smartphone usage for photoshooting
TRANSCRIPT
Vietnamese photo life with smartphone

Camera device usage
Smartpho
ne
Tablet
Digital
compac
t cam
era
Feature
phone
DSLR
Mirrorle
ss
77%
21% 20% 18%
5% 2%
71%
6% 7%11%
0% 1%
Device used
Device most used
Smartphone has the dominant usage for phone taking
Q. Which device did you use to take photos in last 12 moth / Which device do you use the most to take photos, N=731
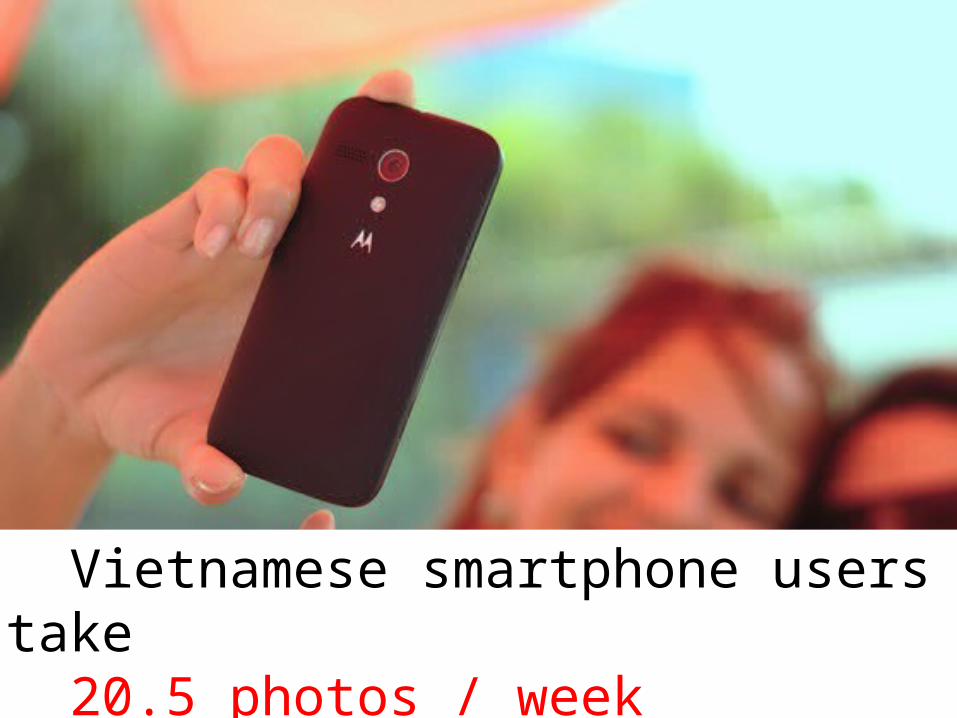
Vietnamese smartphone users take 20.5 photos / week

Numbers of photos via smarthone
All Female Male Less than 1 hour
1-3 hours More than 3 hours
6% 8% 5% 2% 9% 5%8% 9% 7% 10%
9%7%
40% 40%41%
66%40%
35%
20% 18% 23%
11%
23%
20%
13% 12% 13%
8%12%
14%
6% 6% 6% 3%10%
6% 8% 5% 4% 9%
Not recall Do not take photo 1-10 11-2021 - 40 41-80 More than 80
Q. How many photos did you take in 7 days with smartphones, N=528
Those who use internet longer tend to take more photos
By Gender By Internet Usage

What kinds of photos do they take?
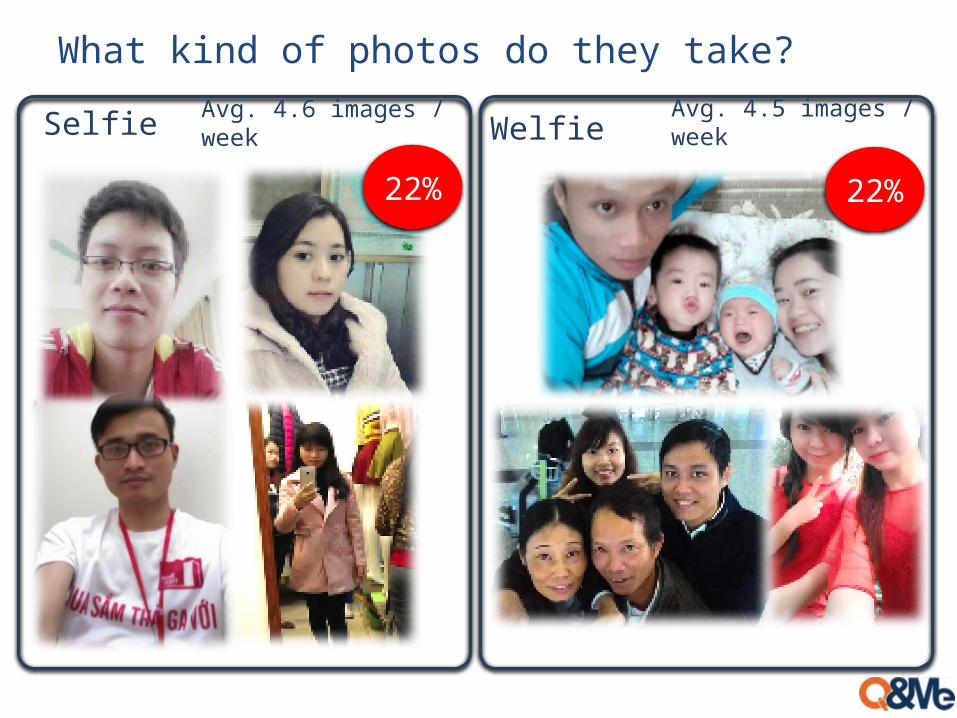
What kind of photos do they take?
Selfie
22% 22%
WelfieAvg. 4.6 images / week Avg. 4.5 images / week
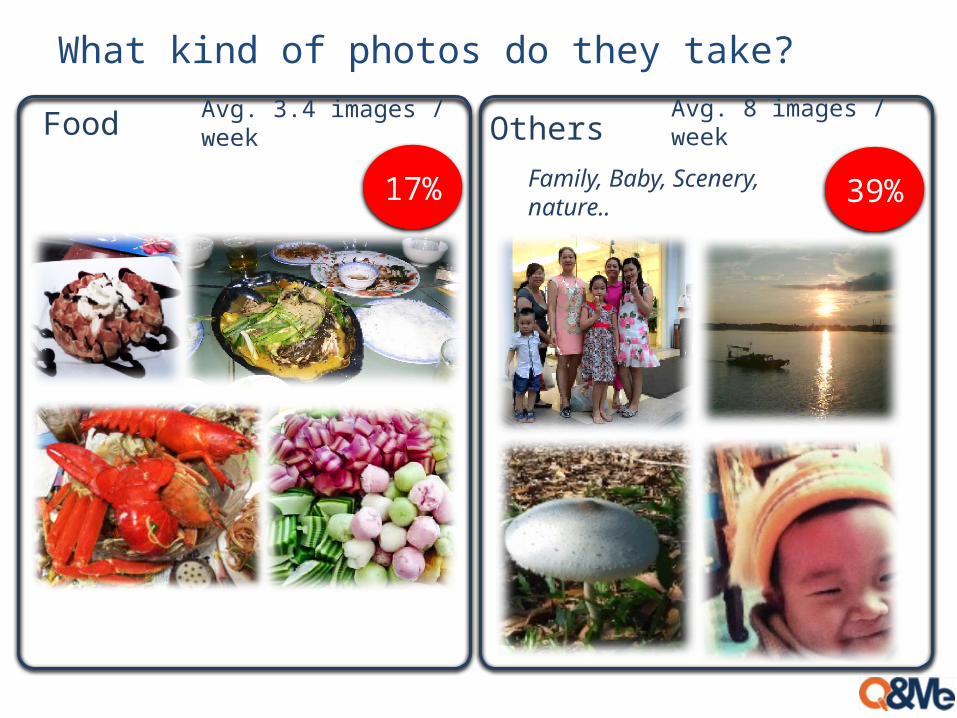
What kind of photos do they take?
Food
17% 39%
OthersAvg. 3.4 images / week Avg. 8 images / week
Family, Baby, Scenery, nature..
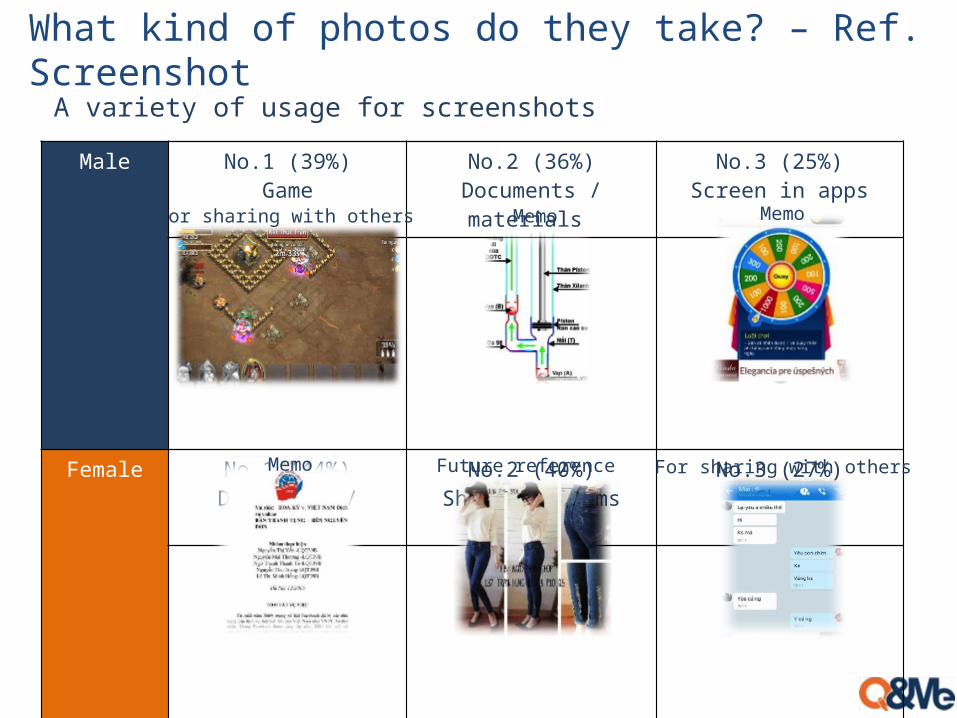
Male No.1 (39%)Game
No.2 (36%)Documents / materials
No.3 (25%)Screen in apps
Female No.1 (44%)Documents / materials
No.2 (40%)Shopping items
No.3 (27%)Chat
A variety of usage for screenshots
For sharing with others
For sharing with othersFuture referenceMemo
Memo Memo
What kind of photos do they take? – Ref. Screenshot
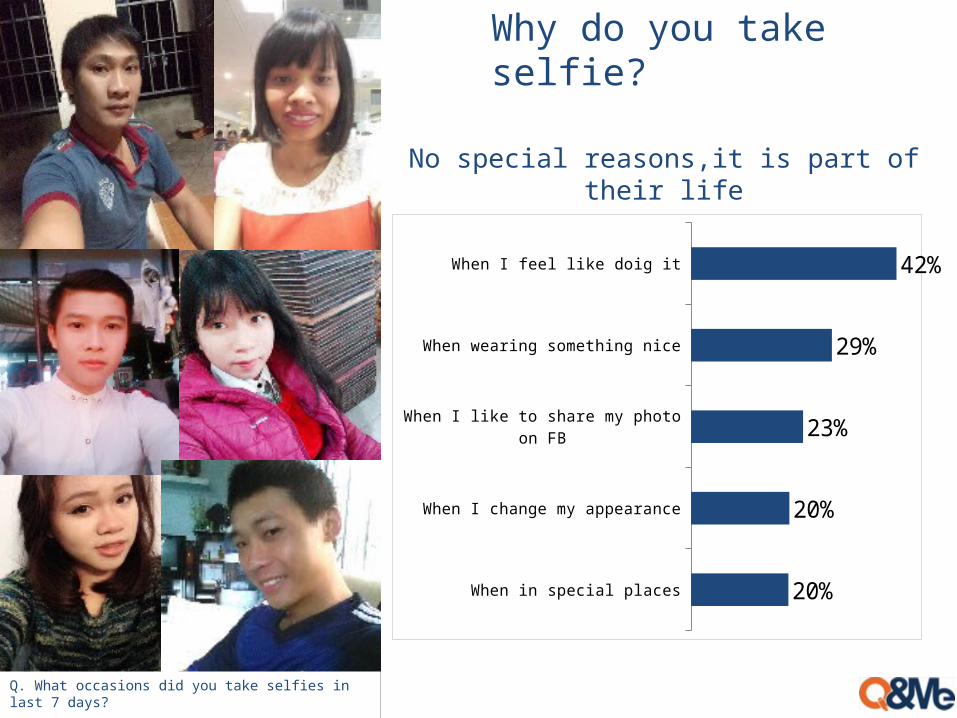
Why do you take selfie?
When in special places
When I change my appearance
When I like to share my photo on FB
When wearing something nice
When I feel like doig it
20%
20%
23%
29%
42%
No special reasons,it is part of their life
Q. What occasions did you take selfies in last 7 days?
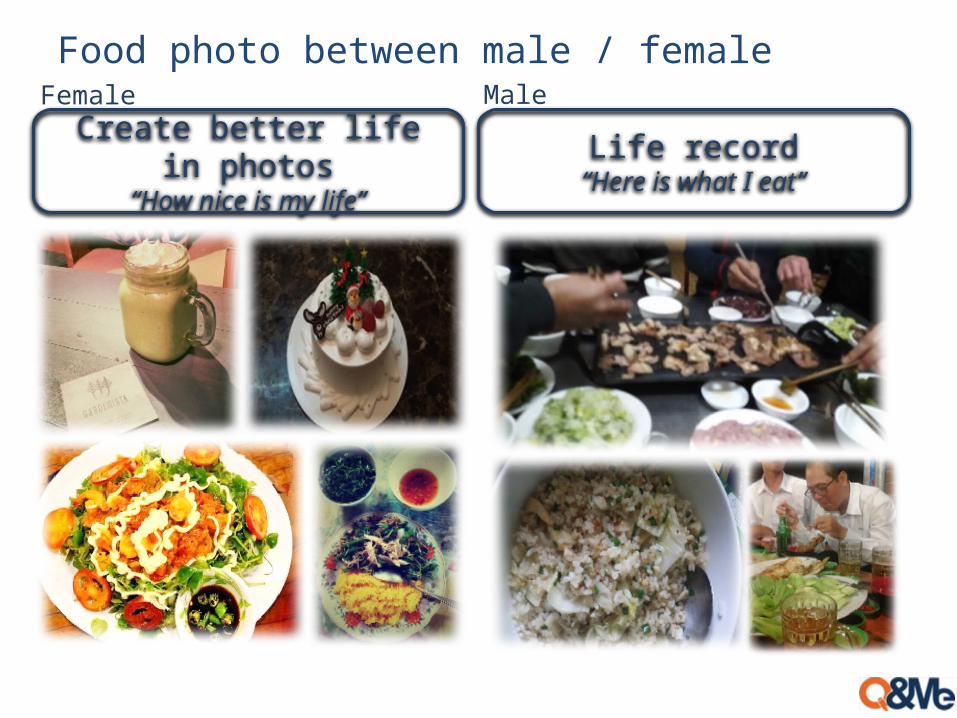
Food photo between male / female
Create better life in photos“How nice is my life”
Life record“Here is what I eat”
Female Male

Photo and Facebook

Photo sharing method
Facebook, Zalo are the common ways of sharing
57%
36%26% 21%
12% 7% 6% 3% 2% 5%
Q. How did you share the photos you had taken for past 7 days?, N=528
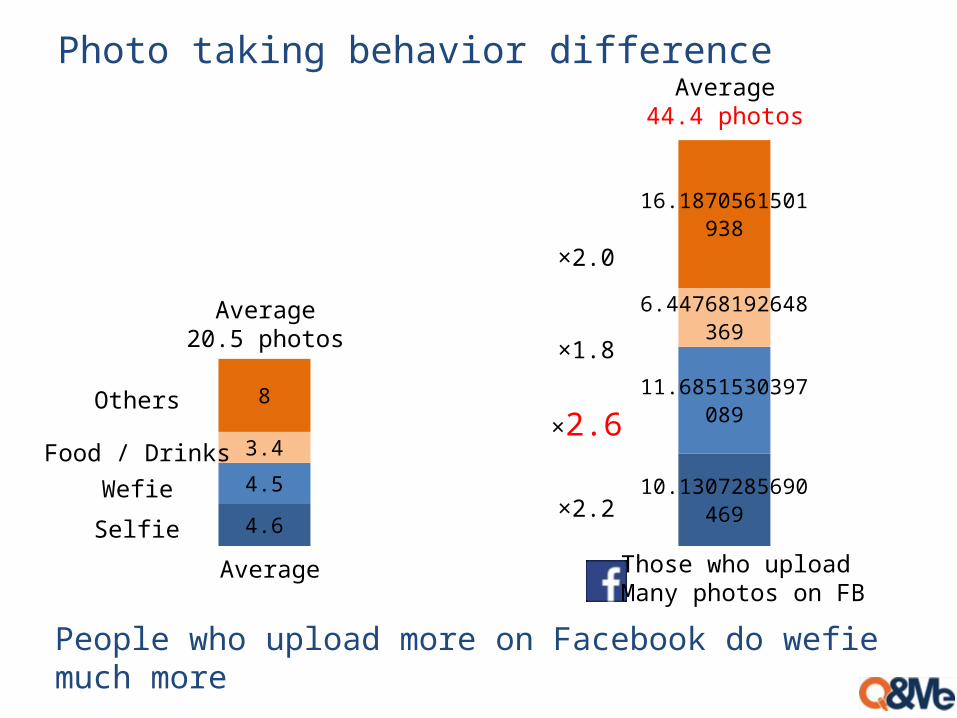
Photo taking behavior difference
People who upload more on Facebook do wefie much more
4.6
10.1307285690469
4.5
11.6851530397089
3.4
6.44768192648369
8
16.1870561501938
×2.2
×2.6
×1.8
Others
Food / DrinksWefie
Selfie
Average20.5 photos
Average44.4 photos
×2.0
Average Those who uploadMany photos on FB
What apps are popular for photo shooting?

Camera App Usage
Q. When you take photos with smartphone, how do you take photos?, N=528
Mobile app only;
17%
Mix of camera / mobile app; 39%
Default app only;
44%
Mobile app onlyMix of camera / mobile appDefault app only
56% use mobile app

Camera App Usage – Popular App
Camera360 BeautyPlus Photowonder FV-5“Professional”“Funny”“Beauty”“Selfie”
Satisfaction / Dissatisfaction

Camera on smartphone satisfaction
Q. How much are you satisfied with smartphone camera? (0 = Completely dissatisfied, 10 = Completely satisfied)N=528
Satisfaction levels are quite high
0 1 2 3 4 5 6 7 8 9 10
4%
2%1% 1%
5%
9%
15%17%
27%
8%
12%
0%1% 1%
3%4%
11%
15%
20%22%
12%11%
Female Male
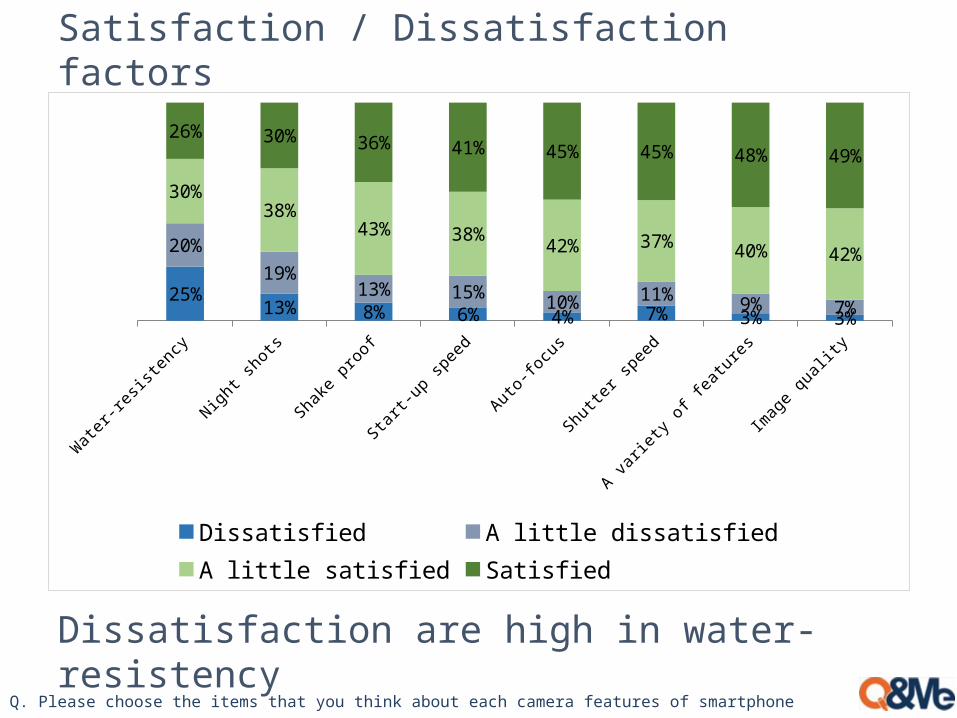
Satisfaction / Dissatisfaction factors
Q. Please choose the items that you think about each camera features of smartphone
Dissatisfaction are high in water-resistency
Wate
r-res
isten
cy
Night s
hots
Shake
proo
f
Start-u
p spe
ed
Auto-fo
cus
Shutte
r spe
ed
A varie
ty of
featur
es
Imag
e qua
lity
25%13% 8% 6% 4% 7% 3% 3%
20%
19%13% 15%
10% 11%9% 7%
30%38%
43% 38%42% 37%
40% 42%
26% 30% 36% 41% 45% 45% 48% 49%
Dissatisfied A little dissatisfiedA little satisfied Satisfied
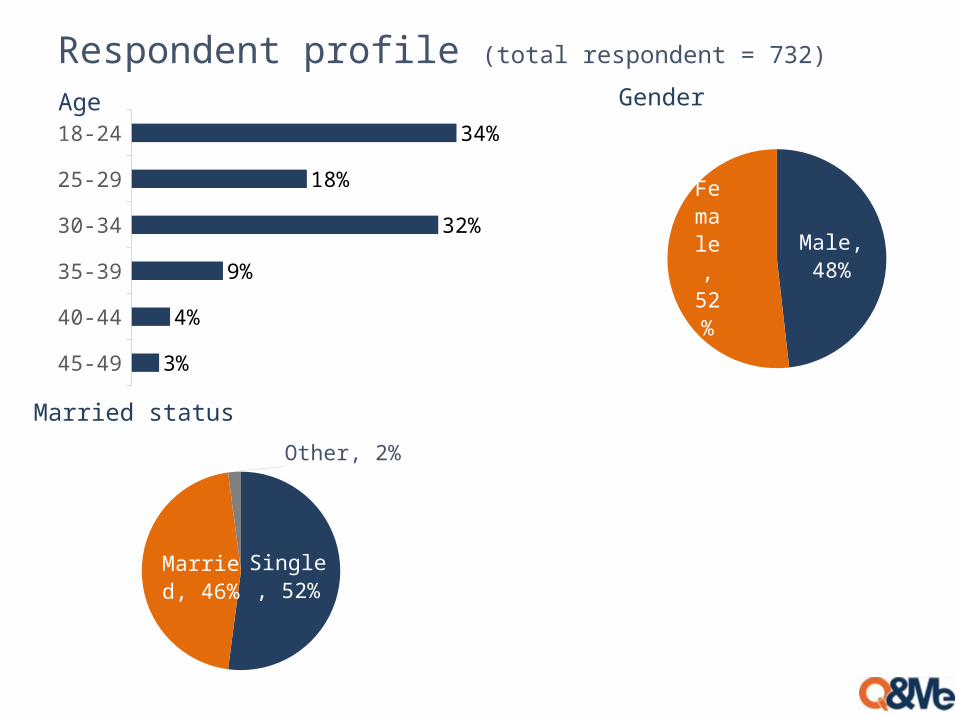
Respondent profile (total respondent = 732)
Male, 48%
Female, 52%
45-49
40-44
35-39
30-34
25-29
18-24
3%
4%
9%
32%
18%
34%
Single, 52%
Married, 46%
Other, 2%
Age Gender
Married status
About Q&Me Vietnam Market Research Service

Who we are (1) – What is Q&Me
Q&Me is the online market research services in Vietnam. Due to our online utilization and direct panels, we offer the researches in days with 1/3 of the traditional research company cost.
Affordable Quick High qualityTakes 24 - 48 hours for most surveys, proving
real-time analysis
Superb real-time analysis for flexible and accurate data collection
1/3 of the competitor pricing

<9 10-14 15-19 20-24 25-29 30-34 35-39 40-44 45-49 50-
17%
8% 8% 8% 8% 8% 7% 7% 7%
22%
0%1%
18%
31%
22%
14%
7%
3% 3%
1%
Stats Q&Me
Active users by age Urban user ratio (top 6 provinces)
Stats Q&Me
22%
51%
78%
49%
Top 6 provinces Others
Who we are (1) – Q&Me panelist
Due to the utilization of online, our service is best suited for the survey targeting 10’s – 30’s in urban areas

Contact Us
URL: http://www.qandme.netContact: [email protected]
Q&Me is operated by Asia Plus Inc.
Asia Plus Inc.Floor 1 25/7A Nguyen Binh Khiem str., Ben Nghe ward, District 1, HCMC, VietnamTel. +84 839 100 043
People who are dissatisfied with smartphone camera