survey results power in the sharing economy: european ... · power in the sharing economy: european...
TRANSCRIPT
Survey ResultsPower in the Sharing Economy: European PerspectivesOctober, 2017Gemma Newlands, Christoph Lutz, and Christian Fieseler
Power in the
Sharing Economy
Page 2 Executive Summary
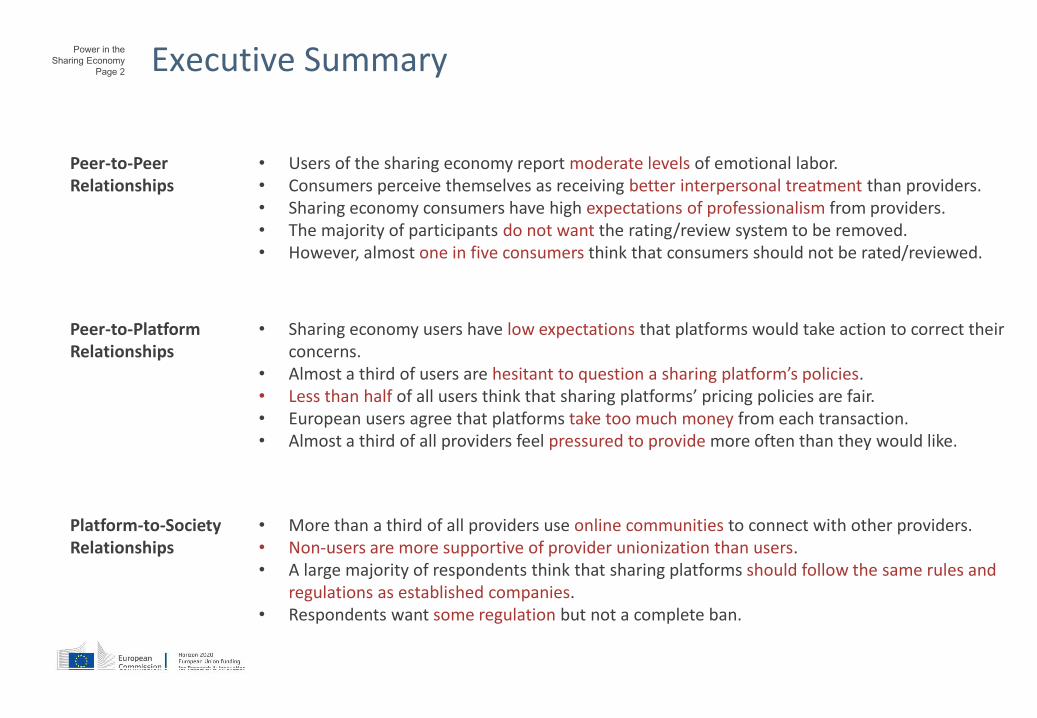
Peer-to-PeerRelationships
• Users of the sharing economy report moderate levels of emotional labor. • Consumers perceive themselves as receiving better interpersonal treatment than providers.• Sharing economy consumers have high expectations of professionalism from providers.• The majority of participants do not want the rating/review system to be removed. • However, almost one in five consumers think that consumers should not be rated/reviewed.
Peer-to-Platform Relationships
• Sharing economy users have low expectations that platforms would take action to correct their concerns.
• Almost a third of users are hesitant to question a sharing platform’s policies. • Less than half of all users think that sharing platforms’ pricing policies are fair. • European users agree that platforms take too much money from each transaction. • Almost a third of all providers feel pressured to provide more often than they would like.
Platform-to-SocietyRelationships
• More than a third of all providers use online communities to connect with other providers. • Non-users are more supportive of provider unionization than users. • A large majority of respondents think that sharing platforms should follow the same rules and
regulations as established companies. • Respondents want some regulation but not a complete ban.
Power in the
Sharing Economy
Page 3
Introduction:Power and the Sharing Economy1User perceptions and concerns
Power in the
Sharing Economy
Page 4 Overview of the Report
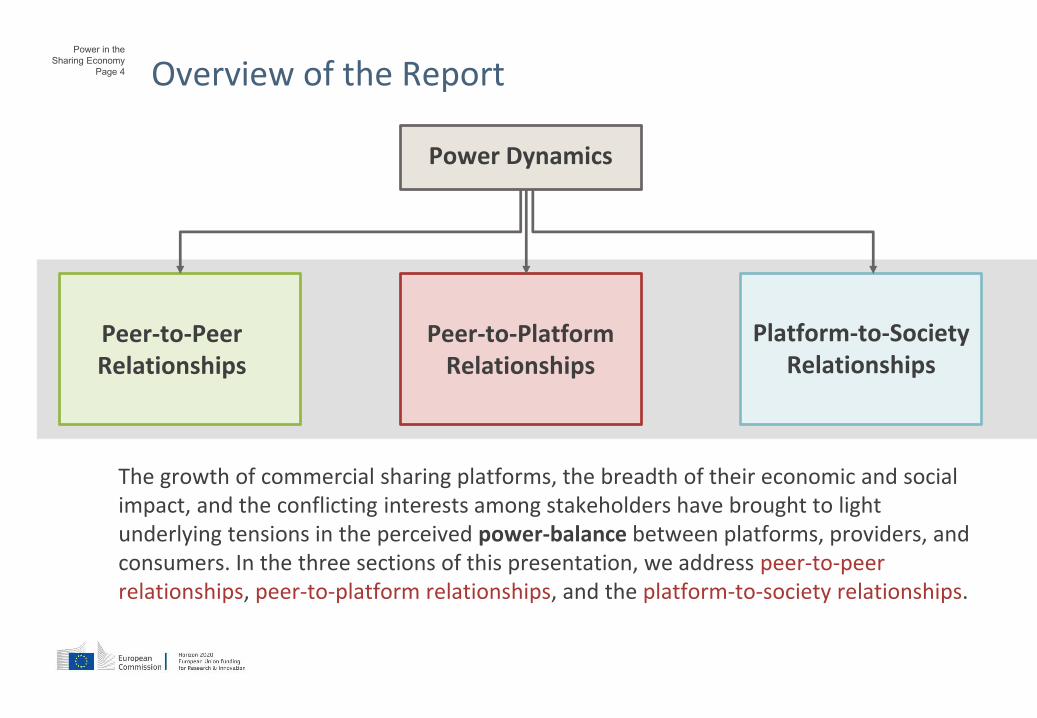
Peer-to-Peer Relationships
Peer-to-Platform Relationships
Platform-to-Society Relationships
Power Dynamics
The growth of commercial sharing platforms, the breadth of their economic and social impact, and the conflicting interests among stakeholders have brought to light underlying tensions in the perceived power-balance between platforms, providers, and consumers. In the three sections of this presentation, we address peer-to-peer relationships, peer-to-platform relationships, and the platform-to-society relationships.
Power in the
Sharing Economy
Page 5
Emotional Labor in the Sharing Economy2Self-conscious emotional regulation among providers and consumers during a sharing transaction
Power in the
Sharing Economy
Page 6
Emotional LaborSharing with strangers often necessitates human interaction. However, the ‘service layer’ of certain platforms demands emotional regulation akin to traditional service industries. Are providers, and even consumers, forced to put on a friendly face?
Power in the
Sharing Economy
Page 7
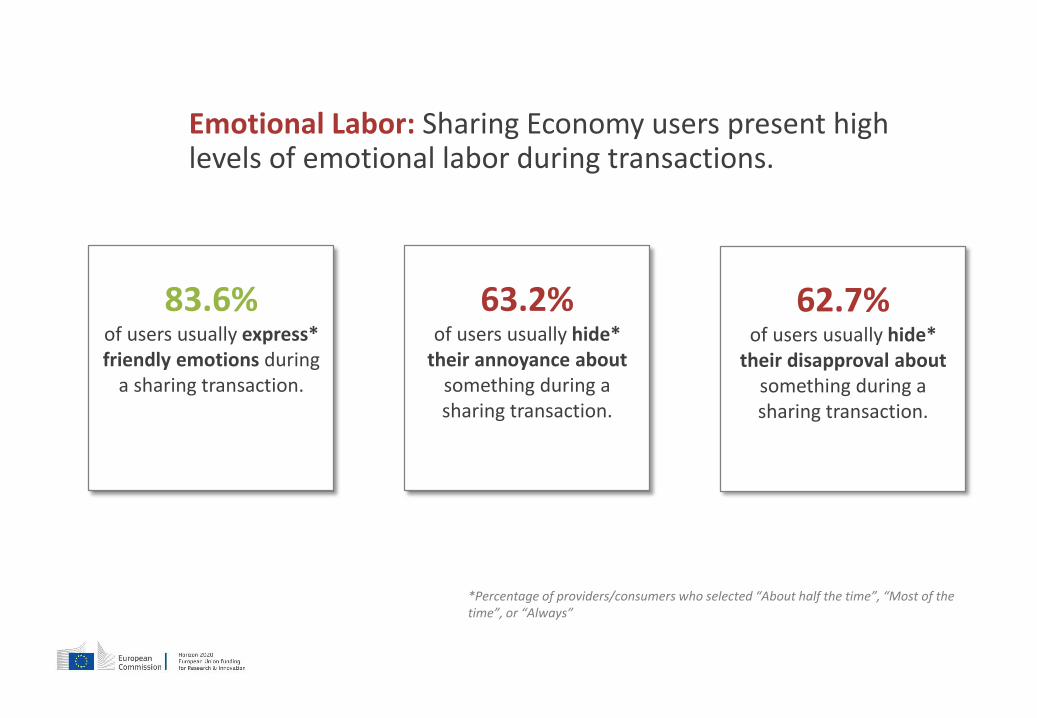
Emotional Labor: Sharing Economy users present high levels of emotional labor during transactions.
83.6%of users usually express* friendly emotions during
a sharing transaction.
63.2%of users usually hide*
their annoyance aboutsomething during a sharing transaction.
*Percentage of providers/consumers who selected “About half the time”, “Most of the time”, or “Always”
62.7% of users usually hide*
their disapproval aboutsomething during a sharing transaction.
Power in the
Sharing Economy
Page 8
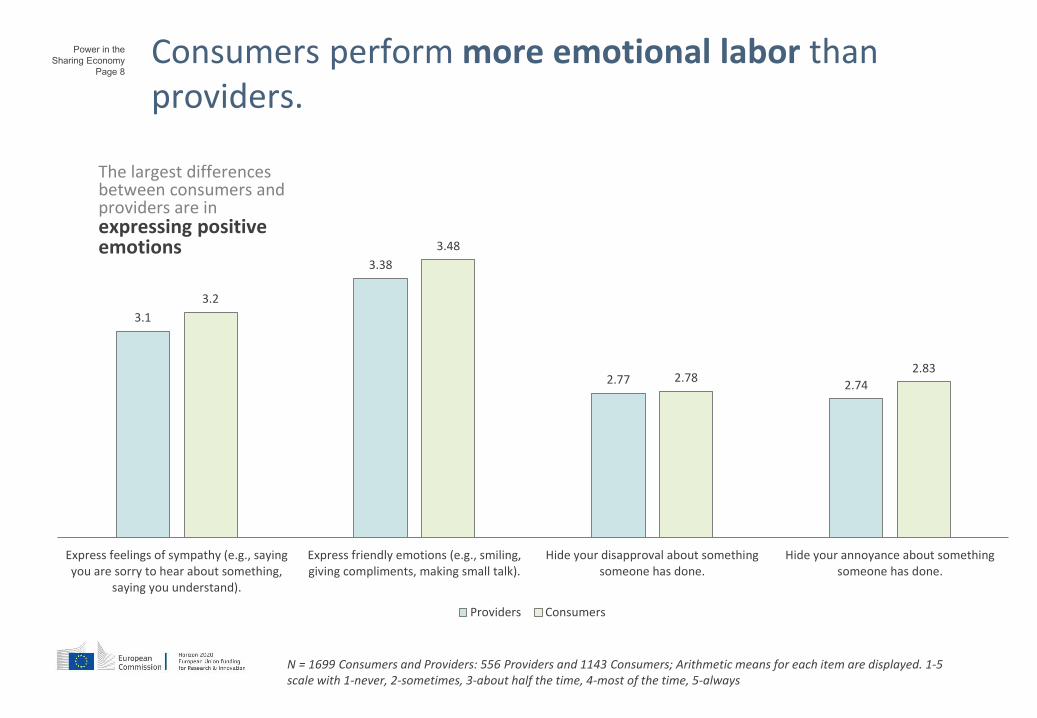
Consumers perform more emotional labor than providers.
N = 1699 Consumers and Providers: 556 Providers and 1143 Consumers; Arithmetic means for each item are displayed. 1-5 scale with 1-never, 2-sometimes, 3-about half the time, 4-most of the time, 5-always
3.1
3.38
2.77 2.74
3.2
3.48
2.782.83
Express feelings of sympathy (e.g., sayingyou are sorry to hear about something,
saying you understand).
Express friendly emotions (e.g., smiling,giving compliments, making small talk).
Hide your disapproval about somethingsomeone has done.
Hide your annoyance about somethingsomeone has done.
Providers Consumers
The largest differences between consumers and providers are in expressing positive emotions
Power in the
Sharing Economy
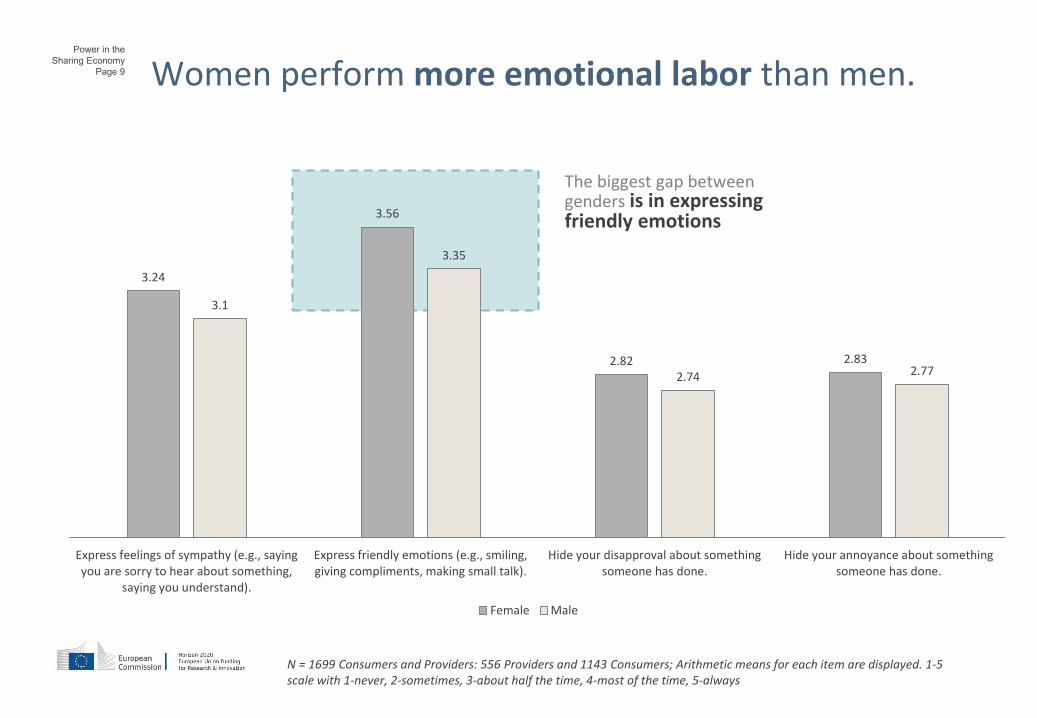
Page 9
text
3.24
3.56
2.82 2.83
3.1
3.35
2.74 2.77
Express feelings of sympathy (e.g., sayingyou are sorry to hear about something,
saying you understand).
Express friendly emotions (e.g., smiling,giving compliments, making small talk).
Hide your disapproval about somethingsomeone has done.
Hide your annoyance about somethingsomeone has done.
Female Male
The biggest gap between genders is in expressing friendly emotions
Women perform more emotional labor than men.
N = 1699 Consumers and Providers: 556 Providers and 1143 Consumers; Arithmetic means for each item are displayed. 1-5 scale with 1-never, 2-sometimes, 3-about half the time, 4-most of the time, 5-always
Power in the
Sharing Economy
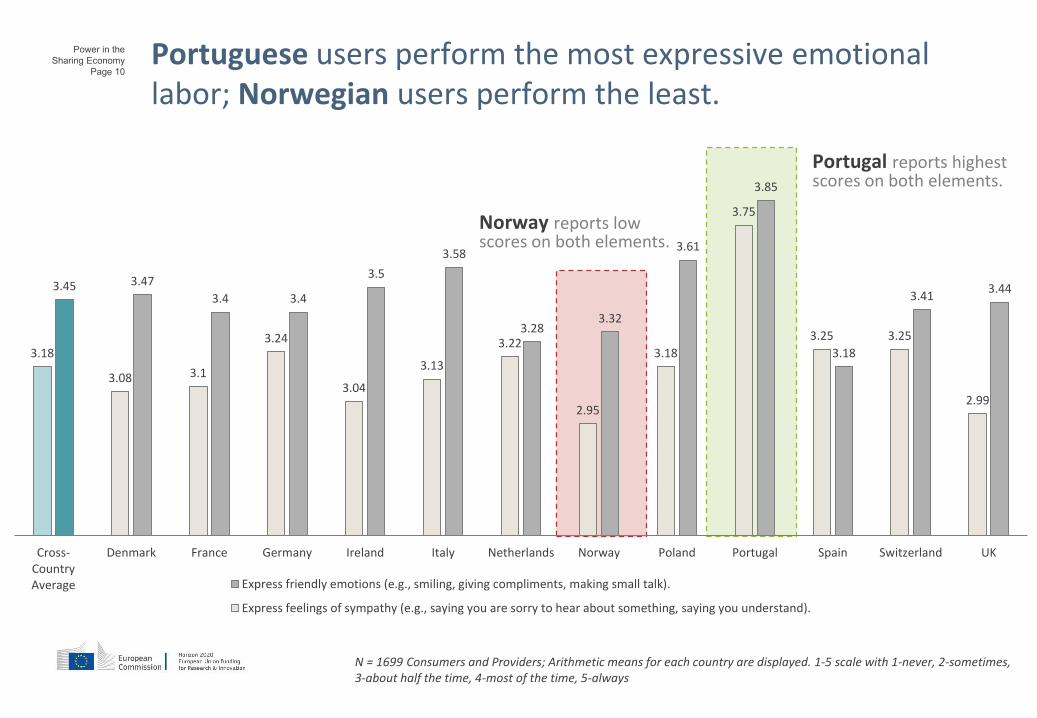
Page 10Portuguese users perform the most expressive emotional labor; Norwegian users perform the least.
N = 1699 Consumers and Providers; Arithmetic means for each country are displayed. 1-5 scale with 1-never, 2-sometimes, 3-about half the time, 4-most of the time, 5-always
Portugal reports highest scores on both elements.
3.443.41
3.18
3.85
3.61
3.323.28
3.58
3.5
3.43.4
3.473.45
2.99
3.253.25
3.75
3.18
2.95
3.22
3.13
3.04
3.24
3.13.08
3.18
UKSwitzerlandSpainPortugalPolandNorwayNetherlandsItalyIrelandGermanyFranceDenmarkCross-CountryAverage Express friendly emotions (e.g., smiling, giving compliments, making small talk).
Express feelings of sympathy (e.g., saying you are sorry to hear about something, saying you understand).
Norway reports low scores on both elements.
Power in the
Sharing Economy
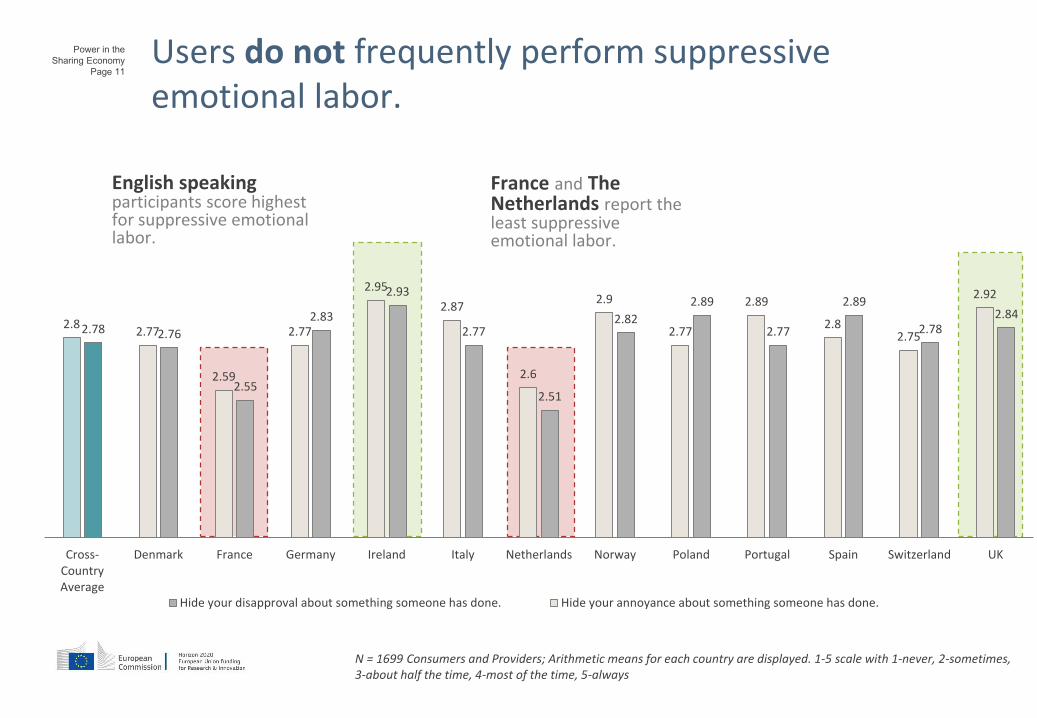
Page 11
Users do not frequently perform suppressive emotional labor.
N = 1699 Consumers and Providers; Arithmetic means for each country are displayed. 1-5 scale with 1-never, 2-sometimes, 3-about half the time, 4-most of the time, 5-always
English speaking participants score highest for suppressive emotional labor.
France and The Netherlands report the least suppressive emotional labor.
2.842.78
2.89
2.77
2.89
2.82
2.51
2.77
2.93
2.83
2.55
2.762.78
2.92
2.752.8
2.89
2.77
2.9
2.6
2.87
2.95
2.77
2.59
2.772.8
UKSwitzerlandSpainPortugalPolandNorwayNetherlandsItalyIrelandGermanyFranceDenmarkCross-CountryAverage
Hide your disapproval about something someone has done. Hide your annoyance about something someone has done.
Power in the
Sharing Economy
Page 12 Key Insights into Emotional Labor
• Users of the sharing economy report, on average, moderate to high levels of expressing positive emotions and moderate levels of suppressing negative emotions.
• However, consumers score slightly higher for emotional labor than providers.
• Women perform more emotional labour than men.
• There is a North-South pattern, with Southern European countries such as Portugal and Italy having higher values for emotional labor than Northern European countries such as Norway.
Power in the
Sharing Economy
Page 13
Interpersonal Treatment in the Sharing Economy3
Do providers and consumers treat each other with respect, dignity, and politeness?

Power in the
Sharing Economy
Page 14
Interpersonal TreatmentThe respectful treatment of one’s peers is an underappreciated aspect of the experiential reality of the sharing economy. For those who share more frequently, how users are treated has a significant impact on whether the sharing economy provides decent working conditions.

Power in the
Sharing Economy
Page 15
Consumers perceive themselves as receiving better treatment than providers.
3.68
3.62 3.61
3.92
3.83
3.88
Consumers/Providers treat me in a polite manner. Consumers/Providers treat me with dignity. Consumers/Providers treat me with respect.
Providers Consumers
N = 1699 Consumers and Providers; Arithmetic means for each group are displayed. 1-5 scale with 1-strongly disagree, 2-somewhat disagree, 3-neither agree nor disagree, 4-somewhat agree, 5-strongly agree
Users overall still perceive themselves as being treated with politeness, dignity, and respect.
Power in the
Sharing Economy
Page 16
text
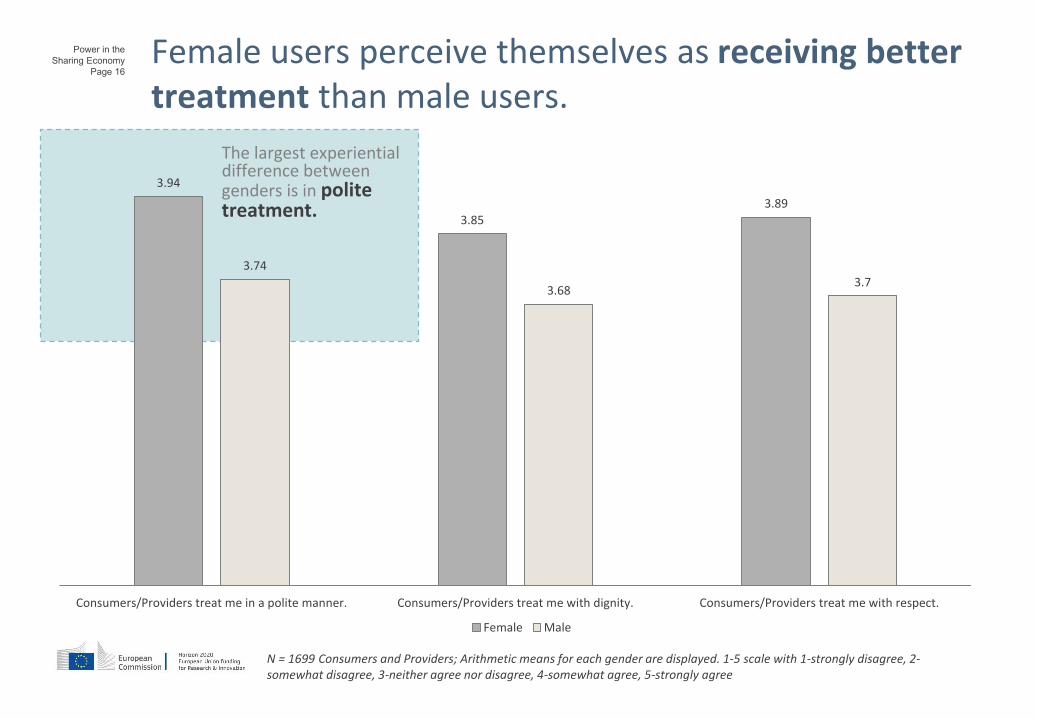
3.94
3.85
3.89
3.74
3.683.7
Consumers/Providers treat me in a polite manner. Consumers/Providers treat me with dignity. Consumers/Providers treat me with respect.
Female Male
Female users perceive themselves as receiving better treatment than male users.
N = 1699 Consumers and Providers; Arithmetic means for each gender are displayed. 1-5 scale with 1-strongly disagree, 2-somewhat disagree, 3-neither agree nor disagree, 4-somewhat agree, 5-strongly agree
The largest experiential difference between genders is in polite treatment.
Power in the
Sharing Economy
Page 17
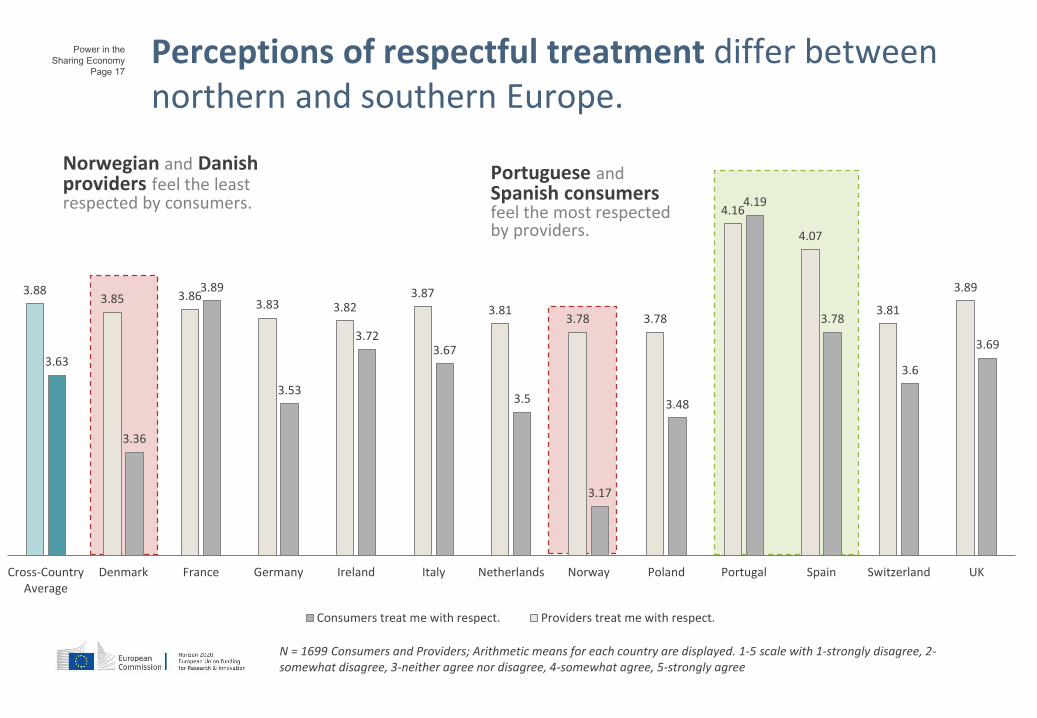
Perceptions of respectful treatment differ between northern and southern Europe.
3.69
3.6
3.78
4.19
3.48
3.17
3.5
3.673.72
3.53
3.89
3.36
3.63
3.89
3.81
4.07
4.16
3.783.783.81
3.873.823.83
3.863.853.88
UKSwitzerlandSpainPortugalPolandNorwayNetherlandsItalyIrelandGermanyFranceDenmarkCross-CountryAverage
Consumers treat me with respect. Providers treat me with respect.
N = 1699 Consumers and Providers; Arithmetic means for each country are displayed. 1-5 scale with 1-strongly disagree, 2-somewhat disagree, 3-neither agree nor disagree, 4-somewhat agree, 5-strongly agree
Norwegian and Danish providers feel the least respected by consumers.
Portuguese andSpanish consumers feel the most respected by providers.
Power in the
Sharing Economy
Page 18
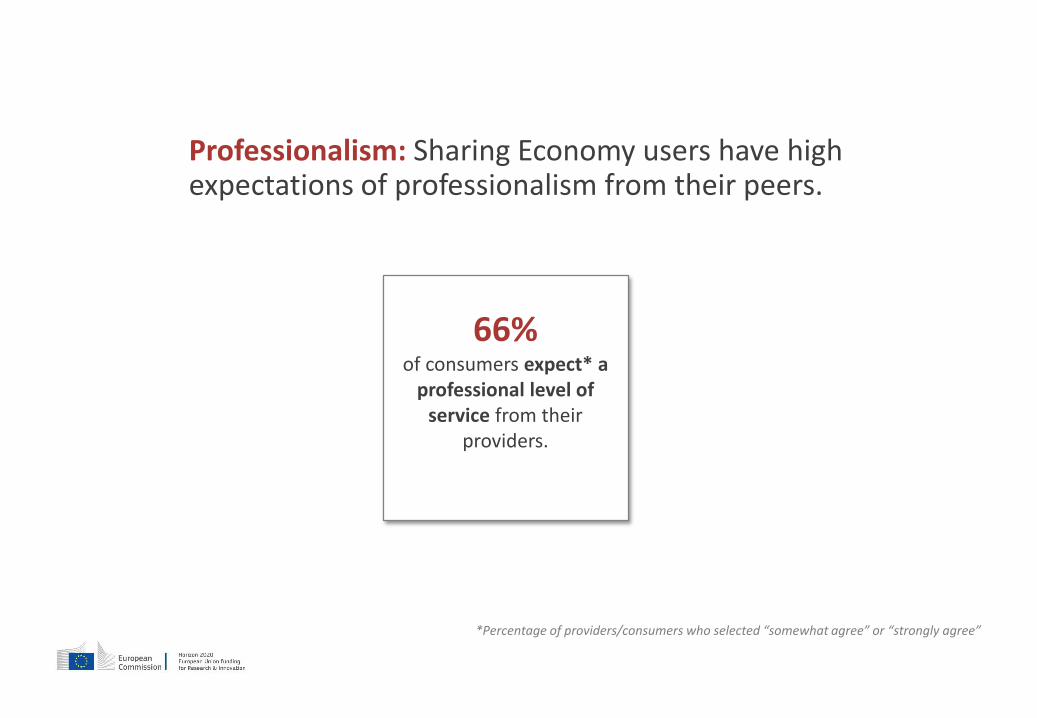
Professionalism: Sharing Economy users have high expectations of professionalism from their peers.
66%of consumers expect* a
professional level of service from their
providers.
*Percentage of providers/consumers who selected “somewhat agree” or “strongly agree”
Power in the
Sharing Economy
Page 19
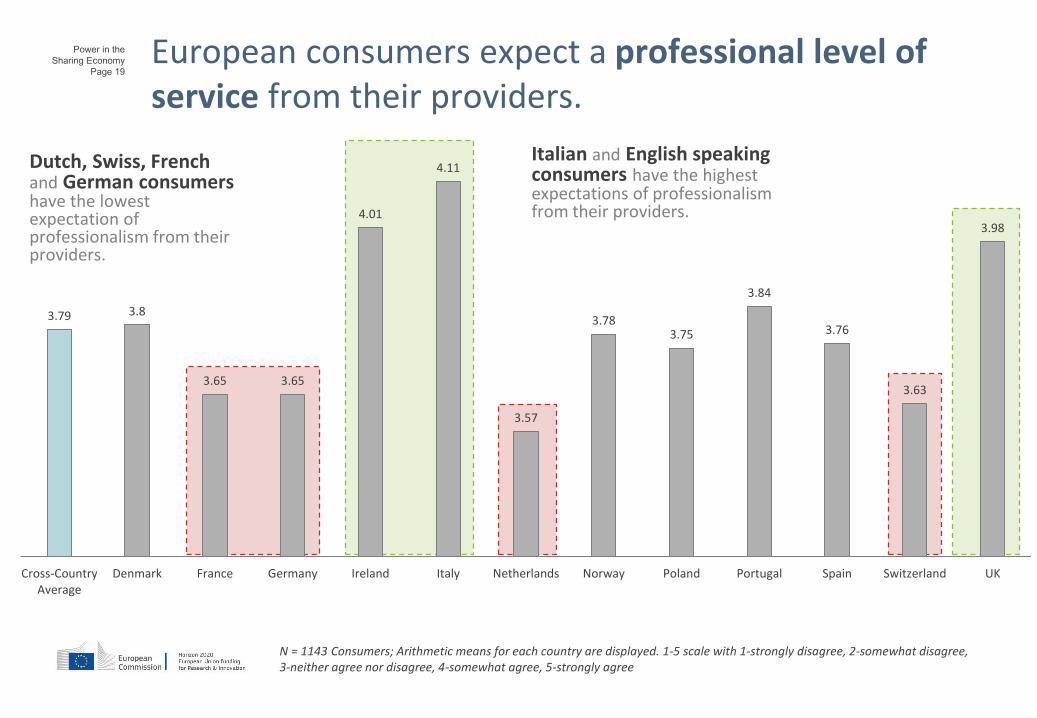
European consumers expect a professional level of service from their providers.
N = 1143 Consumers; Arithmetic means for each country are displayed. 1-5 scale with 1-strongly disagree, 2-somewhat disagree, 3-neither agree nor disagree, 4-somewhat agree, 5-strongly agree
Italian and English speaking consumers have the highest expectations of professionalism from their providers.
Dutch, Swiss, French and German consumers have the lowest expectation of professionalism from their providers.
3.98
3.63
3.76
3.84
3.753.78
3.57
4.11
4.01
3.653.65
3.83.79
UKSwitzerlandSpainPortugalPolandNorwayNetherlandsItalyIrelandGermanyFranceDenmarkCross-CountryAverage

Power in the
Sharing Economy
Page 20
text
Younger consumers have the lowest expectations of professionalism from providers.
3.66
3.84
3.79
3.88 3.89
18-24 25-34 35-44 45-54 55-65
I expect a professional level of service from my providers.
N = 1143 Consumers; Arithmetic means for each age-group are displayed. 1-5 scale with 1-strongly disagree, 2-somewhat disagree, 3-neither agree nor disagree, 4-somewhat agree, 5-strongly agree
Young consumers show a sharp increase in expected professionalism in their mid-20s.
Power in the
Sharing Economy
Page 21 Key Insights on Interpersonal Treatment
• Overall treatment of peers in the European sharing economy is very good: Consumers and providers treat each other with respect, with dignity, and in a polite manner.
• Consumers report better treatment than providers.
• Women report better treatment than men.
• Consumers expect a professional level of service from providers.
• Service expectations increase with age.
Power in the
Sharing Economy
Page 22
The Rating/Review Systems of the Sharing Economy4The feedback systems employed by sharing economy platforms are essential in building trust between strangers
Power in the
Sharing Economy
Page 23
The Rating/Review SystemsRating systems, through their ability to determine the eligibility and ranking of providers, put consumers into a position of control. But what can you expect from a five-star rating…and how far would you go to get one?
Power in the
Sharing Economy
Page 24
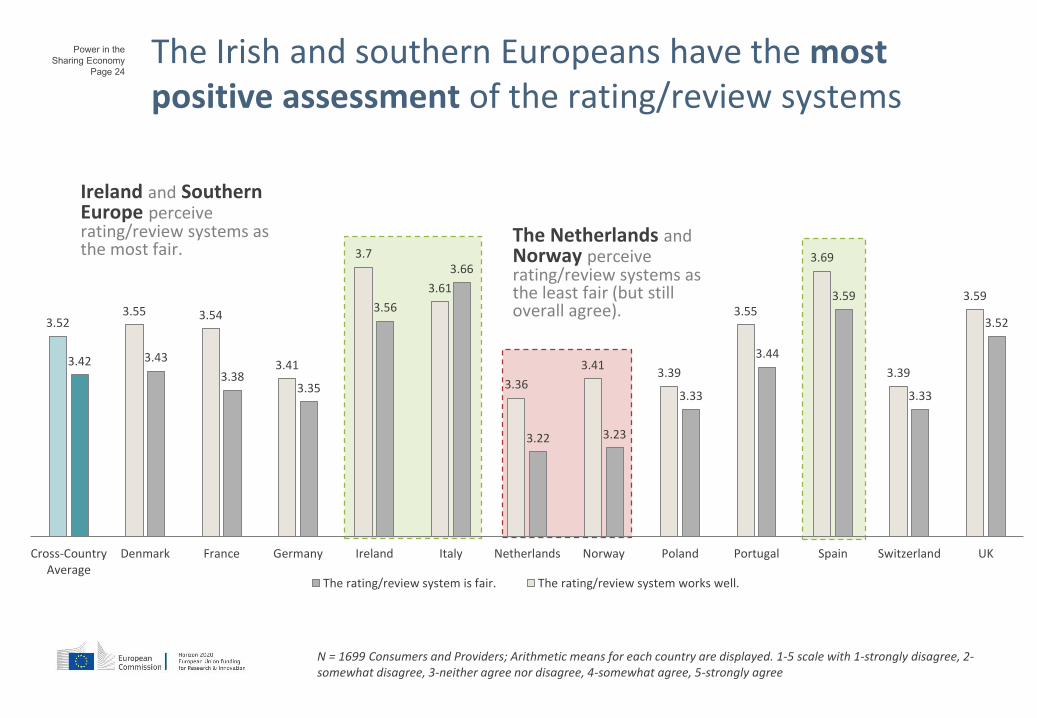
The Irish and southern Europeans have the mostpositive assessment of the rating/review systems
N = 1699 Consumers and Providers; Arithmetic means for each country are displayed. 1-5 scale with 1-strongly disagree, 2-somewhat disagree, 3-neither agree nor disagree, 4-somewhat agree, 5-strongly agree
Ireland and Southern Europe perceive rating/review systems as the most fair.
The Netherlands andNorway perceive rating/review systems as the least fair (but still overall agree).
3.52
3.33
3.59
3.44
3.33
3.233.22
3.66
3.56
3.353.38
3.433.42
3.59
3.39
3.69
3.55
3.393.41
3.36
3.61
3.7
3.41
3.543.553.52
UKSwitzerlandSpainPortugalPolandNorwayNetherlandsItalyIrelandGermanyFranceDenmarkCross-CountryAverage
The rating/review system is fair. The rating/review system works well.
Power in the
Sharing Economy
Page 25
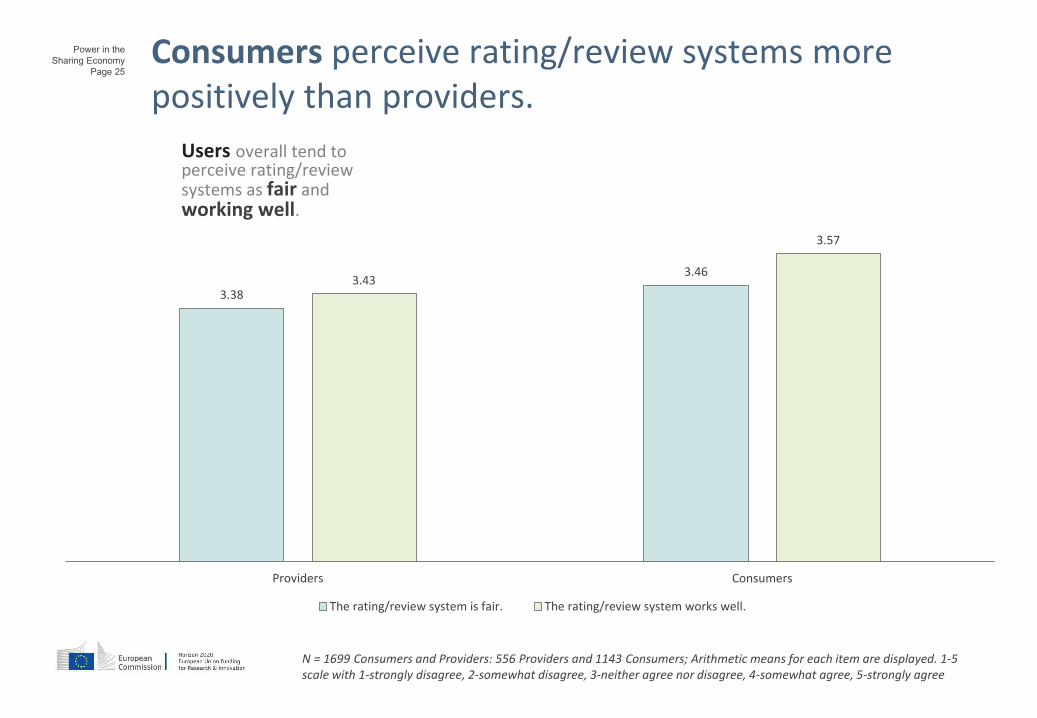
Consumers perceive rating/review systems more positively than providers.
N = 1699 Consumers and Providers: 556 Providers and 1143 Consumers; Arithmetic means for each item are displayed. 1-5 scale with 1-strongly disagree, 2-somewhat disagree, 3-neither agree nor disagree, 4-somewhat agree, 5-strongly agree
3.38
3.463.43
3.57
Providers Consumers
The rating/review system is fair. The rating/review system works well.
Users overall tend to perceive rating/review systems as fair and working well.
Power in the
Sharing Economy
Page 26
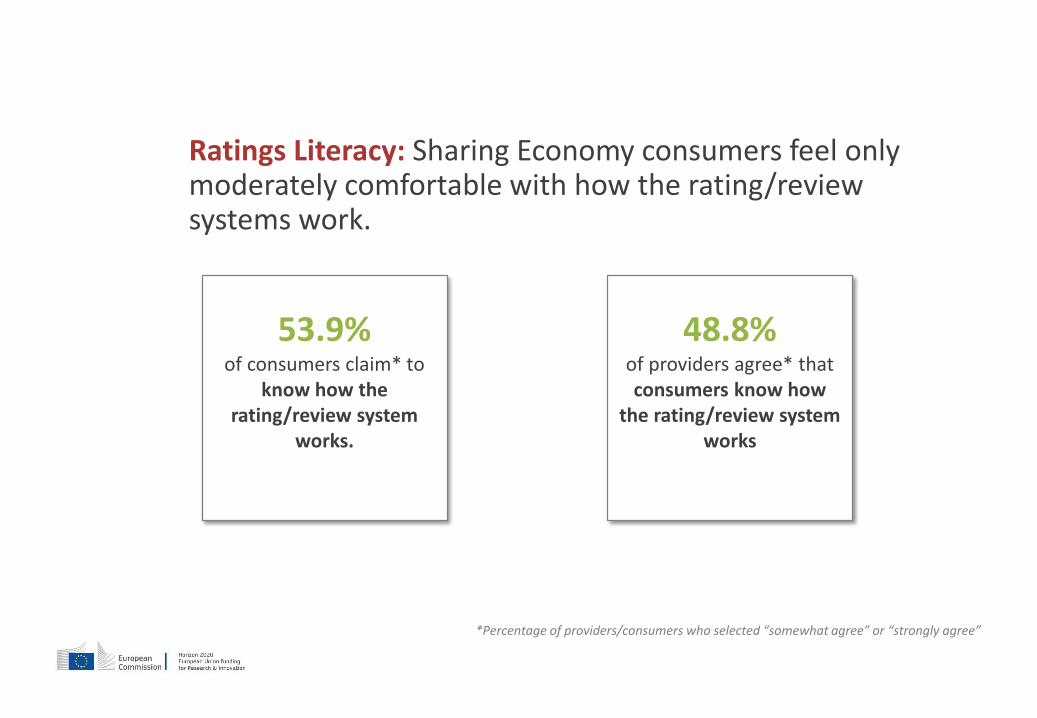
Ratings Literacy: Sharing Economy consumers feel only moderately comfortable with how the rating/review systems work.
53.9%of consumers claim* to
know how the rating/review system
works.
48.8%of providers agree* that consumers know how
the rating/review system works
*Percentage of providers/consumers who selected “somewhat agree” or “strongly agree”
Power in the
Sharing Economy
Page 27
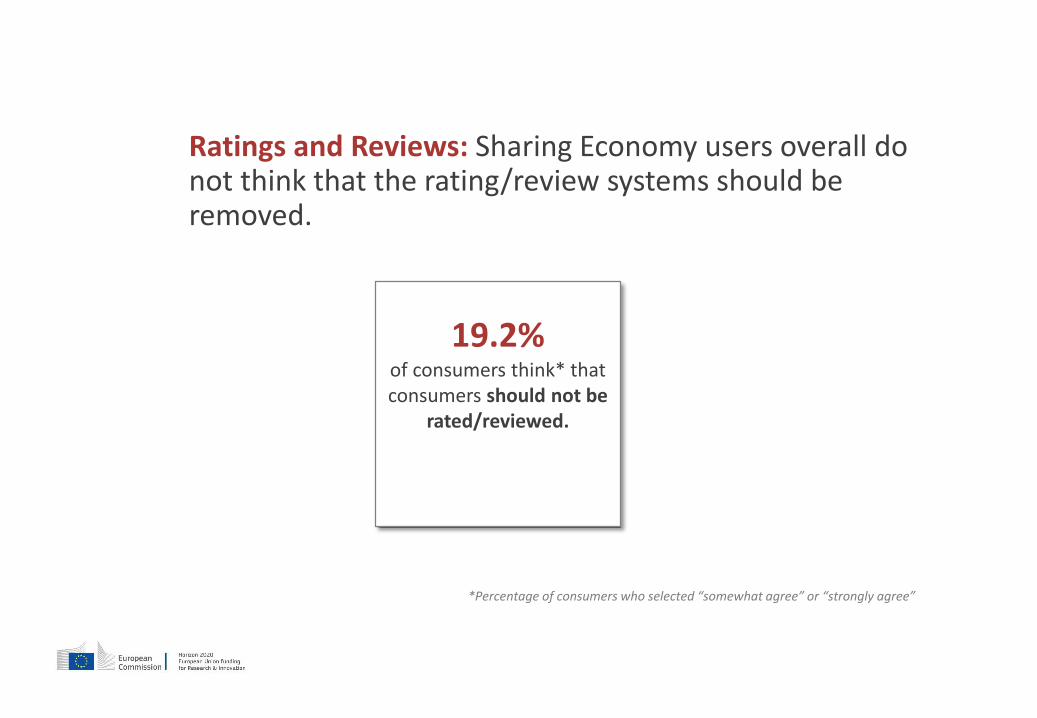
Ratings and Reviews: Sharing Economy users overall do not think that the rating/review systems should be removed.
*Percentage of consumers who selected “somewhat agree” or “strongly agree”
19.2% of consumers think* that consumers should not be
rated/reviewed.
Power in the
Sharing Economy
Page 28
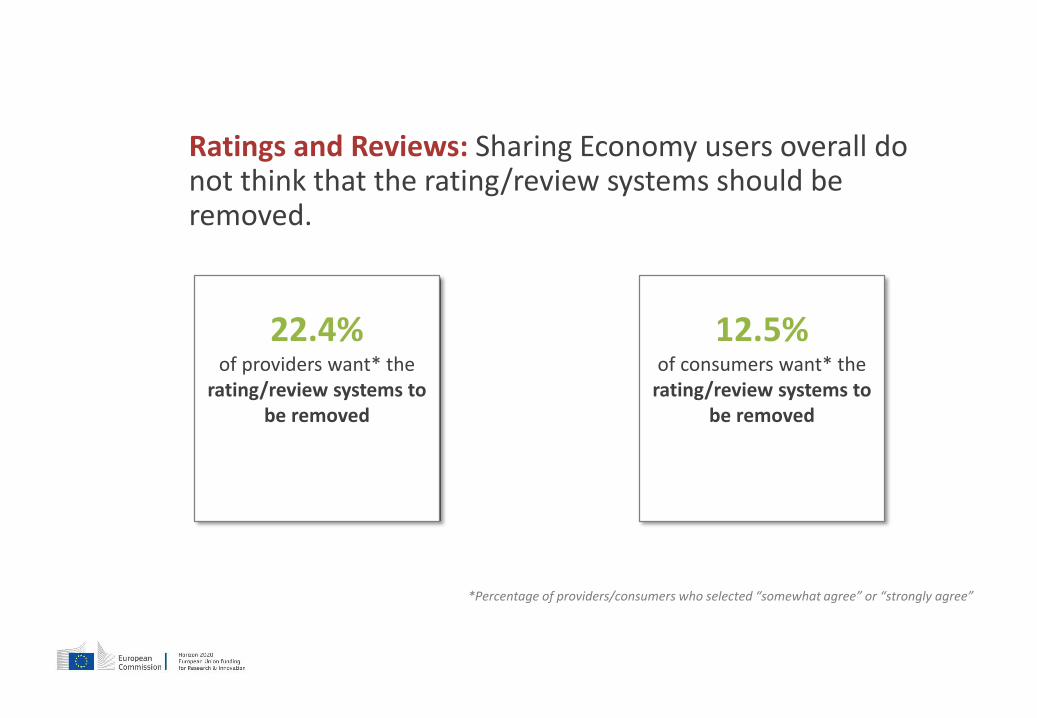
Ratings and Reviews: Sharing Economy users overall do not think that the rating/review systems should be removed.
22.4%of providers want* the
rating/review systems to be removed
12.5%of consumers want* the
rating/review systems to be removed
*Percentage of providers/consumers who selected “somewhat agree” or “strongly agree”

Power in the
Sharing Economy
Page 29
European providers are divided over the accuracy of their ratings.
N = 556 Providers; Arithmetic means for each country are displayed. 1-5 scale with 1-strongly disagree, 2-somewhat disagree, 3-neither agree nor disagree, 4-somewhat agree, 5-strongly agree
Irish and Portuguese providers think that consumers have the most unrealistic expectations.
Dutch providers agree that consumers have unrealistic expectations… but nevertheless think that consumers are the least harsh.
2.96
2.55
3.02
3.38
2.48
3.03
2.38
2.47
3.03
2.432.48
2.66
2.74
3.31
2.88
3.13
3.38
2.74
3.08
3.31
3.05
3.53
2.77
2.98
2.78
3.08
UKSwitzerlandSpainPortugalPolandNorwayNetherlandsItalyIrelandGermanyFranceDenmarkCross-CountryAverage
Consumers rate me too harshly. Consumers have unrealistic expectations.
Power in the
Sharing Economy
Page 30
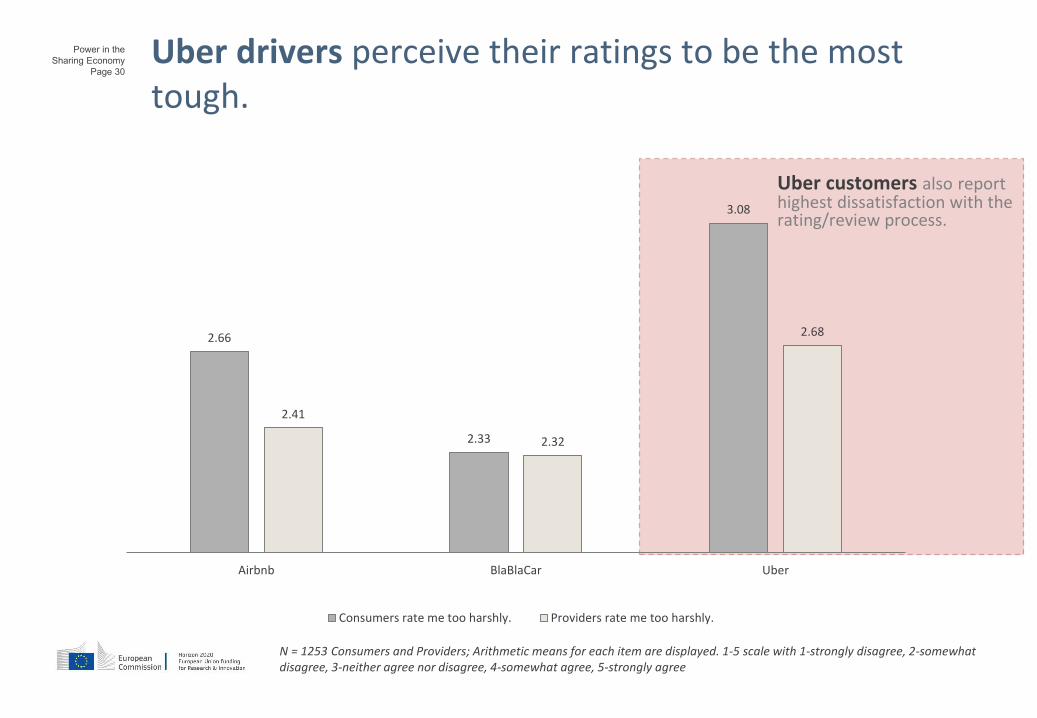
Uber drivers perceive their ratings to be the most tough.
N = 1253 Consumers and Providers; Arithmetic means for each item are displayed. 1-5 scale with 1-strongly disagree, 2-somewhat disagree, 3-neither agree nor disagree, 4-somewhat agree, 5-strongly agree
2.66
2.33
3.08
2.41
2.32
2.68
Airbnb BlaBlaCar Uber
Consumers rate me too harshly. Providers rate me too harshly.
Uber customers also report highest dissatisfaction with the rating/review process.
Power in the
Sharing Economy
Page 31
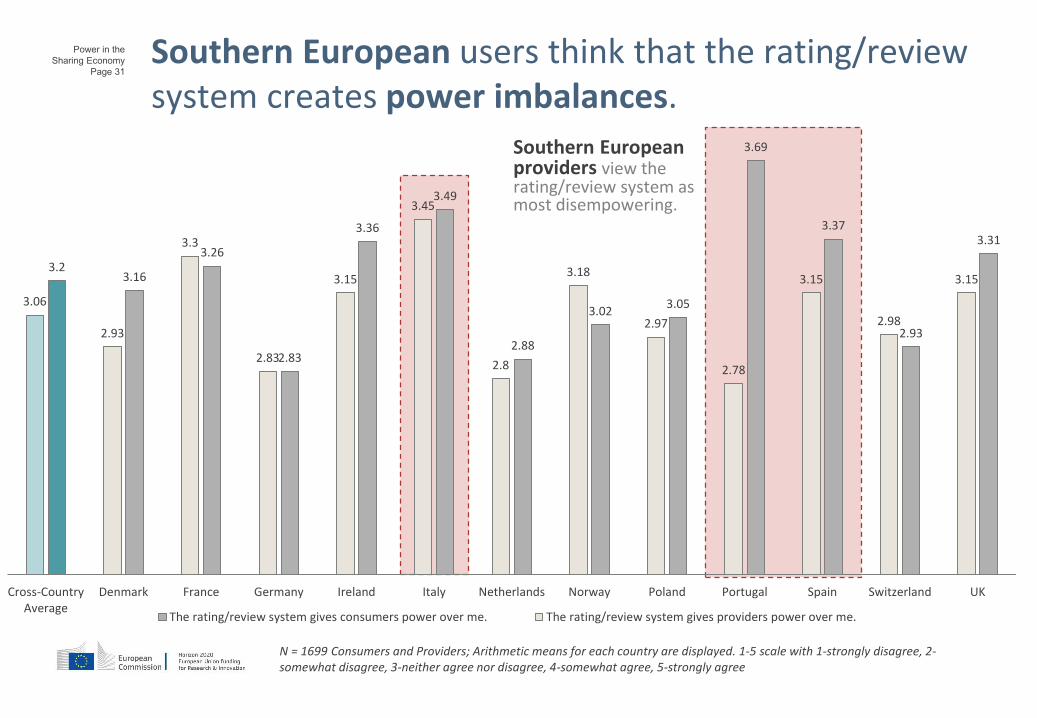
Southern European users think that the rating/review system creates power imbalances.
N = 1699 Consumers and Providers; Arithmetic means for each country are displayed. 1-5 scale with 1-strongly disagree, 2-somewhat disagree, 3-neither agree nor disagree, 4-somewhat agree, 5-strongly agree
Southern European providers view the rating/review system as most disempowering.
3.31
2.93
3.37
3.69
3.053.02
2.88
3.49
3.36
2.83
3.26
3.163.2
3.15
2.98
3.15
2.78
2.97
3.18
2.8
3.45
3.15
2.83
3.3
2.93
3.06
UKSwitzerlandSpainPortugalPolandNorwayNetherlandsItalyIrelandGermanyFranceDenmarkCross-CountryAverage
The rating/review system gives consumers power over me. The rating/review system gives providers power over me.
Power in the
Sharing Economy
Page 32 Key Insights on the Rating/Review System
• Rating/review systems are assessed relatively positively and seen as a necessary part of the sharing economy.
• A sizable minority of respondents reports only moderate knowledge about how the rating/review systems work.
• Countries are divided about whether consumers have unrealistic expectations towards providers.
• Uber drivers perceive the rating/review systemss as tougher than Airbnb hosts and BlaBlaCar drivers.

Power in the
Sharing Economy
Page 33
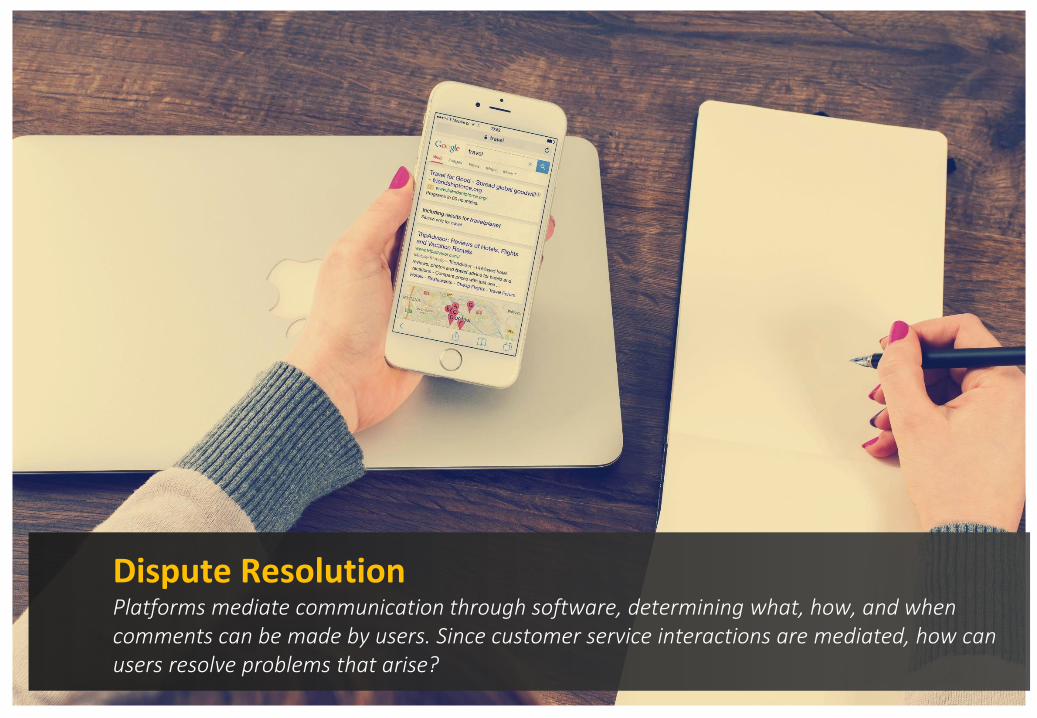
Dispute Resolution in the Sharing Economy5Despite the cutting-edge technologies which characterize certain sharing economy platforms, peer-to-peer transactions between strangers and mediated by sharing platforms might not always go flawlessly….
Power in the
Sharing Economy
Page 34
Dispute ResolutionPlatforms mediate communication through software, determining what, how, and when comments can be made by users. Since customer service interactions are mediated, how can users resolve problems that arise?

Power in the
Sharing Economy
Page 35
Platform concerns: Sharing Economy users have low expectations about platforms resolving their user problems.
36.5% of users think* that
sharing platforms give high priority to handling
user concerns.
38.9%of users think* that
sharing platforms would take action to correct
their concerns.
49.7%of users think* that all users are treated the same by the sharing
platform.
*Percentage of providers/consumers who selected “somewhat agree” or “strongly agree”
Power in the
Sharing Economy
Page 36
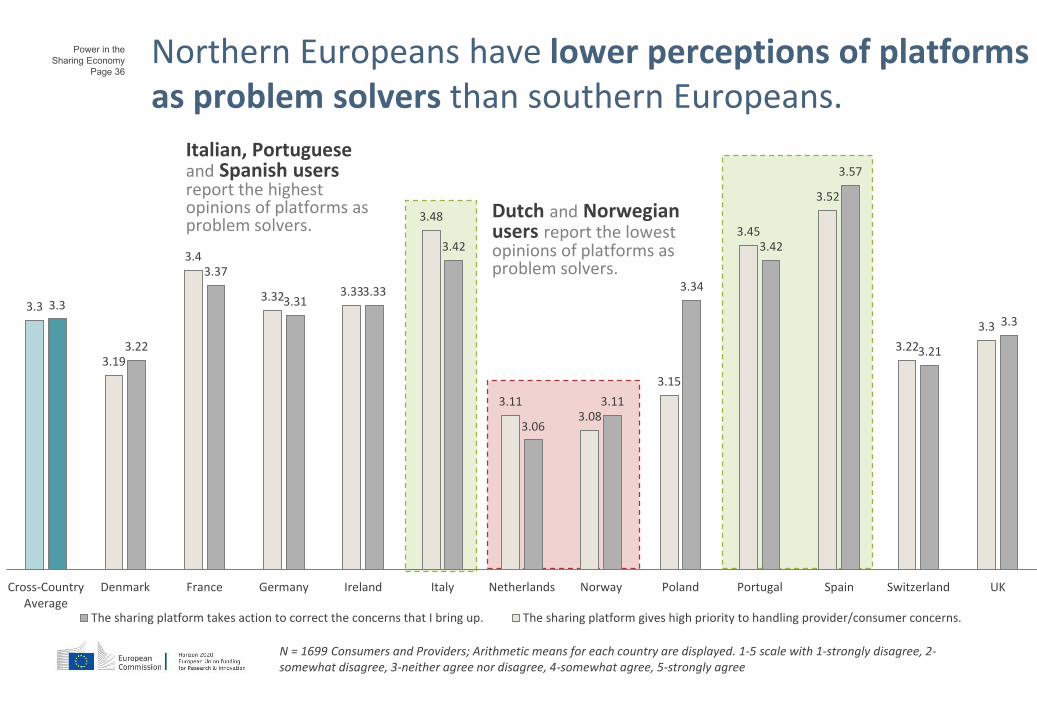
Northern Europeans have lower perceptions of platforms as problem solvers than southern Europeans.
N = 1699 Consumers and Providers; Arithmetic means for each country are displayed. 1-5 scale with 1-strongly disagree, 2-somewhat disagree, 3-neither agree nor disagree, 4-somewhat agree, 5-strongly agree
Dutch and Norwegian users report the lowest opinions of platforms as problem solvers.
Italian, Portuguese and Spanish users report the highest opinions of platforms as problem solvers.
3.3
3.21
3.57
3.42
3.34
3.11
3.06
3.42
3.333.31
3.37
3.22
3.3
3.3
3.22
3.52
3.45
3.15
3.083.11
3.48
3.333.32
3.4
3.19
3.3
UKSwitzerlandSpainPortugalPolandNorwayNetherlandsItalyIrelandGermanyFranceDenmarkCross-CountryAverage
The sharing platform takes action to correct the concerns that I bring up. The sharing platform gives high priority to handling provider/consumer concerns.
Power in the
Sharing Economy
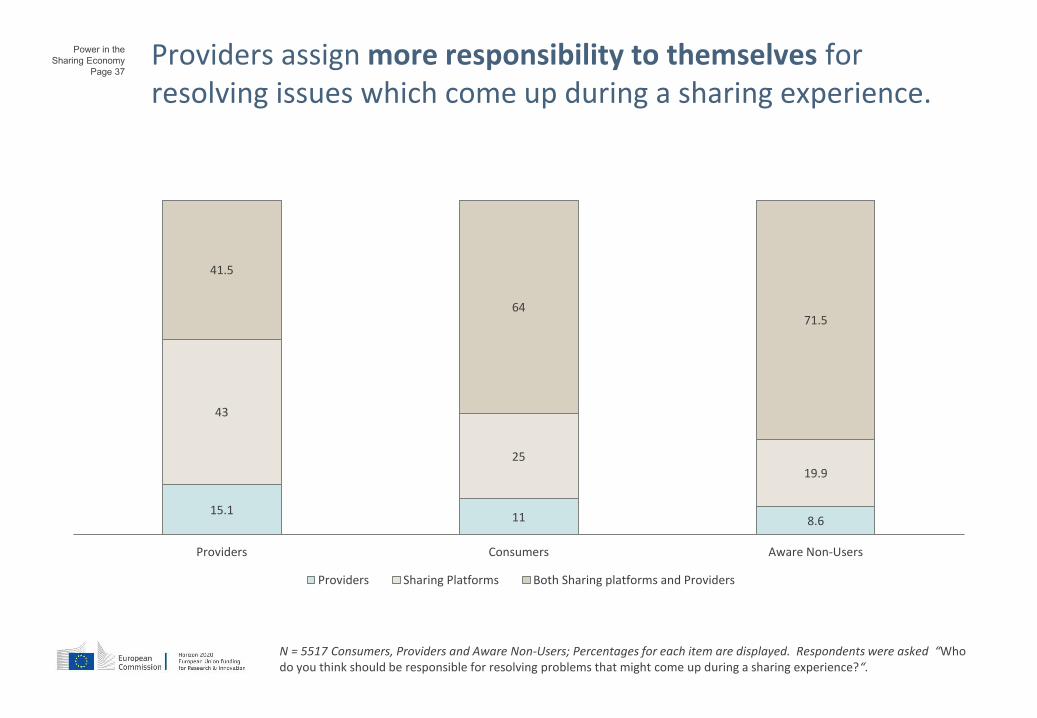
Page 37Providers assign more responsibility to themselves for resolving issues which come up during a sharing experience.
15.111 8.6
43
25
19.9
41.5
6471.5
Providers Consumers Aware Non-Users
Providers Sharing Platforms Both Sharing platforms and Providers
N = 5517 Consumers, Providers and Aware Non-Users; Percentages for each item are displayed. Respondents were asked “Who do you think should be responsible for resolving problems that might come up during a sharing experience?“.
Power in the
Sharing Economy
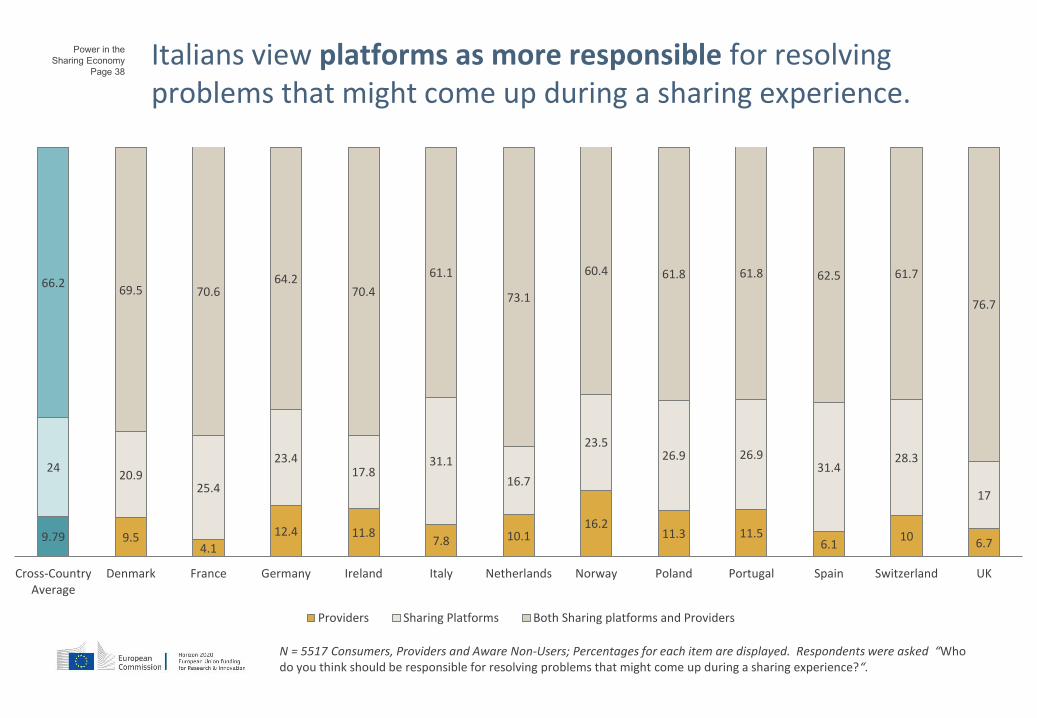
Page 38Italians view platforms as more responsible for resolving problems that might come up during a sharing experience.
N = 5517 Consumers, Providers and Aware Non-Users; Percentages for each item are displayed. Respondents were asked “Who do you think should be responsible for resolving problems that might come up during a sharing experience?“.
6.710
6.111.511.3
16.210.17.8
11.812.4
4.19.59.79
17
28.331.4
26.926.923.5
16.7
31.117.8
23.4
25.420.9
24
76.7
61.762.561.861.860.4
73.1
61.1
70.464.2
70.669.566.2
UKSwitzerlandSpainPortugalPolandNorwayNetherlandsItalyIrelandGermanyFranceDenmarkCross-CountryAverage
Providers Sharing Platforms Both Sharing platforms and Providers
Power in the
Sharing Economy
Page 39
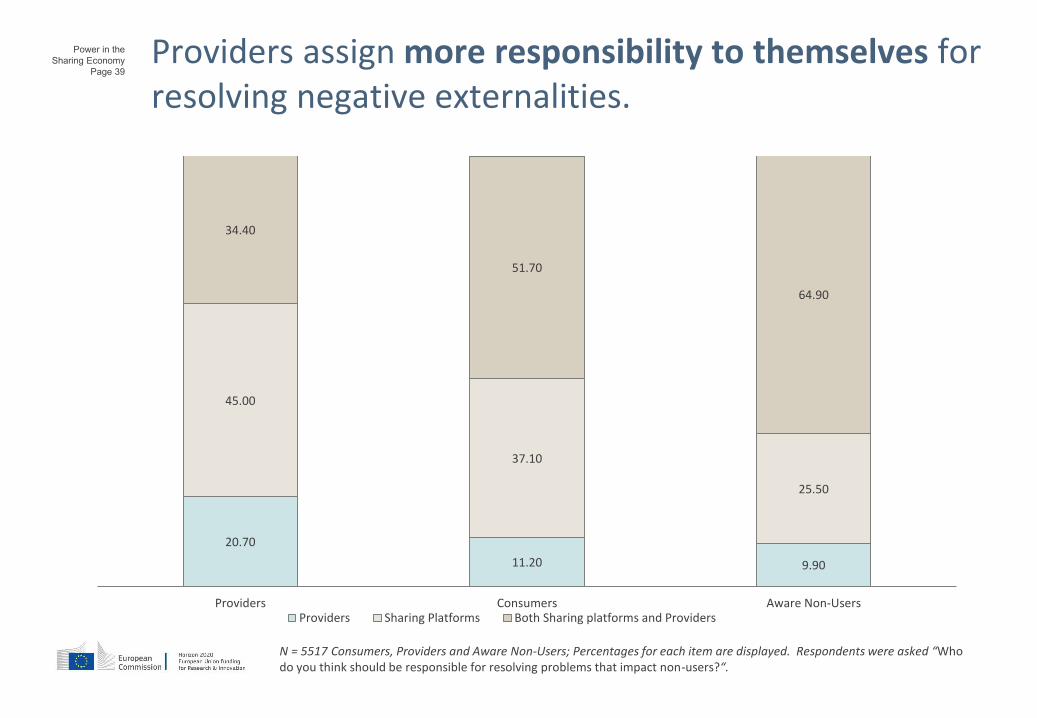
Providers assign more responsibility to themselves for resolving negative externalities.
20.70
11.20 9.90
45.00
37.10
25.50
34.40
51.70
64.90
Providers Consumers Aware Non-UsersProviders Sharing Platforms Both Sharing platforms and Providers
N = 5517 Consumers, Providers and Aware Non-Users; Percentages for each item are displayed. Respondents were asked “Who do you think should be responsible for resolving problems that impact non-users?“.
Power in the
Sharing Economy
Page 40
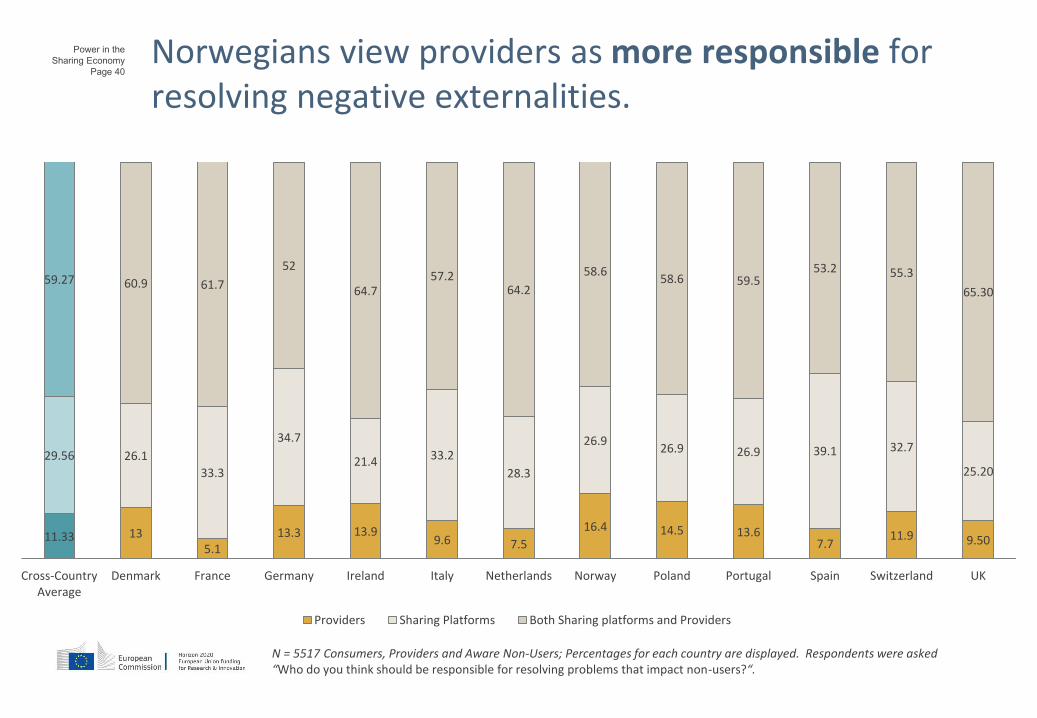
Norwegians view providers as more responsible for resolving negative externalities.
N = 5517 Consumers, Providers and Aware Non-Users; Percentages for each country are displayed. Respondents were asked“Who do you think should be responsible for resolving problems that impact non-users?“.
9.5011.97.7
13.614.516.4
7.59.613.913.3
5.11311.33
25.20
32.739.126.926.926.9
28.3
33.221.4
34.7
33.3
26.129.56
65.30
55.353.259.558.6
58.6
64.257.2
64.7
52
61.760.959.27
UKSwitzerlandSpainPortugalPolandNorwayNetherlandsItalyIrelandGermanyFranceDenmarkCross-CountryAverage
Providers Sharing Platforms Both Sharing platforms and Providers

Power in the
Sharing Economy
Page 41 Key Insights on Dispute Resolution
• Sharing economy users in Europe have low expectations about how sharing platforms handle their concerns. However, a large part might not have experienced concerns and are undecided.
• There is a North-South difference: Southern European users assess platforms more positively when it comes to handling concerns, northern European and Dutch users are more critical.
• Providers see more responsibility among themselves and on the side of the sharing platform to resolve problems during and after sharing transactions. Consumers and aware non-users see both the providers and the platforms responsible to a larger extent.
• Users in Italy and Spain see platform responsibility as particularly pronounced, whereas users in Norway report higher values for provider responsibility.
Power in the
Sharing Economy
Page 42
Terms and Conditions in the Sharing Economy6Terms and conditions are crucial elements of a platform’s governance. They describe user rights and show the underlying philosophies of how a platform operates
Power in the
Sharing Economy
Page 43
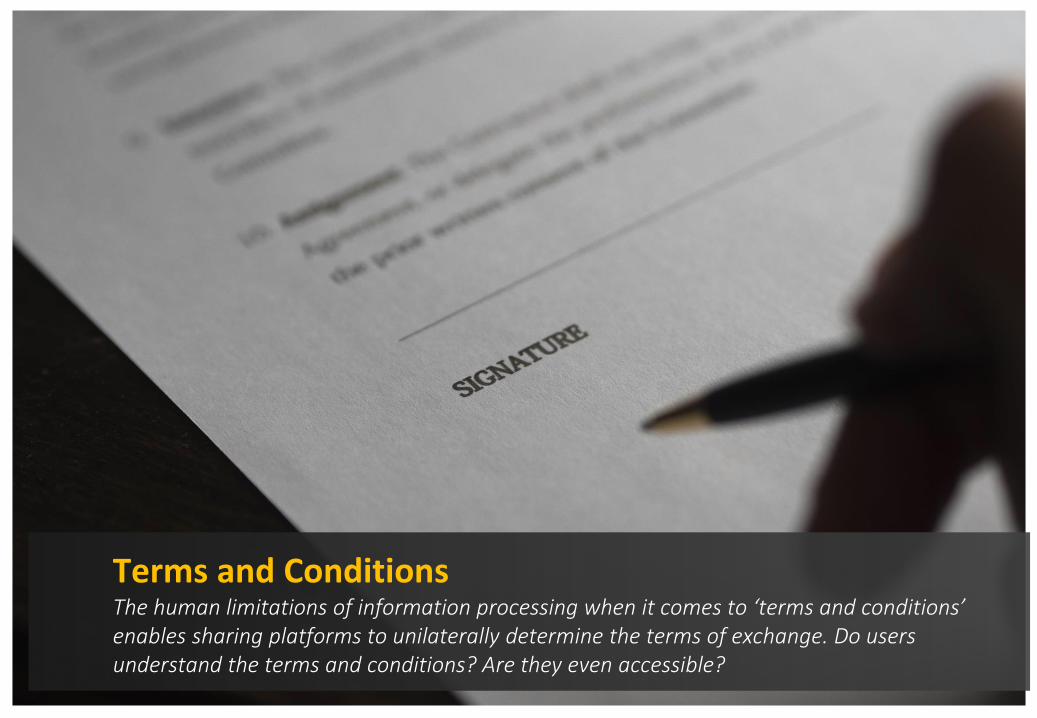
Terms and ConditionsThe human limitations of information processing when it comes to ‘terms and conditions’ enables sharing platforms to unilaterally determine the terms of exchange. Do users understand the terms and conditions? Are they even accessible?
Power in the
Sharing Economy
Page 44
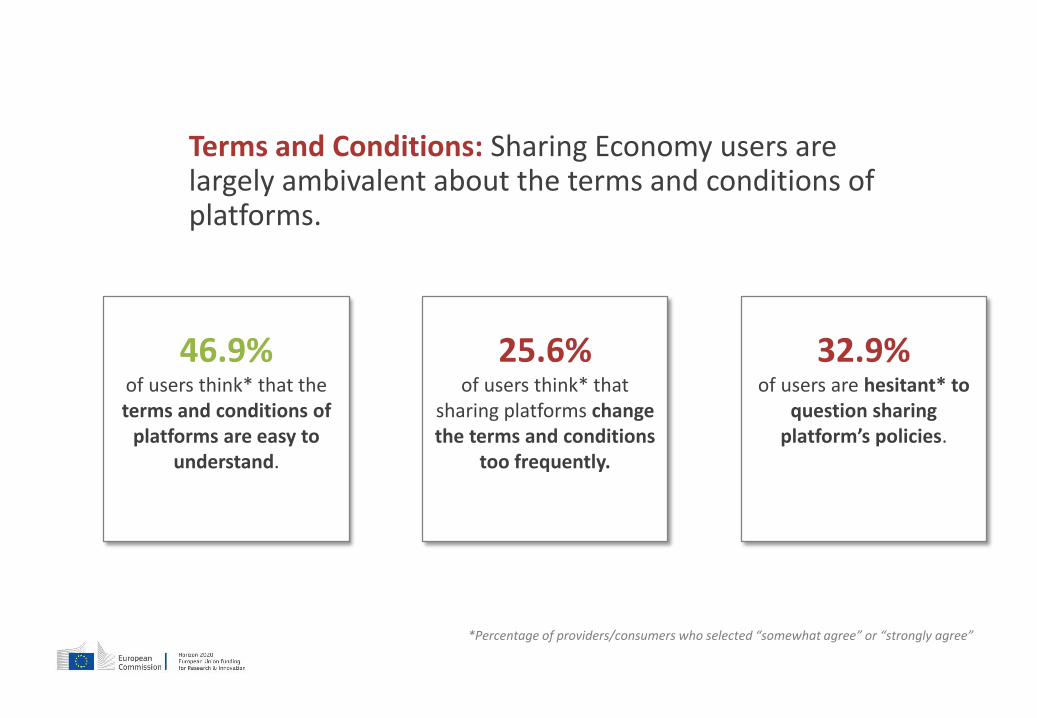
Terms and Conditions: Sharing Economy users are largely ambivalent about the terms and conditions of platforms.
25.6% of users think* that
sharing platforms change the terms and conditions
too frequently.
46.9%of users think* that the terms and conditions of
platforms are easy to understand.
32.9%of users are hesitant* to
question sharing platform’s policies.
*Percentage of providers/consumers who selected “somewhat agree” or “strongly agree”

Power in the
Sharing Economy
Page 45
BlaBlaCar is perceived to have the most accessible terms and conditions. Uber has the least accessible.
3.563.6
3.28
3.37
3.51
3.17
3.33
3.43
3.05
Airbnb BlaBlaCar Uber
The terms and conditions are easy to find. The terms and conditions are easy to understand. I have read the terms and conditions.
N = 1253 Consumers and Providers; Arithmetic means for each group are displayed. 1-5 scale with 1-strongly disagree, 2-somewhat disagree, 3-neither agree nor disagree, 4-somewhat agree, 5-strongly agree
Power in the
Sharing Economy
Page 46
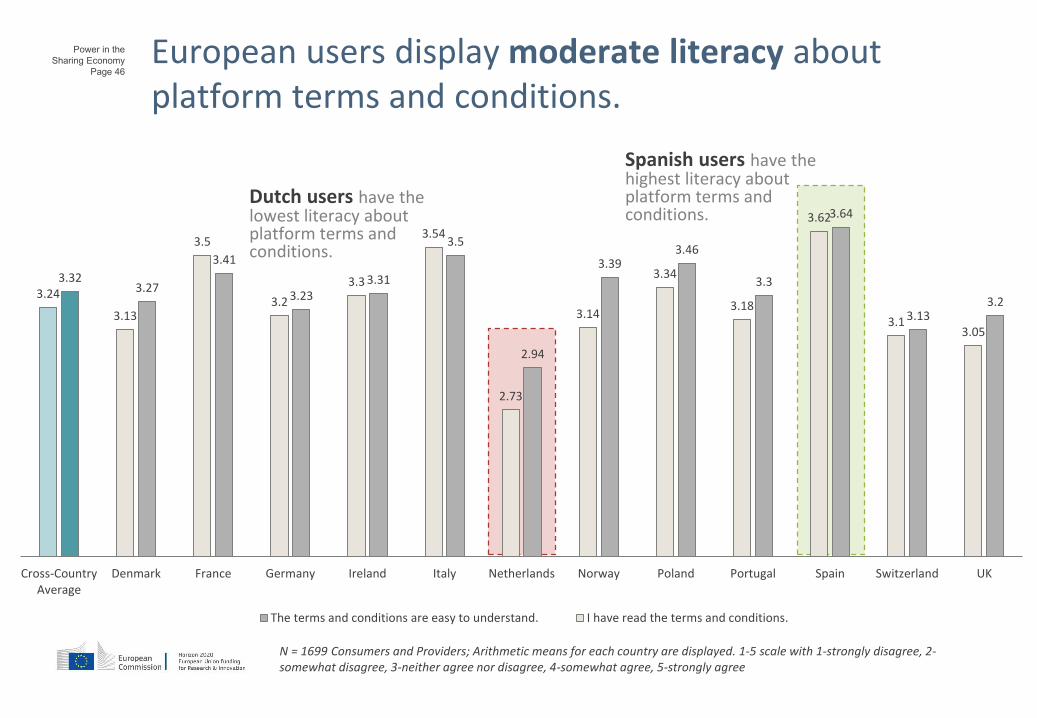
European users display moderate literacy about platform terms and conditions.
3.23.13
3.64
3.3
3.463.39
2.94
3.5
3.313.23
3.41
3.273.32
3.053.1
3.62
3.18
3.34
3.14
2.73
3.54
3.3
3.2
3.5
3.13
3.24
UKSwitzerlandSpainPortugalPolandNorwayNetherlandsItalyIrelandGermanyFranceDenmarkCross-CountryAverage
The terms and conditions are easy to understand. I have read the terms and conditions.
N = 1699 Consumers and Providers; Arithmetic means for each country are displayed. 1-5 scale with 1-strongly disagree, 2-somewhat disagree, 3-neither agree nor disagree, 4-somewhat agree, 5-strongly agree
Dutch users have the lowest literacy about platform terms and conditions.
Spanish users have the highest literacy about platform terms and conditions.
Power in the
Sharing Economy
Page 47
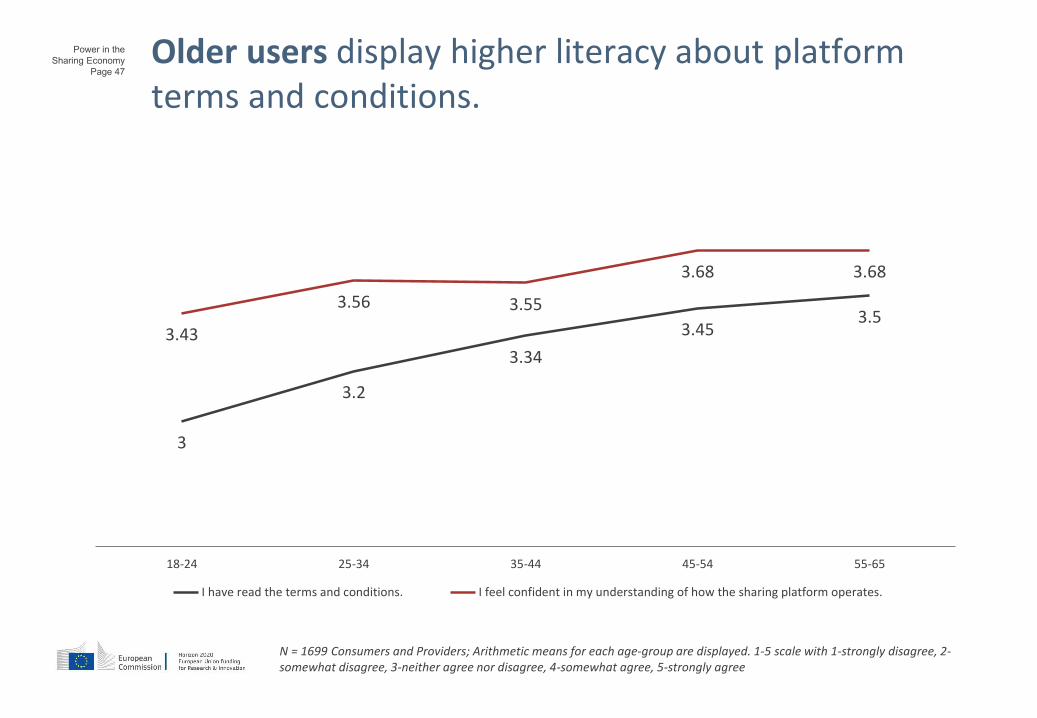
Older users display higher literacy about platform terms and conditions.
3
3.2
3.34
3.453.5
3.43
3.56 3.55
3.68 3.68
18-24 25-34 35-44 45-54 55-65
I have read the terms and conditions. I feel confident in my understanding of how the sharing platform operates.
N = 1699 Consumers and Providers; Arithmetic means for each age-group are displayed. 1-5 scale with 1-strongly disagree, 2-somewhat disagree, 3-neither agree nor disagree, 4-somewhat agree, 5-strongly agree
Power in the
Sharing Economy
Page 48
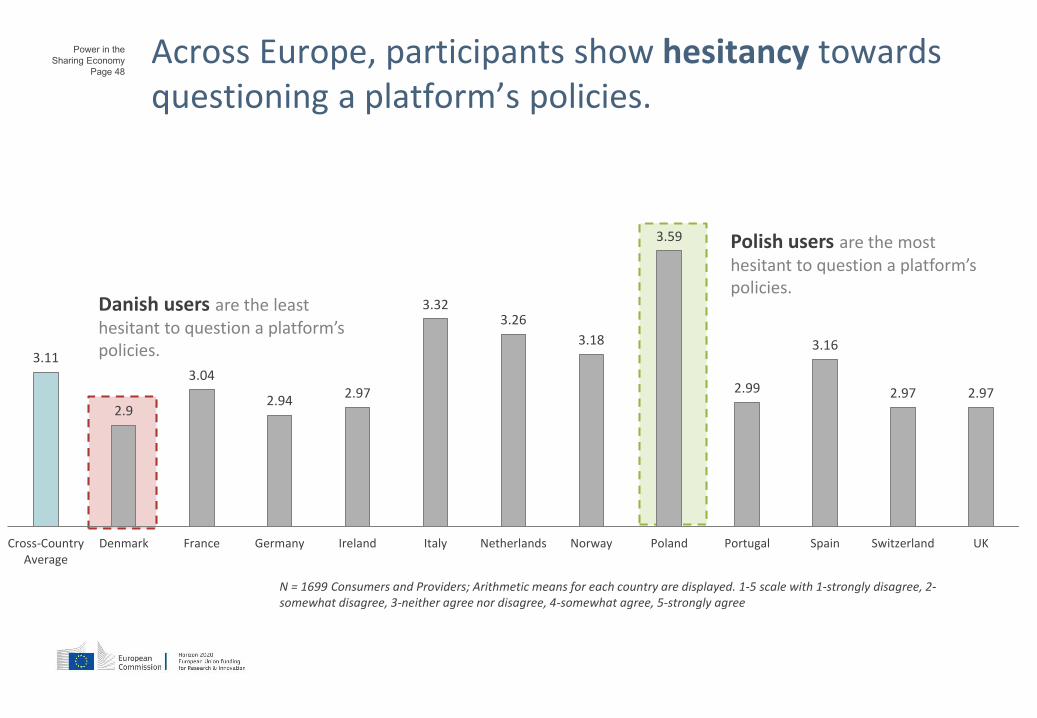
Across Europe, participants show hesitancy towards questioning a platform’s policies.
2.972.97
3.16
2.99
3.59
3.18
3.263.32
2.972.94
3.04
2.9
3.11
UKSwitzerlandSpainPortugalPolandNorwayNetherlandsItalyIrelandGermanyFranceDenmarkCross-CountryAverage
N = 1699 Consumers and Providers; Arithmetic means for each country are displayed. 1-5 scale with 1-strongly disagree, 2-somewhat disagree, 3-neither agree nor disagree, 4-somewhat agree, 5-strongly agree
Polish users are the most hesitant to question a platform’s policies.
Danish users are the least hesitant to question a platform’s policies.
Power in the
Sharing Economy
Page 49 Key Insights on Terms and Conditions
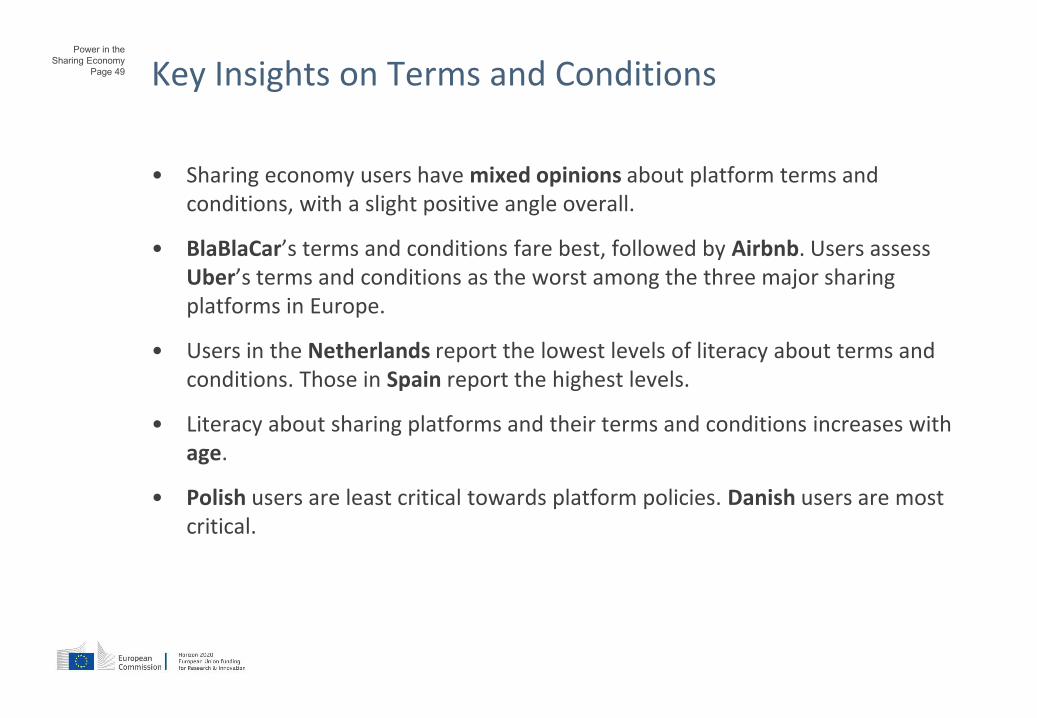
• Sharing economy users have mixed opinions about platform terms and conditions, with a slight positive angle overall.
• BlaBlaCar’s terms and conditions fare best, followed by Airbnb. Users assess Uber’s terms and conditions as the worst among the three major sharing platforms in Europe.
• Users in the Netherlands report the lowest levels of literacy about terms and conditions. Those in Spain report the highest levels.
• Literacy about sharing platforms and their terms and conditions increases with age.
• Polish users are least critical towards platform policies. Danish users are most critical.

Power in the
Sharing Economy
Page 50
Pricing in the Sharing Economy7The complicated model of sharing economy pricing can raise questions about the transparency and fairness of platform pricing models
Power in the
Sharing Economy
Page 51
PricingSharing economy platforms continue to ‘disrupt’ traditional businesses, operating with new pricing options and models. Are these options fair? Are platforms taking too much of a ‘cut’ for what is simply mediating between peers?
Power in the
Sharing Economy
Page 52
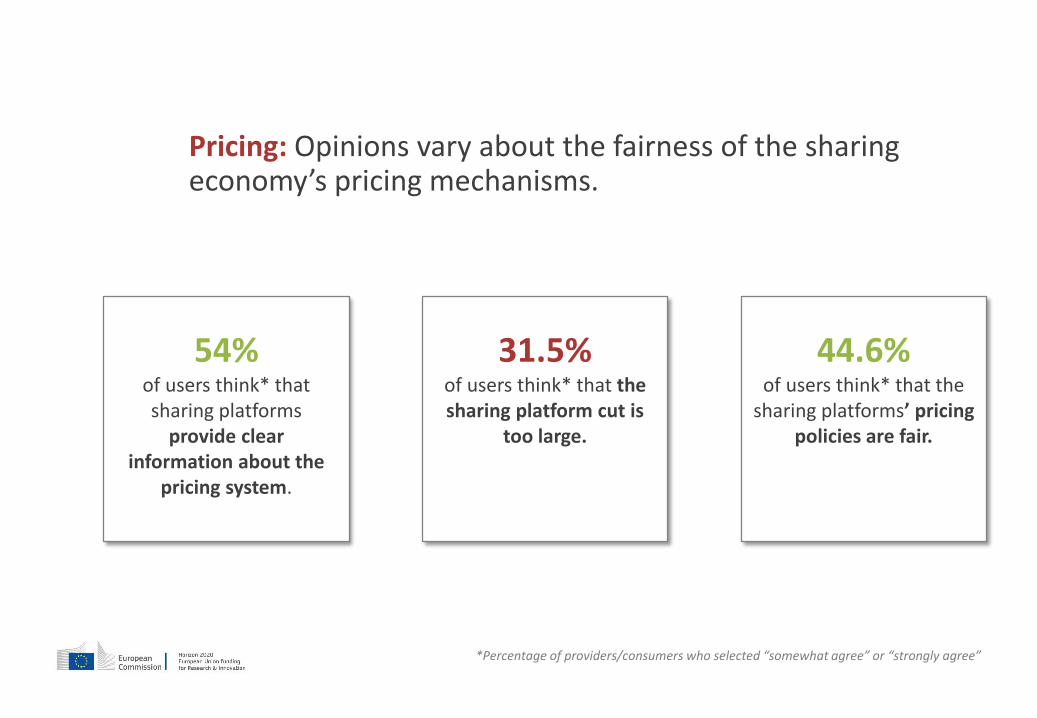
Pricing: Opinions vary about the fairness of the sharing economy’s pricing mechanisms.
31.5% of users think* that the sharing platform cut is
too large.
54%of users think* that sharing platforms
provide clear information about the
pricing system.
44.6%of users think* that the
sharing platforms’ pricing policies are fair.
*Percentage of providers/consumers who selected “somewhat agree” or “strongly agree”

Power in the
Sharing Economy
Page 53
text
3.36
3.44
3.48
3.62
3.65
18-24 25-34 35-44 45-54 55-65
The sharing platform provides clear information about the pricing system.
Older users perceive platform pricing information most clearly.
N = 1699 Consumers and Providers; Arithmetic means for each age-group are displayed. 1-5 scale with 1-strongly disagree, 2-somewhat disagree, 3-neither agree nor disagree, 4-somewhat agree, 5-strongly agree
Users show a sharp increase in perceived pricing clarity in their mid-40s.
Power in the
Sharing Economy
Page 54
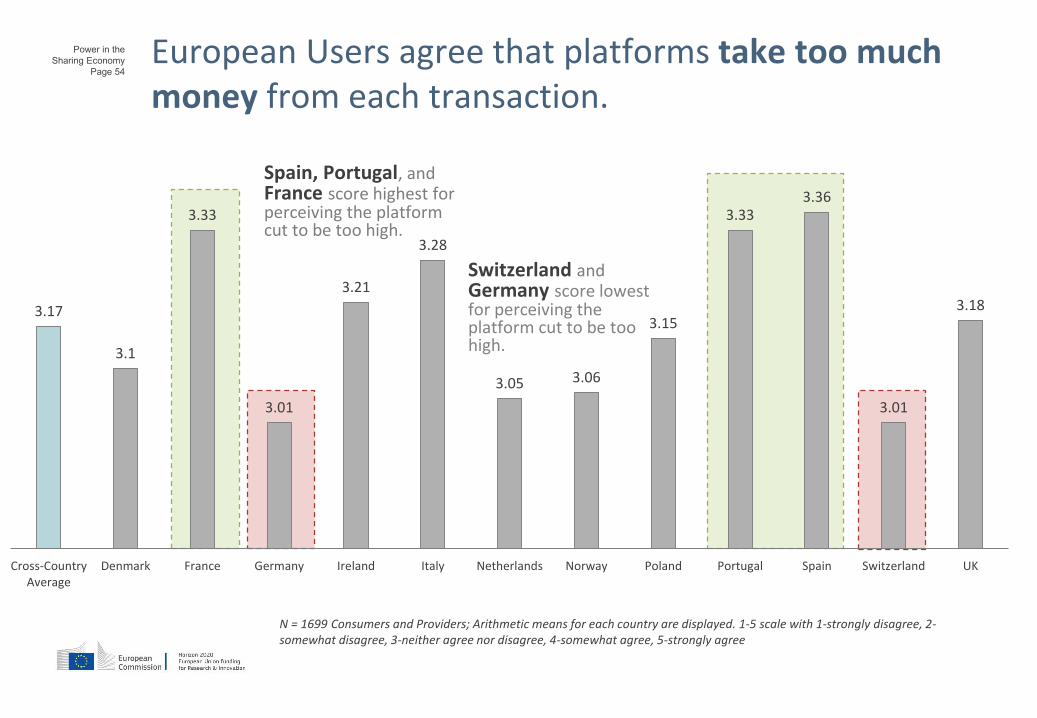
European Users agree that platforms take too much money from each transaction.
N = 1699 Consumers and Providers; Arithmetic means for each country are displayed. 1-5 scale with 1-strongly disagree, 2-somewhat disagree, 3-neither agree nor disagree, 4-somewhat agree, 5-strongly agree
3.18
3.01
3.363.33
3.15
3.063.05
3.28
3.21
3.01
3.33
3.1
3.17
UKSwitzerlandSpainPortugalPolandNorwayNetherlandsItalyIrelandGermanyFranceDenmarkCross-CountryAverage
Spain, Portugal, and France score highest for perceiving the platform cut to be too high.
Switzerland andGermany score lowest for perceiving the platform cut to be too high.
Power in the
Sharing Economy
Page 55
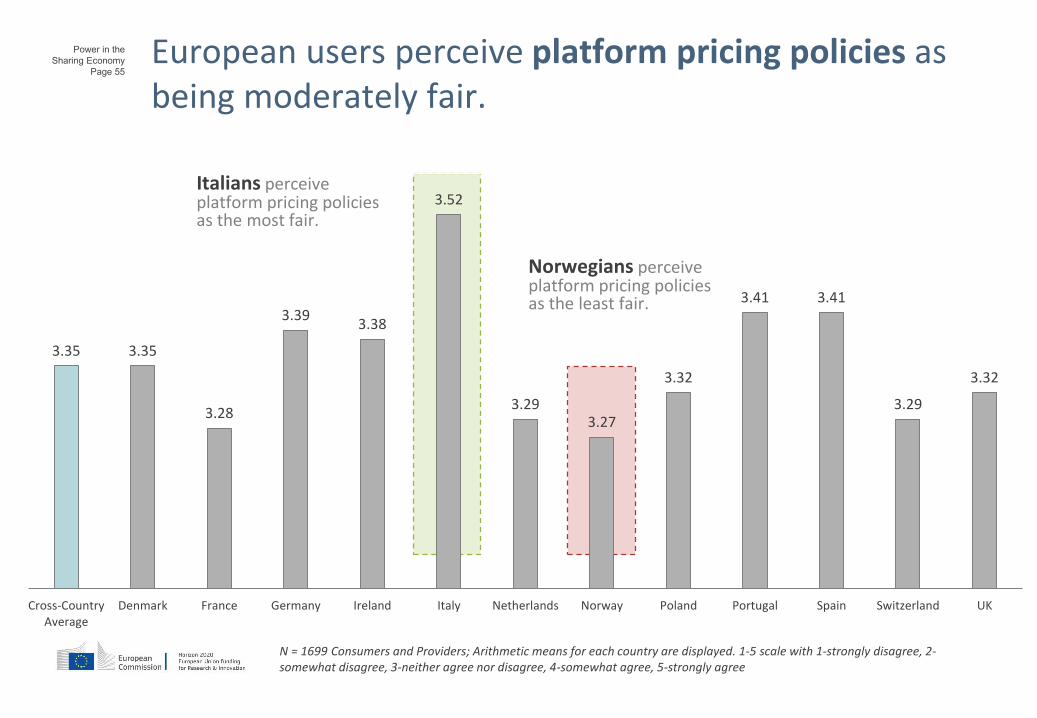
European users perceive platform pricing policies as being moderately fair.
N = 1699 Consumers and Providers; Arithmetic means for each country are displayed. 1-5 scale with 1-strongly disagree, 2-somewhat disagree, 3-neither agree nor disagree, 4-somewhat agree, 5-strongly agree
3.32
3.29
3.413.41
3.32
3.273.29
3.52
3.383.39
3.28
3.353.35
UKSwitzerlandSpainPortugalPolandNorwayNetherlandsItalyIrelandGermanyFranceDenmarkCross-CountryAverage
Norwegians perceive platform pricing policies as the least fair.
Italians perceive platform pricing policies as the most fair.
Power in the
Sharing Economy
Page 56 Key Insights on Pricing
• Users’ opinions about pricing practices are mixed, with a large part of users being ambivalent or not knowledgeable.
• The pricing information provided by platforms seems to be clear but a third of users think that the platform cut is too large.
• Younger users find the pricing information less clear than older users.
• The perceptions of platforms as greedy vary across countries: More users in Spain, Portugal, and France find the platform cut too large compared with Germany and Switzerland.
• There is a small North-South divide in pricing fairness perceptions. Users in the South, particularly in Italy, Portugal, and Spain, find the pricing policy fairer than those in Norway, France, Switzerland, and the Netherlands.
Power in the
Sharing Economy
Page 57
Platform Control in the Sharing Economy8Matching platforms enable flexible and convenient access to under-used assets by connecting providers and consumers. But how do platforms ensure availability and accessibility among providers?
Power in the
Sharing Economy
Page 58
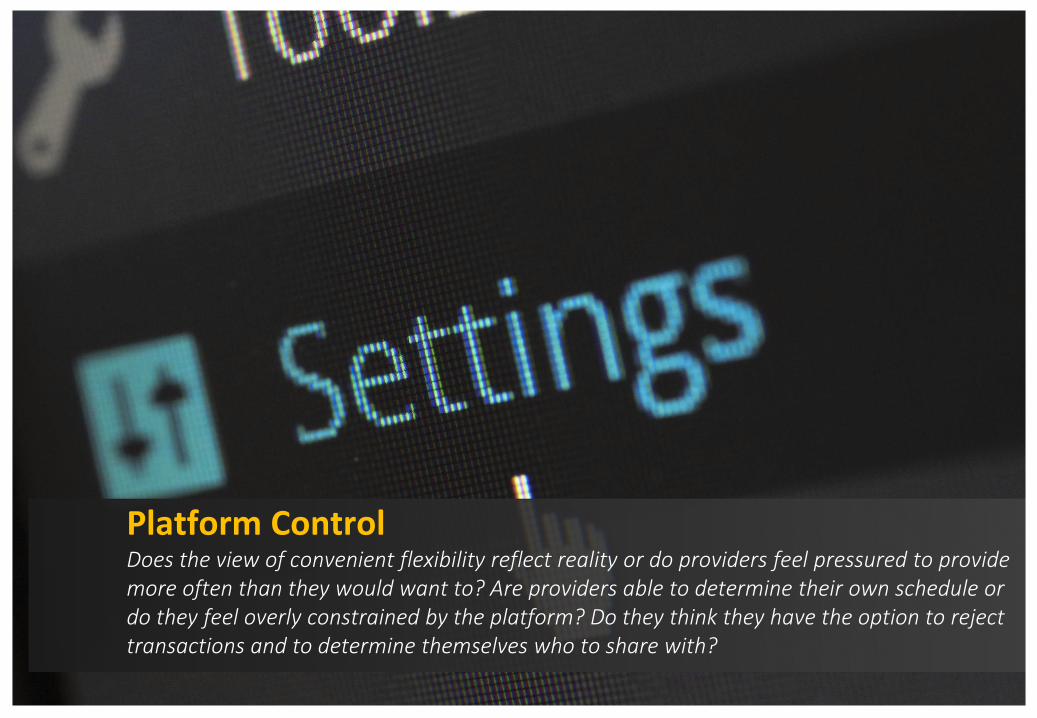
Platform ControlDoes the view of convenient flexibility reflect reality or do providers feel pressured to provide more often than they would want to? Are providers able to determine their own schedule or do they feel overly constrained by the platform? Do they think they have the option to reject transactions and to determine themselves who to share with?
Power in the
Sharing Economy
Page 59
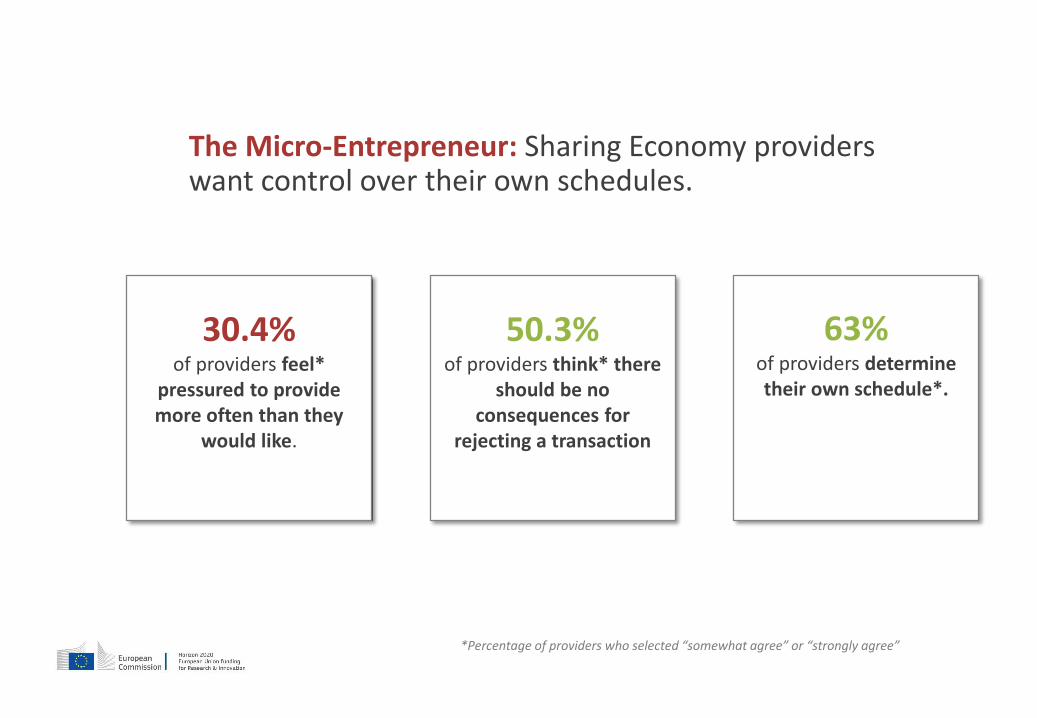
The Micro-Entrepreneur: Sharing Economy providers want control over their own schedules.
30.4% of providers feel*
pressured to provide more often than they
would like.
50.3%of providers think* there
should be no consequences for
rejecting a transaction
63%of providers determine their own schedule*.
*Percentage of providers who selected “somewhat agree” or “strongly agree”

Power in the
Sharing Economy
Page 60
Italian providers feel the most pressured to provide more often than they would like.
2.882.83
2.76
3.23
2.98
2.89
2.75
3.26
3.14
2.622.65
2.7
2.89
UKSwitzerlandSpainPortugalPolandNorwayNetherlandsItalyIrelandGermanyFranceDenmarkCross-CountryAverage
N = 556 Providers; Arithmetic means for each country are displayed. 1-5 scale with 1-strongly disagree, 2-somewhat disagree, 3-neither agree nor disagree, 4-somewhat agree, 5-strongly agree
Italian, Irish, and Portuguese providers feel the most pressured to provide.
Power in the
Sharing Economy
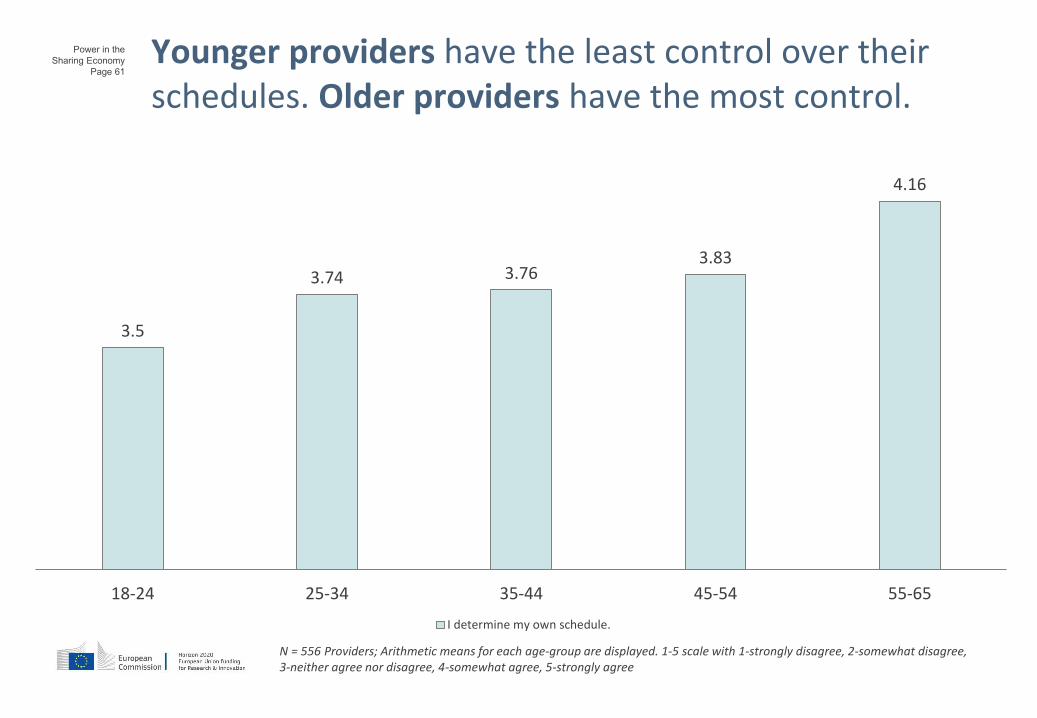
Page 61
3.5
3.74 3.763.83
4.16
18-24 25-34 35-44 45-54 55-65
I determine my own schedule.
Younger providers have the least control over their schedules. Older providers have the most control.
N = 556 Providers; Arithmetic means for each age-group are displayed. 1-5 scale with 1-strongly disagree, 2-somewhat disagree, 3-neither agree nor disagree, 4-somewhat agree, 5-strongly agree
Power in the
Sharing Economy
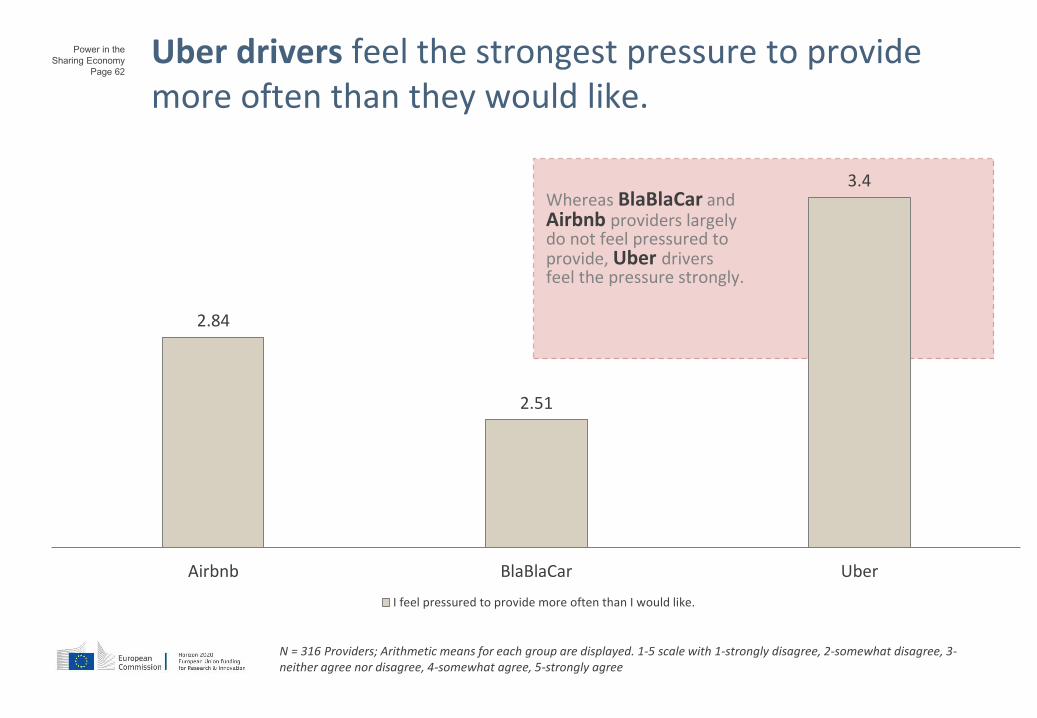
Page 62
2.84
2.51
3.4
Airbnb BlaBlaCar Uber
I feel pressured to provide more often than I would like.
Uber drivers feel the strongest pressure to provide more often than they would like.
N = 316 Providers; Arithmetic means for each group are displayed. 1-5 scale with 1-strongly disagree, 2-somewhat disagree, 3-neither agree nor disagree, 4-somewhat agree, 5-strongly agree
Whereas BlaBlaCar and Airbnb providers largely do not feel pressured to provide, Uber drivers feel the pressure strongly.
Power in the
Sharing Economy
Page 63
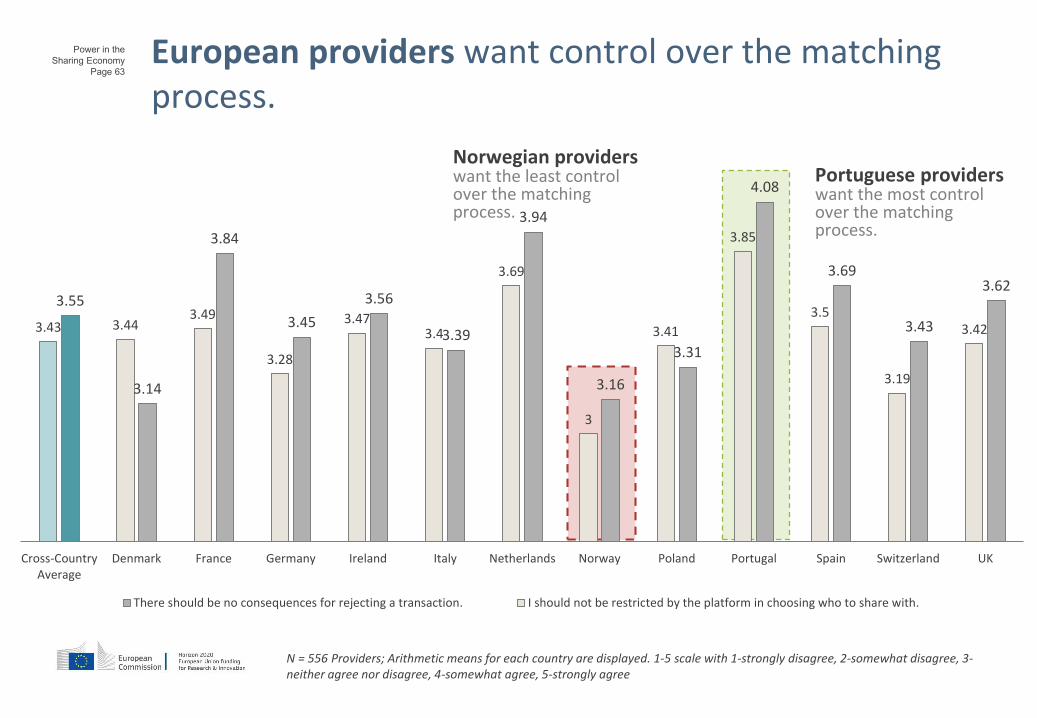
European providers want control over the matching process.
3.62
3.43
3.69
4.08
3.31
3.16
3.94
3.39
3.56
3.45
3.84
3.14
3.55
3.42
3.19
3.5
3.85
3.41
3
3.69
3.43.47
3.28
3.493.443.43
UKSwitzerlandSpainPortugalPolandNorwayNetherlandsItalyIrelandGermanyFranceDenmarkCross-CountryAverage
There should be no consequences for rejecting a transaction. I should not be restricted by the platform in choosing who to share with.
N = 556 Providers; Arithmetic means for each country are displayed. 1-5 scale with 1-strongly disagree, 2-somewhat disagree, 3-neither agree nor disagree, 4-somewhat agree, 5-strongly agree
Norwegian providers want the least control over the matching process.
Portuguese providers want the most control over the matching process.
Power in the
Sharing Economy
Page 64
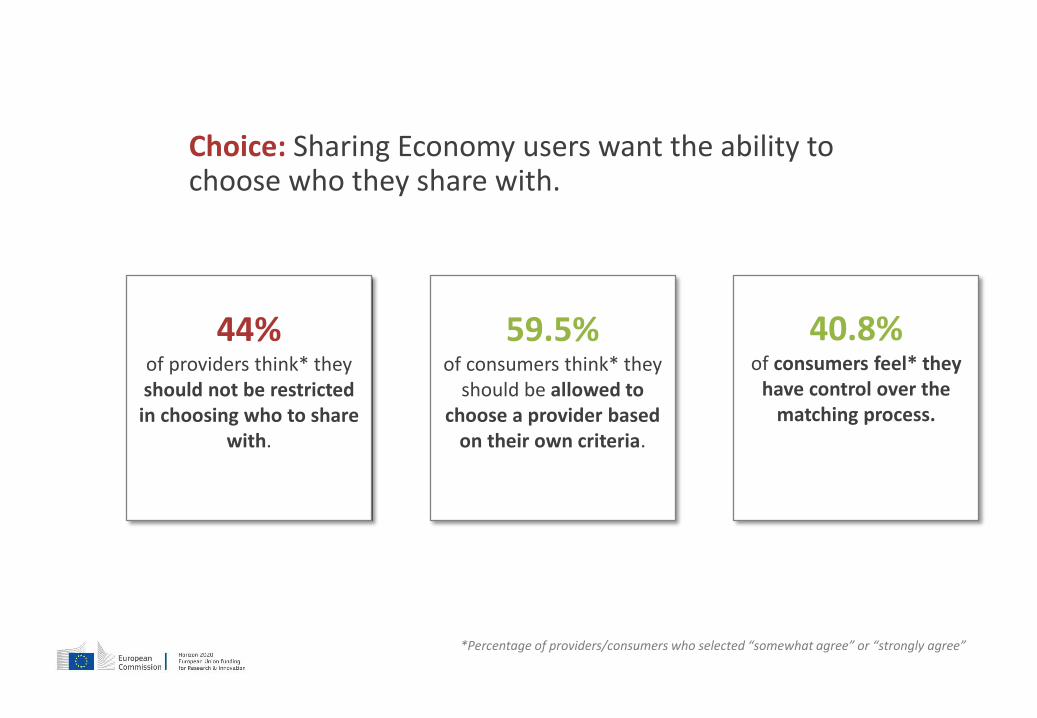
Choice: Sharing Economy users want the ability to choose who they share with.
44% of providers think* they should not be restricted in choosing who to share
with.
59.5%of consumers think* they
should be allowed to choose a provider based
on their own criteria.
40.8%of consumers feel* they
have control over the matching process.
*Percentage of providers/consumers who selected “somewhat agree” or “strongly agree”
Power in the
Sharing Economy
Page 65
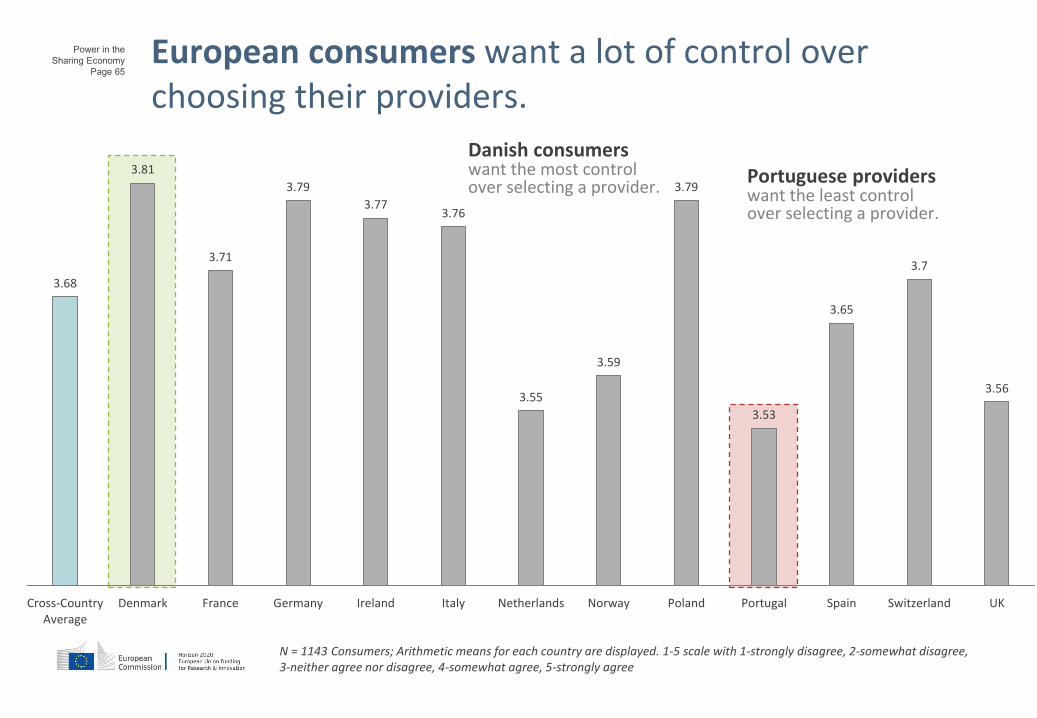
European consumers want a lot of control over choosing their providers.
N = 1143 Consumers; Arithmetic means for each country are displayed. 1-5 scale with 1-strongly disagree, 2-somewhat disagree, 3-neither agree nor disagree, 4-somewhat agree, 5-strongly agree
3.56
3.7
3.65
3.53
3.79
3.59
3.55
3.763.77
3.79
3.71
3.81
3.68
UKSwitzerlandSpainPortugalPolandNorwayNetherlandsItalyIrelandGermanyFranceDenmarkCross-CountryAverage
Portuguese providers want the least control over selecting a provider.
Danish consumers want the most control over selecting a provider.
Power in the
Sharing Economy
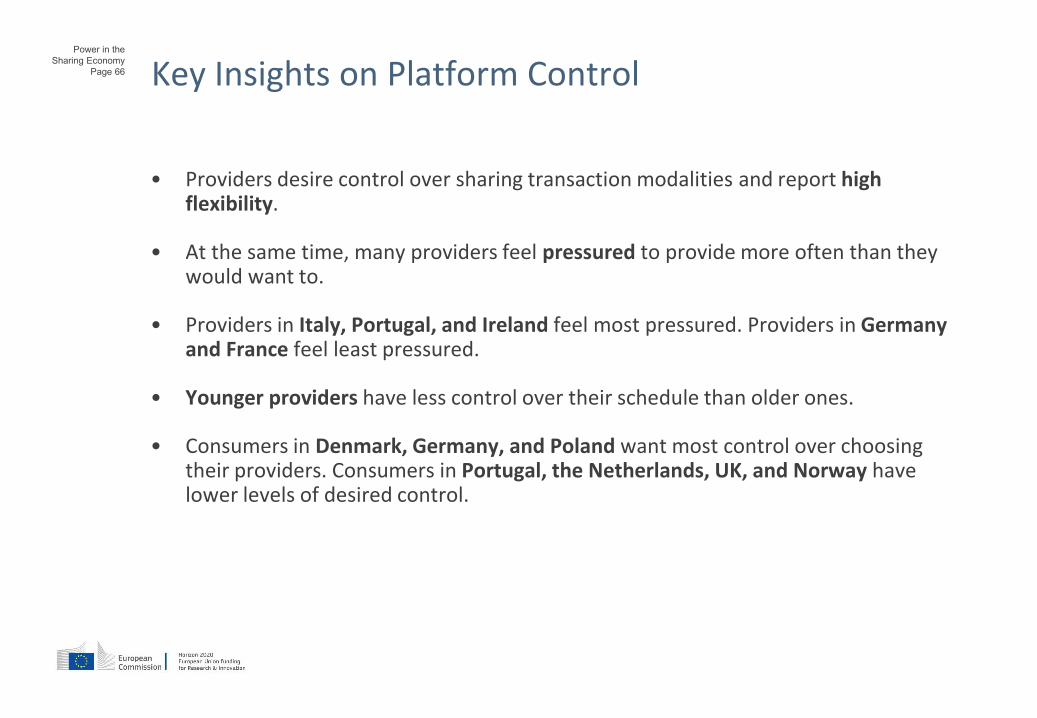
Page 66 Key Insights on Platform Control
• Providers desire control over sharing transaction modalities and report high flexibility.
• At the same time, many providers feel pressured to provide more often than they would want to.
• Providers in Italy, Portugal, and Ireland feel most pressured. Providers in Germany and France feel least pressured.
• Younger providers have less control over their schedule than older ones.
• Consumers in Denmark, Germany, and Poland want most control over choosing their providers. Consumers in Portugal, the Netherlands, UK, and Norway have lower levels of desired control.
Power in the
Sharing Economy
Page 67
Collective Action in the Sharing Economy9An important discussion when it comes to labor and the sharing economy revolves around collective action
Power in the
Sharing Economy
Page 68
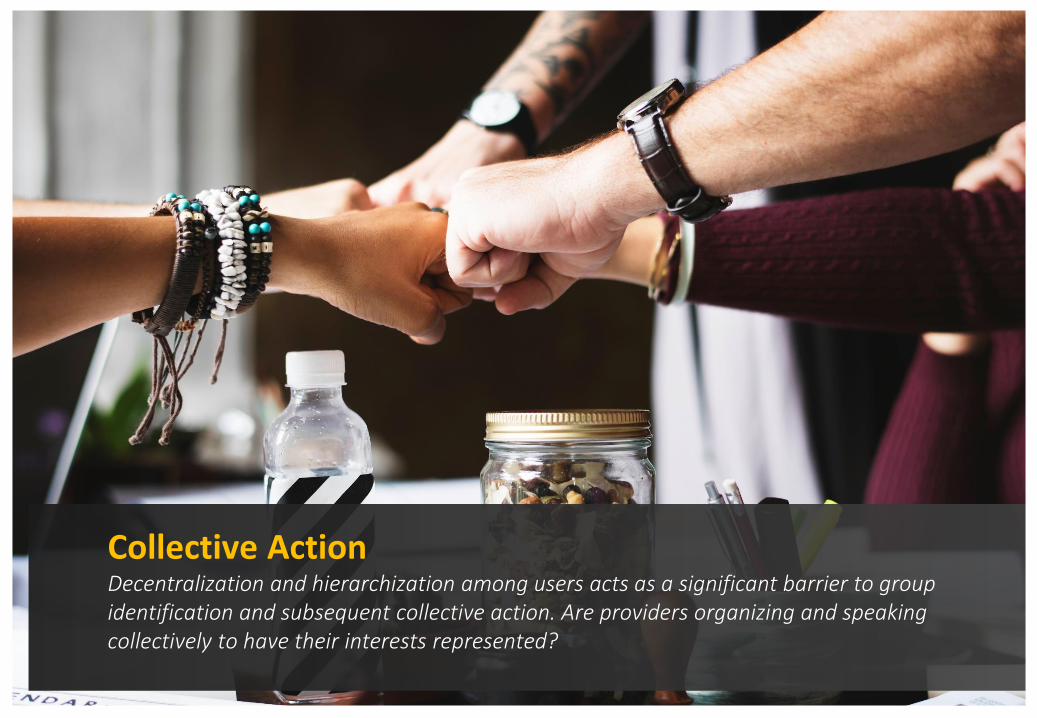
Collective ActionDecentralization and hierarchization among users acts as a significant barrier to group identification and subsequent collective action. Are providers organizing and speaking collectively to have their interests represented?
Power in the
Sharing Economy
Page 69
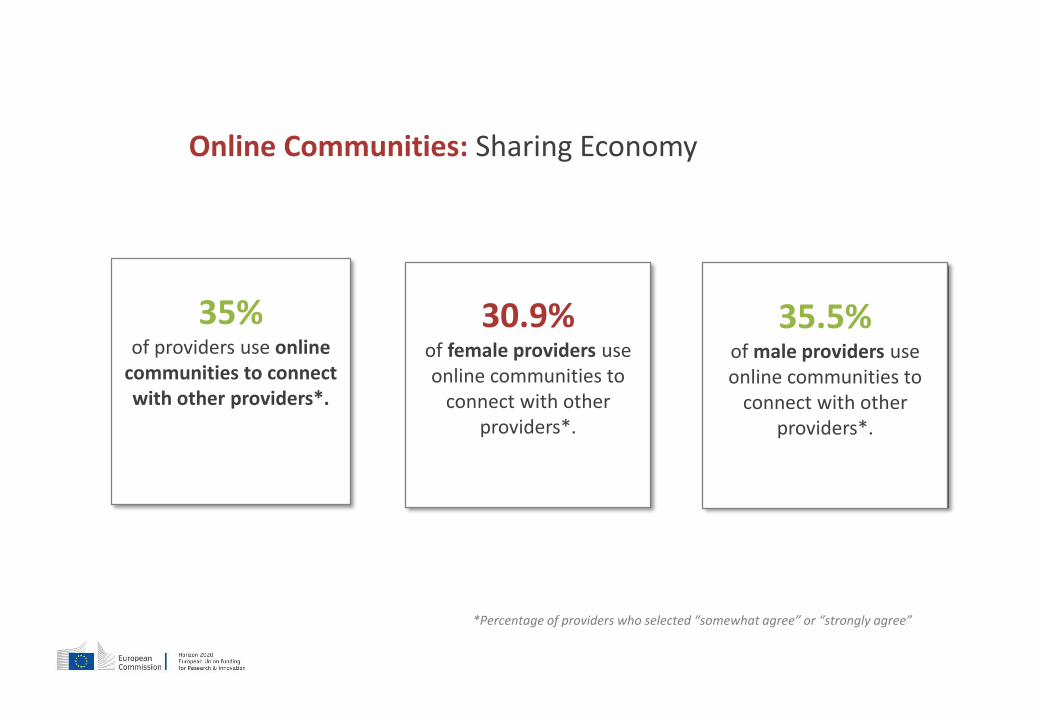
Online Communities: Sharing Economy
35%of providers use online
communities to connect with other providers*.
30.9% of female providers use online communities to
connect with other providers*.
35.5%of male providers use online communities to
connect with other providers*.
*Percentage of providers who selected “somewhat agree” or “strongly agree”
Power in the
Sharing Economy
Page 70
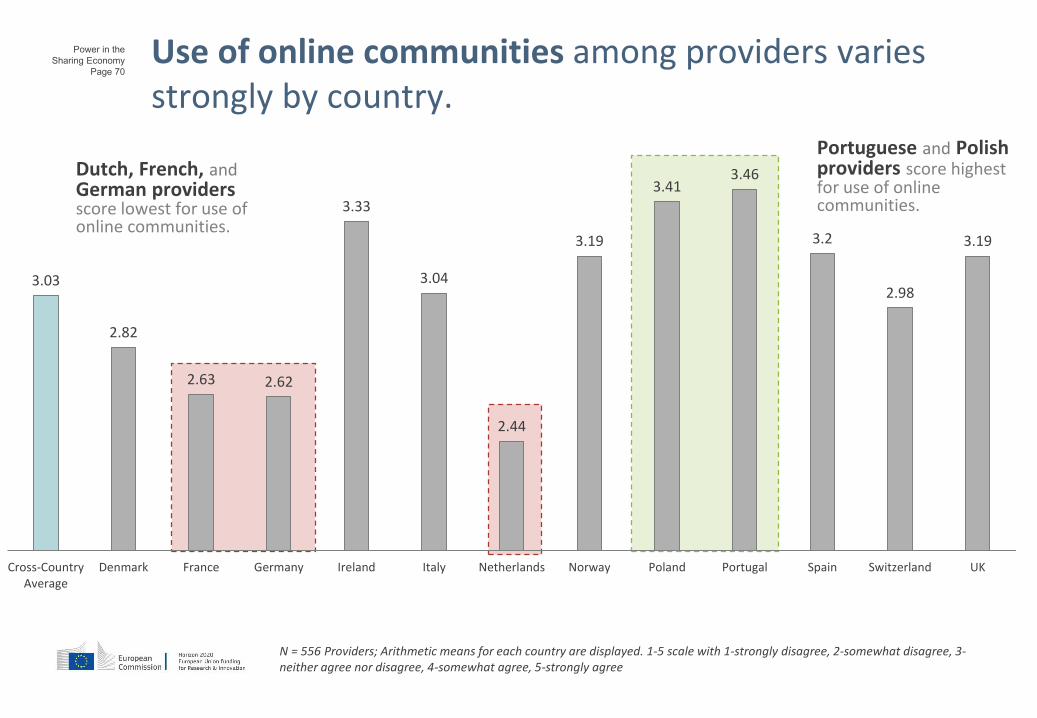
Use of online communities among providers varies strongly by country.
3.19
2.98
3.2
3.463.41
3.19
2.44
3.04
3.33
2.622.63
2.82
3.03
UKSwitzerlandSpainPortugalPolandNorwayNetherlandsItalyIrelandGermanyFranceDenmarkCross-CountryAverage
N = 556 Providers; Arithmetic means for each country are displayed. 1-5 scale with 1-strongly disagree, 2-somewhat disagree, 3-neither agree nor disagree, 4-somewhat agree, 5-strongly agree
Dutch, French, andGerman providers score lowest for use of online communities.
Portuguese and Polish providers score highest for use of online communities.
Power in the
Sharing Economy
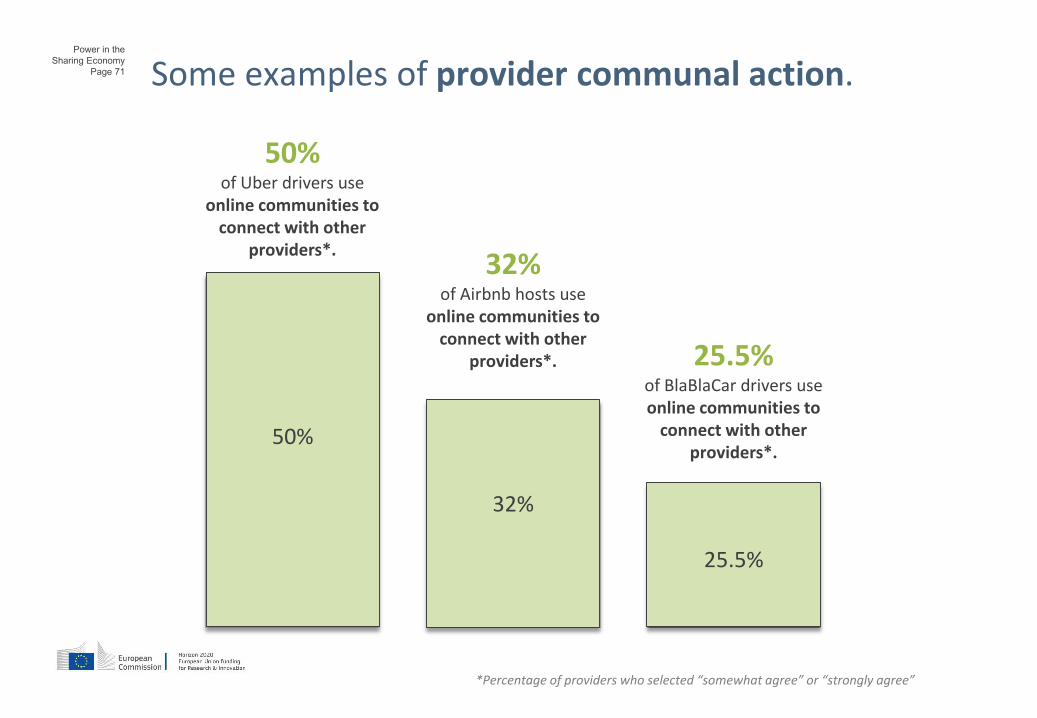
Page 71 Some examples of provider communal action.
50%
50%of Uber drivers use
online communities to connect with other
providers*.
32%
32%of Airbnb hosts use
online communities to connect with other
providers*. 25.5%of BlaBlaCar drivers use online communities to
connect with other providers*.
25.5%
*Percentage of providers who selected “somewhat agree” or “strongly agree”
Power in the
Sharing Economy
Page 72
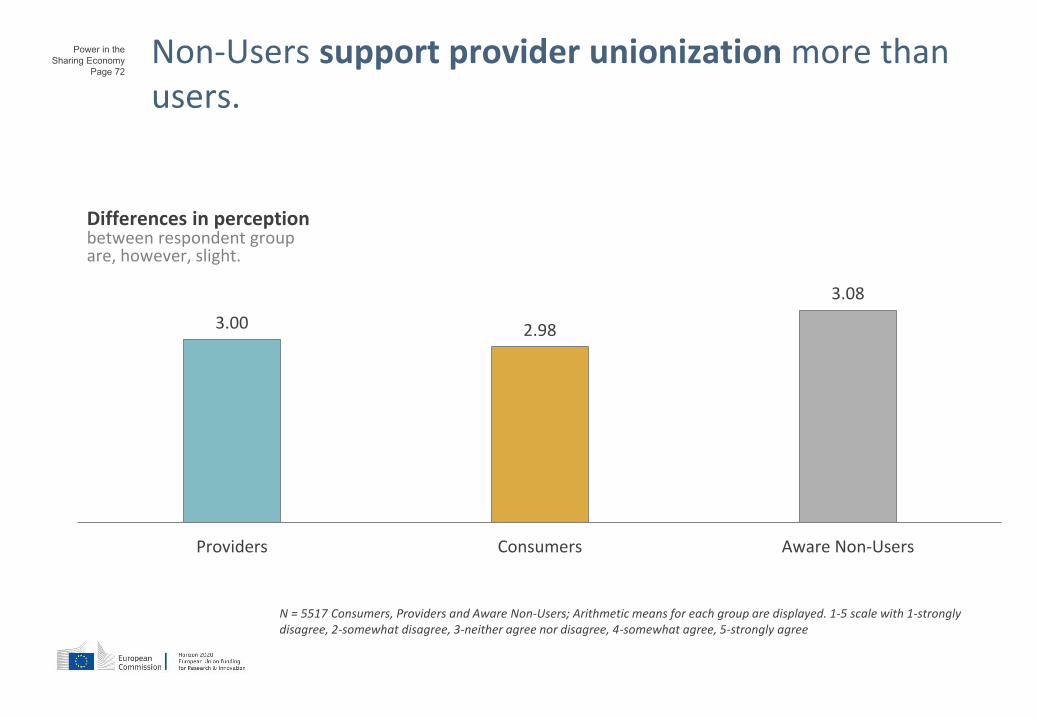
Non-Users support provider unionization more than users.
N = 5517 Consumers, Providers and Aware Non-Users; Arithmetic means for each group are displayed. 1-5 scale with 1-strongly disagree, 2-somewhat disagree, 3-neither agree nor disagree, 4-somewhat agree, 5-strongly agree
3.00 2.98
3.08
Providers Consumers Aware Non-Users
Differences in perception between respondent group are, however, slight.
Power in the
Sharing Economy
Page 73
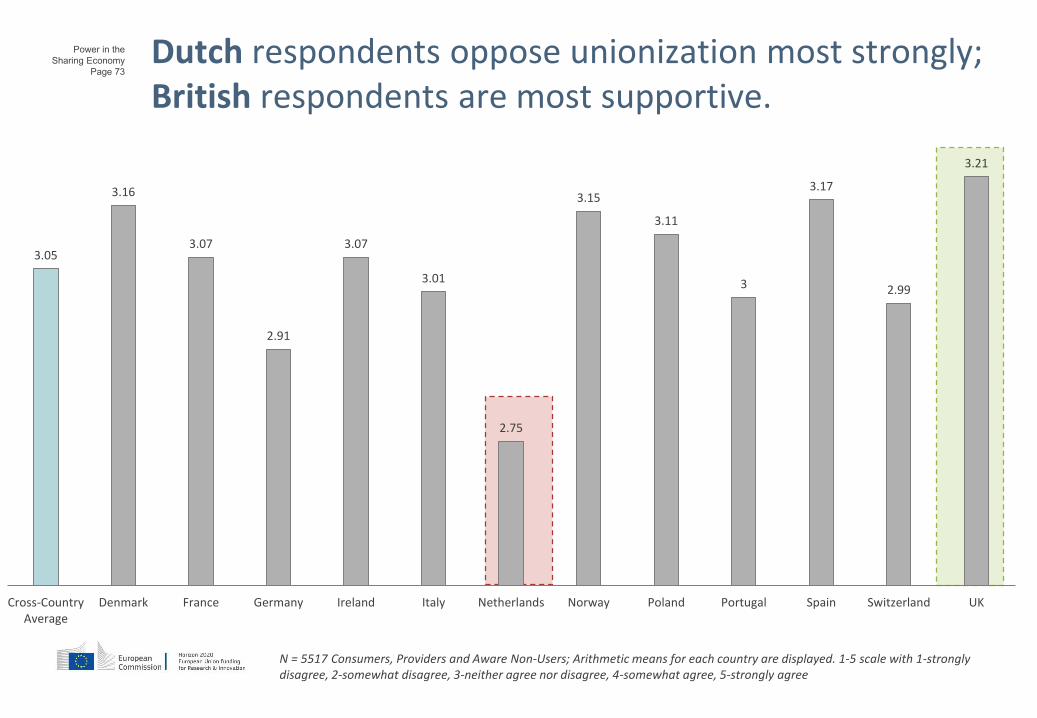
Dutch respondents oppose unionization most strongly; British respondents are most supportive.
N = 5517 Consumers, Providers and Aware Non-Users; Arithmetic means for each country are displayed. 1-5 scale with 1-strongly disagree, 2-somewhat disagree, 3-neither agree nor disagree, 4-somewhat agree, 5-strongly agree
3.21
2.99
3.17
3
3.11
3.15
2.75
3.01
3.07
2.91
3.07
3.16
3.05
UKSwitzerlandSpainPortugalPolandNorwayNetherlandsItalyIrelandGermanyFranceDenmarkCross-CountryAverage
Power in the
Sharing Economy
Page 74 Key Insights on Collective Action
• More than a third of all providers in the survey report using online communities to connect with other providers.
• The use of online communities is more prevalent among male providers than female providers.
• Uber drivers use online communities to a larger extent than Airbnb hosts and BlaBlaCar drivers.
• Support for unionization of providers is stronger among non-users than among providers and consumers.
• Support for unionization of providers is strongest in the UK and weakest in the Netherlands.

Power in the
Sharing Economy
Page 75
Narratives of the Sharing Economy10
The initial framing of issues in the media has created path dependencies for discussing platform narratives
Power in the
Sharing Economy
Page 76
Narratives of the Sharing EconomyHow do respondents perceive sharing economy platforms in terms of their primary function and mission? Do they see them as mere intermediaries between provider and consumers?

Power in the
Sharing Economy
Page 77Providers have the highest perception of themselves as employees. Non-users have the lowest perception of providers as employees.
40.65
36.05
34
59.35
63.95
66
Providers
Consumers
Aware Non-Users
As employees who work directly for the platform. As independent contractors who use the platform to connect to potential customers.
N = 5517 Consumers, Providers and Aware Non-Users; Percentages for each item are displayed.

Power in the
Sharing Economy
Page 78
Norwegians have strongest perceptions of providers as employees; The Dutch have the weakest perceptions of providers as employees.
N = 5517 Consumers, Providers and Aware Non-Users; Percentages for each item are displayed.
39.937.431.633.7
39.541.5
22.4
35.232.530.436.939.8
35.07
60.162.668.466.3
60.558.5
77.6
64.867.569.663.160.2
64.93
UKSwitzerlandSpainPortugalPolandNorwayNetherlandsItalyIrelandGermanyFranceDenmarkCross-CountryAverage
As employees who work directly for the platform. As independent contractors who use the platform to connect to potential customers.
Power in the
Sharing Economy
Page 79
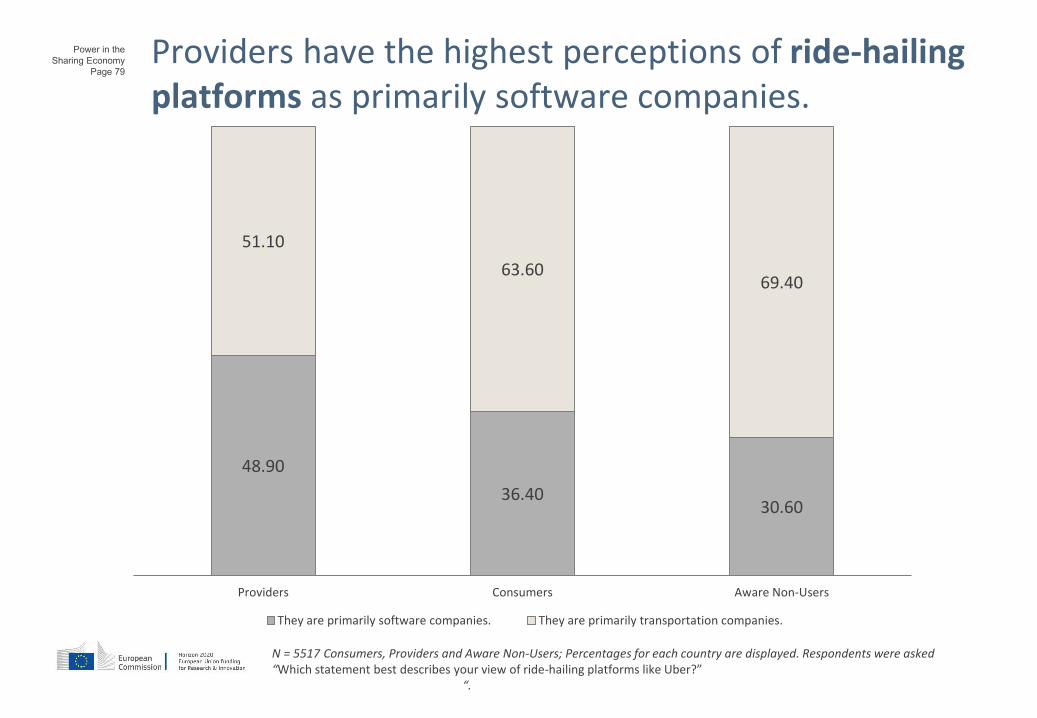
Providers have the highest perceptions of ride-hailing platforms as primarily software companies.
48.90
36.4030.60
51.10
63.6069.40
Providers Consumers Aware Non-Users
They are primarily software companies. They are primarily transportation companies.
N = 5517 Consumers, Providers and Aware Non-Users; Percentages for each country are displayed. Respondents were asked“Which statement best describes your view of ride-hailing platforms like Uber?”
“.
Power in the
Sharing Economy
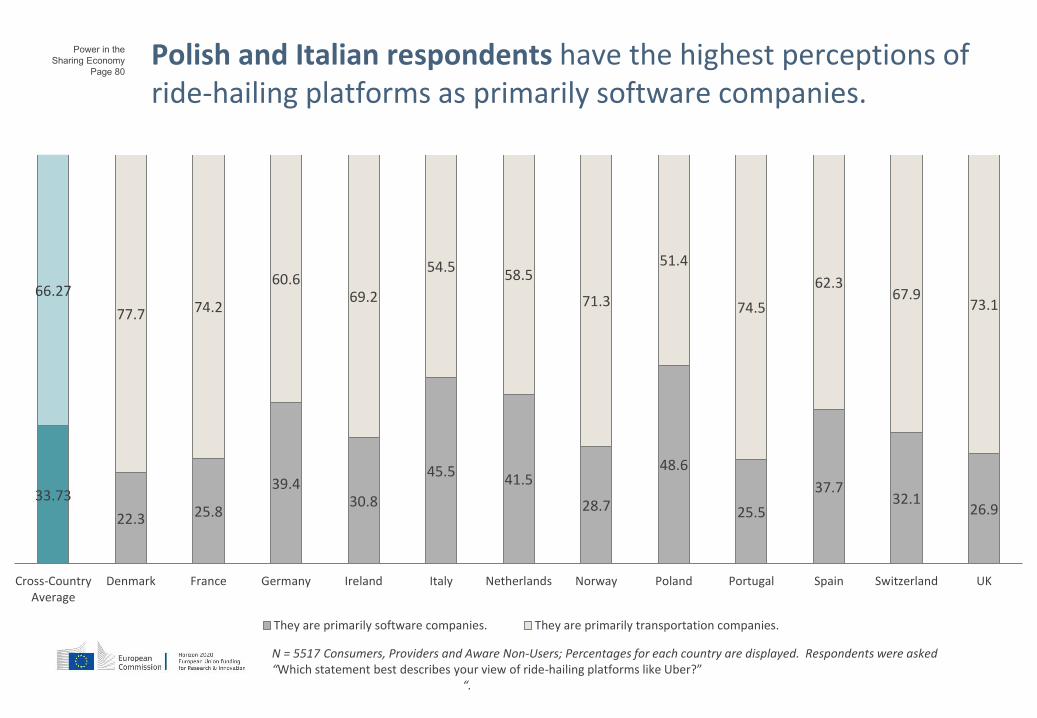
Page 80Polish and Italian respondents have the highest perceptions of ride-hailing platforms as primarily software companies.
26.932.1
37.7
25.5
48.6
28.7
41.545.5
30.839.4
25.822.3
33.73
73.167.9
62.3
74.5
51.4
71.3
58.554.5
69.260.6
74.277.7
66.27
UKSwitzerlandSpainPortugalPolandNorwayNetherlandsItalyIrelandGermanyFranceDenmarkCross-CountryAverage
They are primarily software companies. They are primarily transportation companies.
N = 5517 Consumers, Providers and Aware Non-Users; Percentages for each country are displayed. Respondents were asked“Which statement best describes your view of ride-hailing platforms like Uber?”
“.
Power in the
Sharing Economy
Page 81
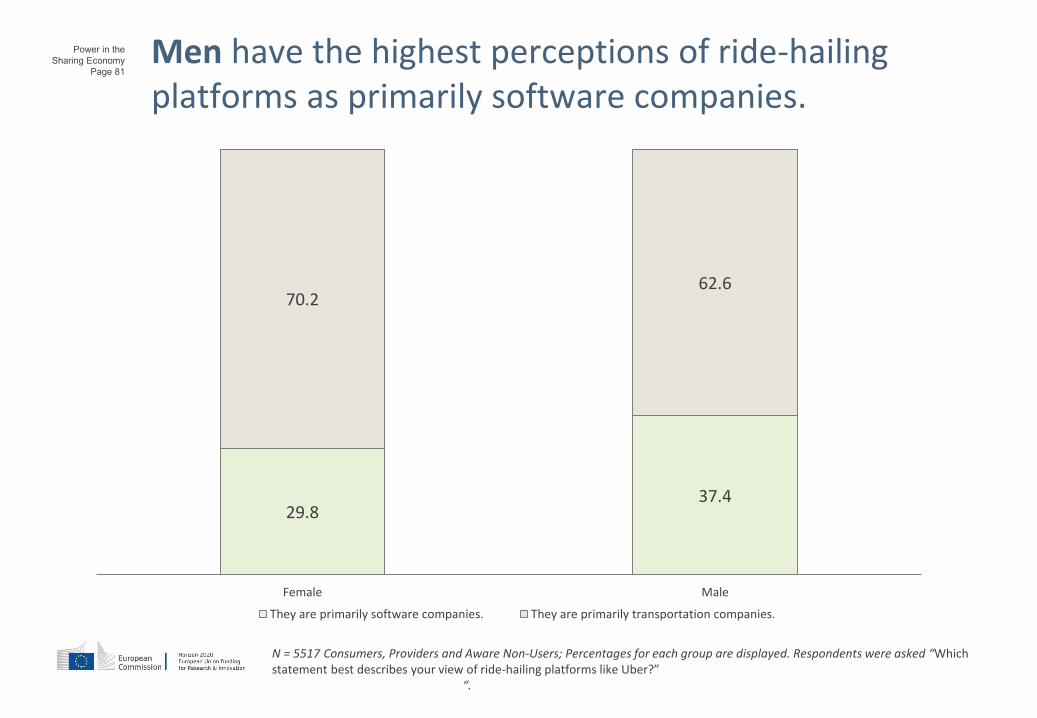
Men have the highest perceptions of ride-hailing platforms as primarily software companies.
29.837.4
70.262.6
Female Male
They are primarily software companies. They are primarily transportation companies.
N = 5517 Consumers, Providers and Aware Non-Users; Percentages for each group are displayed. Respondents were asked “Which statement best describes your view of ride-hailing platforms like Uber?”
“.
Power in the
Sharing Economy
Page 82
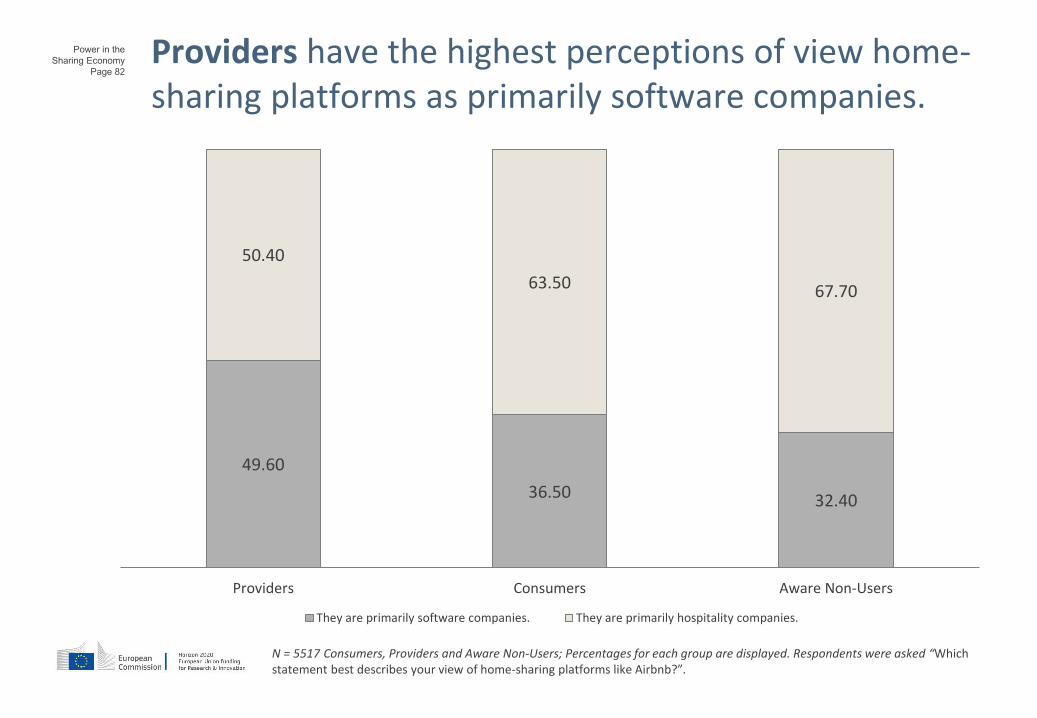
Providers have the highest perceptions of view home-sharing platforms as primarily software companies.
49.60
36.50 32.40
50.40
63.50 67.70
Providers Consumers Aware Non-Users
They are primarily software companies. They are primarily hospitality companies.
N = 5517 Consumers, Providers and Aware Non-Users; Percentages for each group are displayed. Respondents were asked “Which statement best describes your view of home-sharing platforms like Airbnb?”.
Power in the
Sharing Economy
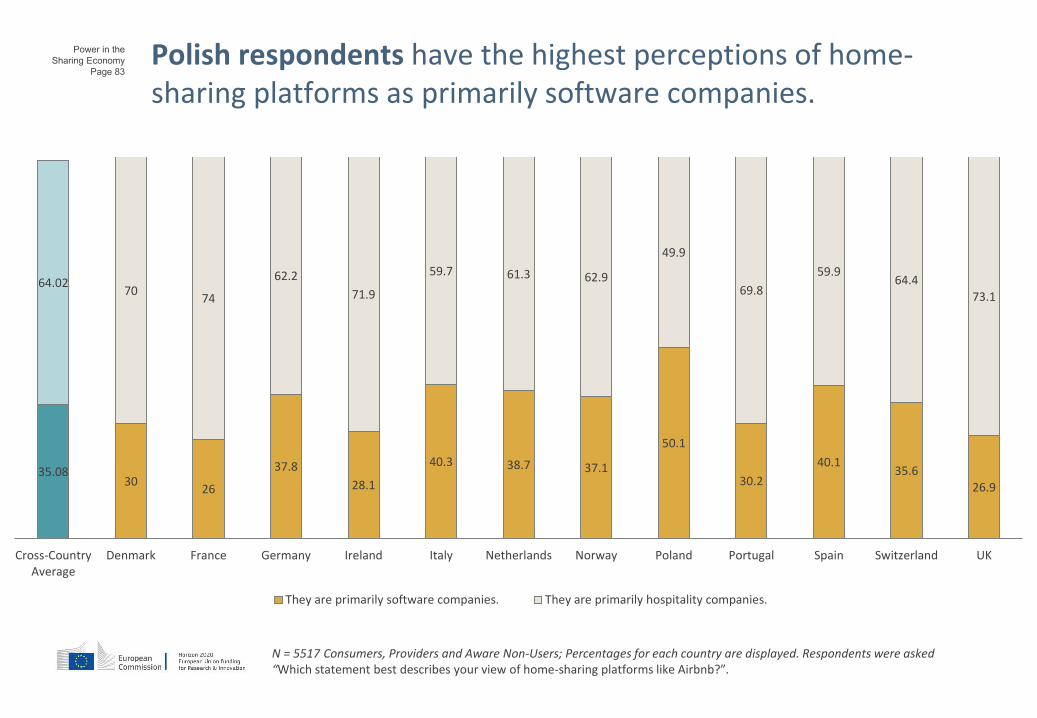
Page 83Polish respondents have the highest perceptions of home-sharing platforms as primarily software companies.
N = 5517 Consumers, Providers and Aware Non-Users; Percentages for each country are displayed. Respondents were asked“Which statement best describes your view of home-sharing platforms like Airbnb?”.
26.935.6
40.1
30.2
50.1
37.138.740.3
28.1
37.8
2630
35.08
73.1
64.459.9
69.8
49.9
62.961.359.7
71.9
62.2
7470
64.02
UKSwitzerlandSpainPortugalPolandNorwayNetherlandsItalyIrelandGermanyFranceDenmarkCross-CountryAverage
They are primarily software companies. They are primarily hospitality companies.
Power in the
Sharing Economy
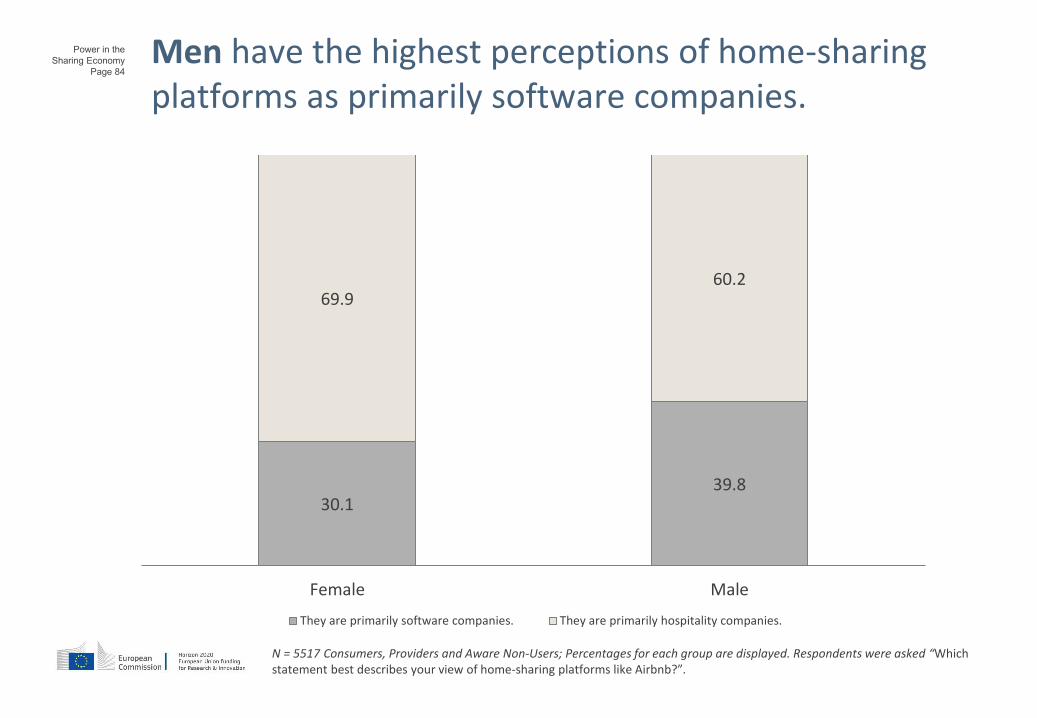
Page 84
Men have the highest perceptions of home-sharing platforms as primarily software companies.
30.139.8
69.960.2
Female Male
They are primarily software companies. They are primarily hospitality companies.
N = 5517 Consumers, Providers and Aware Non-Users; Percentages for each group are displayed. Respondents were asked “Which statement best describes your view of home-sharing platforms like Airbnb?”.
Power in the
Sharing Economy
Page 85 Key Insights on Narratives
• A two third majority sees providers as independent contractors.
• The proportion of providers who see themselves as employees – rather than indpendent contractors – is higher than the proportion of consumers and aware non-users who see providers as employees.
• Respondents in Norway, the UK, and Denmark see providers more as employees than respondents in other countries.
• A one third minority sees ride-hailing and home-sharing platforms as software companies, a two third majority as transport and hospitality companies.

Power in the
Sharing Economy
Page 86
Regulating the Sharing Economy11
A lack of clarity over service legality leaves users vulnerable
Power in the
Sharing Economy
Page 87
Regulating the Sharing EconomyThe novel nature of sharing economy platforms, in addition to their frequently trans-national nature, has created a scattered regulatory backdrop against which companies have been able to expand with varied levels of resistance and compliance.
Power in the
Sharing Economy
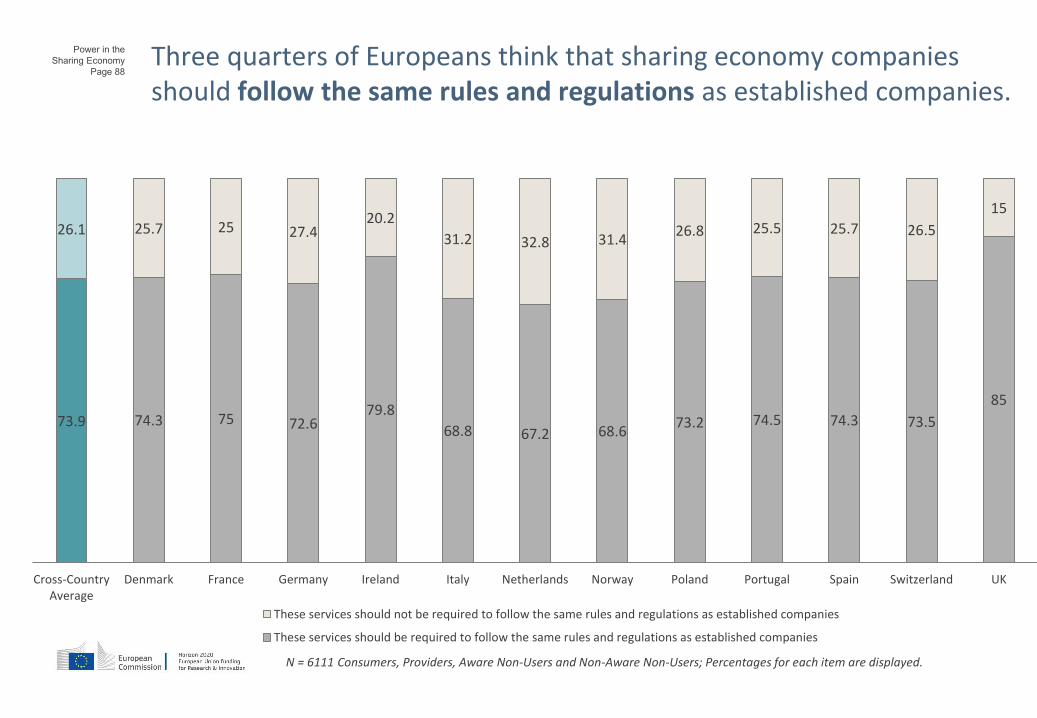
Page 88Three quarters of Europeans think that sharing economy companies should follow the same rules and regulations as established companies.
85
73.574.374.573.268.667.268.8
79.872.67574.373.9
15
26.525.725.526.831.432.831.2
20.227.42525.726.1
UKSwitzerlandSpainPortugalPolandNorwayNetherlandsItalyIrelandGermanyFranceDenmarkCross-CountryAverage
These services should not be required to follow the same rules and regulations as established companies
These services should be required to follow the same rules and regulations as established companies
N = 6111 Consumers, Providers, Aware Non-Users and Non-Aware Non-Users; Percentages for each item are displayed.
Power in the
Sharing Economy
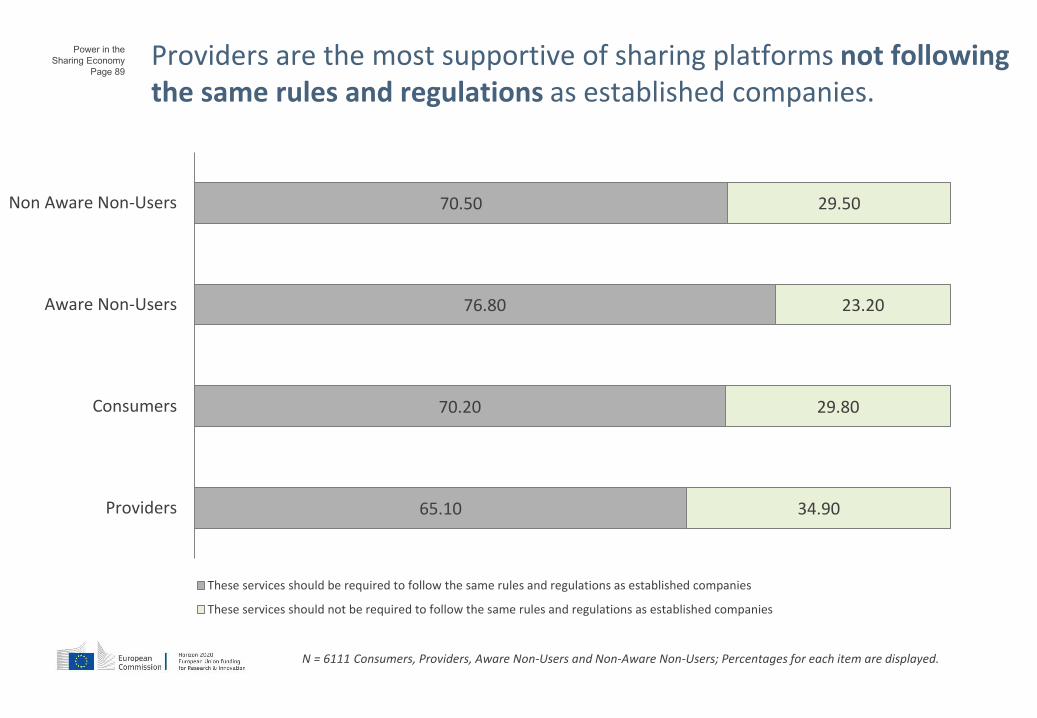
Page 89Providers are the most supportive of sharing platforms not following the same rules and regulations as established companies.
65.10
70.20
76.80
70.50
34.90
29.80
23.20
29.50
Providers
Consumers
Aware Non-Users
Non Aware Non-Users
These services should be required to follow the same rules and regulations as established companies
These services should not be required to follow the same rules and regulations as established companies
N = 6111 Consumers, Providers, Aware Non-Users and Non-Aware Non-Users; Percentages for each item are displayed.

Power in the
Sharing Economy
Page 90
Younger Europeans are more supportive of platforms not
following the same rules and regulations than older Europeans.
69.4
70.4
74.5
75.7
77.3
30.6
29.6
25.5
24.3
22.7
18-24
25-34
35-44
45-54
55-65
These services should be required to follow the same rules and regulations as established companies
These services should not be required to follow the same rules and regulations as established companies
N = 6111 Consumers, Providers, Aware Non-Users and Non-Aware Non-Users; Percentages for each item are displayed.
Power in the
Sharing Economy
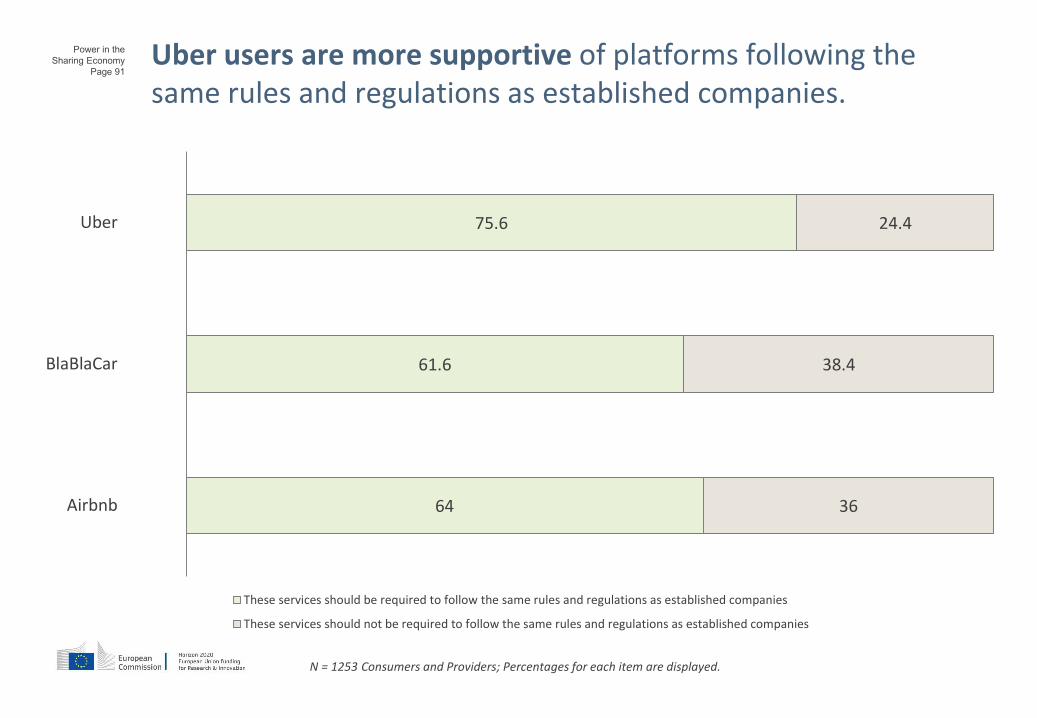
Page 91Uber users are more supportive of platforms following the same rules and regulations as established companies.
64
61.6
75.6
36
38.4
24.4
Airbnb
BlaBlaCar
Uber
These services should be required to follow the same rules and regulations as established companies
These services should not be required to follow the same rules and regulations as established companies
N = 1253 Consumers and Providers; Percentages for each item are displayed.

Power in the
Sharing Economy
Page 92Respondents prefer moderate regulation of the sharing economy. Only a small minority wants no regulation at all or a complete ban.
4.94.0
6.6
8.3
28.5
17.8
11.5
8.9
4.45.0
0-10 11-20 21-30 31-40 41-50 51-60 61-70 71-80 81-90 91-100
Complete BanNo Regulation at all
N = 5517 Consumers, Providers and Aware Non-Users; Percentages for each country are displayed. Respondents were asked “How much regulation should there be towards the sharing economy? 0 means no regulation at all and 100 means a complete ban.”

Power in the
Sharing Economy
Page 93
Aware Non-Users want most regulation and Consumers want the least regulation.
48.81 48.68
54.1
50.4
Provider Consumer Aware Non-User Non-Aware Non-User
N = 6111 Consumers, Providers, Aware Non-Users and Non-Aware Non-Users; Percentages for each item are displayed. Respondents were asked “How much regulation should there be towards the sharing economy? 0 means no regulation at all and 100 means a complete ban.”
Power in the
Sharing Economy
Page 94
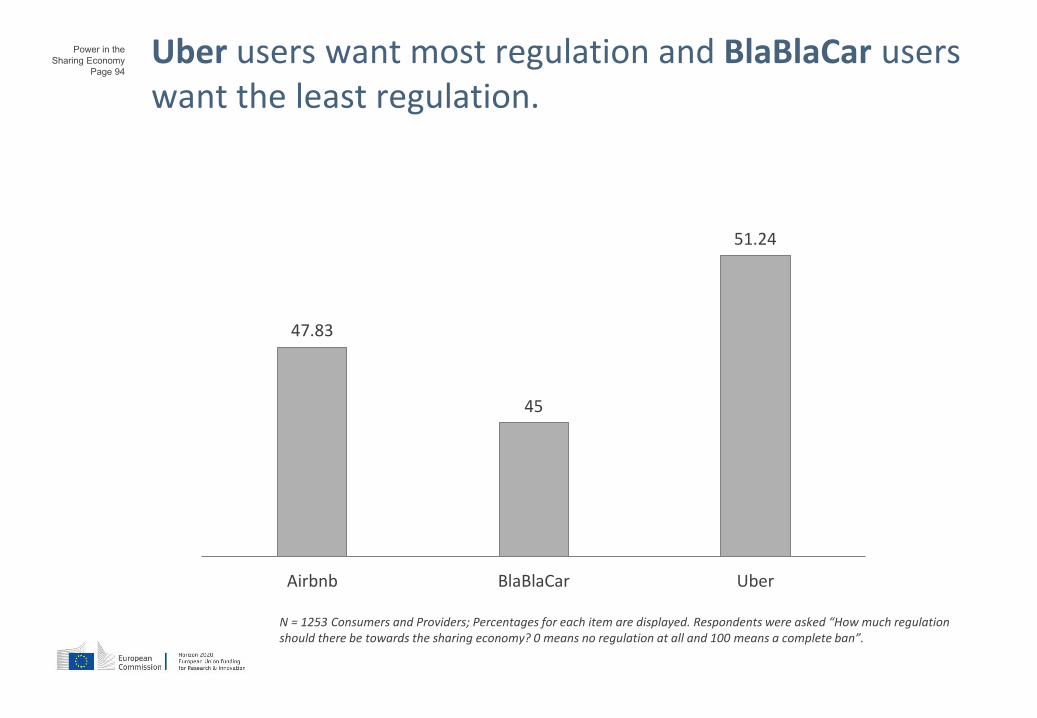
Uber users want most regulation and BlaBlaCar userswant the least regulation.
47.83
45
51.24
Airbnb BlaBlaCar Uber
N = 1253 Consumers and Providers; Percentages for each item are displayed. Respondents were asked “How much regulation should there be towards the sharing economy? 0 means no regulation at all and 100 means a complete ban”.
Power in the
Sharing Economy
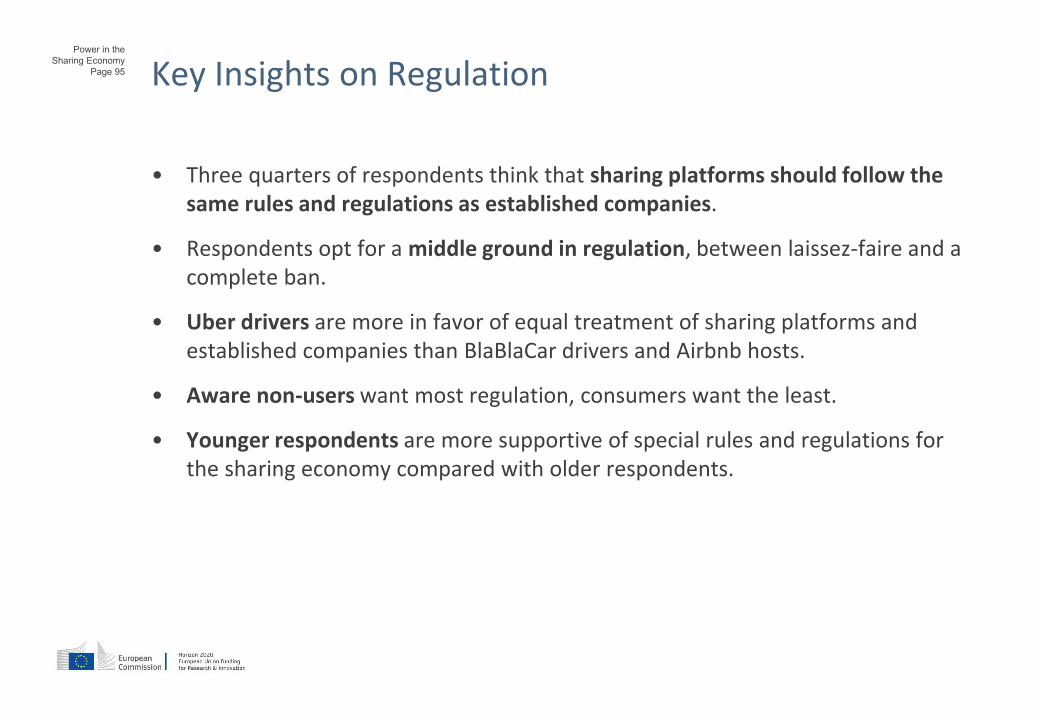
Page 95 Key Insights on Regulation
• Three quarters of respondents think that sharing platforms should follow the same rules and regulations as established companies.
• Respondents opt for a middle ground in regulation, between laissez-faire and a complete ban.
• Uber drivers are more in favor of equal treatment of sharing platforms and established companies than BlaBlaCar drivers and Airbnb hosts.
• Aware non-users want most regulation, consumers want the least.
• Younger respondents are more supportive of special rules and regulations for the sharing economy compared with older respondents.
Power in the
Sharing Economy
Page 96
Conclusions12
Power in the
Sharing Economy
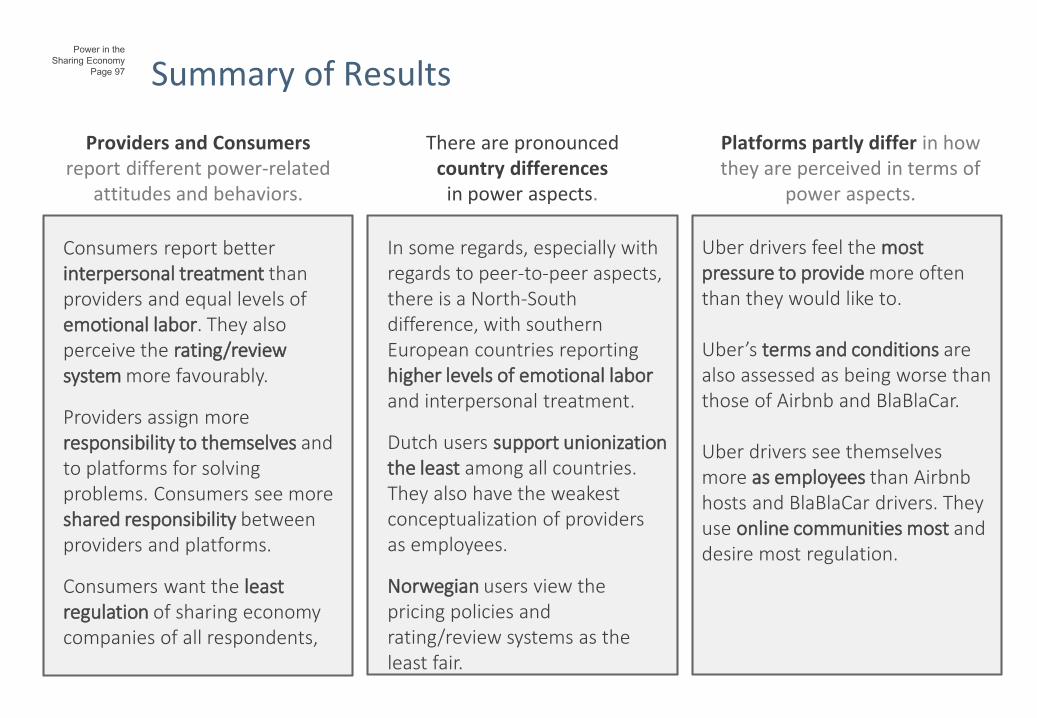
Page 97 Summary of Results
Consumers report better interpersonal treatment than providers and equal levels of emotional labor. They also perceive the rating/review system more favourably.
Providers assign more responsibility to themselves and to platforms for solving problems. Consumers see more shared responsibility between providers and platforms.
Consumers want the least regulation of sharing economy companies of all respondents,
In some regards, especially with regards to peer-to-peer aspects, there is a North-South difference, with southern European countries reporting higher levels of emotional labor and interpersonal treatment.
Dutch users support unionization the least among all countries. They also have the weakest conceptualization of providers as employees.
Norwegian users view the pricing policies and rating/review systems as the least fair.
Uber drivers feel the most pressure to provide more often than they would like to.
Uber’s terms and conditions are also assessed as being worse than those of Airbnb and BlaBlaCar.
Uber drivers see themselves more as employees than Airbnb hosts and BlaBlaCar drivers. They use online communities most and desire most regulation.
Providers and Consumersreport different power-related
attitudes and behaviors.
There are pronounced country differences
in power aspects.
Platforms partly differ in how they are perceived in terms of
power aspects.
Power in the
Sharing Economy
Page 98
thank you for your considerationPs2Share – Power, Privacy and Participation in the Sharing Economy Consortiumps2share.eu