university of el salvador school of arts … family’s autonomy was growing, the extensive family...
TRANSCRIPT

UNIVERSITY OF EL SALVADOR SCHOOL OF ARTS AND SOCIAL SCIENCES DEPARTMENT OF FOREIGN LANGUAGES
“STUDENTS’ PROFILE OF THIRD YEAR STUDENTS OF THE BACHELOR OF ARTS IN ENGLISH, EMPHASIS IN TEACHING, IN SEMESTER II/2016, AT THE UNIVERSITY OF EL SALVADOR,
AND ITS INFLUENCE IN THEIR PROCESS OF LEARNING ENGLISH.” PRESENTED BY: CASTILLO SERRANO, VERÓNICA DE LOS ÁNGELES CS09021 CERNA HERNÁNDEZ, ROXANA BEATRIZ CH08039 OLMEDO DE CANO, CELIA ALCIRA OC07003
FINAL RESEARCH REPORT IN ORDER TO OBTAIN THE DEGREE OF BACHELOR OF ARTS IN ENGLISH WITH EMPHASIS IN TEACHING
MaT. JOSÉ RICARDO GAMERO ORTIZ RESEARCH ADVISOR
LIC. ALEXANDER LANDAVERDE COORDINATOR OF GRADUATION PROCESSES
JUNE 26TH, 2017
MAIN UNIVERSITY CAMPUS, SAN SALVADOR, EL SALVADOR

AUTHORITIES OF THE UNIVERSITY OF EL SALVADOR
Roger Armando Arias, Engineer. PRESIDENT
Manuel de Jesús Joya, Doctor. ACADEMIC VICE-PRESIDENT
--
ADMINISTRATIVE VICE-PRESIDENT
Beatriz Meléndez, Licda. ATTORNEY GENERAL
Cristóbal Ríos, B.A.
SECRETARY GENERAL
AUTHORITIES OF THE SCHOOL OF ARTS AND SOCIAL SCIENCES
José Vicente Cuchilla Melara, B.A. DEAN
Edgar Nicolás Ayala, M.A.
VICE-DEAN
Alfonso Mejía Rosales, M.A. SECRETARY
AUTHORITIES OF THE DEPARTMENT OF FOREIGN LANGUAGES
José Ricardo Gamero Ortiz, M.A. HEAD OF DEPARTMENT
Manuel Alexander Landaverde
COORDINATOR OF GRADUATION PROCESSES
José Ricardo Gamero Ortiz, M.A RESEARCH ADVISOR
EVALUATING COMMITTEE
José Ricardo Gamero Ortiz, M.A Carolina Ramos de Gómez, M.A.
Ricardo Cabrera, Lic.

AKCNOWLEDGEMENTS
We thank God for having accompanied and guided us throughout our career, for being
our strength in times of difficulty, for giving us wisdom and for giving us a life of learning,
experiences and above all happiness.
We would first like to thank our thesis advisor MaT. Ricardo Gamero of the Foreign
Language Department, School of Arts and Social Sciences at University of El Salvador. The
door to Prof. Gamero office was always open whenever we ran into a trouble spot or had a
question about our research or writing. He consistently allowed this paper to be our own
work, but steered us in the right direction whenever he thought we needed it.
We would also like to thank the evaluating committee for this research project: MsC.
Carolina Ramos, Lic. Ricardo Cabrera. Without their passionate participation and input to
our research final paper could not have been successfully conducted.
We would also like to acknowledge Lic. Alexander Landaverde of the Foreign Language
Department, School of Arts and Social Sciences at University of El Salvador for helping us
while we were facing a very difficult time in our research and graduation process, and we
are gratefully indebted to his for his very valuable comments on this process.
Finally, we must express our very profound gratitude to our parents and to ourselves for
providing us with unfailing support and continuous encouragement throughout our years
of study and through the process of researching and writing this thesis. This
accomplishment would not have been possible without them. Thank you so much.
Authors
Verónica Castillo Serrano Roxana Cerna Hernández Celia Olmedo de Cano

TABLE OF CONTENTS
Table of contents
Introduction.......................................................................................................................... 1
Chapter I .............................................................................................................................. 2
1. Statement of the problem ................................................................................................ 2
1.1 Description of the problem ........................................................................................ 2
1.2 Delimitation of the problem...................................................................................... 9
1.3 Justification ................................................................................................................ 9
1.4 Objectives .................................................................................................................. 10
1.4.1 General objective .............................................................................................. 10
1.4.2 Specific objectives............................................................................................ 10
1.5 Research questions .................................................................................................... 11
Chapter II............................................................................................................................ 12
2. Historical framework ....................................................................................................... 12
Chapter III ......................................................................................................................... 13
3. Theoretical framework..................................................................................................... 13
3.1 Environmental factor................................................................................ 14
3.2 Socioeconomic factor................................................................................ 15
3.3 Educational Background factor .......................................................................................17
Chapter IV ...........................................................................................................................23
4. Hypothesis .......................................................................................................................23
4.1 Research hypotheses.................................................................................................. 23
4.2 Specific working hypotheses and void hypotheses.......................................................23
4.3 Operational definition of hypotheses variables.............................................................. 24
4.3.1 Operationalization of variables……………………………………………………..24
Chapter V ........................................................................................................................... 25
5. Research design ............................................................................................................... 25
Chapter VI ...........................................................................................................................26

6. Population and sample ................................................................................................... 26
6.1 Population .................................................................................................................. 26
6.2 Sample....................................................................................................................... 26
Chapter VII .........................................................................................................................28
7. Analysis of data .............................................................................................................28
7.1 Data gathering process............................................................................................... 28
7.2 Data analysis............................................................................................................ .. 28
7.2.1 Analysis of survey results ................................................................................. 2 8
7.2.2 Analysis of teachers’ interviews....................................................................... 45
Chapter VIII ........................................................................................................................48
8. Main Findings, Conclusions, recommendations and limitations .................................... 48
8.1 Main Findings ……………………………………………………………………….. 48
8.2 Conclusions ................................................................................................................ 50
8.3 Recommendations ...................................................................................................... 52
8.4 Limitations................................................................................................................. 53
Annexes .............................................................................................................................. 54
Annex 1 …………………………………………………………………………………... 55
Annex 2 …………………………………………………………………………………... 56
Annex 3 …………………………………………………………………........................... 57
Annex 4 …………………………………………………………………………………... 60
Annex 5 …………………………………………………………………………………... 61
Annex 6 …………………………………………………………………………………... 62
Annex 7 …………………………………………………………………………………... 65
Annex 8: students’ survey.………………………………………...................................... 66
Annex 9: teachers’ interview …………………………………………………………….. 69
Annex 10: Feedback from Members of the Evaluating Committee ............................... 71
Bibliography......................................................................................................................... 72
Webgraphy........................................................................................................................... 75

1
INTRODUCTION
The students’ profile and the factors that influence it to learn a new language is the general
purpose of this research that will be carried out in the Foreign Language Department of the
University of El Salvador.
The factors that influence in some way the acquisition of a new language can be classified
into environmental, socioeconomic, and educational background. Since each student is a
unique human being and he develops in a different environment, he cannot react to an
action in a same way, because the students’ needs are different, “anyone who has learned
a language abroad can say that is not an easy task. They should practice and develop
multiple skills where many factors can help or hinder the learning process” (Johnson, 2006).
Following this, the profile of each student is different.
The population of this research will be the students in third year of BA in English
Language, semester II/2016 of the University of El Salvador and it will be verified if the
profile of this population influences or not in learning a foreign language. This study is
orientated to the descriptive type, since it is tent to describe characteristics of a population
or phenomenon. This one will be a study with the intention of describe a new facet of the
development of future professional in English learning at the Bachelor of Arts in English at
the Foreign Languages Department.
Quantitative data will be obtained through this research by using two different
techniques. These techniques are: the survey and the interview. The survey will be
administered to students of the previously mentioned, the interviews will be conducted
with some of the teachers of the FLD.

2
CHAPTER I
1. STATEMENT OF THE PROBLEM
1.1 DESCRIPTION OF THE PROBLEM
The college students come from different family structures, but what is a family
structure? “It is an open system composed by human elements that form a functional unit,
governed by their own rules, with their own and unforgettable history and constantly
evolving.” (Cibanal, 2013). In El Salvador, it is possible to identify some common family
structures. Currently, there are several family structure organization and kinship; among
them it has been distinguished four types of families: nuclear or elementary family where
the basic family unit consists of husband (father), wife (mother) and children. This one may
be the biological offspring of the couple or adopted by the family members. Extensive or
consanguineous family consisting of more than one nuclear unit, extends beyond two
generations and is based on blood ties a lot of people, including parents, children,
grandparents, uncles, aunts, nephews, cousins and others; for example, three generation
family includes parents, their married children or single, to politicians and to the
grandchildren. The single- parent family is that family that is constituted by one of the
parents and their children. And finally the assembled family that consists of two or more
families (e.g. single mother with her children meets widowed father with his children), and
other types of families, those formed solely by brothers by friends who live together in the
same place for a considerable time. (EducarChile; 2013) Nowadays, due to many problems
our country has lost many of the numbers of family since the twentieth century up to now.
Because El Salvador suffers a civil war between 1982 and 1992, our country experienced
different changes in the family structure. Before the civil war, the nuclear and extensive
family began their development and were consolidated with the urbanization process
originated since the second period on the twentieth century at the same time of the
manufacturing process. Certainly, the rise of the nuclear family didn’t indicate the
disappearance of the extensive family, but the coexistence and connective between both
family structures categories: visit to the grandparents on weekends, annual meetings with

3
the family, all these activities proved the link between both types of families structures, as
well as its weakness, since the beginning of the nuclear family. On the Eighties, when the
nuclear family’s autonomy was growing, the extensive family was being reduce as the main
type of family in El Salvador. But on the fifties and sixties, people stared to make colonies
and these events open the beginning of nuclear family with its values, and traditions as the
main type of family in our country. It was not easy for all these families to dispense with
their parents, grandfathers and son, to begin their own families. (González, L. 2004)
Family could have a crucial effect on the learning process of its members, being this, one
of the major institutions that have the rights to educate and have the major influence on it.
(Fínez Silva, M.J, 2004). The family is the fundamental basis of the society, such as
transmitting the inherence received and lived, for socializing new members, saving and
reproducing this society, although assimilating innovative elements that make this will
change over time in different generations. In urban areas of El Salvador, it is common to
find households of one parent, one or two children with communication problems and
dependence. In rural areas, they are often extended families where the head of household
is the mother or grandmother, who have gathered in a physical place to a group of more or
less related persons, overwhelmed by the precarious economic situation, with problems of
overcrowding, alcoholism, domestic violence, low educational level and employment, and
with little time by adults to devote to children and young people. The home in which one is
born may mean the promise of a life full of options or perspective, almost irreversible, a life
in poverty (UNDP, 2013). Also, the family is generally vulnerable because they do not have
social support networks, because if it is small, depends very heavily on one or two people,
and one or two salaries. According to UNDP in its Human Development Report 2013. El
Salvador Imagine a new country. Do the possible. Diagnosis and proposal. “A child living in
a house with some material deficiency can accumulate up to 3 years less of study other than
the suffering. A similar effect has in years of education grow up in a home with deprivation
of utilities (electricity, water and sanitation).” That's why the type of family in which
students develop, can be crucial in the acquisition of a foreign language and its training as
a student on the FLD at the University of El Salvador.

4
Socioeconomic status, on the other hand, can be an influential profile of a student of a
foreign language factor. Socioeconomic status as a measure of economic and social position
of a family or an individual based on education, income, and occupation is defined. (Vera
R., 2013). If we talk about the economy as a crippling factor in the Salvadoran family, simply
cite the reports thrown by different newspapers across the country and government
institutions which reports on the current economic situation. An example of this is the cost
of the market basket, which is defined as the set of previously defined goods and services
that households buy and use directly or indirectly for the satisfaction of their own needs
and desires, according to General Directorate of Statistics and Censuses (DIGESTYC, for its
acronym in Spanish). If we compare both the total increase in market basket with the
increasing of the minimum wage, we can find that this increase is not enough to meet the
expenditure of all the needs of a home in El Salvador since the minimum wage varies by
sector. According to the law, the minimum wage in our country should be checked every
three years to verify the possibility of some increase, taken into account factors such as
current inflation and other economic issues. In an official study carried out in the month of
October 2014, it was concluded that the cost of the basic basket in El Salvador is $193.10
and $139.06 to rural areas; taking into account the minimum inputs to live.
The following table shows the labor and wage their respective sectors.
TABLE 11
LABOR SECTOR MINIMUN WAGE USD
Agricultural sector $118.20
Trade and service 251.70
Industry: 246.60
Manufacturing, textiles and clothing 210.90
CROB HARVEST
Short coffee $129.00
Cotton crop 98.70
Sugar cane harvest 109.20
SEASONAL AGRICULTURAL INDUSTRY
Benefits of coffee $171.00
sugar industry 124.20
Benefits of cotton 124.20
1 Annex 1 Wages up to December 31st 2016.
5
Therefore, El Salvador has a serious problem of growth in its economy. As a relevant fact,
this study shows that from 1991 to 2006 poverty dropped from 60% to 30% in the country,
this reduction in poverty may be being influenced by remittances from Salvadoran
emigrants. (Monge y Rodríguez, 2009). It could not be further from the truth the fact that
students in the FLD receive remittances from a relative abroad, being somehow a support
for their academic development. For other type of students the chance to study at
university may be limited by the poverty of the country. In addition to this the lack of space
within a public university, as it is the University of El Salvador, which is limited to accept a
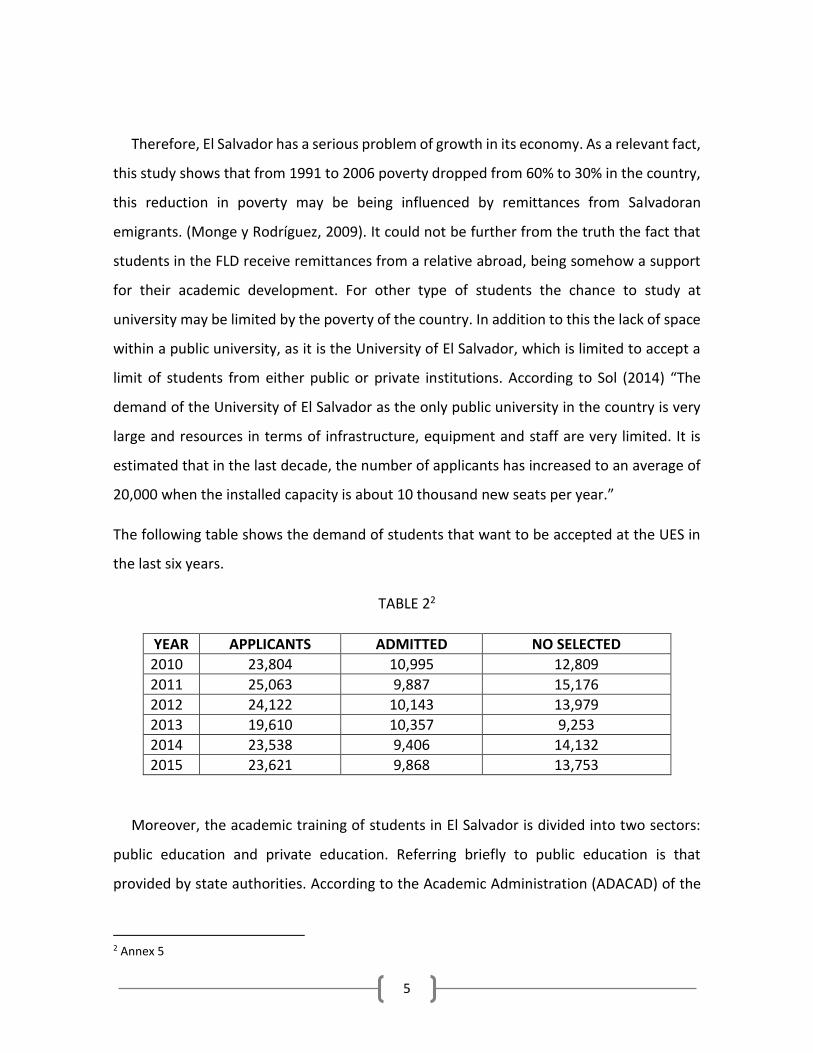
limit of students from either public or private institutions. According to Sol (2014) “The
demand of the University of El Salvador as the only public university in the country is very
large and resources in terms of infrastructure, equipment and staff are very limited. It is
estimated that in the last decade, the number of applicants has increased to an average of
20,000 when the installed capacity is about 10 thousand new seats per year.”
The following table shows the demand of students that want to be accepted at the UES in
the last six years.
TABLE 22
YEAR APPLICANTS ADMITTED NO SELECTED
2010 23,804 10,995 12,809
2011 25,063 9,887 15,176
2012 24,122 10,143 13,979
2013 19,610 10,357 9,253
2014 23,538 9,406 14,132
2015 23,621 9,868 13,753
Moreover, the academic training of students in El Salvador is divided into two sectors:
public education and private education. Referring briefly to public education is that
provided by state authorities. According to the Academic Administration (ADACAD) of the
2 Annex 5
6
University of El Salvador, 31.94% of students of the UES comes from the private education
sector compared to 68.06%3 from the public sector (2015). The curriculum of schools is
designed by the Ministry of Education of El Salvador and also it provides the infrastructure
of schools and institutions to develop the process of learning of the different cycles, from
nursery up to high school. From a total of 5,212 public schools in the country, the 57.55%
of “schools do not have enough classrooms to adequately serve the students, which affects
the quality of education” (News, 2015). Public school receives every student at every level
and do not make any aptitude test to assess the student's level to check whether they are
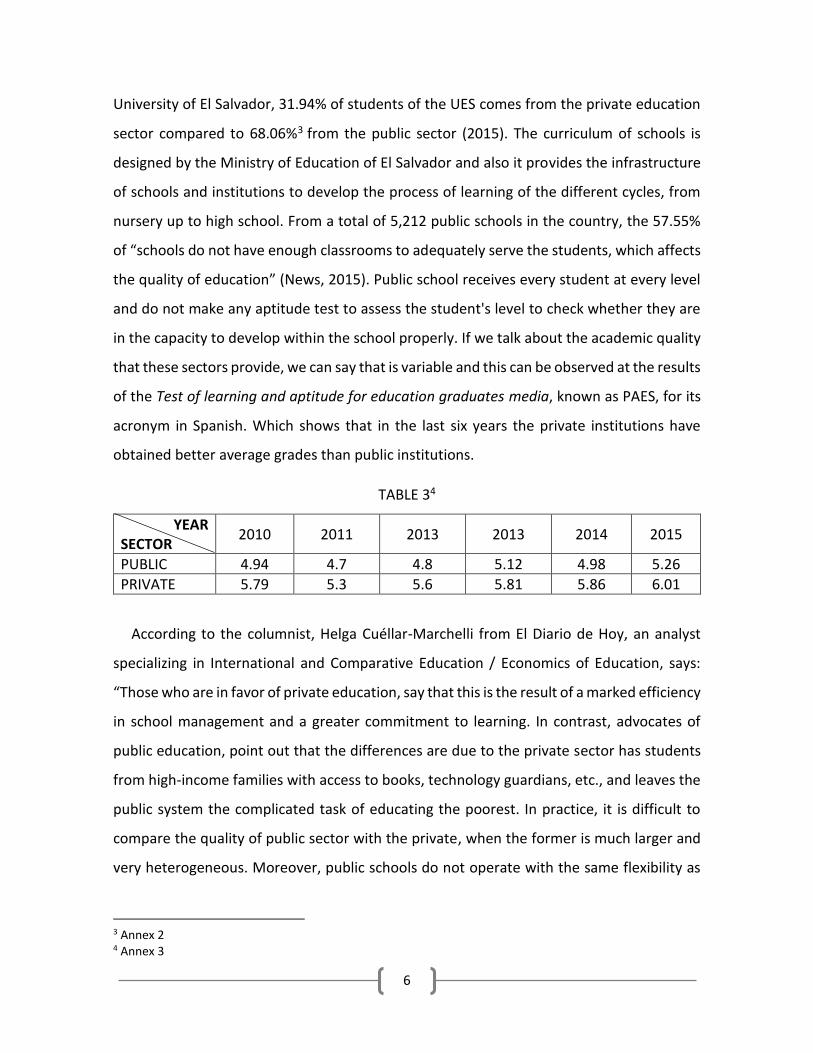
in the capacity to develop within the school properly. If we talk about the academic quality
that these sectors provide, we can say that is variable and this can be observed at the results
of the Test of learning and aptitude for education graduates media, known as PAES, for its
acronym in Spanish. Which shows that in the last six years the private institutions have
obtained better average grades than public institutions.
TABLE 34
YEAR SECTOR
2010 2011 2013 2013 2014 2015
PUBLIC 4.94 4.7 4.8 5.12 4.98 5.26
PRIVATE 5.79 5.3 5.6 5.81 5.86 6.01
According to the columnist, Helga Cuéllar-Marchelli from El Diario de Hoy, an analyst
specializing in International and Comparative Education / Economics of Education, says:
“Those who are in favor of private education, say that this is the result of a marked efficiency
in school management and a greater commitment to learning. In contrast, advocates of
public education, point out that the differences are due to the private sector has students
from high-income families with access to books, technology guardians, etc., and leaves the
public system the complicated task of educating the poorest. In practice, it is difficult to
compare the quality of public sector with the private, when the former is much larger and
very heterogeneous. Moreover, public schools do not operate with the same flexibility as
3 Annex 2 4 Annex 3

7
private, when evaluating the performance of teachers and principals, hire staff and allocate
resources.”
Comparing the payment of tuition and fees from one sector to another, the economic
separation is very large, because the public sector does not pay monthly tuition or tuition,
in spite of the budget that the State provides to the MINED. In 2016 a budget of $
942,206,2945 was approved and there has been an increase to the budget of $ 210, 692,615
for it use and development of MINED during the past five years (GPGEC, 2016).
Tuition and school fees of the private sector, of different categories from A to C, where
category A schools meet the requirements MINED calls for them to provide education;
Category B schools are those that despite meeting the requirements need to improve a
given requirement; and colleges in category C are those who are ready to close, they range
from $ 50 to $ 400 in tuition and $ 10 to $ 189 in monthly payments. Students of the private
sector can have large classrooms, teaching materials such as computers, internet, among
others. Unlike students from public institutions where conditions could be different. In
either case, the economic and social status has a strong influence on the student profile and
therefore it is important to clarify the fact that neither high or low economic conditions will
produce a good or bad English language learner as a foreign language, but it can have an
effect on student profiles and consequently in the development of courses and the
development in language learning.
After establishing differences between public and private education sector is important
to return to the main theme of this research, and it is necessary to know if the educational
background, whether it comes from public or private school, student of the third year of
the degree in English language can have an influence on each of their profiles.
It is also important to know through this research not only the external factor (family,
socioeconomic status, place of origin) and the incidence of this profile of students, but also
5 Annex 4

8
the internal factor (motivation, age, self-concept, self-esteem) and their importance in
learning of each individual. One of those internal factors that cannot be ignored in
understanding this process is intrinsic motivation. “The motivation in general can be defined
as the set of physical or psychological needs, values and social models built, not always
aware that guide the behavior of the individual towards achieving a goal” (Psico., 2009). In
this particular case is the intrinsic motivation, which according to Lorenzana is defined
simply as conduct that takes place frequently and without any external contingency, which
influences positively or negatively on the performance of students both in their daily lives
and important decisions they take. This important part of human being can help students
have a better learning the language or can cause them difficulty on learning this.
Finally, we can say that students of the third year of the degree in English Language come
from different backgrounds and areas of our country, many of them lack the basic
requirements for a development worthy of a human being so it would be wrong drop it in
the investigation. According to The World Bank, poverty in El Salvador it has declined from
40.6% of the population in 2011 to 29.6% in 2013. Although these data vary greatly from
the Salvadoran reality, and the Social Investment Fund for Local Development (FISDL, for its
acronym in Spanish) reports that in the 262 municipalities in El Salvador there is extreme
poverty, where 32 of these municipalities have severe extreme poverty, with five
municipalities in the department of Morazán the poorest in our country, among these is
Torola municipality that has an extreme poverty rate of 60.4% of its total population is
1,801. In contrast, San Salvador only it has extreme poverty rate of 6%. For example, we can
to weigh the advantages that a student who lives in the municipality of San Salvador where
it has the necessary resources for their daily life as electricity, water, adequate housing and
the best of computer cases and Internet would for their studies and disadvantages of a
student from the town of Torola having travel long distances to get to their school so he
must get up very early and arriving late to his home, where in most cases not They not even
have electricity or running water for survival and find it difficult to have access to a

9
computer and perform tasks that some professors tend to allocate on the platform of the
FLD of the UES, so their academic performance is affected.
1.2 DELIMITATION OF THE PROBLEM
This research will reach the student population in third year of BA in English Language ,
semester II / 2016 of the University of El Salvador and verify as the profile of this population
influences or not learning a foreign language.
1.3 JUSTIFICATION
Because daily demand in the acquisition of a foreign language is increasing, this to
improve skills and competences in the workplace, many universities have seen the need to
increase capacity in their classrooms for training teachers specialized in teaching a foreign
language. The Foreign Languages Department (FLD) of the University of El Salvador (UES),
which offers racing BA in English Language Teaching and Bachelor option Modern
Languages specialty French and English is no exception. According to ADACAD only this year
2016, the number of students who make up the student population at FLD is 930. In
comparison to registration or entry to FLD 1136, 1052, 1022 and 1057 in 2011, 2012, 2013,
2014 and 2015 respectively. The requirements to study in the FLD are:
a) If the student is newly enrolled, the approval of the admission test is needed and
has reached the required score to study the desired career.
b) If the student income is old and has chosen career change must have studied one
year at the UES and make the career change process.
However, this test evaluates only general knowledge that students acquire during their
passage through secondary education regardless of the student profile and circumstances
that have shaped him.
It is for this reason that this research aims to determine the influence of students’ profile
on learning English, of third year students of the Bachelor of Arts in English of the Foreign
Languages Department at the University of El Salvador in semester II- 2016, since it is in the

10
sixth semester of the major that students complete intensive English courses and began to
pursue training for their future as teachers of English subjects.
“The whole learning process has always conditioned by a number of factors and when
we refer to the acquisition of a language, the way forward is characterized by a diverse
complexity.” (Nolasco, 2004).
Each student is a unique human being and with it, he develops in a different
environment, therefore, to ensure that they have the same reaction to an action is wrong
because the student needs are different, “anyone who has learned a language abroad can
say that is not an easy task. They should practice and develop multiple skills where many
factors can help or hinder the learning process” (Johnson, 2006). Following this, the profile
of each student is different.
1.4 OBJECTIVES
1.4.1 General Objective
To analyze to what extent the students’ profile influence in the learning process of
English as a foreign language through a survey and whether or not the
socioeconomic, the environmental and the educational background factors
influence the learning process in order to improve the acquisition of English as a
foreign language.
1.4.2 Specific Objectives
To determine the influence of the socioeconomic factor in the students’ profile
during the learning process.
To determine the influence of the environmental factor in the students’ profile
during the learning process.

11
To determine the influence of the educational background factor in the students’
profile during the learning process.
1.5 RESEARCH QUESTION
To what extent the process of learning English as a foreign language is influenced by the
students’ profile of the third year of the Bachelor of Arts in English, emphasis in teaching,
in semester II/2016, at the University of El Salvador?
CHAPTER II

12
2. HISTORICAL FRAMEWORK
As time passes and technologies increase nowadays on the twentieth century, it is more
difficult for the Salvadorian society to be at the forefront to get a job; that is why it is very
necessary to learn a new language; in this case, we are talking about learning English as a
foreign language. For that reason, the Foreign Language Department (FLD) at the University
of El Salvador (UES) has been providing with language training in both English and French
since its foundation as a general language academy and it was formally accredited as
Foreign Language Department in 1956. The FLD has taken the lead for 59 years and it has
been training professionals in language teaching up to the present.
At the University of El Salvador, specifically at the FLD, it can be found different kinds of
students very concerned and enthusiastic about learning a new language. Every student has
a personal notion about life and that is because they come from different places and they
develop their personality according to their life style and it’s because of those factors that
students develop a unique profile that makes them have a different learning style. On this
research we are going to detailed every factor that makes students opt to study a foreign
language and how those factors have an influence or not during this process.
CHAPTER III

13
3. THEORETICAL FRAMEWORK
Today speaking a second language like English is one of the requirements that
Salvadorans need to fulfill when applying for a job at any company or place that requires
staff, so people decide to enroll into free courses where they will be taught everything
related to language. The students who graduate from high school and decide to continue
their higher studies, opt for a career where English is taught and this is confirmed by the
statistics provided by the ADACAD from the School of Sciences and Arts in its online portal,
where enrollment of students that went to the FLD during 2016 in its first semester was 986
students. However, enrollment of students who wish to join the DIE has decreased
compared to previous years.
The following chart presents the number of students in the Foreign Languages
Department (FLD).
TABLE 46
YEAR TOTAL OF STUDENTS
2015 1057
2014 1022
2013 1052
2012 1136
2011 1139
Even though, there is a reduction of 18.21% of students coming to the FLD there are still
companies in where the people have to have at least 80% of domain in the English language
in order to apply to a job, not only in the educational area but also commercial or industrial
area. It has been said before that learning a second language is essential to function in a
globalized world, comprising to know about different cultures, societies, economies and
technologies, and to help students to achieve their goals. However, learning the language
will be influenced either by external and internal factors. As Engine says in his article
“Second Language Learning Success and Motivation”:
6 Source available in: https://academica.ues.edu.sv/estadisticas/poblacion_estudiantil.php

14
“There are a number of variables and factors that influence students’
learning achievement in school, both directly and indirectly. It is important
to have enough information about the students in order to be prepared for
teaching them.” (2009)
3.1 ENVIRONMENTAL FACTOR
Among external factors that can influence the students’ profile and thus their way of
learning, we have the environmental factor in which the students have developed at
different stages of life, socioeconomic status, in which students live and develop and their
previous knowledge of English. Being the environment in which a person grows, one of the
external factors influencing the life of any individual, it is important to know the
environment in which students have grown. Part of that environmental in which students
develop and live is the family. According to the Constitution of El Salvador in its article 33
says that “the law shall regulate the family relation resulting from a stable union of a man
and a woman.” and within the framework of the Family Code in its article 2 “Family is the
permanent social group, consisting of the marriage, not marriage union or kinship.” which
dictate that the family is made up of the marriage, father and mother. However, in recent
years the need of finding a better economic stability has led Salvadoran families to separate,
leaving the caring of the children either to the mother or the father, or in more difficult
situations, leaving them to care by a close relative (grandparents or uncles). Family
disintegration consisting in breaking the family unit, cause destabilization in the family.
According to a study conducted in 2005 by the United Nations Development Program
(UNDP) “there is no accurate data on the number of Salvadoran families impacted by
migration.” This situation is one of the major causes in the environmental factor in which
students are forced to live, thus losing the interest and motivation in their studies and thus
affecting their academic performance and causing other problems such as seek 'refuge' in
organizations as are criminal gangs.
3.2 SOCIOECONOMIC FACTOR

15
Second causal within the environment in which the student develops is violence.
Violence in El Salvador has increased abruptly. El Salvador is the sixth country with the
highest rate of homicides per 100,000 inhabitants has a rate of 43.9 (WHO, 2014).
These numbers published by the World Health Organization shows the degree of
violence in the country to which students are daily exposed. While it is true that many may
not be directly affected somehow indirectly affect them so that make an influence in their
profile both as a student as a person.
Adding to the environmental factor in which the students develop; it is the
socioeconomic status as a second factor that may influence the students’ profile. In a
society where Salvadoran socioeconomic status is not balanced it is not difficult to see cases
where students have to work and study at the same time to help their parents to cover the
needs at the home. As a result, many students do not have the enough financial resources
to acquire original material (textbooks, workbooks, etc.) that will be used in each of the
subjects who may be pursuing during the course of study. Also the educational gap between
the private and public sector is part of socioeconomic differences among students from the
FLD as there are students from private schools where they are taught English as a second
language and even students are taught basic subjects in that language. While in public
schools, students are taught English as a subject and as a superficial way. According to
Martinez (2009) students in public institutions are not taught the English language for more
than 500 hours from the seventh grade until the second year of high school. “Most studies
compare students of all socioeconomic levels to reach the conclusion that low
socioeconomic status affects negatively a number of educational outcomes” (Considine &
Zappalà, 2001). Through this statement can be said that students from public institutions
have a disadvantage over those from private institutions, that due to their socioeconomic

16
difference and since, as written before, the Salvadoran families where their income is the
minimum wage7.
Considering that many of these families are single parent, students from schools or public
institutions will be difficult to access to the necessary tools for learning a foreign language
(internet, books, CDs, DVDs, dictionaries, etc.) compared to those from private schools
where students pay tuition that do not drop the $150, possessing the necessary tools at
hand.
According to Considine and Zappalà in their work “Factors Influencing the Educational
Performance of Students from Disadvantaged Backgrounds”, there are a number of
patterns that students from low socioeconomic status reflect, which are:
• have lower levels of literacy, numeracy and comprehension;
• have lower retention rates (children from low SES families are more likely to leave school
early);
• have lower higher education participation rates (children from low SES families are less
likely to attend university);
• Exhibit higher levels of problematic school behavior (for instance truancy);
• are less likely to study specialized math and science subjects;
• are more likely to have difficulties with their studies and display negative attitudes to
school; and
• have less successful school-to-labor market transitions.
These patterns may or may not be alien within Salvadoran society depending, obviously,
of socioeconomic status that the students have, and impact in learning English as a foreign
language. In order to erase or diminish differences of the English learning among students
who come from a public or a private institution it should “be made structural changes in all
7 Table 1 is within the statement of the problem that shows the different minimum wages for a Salvadoran earns monthly, depending on the sector in which it operates.

17
areas that make up the educational act to ensure the change from a purely traditional
model teaching to one more communicative and more practical since is requested in this
XXI century” (Pineda, 2013). This is reflected in the FLD, since teachers use the
communicative language teaching (communicative approach) which helps students to
interact with their counterparts since that is the means and the ultimate goal in learning
English as a foreign language.
However, these external factors are not the only ones who develop the students’ profile
as internal factors tend, like external, to mark the students’ profile.
“Students’ immediate environment: their family and friends, and the broader socio-
economic context play an important role in goal setting, attitude formation and in
influencing students’ self-efficacy beliefs and the effort and persistence with which
they carry out learning tasks.” (Kormos & Kiddle, 2013)
3.3 EDUCATIONAL BACKGROUND FACTOR
EDUCATION IN EL SALVADOR
All learning process is conditioned by various factors, which for this research, have been
divided into three groups. As the third of them, it can be the educational background, in
which most of FLD students have been developed. For this reason, it is necessary to study
the kind of education these students have acquired. In this research, the educational
background has been divided into two branches: public education and private education.
PUBLIC EDUCATION
The Constitution of the Republic of El Salvador, in Article 53 establishes the right to
education and culture as an inherent right of the person, recognizing that this is essential
for human beings in order to live in dignity, which assigns to the State, obligation and
primary purpose of preservation, promotion and dissemination. The State, in compliance
with that mandate, has the responsibility to establish institutions and services necessary
(Art. 54). As part of that process, the State has created the Ministry of Education as the body
should develop and implement educational policies. It has also formed a legal framework

18
regulating the education system; within this framework legal are General Education Law of
El Salvador (LGE, for its acronym in Spanish), the Teaching Profession Act (LCD, for its
acronym in Spanish) and Higher Education Act (LES, for its acronym in Spanish).
Within the education system, education is understood as “a process of training
permanent, personal, cultural and social that is based on an integral concept of human
person, their dignity, their rights and their duties” (LGE, Art. 1). The education system
recognizes two ways to train people: formal education and non-formal (LGE, Art. 8). The
LGE defines formal education as one that “is taught in educational establishments
authorized in a regular sequence of years or teaching cycles, and subject to progressive
curriculum guidelines leading to degrees and diplomas”; while non-formal education is
recognized as “being offered in order to complete, update, supply knowledge and training
in academic or labor issues, without being subject to system levels and degrees of formal
education”. In both cases, the governing body and make norms is the Ministry of Education
(MINED).
In non-formal education, there are educational opportunities for young people and
adults that, because of different circumstances, did not start or continue their studies at the
time. It has literacy and flexible forms, which are articulated to the formal system,
mechanisms defined to establish equivalence with grades of formal education, since second
grade until the second year of high school.
As for the levels of study, the General Education Act recognizes five levels:
INITIAL EDUCATION:
Begins at the conception of a child until four years old. It seeks to promote the
development socio-affective, psychomotor, sensoperceptive, language and play, through
adequate early stimulation (LGE, Arts. 16 and 17). Actions at this level require a very active
participation with family and community.

19
PRESCHOOL EDUCATION:
It consists of three years of study, attention focused on four to six years. Involving family,
school and community in the development of curricular components to promote the
comprehensive development of this age group (LGE, Art.18).
BASIC EDUCATION:
It comprising nine years of study, the first to the ninth grade, and is organized into three
cycles of three years each, usually starting at seven years of age (LGE, Art 19).
MIDDLE EDUCATION:
This level includes two types of education, one general and another technique, which
have a duration of two and three years respectively. When this level is finished, it allows
the continuation of higher education or their incorporation into working life (LGE, Art. 22).
HIGHER EDUCATION:
It is any systematic effort of post-secondary education and training includes technology
education and university education. It comprises seven academic degrees: coach, teacher,
technologist; graduate, engineer and architect; teacher, doctor and specialist (LES Arts. 4
and 5).
In addition to these levels, the educational system recognizes Adult Education, Special
Education, Arts Education, Physical Education and School Sports.
The Constitution of the Republic was reformed in 2009, extending the right of free more
educational levels. Currently it states: “The early childhood education, primary, secondary
and special will be free when provided by the State” (second paragraph of Article 56, ratified
and published in the Official Gazette on June 4, 2009).

20
Despite the legislation, the structure and composition of the education system remains
pyramidal, concentrating on basic education coverage, but decreased in early childhood
education, secondary education and higher education.
AVERAGE SCHOOLING AND LITERACY
According to the Household Survey of Multiple Purposes (EHPM, for its acronym in
Spanish), average schooling is conceived as the number of years, people approved six years
and older. Their analysis allows inferring on the educational situation of a country, while
refers to number of degrees approved by the population average.
It is conducted by the Ministry of Economy, meaning through the Department of
Statistics and Census (DIGESTYC, for its acronym in Spanish). It is a statistical instrument for
the country, to provide information on the socioeconomic situation of Salvadoran
households, which allows planning and implementing public policy actions for development
of the country and on the other hand, facilitating the monitoring of the effects that social
policy measures produce.
The gaps in rural areas have not been able to overcome. According to DIGESTYC in the
year, 2011 nationwide, average schooling was 6.2, but in rural areas is 4.3 degrees8. These
data are a warning of what happens in the formal education system: problems of desertion,
repetition and survival directly influence levels schooling country.
As already mentioned, in rural areas, opportunities to complete at least Basic Education
(Ninth grade), are limited by factors of poverty and little social value of education. This
assessment is supported by the results of EHPM several years, which has been drawing the
above factors as limiting parents’ family to send their children to school. In addition, the
chances of completing the Basic education are related to the offer, which decreases at that
level, especially in rural areas.
8 Annex 7
21
LITERACY
With regard to literacy, according to EHPM 2012, the percentage of people aged 10 and
more on condition of illiteracy declined from 18% in 1999, which was 12.8% in 2011. In rural
communities, this percentage decreased from 29% to 20% over the same period. In the last
case, the reduction is 9 percentage points in 11 years, less than one point per year9.
Overall, educational indicators have shown progress, but fails to the leap in quality,
equity and relevance expected. The Salvadoran government has not invested necessary
resources to fulfill international commitments, challenges and goals. Investment
percentages have been 3% of gross domestic product (GDP) and average investment costs
per student are not competitive by investing in the latest decade and average of $172, in
Preschool, $ 262 and $ 285 Basic Education and in High School Education, this according to
the Ministry of Education and Ministry of Finance.
PRIVATE EDUCATION
According to the columnist, Helga Cuéllar-Marchelli from El Diario de Hoy, an analyst
specializing in International and Comparative Education / Economics of Education, said:
"Those who are in favor of private education say that this is the result of a marked efficiency
school management and a greater commitment to learning. In contrast, advocates of public
education, point out that the differences are due to the private sector has students from
high-income families with access to books, technology, tutors, etc., and leaves the public
system the complicated task of educate the poorest. In practice, it is difficult to compare
the quality of public sector with the private, when the former is much larger and very
heterogeneous. Moreover, public schools do not operate with the same flexibility as
private, when evaluating the performance of teachers and principals, hire staff and allocate
resources. "
9 Annex 7
22
Comparing the payment of tuition and fees from one sector to another, the economic
separation is very large, because the public sector does not pay monthly tuition or tuition,
in spite of the budget that the State provides the MINED. In 2016 a budget of $
942,206,294 10 was approved and there has been an increase to the budget of $ 210,
692,615 for it use and development of MINED during the past five years (GPGEC, 2016).
Tuition and school fees of the private sector, of different categories from A to C, where
category A schools meet the requirements MINED calls for them to provide education;
Category B schools are those that despite meeting the requirements need to improve a
given requirement; and colleges in category C are those who are ready to close, they range
from $ 50 to $ 400 in tuition and $ 10 to $ 189 in monthly payments. Students of the private
sector can have large classrooms, teaching materials such as computers, internet, among
others, unlike students from public institutions where conditions could be different. In
either case, the kind of education has a strong influence on the student profile and
therefore it is important to clarify the fact that neither a private or public institutions, will
produce a good or bad English Language Learner as a foreign language, but it can have an
effect on student profiles and consequently in the development of courses and the
development in language learning.
If talking about the academic quality that these sectors provide, it can be said that is
variable and this can be observed at the results of the test known as PAES, which shows
that in the last five years the private institutions have obtained better average grades than
public institutions.
10 Annex 4

23
CHAPTER IV
4. HYPOTHESES
4.1 RESEARCH HYPOTHESIS
The students’ profile of third year of third year of the Bachelor of Arts in English at the
Foreign Language Department of the University of El Salvador during semester II/2016
influence in learning English as a foreign language.
4.2 SPECIFIC WORKING HYPOTHESES AND VOID HYPOTHESES
H1. The types of profile that affect learning English as a foreign language are:
socioeconomic, environmental and academic.
HO1. Profiles such as socioeconomic, environmental and academic have no impact on the
student profile.
H2. The students’ profile is related to learning English as a foreign language.
HO2. Learning English as a foreign language has no relation to the student profile.
H3. The students’ profile and their learning styles are related when learning English as a
foreign language.
Ho3. The students’ profile and their learning styles are not related when learning English as
a foreign language.

24
4.3 OPERATIONALIZATION OF THE HYPOTHESIS VARIABLES
Independent variable: Students’ profile
Dependent Variable: Learning English as a foreign language.
4.3.1 OPERATIONALIZATION OF VARIABLES
HYPOTHESIS VARIABLES INDICATORS
Hg. The students’ Profile of third year of third year of the Bachelor of Arts in English at the Foreign Language Department of the University of El Salvador during semester II/2016 influence in learning English as a foreign language.
I.V The student`s profile
- emotional growth - students’ age - students’ genre - residence - family structure - high school background - socioeconomic level
D.V Learning English as a Foreign Language
- attitudes to get new knowledge -aptitudes to learn a new language - learning styles - learning strategy - teaching method

25
CHAPTER V
5. RESEARCH DESIGN
This study is oriented to the descriptive type, since it is tent to describe characteristics of
a population or phenomenon. This one will be a study with the intention of describe a new
facet of the development of future professional in English learning at the Bachelor of Arts
in English at the Foreign Languages Department.
The design is a non-experimental and cross-correlational research as this research will
be responsible for describing the relationship between the two variables at a given time,
which will be during the semester II 2016 in the DIE of the University of El Salvador.

26
CHAPTER VI
6. POPULATION AND SAMPLE
6.1 POPULATION
It will be taken as a basis all the individuals or elements from which it is desired to refer.
In this research, the population that has been considered will be the total active students
of the third year of the Bachelor of Arts in English at the Foreign Language Department
during the Semester II 2016, 600 students approximately. In addition, 3 teachers from the
DIE will be interviewed, the Director of the School of Social Sciences, an analyst from Diario
de Hoy and a teacher from the Pedagogical University of El Salvador.
MsC. Alexander Landaverde (teacher from DIE)
MsC. Nicolás Ayala (teacher from DIE)
MsC. Juan Carlos Cruz (teacher from DIE)
Lic. Ernesto Pineda (Director of the Social Sciences School)
MsC. Helga Cuéllar-Marchelli (Analyst specializing in International and
Comparative Education / Economics of Education from El Diario de Hoy)
MsC. Dalila Alcira Cruz (teacher from Universidad Pedagógica, Administration of
Education)
6.2 SAMPLE
Having already defined the population that will be the subject of study in this research is
necessary to have a sample of the total, which will make use of a random probability
probabilistic sampling since all students will have equal opportunity to participate in the
research.

27
6.2.1. Procedure for determining the sample size.
A 15% of the total student population will be taken into account in order to
administer the survey, this 15% correspond to 90 DIE students.
6.2.2. Sampling Type
The probabilistic sampling will be used.

28
CHAPTER VII
7. ANALYSIS OF DATA
7.1 DATA GATHERING PROCESS
The data were gathered during the final months of semester II/2016. First, the
techniques to be used were selected based on the specific information that wanted to be
collected. It was decided that the survey and the interview were going to be the techniques
to be used in the research. The objective of using these techniques was to obtain more
reliable and valid information at the end of the research and to collect the information
taking into account the perspective of those involved in the problematic situation: the
teachers and the students. Besides, the perspective of the research team as include to
finally comparing all perspectives. Then the instruments to be used were selected, created,
and tested. These instruments were a questionnaire and an interview.
First, in the month of November and December 2016, the survey was administered to
students of the third year. Finally, in the same month of December 2016, the interviews
were carried out with teachers of the FDL, a teacher from Universidad Pedagógica and the
analyst. For this, a list of prepared questions was used as an instrument. The interviews
were semi-structured interviews since teachers were given the opportunity to extend on
their answers if necessary and not just answering questions providing short answers.
7.2 DATA ANALYSIS
7.2.1 ANALYSIS OF SURVEY RESULTS
Based on the data that was collected in the Foreign Languages Department from the
students of the Bachelor of Arts in English, emphasis in Teaching, in semester II/2016, it was
found the following general information.

29
GRAPHIC ONE
The age of the students was ranked in three groups, where 91.2% are students from 21 to
30 years old; 7.7% from 31 to 40; and 1.1% between 41 and 50 years old.
GRAPHIC TWO
Most of the surveyed students (83.5%) have a GPA between 7 and 8, what is satisfactory
since the minimum average to pass a subject is a GPA of 6.
30
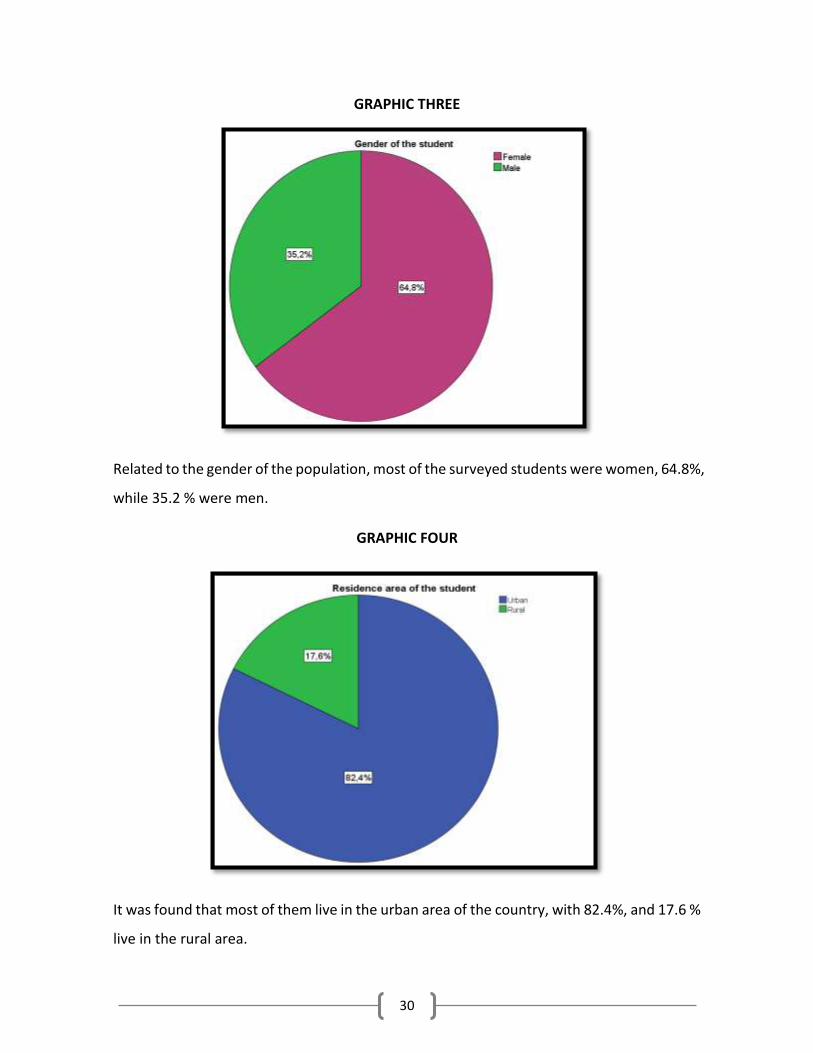
GRAPHIC THREE
Related to the gender of the population, most of the surveyed students were women, 64.8%,
while 35.2 % were men.
GRAPHIC FOUR
It was found that most of them live in the urban area of the country, with 82.4%, and 17.6 %
live in the rural area.

31
GRAPHIC FIVE
Most of the surveyed population lives in its own house (79.1%).
GRAPHIC SIX
Students were asked about their family structure to which most of them are part of a
nuclear family, which means, they live with their parents and brothers or siblings. While a
minority of 5.5% is part of an assembled family.

32
GRAPHIC SEVEN
For this question, 83.5% of the surveyed students live with at least one member of their
family, while just 6.6% of the population lives alone.
GRAPHIC EIGHT
In this question, it was necessary to know any occupation of the students. It was found that
most of them are not working at the moment; and 45.1% is working in different areas.

33
GRAPHIC NINE
This graph shows that most of the population has never worked before, but almost the
same amount has worked at some time.
GRAPHIC TEN
This graphics shows that 27.5% has 3 or more years without a job, this can be because of
the lack of opportunities in the country, or because they have decided not interrupting their
studies.
34
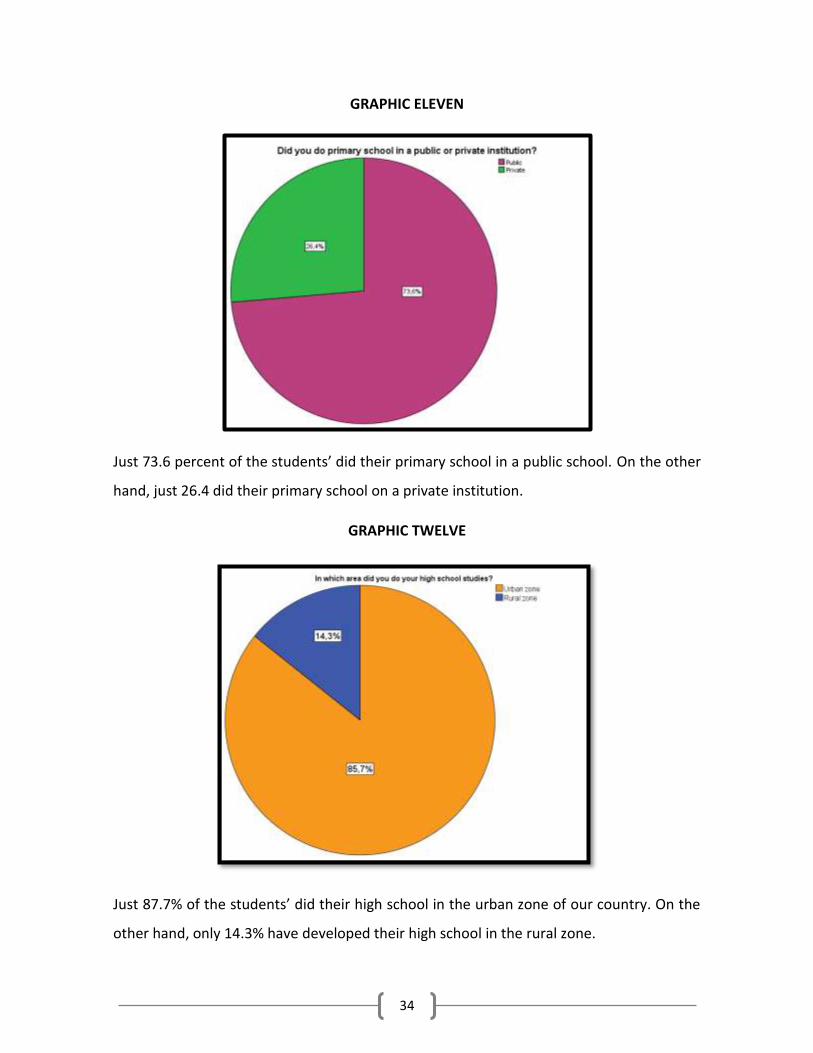
GRAPHIC ELEVEN
Just 73.6 percent of the students’ did their primary school in a public school. On the other
hand, just 26.4 did their primary school on a private institution.
GRAPHIC TWELVE
Just 87.7% of the students’ did their high school in the urban zone of our country. On the
other hand, only 14.3% have developed their high school in the rural zone.

35
GRAPHIC THIRTEEN
It is clear that the majority of the students chose the English major to be an English teacher,
and just 4.4%t chose the major because it is cheaper than an English academy.
GRAPHIC FOURTEEN
Just 62.6% of the students felt highly motivated to study English, meanwhile 1.1% felt less
motivated.

36
GRAPHIC FIFTEEN
The majority of the students are used to sing in English to develop their oral expression. On
the other hand, 22% of the students tried to speak outside of the classroom in order to
practice. In addition, 18.7% practiced dialogues in English to improve their speaking,
meanwhile 5.5% of the students’ used to memorize vocabulary in English.
GRAPHIC SIXTEEN
On the listening skill 48.4% of the students are used to watching movies in English to
improve this skill, on the contrary only 7.7% of the students tried to watch the news in
English.

37
GRAPHIC SEVENTEEN
In order to improve their Reading skills, 49.5% of the sample of students at the FLD read
book in English for pleasure. A 37.4% look up the meaning of the unknown vocabulary and
13.2% of the sample memorize vocabulary.
GRAPHIC EIGHTEEN
To improve their writing, 38.5% of the simple of students at the FLD memorize vocabulary
from the dictionary, 36.3% of the sample just write sentences in English and 25.3% try to
write in English daily.

38
GRAPHIC NINETEEN
As known, it is very important to develop the four English skills in order to get full knowledge
about the language. Taking into account that information it is clear that 51.6% of the
students agreed that listening is the most difficult skill for them, meanwhile just 6.6%
agreed that reading is the most difficult skill for them.
GRAPHIC TWENTY
When a new semester starts students have to buy their daily materials, because of the
economy 63.7% of the students photocopy them and just 36.3% of the students buy new
material.
39
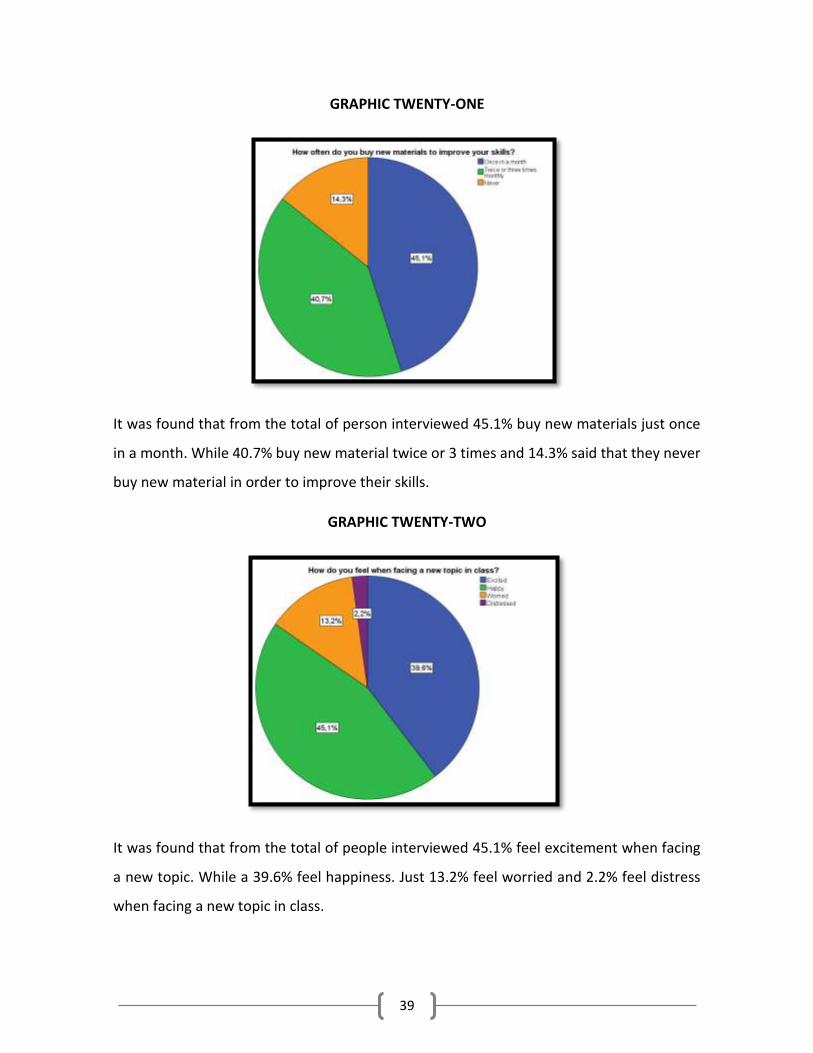
GRAPHIC TWENTY-ONE
It was found that from the total of person interviewed 45.1% buy new materials just once
in a month. While 40.7% buy new material twice or 3 times and 14.3% said that they never
buy new material in order to improve their skills.
GRAPHIC TWENTY-TWO
It was found that from the total of people interviewed 45.1% feel excitement when facing
a new topic. While a 39.6% feel happiness. Just 13.2% feel worried and 2.2% feel distress
when facing a new topic in class.

40
GRAPHIC TWENTY-THREE
It was found that from the total of person interviewed 42.9% said that their parent have a
university level of education. While 24.2% have a secondary (technical training) level. Just
18.7% have a Secondary school level and 14.3% have a Primary school or less level of
education.
GRAPHIC TWENTY-FOUR
It was found that from the total of person interviewed the 50.5% have an academic degree.
45.1% said that they do not have any. While 4.4% said that just one of their relatives have
an academic degree.

41
GRAPHIC TWENTY-FIVE
It was found that from the total of person interviewed 64.8% of them said that someone in
their family had studied English. On the other hand, 35.2% said that no one in his or her
family had studied English as a foreign language.
GRAPHIC TWENTY-SIX
It was found that from the total of person interviewed 80.2% have relatives abroad. While
19.8% do not have relatives abroad.
42
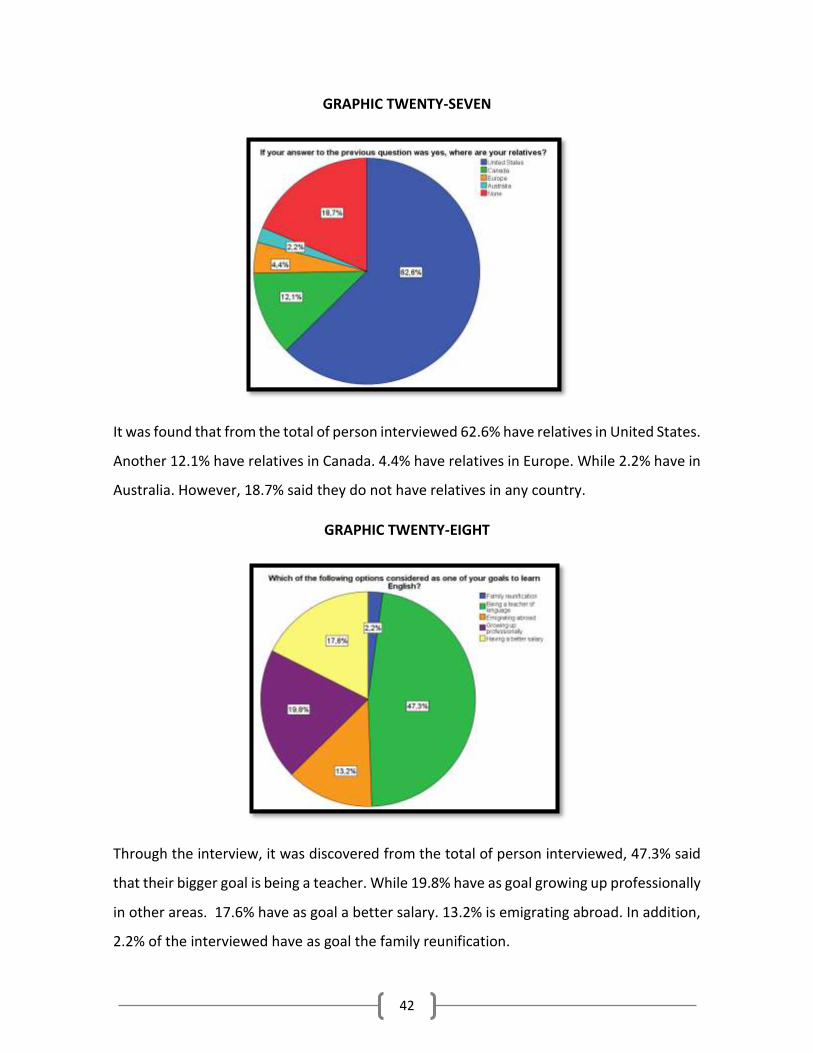
GRAPHIC TWENTY-SEVEN
It was found that from the total of person interviewed 62.6% have relatives in United States.
Another 12.1% have relatives in Canada. 4.4% have relatives in Europe. While 2.2% have in
Australia. However, 18.7% said they do not have relatives in any country.
GRAPHIC TWENTY-EIGHT
Through the interview, it was discovered from the total of person interviewed, 47.3% said
that their bigger goal is being a teacher. While 19.8% have as goal growing up professionally
in other areas. 17.6% have as goal a better salary. 13.2% is emigrating abroad. In addition,
2.2% of the interviewed have as goal the family reunification.

43
GRAPHIC TWENTY-NINE
The data analysis found that from the total of person interviewed 62.6% said that their
parents support them. Just 27.5% are independent and 9.9% said that have relatives abroad
that support them financially speaking.
GRAPHIC THIRTY
It was found that from the total of person interviewed 57.1% have all the service and items
that a student needs. Just 37.4% have lot of the services. While 5.5% have little service and
items that, a student needs in order to develop academic and personal speaking.

44
GRAPHIC THIRTY-ONE
The analysis from the data that was gathered shows that from the total of person
interviewed 75.8% plan to work as a teacher. 19.8% of the interviewed said that have not
thought about if working as teacher or not. While 4.4% said that, they are no planning to
work as teacher at the end of their major.

45
7.2.2 ANALYSIS OF TEACHERS’ INTERVIEW RESULTS
As part of this research, different teachers of the Foreign Languages Department working
and a teacher from the Pedagogical University and an analyst were interviewed. It is
important to mention that the teachers interviewed have a vast experience in the English
teaching field, as well as many years working in the Foreign Languages Department. This is
the information we collected from the interviews:
GRAPHIC ONE
According to what the teachers said, the 60% said that teachers might know where their
students come from. While the 40% of them said that it is not necessary to know.

46
GRAPHIC TWO
It was found that from the total of teachers interviewed 40% think that the economic factor
has influence. 40% said is the educational. While 20% think that environment makes a major
influences.
GRAPHIC THREE
It was found that from the total of teachers interviewed 40% said students would have
more advantage. 40% said it would depend on the institution they studied before. While 20%
think said no. While 20% think that it does not influence.
47
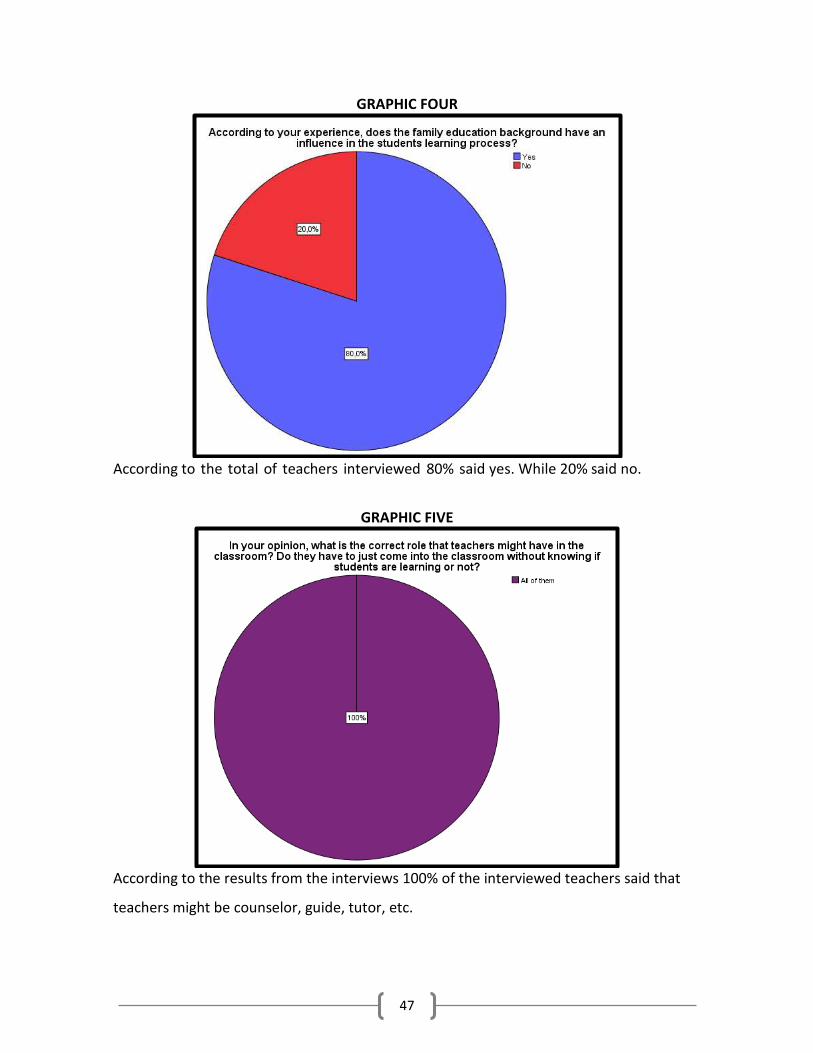
GRAPHIC FOUR
According to the total of teachers interviewed 80% said yes. While 20% said no.
GRAPHIC FIVE
According to the results from the interviews 100% of the interviewed teachers said that
teachers might be counselor, guide, tutor, etc.

48
CHAPTER VIII
8. MAIN FINDINGS CONCLUSIONS, RECOMMENDATIONS AND LIMITATIONS
8.1 MAIN FINDINGS
After analyzing and compering, the gathered data and its results with the hypotheses
that were include in this research it can be said that:
The students from the third year of the Bachelor of Arts in English, emphasis
in teaching and respecting to the socioeconomic factor they do not face any
difficulties because the majority of them have their parents or any relative abroad
who help them and even there were some students who said that they can afford
what they need by themselves. Saying this, the students from the third year of
the Bachelor of Arts in English, emphasis in teaching have no trouble to get
material that can help in the learning process of English as a foreign language.
Furthermore, students count on with the service and items that may help them
to improve their development through their studies in the Bachelor. So that,
socioeconomic factor does not have an influence on the learning process of the
language.
According to the given results, the educational background has not made a
significant influence on students of third year of the Bachelor of Arts in English,
emphasis in Teaching, since around an 84% of the students have a GPA no less
than 7 and 8, which means that are in a valid average according to university
grades requirements. When it was asked about the education sector where high
scholars got their education, the majority of them assured they came from the
public system, and because of this, most of them did not have a real contact with
English Language what made Speaking and Listening, the more difficult skills to
acquire when they practice English. In addition to this, Students in the Foreign
language department from the Major in English have satisfactory results but they
could be even better, since they have most of the resources that a languages
student can take into advantage to be more profitable in his/her learning. Finally,

49
even though a percentage of the students live in rural areas, they affirmed they
have enough resources to practice the language.
Following with the Environmental Factor it can be said that those students at
the Foreign Language Department who come from a nuclear family do not have
any kind of advantages from the ones that come from any other type of family.
Moreover, according to the results it cannot be said that the students that do not
come from a nuclear family cannot be develop as the same way of the other
students. In addition, it is important to mention that the academic background or
knowledge of the language that the parents or any member of the family do not
affect students in order to learn a new language. To conclude it can be said that
Environmental Factor does not have any influence in students profile and as a
result, it does not affect the learning process.

50
8.2 CONCLUSIONS
Because of the data gathering obtained from the Students of the Bachelor of Arts in English,
Emphasis in Teaching and the analysis of it, it is conclude that:
Educational Background factor conclusions
Most of the students from the major before mentioned have a GPA (Units of Merit
Coefficient, for its acronym in Spanish) no less than eight and adding the fact that most of
them come from a public institution. So that, it is important to say that the educational
background may not influence in the students’ profile because the 83.5% have a CUM
between seven and eight. Furthermore, the data gathering shows that a little more of the
50% of the students chose the Bachelor of Arts in English, Emphasis in Teaching because
they want to become English teachers, even though there is not the only reason for the
students to study the career before mentioned, the students interviewed feel motivated to
learn English language.
The students from Bachelor of Arts in English, Emphasis in Teaching said that they
practice several techniques in order to improve their skills. Some of the techniques that
they practice are singing, memorizing vocabulary, watching movies and others. However, in
order to acquire the second language most of the students said that listening is the most
difficult skill of the four, while one of the quarter part said that speaking is the most difficult
while acquire English as a second language. Because the majority of them did their high
school in public schools and they did not have much contact with the language before they
have to use many techniques to improve their level of English.
Students in the Foreign Languages Department from the Major in English have
satisfactory results but they could be even better, since they have most of the resources
that a languages student can take into advantage to be more profitable in his/her learning.

51
Socioeconomic factor conclusion
Most of the students count with the main basic and extra service in order to live and
improve the learning process of the language. In addition, we can mention that the majority
of the students’ have relatives abroad and the majority of them live in the United States so
students can be in contact with the language. Even though a percentage of the students live
in rural areas, they affirmed they have enough resources to practice the language. So we
can conclude that socioeconomic factor do not have an influence in the students’ profile
during the learning process.
Environmental Factor conclusion
It is concluded that environmental factor does not affect the students profile during the
learning process because they feel high motivated to face new topics and the majority of
them are planning to work as teachers.
Even though the majority of people on the nuclear family of the students do not have an
academic degree, the majority of the parents had finished university, but none of them had
studied English as a foreign language.

52
8.3 RECOMMENDATIONS
Due to the results that the survey showed when being administered and the analysis of the
data, the following recommendations are made concerning the improvement of students
of the Bachelor of Arts in English, emphasis in Teaching, in semester II/2016, at the
University of El Salvador, and its influence in their process of learning English. So that their
profile does not interfere but helps them to.
Open extra courses in order to improve listening and speaking or extent some
courses such as pronunciation and conversation for the same porpoise.
Since Listening is one of the most difficult skills to acquire, the University has to
create special media centers or laboratories to practice the language.
Give more use to the tools that the FLD has like the laboratory and the computer
center for the English intensive courses and others so students can have more real
and diary material in order to use them in their daily routine.
They should take more advantage of the resources they have in order to improve
their skills in learning English.
Implement the use of WIFI outside of the FLD so student can find tools to improve
the use of the language
Update the English major curricula
Since this research was carried out to give a general view of the issue is
recommended to give a follow up research about the topic but only focusing in one
factor at the time.

53
8.4 LIMITATIONS
During the research process the group encountered some difficulties or limitations,
among the most important ones we have:
The period in which the student population is going to be surveyed will be semester
II comprising from July to December, which for possible unforeseen may not be
achieved in the time stipulated.
The apathy of students, taken into account as sample collection can affect the
desired data.
The lack of participation by experts to be part of this research for gathering
information can generate the failure to obtain the desired results.

54
ANNEXES

55
ANNEX 1 MINISTERIO DE TRABAJO Y PREVISIÓN SOCIAL
TARIFAS DE SALARIOS MÍNIMOS VIGENTES A PARTIR DEL 1º DE ENERO 2015 (PUBLICADAS EN EL DIARIO OFICIAL Nº119, TOMO 400 DEL 1º DE JULIO DE 2013)
RAMA DE ACTIVIDAD Y SUBGRUPOS
UNIDAD DE
PAGO
MONTO
Por día $ 3.94
Trabajadores Agropecuarios (D.E. Nº 103 del 1º DE JULIO 2013) Por hora $ 0.494 (*) Por mes $ 118.20
Por día $ 8.39
Comercio y Servicio (D.E. Nº 104 del 1º DE JULIO 2013) Por hora $ 1.049 (*) Por mes $ 251.70
Por día
$ 8.22
Industria. (D.E. Nº 104 del 1º DE JULIO 2013) Por hora $ 1.028 (*) Por mes $ 246.60
Por día
$ 7.03
Maquila Textil y Confección (D.E. Nº 104 del 1º DE JULIO)2013) Por hora $ 0.879 (*) Por mes $ 210.90
Recolección de Cosechas (D.E. Nº 105 del 1º DE JULIO 2013) Por día $ 4.30
Por hora $ 0.538 - Café (*) Por mes $ 129.00
Por arroba $ 0.86
Por libra $ 0.034 Por día $ 3.29
- Algodón Por hora $ 0.411 (*) Por mes $ 98.70
Por libra $ 0.033 Por día $ 3.64
- Caña de azúcar Por hora $ 0.455 (*) Por mes $ 109.20
Por tonelada $ 1.82
Industria Agrícola de Temporada (D.E. Nº 106 del 1º DE JULIO 2013) Por día $ 5.70
- Beneficio de café Por hora $ 0.713 (*) Por mes $ 171.00
Por día
$ 4.14
- Ingenio azucarero Por hora $ 0.518
(*) Por mes $ 124.20
Por día
$ 4.14
- Beneficio de algodón Por hora $ 0.518 (*) Por mes $ 124.20
FUENTE: CONSEJO NACIONAL DE SALARIO MINIMO
(*) Mes comercial: (30 días)

56
ANNEX 2 Boletín Estadístico Primer Ingreso 2015 AdacadUES
4.3 Sector de la Institución
31.94%
68.06%
Público Privado
Gráfica 2. Composición porcentual por Sector
4.4 Edad
May ores de 40 años
0.2% 0.2%
Entre 36 y 39 años
0.1% 0.2%
Entre 32 y 35 años
0.3% 0.3%
Entre 28 y 31 años
0.6% 0.7%
Entre 24 y 27 años
1.9% 2.1%
Entre 20 y 23 años
12.1%
12.8%
Entre 16 y 19 años
27.8%
40.7%
40% 30% 20% 10% 0% 10% 20% 30% 40% 50%
Femenino Masculino
Gráfica 3: Distribución por Edade
Página 10 de 28

57
ANNEX 3
MINISTERIO DE EDUCACIÓN
DIRECCIÓN NACIONAL DE EDUCACIÓN
GERENCIA DE SEGUIMIENTO A LA CALIDAD DEPARTAMENTO DE EVALUACIÓN DE LOS APRENDIZAJES
Sector 2010 2011 2012 2013 2014
Público 4.94 4.7 4.8 5.12 4.98
Privado 5.79 5.3 5.6 5.81 5.86
Fuente: Dirección Nacional de Educación, Ministerio de Educación (2014). Resultados PAES 2014. Gerencia de Seguimiento a la Calidad. Departamento de Evaluación de los
Aprendizajes. [En línea]. 24 de noviembre de 2014. [Fecha de consulta: 15 de agosto de 2015.] Disponible en:
https://www.mined.gob.sv/jdownloads/PAES/PAES%202014/Resultados%20PAES%20Ordinaria%202014/resultados_paes_2014.pdf
Comparación de resultados por sector

58
SOBRE LA PAES 2015 Opinión
La comunicación oficial de los resultados de la PAES ordinaria 2015 permite hacer consideraciones sobre las cifras derivadas de la prueba. 19 de Diciembre de 2015 a la(s) 6:00 / José Roberto Osorio Archivado en Educación MINED PAES rendimiento escolar Resultados
La PAES es organizada y administrada en cumplimiento del art. 57 de la Ley General de
Educación que pone: “El Ministerio de Educación establecerá una prueba obligatoria orientada a medir el aprendizaje y las aptitudes de los estudiantes, que permita establecer su rendimiento y la eficacia en las diferentes áreas de atención curricular. Dicha prueba será diseñada, aplicada y procesada bajo la responsabilidad del Ministerio de Educación”. “Someterse a la prueba es requisito para graduarse de bachillerato y...”. 81,663 estudiantes se examinaron en la prueba ordinaria, 2,143 alumnos menos en relación con 2013, que en el período de 2011 a 2015 exhibe la cifra más alta de participantes. En 2014 participaron 82,191 estudiantes; 558 más que en 2015. De los participantes, el 52 % eran alumnas (42,204) y el resto estudiantes varones. En cifras absolutas se examinaron 2,725 señoritas más que alumnos. El 71 % de los estudiantes procedía del sector público (57,972) y 23,661 (29 %) de centros educativos privados. Estudiantes del sector privado obtuvieron puntajes relativamente mayores que los del público. El puntaje global del sector privado fue de 6.01 para un resultado del sector público de 5.26: una diferencia de 0.75 décimas. Estudiantes del sector privado obtuvieron un puntaje de 5.02 en Matemática (los del público, 4.43), un nivel de 6.8 en Estudios Sociales (6.09 los del sector público); 6.05 en Lenguaje y Literatura (5.31 los alumnos del sector público); y en Ciencias Naturales, 5.84, a diferencia de los examinandos del sector público, que fue de 5.35. Los estudiantes de San Salvador representaron el 31.6 % de los examinandos. En cuatro departamentos: San Salvador, (25,772), La Libertad (10,025), Santa Ana (6,744) y San Miguel (5,995), se concentró el 59.5 % de los estudiantes que se sometieron a la prueba, dato de interés para focalizar acciones de mejora de puntajes de la prueba. Cabañas fue el departamento con menos estudiantes examinados: 1,726, y enseguida La Unión con 2,107.

59
El puntaje más bajo en Matemática se reporta en el departamento de La Paz, el de Estudios Sociales y Cívica en Usulután, lo mismo que el puntaje más bajo en Lenguaje y Literatura. La Paz se repite con el menor puntaje obtenido en Ciencias Naturales. Este mismo departamento muestra el menor puntaje global de todos los territorios. Los mejores puntajes se concentraron en La Unión, con excepción de la asignatura Estudios Sociales y Cívica, que exhibe un resultado más alto en San Salvador. El porcentaje global más alto por departamento se lo asignó La Unión y enseguida San Salvador. Estas cifras resultan de importancia para los fines de iniciar acciones piloto a efecto de mejorar los resultados. ¿Dónde focalizar esfuerzos para mejorar resultados?: en La Paz, Usulután, Cuscatlán, San Vicente, Cabañas, por ejemplo. En cuanto a los puntajes obtenidos por asignatura y competencia, los relacionados con Estudios Sociales y Cívica obtuvieron mayores resultados, siguiéndole Ciencias Naturales. En la asignatura y competencias de Matemática, los estudiantes obtuvieron menores puntajes, en particular en la competencia de “Aplicación de la Matemática al entorno”, con 3.67. Los 738 estudiantes que estudiaban bajo el sistema “Calendario Norte” obtuvieron un puntaje promedio de 7.71. Se trata normalmente de centros privados, con enseñanza bilingüe. Estudiantes del sistema regular puntuaron en promedio 5.50, los organizados en CIE, 3.94, y los de EDUCAME, 4.27. Los informes de resultados son una buena base para la formulación de acciones y medidas conducentes a mejorar el rendimiento de los estudiantes en la PAES. Fuente: Osorio, J.R. (2015). Sobre la PAES 2015. Opinión, La Prensa Gráfica. [En línea.] 19 de diciembre de 2015. [Fecha de consulta: 21 de septiembre de 2016.] Disponible en: http://www.laprensagrafica.com/2015/12/19/sobre-la-paes-2015#sthash.4h5su6QI.dpuf

60
ANNEX 4 Entre los principales presupuestos del Órgano Ejecutivo se destacan las siguientes instituciones con sus
actividades y proyectos a realizar durante el ejercicio financiero fiscal 2016:
Ministerio de Educación: US$942,206,294.
Desarrollar acciones para lograr la efectividad de la educación, con criterios de equidad, pertinencia,
eficacia y eficiencia en las áreas de currículo, desarrollo profesional docente, gestión escolar y
fortalecimiento de la educación superior.
Guía del Presupuesto General del Estado para el Ciudadano 2016 1 7 Ministerio de Hacienda, Dirección General del Presupuesto
Desarrollar acciones que permitan integrar la investigación, ciencia y tecnologías al sistema educativo, bajo la estrategia
de "enseñar a pensar, a crear conocimiento y a aplicar conocimiento".
Desarrollar acciones que permitan dar cobertura y mejorar las prácticas de enseñanza aprendizaje en la educación inicial
y parvularia de 0 a 6 años.
Desarrollar acciones que propicien que todos los niños y niñas, completen sus nueve grados de educación básica, bajo un
enfoque integral e inclusivo.
Desarrollar acciones para lograr que la población salvadoreña complete sus once grados de educación formal,
desarrollando además estrategias innovadoras para atender las necesidades de formación general de los y las jóvenes y
adultos que nunca fueron a la escuela, que ingresaron tardíamente a ella o que la abandonaron sin completar su educación.
Desarrollar acciones para rehabilitar y atender centros escolares que actualmente no reúnen las condiciones de seguridad
y funcionalidad.
Contribuir a la implementación y ejecución de la Política Nacional de Innovación, Ciencia y Tecnología.
Los proyectos de inversión a realizar durante el 2016 que fueron consignados en la Ley de Presupuesto son:
Proyecto
Monto
(Mill. US$ )
- Mejoramiento de la Calidad de la Educación. 18.6
- Programa Espacios Educativos Agradables, Armónicos y Seguros para el Sistema
1.7
Educativo en El Salvador.
- Mejoramiento de la Infraestructura de dos Centros Escolares ubicados en los Caseríos El Mozote y el Barrial del Municipio de Meanguera, Departamento de 0.4
Morazán.
- Reparaciones menores en 6 Centros Escolares ubicados en el Caserío El Mozote y
zonas aledañas ubicados en los Municipios de Meanguera y Arámbala del 0.3
Departamento de Morazán.
- Obras Complementarios en tres Centros Escolares ubicados en los municipios de
Juayúa, Santiago Nonualco y San Vicente de los departamentos de Sonsonate, La 0.3
Paz y San Vicente.
- Programa de Apoyo a Comunidades Solidarias en El Salvador (UE-AECID_PACSES). 0.2
- Fortalecimiento Educativo para docentes en servicio del sector público en el marco de
0.2
la estrategia EITP a nivel nacional.
- Programa Potenciando la Escuela Inclusiva a Tiempo Pleno.
0.2
Total
21.9

61
ANNEX 5 Existe una tercera fase que es la de reconsideración por cupo incompleto. El artículo 49 del reglamento establece que si el cupo de las carreras de acuerdo al estudio de factibilidad inicial, no se completa, las Juntas Directivas de cada Facultad podrán tomar decisión al respecto, siempre y cuando el resultado del aspirante en la prueba específica no sea inferior a 30 puntos. Esta reconsideración por cupo se hace por medio de la coordinación entre jefes de departamento, vicedecanos, juntas directivas y las asociaciones estudiantiles de cada facultad, cabe señalar que estas últimas juegan un papel fundamental en esta fase. Sin embargo, tal como se menciona en el artículo 49, todo dependerá de las condiciones particulares de cada facultad. Estas evaluaciones que realiza la universidad cada año a los aspirantes, se convierten en una especie de termómetro para medir las capacidades o deficiencias que traen los estudiantes del bachillerato. Pero en sí, dibuja un cuadro lamentable en cuanto a las deficiencias académicas que reflejan los resultados de los exámenes, si de un aproximado de 20 mil bachilleres, solo un promedio de mil obtienen una calificación de 50 puntos o más. Como dato relevante, las mejores calificaciones las obtienen estudiantes que proceden de centros educativos privados de prestigio, al contrario de lo que ocurría en el pasado, cuando los mejores resultados eran de los bachilleres de provenían de institutos públicos. Pero este fenómeno es algo que deberán analizar las autoridades competentes en su debido momento. Comportamiento del ingreso universitario en la última década
Año Total Aspirantes Total Admitidos Total No Seleccionados
2005 20,297 11,653 8,644
2006 16,852 9,391 7,461
2007 17,701 10,597 7,104
2008 18,294 10,803 7,491
2009 21,417 12,238 9,179
2010 23,804 10,995 12,809
2011 25,063 9,887 15,176
2012 24,122 10,143 13,979
2013 19,610 10,357 9,253
2014 23,538 9,406 14,132
Las facultades con mayor demanda en la UES No todas las facultades dentro de la universidad tienen igual demanda, de ahí que muchos estudiantes logran una oportunidad para ingresar, aunque no sea en la carrera de su elección. Entre las facultades con mayor población estudiantil están la de Ciencias y Humanidades, la Facultad de Medicina y la Facultad de Ingeniería y Arquitectura. Dentro de estas facultades también hay carreras que tienen mayor demanda, por ejemplo en la Facultad de Ciencias y Humanidades, el Departamento de Idiomas Extranjeros, el Departamento de Psicología y el Departamento de Periodismo son carreras que no dan abasto. En la Facultad de Medicina la carrera de Doctorado en Medicina ha sobrepasado por mucho su capacidad, por mencionar algunos casos. Fuente: Sol, M. (2014). Nuevo ingreso sobrepasa capacidad de la UES. El Universitario [en línea.] 23 de abril de 2014. [Fecha de consulta: 24 de septiembre de 2016.] Disponible en: http://www.eluniversitario.ues.edu.sv/index.php?option=com_content&view=article&id=3474:nuevo-ingreso-sobrepasa-capacidad-ues-ya-no-da-abasto&catid=42:temadelmes&Itemid=54

62
ANNEX 6 POBLACIÓN DE ESTUDIANTES PARA EL AÑO: 2016 (pulse sobre el nombre de la Facultad para ver la distribución por carreras)
FACULTAD CANTIDAD
M F Total
Facultad de Ciencias Agronómicas 628 720 1,348
Facultad de Ciencias Económicas 3,717 4,913 8,630
Facultad de Ciencias y Humanidades 3,308 4,973 8,281
Facultad de Ciencias Naturales y Matemática 920 901 1,821
Facultad de Ingeniería y Arquitectura 3,999 1,582 5,581
Facultad de Jurisprudencia y Ciencias Sociales 1,788 2,960 4,748
Facultad de Medicina 1,920 3,518 5,438
Facultad Multidisciplinaria de Occidente 4,365 4,757 9,122
Facultad Multidisciplinaria Oriental 3,176 3,601 6,777
Facultad Multidisciplinaria Paracentral 1,071 1,226 2,297
Facultad de Odontología 230 458 688
Facultad de Química y Farmacia 358 589 947
TOTAL: 25,480 30,198 55,678
Fuente: Estadísticas – Población Estudiantil (2016). Población de estudiantes para el año: 2016. Administración Académica – UES. [En línea].
[Fecha de consulta: 17 de septiembre de 2016]. Disponible en:
https://academica.ues.edu.sv/estadisticas/poblacion_estudiantil.php?&npag=1&anio=2016

63
FACULTAD DE CIENCIAS Y HUMANIDADES POBLACIÓN DE ESTUDIANTES PARA EL AÑO: 2016
CARRERA CANTIDAD
M F Total
L10405 Licenciatura en Filosofía 165 164 329
L10406 Licenciatura en Sociología 165 127 292
L10407 Licenciatura en Psicología 327 792 1,119
L10408 Licenciatura en Letras 152 284 436
L10409 Licenciatura en Periodismo 400 523 923
L10410 Licenciatura en Idioma Inglés 0 3 3
L10411 Licenciatura en Idioma Inglés opción Enseñanza 407 579 986
L10412 Licenciatura en Lenguas Modernas Especialidad en Francés e Inglés 390 641 1,031
L10415 Licenciatura en Enseñanza del Inglés 41 35 76
L10427 Licenciatura en Ciencias de la Educación 165 543 708
L10428 Licenciatura en Ciencias de la Educación: Especialidad en Educación Física,
Deportes y Recreación 413 140 553
L10432 Licenciatura en Artes Plásticas 10 7 17
L10433 Licenciatura en Artes Plásticas, Opción Cerámica 16 23 39
L10434 Licenciatura en Artes Plásticas, Opción Diseño Gráfico 192 214 406
L10435 Licenciatura en Artes Plásticas, Opción Escultura 22 12 34
L10436 Licenciatura en Artes Plásticas, Opción Pintura 46 26 72
L10438 Licenciatura en Historia 107 89 196
L10439 Licenciatura en Trabajo Social 109 480 589
L10440 Licenciatura en Antropóloga Sociocultural 97 114 211
L10441 Licenciatura en Biblioteconomía y Gestión de la Información 39 64 103
P10401 Profesorado en Educación Parvularia 0 4 4
P10402 Profesorado en Educación Básica para Primero y Segundo Ciclos 1 2 3
P10426 Profesorado en Educación Media para la enseñanza del Idioma Inglés 1 0 1
P10429 Profesorado en Lenguaje y Literatura para Tercer Ciclo de Educación
Básica y Educación Media 13 22 35
P10431 Profesorado en Ciencias Sociales para Tercer Ciclo de Educación Básica y
Educación Media 1 0 1
T10454 Técnico en Bibliotecología 29 85 114
TOTAL: 3,308 4,973 8,281

64
Fuente: Estadísticas – Población Estudiantil (2016). Facultad de Ciencias y Humanidades. Población de estudiantes para el año: 2016. Administración Académica – UES [En línea]. [Fecha de consulta: 17 de septiembre de 2016]. Disponible en: https://academica.ues.edu.sv/estadisticas/poblacion_estudiantil.php?npag=2&anio=2016&facultad=FACU-CCYHH

65
ANNEX 7

66
ANNEX 8: Student’s survey
UNIVERSITY OF EL SALVADOR SCHOOL OF SCIENCE AND ARTS
FOREIGN LANGUAGE DEPARTMENT
“STUDENTS’ PROFILE OF THIRD YEAR STUDENTS OF THE BACHELOR OF ARTS IN ENGLISH, EMPHASIS IN TEACHING, IN SEMESTER II/2016, AT THE UNIVERSITY OF EL SALVADOR, AND ITS INFLUENCE IN THEIR PROCESS OF LEARNING ENGLISH.” Objective: To analyze to what extent the students’ profile influence in the learning process of English as a foreign language through a survey and whether or not the socioeconomic, the environmental and the educational background factors influence the learning process in order to improve the acquisition of English as a foreign language. Instructions: Read carefully the following questions and choose, by underlining, the answer according to your personal situation.
1. CUM: ______
2. Gender 1) Female 2) Male
3. Age 1) 21 – 30 2) 31 – 40 3) 41 – 50 4) 51 – 60
4. What is your residence area? 1) Urban 2) Rural
5. The house in which you live is 1) Own 2) Rented
6. What is your family structure? 1) Nuclear 2) Single-parent 3) Extensive 4) Assembled
7. Regardless of your family structure, do you live alone or with someone in your family? 1) Alone 2) With someone of my family 3) With a friend

67
8. Which of the following statements about occupational status apply to you? 1) Not working at the moment 2) Part-time or hourly work (< 15 hours per week) 3) Part-time work (15 to 34 hours per week) 4) Full-time work 5) On temporary leave (education, public service leave) 6) In training (apprentice)
9. If you are presently not working. Did you ever work before? 1) Yes 2) No
10. Since when are you no longer working? 1) 1-6 months 2) 1-3 years 3) More than 3 years
11. Did you do primary school in a public or private institution? 1) Public 2) Private
12. In which area did you do your high school studies? 1) Urban zone 2) Rural zone
13. Why did you decide to study a Bachelor of Arts in English, Emphasis in Teaching? 1) Being English teacher 2) Work in a call center 3) Travel abroad 4) Personal growth 5) Emigrating abroad 6) Personal growth 7) It is cheaper than an academy of English
14. How motivated do you feel to learn the English language? 1) Highly motivated 2) Motivated 3) Little motivated
15. As for your personal study, what are the techniques used to develop oral expression of language? 1) Singing English music 2) Memorize vocabulary
3) Practicing dialogues in English 4) Talk outside of class
5) Only practice during classes
16. How do you improve your understanding of language (listening)? 1) Watch movies in English 2) Listen to music in English 3) See news in English
17. As for your reading, what do you do to understand texts written entirely in English? 1) Read English books for pleasure 2) Memorize vocabulary 3) Look up the meaning of vocabulary
18. To improve writing, what practical techniques do you use? 1) Trying to write daily in English 2) Write sentences in English 3) Memorizing vocabulary dictionary
19. Of the four skills acquired by learning a second language, what is more difficult for you? 1) Listening 2) Speaking 3) Reading 4) Writing

68
20. When a new semester stars, how do you get your materials?
1) Buy them 2) Photocopy them 3) Don’t get them
21. How often do you buy new materials to improve your skills?
1) Once in a month 2) Twice or three times monthly 3) Never
22. How do you feel when facing a new topic in class? 1) Excited 2) Happy 3) Worried 4) Distressed
23. What is the highest level of education that your parents have completed?
1) University/college or equivalent 2) Intermediate between secondary level and university (e.g. technical training) 3) Secondary school 4) Primary school only (or less
24. Does anyone on your nuclear family has an academic degree? 1) Yes 2) No 3) Just on my relatives
25. Had anyone on your family studied English as a foreign language?
1) Yes 2) No
26. Do you have relatives abroad? 1) Yes 2) No
27. If your answer to the previous question was yes, where are your relatives? 1) United States 2) Canada 3) Europe 4) Australia
28. Which of the following options considered as one of your goals to learn English? 1) Family Reunification 2) Being a teacher of language
3) Emigrating abroad 4) Growing up professionally
5) Having a better salary
29. Who supports you financially?
1) Parents 2) Relatives abroad 3) Independent
30. Mark an "x" the following services and items with which accounts in your home. 1) Electricity ___ 2) Water ___ 3) Internet ___ 4) Computer ___ 5) Telephone ___ 6) Television ___ 7) Refrigerator ___ 8) Cable ___ 9) Books ___ 10) Audios ___
31. At the end of your major, do you plan to work as a teacher? 1) Yes 2) No 3) I have not thought about that
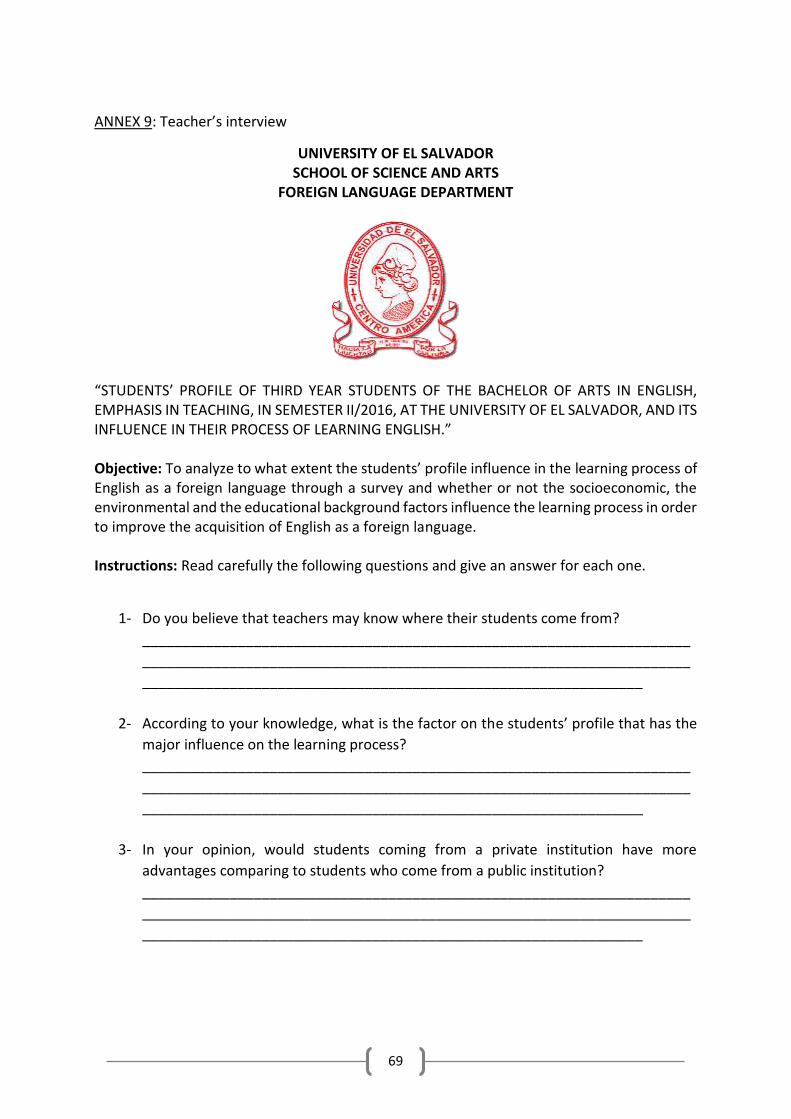
69
ANNEX 9: Teacher’s interview
UNIVERSITY OF EL SALVADOR SCHOOL OF SCIENCE AND ARTS
FOREIGN LANGUAGE DEPARTMENT
“STUDENTS’ PROFILE OF THIRD YEAR STUDENTS OF THE BACHELOR OF ARTS IN ENGLISH, EMPHASIS IN TEACHING, IN SEMESTER II/2016, AT THE UNIVERSITY OF EL SALVADOR, AND ITS INFLUENCE IN THEIR PROCESS OF LEARNING ENGLISH.” Objective: To analyze to what extent the students’ profile influence in the learning process of English as a foreign language through a survey and whether or not the socioeconomic, the environmental and the educational background factors influence the learning process in order to improve the acquisition of English as a foreign language. Instructions: Read carefully the following questions and give an answer for each one.
1- Do you believe that teachers may know where their students come from?
_____________________________________________________________________
_____________________________________________________________________
_______________________________________________________________
2- According to your knowledge, what is the factor on the students’ profile that has the
major influence on the learning process?
_____________________________________________________________________
_____________________________________________________________________
_______________________________________________________________
3- In your opinion, would students coming from a private institution have more
advantages comparing to students who come from a public institution?
_____________________________________________________________________
_____________________________________________________________________
_______________________________________________________________

70
4- According to your experience, does the family education background have an influence
in the students learning process?
_____________________________________________________________________
_____________________________________________________________________
_______________________________________________________________
5- In your opinion, what is the correct role that teachers might have in the classroom? Do
they have just come into the classroom without knowing if students are learning or
not?
_____________________________________________________________________
_____________________________________________________________________
_______________________________________________________________

71
Annex 10: Feedback from the Evaluating committee.
After given a resume and the results from this research, members from the evaluating
committee gave some feedback and observation in order to improve the research paper, here
presented. Some of the observations and feedback were:
Congratulations for the effort that you have done in the research.
The paper looks well organized.
Modify or correct some typos that were found in the paper
There was a problem with the way in which the research question was written down,
so it is needed to change to give a second look to the structure and make the
arrangements.
After the analysis of the data and presented into graphics are the conclusions,
recommendations and limitations. However, it gives the impression that something is
missing between those items. So that, you should include the most important part of
the job: the main findings. In order to know if any of the factor influence or not in the
students’ profile.
To give a follow up. Since the research project was considered to give a general view
of the issue, the following research about the topic should be specific, focusing in one
of the three factors that were taken into account in this research.
BIBLIOGRAPHY

72
González, L. (2004) “Proyecto Monitoreo a las Leyes relativas al reconocimiento de hijos e hijas y deberes de asistencia económica”. Investigador y Director del Centro de Información, Documentación y Apoyo a la Investigación (CIDAI), de la Universidad Centroamericana “José Simeón Cañas” (UCA).
Johnson, B. (2006). Foreign Language Learning: An Exploratory Study on the External Influences Affecting Success (Thesis for the degree of Master Arts unpublished). Department of Modern Foreign Language. Baylor University. Texas, United States.
Monge-Naranjo, A. & Rodríguez-Clare, A. (2009). Crecimiento económico en El Salvador (tesis preparada para la Fundación Salvadoreña para el Desarrollo). Página 31. Department of Economics. Pennsylvania State University. Pennsylvania, United States.
Nolasco, M. & Ideaspropias (2004). Enseñanza de una Segunda Lengua. Manual Práctico para Docentes. 1° Edición. Editorial IdeasPropias. Madrid, España.
Programa de las Naciones Unidas para el Desarrollo (2013). Informe sobre Desarrollo Humano El Salvador 2013. Imaginar un nuevo país. Hacerlo posible. Diagnóstico y propuesta. PNUD. La Libertad, El Salvador.
Vera R., O.E. & Vera R., F.M., (2013). Evaluación del nivel socioeconómico: presentación de una escala adaptada en una población de Lambayeque. Revistas Cuerpo Médico del Hospital Nacional Almanzor Aguinaga Asenjo. Vol. 6 (1) Perú.
Bernaus, M. (Ed.), (2001).Didáctica de las lenguas extranjeras en la Educación Segundaria Obligatoria. Madrid, Síntesis educación.
Considine1, G. & Zappalà2, G. (2009). Factors Influencing the Educational Performance of Students from Disadvantaged Backgrounds.1Australian Centre for Industrial Relations Research and Training. University of Sydney. 2Research and Social Policy Team. The Smith Family.
Engine, A.O. (2009). Second Language Learning Success and Motivation. Society for Personality Research. Kafka University. Kars, Turkey.
73
Gardner. H. (1999). Intelligence Reframed: Multiple Intelligences for the 21st Century. Basic Books. Estados Unidos.
Kiddle1, T. & Kormos2, J. (2013). The role of socio-economic factors in motivation to learn English as a foreign Language: The case of Chile.1Lancaster University, Department of Linguistics and English Language, United Kingdom. 2Research Department, Universidad Chileno Británica de Cultura. Chile & Norwich Institute of Language Education, United Kingdom.
Luján, G., C.I. (2005) La motivación: Un factor relevante en el proceso enseñanza-aprendizaje de lengua extranjeras. Universidad de Las Palmas de Gran Canaria. España.
Mendoza, R. Constitución de la Republica de El Salvador. Título II, capítulo II, art. 33. Edición 2013. San Salvador.
Organización Mundial de la Salud. (2014). Perfiles de los países. En INFORME SOBRE LA SITUACIÓN MUNDIAL DE LA PREVENCIÓN DE LA VIOLENCIA 2014(124). Ginebra, Suiza: WHO Press.
Órgano Legislativo. (1993). Código de Familia de El Salvador. Diario Oficial No. 121, Tomo 384. Según la reforma del año 2009.
Pineda, T.S. (2013). Evaluación del Proceso Enseñanza-Aprendizaje del Inglés en Escuelas Públicas del Municipio San Pedro Nonualco. Escuela de Idiomas. Universidad Tecnológica de El Salvador. Revista Cátedra Abierta.
Programa de las Naciones Unidas para el Desarrollo (2005). Informe sobre Desarrollo Humano El Salvador 2005. Una mirada al nuevo nosotros. El impacto de las migraciones. PNUD. San Salvador, El Salvador.
Rivas, F. (2013). El Financiamiento de la educación en El Salvador. Fundación Innovaciones Educativas Centroamericanas- FIECAS. San Salvador, El Salvador.
Rubio Alcalá, F. D. (2004). La ansiedad en el aprendizaje de idiomas. Huelva: Universidad de Huelva.

74
WEBGRAPHY
75
ADACAD. (2014). Boletín Estadístico Primer Ingreso 2014. Sistema de Información de la Administración Académica, ADACAD. [en línea]. marzo 9, 2015. [fecha de consulta: 1 de mayo de 2015] Disponible en: https://academica.ues.edu.sv/
Asamblea Legislativa de El Salvador. (2016). Ley General de Educación. [en línea]. Febrero 11, 2016. [fecha de consulta: 24 de septiembre de 2016.] Disponible en: http://www.asamblea.gob.sv/eparlamento/indice-legislativo/buscador-de-documentos-legislativos/ley-general-de-educacion
Asamblea Legislativa de El Salvador. (2016). Ley de la Carrera Docente. [en línea]. Julio 29, 2016. [fecha de consulta: 24 de septiembre de 2016.] Disponible en: http://www.asamblea.gob.sv/eparlamento/indice-legislativo/buscador-de-documentos-legislativos/ley-de-la-carrera-docente
Banco Mundial. El Salvador Indicadores del desarrollo mundial. [en línea] [fecha de consulta: 15 de agosto de 2015.] disponible en: http://datos.bancomundial.org/pais/el-salvador
Cibanal, L. (2013). ESTRUCTURA FAMILIAR. Página personal de Nicanor Aniorte Hernández sobre la Formación Postgrado en Enfermería. [en línea]. enero 13, 2013. [fecha de consulta: 1 de mayo de 2015] Disponible en: http://www.aniorte-nic.net/apunt_terap_famil_4.html
Dirección General de Estadística y Censos. (2015) Canasta Básica Alimentaria. [en línea] 15 de febrero de 2012. [fecha de consulta: 16 de junio de 2015.] Disponible en: http://www.digestyc.gob.sv/index.php/temas/ee/canasta-basica-alimentaria-cba-html
Dirección General del Presupuesto, del Ministerio de Hacienda. (2015) GUÍA DEL PRESUPUESTO GENERAL DEL ESTADO PARA EL CIUDADANO 2015. [en línea] 27 de febrero de 2015. [fecha de consulta: 09 de junio de 2015]. Disponible en: http://www.mh.gob.sv/portal/page/portal/PTF/Presupuestos_Publicos/Guias_del_presupuesto_para_el_ciudadano
Dirección Nacional de Educación, Ministerio de Educación (2014). Resultados PAES 2014. Gerencia de Seguimiento a la Calidad. Departamento de Evaluación de los

76
Aprendizajes. [en línea]. 24 de noviembre de 2014. [fecha de consulta: 15 de agosto de 2015.] Disponible en: https://www.mined.gob.sv/jdownloads/PAES/PAES%202014/Resultados%20PAES%20Ordinaria%202014/resultados_paes_2014.pdf
EducarChile. (2013). Tipos de Familia. EducarChile [en línea]. [fecha de consulta: 5 de mayo de 2015]. Disponible en: http://www.educarchile.cl/ech/pro/app/detalle?ID=206646
Fínez Silva, M.J. La familia como agente educador. (On line) ISSN 1698-7799, ISSN-e 1698-7802, Nº. 3, 2004, págs. 18-20 (consultado el 15/07/2015) Disponible en Internet: http://dialnet.unirioja.es/servlet/autor?codigo=1911431
Fondo de Inversión Social para el Desarrollo Local (FISDL) (2005). Libro Mapa de Pobreza. [en línea]. 07 de diciembre de 2005. [fecha de consulta: 15 de agosto de 2015]. Disponible en: www.fisdl.gob.sv/temas-543/mapa-de-pobreza
Gochez, R.E. Mapa de Pobreza en El Salvador. Especialista en Desarrollo Local (ADEPRO). [en línea]. [fecha de consulta: 15 de agosto de 2015]. Disponible en: http://www.adepro.biz/espanol.php?id=8&cat=2&art=16
Lorenzana, L. La motivación intrínseca y la motivación extrínseca. Psicología Motivacional. [en línea]. [fecha de consulta: 16 de junio de 215]. Disponible en: http://psicologiamotivacional.com/la-motivacion-intrinseca-y-la-motivacion-extrinseca/
Ministerio de Trabajo. (2015). Tabla salario mínimo vigente 2015. Ministerio de Trabajo y Prevención Social [en línea]. 27 de Febrero de 2015. [Fecha de consulta: 2 de mayo de 2015] Disponible en: http://www.mtps.gob.sv/index.php?option=com_content&view=article&id=2133%avisos-ciudadano&catid=25%3Athe-cms&Itemid=76
Moodle. Departamento de Idiomas Online. [en línea] Disponible en: http://www.idiomas.ues.edu.sv/moodle/

77
Psicología, La Guía. 2009. La Motivación. [en línea]. 29 de mayo de 2009. [fecha de consulta: 16 de julio de 2015.] Disponible en: http://psicologia.laguia2000.com/el-aprendizaje/la-motivacion#ixzz3gBAnqHRf
Sol, M. (2014). Nuevo Ingreso sobrepasa capacidad de la UES. El Universitario [en línea.] 23 de Abril de 2014. [Fecha de consulta: 24 de septiembre de 2015.] Disponible en: http://www.eluniversitario.ues.edu.sv/index.php?option=com_content&view=article&id=3474:nuevo-ingreso-sobrepasa-capacidad-ues-ya-no-da-abasto&catid=42:temadelmes&Itemid=54
Martínez, N. (2009). Por qué los estudiantes de las escuelas públicas no aprenden inglés. Diálogos. Revista de Educación [en línea]. Julio 2009, n° 4. [fecha de consulta: 1 de mayo de 2015]. Disponible en: http://www.udb.edu.sv/dialogos/Informes.html
Rodríguez-Pérez, N. (2014). Creencias y representaciones de los profesores de lenguas extranjeras sobre la influencia de los factores motivacionales y emocionales en los alumnos y en las alumnas. Porta Linguarum [en línea]. enero 2014, no 21. [fecha de consulta: mayo 15, 2015]. Disponible en: http://www.ugr.es/~portalin/articulos/articles-index.htm