world knowledge competitiveness index 2008
TRANSCRIPT

World Knowledge Competitiveness Index 2008
Wor
ld K
now
ledg
e Co
mpe
titi
vene
ss In
dex
2008
Western AvenueCardiffCF5 2SGtel: +44 (0)29 2041 6070fax: +44 (0)29 2041 6286email: [email protected]
Rhodfa’r GorllewinCaerdyddCF5 2SGffôn: +44 (0)29 2041 6070ffacs: +44 (0)29 2041 6286ebost: [email protected]
All wood/pulp used in this prospectus is sourced from sustainable producers andresponsibly managed forests that create minimal environmental impact.


Robert HugginsCentre for International Competitiveness
Cardiff School of ManagementUniversity of Wales Institute, Cardiff
Hiro IzushiCentre for International Competitiveness
Aston Business SchoolAston University
Will DaviesAssociate
Centre for International Competitiveness
Luo ShouguiCollege of Antai Economics and Management
Shanghai Jiao Tong University
Published by: Centre for International CompetitivenessCardiff School of Management
University of Wales Institute, CardiffColchester Avenue
CardiffCF23 9XR
WalesUnited Kingdom
Telephone: +44 (0) 29 2041 7075
http://www.cforic.org
© Robert Huggins and Hiro Izushi
ISBN: 1-902829-04-2
World Knowledge Competitiveness Index
2008


Contents
CHAPTER Page
Executive Summary
ONE Introduction 01
TWO The Rankings: World Knowledge Competitiveness Index 2008 07
THREE Human Capital Components 14
FOUR Knowledge Capital Components 20
FIVE Financial Capital 24
SIX Regional Knowledge Economy Outputs 26
SEVEN Knowledge Sustainability Components 29
WKCI 2008 Data Sources 33
EIGHT Regional Evolution and Knowledge Diffusion:Evidence from China’s Three Leading Regionsby Robert Huggins and Luo Shougui 34
Con
tent
s


Exe
cutiv
e S
umm
ary
ExecutiveSummary
This report represents the fifth edition of the WorldKnowledge Competitiveness Index (WKCI), the firstcomposite and relative measure of the knowledgeeconomies of the world’s leading regions. The WKCI isan integrated and overall benchmark of the knowledgecapacity, capability and sustainability of each region,and the extent to which this knowledge is translated intoeconomic value, and transferred into the wealth of thecitizens of each region. As such, the competitiveness ofa region will depend on its ability to anticipate andsuccessfully adapt to internal and external economicand social challenges, by providing new economicopportunities, including higher quality jobs.
The 2008 edition of the WKCI compares 145 regions across19 knowledge economy benchmarks (full data for allindicators across each of the 19 benchmarks in containedin the accompanying Excel spreadsheets). This representsan increase of twenty regions compared to the last edition in2005: nine from Europe, eight from North America, and threefrom Asia Pacific. These new regions were selected on thebasis of a survey of a wide range of regions appearing to bebecome more internationally competitive. This year’s reportalso contains a special chapter on economic development inthe three leading Chinese regions.
Once again, at the top of the index is the US metropolitanarea of San Jose (248.3). The region, the home of SiliconValley, continues to lead the WKCI rankings by somedistance, due to its enormous investment in knowledge-intensive business development, in particular in the fields ofhigh-technology engineering, computers, andmicroprocessors. Despite the onset of the dot-com crashearlier in the decade, San Jose has remained a clear leaderacross a number of knowledge employment sectors, as wellas ranking amongst the top regions worldwide for investmentin education and business R&D, as well as for correspondingeconomic output indicators such as productivity andearnings.
Remaining in second place in 2008 is the metropolitan areaof Boston, a region which thrives on high levels of intellectualand financial capital. Boston, is of course, synonymous withhigher education, and is home to eight research universitiesincluding Harvard and the Massachusetts Institute ofTechnology. Hartford moves further up the index to third, withits score boosted by very strong results for both R&Dspending and private equity investment, which translate intoa very strong productivity score: Hartford ranks as thehighest region worldwide by productivity in our rankings.The neighbouring Connecticut region of Bridgeport, a newregion in this year’s index, enters in an impressive fourthplace while San Francisco slips two places to fifth.
Stockholm moves up two places to sixth position, and thecontinued improvement of Stockholm’s ranking has beenbased on gains across a range of indicators – in particular,business R&D spending, biotechnology and chemical sectoremployment, and higher education spending. Tokyo movesup from twenty-second to ninth position, while Shiga, West
Sweden and West Netherlands all move into the top twenty.The new regions of Iceland and Pohjois-Suomi (Finland)
diluting the influence of North American regions. The toptwenty now contains thirteen US regions, five Europeanregions and two Japanese regions.
At the foot of rankings we continue to find the Chinese,Indian and Eastern European regions – the lowest rankedbeing Bangalore, Mumbai and Hyderabad. Amongst theemerging regions in the index, Shanghai continues toperform best, increasing its ranking one again despite theentry of twenty new regions, mostly from Europe and the US.Shanghai is now ahead of the likes of Berlin and BritishColumbia, which shows how far the most developedamongst the Chinese regions has come in recent years.Also, our index of Regional Knowledge Intensity (a measurecomparing the underlying knowledge base of a region inrelation to its direct economic output) is headed by theGuangdong region of China.

CH
AP
TE
R O
NE
P:0
1In
trod
uctio
n
Introduction
This report represents the fifth edition of the WorldKnowledge Competitiveness Index (WKCI), the firstcomposite and relative measure of the knowledgeeconomies of the world’s leading regions. The WKCI isan integrated and overall benchmark of the knowledgecapacity, capability and sustainability of each region,and the extent to which this knowledge is translated intoeconomic value, and transferred into the wealth of thecitizens of each region. As such, the competitiveness ofa region will depend on its ability to anticipate andsuccessfully adapt to internal and external economicand social challenges, by providing new economicopportunities, including higher quality jobs.
The global importance of the concept of competitiveness hasincreased rapidly in recent years, with the issuessurrounding it becoming, at the same time, both moreempirically refined and theoretically complex. It was theresearch of Michael Porter that first defined nationalcompetitiveness as an outcome of a nation’s ability toinnovate in order to achieve, or maintain, an advantageousposition over other nations in a number of key industrialsectors. Further work by Lester Thurow determined that it isprimarily knowledge-based industries within which a nationneed specialise in order to obtain a word-class standard ofliving for its citizens.
We define such competitiveness as referring to the capabilityof an economy to attract and maintain firms with stable orrising profits in an activity, while maintaining stable orincreasing standards of living for those who participate in it.This makes clear that competitiveness is not a zero-sum
game, and does not rely on the shifting of a finite amount ofresources from one place to another. However,competitiveness does involve balancing the different types ofadvantages that one place may hold over another – therange of differing strengths that the socio-economicenvironment affords to a particular place compared toelsewhere.
While the competitiveness of both nations and regions willbe intrinsically bound to their economic performance, thereexists a growing consensus that competitiveness is bestmeasured in terms of the ‘assets’ of the local businessenvironment – such as the level of human capital, thedegree of innovative capacity and the quality of the localinfrastructure – which affect the propensity of a region toachieve competitive advantage in technologically leading-edge and growing sectors of activity. In other words,competitiveness is increasingly being measured in terms ofcreativity, knowledge and environmental conditions, ratherthan purely based on accumulated wealth.
The 2008 edition of the WKCI compares 145 regions across19 knowledge economy benchmarks (full data for allindicators across each of the 19 benchmarks in containedin the accompanying Excel spreadsheets). This representsan increase of twenty regions compared to the last edition in2005: nine from Europe, eight from North America, and threefrom Asia Pacific. These new regions were selected on thebasis of a survey of a wide range of regions appearing to bebecome more internationally competitive. This year’s report
also contains a special chapter on economic development inthe three leading Chinese regions.
The results of our analysis are combined to produce acomposite index of knowledge competitiveness. The seriesof benchmarks we establish identify the relative strengthsand weaknesses of regional economies in terms of theirknowledge capacity, capability and utilisation. The focus onthe global benchmarking of regions is highly relevant, sincethere is an increasing appreciation that it is regions, ratherthan whole nations, that are competing in the globalknowledge-based economy. Here we define the knowledge-base of an economy as:
‘the capacity and capability to create and innovate newideas, thoughts, processes and products, and to translate
these into economic value and wealth.’
The importance of the concept of competitiveness is nowfirmly embedded within economic policymaking around theworld. As such, measuring, understanding and analysingcompetitiveness at a number of geographic levels hasbecome a vital factor in creating an informed dialogue, andcan contribute to a policy environment attuned to enhancingthe economic performance of nations and regions across theworld.
To this end, we have selected those indicators currentlyavailable that enable a quantitative comparison of thecompetitiveness of an economy: these include levels oflabour productivity, investment in research and developmentactivities, expenditure on education, levels of employmentand economic activity rates, ICT infrastructure density,access to private equity, and employment in ‘knowledge-based’ sectors. These so-called knowledge-based sectorsprimarily concern high-technology manufacturing andknowledge-based services such as telecommunications, ITservices, and research and development activities.1
Conceptualising the Knowledge Economy
The conceptual model we employ to analyse regionalknowledge economies, as illustrated by Figure 1.1, is amulti-linked cycle model representing knowledge creationand utilisation as well as capacity building. The modelreflects the latest thinking on the innovation process, whichsees it as a process whereby agents in different domains(e.g. departments/divisions of private firms, universities,research laboratories and governments) interact with oneanother through feedback loops. We extend this thinking tothe regional level and add a component that reproduces andsustains the whole system’s innovative capacity.
The model consists of four key components: (1) CapitalInputs; (2) Knowledge Economy Production; (3) RegionalEconomy Outputs (including Knowledge Economy Outputs);and (4) the Sustainability Link. Each of these components,with the exception of Knowledge Economy Production, hasrepresentative variables, while Knowledge EconomyProduction is regarded as a production function thattransforms Capital Inputs into Regional Economy Outputs.

Capital Inputs consist of four groups: Knowledge Capital,Human Capital, Financial Capital, and Physical Capital. Untilrecently, economists tended to account for economicoutputs, or growth, of geographic areas via measurementsof ‘capital’ and ‘labour’. ‘Capital’ refers to physical units of, orfixed investments in, production such as land, plants,machinery and equipment, while ‘labour’ is defined by thenumber of ‘heads’ in employment (or working population).Under this framework, a residual that cannot be explained bythese two factors is often seen as an indicator of technicalchange.
This traditional accounting model has given way to newmodels resulting from to two key developments in economictheory: human capital theory and endogenous models ofeconomic growth. Human capital theory recognises skillsand expertise gained through education and training asinvestment made by, and embodied in, individuals. This is adeparture from the traditional models of economic growththat do not distinguish any differences between individuals.Endogenous economic growth theory views theaccumulation of knowledge as a key source of long-runeconomic growth, and acknowledges the creation ofknowledge by private-sector firms, through Schumpeteriancompetition (i.e. temporary monopoly of economic gainsderiving from new knowledge by its inventor), as an internal(i.e. endogenous) factor.
The four groups of Capital Inputs in our model incorporatethese developments in economic theory. While PhysicalCapital refers to capital in the traditional parlance ofeconomics, Financial Capital emphasises the liquidity offinancial resources mobilised into new areas of growth andknowledge (e.g. products, sectors, industries) throughsources such as venture capital. Knowledge Capital is the
raw material of the knowledge economy, referring to theregion’s capacity for, or its resources aimed at, creating newideas. Ideas in this realm are not necessarily created withconsideration for commercial applications, with the sourcesof such new ideas ranging from universities and researchestablishments to firms, individuals and other organisations.Included as a form of Knowledge Capital is the intermediarythroughput produced during the course of convertingknowledge into commercial values. Finally, Human Capitalindicates the capacity of individuals in a region to create,understand and utilise knowledge for the creation ofcommercial values.
The combination of the four types of capital within the regionresults in the production of knowledge-based goods andservices containing high value-added. These knowledge-based goods and services, which we term KnowledgeEconomy Outputs, form part of the total outputs of theregion’s economic activity, i.e. Regional Economy Outputs.The distinction between Knowledge Economy Outputs andRegional Economy Outputs signifies our assumption thatinnovative knowledge outputs embodied in goods andservices are not always translated evenly into the wealth aregion’s inhabitants will enjoy.
The cycle is completed by the requirement for KnowledgeSustainability. Unless part of the wealth created is re-invested into Capital Inputs, and particularly KnowledgeCapital and Human Capital, to support their reproductionand further development, the medium to long-term prosperityof a regional economy will be undermined.
P:0
2In
trod
uctio
n
1 Although it is clear that knowledge utilisation is not confined to any particular sectors ofactivity, in terms of the best available means of analysis and measurement we are requiredto work on the assumption that the intensity of knowledge utilisation is higher in certainsectors of activity than others.
Conceptualising the Regional Knowledge Economy Figure 1.1

Research Design
The key factor underlying the selection of regions forbenchmarking is their relative gross domestic product (GDP)per capita. In the main, those regions included in the WKCIare those that have achieved the highest output per capitaacross the globe during the recent period. However, thereare a number of exceptions in the case of Asian regions,which although they do not currently have a GDP per capitaas high as many of their North American and Europeancounterparts, they have experienced a level of output growththat can be said to merit their inclusion. The same is true ofthe Baltic regions of Latvia, Lithuania and Estonia which,although still relatively poor by European standards, havedisplayed significant potential through their recent rates ofknowledge-based economic growth. Of the 145 regionscontained in the index there are 63 representatives fromNorth America, 54 from Europe and 28 from Asia andOceania. For the purposes of this report, Israel is includedunder Asia Pacific on the basis that it is not a Eurostat region.
European RegionsBrussels, BelgiumVlaams Gewest, BelgiumBaden-Württemberg, GermanyBayern, GermanyBerlin, GermanyBremen, GermanyHamburg, GermanyHessen, GermanyNiedersachsen, GermanyNordrhein-Westfalen, GermanySaarland, GermanySchleswig-Holstein, GermanyDenmarkEstonia*Noreste, SpainComunidad de Madrid, SpainÎle de France, FranceCentre-est, FranceSouthern and Eastern, IrelandNorth West, ItalyLombardia, ItalyNorth East, ItalyEmilia-Romagna, ItalyCentral, ItalyLazio, ItalyLithuania*LuxembourgLatvia*North, NetherlandsEast, Netherlands*West, NetherlandsSouth, NetherlandsEast, AustriaWest, AustriaEtela-Suomi, FinlandLansi-Suomi, Finland*Pohjois-Suomi, Finland*Stockholm, SwedenOstra Mellansverige, Sweden*South, SwedenSmaland Medoarna, SwedenWest, SwedenEastern, UKLondon, UKSouth East, UKSouth West, UK*Scotland, UKSwitzerland
NorwayPrague, Czech RepublicBratislavsk_, Slovak RepublicBudapest, HungaryIceland
North American RegionsAkron, US*Atlanta-Sandy Springs-Marietta, USAustin-Round Rock, USBaltimore-Towson, USBoston-Cambridge-Quincy, USBridgeport-Stamford-Norwalk, US*Buffalo-Niagara Falls, USCharlotte-Gastonia-Concord, USChicago-Naperville-Joliet, USCincinnati-Middletown, USCleveland-Elyria-Mentor, USColorado Springs, US*Columbus, USDallas-Fort Worth-Arlington, USDenver-Aurora, USDetroit-Warren-Livonia, USDurham, US*Grand Rapids, USGreensboro-High Point, USHartford, USHouston-Sugar Land-Baytown, USIndianapolis, USJacksonville, USKansas City, USLas Vegas-Paradise, USLos Angeles-Long Beach-Santa Ana, USLouisville, USMemphis, USMiami-Fort Lauderdale-Miami Beach, USMilwaukee-Waukesha-West Allis, USMinneapolis-St. Paul-Bloomington, USNashville-Davidson--Murfreesboro, USNew York-Northern New Jersey-Long Island, USOklahoma City, US*Orlando-Kissimmee, USOxnard-Thousand Oaks-Ventura, US*Philadelphia-Camden-Wilmington, USPhoenix-Mesa-Scottsdale, USPittsburgh, USPortland-Vancouver-Beaverton, USProvidence-Fall River-Warwick, US*Raleigh-Cary, USRichmond, USRiverside-San Bernardino-Ontario, USRochester, USSacramento--Arden-Arcade--Roseville, USSalt Lake City, USSan Antonio, USSan Diego-Carlsbad-San Marcos, USSan Francisco-Oakland-Fremont, USSan Jose-Sunnyvale-Santa Clara, USSarasota-Bradenton-Venice, US*Seattle-Tacoma-Bellevue, USSt. Louis, USTampa-St. Petersburg-Clearwater, USVirginia Beach-Norfolk-Newport News, USWashington-Arlington-Alexandria, USAlberta, CanadaBritish Columbia, CanadaManitoba, CanadaOntario, CanadaQuebec, CanadaSaskatchewan, Canada
P:0
3In
trod
uctio
n

Asia/Oceania RegionsNew South Wales, AustraliaVictoria, AustraliaWestern AustraliaIsraelNew ZealandTochigi, JapanTokyo, JapanKanagawa, JapanToyama, JapanShizuoka, JapanAichi, JapanShiga, JapanKyoto, JapanOsaka, JapanSeoul, KoreaUlsan, KoreaHong KongSingaporeTaiwanShanghai, ChinaBeijing, ChinaTianjin, China*Guangdong, China*Jiangsu, China*Zhejiang, China*Shandong, China**Denotes new region
The European regions in the WKCI are based on theEuropean Union’s definition of regional units, NUTS-1. Dueto this definition, some nations are included as regions (i.e.Denmark and Luxembourg). In addition, three non-EUmember countries, Switzerland, Norway and Iceland (newaddition to the WKCI 2008) are included in the analysis andare treated as regions. Among the European Union’s newEU-10 nations, three regions – Bratislava in the SlovakRepublic, Budapest in Hungary and Prague in the CzechRepublic – are included in the index. Three of the other newEuropean nations – Latvia, Lithuania and Estonia – are alsonewly included this year as region-states. Other newEuropean regions included this year are: Lansi-Suomi andPohjois-Suomi in Finland, the South West of the UK, OstraMellansverige in Sweden and East Netherlands. All of thesewere added to the WKCI following strong performances inthe 2006 edition of the European Competitiveness Index.The NUTS-1 region of Southern and Eastern Ireland alsoreplaces Ireland, which was previously included as a region-state.
For the US, regions are again based on the metropolitanstatistical areas (MSAs) classification, following the overhaulof the previous consolidated metropolitan statistical areas(CMSAs) classification prior to the 2005 edition of the WKCI.As defined by the US Census Bureau, MSAs consist ofareas with a substantial population centre and adjacentcounties having a high degree of economic homogeneity.Compared with counties, cities and states, the MSAsanalysed in this study are more robust regional units foreconomic analysis as they reflect the boundaries of clustersof firms in related industries. New MSAs included this year,based on an analysis of both current levels and growth ratesof per capita GDP, are: Akron in the state of Ohio,Bridgeport-Stamford-Norwalk in Connecticut, ColoradoSprings in Colorado, Durham in North Carolina, OklahomaCity in Oklahoma, Oxnard-Thousand Oaks-Ventura inCalifornia, Providence-Fall River-Warwick in the states ofMassachusetts and Rhode Island, and Sarasota-Bradenton-Venice in Florida.
The Canadian regions are based on their defined provincialunits. The Asian/Oceanic regions consist of prefectures inJapan and defined city or provincial boundaries for mostother nations, as well as the inclusion of Taiwan, Singaporeand New Zealand as region-states. New regions includedthis year are predominately Chinese which reflects the ratesof economic growth in the country’s coastal areas. Theseare Guangdong province on the South coast of China, andJiangsu, Shandong and Zhejiang provinces, all on the eastcost of China. The region of Pearl River Delta, whichincludes Guangdong province, was dropped this yearbecause of better data availability at the provincial level,which better reflects the definition of the regional economic unit.
Selecting the Indicators
In deciding what indicators to use in our analysis, the keyconcern was to develop an analysis which incorporated dataavailable and comparable at the local, regional and nationallevels, thereby providing visible yardsticks of economicstrength and weaknesses that go beyond the usually narrowfocus on macroeconomic performance. To create a singlecomposite measure of regional competitiveness, a numberof different modes of creating the index, and the variables tobe included, were considered. In addition, the analysis thatfollows in later chapters also examines the associationbetween different variables, and links these variablesthrough a chain of inputs, outputs and outcomes, therebyattempting to reflect the link between macroeconomicperformance and the underlying sources of competitiveness,be it stocks or investments in knowledge, innovativecapacity, ICT infrastructure, financial capital, and so on. Inselecting the appropriate variables, consideration also had tobe given towards the overall ‘value’ of the indicators, andtheir relative effectiveness as a performance measure. Theselected variables analysed can be usefully divided into fivecomponents: human capital, financial capital, knowledgecapital, regional economy outputs and knowledgesustainability. The variables selected for the analysis are asfollows:
HUMAN CAPITAL COMPONENTS
Knowledge economies compete on value and innovation,rather than costs alone. As regions make the transition toknowledge economies, we would expect increases in thenumber and proportion of knowledge-based businesses andemployment. In general terms, higher levels of R&D activitymost often define knowledge-based sectors. Consequently,knowledge-based sectors have a higher potential forinnovation and competitive advantage. We consider thatdue to their requirements for R&D and innovation, thesesectors have a higher propensity for developing aknowledge-driven economy, and that the outputs from thesesectors are more likely to generate knowledge spillovers forthe rest of the regional economy. High activity rates andmanagerial density are also considered strong indicators ofthe strength of the human capital stock in a region. As such,human capital indicators are:
• Employment in IT and Computer Manufacturing per 1,000employees • Employment in Biotechnology and Chemicals per 1,000employees • Employment in Automotive and Mechanical Engineeringper 1,000 employees • Employment in Instrumentation and Electrical Machineryper 1,000 employees • Employment in High-Tech Services per 1,000 employees • Economic Activity Rate• Number of Managers per 1,000 employees
P:0
4In
trod
uctio
n

In this year’s report we have switched the denominator forthe human capital indicators (except for economic activityrate) from inhabitants to employees, as the latter shows amore accurate density of specific employment types incomparison to the total.
KNOWLEDGE CAPITAL COMPONENTS
Investment and employment in research and developmentactivities signal the strength of efforts to develop and exploitnew technology, software and ideas in order to enlarge theknowledge base. Similarly, the number of patents can beused to indicate how successful a region is in convertingknowledge into potentially commercially valuable productsand processes. By utilizing this range of innovationvariables we avoid the potential distortions that may beintroduced by looking at any individual variable in isolation.For example, while R&D expenditure provides a very goodindication of innovative activity, some sectors rely moreheavily on capital-intensive R&D activities than others. Acomposition of indicators seeks to dampens any distortions.As such, knowledge capital indicators are:
• Per Capita Expenditures on R&D performed byGovernment• Per Capita Expenditures on R&D performed by Business• Number of Patents Registered per one million inhabitants
REGIONAL ECONOMY OUTPUTS
Economic performance indicators are clearly vitalcomponents of competitiveness, and are usually the mostestablished and well-known measures used. The WKCIanalyses the following indicators of economic performance:
• Labour Productivity• Mean Gross Monthly Earnings• Unemployment Rates
FINANCIAL CAPITAL COMPONENTS
Without a high stock of human capital and innovationcapacity, a region will not be able to generate innovative newbusinesses. However, given the presence of such factorsthe commercialization of new ideas still relies on theavailability of finance, in particular venture capital finance,which can enable a region to maximise the returns on itsR&D and human capital investments. As such, the followingindicator is included in the WKCI:
• Per Capita Private Equity Investment
KNOWLEDGE SUSTAINABILITY
Future human and knowledge capital is embodied withinthose individuals currently undertaking education. Althoughstrong regions will be able to attract talent from elsewhere,in the long-term reinvestment of returns in local humancapital through education will help to ensure a region’sknowledge economy maintains a sufficient flow of humancapital. Likewise local investment in ICT infrastructure isalso fast becoming a necessity in order to transferknowledge effectively and efficiently in today’s electronicworld. As such, the following indicators of knowledgesustainability are included:
• Per Capita Public Expenditures on Primary and SecondaryEducation• Per Capita Public Expenditures on Higher Education• Secure Servers per one million inhabitants• Internet Hosts per 1,000 inhabitants• Broadband Access per 1,000 inhabitants
Creating the Composite World KnowledgeCompetitiveness Index
In order to create the composite World KnowledgeCompetitiveness Index all data are first converted so that themean and variance of each variable is set at zero and onerespectively. After the standardisation, a multivariate datareduction technique called factor analysis is applied to thedata set. Factor analysis is used to simplify complex anddiverse relationships that exist among a set of observedvariables by uncovering common dimensions or factors thatlink together the seemingly unrelated variables, andconsequently provide insights into the underlying structure ofthe data. In general, these dimensions are uncorrelated withone another.
To extract the common part of variations among the originalvariables (i.e. commonalities), an extraction method calledimage factoring is employed. The dimensions obtained arethen rotated. A rotation method called varimax is used withKaiser normalisation. While identifying common dimensionsof the underlying structure, factor analysis also shows thelocation of each case (i.e. region in this study) within theunderlying structure, by providing the case’s scores for thedimensions identified. We use these scores for thedimensions as sub-composite indices.
Subsequently, we aggregate these sub-composite indiceswith a view to obtaining a single composite. A quantitativeanalytical technique called Data Envelopment Analysis(DEA) is used to obtain a single composite index from theabove sub-composite indices. DEA is a linear programmingtechnique originally developed for the estimation of therelative efficiency of a set of units (called decision makingunits, DMUs) producing a set of outputs from commoninputs. It neither assigns weights to variables with anydependent variable chosen a priori, nor assigns weights seta priori. Instead, it seeks a set of weights for each unit thatmaximises a weighted sum of variables, with the constraintthat no units have a weighted sum larger than one. As aresult, each unit receives a score between 0 and 1. Thisprocess is repeated for all units in the data set, giving eachunit a score unique to each iteration. Finally a geometricmean of all the scores is taken for each unit, providing a DEAscore.
The DEA model can be stated as follows. Let xij (i = 1, ..., m)be the scores of m sub-composite indices for region j ( j = 1,..., n). A composite score of region j, denoted here as C, isthen maximised as:
Max Cj = ( V1 x1 + .... + Vm xmj)
subject to:
(V1 x1 + .... + Vm xmj) ≤ 1 j = 1, ...., n.
Vi > 0 for all i.
Let us denote the maximised composite score for region jas Cj (max j). While Cj (max j) is obtained for region j, otherregions also gain composite scores under the weightsV1, …,Vm that are set to maximise the region j’s score. Theycan be denoted as C1 (max j), C2 (max j), Cn…, (max j).
This maximisation process is undertaken for all regions inthe data set. As a result, each region receives n compositescores, one of which is obtained from maximisation of itsown composite score. Finally a geometric mean of Cj (max1), Cj (max 2), …, Cj (max j) …, Cj (max n) is taken for regionj, providing a DEA score of region j (j = 1, ..., n).
P:0
5In
trod
uctio
n

As noted above, DEA scores range from zero to one. Tofacilitate a more intuitive understanding, we convert DEAscores to ones whose average is 100 with a variance similarto variances of the original variables. For this, we firstconvert original variables so that their averages become 100(i.e. divide the scores of regions for each variable by itsaverage and then multiply them by 100). We then take ageometric mean of the variances of the converted variables,which we denote by (variance)original. Finally, we standardiseDEA scores for regions 1 to n, multiply them by(variance)original, and add 100. The obtained scores, whoseaverage equals 100, still maintain relative distance betweenregions but have a variance similar to the original variables.
In the following analysis and data presentation allscores are converted into the figures whose average is100, facilitating an intuitive understanding of theregions’ positions in our league table. Also, please notethe abbreviation n/a refers to a lack of relevant data.
A ranking change followed by * indicates a change in datasource or methodology that we now consider to be morereliable than that adopted in previous years.
P:0
6In
trod
uctio
n
CH
AP
TE
R O
NE

CH
AP
TE
R T
WO
Throughout this report we make the case that economiccompetitiveness should be analysed in terms of stocksand investments in knowledge, with a firm focus onregions. But why analyse regions? With advances intelecommunications and information technologiesallowing the instantaneous transfer of information,regardless of location, it might appear logical toconsider that geography would be an increasingly lessimportant issue in economic analysis. In fact, in anumber of ways the reverse is true. Whilst it hasbecome possible for firms and individuals to sourcework far more widely, the geographic concentration ofrelated resources and industries, in particular ofknowledge-intensive activities, remains one of the moststriking features of any nation or region, especially inthe most advanced economies. Furthermore, whilst thehistoric factors influencing location, such as proximityto inputs and markets, are being undercut, the ability tosource from anywhere is also, paradoxically, increasingthe importance of local competition - in many respects,globalisation is reinforcing localisation. This ‘locationparadox’ is explained by Michael Porter as follows:
Anything that can be efficiently sourced from a distance hasessentially been nullified as a competitive advantage inadvanced economies. Information and relationships thatcan be accessed through fax and email are available toeveryone. Although global sourcing mitigatesdisadvantages, it does not create advantages . . .paradoxically, the most enduring competitive advantages ina global economy seem to be local.
For Porter, these localised productivity advantages ofagglomeration, such as access to specialised inputs,employees, information, and institutions, will encouragefirms to cluster and reinforce these clusters over time, asnew firms become attracted by the same advantages ofconcentration. Also, many of the factors that increasecurrent productivity will also encourage innovation within thecluster, and therefore increase the productivity growth offirms. For example, access to specialised information viapersonal relationships will, over time, provide localisedadvantages for firms in perceiving new technologicalopportunities and new buyer needs. Thus, as traditionalforms of advantage become nullified, competitive advantagelying outside companies – that is, in the businessenvironment in which they are located – increase inimportance.
The growing theoretical support for this concept of localisedcompetition lends considerable weight to the use of bothdata analysis and a policy approach at the regional, ratherthan the national, level. This is not to dismiss the fact thatin some circumstances a ‘region’ still remains a somewhatarbitrary level of analysis, but given that we can neverpossibly define, let alone find data for, identically integratedeconomic areas, then clearly as a geographic unit ofanalysis the use of sub-national geographic units (‘regions’)will bring us much closer in line with the nature ofcompetition and the appropriate role of government ineconomic development activity.
P:0
7C
hapt
er 2
: The
Ran
king
s: W
orld
Kno
wle
dge
Com
petit
iven
ess
Inde
x 20
08
Chapter 2:The Rankings: World Knowledge Competitiveness Index 2008
2 Porter, M. (2000): ‘Location, Competition, and Economic Development: Local Clusters ina Global Economy’, Economic Development Quarterly, 14: 15-34.
World Knowledge Competitiveness Index 2008 Table 2.11
Rank Knowledge Competitiveness Rank ChangeIndex 2008 2005 in Rank
2005-08
1 San Jose-Sunnyvale-Santa Clara, US 248.3 1 0
2 Boston-Cambridge-Quincy, US 175.3 2 0
3 Hartford, US 175.1 4 1
4 Bridgeport-Stamford-Norwalk, US 174.7
5 San Francisco-Oakland-Fremont, US 160.8 3 -2
6 Stockholm, Sweden 151.8 8 2
7 Seattle-Tacoma-Bellevue, US 151.3 5 -2
8 Providence-Fall River-Warwick, US 147.1
9 Tokyo, Japan 147.0 22 13
10 San Diego-Carlsbad-San Marcos, US 146.1 7 -3
11 Los Angeles-Long Beach-Santa Ana, US 144.4 10 -1
12 Shiga, Japan 140.9 57 45
13 Grand Rapids, US 140.0 6 -7
14 Iceland 139.8
15 Detroit-Warren-Livonia, US 138.1 15 0
16 West, Sweden 137.9 37 21
17 Oxnard-Thousand Oaks-Ventura, US 137.1
18 Sacramento--Arden-Arcade--Roseville, US 133.6 11 -7
19 West, Netherlands 132.4 77 58
20 Pohjois-Suomi, Finland 132.1
Rank Knowledge Competitiveness Rank ChangeIndex 2008 2005 in Rank
2005-08
21 Minneapolis-St. Paul-Bloomington, US 131.7 13 -8
22 Portland-Vancouver-Beaverton, US 129.7 18 -4
23 Etela-Suomi, Finland 129.1 20 -3
24 Kanagawa, Japan 128.6 81 57
25 Durham, US 127.7
26 Colorado Springs, US 124.4
27 Singapore 123.1 78 51
28 Switzerland 122.5 44 16
29 Île de France, France 121.8 29 0
30 Toyama, Japan 120.5 80 50
31 Osaka, Japan 119.6 72 41
32 Riverside-San Bernardino-Ontario, US 119.3 16 -16
33 Philadelphia-Camden-Wilmington, US 117.7 17 -16
34 Luxembourg 116.9 58 24
35 New York-Northern New Jersey-Long Island, US 116.8 12 -23
36 Denmark 116.7 51 15
37 Tochigi, Japan 116.1 73 36
38 South, Sweden 115.2 46 8
39 Greensboro-High Point, US 113.5 40 1
40 Lansi-Suomi, Finland 112.5

P:0
8C
hapt
er 2
: The
Ran
king
s: W
orld
Kno
wle
dge
Com
petit
iven
ess
Inde
x 20
08
World Knowledge Competitiveness Index 2008 (continued) Table 2.11
Rank Knowledge Competitiveness Rank ChangeIndex 2008 2005 in Rank
2005-08
41 Washington-Arlington-Alexandria, US 112.4 23 -18
42 Austin-Round Rock, US 112.3 19 -23
43 Kyoto, Japan 111.9 96 53
44 Milwaukee-Waukesha-West Allis, US 111.2 24 -20
45 Denver-Aurora, US 110.7 14 -31
46 Chicago-Naperville-Joliet, US 109.4 28 -18
47 Brussels, Belgium 109.4 45 -2
48 Israel 109.3 86 38
49 Baltimore-Towson, US 108.9 27 -22
50 Rochester, US 108.8 9 -41
51 Shizuoka, Japan 106.8 71 20
52 Dallas-Fort Worth-Arlington, US 106.6 21 -31
53 Taiwan 106.5 99 46
54 Eastern, UK 106.1 62 8
55 Baden-Württemberg, Germany 106.0 54 -1
56 Aichi, Japan 105.6 75 19
57 Ostra Mellansverige, Sweden 105.3
58 Phoenix-Mesa-Scottsdale, US 103.3 38 -20
59 Buffalo-Niagara Falls, US 102.8 25 -34
60 Virginia Beach-Norfolk-Newport News, US 102.5 48 -12
61 East Netherlands 102.1
62 Cleveland-Elyria-Mentor, US 101.9 39 -23
63 Bayern, Germany 101.8 65 2
64 Indianapolis, US 101.7 32 -32
65 North, Netherlands 101.6 89 24
66 Raleigh-Cary, US 100.7 31 -35
67 Charlotte-Gastonia-Concord, US 100.7 41 -26
68 South, Netherlands 100.0 50 -18
69 Ulsan, Korea 100.0 113 44
70 Houston-Sugar Land-Baytown, US 99.9 26 -44
71 Richmond, US 99.9 33 -38
72 Pittsburgh, US 99.3 43 -29
73 Vlaams Gewest, Belgium 99.1 79 6
74 South East, UK 98.9 55 -19
75 Norway 98.6 52 -23
76 Ontario, Canada 98.5 66 -10
77 Hessen, Germany 97.9 67 -10
78 Columbus, US 96.0 30 -48
79 East, Austria 94.7 70 -9
80 Salt Lake City, US 94.3 34 -46
81 Akron, US 93.0
82 Hamburg, Germany 92.4 76 -6
83 Quebec, Canada 92.2 85 2
84 Southern and Eastern, Ireland 91.2
85 Alberta, Canada 91.0 98 13
86 Kansas City, US 90.0 42 -44
87 Centre-est, France 89.7 82 -5
88 San Antonio, US 89.4 47 -41
89 Cincinnati-Middletown, US 89.2 36 -53
90 Memphis, US 88.9 61 -29
91 St. Louis, US 88.8 49 -42
92 Nashville-Davidson--Murfreesboro, US 87.6 59 -33
93 Bremen, Germany 86.4 95 2
Rank Knowledge Competitiveness Rank ChangeIndex 2008 2005 in Rank
2005-08
94 Louisville, US 86.1 53 -41
95 Atlanta-Sandy Springs-Marietta, US 85.9 35 -60
96 Lombardia, Italy 85.7 84 -12
97 West, Austria 85.2 90 -7
98 Tampa-St. Petersburg-Clearwater, US 85.1 64 -34
99 Victoria, Australia 82.9 88 -11
100 North West, Italy 82.6 101 1
101 Smaland Medoarna, Sweden 81.8 97 -4
102 London, UK 81.4 56 -46
103 Orlando-Kissimmee, US 81.2 60 -43
104 New South Wales, Australia 81.2 91 -13
105 South West, UK 81.0
106 Jacksonville, US 80.8 63 -43
107 Seoul, Korea 80.7 120 13
108 Western Australia 80.5 93 -15
109 Las Vegas-Paradise, US 80.1 68 -41
110 Shanghai, China 79.4 112 2
111 Berlin, Germany 78.7 87 -24
112 British Columbia, Canada 77.4 105 -7
113 Nordrhein-Westfalen, Germany 77.4 94 -19
114 Sarasota-Bradenton-Venice, US 77.3
115 Miami-Fort Lauderdale-Miami Beach, US 76.4 69 -46
116 Niedersachsen, Germany 76.4 103 -13
117 Emilia-Romagna, Italy 75.4 102 -15
118 Manitoba, Canada 73.7 100 -18
119 North East, Italy 72.7 107 -12
120 Hong Kong 72.6 118 -2
121 Saskatchewan, Canada 72.3 104 -17
122 Oklahoma City, US 71.5
123 Lazio, Italy 70.4 106 -17
124 Scotland, UK 70.4 83 -41
125 Comunidad de Madrid, Spain 68.5 92 -33
126 Central, Italy 66.4 114 -12
127 Noreste, Spain 65.7 108 -19
128 Budapest, Hungary 65.5 121 -7
129 Schleswig-Holstein, Germany 64.8 109 -20
130 Tianjin, China 61.3 122 -8
131 Guangdong, China 60.4
132 Prague, Czech Republic 60.3 116 -16
133 Saarland, Germany 58.1 111 -22
134 New Zealand 55.1 110 -24
135 Beijing, China 48.9 119 -16
136 Bratislavsk_, Slovak Republic 48.8 117 -19
137 Estonia 43.9
138 Jiangsu, China 30.2
139 Lithuania 27.5
140 Zhejing, China 26.5
141 Latvia 20.8
142 Shandong, China 20.6
143 Mumbai, India 5.5 123 -20
144 Hyderabad, India 5.3 125 -19
145 Bangalore, India 5.0 124 -21

The scores and ranks for the World KnowledgeCompetitiveness Index (WKCI) 2008 are shown by Table2.1, which also highlights the change in ranks from the 2005index. The WKCI represents the overall picture for thebenchmarked regions, and the trends taking place acrossthese regions between the 2005 and 2008 reports.
Once again, at the top of the index is the US metropolitanarea of San Jose (248.3). The region, the home of SiliconValley, continues to lead the WKCI rankings by somedistance, due to its enormous investment in knowledge-intensive business development, in particular in the fields ofhigh-technology engineering, computers, andmicroprocessors. Despite the onset of the dot-com crashearlier in the decade, San Jose has remained a clear leaderacross a number of knowledge employment sectors, as wellas ranking amongst the top regions worldwide for investmentin education and business R&D, as well as for correspondingeconomic output indicators such as productivity andearnings. This is also supported by high quality researchfacilities (for example, Stanford University), which boosts theregions patents score, and heavy government investment inR&D (for example, NASA).
This all translates into San Jose being a highly developedand concentrated knowledge economy, as demonstrated bythe high levels of productivity, high earnings and very highemployment in sectors such as the IT and instrumentationmanufacturing industries. The recognised potential of theregion is further emphasised by the extent of the region’slead in private equity availability, a clear market signal thatSilicon Valley remains the place to invest when it comes tohigh-tech business opportunities. The success of San Jose,therefore, reflects an economy within which knowledge is anintegral part of production.
Remaining in second place in 2008 is the metropolitan areaof Boston (175.3), a region which thrives on high levels ofintellectual and financial capital. Boston, is of course,synonymous with higher education, and is home to eightresearch universities including Harvard and theMassachusetts Institute of Technology. It is estimated thatthe direct impact of these universities adds an extraUS$7.4bn to regional economic output. The indirect impactsin terms of skills, innovation and interaction with businessare less easy to quantify, but are evident in the region’s highranking for research and development activity and patentregistration.
Hartford (175.1) moves further up the index to third, with itsscore boosted by very strong results for both R&D spendingand private equity investment, which translate into a verystrong productivity score: Hartford ranks as the highestregion worldwide by productivity in our rankings. Theneighbouring Connecticut region of Bridgeport (174.7), anew region in this year’s index, enters in an impressivefourth place while San Francisco (160.8) slips two places tofifth. These top five regions between them underline thesignificant concentration of knowledge competitiveness innorthern California and Southern New England.
Nevertheless, while the US regions remain out in front at thetop of the rankings this year’s WKCI also suggests a furtherstrengthening of competitiveness in the leading knowledgecentres outside of the US. In the 2004 WKCI the topfourteen positions on the index were taken by US regions,and in 2005 it was the top seven, while this year that figurehas been reduced to the top five due to the continued rise ofStockholm (151.8), which climbs again up to sixth position.The continued improvement of Stockholm’s ranking has
been based on gains across a range of indicators. Thiscatch-up with the leading US regions is not confined toStockholm either: Tokyo (147.0) moves up very strongly thisyear to ninth position, while Shiga (140.9), West Sweden(137.9) and West Netherlands (132.4) all move into the toptwenty. The new regions of Iceland (139.8) and Pohjois-Suomi (132.1) also enter in the top twenty, which nowcontains thirteen US regions, five European regions and twoJapanese regions.
While the US continues to be most prominent at the top ofthe rankings, it is hard to find too many US regions that haverisen by more than a few places, which suggests that thegap with Europe and Asia is beginning to narrow, if notacross the board then at least amongst the leading globalknowledge centres. Looking at the top 50 in the rankingsthe majority of the rising regions are European or Asia-Pacific: notable examples include Singapore, which movesup to 27th, and the Western European region-states ofSwitzerland, Denmark and Luxembourg, which all move upstrongly in the top 50.
The Japanese regions are also noticeable for theirimprovements this year (which partly reflects the use of morecomparable employment statistics which had previouslyunder-estimated relative productivity of the Japaneseregions).3 Tokyo continues to lead amongst the Japaneseregions by some way, due to its strong employment figuresfor high-tech services along with very high patenting ratesand strong output indicators, in particular earnings. Thestrength of other leading Japanese regions, such as Shiga(9th) and Kanagawa (24th) reflects regional economies thatare concentrated around niche knowledge sectors. Shiga,for example, ranks top amongst all regions forinstrumentation and electrical engineering employment, andsecond only to San Jose for IT and computer manufacturing.
At the bottom of the WKCI rankings we continue to find theChinese, Indian and Eastern European regions – the lowestranked being Bangalore, Mumbai and Hyderabad (123rd).Amongst the emerging regions in the index, Shanghaicontinues to perform best, increasing its ranking one againdespite the entry of twenty new regions, mostly from Europeand the US. Shanghai is now ahead of the likes of Berlinand British Columbia, which shows how far the mostdeveloped amongst the Chinese regions has come in recentyears. It is also worth noting the size of the economies thisrelates to, e.g. the Shanghai population is now over 20million people. This indicates that the advances in absoluteterms we are seeing are very significant.
The only other regions to move up in the bottom fifty areSeoul, which gains thirteen places, and North West Italy,which gains one place. At the bottom of the index theprogress of the newly included Baltic regions – Latvia,Lithuania and Estonia – will be interesting to follow, giventhe rapid increase in knowledge investments in thesecountries following the end of the Soviet era, and EUenlargement.
Taking a more comprehensive look at relative regionalperformance and change since 2005, Figure 2.1 provides arepresentation of how each region (grouped by NorthAmerica, Europe and Asia-Pacific regions) benchmarked byWKCI performs in terms of overall index value and changein rank between 2005 and 2008. The trends highlighted
P:0
9C
hapt
er 2
: The
Ran
king
s: W
orld
Kno
wle
dge
Com
petit
iven
ess
Inde
x 20
08
3 Full-time equivalent (FTE) employment statistics were used for Japan in 2005, howeversince it is not considered feasible to accurately estimate FTE data for all European and USregions FTE statistics have not been used for any regions in this year’s index
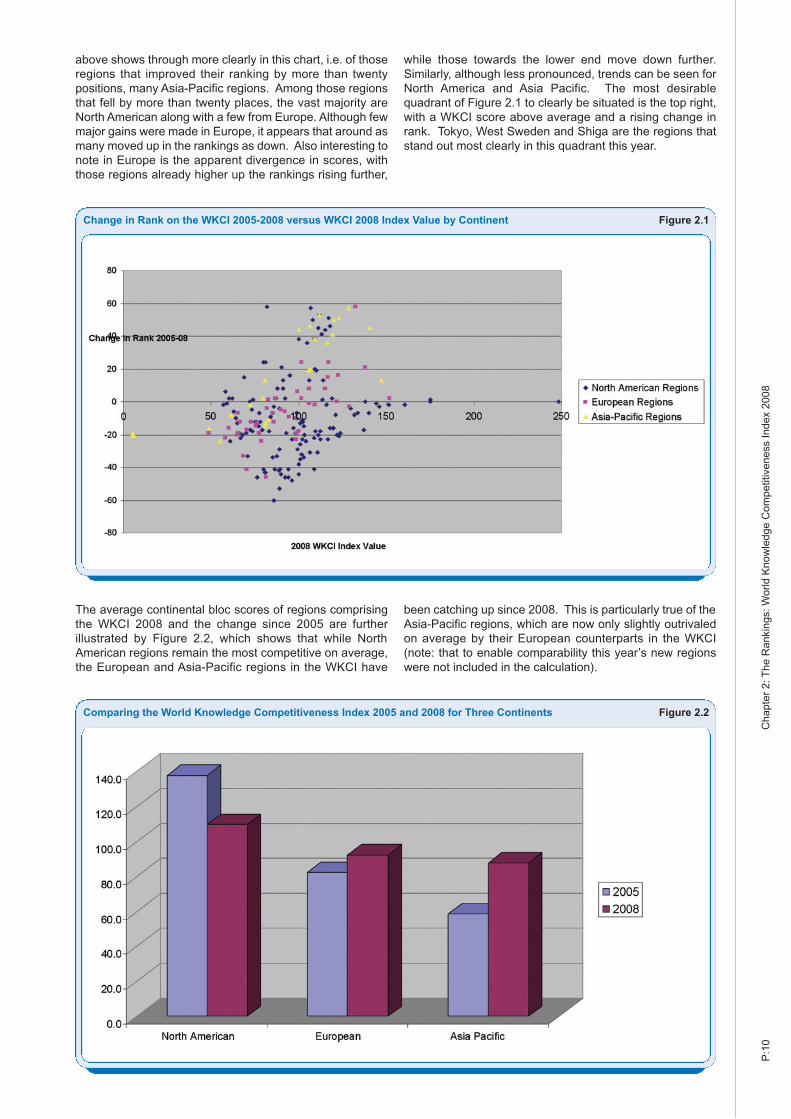
above shows through more clearly in this chart, i.e. of thoseregions that improved their ranking by more than twentypositions, many Asia-Pacific regions. Among those regionsthat fell by more than twenty places, the vast majority areNorth American along with a few from Europe. Although fewmajor gains were made in Europe, it appears that around asmany moved up in the rankings as down. Also interesting tonote in Europe is the apparent divergence in scores, withthose regions already higher up the rankings rising further,
while those towards the lower end move down further.Similarly, although less pronounced, trends can be seen forNorth America and Asia Pacific. The most desirablequadrant of Figure 2.1 to clearly be situated is the top right,with a WKCI score above average and a rising change inrank. Tokyo, West Sweden and Shiga are the regions thatstand out most clearly in this quadrant this year.
The average continental bloc scores of regions comprisingthe WKCI 2008 and the change since 2005 are furtherillustrated by Figure 2.2, which shows that while NorthAmerican regions remain the most competitive on average,the European and Asia-Pacific regions in the WKCI have
been catching up since 2008. This is particularly true of theAsia-Pacific regions, which are now only slightly outrivaledon average by their European counterparts in the WKCI(note: that to enable comparability this year’s new regionswere not included in the calculation).
P:1
0C
hapt
er 2
: The
Ran
king
s: W
orld
Kno
wle
dge
Com
petit
iven
ess
Inde
x 20
08
Change in Rank on the WKCI 2005-2008 versus WKCI 2008 Index Value by Continent Figure 2.1
Comparing the World Knowledge Competitiveness Index 2005 and 2008 for Three Continents Figure 2.2

When we look at continental bloc comparisons acrossindicators, it is also clear that there are significant variationsin the economic development models at work across theglobe. The US regional development framework is far morereliant upon its investments in knowledge sustainability, inthe form of educational expenditure and ICT infrastructure.Asian-Pacific regions tend to place a greater emphasis on
mobilising human capital already within the workforce andinvestment in business-based innovation. Europe’s modelappears to be an under-performing version of that operatingwithin the North American regions.
Figure 2.3 breaks down further the inter-continental scoresfor those variables where data is available at the regional
P:1
1C
hapt
er 2
: The
Ran
king
s: W
orld
Kno
wle
dge
Com
petit
iven
ess
Inde
x 20
08
Comparing Knowledge Competitiveness Factor by Continental Bloc (Individual Variables) Figure 2.3
Econo
mic
Activi
ty R
ate
Numbe
r of M
anag
ers
Empl
oym
ent i
n IT
and
Com
pute
r Man
ufac
turin
g
Empl
oym
ent i
n Bio
tech
& C
hem
icals
Empl
oym
ent i
n Aut
omat
ive a
nd M
echa
nica
l Eng
inee
ring
Empl
oym
ent i
n in
stru
men
tatio
n an
d Ele
ctric
al M
achi
nery
Empl
oym
ent i
n Hig
h-Te
ch S
ervic
es
Per C
apita
Exp
endi
ture
on
R&D by
Gov
ernm
ent
Per C
apita
Exp
endi
ture
on
R&D by
Busin
ess
Numbe
r of P
aten
ts R
egist
ered
Privat
e Equ
ity $
Per
Cap
ita
Labo
ur P
rodu
ctivi
ty
Mea
n G
ross
Mon
thly
Earni
ngs
Unem
ploy
men
t rat
e
Public
Exp
endi
ture
s on
Prim
ary
and
Secon
dary
Edu
catio
n
Public
Exp
endi
ture
s on
Hig
her E
duca
tion
Relationship between GDP per capita and World Knowledge Competitiveness Index 2008 Figure 2.4

level, and therefore highlights inter-continental differencesat the level of individual indicators. The figure shows thatthe leading European and Asian-Pacific regions outperformUS regions in employment terms across a number of high-tech sectors. Asia-Pacific is particularly strong in IT andComputer Manufacturing, while both continents scoresignificantly higher than North America in Instrumentationand Electrical Machinery. North America’s strength comesfrom its spending on R&D and education, which is alsoemphasised by its higher patenting levels. Higher levels ofprivate equity are also a notable North American advantage.In terms of economic output, Asia-Pacific attains lowerscores than North America and Europe for labourproductivity and earnings, and also lags behind NorthAmerica and Europe in education expenditures.
Although North American regions do not show particularstrength in input factors, they have the highest scores foreconomic output and knowledge sustainability factors,indicating their higher capability of transferring knowledgeinputs into outputs, and the ability to establish sustainablegrowth. National level statistics also show that North Americais the leading continent in terms of ICT infrastructure,providing excellent support for moving knowledge effectivelyand efficiently within and across regions.
Figure 2.4 highlights the association between GDP percapita and the World Knowledge Competitiveness Indexacross the 145 regions. The high r-squared statistic (i.e.coefficient of determination) of 0.46 indicates the importanceof knowledge competitiveness to achieving the wealth andprosperity of regions.
Data from previous editions of the WKCI allows us to look atwhich regional economies have been growing most stronglyover this period. In presenting this data we acknowledgethat, particularly in the US, regional statistical boundarieshave changed somewhat and therefore we cannot comparegrowth across all regions. However, looking at those regionsthat have remained spatially consistent does provide aninsight into which regions have been growing most stronglyin per capita economic terms over the four years duringwhich this index has been produced.
As shown by Table 2.2, the Korean regions have beengrowing particularly strongly since the WKCI 2003. whichhas resulted in strong performances from both Ulsan andSeoul in this year’s composite WKCI. In first place, Seoulhas grown by a cumulative 47 percent over the four yearperiod analysed, while Ulsan, in third place, has grown byover 34 percent. This substantial growth rate partly reflectsa recovery from the Asian financial crisis, but also continuedstrong performance in high-tech, high value added sectors.These two regions are divided by Western Australia, whichhas grown by over 40 percent. Also performing impressivelyare the Eastern European regions of Bratislavsk_ and Prahain fourth and fifth place respectively, clearly benefitingsignificantly from increased investment following the EUenlargement. In Western Europe, Luxembourg and Londonlead the way. In both regions recent growth has been fuelledto a large extent by very strong financial services sectorperformance. In the US, Washington DC has shown thebest performance of any city thanks to continued highgovernment expenditure, particularly in the defence sector.However, it should be noted that the reclassification of the
P:1
2C
hapt
er 2
: The
Ran
king
s: W
orld
Kno
wle
dge
Com
petit
iven
ess
Inde
x 20
08
Cumulative growth in GDP per Capita, 2003-08 – Top 50 Regions Table 2.2
Rank Region GDP per Capita – Cumulative WKCI 2008 (US$) Growth WKCI
2003-08
1 Seoul, Korea 22,300 47.0%
2 Western Australia 36,785 40.2%
3 Ulsan, Korea 46,227 34.2%
4 Bratislavsk_, Slovak Republic 32,103 33.5%
5 Praha, Czech Republic 39,011 31.3%
6 Victoria, Australia 32,336 31.0%
7 Hong Kong 34,200 30.9%
8 Luxemburg 62,330 29.9%
9 London, UK 46,815 29.7%
10 Washington-Arlington-Alexandria, US 53,335 28.5%
11 Taiwan 28,369 28.0%
12 Virginia Beach-Norfolk-Newport News, US 45,239 27.2%
13 Shizuoka, Japan 30,086 25.4%
14 Toyama, Japan 29,628 24.1%
15 Noreste, Spain 29,599 23.7%
16 Las Vegas-Paradise, US 42,590 23.1%
17 Greensboro--High Point, US 47,646 22.4%
18 Scotland, UK 29,173 22.2%
19 South East, UK 33,002 21.5%
20 Buffalo-Niagra Falls, US 48,689 21.5%
21 Comunidad de Madrid, Spain 32,813 21.5%
22 Singapore 27,800 20.4%
23 Kyoto, Japan 26,486 20.1%
24 Noord-Nederland, Netherlands 29,933 20.0%
25 Zuid-Nederland. Netherlands 31,178 19.8%
Rank Region GDP per Capita – Cumulative WKCI 2008 (US$) Growth WKCI
2003-08
26 Rochester, US 48,381 19.7%
27 Aichi, Japan 34,112 19.5%
28 Milwaukee-Waukesha-West Allis, US 41,561 19.2%
29 Alberta, Canada 47,146 18.9%
30 Los Angeles-Long Beach-Santa Ana, US 45,057 18.5%
31 Saskatchewan, Canada 32,200 18.4%
32 Philadelphia-Camden-Wilmington, US 43,780 18.2%
33 Lazio, Italy 32,731 18.0%
34 Kanagawa, Japan 25,661 17.7%
35 Vlaams Gewest, Belgium 30,593 17.4%
36 Salt Lake City,US 41,673 17.3%
37 West-Nederland, Netherlands 35,523 17.2%
38 Tochigi, Japan 28,452 16.8%
39 San Diego, US 46,388 16.6%
40 Seattle, US 48,909 16.5%
41 Brussels, Belgium 61,641 15.3%
42 New Zealand 23,200 15.0%
43 Pittsburgh, US 38,670 14.9%
44 Detroit-Warren-Livonia, US 39,254 14.8%
45 Tampa-St. Petersburg-Clearwater, US 38,814 14.8%
46 Eastern, UK 29,288 14.8%
47 Miami-Fort Lauderdale-Miami Beach, US 34,425 14.6%
48 Nord Ovest, Italy 32,760 14.5%
49 Osaka, Japan 31,501 14.2%
50 British Columbia, Canada 29,994 14.1%

CH
AP
TE
R T
WO
MSA boundaries excluded a number of major cities from thiscomparison, including New York, San Francisco and Boston.Likewise, the Indian and Chinese regions, which we wouldhave expected to have seen towards the top of this table,were unable to be included due to incomparable databetween 2003-08.
Knowledge Intensity
The World Knowledge Competitiveness Index allows us tounderstand the relative means by which regions are able tocompete in terms of their overall knowledge capacity,capability and utilisation. However, it does not tell us howinfluential these factors are compared with the overalleconomic performance and capacity of each region. In orderto go someway towards analysing this influence we haveestablished the Regional Ratio of Knowledge Intensity,which is calculated on the basis of each region’s WorldKnowledge Competitiveness Index score relative to its indexof GDP per capita. Knowledge intensity is simply the ratio ofKnowledge Competitiveness/GDP per capita. As such, thismeasure compares the underlying knowledge base of aregion in relation to its direct economic output and, as such,can arguably be used to some extent as an indicator offuture economic potential.
Such a measure is the best available derivative of therelative importance of knowledge and knowledge-basedactivities to the overall economic performance and structureof each region. As shown by Table 2.2, the highest Ratio ofKnowledge Intensity is found in the new region ofGuangdong, China (2.40), followed by Israel (1.82) andPohjois-Suomi (1.81). San Jose, the leader in 2005, slipsslightly to sixth place (1.84). The top twenty regions showsa significant diversity, with Japanese, Chinese, Swedish andFinnish regions all ranking particularly high under thismeasure. North American regions perform less well, withonly San Jose making the top twenty.
The following chapters unpack the scores for the regions forthe individual variables constituting the WKCI.
P:1
3C
hapt
er 2
: The
Ran
king
s: W
orld
Kno
wle
dge
Com
petit
iven
ess
Inde
x 20
08
Regional Ratio of Knowledge Intensity in 2008, Top 50 Regions Table 2.2
Rank Region Index Change in Rank 2008 2008 2005-08
1 Guangdong, China 2.40
2 Israel 1.82 39
3 Pohjois-Suomi, Finland 1.81
4 Kanagawa, Japan 1.74 49
5 West, Sweden 1.69 1
6 San Jose-Sunnyvale-Santa Clara, US 1.65 -5
7 Tianjin, China 1.64 111
8 Shiga, Japan 1.62 16
9 Lansi-Suomi, Finland 1.54
10 Singapore 1.53 30
11 Iceland 1.49 -11
12 Kyoto, Japan 1.46 66
13 South, Sweden 1.46 -4
14 Ostra Mellansverige, Sweden 1.45
15 Shanghai, China 1.43 86
16 Tochigi, Japan 1.41 34
17 Toyama, Japan 1.41 55
18 Etela-Suomi, Finland 1.35 -5
19 Osaka, Japan 1.32 43
20 Beijing, China 1.31 94
21 Denmark 1.31 4
22 Taiwan 1.30 55
23 Providence-Fall River-Warwick, US 1.29
24 East Netherlands 1.29
25 West, Netherlands 1.29 60
Rank Region Index Change in Rank 2008 2008 2005-08
26 Stockholm, Sweden 1.28 -24
27 Riverside-San Bernardino-Ontario, US 1.27 -17
28 Switzerland 1.26 -10
29 Eastern, UK 1.25 -3
30 Seoul, Korea 1.25 89
31 Shizuoka, Japan 1.23 23
32 Detroit-Warren-Livonia, US 1.22 -21
33 Oxnard-Thousand Oaks-Ventura, US 1.20
34 Portland-Vancouver-Beaverton, US 1.20 -20
35 North, Netherlands 1.18 47
36 Boston-Cambridge-Quincy, US 1.16 -31
37 Quebec, Canada 1.15 44
38 Centre-est, France 1.14 28
39 Baden-Württemberg, Germany 1.13 -10
40 San Francisco-Oakland-Fremont, US 1.13 -32
41 Grand Rapids, US 1.12 -37
42 Vlaams Gewest, Belgium 1.12 25
43 Jiangsu, China 1.12
44 South, Netherlands 1.11 -28
45 Los Angeles-Long Beach-Santa Ana, US 1.11 -30
46 Estonia 1.10
47 Bridgeport-Stamford-Norwalk, US 1.09
48 San Diego-Carlsbad-San Marcos, US 1.09 -45
49 Berlin, Germany 1.08 9
50 Sacramento--Arden-Arcade--Roseville, US 1.08 -38

P:1
4C
hapt
er 3
: Hum
an C
apita
l Com
pone
nts
Chapter 3:Human Capital Components
CH
AP
TE
R T
HR
EE
Economic Activity - Top Twenty Regions in 2008 Table 3.1
Rank Region Index Change in Rank2008 2003-08
1 Iceland 128.7
2 Stockholm, Sweden 121.5 5
3 Minneapolis-St. Paul-Bloomington, US 120.6 0
4 Alberta, Canada 117.1 8
5 Salt Lake City, US 116.4 1
6 Denver-Aurora, US 116.4 5
7 Austin-Round Rock, US 115.4 -3
8 Norway 115.3 11
9 West, Sweden 115.3 25
10 Indianapolis, US 114.0 10
Rank Region Index Change in Rank 2008 2003-08
11 Washington-Arlington-Alexandria, US 113.7 14
12 Cleveland-Elyria-Mentor, US 113.2 49
13 Dallas-Fort Worth-Arlington, US 111.8 -4
14 Atlanta-Sandy Springs-Marietta, US 111.5 -4
15 Smaland Medoarna, Sweden 111.2 22
16 Columbus, US 111.0 1
17 Boston-Cambridge-Quincy, US 110.8 21
18 Raleigh-Cary, US 110.5 -3
19 Charlotte-Gastonia-Concord, US 110.2 -5
20 Grand Rapids, US 110.2 -15
Economic activity, or participation, rates measure theavailability of human capital in an economy. A healthylevel of human capital input is necessary for a high levelof knowledge production and provides a basis forfurther knowledge investment. In addition, high levelsof activity suggest that the benefits of the productionprocess are spread widely across the population. Highparticipation, therefore, is necessary not only forknowledge economy production, but also for a vibrantand cohesive society. A low level of activity suggests alack of social and economic inclusion, and a higheconomic dependency burden across society as awhole.
While demographic factors are particularly important, thelevel of activity is also determined by the openness andflexibility of the labour market, the effects of the socialsecurity and welfare systems, and a mix of demographic andcultural factors. Effective labour market and welfare systemsallow the greatest possible freedom and opportunity forpeople to be economically active, and take full advantage ofthe demographic context.
Straight in at the top of the economic activity rankings (seeTable 3.1) is Iceland (index score of 128.7), one of the newWKCI regions this year. Iceland enjoys a persistent excessdemand for labour, resulting in negligible unemployment andhigh activity rates amongst both men and women of all ages.In second place is Stockholm (121.5), another economicallyvibrant region whose economic activity rate ranking hasbeen steadily improving, which has also been the case inWest Sweden (115.3) and Smaland Medoarna (111.2).Outside of northern Europe the top of the index is dominatedby North American regions, with Minneapolis (120.6) in thirdposition and Alberta (117.1) in fourth. An interestingobservation for this index is the seeming climatic influenceon activity rates, with the vast majority of the top twentybeing located in relatively high-latitude regions. In the US,of course, this is quite evident in the prevalence of southerlymigration amongst retirees.
As shown in Table 3.2, Western Australia (108.1) ranks topamongst the Asia-Oceania regions, which as a group rankrelatively low for this indicator. The Japanese and Chineseregions have both tended to see their rankings declining,although in the latter case this is influenced to a considerableextent this year by the availability of more accurate data.
(Labour Force as a percentage of working age population)
Economic Activity - Top Twenty Asia-Oceania Regions in 2008 Table 3.2
Rank Region Index Change in Rank2008 2005-08
1 Western Australia 108.1 -2
2 Zhejing, China 106.7 -
3 Israel 106.1 60
4 New Zealand 106.1 -22
5 Victoria, Australia 102.6 -18
6 Shizuoka, Japan 101.2 22
7 Singapore 101.0 -35
8 Toyama, Japan 100.0 23
9 Aichi, Japan 100.0 24
10 New South Wales, Australia 99.7 -26
Rank Region Index Change in Rank 2008 2005-08
11 Tochigi, Japan 98.9 19
12 Ulsan, Korea 97.8 -30
13 Beijing, China 97.7 -91
14 Shiga, Japan 97.3 21
15 Seoul, Korea 96.3 -40
16 Kanagawa, Japan 95.4 10
17 Kyoto, Japan 93.0 8
18 Taiwan 92.2 -29
19 Osaka, Japan 91.7 5
20 Tokyo, Japan 91.1 -17
(Labour Force as a percentage of working age population)

The number of managers per 1000 employees providessome indication of the concentration of knowledge workersin an economy. Managers, professionals and high-endtechnical workers are a vital part of the knowledgeproduction process. There is increasing recognition of therole played by these workers as a source of innovation andwhose responsibility it is to stimulate investment and growth.These workers include the ‘creative class’ of employeeswhose value is specifically their intelligence. Althoughknowledge workers have a role to play in all industries,
clusters are usually found in new industries and highlyknowledge-intensive industries and services. Managers areusually the employees that find efficient ways of working withnew technology, and are a vital stimulus in the diffusion ofsuch technologies. Their importance is recognised by thefact these workers not only provide the highest value-addedto an economy but also receive the highest level of financialremuneration.
Overall this is an index dominated by the European regions,which are found in fifteen of the top twenty places in therankings. Top of these are the UK regions of Eastern (520.0)
P:1
5C
hapt
er 3
: Hum
an C
apita
l Com
pone
nts
Number of Managers - Top Twenty European Regions in 2008 Table 3.3
Change in RankIndex 2005-08 (based on
Rank Top 20 European Regions 2008 all 145 regions)
1 Eastern, UK 520.0 4
2 South East, UK 350 0
3 South Netherlands 344.0 -2
4 Southern and Eastern, Ireland 296.1 -
5 Budapest, Hungary 242.8 -
6 North West, Italy 232.7 56*
7 Île de France, France 224.2 0
8 Estonia 208.9 -
9 South West, UK 201.2 -
10 Pohjois-Suomi, Finland 200.2 -
Change in RankIndex 2005-08 (based on
Rank Top 20 European Regions 2008 all 145 regions)
11 Vlaams Gewest, Belgium 197.5 7
12 Emilia-Romagna, Italy 197.1 87*
13 Lombardia, Italy 197.1 68*
14 Comunidad de Madrid, Spain 172.3 -9
15 East Netherlands 171.7 -
16 Bratislavský, Slovak Republic 171.0 -15
17 Prague, Czech Republic 163.1 -11
18 Latvia 161.3 -
19 Baden-Württemberg, Germany 155.6 -5
20 Etela-Suomi, Finland 154.5 24
(Managers per 1000 employees)
Number of Managers - Top Twenty North American Regions in 2008 Table 3.4
Change in RankIndex 2005-08 (based on
Rank Top 20 North American Regions 2008 all 145 regions)
1 Ontario, Canada 188.0 -4
2 British Columbia, Canada 181.7 0
3 Alberta, Canada 171.3 -6
4 Quebec, Canada 156.7 -3
5 Manitoba, Canada 144.9 -5
6 Saskatchewan, Canada 139.2 1
7 San Jose-Sunnyvale-Santa Clara, US 127.4
8 Boston-Cambridge-Quincy, US 115.1 -16
9 Atlanta-Sandy Springs-Marietta, US 109.1 -1
10 Washington-Arlington-Alexandria, US 104.5 -23
Change in RankIndex 2005-08 (based on
Rank Top 20 North American Regions 2008 all 145 regions)
11 Nashville-Davidson--Murfreesboro, US 100.5 -11
12 San Francisco-Oakland-Fremont, US 100.0 -5
13 Baltimore-Towson, US 95.2 -20
14 Memphis, US 92.0 -7
15 Raleigh-Cary, US 90.1 -18
16 Hartford, US 89.9 -2
17 Oklahoma City, US 88.5
18 Chicago-Naperville-Joliet, US 87.5 -15
19 Charlotte-Gastonia-Concord, US 87.3 -21
20 Bridgeport-Stamford-Norwalk, US 85.8
(Managers per 1000 employees)
Number of Managers - Top Twenty Asia-Oceania Regions in 2008 Table 3.4
Change in RankIndex 2003-08 (based on
Rank Top 20 Asia-Oceania Region 2008 all 145 regions)
1 Singapore 190.9 16
2 Hong Kong 130.5 55
3 New South Wales, Australia 117.4 -23
4 Israel 93.4 6
5 Taiwan 93.4 8
6 Western Australia 88.6 -43
7 Guangdong, China 49.0 -
8 Seoul, Korea 47.9 -
9 Shanghai, China 45.6 -
10 Ulsan, Korea 39.9 -
Change in RankIndex 2003-08 (based on
Rank Top 20 Asia-Oceania Region 2008 all 145 regions)
11 Tianjin, China 39.3 -
12 Bangalore, India 36.7 -39
13 Mumbai, India 36.7 -41
14 Hyderabad, India 36.7 -40
15 Tokyo, Japan 30.3 -68
16 Toyama, Japan 26.6 -52
17 Osaka, Japan 24.2 -56
18 Kanagawa, Japan 24.1 -61
19 Aichi, Japan 22.8 -51
20 Kyoto, Japan 22.5 -62
(Managers per 1000 employees)
P:1
6C
hapt
er 3
: Hum
an C
apita
l Com
pone
nts
and South East (350.0) England, which have both been inthe top five since WKCI 2003 and are two of the mosteconomically productive regions of the UK. As Table 3.3shows, a number of the new European regions also scorevery well for this indicator, including Estonia (208.9), Pohjois-Suomi (200.2) and Latvia (161.3) (a number of Italianregions also perform strongly on the basis of an alteration inthe classification of the underlying data).
In North America, the Canadian regions perform best for thisindicator, with Ontario (188.0) and British Columbia (181.7)both ranking in the top fifteen regions overall. Of the USregions, the overall leading WKCI region San Jose (127.4)and Boston (115.1) are at the head of the field, which
suggests that, although the US labour market seems to relyon a lower percentage of managerial positions than inEurope and Canada, there is still a strong correlation at theregion level between density of managers andcompetitiveness with in the US.
In Asia-Oceania, Singapore (190.9) remains by far thehighest ranked region for numbers of managers peremployee, continuing to benefit from an inflow of managerialworkers from abroad. Hong Kong (130.5) and New SouthWales (117.4) also rank above the index average.Elsewhere rankings are generally low, particularly in Japanwhere the corporate structure, which lends itself to lowerlabour mobility within relatively large corporations, leads to
a lower ratio of managers to workers than elsewhere.
Knowledge-Based Sectors and Employment
Knowledge economies compete on value and innovation,rather than costs alone. As regions make the transition toknowledge economies, we would expect increases in thenumber and proportion of knowledge-based employment. Inorder to analyse knowledge-based employment, we haveestablished five broad groups of knowledge-based activity.Knowledge-based sectors are those sectors characterisedby concentrations of high-end technology and intelligence,with the production process requiring high levels ofinvestment and innovation. Firms in such industries deploya significantly higher proportion of their resources toresearch and development and often provide increasedvalue-added in terms of generating wealth. Overall, thesesectors have the most ‘knowledge intensive’ productionprocesses, with the importance of innovation and theefficiency of production providing an opportunity forcompetitive advantage to exist between regions. Theoutputs from these knowledge-intensive sectors can alsoincrease productivity in other economic sectors and supportthe diffusion of knowledge.
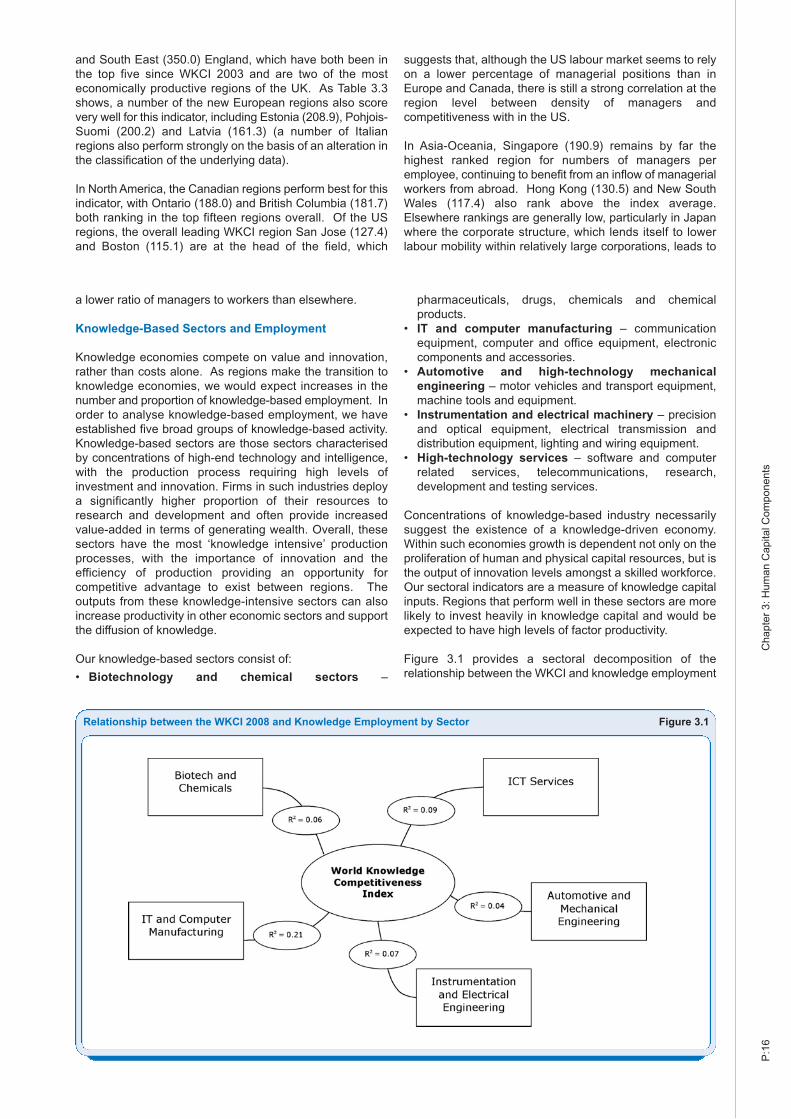
Our knowledge-based sectors consist of:
• Biotechnology and chemical sectors –
pharmaceuticals, drugs, chemicals and chemicalproducts.
• IT and computer manufacturing – communicationequipment, computer and office equipment, electroniccomponents and accessories.
• Automotive and high-technology mechanicalengineering – motor vehicles and transport equipment,machine tools and equipment.
• Instrumentation and electrical machinery – precisionand optical equipment, electrical transmission anddistribution equipment, lighting and wiring equipment.
• High-technology services – software and computerrelated services, telecommunications, research,development and testing services.
Concentrations of knowledge-based industry necessarilysuggest the existence of a knowledge-driven economy.Within such economies growth is dependent not only on theproliferation of human and physical capital resources, but isthe output of innovation levels amongst a skilled workforce.Our sectoral indicators are a measure of knowledge capitalinputs. Regions that perform well in these sectors are morelikely to invest heavily in knowledge capital and would beexpected to have high levels of factor productivity.
Figure 3.1 provides a sectoral decomposition of therelationship between the WKCI and knowledge employment
Relationship between the WKCI 2008 and Knowledge Employment by Sector Figure 3.1

P:1
7C
hapt
er 3
: Hum
an C
apita
l Com
pone
nts
for regions in the European Union-15 member states.Although all sectors are positively correlated with the mainindex, the most significant relationship is with the IT andcomputer manufacturing sector. Although many of the othersectors show relatively low levels of correlation, therelationship between the sum of employment in theseknowledge sectors and the WKCI has a sample R-squaredvalue of 0.21. This suggests that regional specialisation maybe significant: i.e. a competitive region may become highlyspecialised in one or perhaps two knowledge sectors, butnot all, thereby dampening the relationship between any onearea of activity and overall knowledge competitiveness. Forthis reason, the WKCI covers a range of sectors, the inputsfor which can be considered knowledge-intensiveIt should be noted that this year the denominator for theknowledge employment data has been changed frompopulation (sector employment per 1,000 inhabitants) toemployment (sector employees per 1,000 total employees)in order to give a better indication of knowledge employment‘density’ based on the overall workforce rather thanpopulation. Therefore, it should be kept in mind that rankingchanges from 2005 to 2008 under these indicators are likelyto reflect, in part, the change in denominator.
Biotechnology and chemicals production requires a highlyskilled workforce. This is particularly true in the moredeveloped economies where production tends to beconcentrated on niche chemicals. This year the metropolitanarea of Durham (476.4) enters the index in first position.Sometimes referred to as the “City of Medicine”, Durham is
a major US healthcare centre, home to more than 300medical and health-related companies and medicalpractices, as well as the nationally renowned ResearchTriangle Park, as well as number of major universitiesincluding Duke. In second place is Rochester (422.9), a cityin upstate New York that is home to more than 70 biotechcompanies, with a particular concentration in vision scienceand medical imaging. The city is a new entrant at the top thebiotech index on the basis of data for this sector now beingavailable for Rochester at the MSA level. These two citiesare well ahead of the Japanese biotech centre of Toyama(272.6) in third place, while last year’s leader Indianapolis(263.1), home to the huge Eli Lilly pharmaceuticalcorporation, moves down in the rankings to fifth.
Analysing the WKCI biotechnology and chemical sectorindex as a whole, it is interesting to see that there are largeintra-national variations in employment, showing thatbusiness clustering in this sector appears to be taking placevery much on a regional, rather than a national, basis. Thislends support to the importance of competition at theregional level in innovative, knowledge-intensive sectors.There is also no major continental domination of the industry,as shown by Table 3.5, which demonstrates a relatively evengeographic distribution between North America, Europe andAsia.
IT and computer manufacturing is another high value-addedindustry and continues to grow rapidly, having recoveredfrom the brief but dramatic downturn of the dot-com crash.
Employment in the Biotechnology and Chemicals Sector - Top Twenty Regions in 2008 Table 3.5
Rank Top 20 Regions Index Change in Rank2008 2005-08
1 Durham, US 476.4 -
2 Rochester, US 422.9 -
3 Toyama, Japan 272.6 2
4 Oxnard-Thousand Oaks-Ventura, US 269.4 -
5 Indianapolis, US 263.1 -4
6 Hessen, Germany 253.8 -3
7 Lombardia, Italy 249.2 -5
8 Vlaams Gewest, Belgium 238.5 -1
9 Greensboro-High Point, US 227.0 -5
10 South Netherlands 204.9 7
Rank Top 20 Regions Index Change in Rank 2008 2005-08
11 Philadelphia-Camden-Wilmington, US 201.7 -2
12 South, Sweden 201.5 -1
13 Switzerland 196.1 -7
14 Taiwan 192.5 -2
15 Houston-Sugar Land-Baytown, US 189.5 -5
16 North West, Italy 186.0 64
17 Osaka, Japan 183.5 -4
18 Singapore 183.1 25
19 Southern and Eastern, Ireland 180.6 -
20 Centre-est, France 169.7 5
(Employees per 1000 employees)
Employment in the IT and Computer Manufacturing Sector - Top Twenty Regions 2008 Table 3.7
Rank Top 20 Regions Index Change in Rank2008 2005-08
1 San Jose-Sunnyvale-Santa Clara, US 1,233.2 0
2 Shiga, Japan 520.0
3 Singapore 519.0 0
4 Austin-Round Rock, US 427.0 -2
5 Durham, US 394.5
6 Pohjois-Suomi, Finland 376.0
7 Guangdong, China 374.2
8 Portland-Vancouver-Beaverton, US 352.4 -3
9 Shanghai, China 348.6
10 Colorado Springs, US 346.8
Rank Top 20 Regions Index Change in Rank 2008 2005-08
11 Kanagawa, Japan 316.6 -3
12 Tochigi, Japan 304.7 -6
13 Tianjin, China 300.1
14 Toyama, Japan 293.2 -7
15 South Netherlands 288.8 -6
16 Stockholm, Sweden 233.1 11
17 Taiwan 229.7 -6
18 Kyoto, Japan 214.7 -2
19 Phoenix-Mesa-Scottsdale, US 187.8 -4
20 Etela-Suomi, Finland 182.1 6
(Sector employees per 1000 total employees)

This is also the sector which shows the highest correlationwith overall knowledge competitiveness, as indicated byFigure 3.1. This year the metropolitan area of San Jose(1,233.2), the leading region in the composite WKCI, is againthe leader of the IT and computer manufacturing index. Withover one in every ten employees working in the IT andcomputer manufacturing sector in the region – over twelvetimes the index average – the index demonstrates SanJose’s strength in this sector, where the clustering effect ofglobal manufacturers such as Hewlett Packard, SunMicrosystems, Intel, and many more, continues to develophighly knowledge-intensive employment.
Elsewhere there has been little change. Shiga (520.0)moves up two places to second place while Austin (474.8),the index leader in 2004 and home to Dell computers, movesdown to fourth place. Clusters of IT manufacturing remainparticularly prevalent in East Asia, especially Singapore(519.0) and a number of Chinese and Japanese regions. Ofnote is the number of new regions in this year’s top twenty,indicating that IT and computer manufacturing is often strongin up and coming knowledge centres. Amongst these is theFinnish region of Pohjois-Suomi (376.0), the only Europeanregion in the top ten.
The automotive and mechanical engineering sector provideshigh-technology employment and requires high levels oftechnological investment. As such, regions that are strongin this sector also tend to have relatively high levels ofbusiness R&D investment and patenting rates, both of whichcan have positive spillovers for other sectors in the region.
The reputation of Germany and Japan in automotiveproduction is again borne out in our rankings, which betweenthem have nine of the top twenty regions in this index. Thisyear Aichi (411.7) and Baden Württemberg (357.8) tradeplaces at the top of the rankings. Both are renowned globalautomotive centres. Aichi has the highest industrial outputof any Japanese prefecture and is home to the vast ToyotaMotor Corporation, as well as a number of other plantsoperated by the likes of Mitsubishi and Suzuki. BadenWürttemberg, considered by some to be the home of theautomobile industry,4 is the hub of the German automobileindustry, and employment in the sector remains resilientdespite gradual outsourcing to Eastern Europe.
Elsewhere on the index the Swedish regions are noticeablefor their strong performance on this year’s automotive andmechanical engineering index, with West Sweden (302.0) –home to the Volvo and Saab brands – moving up sevenplaces to fourth and Smaland Medoarna (290.4) moving upsixteen places to fifth. Of the North American regions,Detroit (266.1), the city that has for so long beensynonymous with the US car industry, remains the strongestperformer, although its position has continued to declinegradually since the WKCI began.
The instrumentation and electrical engineering sector utilisessome of the most high-technology production techniquesavailable. Similarly, the sector requires a supply of suitablyskilled labour, providing high value equipment for a range of
P:1
8C
hapt
er 3
: Hum
an C
apita
l Com
pone
nts
Employment in the Automotive and Mechanical Engineering Sector - Top Twenty Regions 2008 Table 3.8
Rank Top 20 Regions Index Change in Rank2008 2005-08
1 Aichi, Japan 411.7 1
2 Baden-Württemberg, Germany 357.8 -1
3 Shizuoka, Japan 348.0 1
4 West, Sweden 302.0 7
5 Smaland Medoarna, Sweden 290.4 16
6 Saarland, Germany 282.9 6
7 Detroit-Warren-Livonia, US 266.1 -1
8 Ostra Mellansverige, Sweden 244.1 -
9 Bayern, Germany 240.7 -4
10 Hartford, US 233.9 4
Rank Top 20 Regions Index Change in Rank 2008 2005-08
11 Emilia-Romagna, Italy 231.0 -1
12 Tochigi, Japan 230.0 3
13 Noreste, Spain 223.6 0
14 Shiga, Japan 219.5 6
15 Seattle-Tacoma-Bellevue, US 205.7 1
16 Niedersachsen, Germany 202.4 -9
17 South, Sweden 200.2 n/a
18 Kanagawa, Japan 198.9 14
19 Lansi-Suomi, Finland 198.1 -
20 North East, Italy 191.0 -2
(Sector employees per 1000 total employees)
Employment in the Instrumentation and Electrical Machinery Sector - Top Twenty Regions 2008 Table 3.9
Rank Top 20 Regions Index Change in Rank2008 2005-08
1 Shiga, Japan 382.2 8
2 Baden-Württemberg, Germany 304.9 1
3 Tochigi, Japan 304.5 5
4 Singapore 302.0 n/a
5 Switzerland 300.3 -3
6 Shizuoka, Japan 296.4 0
7 San Jose-Sunnyvale-Santa Clara, US 295.8 -3
8 Milwaukee-Waukesha-West Allis, US 274.5 -3
9 Bayern, Germany 251.6 2
10 Shanghai, China 240.3 -
Rank Top 20 Regions Index Change in Rank 2008 2005-08
11 Guangdong, China 238.9 -
12 Lombardia, Italy 229.4 0
13 Aichi, Japan 225.7 0
14 Kyoto, Japan 223.5 1
15 Budapest, Hungary 217.4 1
16 North West, Italy 204.2 15
17 Centre-est, France 202.2 5
18 North East, Italy 201.3 -1
19 Emilia-Romagna, Italy 189.7 0
20 Hessen, Germany 182.7 1
(Sector employees per 1000 total employees)
4 Gottlieb Daimler and Karl Benz invented the motorbike and the four wheel automobilein the region’s capital, Stuttgart

CH
AP
TE
R T
HR
EE
‘front line’ industries. The Japanese region of Shiga (382.2)moves up eight places to become this year’s leader ininstrumentation and electrical engineering employment (seeTable 3.9). Shiga is home to a wide variety of major hightech companies in this sector such as Toray Industries andCanon. Baden-Württemberg (304.9) moves up to secondplace, suggesting it is using its automobile base toincreasingly diversify into other high value addedmanufacturing sectors. Accurate data is now also availablefor Singapore (302.0), which enters in fourth place by virtueof an electronics industry that accounts for almost half oftotal industrial output. Other notable new entrants are theChinese regions of Shanghai (240.3) and Guangdong(238.9), demonstrating that these leading Chinese regionsare beginning to move into sectors towards the top of thevalue chain.
The WKCI’s high-technology service sector index representsthe density of employment in the following:telecommunications services; IT support; data processing;computer software; and research and scientificdevelopment. All are sectors which require innovativebusinesses and a pool of well educated workers, asillustrated earlier in Figure 3.1 which showed the relativelyhigh correlation between high-tech service employment andthe composite WKCI.
This year Île de France (336.4), the region which covers thecapital Paris, moves to the top of the rankings. The Parisregion has a very high density of knowledge employmentacross many sectors, but moves to the top of rankings basedon particularly high telecoms and computer serviceemployment. Lazio (301.2) moves up to second place(following some reclassifications of Italian statistics), whileSan Jose (279.3) remains in third place, demonstrating itsvery high knowledge employment across the service andmanufacturing sectors. Of the new regions, Beijing (173.9)and Durham (166.8) both enter in the top fifteen.
A notable point of interest in the high tech service index isthe extent of geographic dispersion among the top regions.Remarkably, fourteen different nations are represented inthe top twenty, which strongly suggests that each nation
tends to have a central ‘pole’ region which provides the basefor the high-tech service sector in that nation, rather thannational specialisation in these sectors. These regions tendto be centred around a nation’s economic centre: Paris,Toyko Stockholm, Brussels, Beijing, Prague, and so on.
Why do we get greater regional dispersion in high techservices as opposed to high-tech manufacturing? Firstly, inhigh-tech manufacturing sectors, such as automotives orpharmaceuticals, high fixed costs create a barrier to entrythat will tend to create an oligopolistic market structure,dominated by a few big players. As such, employment inthese sectors will be heavily concentrated in areas wheremajor firms locate, and thus regional or even global marketswill be dominated by a handful of centres that are able toservice the whole geographic area. In contrast, low fixedcosts means that the success of service firms will be muchless dependent on increasing returns to scale, enablingsmaller firms to compete successfully in many areas.Secondly, service providers remain far more nationally-oriented than manufacturers: in Europe, for example theservice sector still accounts for only 20 percent of tradebetween member states, despite accounting for 70 percentof the EU's GDP.
P:1
9C
hapt
er 3
: Hum
an C
apita
l Com
pone
nts
Employment in the High Tech Service Sector - Top Twenty Regions 2008 Table 3.9
Rank Top 20 Regions Index Change in Rank2008 2005-08
1 Île de France, France 336.4 7
2 Lazio, Italy 301.2 30*
3 San Jose-Sunnyvale-Santa Clara, US 279.3 0
4 Washington-Arlington-Alexandria, US 264.9 0
5 Comunidad de Madrid, Spain 252.8 8
6 Tokyo, Japan 249.0 -5
7 Stockholm, Sweden 237.8 -5
8 Brussels, Belgium 206.6 33
9 Nordrhein-Westfalen, Germany 180.7 n/a
10 Prague, Czech Republic 175.5 -3
Rank Top 20 Regions Index Change in Rank 2008 2005-08
11 Beijing, China 173.9
12 South East, UK 173.0 -3
13 West, Netherlands 167.6 13
14 Budapest, Hungary 166.9 17
15 Durham, US 166.8
16 Central, Italy 165.1 96*
17 San Francisco-Oakland-Fremont, US 162.2 -3
18 Kansas City, US 161.2 -6
19 Kanagawa, Japan 154.9 2
20 New South Wales, Australia 151.9 10
(Sector employees per 1000 total employees)

CCHHAAPPTTEERR FFOOUURR
Knowledge capital refers to a region’s capacity forcreating new ideas and transforming these ideas tocreate commercial value. Investment in research anddevelopment activity is a key indicator of the efforts todevelop and exploit new technology, software and ideasin order to enlarge the knowledge base. These researchand development indicators have been broken downaccording to the two major sectors participating in suchactivity – business and government. There are somedisadvantages to using this indicator as it may fail totake account of the R&D activities of firms whereinnovation occurs ‘outside of the laboratory’ or R&Ddepartment. Secondly, differences in R&D intensityacross regions and nations will depend on differencesin the mix of industries within the area. Nevertheless,R&D expenditure indicators remain some of the bestavailable measures of an economy’s ability to developknowledge and translate it into high value-addedeconomic output. The extent of the correlation betweentotal R&D expenditure (business and government) andknowledge competitiveness is demonstrated by Figure 4.1.
Table 4.1 ranks public/government R&D expenditure perhead. Government expenditure on R&D is usually focusedon developing the science base, supporting the full benefitsof research that cannot always be adequately captured bythe private sector. This index has seen little movement since2005, reflecting the relatively stable rates of public sectorexpenditure. The Washington DC metropolitan area (815.9) remains at the top of the rankings for the fifth year runningby virtue of the US capital region’s continuingdisproportionate share of federal R&D budgets, in particularin health and defence. Neighbouring Baltimore (744.8)
P:20
Chapter 4: Knowledge Capital Components
Chapter 4:Knowledge Capital Components
Relationship between total R&D Expenditure per Capita at the Regional Level and the WKCI 2008 Figure 4.1

remains in second, reflecting the strength of governmentR&D spending in the state of Maryland. The rest of the toptwenty continues to be dominated by US regions, reflectingthe continued strength of government-sponsored researchin the US, which during the 1990s had been declining due toa fall in military-related R&D. The only non-US region isBeijing (534.8), in third place, having been the only topregion to have moved significantly up the rankings since2005.
The top ranking European region is Lazio (158.2) althoughthe region has fallen five places down to 22nd in therankings overall. Prague (157.4) also moves down, although
government expenditure on R&D remains very high relativeto the size of the Czech budget. Elsewhere, most leadingEuropean regions have seen there ranking decline, theexceptions being Bratislavsk_ which has risen thirty placesto 58th and Central Italy, rising 42 places to 62nd overall.
Outside of China the Asia-Pacific regions have also seentheir rankings decline since 2005, as shown by Table 4.3.The wide disparity in government R&D expenditure is alsonotably in the Asia-Pacific top twenty, ranging from five timesthe index average in top ranked Beijing to less than one-sixththe index average in Zhejing, Toyama and Aichi. Business expenditure on R&D is a key measure of the extent
P:21
Chapter 4: Knowledge Capital Components
Per Capita Research and Development Expenditure by Government – Top Twenty European Regions 2008 Table 4.2
Rank Top 20 European Regions Index Change in Rank2008 2005-08
22 Lazio, Italy 158.2 -5
23 Prague, Czech Republic 157.4 -5
27 Berlin, Germany 139.6 -8
28 Bremen, Germany 122.7 -5
29 Iceland 112.6
44 Île de France, France 103.7 -17
58 Bratislavsk_, Slovak Republic 87.3 30
59 Hamburg, Germany 86.9 -19
62 Central, Italy 83.3 42
65 Etela-Suomi, Finland 79.6 -40
Rank Top 20 European Regions Index Change in Rank 2008 2005-08
75 Comunidad de Madrid, Spain 72.9 -27
77 Budapest, Hungary 67.0 -28
78 Stockholm, Sweden 64.8 -9
80 Baden-Württemberg, Germany 62.4 -23
82 South East, UK 59.9 -7
83 East Netherlands 57.9
84 Luxembourg 54.1 0
85 West, Netherlands 52.2 -20
86 Eastern, UK 51.0 -9
87 Norway 50.6 -17
(Expenditure per capita in USD - PPP adjusted)
Per Capita Research and Development Expenditure by Government – Top Twenty Regions 2008 Table 4.1
Rank Top 20 Regions Index Change in Rank2008 2005-08
1 Washington-Arlington-Alexandria, US 815.9 0
2 Baltimore-Towson, US 744.8 0
3 Beijing, China 534.8 11
4 Richmond, US 441.8 -1
5 Virginia Beach-Norfolk-Newport News, US 438.9 -1
6 Boston-Cambridge-Quincy, US 398.3 -1
7 Providence-Fall River-Warwick, US 314.5
8 Hartford, US 313.1 -2
9 Bridgeport-Stamford-Norwalk, US 313.1
10 San Francisco-Oakland-Fremont, US 257.3 -1
Rank Top 20 Regions Index Change in Rank 2008 2005-08
11 San Diego-Carlsbad-San Marcos, US 257.3 1
12 Oxnard-Thousand Oaks-Ventura, US 257.3
13 Riverside-San Bernardino-Ontario, US 257.3 -3
14 San Jose-Sunnyvale-Santa Clara, US 257.3 -6
15 Los Angeles-Long Beach-Santa Ana, US 257.3 -4
16 Sacramento--Arden-Arcade--Roseville, US 257.3 -3
17 Seattle-Tacoma-Bellevue, US 196.0 -10
18 Denver-Aurora, US 185.8 -2
19 Colorado Springs, US 185.8
20 Phoenix-Mesa-Scottsdale, US 171.5 -5
Per Capita Research and Development Expenditure by Government – Top Twenty Asia-Pacific Regions 2008 Table 4.3
Rank Top 20 Asia-Pacific Regions Index Change in Rank2008 2005-08
3 Beijing, China 534.8 11
24 Shanghai, China 155.0 47
49 Tokyo, Japan 95.3 -12
63 Taiwan 80.2 -28
73 Ulsan, Korea 76.1 -11
74 Seoul, Korea 76.1 -13
76 Tianjin, China 68.2 26
88 Victoria, Australia 47.8 -15
92 New Zealand 40.8 -12
93 Western Australia 40.7 -19
Rank Top 20 Asia-Pacific Regions Index Change in Rank 2008 2005-08
101 Singapore 35.9 -10
103 Israel 35.2 -6
105 Kanagawa, Japan 33.1 -10
106 New South Wales, Australia 32.5 -34
109 Jiangsu, China 30.4
110 Tochigi, Japan 30.2 -12
119 Osaka, Japan 17.5 -12
121 Zhejing, China 16.5
122 Toyama, Japan 16.4 -12
123 Aichi, Japan 16.2 -12
(Expenditure per capita in USD - PPP adjusted)

to which businesses are developing and exploiting newtechnology and ideas. Expenditure on R&D by industry hasbeen shown to generate important positive externalities forother firms, and for society as a whole, which facilitates theutilisation and transfer of knowledge. The level ofinvestment by business, as opposed to the public sector, isa strong barometer of the level of innovative activity withinregions and the extent to which technology is driving processdevelopment.
Similar to government R&D expenditure, the top regions bybusiness R&D expenditure are predominantly American.This year Hartford (299.9) moves up again and is now in first
position. Boston (298.2) also moves up two places to third,further emphasising the strength of business R&Dinvestment in southern New England. Seattle (267.7), theindex leader in 2005, slips five places this year to sixth, justahead of West Sweden (264.5), the only non-Americanregion in the top fifteen.
While business R&D in the US is relatively concentrated inthe North East and South West, in Europe it is more widelydistributed, with ten different nations represented in the toptwenty. The Swedish regions perform particularly well, withWest Sweden (264.5) and Stockholm (216.3) holding thefirst two places by some distance, as well as two other
P:22
Chapter 4: Knowledge Capital Components
Per Capita Research and Development Expenditure by Business – Top Twenty Regions 2008 Table 4.4
Rank Top 20 Regions Index Change in Rank2008 2003-08
1 Hartford, US 299.9 2
1 Bridgeport-Stamford-Norwalk, US 299.9
3 Boston-Cambridge-Quincy, US 298.2 2
4 Grand Rapids, US 271.5 3
4 Detroit-Warren-Livonia, US 271.5 1
6 Seattle-Tacoma-Bellevue, US 267.7 -5
7 West, Sweden 264.5 -3
8 Providence-Fall River-Warwick, US 238.3
9 San Diego-Carlsbad-San Marcos, US 236.6 3
9 San Jose-Sunnyvale-Santa Clara, US 236.6 -2
Rank Top 20 Regions Index Change in Rank 2008 2003-08
9 Los Angeles-Long Beach-Santa Ana, US 236.6 0
9 San Francisco-Oakland-Fremont, US 236.6 -2
9 Oxnard-Thousand Oaks-Ventura, US 236.6
9 Riverside-San Bernardino-Ontario, US 236.6 -5
9 Sacramento--Arden-Arcade--Roseville, US 236.6 -2
16 Shiga, Japan 227.0 0
17 Stockholm, Sweden 216.3 -15
18 Shizuoka, Japan 212.4 2
19 Aichi, Japan 210.9 0
20 Kanagawa, Japan 185.4 6
(Expenditure per capita in USD - PPP adjusted)
Per Capita Research and Development Expenditure by Business – Top Twenty European Regions 2008 Table 4.5
Rank Top 20 Eurpoean Regions Index Change in Rank2008 2005-08
1 West, Sweden 264.5 -3
2 Stockholm, Sweden 216.3 -15
3 Eastern, UK 178.0 4
4 Île de France, France 170.0 -11
5 Baden-Württemberg, Germany 169.8 -8
6 Pohjois-Suomi, Finland 161.8
7 Luxembourg 155.3 -17
8 South, Sweden 149.4 -13
9 Etela-Suomi, Finland 143.0 -18
10 Bayern, Germany 136.2 -10
Rank Top 20 Eurpoean Regions Index Change in Rank 2008 2005-08
11 Switzerland 135.5 1
12 Hessen, Germany 127.4 -7
13 South East, UK 120.7 -7
14 Lansi-Suomi, Finland 118.5 -44
15 Ostra Mellansverige, Sweden 117.0
16 South Netherlands 115.3 -18
17 Denmark 96.3 -8
18 Hamburg, Germany 92.8 11
19 Bremen, Germany 92.5 6
20 East, Austria 91.9 -19
Per Capita Research and Development Expenditure by Business – Top Twenty Asia Pacific Regions 2008 Table 4.6
Rank Top 20 Asia-Pacific Regions Index Change in Rank2008 2005-08
1 Shiga, Japan 227.0 0
2 Shizuoka, Japan 212.4 2
3 Aichi, Japan 210.9 0
4 Kanagawa, Japan 185.4 6
5 Tochigi, Japan 175.3 7
6 Tokyo, Japan 167.0 4
7 Israel 164.8 4
8 Toyama, Japan 161.4 7
9 Osaka, Japan 158.7 3
10 Kyoto, Japan 117.1 7
Rank Top 20 Asia-Pacific Regions Index Change in Rank 2008 2005-08
11 Ulsan, Korea 79.0 -1
12 Seoul, Korea 79.0 -3
13 Taiwan 74.8 0
14 Beijing, China 72.6 3
15 Singapore 71.4 -5
16 Western Australia 70.4 3
17 Victoria, Australia 64.2 -1
18 New South Wales, Australia 62.2 -3
19 Shanghai, China 50.8 9
20 Tianjin, China 29.9 -3

CCHHAAPPTTEERR FFOOUURR
Swedish regions making the top fifteen. Germany also rankswell, with five regions in the top twenty, led by BadenWürttemberg (169.8). However, few European regions haveperformed well compared to 2005, a trend particularlynoticeable amongst the Finnish and Swedish regions.
In Asia, Japanese regions are clearly at the head of businessR&D investment, led by four regions which also make thetop twenty overall: Shiga (227.0), Shizuoka (212.4), Aichi(210.9) and Kanagawa (185.4). The Japanese regions havealso all seen their rankings maintained or improved since2005. Lower down the table Shanghai (50.8) is also notablefor a strong rise in its ranking.
Along with R&D investment, the generation of new ideaswithin the WKCI is represented by levels of patentregistration, as the nearest proxy to direct indicators ofknowledge formation and knowledge capitalisation. Thenumber of patents can be used to indicate how successful aregion is in converting knowledge into potentiallycommercially viable products and processes. This indicator
is not perfect as patents are an indicator of invention notinnovation, and it may be a better indicator for someindustries rather than others. For example, automotivecompanies are more likely to patent than those firms workingin financial services. However, there does appear to be asignificant relationship between patenting rates and broaderknowledge competitiveness; a fact illustrated by the strongcorrelation seen in Figure 4.2.Looking at the leading regions for this indicator, Table 4.7illustrates that, as with other indicators of knowledge capital,patent registrations across the WKCI regions are dominatedby US regions, with the notable exception of the twoJapanese regions of Tokyo (708.7) and Osaka (346.9) whichoccupy the first two positions on the index by some distance.The Californian MSAs make up most of the rest of the top10, followed by a number of other US regions from the NorthEast, North West and Colorado. South Netherlands (205.3)and Baden-Württemberg (187.4) are the only Europeanregions in the top twenty, which also includes the Asia-Pacific regions of Kyoto (196.2) and Shanghai (186.0).
P:23
Chapter 4: Knowledge Capital Components
Relationship between Patent Registrations per 1 million inhabitants and the WKCI 2008 Figure 4.2
Index of Patent Registrations per 1 million inhabitants- Top Twenty Regions 2008 Table 4.7
Rank Top 20 Regions Index Change in Rank2008 2005-08
1 Tokyo, Japan 708.7 0
2 Osaka, Japan 346.9 1
3 San Jose-Sunnyvale-Santa Clara, US 252.3 1
4 San Diego-Carlsbad-San Marcos, US 252.3 4
5 Los Angeles-Long Beach-Santa Ana, US 252.3 2
6 San Francisco-Oakland-Fremont, US 252.3 0
7 Riverside-San Bernardino-Ontario, US 252.3 -2
8 Oxnard-Thousand Oaks-Ventura, US 252.3
9 Sacramento--Arden-Arcade--Roseville, US 252.3 0
10 Boston-Cambridge-Quincy, US 250.4 1
Rank Top 20 Regions Index Change in Rank 2008 2005-08
11 Minneapolis-St. Paul-Bloomington, US 243.1 -1
12 Portland-Vancouver-Beaverton, US 217.0 2
13 Colorado Springs, US 208.5
14 Denver-Aurora, US 208.5 -1
15 Bridgeport-Stamford-Norwalk, US 206.0
16 Hartford, US 206.0 7
17 South Netherlands 205.3 32
18 Kyoto, Japan 196.2 12
19 Baden-Württemberg, Germany 187.4 25
20 Shanghai, China 186.0 -18

CCHHAAPPTTEERR FFIIVVEE
P:24
Chapter 5: Financial Capital
Chapter 5:Financial Capital
Index of Private Equity Investment Capital Per Capita – Top Twenty Regions in 2008 Table 5.1
Rank Top 20 Regions Index Change in Rank2008 2005-08
1= San Jose-Sunnyvale-Santa Clara, US 1,454.2 0
1= San Francisco-Oakland-Fremont, US 1,454.2 0
3= San Diego-Carlsbad-San Marcos, US 451.9 2
3= Hartford, US 413.8 -1
3= Bridgeport-Stamford-Norwalk, US 413.8
3= Boston-Cambridge-Quincy, US 413.8 -3
3= Providence-Fall River-Warwick, US 413.8
8 Stockholm, Sweden 346.5 -1
9 London, UK 285.0 -1
10 Île de France, France 284.2 -1
Rank Top 20 Regions Index Change in Rank 2008 2005-08
11= Seattle-Tacoma-Bellevue, US 200.3 1
11= Portland-Vancouver-Beaverton, US 200.3 0
13 Iceland 174.4
14 South East, UK 168.0 0
15 Denver-Aurora, US 160.6 -9
15= Colorado Springs, US 160.6
17 West, Sweden 152.1 0
18 Quebec, Canada 148.6 -2
19 Israel 135.6 3
20 Singapore 128.8 5
In order for firms to compete in the knowledge economy,actors not only need the willingness to acquireknowledge capital but also the finance with which to doso. Here we benchmark the availability of private equityto businesses at the regional level as a measure offinancial capital availability. Private equity funding isparticularly important, as it is often concentrated insmall or medium sized firms with the potential forgrowth. Such investments finance expansion in orderfor innovative firms to build up their human, physicaland knowledge capital stocks. In addition, private equityincludes venture capital and start-up investments,which tend to be in knowledge-based activities andsignificantly add to each region’s business base.
As shown by Table 5.1, US regions continue to provide thehighest levels of private equity to their firms and occupy thetop seven spots in the 2008 rankings. San Jose and SanFrancisco share the top spot, with both regions benefitingfrom the huge amount of venture capital available in andaround Silicon Valley. These regions are a very long wayahead of San Diego (451.9), which moves up two places tothird. The southern New England regions of Hartford,Boston, Bridgeport and Providence follow, all of which scoreover four times the index average. Outside of NorthAmerica, a handful of European are competitive in terms ofprivate equity: Stockholm, London and Paris all make thetop ten.

CCHHAAPPTTEERR FFIIVVEE
Figure 5.1 compares average scores for private equityacross the three continents. Asia-Pacific regions performparticularly poorly for this indicator, partly reflecting thebusiness structure, but also suggesting a potential lack ofcapital investment for smaller and more dynamic firms.However, it should be noted that this comparison alsoreflects in part the relatively poor quality of data available forprivate equity for countries such as India and China.
P:25
Chapter 5: Financial Capital
Private Equity Investment Capital per Capita – Mean Average Index Score by Continent Figure 5.1

CCHHAAPPTTEERR SSIIXXLabour productivity is an important measure of regional
performance. It is a variable influenced by a wide rangeof factors such as sector make-up, workforce skills,investment in innovation and market competition.Productivity varies from GDP per capita and is partly afunction of a region’s economic activity andunemployment rates. The prosperity of all economies ishighly dependent on their productivity rates.
As shown by Table 6.1, the highest productivity rate in thisyear’s index is found in Hartford (185.2), some way ahead ofSan Jose (159.5) in second and Bridgeport (159.4) in third.The relative strength of the US in terms of output peremployee is very clear in the table, which contains eighteenUS regions out of the top twenty. Notable movers amongstthe US regions are New York, Washington and VirginiaBeach, which move up strongly into the top ten, as well asSan Diego, Greensboro and Philadelphia, which all makesignificant gains to move into the top twenty. While the USregions have always been dominant under this indicator itshould be noted that their lead has been furtherstrengthened this year by the harmonization of datacollection which previously had slightly favoured European
and Japanese regions for which full-time equivalentestimates were available. Thus, under this more comparableapproach only Luxembourg (132.6) and Brussels (132.5)maintain their positions in the top twenty.
In Europe (Table 6.2), Luxembourg and Brussels arefollowed in the rankings by Ile de France (129.0) and thenthe Dutch regions of North and West Netherlands. London(109.1) and Vlaams Gewest (108.0) are the only top twentyEuropean regions that improve their ranking since 2005.While productivity comparisons between Europe and the USappear discouraging, it should be noted that a significantproportion of the difference reflects additional hours of workper employee. Comparisons between Europe and the USon the basis of productivity per hour show that while the USis still more productive, the extent of the ‘genuineproductivity’ difference is exaggerated by the longer averageworking hours and fewer holidays taken by US workers.
P:26
Chapter 6: Regional Knowledge Economy Outputs
Chapter 6:Regional Knowledge Economy Outputs
Index of Labour Productivity (Output per Employee) – Top Twenty Regions 2008 Table 6.1
Rank Top 20 Regions Index Change in Rank2008 2005-08
1 Hartford, US 185.2 2
2 San Jose-Sunnyvale-Santa Clara, US 159.5 3
3 Bridgeport-Stamford-Norwalk, US 159.4
4 New York-Northern New Jersey-Long Island, US 147.4 6
5 Buffalo-Niagara Falls, US 142.8 8
6 Washington-Arlington-Alexandria, US 142.2 10
7 Boston-Cambridge-Quincy, US 141.0 5
8 Rochester, US 140.2 3
9 San Francisco-Oakland-Fremont, US 139.7 -3
10 Virginia Beach-Norfolk-Newport News, US 138.0 35
Rank Top 20 Regions Index Change in Rank 2008 2005-08
11 Providence-Fall River-Warwick, US 136.6
12 Los Angeles-Long Beach-Santa Ana, US 136.1 3
13 Seattle-Tacoma-Bellevue, US 136.0 4
14 San Diego-Carlsbad-San Marcos, US 134.4 10
15 Luxembourg 132.6 -13
16 Brussels, Belgium 132.5 -15
17 Greensboro-High Point, US 131.6 44
18 Charlotte-Gastonia-Concord, US 131.1 4
19 Durham, US 129.1
20 Philadelphia-Camden-Wilmington, US 129.0 10
Index of Labour Productivity (Output per Employee) – Top Twenty European Regions 2008 Table 6.2
Rank Top 20 Eurpoean Regions Index Change in Rank2008 2003-08
1 Luxembourg 132.6 -6
2 Brussels, Belgium 132.5 -14
3 Île de France, France 129.0 -10
4 North, Netherlands 119.5 60*
5 West, Netherlands 119.0 34*
6 Southern and Eastern, Ireland 117.1
7 Hamburg, Germany 113.1 -24
8 Norway 111.6 -24
9 South Netherlands 111.5 36*
10 London, UK 109.1 1
Rank Top 20 Eurpoean Regions Index Change in Rank 2008 2003-08
11 Vlaams Gewest, Belgium 108.0 7
12 Stockholm, Sweden 105.3 -21
13 East Netherlands 103.4
14 Lombardia, Italy 101.8 -40
15 Lazio, Italy 99.8 -25
16 North West, Italy 98.6 -36
17 East, Austria 97.2 -33
18 Hessen, Germany 97.0 -26
19 Etela-Suomi, Finland 95.3 -34
20 Bayern, Germany 94.2 -11
(Output per Employee)

In Asia-Pacific (Table 6.3) the Korean city of Ulsan (119.1)leads by productivity, followed by a series of Japaneseregions. Hong Kong (99.6) moves up strongly, although stillfalls a little below the index average, while the Asia-Pacifictop ten is completed by the three Australian regions of NewSouth Wales, Victoria and Western Australia.
It is important not just to assess output, but also how outputis translated into wealth and prosperity for those individualsliving within the WKCI regions. Earnings data indicate therelative wealth and standards of living within an economy,particularly the value-added generated from economicactivity. It is also a strong proxy of the relative quality of jobswithin an economy.
Table 6.4 indicates that although US regions perform verystrongly under this indicator, European regions also faremuch better than their performance in productivity index. Atthe top of the table, San Jose (208.7) remains in first place,although now closely followed by Tokyo ( 202.4), whichmoves up four places to second overall. Bridgeport (182.1)enters strongly in third followed by Ile de France (152.5), theleading European region. The rest of the top twenty is madeup of a mixture of major world cities from the US, Europeand Japan.
P:27
Chapter 6: Regional Knowledge Economy Outputs
Index of Labour Productivity (Output per Employee) – Top Twenty Asia-Pacific Regions 2008 Table 6.3
Rank Top 20 Asia-Pacific Regions Index Change in Rank2008 2003-08
1 Ulsan, Korea 119.1 -19
2 Tokyo, Japan 113.8 -41
3 Shiga, Japan 104.6 33
4 Aichi, Japan 103.0 24
5 Kanagawa, Japan 102.9 42
6 Osaka, Japan 101.6 8
7 Hong Kong 99.6 20
8 New South Wales, Australia 99.1 0
9 Western Australia 95.0 -2
10 Victoria, Australia 91.6 -4
Rank Top 20 Asia-Pacific Regions Index Change in Rank 2008 2003-08
11 Taiwan 91.1 8
12 Shizuoka, Japan 90.8 18
13 Kyoto, Japan 89.8 14
14 Tochigi, Japan 89.0 11
15 Toyama, Japan 87.3 10
16 Singapore 77.0 -15
17 Israel 75.6 -51
18 New Zealand 66.1 -14
19 Seoul, Korea 65.2 -13
20 Shanghai, China 58.1 -15
Index of Earnings (Mean Gross Monthly Earnings) – Top Twenty Regions 2008 Table 6.4
Rank Top 20 Regions Index Change in Rank2008 2005-08
1 San Jose-Sunnyvale-Santa Clara, US 208.7 0
2 Tokyo, Japan 202.4 4
3 Bridgeport-Stamford-Norwalk, US 182.1
4 Washington-Arlington-Alexandria, US 160.9 1
5 Île de France, France 152.5 39
6 Hartford, US 152.0 4
7 San Francisco-Oakland-Fremont, US 151.1 -4
8 Boston-Cambridge-Quincy, US 148.6 -1
9 New York-Northern New Jersey-Long Island, US 146.0 -5
10 Brussels, Belgium 145.9 -8
Rank Top 20 Regions Index Change in Rank 2008 2005-08
11 Osaka, Japan 143.7 48
12 Durham, US 143.2
13 Aichi, Japan 141.6 44
14 London, UK 140.7 -3
15 Luxembourg 140.2 -7
16 Shiga, Japan 138.3 45
17 Stockholm, Sweden 136.4 41
18 Kanagawa, Japan 136.3 75
19 West, Netherlands 132.3 41
20 Shizuoka, Japan 131.3 53
(Mean Gross Monthly Earnings)

CCHHAAPPTTEERR SSIIXX
Indices of unemployment are shown in Tables 6.5, reverseranked so that a high score indicates a low level ofunemployment. In order to standardise the indexationmethod across all indices, this year the unemployment rateindex is transformed using the simplified equation 100 minusunemployment rate, thereby maintaining a lineartransformation.
According to official statistics, Beijing (104.9) has the lowestrate of unemployment amongst the WKCI regions, followedby another Chinese region, Guangdong (103.5), in secondplace. Ulsan (103.0) remains in third place where it is joinedby Iceland and followed in fifth by South West England inthe UK (102.9). In the US, Washington DC (102.4) has thelowest unemployment rate thanks to high levels of publicsector employment in the region.
At the other end of the index the continued problems ofstructural unemployment in Europe is apparent, withfourteen European regions in the bottom twenty. Six ofthese are German regions, including Berlin in last place withan unemployment rate of over 19 percent. Interestingly, anumber of European regions at the wrong end of this indexare actually amongst the better performers overall; examplesinclude Ile de France, Lansi Suomi, Pohjois-Suomi andBrussels. This suggests that while unemployment inevitablyrepresents an economically inefficient use of humanresources, it does not necessarily seem to be a barrier forregions in maintaining competitiveness in the economy morebroadly.
P:28
Chapter 6: Regional Knowledge Economy Outputs
Index of Unemployment – Top Twenty Regions 2008 Table 6.5
Rank Top 20 Regions Index Change in Rank2008 2005-08
1 Beijing, China 104.9
2 Guangdong, China 103.5
3 Ulsan, Korea 103.0 0
3 Iceland 103.0
5 South West, UK 102.9
6 Singapore 102.7 41
7 Shandong, China 102.7
8 Eastern, UK 102.5 5
9 Washington-Arlington-Alexandria, US 102.4 7
10 South East, UK 102.4 2
Rank Top 20 Regions Index Change in Rank 2008 2005-08
11 West, Austria 102.4 -10
12 Emilia-Romagna, Italy 102.4 -10
13 Prague, Czech Republic 102.3 8
14 Tianjin, China 102.3 0
15 Jiangsu, China 102.3
16 Richmond, US 102.2 1
17 North East, Italy 102.2 -12
18 Virginia Beach-Norfolk-Newport News, US 102.1 1
19 Lombardia, Italy 102.1 -13
20 Sarasota-Bradenton-Venice, US 102.0
(unemployment rate – reversed)
Index of Unemployment – Bottom Twenty Regions 2008 Table 6.6
Rank Bottom 20 Regions Index Change in Rank2008 2005-08
126 Saarland, Germany 97.3 -17
127 Quebec, Canada 97.2 -8
128 Osaka, Japan 97.2 -16
129 Schleswig-Holstein, Germany 96.9 -15
130 Lansi-Suomi, Finland 96.5
131 Niedersachsen, Germany 96.5 -21
132 Île de France, France 96.4 -12
133 Nordrhein-Westfalen, Germany 96.4 -20
134 Mumbai, India 96.2 -18
135 Bangalore, India 96.2 -18
Rank Bottom 20 Regions Index Change in Rank 2008 2005-08
136 Hyderabad, India 96.2 -18
137 Estonia 96.0
138 Hamburg, Germany 95.4 -17
139 Latvia 95.3
140 Israel 94.9 -18
141 Pohjois-Suomi, Finland 94.5
142 Lithuania 94.2
143 Bremen, Germany 91.1 -20
144 Brussels, Belgium 89.6 -20
145 Berlin, Germany 86.8 -20
(unemployment rate – reversed)

CCHHAAPPTTEERR SSEEVVEENN
Knowledge sustainability represents each region’scapacity for sustaining the long-term health of itsknowledge creation and commercial exploitationcapacities. In our model, this is represented byinvestment in future generations of knowledge workersand investment in ICT infrastructure. The five variablesincluded are:
Investment in Future Knowledge- Per Capita Public Expenditures on Primaryand Secondary Education.
- Per Capita Public Expenditures on Higher Education.
National ICT Infrastructure- Secure servers per one million inhabitants.- Internet Hosts per 1,000 inhabitants.- Broadband Penetration.
Investment in Future Knowledge
New theories of economic growth are based on theimportance of human capital and the need for a skilledworkforce that is able to adapt to and meet new businessgoals in an evolving economy. Future human and knowledgecapital is embodied within those individuals undertakingeducation. Therefore, resources dedicated to education andtraining can be thought of as investment in knowledge.Sustained economic growth will depend on the quality ofschool and university graduates and their ability to produce,adapt, commercialise and utilise knowledge. Much of theexpenditure on education is set by national budgets,particularly for compulsory primary and secondary educationin Europe, while higher education expenditure is a reflectionof the number and type of institutions within a region.
Table 7.1 highlights primary and secondary educationexpenditure per capita for the highest performing regions.The statistics continue to show that the leading European
and US regions are closely matched when it comes toprimary and secondary education expenditure. Luxembourg(232.1) remains ranked first, ahead of Ile de France (225.0)which moves up to second on the basis of regional databecoming available for French education expenditure.Norway (172.0) moves up to third place just ahead of NewYork (170.1) - the top US region - which falls two places tofourth. Elsewhere in the top twenty there remains an evenbalance of European and US regions, with little movementtaking place since 2005, reflecting the stable nature of publicexpenditure.
Asia-Pacific regions compare unfavourably for primary andsecondary education expenditure (Table 7.2). WesternAustralia (115.0), in 54th place overall, ranks highest on thecontinent followed by New South Wales (104.1) and Victoria(101.1). These are the only three Asia-Pacific regions thatrank above the index average.
Table 7.3 illustrates investments in higher education. Again,as for primary and secondary education, we see a pattern ofstrong North American performance. European regions donot perform as strongly, the exceptions being Norway(248.8) which moves up to first in the rankings, and Ile deFrance (191.5) which moves up to sixth place. The othereighteen regions in the top twenty are North American, ledby Seattle (246.6) which drops one place to second. Onceagain, no regions from Asia-Pacific make the top twenty (thehighest being Taiwan in 35th place).
The extent of the apparent contribution of educationinvestment to competitiveness more broadly is shown inFigure 7.1, which displays the correlation between totalpublic education expenditure (primary, secondary andhigher) per capita and scores in the WKCI 2008.
P:29
Chapter 7 - Knowledge Sustainability Components
Chapter 7:Knowledge Sustainability Components
Index of Investment in Primary and Secondary Education (per capita public expenditure) – Table 7.1Top Twenty Regions 2008
Rank Top 20 Regions Index Change in Rank2008 2005-08
1 Luxembourg 232.1 0
2 Île de France, France 225.0 45
3 Norway 172.0 8
4 New York-Northern New Jersey-Long Island, US 170.1 -2
5 Iceland 170.3
6 Hartford, US 166.9 -3
7 Bridgeport-Stamford-Norwalk, US 166.9
8 Rochester, US 166.7 -4
9 Buffalo-Niagara Falls, US 166.7 -4
10 Denmark 155.7 2
Rank Top 20 Regions Index Change in Rank 2008 2005-08
11 Boston-Cambridge-Quincy, US 149.0 -3
12 Providence-Fall River-Warwick, US 144.2
13 Grand Rapids, US 143.8 -3
14 Detroit-Warren-Livonia, US 143.8 -5
15 Smaland Medoarna, Sweden 142.2 -2
16 Ostra Mellansverige, Sweden 141.9
17 West, Sweden 140.5 -3
18 South, Sweden 137.9 0
19 Philadelphia-Camden-Wilmington, US 136.8 -3
20 Brussels, Belgium 136.6 32

P:30
Chapter 7 - Knowledge Sustainability Components
Index of Investment in Primary and Secondary Education (per capita public expenditure) – Table 7.2Top Twenty Asia-Pacific Regions 2008
Rank Top 20 Asia-Pacific Regions Index Change in Rank2008 2005-08
54 Western Australia 116.1 37
69 New South Wales, Australia 105.2 25
75 Victoria, Australia 102.1 18
78 New Zealand 99.0 33
99 Hong Kong 84.0 10
108 Taiwan 75.4 -1
112 Shiga, Japan 71.4 -58
113 Shizuoka, Japan 71.4 -35
114 Aichi, Japan 71.4 -28
115 Kanagawa, Japan 71.4 -12
Rank Top 20 Asia-Pacific Regions Index Change in Rank 2008 2005-08
116 Tochigi, Japan 71.4 -53
117 Tokyo, Japan 71.4 -25
118 Toyama, Japan 71.4 -65
119 Osaka, Japan 71.4 -36
120 Kyoto, Japan 71.4 -36
125 Seoul, Korea 58.6 -11
129 Beijing, China 54.6 -8
130 Ulsan, Korea 50.9 -17
132 Singapore 45.9 -14
135 Shanghai, China 35.7 -16
Index of Investment in Higher Education (per capita public expenditure) – Top Twenty Regions 2008 Table 7.3
Rank Top 20 Regions Index Change in Rank2008 2005-08
1 Norway 248.8 19
2 Seattle-Tacoma-Bellevue, US 246.6 -1
3 Salt Lake City, US 224.7 -1
4 Grand Rapids, US 198.5 0
5 Detroit-Warren-Livonia, US 198.4 0
6 Île de France, France 191.5 56
7 Portland-Vancouver-Beaverton, US 188.1 -1
8 Rochester, US 176.7 0
9 Buffalo-Niagara Falls, US 176.7 0
10 Milwaukee-Waukesha-West Allis, US 175.3 0
Rank Top 20 Regions Index Change in Rank 2008 2005-08
11 Quebec, Canada 173.5 46
12 Oklahoma City, US 172.4
13 New York-Northern New Jersey-Long Island, US 169.8 -2
14 San Diego-Carlsbad-San Marcos, US 162.1 -2
15 San Francisco-Oakland-Fremont, US 162.1 -2
16 Sacramento--Arden-Arcade--Roseville, US 162.1 -2
17 Los Angeles-Long Beach-Santa Ana, US 162.1 -2
18 Riverside-San Bernardino-Ontario, US 162.1 -2
19 Oxnard-Thousand Oaks-Ventura, US 162.1
20 San Jose-Sunnyvale-Santa Clara, US 162.0 -3
(Expenditure per capita in USD - PPP adjusted)
Relationship between Total Regional Education Expenditure per Capita and the Composite WKCI 2008 Figure 7.1

ICT Infrastructure
In order to transfer knowledge effectively and efficientlyacross regions and nations a well–developed ICTinfrastructure, particularly access to fast broadbandtelecommunications services, is required. Althoughbroadband access data is unavailable for all ourbenchmarked regions and nations, the OECD has collectedcertain data at the national level for its member states. Also,in order to look in more detail at the ICT infrastructure, wehave analysed the number of secure servers and Internethosts per capita in the nations covered by the WKCIbenchmarked regions. Secure servers utilise encryptedsoftware for e-commerce transactions and the number ofsuch servers within a nation gives a strong indication of thelevel of e-business undertaken.
Table 7.5 shows that the highest per capita level of secureservers is in Iceland (408.4), a country with arguably themost advanced ICT infrastructure in the World. The UnitedStates (323.6) in second place is well behind Iceland, butwell ahead of Canada (228.4) in third place. China and Indiaremain well behind the other nations, a clear example of the‘digital divide’ that exists between the developing anddeveloped worlds. In general, the ranking remain highlystable since WKCI 2005.
P:31
Chapter 7 - Knowledge Sustainability Components
Index of Secure Servers per Capita Table 7.4
Rank Country Index Change in Rank2008 2005-08
1 Iceland 408.4
2 United States 323.6 -1
3 Canada 228.4 -1
4 New Zealand 196.7 -1
5 Luxemburg 194.8 -1
6 Australia 192.4 -1
7 Switzerland 181.8 -1
8 United Kingdom 163.2 -1
9 Sweden 150.2 -1
10 Denmark 148.5 -1
11 Ireland 143.3 -1
12 Norway 117.1 -1
13 Finland 114.7 -1
14 Singapore 108.6 -1
15 Netherlands 105.5 -1
16 Austria 93.5 -1
17 Germany 76.0 -1
Rank Country Index Change in Rank 2008 2005-08
18 Japan 73.2 -1
19 Hong Kong 68.6 -1
20 Israel 63.7 -1
21 Estonia 42.3
22 Belgium 41.9 -2
23 Spain 32.0 -2
24 France 29.4 -2
25 Latvia 19.4
26 Taiwan 19.2 -3
27 Italy 16.2 -3
28 Czech Republic 14.7 -3
29 Hungary 9.4 -3
30 Lithuania 8.9
31 Korea 8.7 -4
32 Slovak Republic 5.4 -4
33 India 0.2
34 China 0.1 -1
Index of Internet Hosts per Capita Table 7.5
Rank Country Index Change in Rank2008 2005-08
1 Iceland 369.2
2 Denmark 274.6 -1
3 Finland 236.9 -1
4 Norway 223.9 -1
5 Netherlands 212.6 -1
6 Sweden 173.4 -1
7 Australia 143.7 -1
8 Belgium 141.4 -1
9 Taiwan 139.7 -1
10 Switzerland 138.7 -1
11 Austria 122.4 -1
12 New Zealand 118.5 -1
13 Singapore 117.6 -1
14 Hong Kong 111.1 -1
15 Japan 102.5 -1
16 Canada 102.4 -1
17 Italy 95.0 -1
Rank Country Index Change in Rank 2008 2005-08
18 Israel 79.6 -1
19 Luxemburg 63.2 -1
20 United Kingdom 63.1 -1
21 Estonia 47.5
22 France 45.4 -2
23 Germany 41.8 -2
24 United States 39.6 -2
25 Czech Republic 31.2 -2
26 Hungary 31.2 -2
27 Ireland 28.2 -2
28 Spain 27.9 -2
29 Lithuania 27.7
30 Latvia 25.8
31 Slovak Republic 18.5 -4
32 Korea 5.3 -4
33 India 0.1 -4
34 China 0.1 -4

P:32
Chapter 7 - Knowledge Sustainability Components
Index of Broadband Penetration Table 7.6
Rank Country Index Change in Rank2008 2005-08
1 Iceland 228.8
2 Korea 213.3 -1
3 Hong Kong 179.9 -1
4 Netherlands 162.8 -1
5 Denmark 161.0 -1
6 Taiwan 157.7
7 Israel 156.3
8 Canada 152.5 -3
9 Switzerland 148.2 -3
10 Singapore 138.5
11 Belgium 133.6 -4
12 Finland 128.5 -4
13 Japan 128.5 -4
14 Norway 127.6 -4
15 Sweden 124.2 -4
16 United States 111.4 -4
17 France 90.8 -4
Rank Country Index Change in Rank 2008 2005-08
18 United Kingdom 89.9 -4
19 Austria 87.4 -4
20 Luxemburg 84.0 -4
21 Estonia 73.8
22 Germany 72.0 -4
23 Spain 72.0 -4
24 China 72.0 -7
25 Italy 69.4 -5
26 Australia 66.0 -5
27 New Zealand 40.3 -5
28 Hungary 30.8 -5
29 Ireland 29.1 -5
30 Lithuania 26.3
31 Latvia 20.3
32 Czech Republic 13.7 -7
33 Slovak Republic 9.4 -7
34 India 0.1 -1
As highlighted by Table 7.6, Iceland (228.8) also enters infirst place under access to broadband services, although theprevious leader Korea (213.3) is only marginally behind insecond place. Data for this indicator is also now availablefor Taiwan (157.7) and Israel (156.3), both of which enterhigh up the national index. Data is also now available forIndia (0.1) which enters in last place below the SlovakRepublic (9.4) and the Czech Republic (13.7). Perhaps themost interesting feature of Table 7.7 is the high range ofscores even at a national level, revealing that broadbandaccess is still highly variable across the globe. Also of noteis the remarkable strength of China in this area, given itslevel of economic development relative to many othernations in the index.
CCHHAAPPTTEERR SSEEVVEENN
WKCI 2008 Data Sources
North American sources
US Census Bureau (http://www.census.gov/)Bureau of Labour Statistics (http://www.stats.bls.gov/)US Patent and Trademark Office (http://www.uspto.gov/)US Conference of Mayors (http://www.usmayors.org/)Bureau of Economic Analysis (http://www.bea.doc.gov/)Department of Education (http://www.ed.gov/)National Science Foundation (http://www.nsf.gov/)National Center for Education Statistics(http://www.nces.ed.gov/)Price Waterhouse Coopers, Money Tree Survey(http://www.pwcmoneytree.com/moneytree/index/)Statistics Canada (http://www.statcan.ca)Canada’s Venture Capital & Private Equity Association(http://www.cvca.ca/)
Europe sources
Eurostat (http://europa.eu.it/comm/eurostat/)European Patent Office (http://www.european-patent-of-fice.org/)UK Office for National Statistics(http://www.statistics.gov.uk/)Swiss Federal Statistics Office(http://www.statistik.admin.ch/)Statistics Norway (http://www.ssb.no/)Finish Venture Capital Association (http://www.fvca.fi/)CORDIS (http://www.cordis.lu/)Martin et al. (2003) Regional Venture Capital Policy: UKand Germany Compared, Anglo-German Foundation forthe Study of Industrial Society
Asia – Pacific
Statistics Canada (http://www.statcan.ca)The Statistics Bureau of Japan (http://www.stat.go.jp)Australian Bureau of Statistics (http://www.abs.gov.au)IP Australia (http://www.ipaustralia.gov.au) Statistics New Zealand (http://www.stats.govt.nz)New Zealand Ministry of Education (www.minedu.govt.nz)Israel Central Bureau of Statistics (http://www.cbs.gov.il)Korea National Statistical Office (http://www.nso.go.kr)Statistics Singapore (http://www.singstat.gov.sg/)National Statistics of Taiwan (http://www.stat.gov.tw/)Hong Kong Census and Statistics Department(http://www.info.gov.hk/censtatd/)National Bureau of Statistics of China(http://www.stats.gov.cn/)Beijing Statistical Information Net(http://www.bjstats.gov.cn/)Shanghai Statistics (http://www.stats-sh.gov.cn/)Statistics Tianjin (http://www.stats-tj.gov.cn/)Guangdong Statistical Information Net(http://www.gdstats.gov.cn/)Guangzhou Statistical Information Net (http://www.gzs-tats.gov.cn/)Census of India (http://www.censusindia.net/)Indian Ministry of Statistics and Programme Implementa-tion (http://mospi.nic.in/)Directorate of Economics and Statistics, Government ofMaharashtra(http://www.maharashtra.gov.in/intranet/Deswebpage/)Mumbai Metropolitan Region Development Authortity(http://www.mmrdamumbai.org/)Directorate of Economics and Statistics, Government ofKarnataka (http://des.kar.nic.in/)Government of Andhra Pradesh (http://www.ap.gov.in/)Bombay First (http://www.bombayfirst.org/)
Figures of purchasing power parities used to har-monise monetary values are available from:
OECD (http://www.oecd.org/std/ppp/)World Bank (http://www.worldbank.org/data/)
Other sources include:
United Nations Conference on Trade and Development(http://www.unctad.org/)OECD (http://www.oecd.org/)Asian Development Bank (http://www.adb.org/)UNESCO (http://www.unescostat.unesco.org)
P:33
Chapter 7 - Knowledge Sustainability Components

CCHHAAPPTTEERR EEIIGG
HHTT
1. Introduction
For the past thirty years, the development of theChinese economy has shown distinct characteristicswhich can be generalised as constituting reform andopening-up to the outside world. Reform refers to thechange from the highly centralised planned economy toa market economy, and opening-up refers to the changefrom an extremely closed economy to a more globallyintegrated economy, which can be termed a socialistmarket economy. Given China’s size, there are highlysignificant regional differences in economic and socialconditions, resulting in different growth models. Sincereforming and opening-up to the world in 1970, theChinese economy has developed rapidly. GrossDomestic Product (GDP) increased from US$129.43billion in 1978 to US$9971.76billion in 2006, increasingby 26.8% annually, with GDP per capita increasing 41.35
times . In the past thirty years, China has instigated anumber of regional development strategies (Lin, 1999;Li, 2004; Lu and Wang, 2002; Groenewold et al, 2007).The Chinese government has focused its strategies ondeveloping the East Coastal region, due to moreadvantageous physical and economic conditions(Friedmann, 2006).
Furthermore, development within the East Coastal region isalso unbalanced across three relatively independent regionsconsisting of the Pearl River Delta (PRD), the Yangtze RiverDelta (YRD) and the Bohai Gulf region (BGR) (Figure 1).Within these regions, it is also possible to distinguishbetween the ‘broad’ and ‘narrow’ definition of the region. Thenarrow sense of the Pearl River Delta (nPRD) consists of 9cities, and extends to 14 in the broader sense, with the broadsense of the Pearl River Delta (bPRD) being identical to theprovince of Guangdong. The narrow sense of the YangtzeRiver Delta (nYRD) consists of 16 cities surroundingShanghai; and in the broad sense the Yangtze River Delta(bYRD) region consists of Jiangsu province, Zhejiangprovince and Shanghai. The narrow sense of the Bohai Gulfregion (nBGR) consists of 15 cities surrounding Beijing; andin the broad sense the Bohai Gulf region (bBGR) consistsof Shandong province, Liaoning province, Hebei province,Beijing and Tianjin.
In this chapter, we mainly analyse the three regions in thebroad sense. The three regions include 9 provinces ormunicipalities covering 9.5% surface area and 35.3% of thetotal Chinese population in 2006, accounting for 60.3% oftotal GDP. GDP per capita is 1.7 times higher than thenational average, highlighting the significance of theseregions (Table 1). This chapter focuses on the differingmodels of technology and knowledge diffusion in drivingeconomic growth in each of these regions The chapter isdivided to six sections, with the second, third and fourthanalysing the prevailing models in each of the regions, whilethe fifth provides a comparative analysis across the regions.The final section summarises the major findings anddiscusses their implications.
P:34
Chapter 8: Regional Evolution and Knowledge Diffusion: Evidence from China’s Three Leading Regions by Robert Huggins and Luo Shougui
Chapter 8:Regional Evolution and Knowledge Diffusion:Evidence from China’s Three Leading Regions by Robert Huggins and Luo Shougui
5 In calculating exchange rate we use the Chinese domestic balance price for internationaltrade in 1978 and World Bank purchasing power parity (PPP) for 2006. 1978: 1USdollar=2.80RMB Yuan; 2006: 1US dollar=2.10RMB Yuan.

P:35
Chapter 8: Regional Evolution and Knowledge Diffusion: Evidence from China’s Three Leading Regions by Robert Huggins and Luo Shougui
Area, Population and GDP for the Three Regions (2005) Table 1
The Location of Three Regions Figure 1
2. Bohai Gulf Region: Government Driven Model
2.1 Regional Socio-Economic Characteristics
The BGR is a region with the richest knowledge resourcesand most intensive R&D facilities, including Beijing. In total,382 of the 1,794 (21.3%) universities in China are located inthe BGR. It is also the location for many of the mostprestigious universities, including 29 of the 72 universitiesaffiliated with the Ministry of Education, as well as China’stop two universities: Tsinghua University and PekingUniversity and 28 of Chinese top 100 universities (Wu S.L,2007). The region accounts for 22.3% of Chinese collegestudents, with Beijing and Tianjin having the highest densityof students across China’s 31 provinces. The region has asignificant edge in science and technology development,
with 42 of the 91 institutes of Chinese Academy of Science(most important R&D institutes) located in the region, alongwith R&D activities of the region’s universities. These universities and research institutions provide a competitiveadvantage to the region, especially in terms of human capitaldevelopment. In relation to higher education attainment,more than 7% of the population has received education tojunior college level or above, which is higher than thenational average level by 27.3%, just behind the YRD (Table3). In total, 29.6% of the nation’s R&D researchers are basedin the region, with the aggregate number of scientists andengineers accounting for 28.3% of China’s total (Table 4).
Region Area (km2) Population (million persons) GDP (US $ billion) GDP per capita (US $ billion)
Three Regions Total 911,447 462.07 5,260.49 11,384.62
BGR 520,906 228.82 2,247.90 9,823.88
YRD 210,741 141.4 1,947.51 13,773.06
PRD 179,800 91.85 1,065.07 11,595.75
National Total 9,600,000 1,307.56 8,718.32 6,667.63
Source: National Bureau of Statistics of China, China Statistical Yearbook-2006, Beijing: China Statistics Press, 2006

P:36
Chapter 8: Regional Evolution and Knowledge Diffusion: Evidence from China’s Three Leading Regions by Robert Huggins and Luo Shougui
Comparison of Higher Education Activity across the Three Regions(2005) Table 2
Regions Universities or colleges (1) Top100 (2) Enrolment of students (3)
Total affiliated with theMinistry of Education
BGRs 382 29 28 3,484,464
__Beijing 78 22 16 548,270
__Tianjin 42 2 2 331,553
__Shandong 99 2 5 1,171,284
__Liaoning 76 2 2 659,351
__Hebei 87 1 3 774,006
PRD 101 2 6 874,686
__Guangdong 101 2 2 874,686
YRD 240 16 23 2,253,722
__Shanghai 59 8 8 442,620
__Jiangsu 114 7 14 1,159,795
__Zhejiang 67 1 1 651,307
Other 22 provinces 1,071 25 43 12,140,913
National Total 1,794 72 100 15,617,767
Source: (1) China Education on Line, http://www.eol.cn/article/20040706/3109656.shtml(2) Wu S.L. (2007) Guide to university and college entrance 2007, Beijing: China Statistical Publishing House.(3) National Bureau of Statistics of China. (2006) China Statistical Yearbook-2006, Beijing: China Statistics Press.
Comparison of Science and Technology Talent across the Three Regions(2005) Table 4
Regions R&D personnel Scientists & engineers
Number Number/per Number Number/per (1000 employees) 1000 inhabitants (1000 employees) 1000 inhabitants
BGRs 403.3 1.76 726 3.17
__Beijing 171 11.12 283 18.40
__Tianjin 33.4 3.20 61 5.85
__Shandong 91.1 0.99 177 1.91
__Liaoning 66.1 1.57 121 2.87
__Hebei 41.7 0.61 84 1.23
PRD 119.4 1.30 224 2.44
__Guangdong 119.4 1.30 224 2.44
YRD 275.1 1.94 530 3.75
__Shanghai 67 3.77 138 7.76
__Jiangsu 128 1.71 228 3.05
__Zhejiang 80.1 1.64 164 3.35
Other 22 provinces 567 0.67 1081 1.27
National Total 1364.8 1.04 2561 1.95
Source: China S&T Statistics, http://www.sts.org.cn/sjkl/kjtjdt/data2006/(2) Wu S.L. (2007) Guide to university and college entrance 2007, Beijing: China Statistical Publishing House.(3) National Bureau of Statistics of China. (2006) China Statistical Yearbook-2006, Beijing: China Statistics Press.
Comparison of Educational Attainment across the Three Regions (2005) Table 3
Source: National Bureau of Statistics of China, China Statistical Yearbook-2006, Beijing: China Statistics Press, 2006
Regions Population Aged 6 Proportion of Junior Proportion of Senior Proportion of College and Over Secondary School /% Secondary School /% and Higher Level /%
BGRs 2,853,161 43.06 13.89 7.08
__Beijing 196,019 32.15 25.13 24.49
__Tianjin 132,069 37.94 21.10 14.08
__Shandong 1,146,600 41.85 12.59 4.44
__Liaoning 532,275 45.87 13.72 8.34
__Hebei 846,198 46.27 12.04 4.73
PRD 1,144,620 40.41 15.40 5.81
Guangdong 1,144,620 40.41 15.40 5.81
YRD 1,777,783 37.42 15.15 7.74
__Shanghai 227,240 35.87 24.92 17.84
__Jiangsu 939,782 39.45 14.74 6.80
__Zhejiang 610,761 34.87 12.14 5.42
Other 22 provinces 10,10,2791 36.94 11.22 4.72
National Total 15,878,355 38.35 12.44 5.56

P:37
Chapter 8: Regional Evolution and Knowledge Diffusion: Evidence from China’s Three Leading Regions by Robert Huggins and Luo Shougui
2.2 Analysis of the Regional Economic Growth model
There are clearly historical explanations for these humanresource, education and science and technologyadvantages. Northern China, with the capital Beijing as thecentral and most planned economy, is an important receiverof national investment. For example, the Liaoning provinceof the region was a key investment target during the 1950s,receiving 1.45 billion RMB in 1950-1952, 20% of theaggregate investment for the nation during the period. In1953-1957, during the period of the first Five-year Plan,when heavy industry development was accelerated, 24 ofthe 156 national key projects were located in Liaoningprovince. Beijing has been the key region receivinginvestment, particularly economical, educational and R&Dinvestment.
During the 1990s, China focused more on the developmentof technology and education. ‘The decision on acceleratingthe development of technology by The CPC CentralCommittee and State Council’ published in 1995 proposedthe strategy of strengthening the nation by the developmentof technology and education. The government realised theinternational competence of Chinese economy was weak,and set the strategy in place to develop science andtechnology and promote industrial upgrading. The mainmethods consisted of increasing R&D investment inuniversities and other related research institutions, andpromoting the cooperation and networks betweenenterprises and the research institutions to acceleratetechnology upgrading through knowledge transfer. TheChinese Academy of Science affiliates in the region alsoreceived a significant proportion of these investments. Inrecent years, government R&D investment in the region hascontinued to grow and on a per capita basis is ranked thirdacross the globe, although private sector R&D expenditureremains relatively low.
As shown by Table 5, there are significant differences in thestructure of R&D expenditure across Beijing, Shanghai andGuangdong. Enterprises account for 61.1% of total R&Dexpenditure in Shanghai and 89.9% in Guangdong, but only15.1% in Beijing. In general, the BGR region receives aconsiderable proportion of the government’s R&Dinvestment, with most investment consisting of technologicaland financial allocations by central government. However,the proportion of expenditure by local government issignificantly lower in BGR than in YRD or PRD.
The higher investment in science and technology bygovernment in the BGR results in universities and researchinstitutions facilitates higher levels of R&D and technologicaldevelopment. In order to understand the diffusion of theknowledge it important to assess the extent to which it isbeing commercialised through activities such as patentingand licensing, contract research, or creating spin-offcompanies (Kroll and Liefner, 2007; Huggins, 2008). Atpresent the legal system in China, in terms of intellectualproperty rights, has not yet transformed to a stage wherepatenting and licensing is a feasible option for manyuniversities. In the case of BGR, such is the extent ofgovernment research funding to universities and researchinstitutions, that most are not ‘reliant’ on forming industrialcollaborations, which are generally weakly developed. As aresult, the development of spin-off companies has becomethe most viable option for many researchers in BGR seekingto commercialise their knowledge or technology.
Comparison of R&D Expenditure Structure in Beijing, Shanghai and Guangdong (2005) Table 5
Region Total R&D Independent Research Institutions of Higher Large & Medium-sizedExpenditure Institutions Education Sub-total Enterprises Sub-total
(US$) Amount Proportion % Amount Proportion % Amount Proportion %
Beijing 13,519 9,528 70.5 1,915 14.2 2,076 15.4
Shanghai 9,242 2,351 25.4 1,242 13.4 5,649 61.1
Guangdong 10,501 420 4.0 637 6.1 9,445 89.9
National Total 105,010 26,864 25.6 12,686 12.1 65,461 62.3
Source: China S&T Statistics, http://www.sts.org.cn/sjkl/kjtjdt/data2006/Note: the amounts in shown in this table excludes expenditure by other institutions and organisations.
Comparison of Science and Technology Expenditure by Local Government across the Three Regions(2005) Table 6
BGRs YRD PRD
Municipalities Proportion by Municipalities Proportion by Municipalities Proportion byor Provinces Local Government or Provinces Local Government or Provinces Local Government
% % %
Beijing 37.6 Shanghai 79.3 Guangdong 83.8
Tianjin 13.7 Jiangsu 36.7
Shandong 26.5 Zhejiang 50.0
Liaoning 28.0
Hebei 11.2
Source: China S&T Statistics, http://www.sts.org.cn/sjkl/kjtjdt/data2006/

P:38
Chapter 8: Regional Evolution and Knowledge Diffusion: Evidence from China’s Three Leading Regions by Robert Huggins and Luo Shougui
From the 1990s onwards, universities and researchinstitutions in BGR have began to develop spin-off firms, withsupport from the government, such as permission to listthese firms on Chinese stock markets. In 2005, 24companies affiliated to universities are listed on stockmarkets, with 9 of them located in BGR, including spin-offfrom Peking University and Tsinghua University (Table 7).Alongside these listed firms there are a host of other smallernon-listed smaller spin-off firms. Alongside the universities,the Chinese Academy of Science has 489 companiesaffiliated to it, a number of which have received privatesector investment, with investors including the Chinese-owned Lenovo Group, which bought out much of IBM’shardware activities in 2004.
This model of development can be considered government-driven due to the roots of knowledge investment residingwith central government, but furthermore government hasundertaken other roles such as constructing developmentzones as a means of stimulating further knowledge diffusion.BGR accounts for 23,728 of the nation’s 41,990 high-technology enterprises and 32.1% of high-technologyemployment and 26% of gross output (Table 8). While BGRhas a traditional resource superiority of other Chineseregions, with an industrial structure dependent on theproduction of crude salt, crude oil, soda ash, caustic soda,steel and glass (Li, 2004), its most recent evolution hasincorporated the innovative activities of universities,research institutions, and development zones. In general,the development of BGR is operating along two-dimensions:one consisting of government supported knowledge diffusionand innovation, and another that continues to operate in amore traditional manner unexposed to new developmentsoccurring in the region.
Stock Listed University Spin-Off Firms in the Bohai Gulf Region (2005) Table 7
Name of Companies University Affiliation Sub-Regional Location
China Hi-Tech Co., Ltd. Tsinghua University, Peking University and other 34 Universities Mainly in Beijing
Shenyang Nuesoft Co., Ltd. North East University Liaoning
Beijing Tianqiao Beida Jade Bird Sci-Tech Co., Ltd. Peking University Beijing
Founder Technology Group Corp Peking University Beijing
Tsinghua Tongfang Co., Ltd. Tsinghua University Beijing
Unisplendour Corporation Ltd. Tsinghua University Bejing
Shandong Shanda Wit Science and Technology Co., Ltd. Shandong University Shandong
Tianjin Xinmao Technology Co., Ltd. Tianjin University Tianjin
Tianjin Guangyu Development Co., Ltd. Nankai University Tianjin
Source: Shanghai Stock Exchange, Shenzhen Stock Exchange, 2006.
Comparison of High-Technology Enterprises across the Three Regions (2005) Table 8
Development Number of Enterprises Number of Employees Gross Output Value Total Income ExportsArea (Units) Employees (US$ billion) (US$ billion) (US$ billion)
BGRs 23,728 1,672,518 358.32 503.69 19.78
PRD 2,423 546,448 200.52 210.67 27.911
YRD 3,281 834,375 347.91 389.29 51.42
Other 22 provinces 15,854 2,696,696 767.25 870.41 79.26
National total 41,990 5,211,960 1,378.93 1,638.84 111.65
Source: National Bureau of Statistics of China, China Statistical Yearbook-2006, Beijing: China Statistics Press, 2006

3 The Pearl River Delta: FDI driven model
3.1 Regional socio-economic characteristics
The PRD is one of the three most developed regions ofChina. In 2005, Guangdong province covered only 1.9% ofthe surface area of China, but accounted for 7% of thepopulation, 12.2% of national GDP, and 13.5% of thesavings of the Chinese population. PRD has developed anexport-oriented economy, with the sum of imports andexports, as well foreign capital, the highest of all provincesin China. In 2005, the imports and exports of GuangdongProvince amounted to US$428 billion, accounting for 30%of the total Chinese value. Between 1979 and 2005, totalforeign investment was US$163 billion, 20% of national total,with the region the location for 58,762 enterprises withforeign investment (23% of the Chinese total). GuangdongProvince was in many ways the pilot region for Chinesereform, which has subsequently provided it a range ofinstitutional advantages that have stimulated rapid economicdevelopment (Xie and Costa, 1991). Between1978 and2005, the GDP of Guangdong Province grew more thanthirty-fold (at constant prices), with an average annualgrowth of 13.7%, while China's GDP grew twelve-fold at anaverage annual rate was 9.6%, Guangdong was 4.1percentage points higher than the national average levelannually. Guangdong's economy grew especially fast duringthe period 1990-2000, with an average annual GDP growthof 15.2%, above the 10.4% rate experienced by China as awhole (Figure 2). This resulted in Guangdong’s contributionto national GDP rising from 5.1% in 1978 to 13.7% by 2005(Figure 3).
Compared to it outstanding economic growth, developmentof PRD’s science and technology base, as well aseducational improvement, has been relatively moderate. Thenumber of inhabitants in Guangdong receiving college andhigher level education is 5.8% of inhabitants, only slightlyhigher than the national rate of 5.6% (Table 2). There are14,622 students studying in college per 1 million inhabitantsin the region, which is almost 10% below the nationalaverage level, with Guangdong ranking only 15th acrossChina's 31 provinces, autonomous regions andmunicipalities, and well below student enrolment rates inYRD and BGR (Table 9).With regard to science andtechnology personnel, numbers of both R&D and Scientistsand Engineers per capita is only 25% higher than thenational average (Table 3), well below the proportion ofknowledge workers in YRD and BGR.
P:39
Chapter 8: Regional Evolution and Knowledge Diffusion: Evidence from China’s Three Leading Regions by Robert Huggins and Luo Shougui
Comparison of GDP growth between Guangdong and China Figure 2
Source: (1)National Bureau of Statistics of China, China Statistical Yearbook, Beijing: China Statistics Press, 2006.(2)Guangdong Statistics Bureau, Guangdong Statistical Yearbook, Beijing: China Statistics Press, 2006.
Contribution of GDP growth of Guangdong to China Figure 3
Source: (1)National Bureau of Statistics of China, China Statistical Yearbook, Beijing: China Statistics Press, 2006.(2)Guangdong Statistics Bureau, Guangdong Statistical Yearbook, Beijing: China Statistics Press, 2006.
Regions College students per million inhabitants
PRD 14,622
YRD 21,992
BGRs 21,111
National Total 16,126
Source: National Bureau of Statistics of China, China Statistical Yearbook,Beijing: China Statistics Press, 2006
Comparison of Numbers of College Students Table 9across the Three Regions (2005)

3.2 Analysis of Regional Economic Growth Model
Historically, the economic history of PRD is almost theopposite of BGR. Before reform and opening, this region isbest described by Chinese saying Yiqiong erbai: poverty andblankness. Under the central planning system, Guangdongwas given a very low priority in terms of resource allocation,mainly due to its relatively weak industrial foundation andthe government’s concern with its geographical proximity toHong Kong and Taiwan, which in the Chinese leadership’sview were bases for external hostile forces to subvert thecommunist regime (Vogel, 1989). In 1978, Guangdong’sGDP per capita was 367 yuan, a little lower than the nationalaverage of 377 yuan, and lower than of both YRD (604 yuan)and BGR (482 yuan). In 1980, the industrial sectoraccounted for only 36.3% of the province’s national income,much lower than the national average of 48.9%.
Dialectically, this under-development was considered bygovernment to possess numerous advantages for testingnew reforms and modes of openness (Chairman MaoZedong stating: there being no burden for a sheet of blankpaper, so new and beautiful pictures can be drawn on it) andin 1978 when China first chose the path towards reform PRDwas decided upon as the pilot area. Three of the four specialeconomic zones established in 1980 - Shenzhen, Zhuhai,and Shantou - are in Guangdong province (the other Xiamenis in Fujian province) and among the 14 opened coastal portcities established in 1984, two cities - Guangzhou andZhanjiang – in PRD were included. As part of its pilot status,Guangdong was granted a range of “special polices andflexible measures”, with the region playing the role of both atesting ground and a showcase for China’s new economicpolicies. In contrast to traditional central authority policies,unified control over provincial revenue and spending wasreplaced with an arrangement that required the provincialgovernment to remit to the central treasury fixed amounts ofrevenue according to annual targets specified for a five-yearperiod starting from 1980, with any surplus above the targetsleft at the disposal of the provincial government. Second, theprovincial government was given increased decision-makingauthority over a wade range of economic issues, includingplanning, investment, price control, economic regulations,foreign economic relations, and wage and labor (Eng, 1997).This arrangement of decentralisation and marketisation wasobviously unprecedented at the time.
Upon receiving decision-making autonomy Guangdongprovince set about implementing a market economy, with thelocal government’s priority being to use the ‘market’ toovercome deficiencies in capital, technology, and skilledworkers through the attraction of FDI. Measures relating toextremely preferential taxation rates were initiated, with atax rate of only 15% imposed for overseas investorscompared to 33% for domestic enterprises (as well as a taxholiday during the first two years of business), a policy whichremains in effect in 2007, along with a plethora of land-usepolicies were initiated. Land use policymaking was aided bydifferences between urban and rural land ownership rights.In rural areas, farmers own their land collectively, while inurban areas, the state owns the land, allowing localgovernments to change the ownership of the former into thelatter at a very low cost, with the earning capacity of the landfor farmers being very limited at that time. In the early 1980s,the fee for 30-year land use rights by foreign-fundedenterprises was between US$0.4-0.8 million per hectare,and due to competition among city governments in manycases it was lower and even close to zero. By 2006, in somecities of the PRD the fee was still less than US$0.1 millionper hectare (Xie, 2006).
Catalysed by these policies, FDI in PRD increased quicklyand in 1980 Guangdong province received foreign capital ofUS$214.19 million. By 1990, this had reached US$2,023.47million, rising to US$14574.66 million in 2000 andUS$15,173.58 million in 2005. In 2001, the highest year sofar, foreign investment in Guangdong province accountedfor 31.7% of the national total.
Besides the capital and land, another factor requiringattention in PRD was the workforce and skills development,due to the historic lack of an industrial base and anassociated well-trained pool of workers. Following reformand opening up, about 250 million of China's 400 millionfarmers departed from agricultural production and turned toopportunities elsewhere, a process which was extremelyprevalent in PRD, whereby many foreign enterprises startedto employ workers from the rural interior, in return for wagesbetween two or three times their original farm income, Whilemany of these workers had only received junior middleschool education, after a short-term period of training they
P:40
Chapter 8: Regional Evolution and Knowledge Diffusion: Evidence from China’s Three Leading Regions by Robert Huggins and Luo Shougui
Total value of foreign capital absorbed by Guangdong Province from 1979 Figure 4
Source: Guangdong Statistics Bureau, Guangdong Statistical Yearbook, Beijing: China Statistics Press, 2006.Note: There is some difference in statistical accounting before and after 2002.

qualified are workers able to undertake manually andmachine operating role in the labour-intensive industries,such as toy-making, garment processing, shoe-making,electronics assembly, that were the main feature of the firstwave of FDI in PRD. Although one might assume that aresult of this migration of labour from the rural to urbanareas, such is the size of China's rural labor force the wagesof farm workers has remain almost static, with the wage forrural workers in PRD increasing by only 68 Yuan between1992 and 2004 (Qiao and Chen, 2003; Wu, 2005).
Alongside its special development status, the geographicalproximity of PRD to Hong Kong has also been an importantfactor in the region’s growth, as has been the network tieswith Chinese emigrants around the world originating fromthe region. There are approximately 20 million Chineseemigrants living around the world, about 70% of whom haveancestral roots in Guangdong (Guan and Zhu, 1992).Furthermore, the dialect spoken by people in PRD is quiteunique, and is very different from Chinese pronunciation inother regions (meaning Chinese people in other regionsoften have difficulty understanding this dialect). However, itis similar to that spoken in Hong Kong, which has promotedcultural ties between Hong Kong and PRD (Vogel, 1989;Shirk, 1994).
Between 1979 and 2005, Guangdong received US$162.85billion in foreign investment of which US$105.42 billion US(65%) came from Hong Kong (Figure 5), and before 1990the proportion was even higher, being between 80-90%(Huang, 1995). In the 1980s, as Hong Kong's localmanufacturing costs increased, and its internationalcompetitiveness started to decline, the reforms in PRDrepresented an opportunity to reassert the competitivenessof Hong Kong’s industrial capital. The model initiallyestablished was called qiandian houchang – meaning the‘store in the front’ (Hong Kong) and ‘factory in the backyard’(PRD) (Eng, 1997). This model made full use of HongKong’s position as an international trade centre position, andthe opportunity to investment in new manufacturing sites inthe cost competitive PRD. While Hong Kong remained theshop window, production took place in PRD, with transportcosts relatively low due to close proximity, with most of thePRD region being only one hour’s driving time far from HongKong (Cheng, et al, 2004). In terms of the productionprocess, after the raw materials arrive at Hong Kong KwaiChung Harbour they are processed into components are on
the assembly line in PRD within hours, with final productstransport back to Hong Kong to be shipped around the world(Yu, 2005).
Although the dominance of Hong Kong investment hasbecome more diluted in recent years, these links remain vitalfor the regional economy. Along with Hong Kong, Taiwan,Macao and overseas-based Chinese investors located inSoutheast Asia account for 74% of foreign investment inPRD, with investment coming from North America, Europe,Japan, and other developed countries accounting for 12%.In general, PRD success in attracting FDI is clear, but isperhaps surprising given that other regions, such as YRD,had a far better industrial base and more developed sourcesof human capital already in place. However, it is also clearthat the type of investment occurring was very much relatedto traditional industries, and mature – in some cases almostobsolete - technology (Zheng, 2006). This meant that thelack of indigenous base did not represent a major for thistype of investment quickly embedding itself in the region.FDI, therefore, provide the means for the region to slowlyabsorb the range of knowledge – including managementskills and general technical competencies – allowing it toshift towards more advanced form of economic development(Balasubramanyam, 1996). Overall, FDI in PRD has playeda key role in facilitating the shift to a market economy,providing a model of modern industrial productionorganisation and management, and a bridge to theinternational market. Therefore, in the economic ‘take-off’process in PRD, FDI provided a general framework forknowledge transfer, rather than a specific focus ontechnology transfer. It turned a planned economy into amarket economy, a traditional economy into a moderneconomy, and a local economy into an internationaleconomy.
The knowledge transfer process has mainly been facilitatedthrough middle-level managers and workers operating withinthe foreign-owned enterprises. In PRD, many Chinesemiddle-level managers working in foreign-owned enterprisesfor a number of years, mastering basic productionmanagement processes as well market information,eventually become entrepreneurs and start their ownbusinesses, employing and skilling a new wave of workers,with the new business usually supplying it products to theforeign investors, which again receive cost advantages. Asthe products tend to remain intermediate inputs they do not
P:41
Chapter 8: Regional Evolution and Knowledge Diffusion: Evidence from China’s Three Leading Regions by Robert Huggins and Luo Shougui
Total value of foreign capital absorbed by Guangdong Province by districts - source during 1979-2005 Figure 5
Source: Guangdong Statistics Bureau, Guangdong Statistical Yearbook, Beijing: China Statistics Press, 2006.

increase the propensity of these new firms to utilise moreadvanced technology, with learning processes for thesefirms tending to relate to internationalization, rathertechnological upgrading (Chen et al, 2005). However, thissituation is gradually changing, with local enterprisesbeginning to become less dependent on foreign-ownedenterprises as a new cluster of large and medium-size localdomestic enterprises grown in the PRD. Rather than theprevious focus on ‘imitated innovation’, the firms areestablishing ‘self-initiated innovation’ that can compete withthe foreign investors. For example, the capacity of self-initiated innovation among firms such as Huawei, ZTE, andTCL has improved markedly in recent years. As China'slargest telecommunications equipment firm, Huawei wasfounded in the PRD city of Shenzhen in 1988, and despite itsshort history is now applying for more than 1,000 patentregistrations annually. By 2007 Huawei had applied for morethan 22,000 patents and from 2000 it has recruited 1,000-2,000 IT graduates annually from China's leadinguniversities. Annual investment in R&D is more than 10% ofsales, and it has set-up R&D facilities in India, the UnitedStates, Sweden, Russia, as well as Beijing, Shanghai andNanjing. It is claimed at 48% of the firm’s 62,000 employeesare engaged in R&D. In 2006, sales revenues reachedUS$31.24 billion, 65% of which came from overseasmarkets, ranking first and second globally for sales in itsproduct range.
Huawei is not an isolated case, and a new group of localenterprises have grown up initially learning from foreigninvestors, and subsequently competing with them. This morerecent development of local high-technology enterprises hasplayed a positive role in improving the knowledge andtechnology structure of the PRD region. These companiesnot only attract a large number of technical personnel fromChina, but also promote the government's public investmentin R&D and related services. As a result, a number ofinnovative technology platforms have been established,which in turn further attract investment from foreign-ownedhigh-technology enterprises, promote their R&D activities,and improve their export product base. In 2000, high-technology products in PRD accounted for 25% of theexports of foreign-owned enterprises, by 2005 this hadincreased 43%, which highlights the gradual shift from alabour-intensive and primary processing region to one that isbeginning to develop a growing and complementaryknowledge-based sector. It also highlights the change inPRD’s economic growth path from a dependency oninvestment-driven economic growth to one that is beginningto encompass technical innovation (Tan, 2005). PRD is inthe process of moving from receiving and absorbing ofstrategic management knowledge to creating its owntechnological knowledge for innovation.
4. The Yangtze River Delta: City-Network Driven Model
4.1 Regional Socio-Economic Characteristics
YRD is China’s strongest economic region. In 2006, itaccounted for 22.2% of China’s total GDP, with only 2.2% ofthe land mass and 10.8% of the total population. Its GDPper capita is twice the national average, and in 2006 reachedUS$6,004, which based on purchasing power parity equatesto US$ 22,304. At the core of the region is Shanghai, whichhas a GDP per capita of US$27,016. About one-half ofChina’s most developed counties are with YRD, which isalso China’s most urbanised. The region consists of 80cities, small and large, which constitute a hierarchy structureconducive to industrial development and knowledgediffusion. YRD has a strong industrial foundation, and is thebirthplace of China's modern industry, which began to takeshape in Shanghai, Wuxi and Suzhou in the early 20thcentury. Before reform and opening-up, the state-ownedenterprises in YRD were the largest, with industrial outputfor Shanghai alone accounting for 12.5% of national outputin 1980. At the same time, the collective enterprises in theregion - at that time called ‘township enterprises’ – were themost advanced in China, especially in Jiangsu province, withthe volume and output value of township enterprisesaccounting for almost half of the nationwide total (Luo andZeng, 2001). Therefore, it is important to account for YRD’sindustrial foundation when analysing the rapid economictake-off which occurred following reform.
YRD is China’s most advanced science, technology, andeducation. Historically, it is a region that always attached agreat importance to education, and has among the highestlevels of education attainment in China (Table 3). In morehistoric times, a large number of famous scientists andacademics originated from the region, while more recentlythe number of R&D personnel and scientists and engineersper 1,000 residents in YRD is almost twice the nationalaverage, and is higher than the other two regions (Table 4).In 2005, the total R&D expenditures reached US$30.55billion, accounting for 26% of the national total (Table 10).
YRD has traditionally been one of China's most openregions, and after the Opium War Shanghai, as part of thefirst batch of modern Chinese cities, was forced to open itsgates and began the process of modernisation, developingsignificant links with the capitalist production mode. By the1930s, Shanghai had become the centre of China’s nationalindustries, with the largest light industrial base. It developedas an important international financial and trade centre inFar East. Post 1978, and its openness has continued todevelop, which has been enhanced by the massivedevelopment of the Pudong area of Shanghai as a newfinancial centre.
P:42
Chapter 8: Regional Evolution and Knowledge Diffusion: Evidence from China’s Three Leading Regions by Robert Huggins and Luo Shougui
Comparison of R&D Expenditure across the Three Regions (2005) Table 10
Regions Amount Proportion of the national total Per capitaUS$ billion % US$s
BGRs 43.58 34.02 190
PRD 12.75 9.95 138
YRD 33.55 26.18 237
Other 22 provinces 38.23 29.85 45
National total 128.11 100.00 99
Source: (1)China S&T Statistics, http://www.sts.org.cn/sjkl/kjtjdt/data2006/;(2) National Bureau of Statistics of China, China Statistical Yearbook, Beijing: China Statistics Press, 2006

4.2 Analysis of the Regional Economic Growth Model
As already indicated, compared to PRD and BGR, YRD hassuperiority in terms of the industrialisation, urbanisation anda historically rooted form of openness. Therefore, while YRDformally opened to the outside world, following the 1978reforms, one stage later than PRD, the economicdevelopment of the region was rapidly activated by therelaxation of the planned economy and the introduction ofmarket mechanisms. While PRD’s economy has mainlydepended on FDI-driven forces and BGR’s on government-driven forces, YRD display a different form of economicdriver based on the development of a city-network drivenmodel whereby new knowledge and technology becomesfirst diffused from the core city of Shanghai to moreperipheral cities and then across the region’s industrial andbusiness base a whole. PRD’s system of cities, with a rangeof small, medium and large cities, can be conceptualised asa pyramid, with Shanghai as the core city and its apex. Thediffusion effect through this pyramid displays two forms:neighbor diffusion and rank diffusion (Hagerstrand, 1969).Neighbor diffusion mainly manifests itself throughShanghai’s industrial linkage with adjacent cities in southernJiangsu and northern Zhejiang, where there a strong degreeof economic connectedness. Rank diffusion mainlymanifests itself through advanced technolgical transfer withlarger cities such as Nanjing, Suzhou, Wuxi, and Hangzhou,on through to the medium and smaller cities.
Shanghai’s technological foundation and human resourcecapability – particularly at management level – results in ahigher regional technology absorption effect than otherregions. One output of this is that it is able to cooperate andcollaborate more easily with other technological players,such as multinationals, on the global stage. After infusingthis technology, Shanghai is able to diffuse and transfer itthroughout the region as a whole via the city-networkpyramid. Furthermore, Shanghai plays a similar role at thenational level, acting as the convergent pivot technologicallyconnecting China with the global economy (Figure 6). Fromthis perspective, in newly developing nations, relatively well-developed core cities play an extremely important leadershiprole at the economic take-off stage. At a regional level, therapid development of YRD is closely related to the economicand technological function of Shanghai.
Looking more closely at this form of regional knowledgediffusion in YRD, it is clear that both firms and universitiesplay important roles within the city-network framework. Interms of diffusion across firms, technology diffuses fromoverseas enterprises to domestic enterprises, as well asfrom state-owned enterprises to newer enterprises in theregion. One reason why technology and knowledge is betterdiffused from overseas firms to domestic firms in YRD thanin PRD is the higher absorptive capacity of YRD’s domesticenterprises, and stronger capability to engage in technologytransfer. Also, the proportion of FDI from Europe, NorthAmerica is more than double in YRD compared to PRD,which, as we have seen, mainly stems from other emergingAsian industrialized. This has led to the development of farmore joint ventures and collaborative agreements betweenforeign investors and domestic firms in YRD than PRD. FDIfrom the west has tended to be significantly more advancedthan other foreign investors in relation to technology andintegrated management, and the diffusion effects oftechnology and synthesised knowledge are more apparent,taking a vital role in improving the technological andindustrial structure of the region (Gan, 2003). Between 1978and 2005, 57% of FDI in Shanghai was in the form of jointand cooperative ventures, compared with only 19% inGuangdong. The ventures facilitate domestic firms inaccessing technical and management training, advancedequipment support, and technical guidance and so on. Forinstance, in the automobile industry, Shanghai has enteredjoint venture or cooperation agreements with Volkswagen,GE, Daewoo and Ssangyong, with the government playinga role in guiding the framework of these agreements, suchas the setting of quality standards across industries,especially the automotive and transport sectors.Government’s setting of standards is intended to promotetransparency across the parties involved in joint ventures,promoting further bilateral cooperation and technologytransfer.
Diffusion from state-owned enterprises to other firms inregion mainly occurs through the introduction of technicalworkers and new industrial facilities. China’s state-ownedenterprises still possess the highest quantity and best qualityspecialised technological human resources, with Shanghai’sstate-owned enterprises being China’s strongest. Therefore,
P:43
Chapter 8: Regional Evolution and Knowledge Diffusion: Evidence from China’s Three Leading Regions by Robert Huggins and Luo Shougui
The Diffusion Function of Shanghai Figure 6

P:44
Chapter 8: Regional Evolution and Knowledge Diffusion: Evidence from China’s Three Leading Regions by Robert Huggins and Luo Shougui
many technological problems arising in private enterprisesand collectively operated enterprises throughout YRD canpotentially be solved by specialised talent residing inShanghai’s state-owned enterprises. As early as the 1980swhen Jiangsu and Zhejiang’s township enterprises andprivate enterprises lacked technical talents, they invitedengineers from Shanghai to help them solve technologicalproblems largely in their spare time, a phenomenon whichbecame known as the ‘weekend engineer’ and becamemore formalised in the 1990s (Rui, 2006). Similarly, at a firmlevel, state-owned enterprises in Shanghai have a longtradition of supplier relationships with collectively-operatedand private enterprises in Jiangsu, Zhejiang and theShanghai suburban districts, usually producing spare partsand other upstream and downstream products. Throughthese links, state-owned enterprises have introduced qualitystandards and provided technical training to their workers.Although these links cannot be said to have diffused coretechnologies from Shanghai across the region, they haveacted as an important diffuser of knowledge stimulating theinitial growth of private enterprises located in the region’ssmaller and more medium-sized cities.
Technological diffusion from universities to firms is also moreapparent in YRD than PRD or BGR. While the number ofuniversities in the core city Shanghai is slightly smaller thanthat of Beijing, their ability to undertake technologicalcommercialization is much stronger than the universities inBeijing. An important difference is that the main researchfunds for Beijing’s universities are sourced from national andlocal government, while Shanghai’s universities obtain muchof their funds from the private sector, particularly through theprovision of technology services and contract research. Themore developed industrial base in YRD has heighteneddemand for these services and research, and universities inShanghai have taken a strong initiative in meeting thisdemand, with R&D projects funded to ensure they are closeto market demand. Such university-enterprise cooperationis a very important lever in promoting knowledge andtechnology diffusion from universities to enterprises. Insummary, the spatial technology diffusion effect in YRD overthe 30 years is more marked than it is PRD and BGR. Withinthis process, the city-network configuration and urbanstructure of YRD plays an important and advantageous rolein facilitating technology diffusion.
5. A Comparison of Regional Growth and Diffusion
5.1 Growth
Although all three regions have achieved very high levels ofgrowth since 1978, such growth and development has notbeen uniform, with PRD experiencing the most rapideconomic development and BGR the least. Between 1978and 2005 the compound annual GDP growth rates of BGR,PRD and YRD are 14.9%, 16.8% and 15.4% (at currentprices) respectively. When comparing the two Delta regions,we find that although GDP per capita of the YRD is higher inabsolute value, the PRD’s performance is higher due to itslow starting base (Figure 7).
The growth difference across the three regions may partlyresult from the transfer effects of internal and externalknowledge and technology. PRD is the most market-orientedregion among the three, and the market plays a critical rolein resource allocation. Although its knowledge andtechnology levels are lower than the other regions, itsinternal diffusion effect is apparent. As for BGR, during itsrestructuring and reform it has not moved as swiftly towardsa market-oriented system as the two Deltas due to thehistorical issues mapped out in this study and the continuingmomentum of a planned economy approach. In the region,enterprises lack vitality and technology commercialisation isdifficult relative to the two other regions. While there issignificant research undertaken by universities and scientificinstitutes, it is not often oriented towards market demand,resulting in a supply of knowledge disconnected fromdemand. As a result, commercisalisation activity has tendedto be towards the development of spin-off enterprises, ratherthan other forms of knowledge transfer, restricting diffusionacross the region as whole. Furthermore, many of the spin-off firms established by universities and scientific institutesdo not operate according to market forces, and are highlydependent on state support and the government as theirchief customer (Kroll and Liefner, 2007).
The growth of three regions during 1978-2005 Figure 7
Source: National Bureau of Statistics of China, China Statistical Yearbook, Beijing: China Statistics Press, 1978-2006.
State: GDP is figured out at current prices, and the unit is RMB yuan, and data from 2001 was modified based onChina Economic Census results in 2004.

5.2 The Spatial Diffusion of the Three Regions
The spatial diffusion of knowledge and technology withinregions can drive their economic development and,particularly in the case of Chinese regions, this diffusionoccurs through a pattern where knowledge emanates in thecore cities and diffuses through to the periphery. In order tomeasure differences across our three regions, we use thefollowing formula:
Here F denotes the degree of centralisation of the core city,CT0 and CT1 the GDP per capita in 1978) and 2005,respectively, of the core city, RT0 and RT1 the GDP percapita in 1978 and 2005, respectively, of the region in whichthe core city is located.
Correspondingly, the numerator part denotes the degree ofcentralisation the core city relative to the region in 1978, andthe denominator part denotes the degree of centralisation in2005. If the value of F is bigger than one, it means thedisparity between core city and periphery during the periodhas shrunk; the bigger the value is the more disparity hasshrunk. In contrast, if the value of F is less than one it meansthe disparity between the core city and the periphery haswidened; the less the value is the more the disparity haswidened. If the value of the two components of F rises,agglomeration processes have occurred in the region. Inother words, the core city has attracted resources from therest of the region. If the value of the two components of Fdecreases, diffusion effects can be said to have occurredacross the region. In other words, the core city mainlydistributes resources to the region and drives the economicdevelopment of the region as a whole.
We use formula (1) to compute the variations in the degreeof centralization (F) of BGR, PRD and YRD, with therespective results being 1.19, 2.31 and 1.36. It is clear that
between 1978 and 2005, the rate of centralisation in BGR isless than in the other two regions. The degree ofcentralisation of the core city, Beijing, in BGR actuallydecreases slightly from 2.59 in 1978 to 2.17 in 2005.Meanwhile, the degree of centralisation of the core cityShanghai in YRD decreases sharply from 4.11 in 1978 to1.78 in 2005, with the degree of centralisation of the corecity Guangzhou in PRD decreasing from 2.46 in 1978 to 1.81in 2005.
The decrease in centralisation reflects the diffusion effectfrom the core city, with a strengthening of each of the regionsas a whole. In the three regions, the YRD has the highestdiffusion and BGR the least. One possible explanation is thesize of the region. However, other research has found thatmany of the areas in close proximity to Beijing are amongthe region’s poorest, with these areas termed the ‘PovertyBelt’, which account for almost 4,000 villages and 27 millionpeople when the neighbouring areas around the region’sother core city of Tianjing are included (Fan, 2005; Wei,2005). This poverty belt is acknowledged by the governmentas restricting the diffusion of knowledge and technologyinnovation in the region, and compares unfavourably toYRD, whereby knowledge created in Shanghai appears todiffuse to many neighbouring counties, which are amongChina’s most prosperous.
5.3 The General Difference in Growth and Diffusionacross the Three Regions
It is very interesting to note the differences across the threeregions, which can be analysed further by the use of theStructure Conduct Performance (SCP) framework. Althoughthe SCP framework is generally a model to understand thelinks between firms and their markets (Stigler, 1968), it canalso be utilised to frame the links between regions and theirdevelopment. In effect, we argue that different socio-economic structures have led to different economic paths,resulting in different levels of performance. Thesedifferences are summarised in Table 11.
P:45
Chapter 8: Regional Evolution and Knowledge Diffusion: Evidence from China’s Three Leading Regions by Robert Huggins and Luo Shougui
CT0 RT0
CT1 RT1
F =
Evolutionary Comparison of the Three Regions Table 11
The BGRs: Government-driven model
Good economic foundation. Richestresources for science & technology andeducation, Strong influence of thegovernment.
Central and local government resourceinput for R&D, education and otherrelated fields. Universities and researchinstitutes engaged in setting up spin-offenterprises to commercialise theirtechnology. Large number ofgovernment funded development zones.
Above the national average, but not veryefficient. Connections across theenterprise sector relatively weak. Spatialdiffusion of knowledge not veryefficient.
The PRD: FDI-driven model
Poor economic foundation. Poorresources for science & technology andeducation.
The most rapidly developed marketeconomy. First region carrying outopening-up policies in China. IntensiveFDI introduced through favourablepolicies. Most technology and humanresources introduced from outside theregion., Highly developed export market.
Most efficient and rapid economicgrowth; but a dependency on externalsources of knowledge may affectcontinuity of economic growth.
The YRD: City network-driven model
Stongest economic foundation.Urbanised economy. Rich in resourcesfor science & technology and education.
Linkage across the region’s cities isstrong. The flow of factors of productionis highly active across the region;Introduction of high quality FDI fromdeveloped countries. Significantcooperation between local companiesand foreign investors.
Efficient, technology and knowledgediffusion both across both enterprisesand cities. High quality and sustainablegrowth.
Features
Historic base(structure)
Mechanisms(conduct)
Performance

CCHHAAPPTTEERR EEIIGG
HHTT
P:46
Chapter 8: Regional Evolution and Knowledge Diffusion: Evidence from China’s Three Leading Regions by Robert Huggins and Luo Shougui
6. Conclusion
In China, BGRs, PRD and YRD are the three leadingeconomic regions, each with their own particular growthmodel resulting from their social and economic conditions.BGR continues to show government-driven characteristicseven though the market economy has been in place for morethan a decade. Both state and local government haveallocated large human and financial resources to educationand technology, and the setting up of spin-off enterprises tocommercialise technology and the establishment of high-tech development zones within the region. PRD showsFDI-driven characteristics, especially overseas Chinese-owned FDI. In this region technologies come from overseaswithin an export oriented market. YRD shows city network-driven characteristics, with the core city Shanghai diffusingits knowledge and technologies to medium and smallercities.
Between 1978 and 2005, all the three regions performedabove the national average. PRD grew the fastest, and BGRthe slowest. These differences in growth rate can be linkedto the institutional vitality originating in each of the regions.While PRD has no advantages in terms of human resourcesand technology, it has been adept in taking advantage ofexternal technology and resources, and more recentlytransforming this technology and knowledge to meet itsneeds. The growth of BGR has been hindered by the lack ofa match between the supply and demand of technology,even though the government has allocated significantresources for innovation. YRD has the most evolvedeconomic and technological base, allowing it to absorbadvanced technology from developed countries, andestablish cooperation between local enterprises and foreigncapital, which reinforces the development of the region. Asfor spatial diffusion, effects are most pronounced in YRD,with the core city Shanghai strongly driving the developmentof peripheral cities, contrary to the restricted diffusionapparent in BGR.
In general, each of the three regions has its owncharacteristics. Will they converge in the future? Weconsider this doubtful. The continuance of markeddifferences in the economic and social conditions, andtechnological bases, mean that while they may all continueto grow, they will do so through different ways and means. Aconvergence in these models will be somewhat dependenton the extent to which central and regional policymakersseek to, and are able to effectively, transfer policy lessonsfrom one region to another. For example, policies aimed atincreased marketisation in BGR, or policies focused onindigenous innovation in PRD.

References
Balasubramanyam, V. N., Sapsford, D. and Salisu, M. A.(1996) Foreign direct investment and growth in EP andIS countries. Econ. J. 106, 92-105.
Bell, M., and K. Pavitt. (1997) Technological accumulationand industrial growth: Contrasts between developed anddeveloping countries. In Technology, globalization andeconomic performance, ed. D. Archibugi and J. Michie,83–137. Cambridge, U.K.: Cambridge University Press.
Borensztein, E., De Gregprio, J. and J – W. Lee. (1998)How does foreign direct investment affect economicgrowth. Journal of International Economics 45,115 – 135.
Chen, J.B., Xing, H., and He, J.M. (2005) Researches onthe structure of core-periphery and the location decisionof transnational corporations. China Soft Science 4,91-96
Cheng, G., He, L., and Dong, W. (2004) In the depth of theglobal factories: an investigation of living circumstancesof off-farm workers in the Pearl River Delta. China YouthDaily 12, 31.
Chinese Academy of Science. (2003) .Eng, Irene (1997) The rise of manufacturing towns:externally driven industrialization and urbandevelopment in the Pearl River Delta of China,Joint Editors and Blackwell Publishers Ltd. Oxford.
Fan, J.L. (2005) Emergence of the Poverty Belt AroundBeijing and Tianjin: the poverty population of 272 millionis not only Hebei Province’s thorny problems.The Beijing News 8, 15.
Friedmann, John. (2006) Four theses in the study ofChina’s urbanization. International Journal of Urbanand Regional Research. 30.2, 440-451
Gan, C.K. The relationship between FDI and thedevelopment of Shanghai industries.Shanghai Economy 3, 35-39
Gerschenkron, A. (1962) Economic backwardness inhistorical perspective: A book of essays. Cambridge,MA: Belknap Press of Harvard University Press.
Gibbons, M., Limoges, C., Nowotny, H., Schwartzmann,S., Scott, P., Trow, M. (1994) The new production ofKnowledge. Sage, London/Thousand Oaks.
Groenewold, N., Lee, G.P, Chen, A.P. (2007) Regionaloutput spillovers in China: Estimates from a VAR model.Papers in Regional Science 86.1, 101–122.doi:10.1111/j.1435-5957.2007.00112.x.
Guan, Q., and H. Zhu. eds. (1992) Studies onGuangdong’s foreign trade. The Press of South ChinaUniversity of Science and Technology, Guangzhou.
Hagerstrand, T. (1969) Innovation diffusion as a spatialprocess. University of Chicago Press, Chicago.
Huang, H.Q.(ed.). (1995) New perspectives on theeconomic development in the Pearl River Delta.The press of Zhongshan University, Guangzhou.
Huggins, R. (2008) Universities and knowledge-basedventuring: finance, management and networks inLondon, Entrepreneurship and Regional Development,20, 2, 185-206.
Huggins, Robert, Hiro lzushi, Will Devies. (2005) Worldknowledge competitiveness index 2005, Wales: RobertHuggins Associates Ltd
Kroll, Henning and Ingo Liefner. (2007) Spin-offenterprises as a means of technology commercializationin a transforming economy—Evidence from threeuniversities in China, Technovation.doi:10.1016/j.technovation. 05.002
Li, H.S. (2004) Balanced and unbalanced strategies-on theevolution of development strategies in regional economyof new China. Development Researches 2, 20-21.
Li, L.H. (2004) Study on development strategies of theBohai Gulf regions. Macroeconomic Study 12, 38-42.
Lin, George C. S.. (1999) State policy and spatialrestructuring in post-reform China, 1978–95International Journal of Urban and Regional Research.23. 4, 670-696. doi: 10.1111/1468-2427.00222
Lu, M. and E.R. Wang. (2002) Forging Ahead and FallingBehind: Changing Regional Inequalities in Post-reformChina. Growth and Change. 33.1, 42-71. doi: 10.1111/0017- 4815.00179
Luo, S.G., Zeng, Z.G. (2001) Analyses of SustainableDevelopment Mechanisms in Southern JiangsuProvince, UNCRD Research Report Series 42, 103-115.
Maurel, Francoise and Beatrice Sedillot. (1999) A measureof the geographical concentration in Frenchmanufacturing industries. Regional Science and UrbanEconomics 29. 5, 575-604
Murphy, R. (2002) How migrant labor is changing ruralChina. Cambridge University Press, Cambridge.
National Bureau of Statistics of China. (2007)
Nolan, P. (2004) Transforming China: Globalization,transition and development. Anthem Press, Londonand New York.
Qiao, G.D. and Chen, D. (2003) Being short of furthermotivation, the Pearl River Delta faces declinedcompetitiveness. China Economic News 7, 16.
Rui, L.M. (2006) The weekend engineers in South Jiangsuand some implications. Hongqi Literature, 18, 21-23
Saxenian, A. (1996) Regional advantage: Culture andcompetition in Silicon Valley and Route 128. Cambridge,MA: Harvard University Press.
Shirk, S.L. (1994) How China opened its door. TheBrookings Institution, Washington, DC. South ChinaMorning Post (SCMP).
Siow Yue CHIA and Chalongphob SUSSANGKARN.(2006) The economic rise of China: challenges andopportunities for ASEAN, Asian Economic PolicyReview, 1, 102–128
Stigler G.J. (1968) The Organization of Industry.Homewood, IL, Irwin.
Sung Y., P. Liu, Y.R. Wong and P. Lau. (1995) The fifthdragon: the emergence of the Pearl River Delta. AddisonWesley Publishing Company, Hong Kong and New York.
Tan, L.J. (2005) Observing self-initiated innovation of thePearl River Delta from the visual angle of growth model.The Economic Daily (Internet form) 11, 23.
P:47
References

P:48
References
Tang Wei. (2005) Analysis on the knowledge spillovers inBeijing-Tianjin-Hebei. North-East Normal University,Changchun.
Teece, D. J. (2000) Firm capabilities and economicdevelopment: Implications for the newly industrializingeconomies. In Technology, learning and innovation:Experiences of newly industrializing economies,ed. L. Kim and R. R. Nelson, 105–28. Cambridge, U.K.:Cambridge University Press.
Tuan, Chyau and Linda Fung-Yee Ng. (2007)The place of FDI in China’s regional economicdevelopment: Emergence of the globalized deltaeconomies.Journal of Asian Economics 18, 348–364
Vogel, E. (1989) One step ahead in China:Guangdong under reform. Harvard University Press,Cambridge, MA.
Wu, F. (2002) China’s Changing urban governance in thetransition: towards a more market-oriented economy.Urban Studies 39.7, 1071-1093
Wu, S.L. (2007) Guide to university and college entrance2007, Beijing: China Statistical Publishing House.
Wu, Y. (2005) Focus: is the Yangtze River Deltacontending labor resources from the Pearl River Delta?People’s Daily-South China News (Internet form) 3, 17.
Xie, J. (2006) The competition of inviting investmentamong cities in the Pearl River Delta, land preference isthe key chips. International Financial Daily 4, 24.
Xie, Y. C. and Frank J. Costa.(1991) The impact ofeconomic reforms on the urban economy of the People’sRepublic of China. The Professional Geographer 43.3,318-335.
Xuedu Lu, Jiahua Pan, Ying Chen.(2006) Sustainingeconomic growth in China under energy and climatesecurity constraints. China & World Economy. 14.6,85-97.
Yang, J. and Chen, L. (2006) The dynamic model of urbandevelopment in economic transformation in China: acase study of Yangtze River Delta and Pearl River Delta.Contemporary Economy & Management 28.6, 47-52.
Yang, X.M., Tian, P., Gao, Y. (2005) Regional selection andagglomeration of FDI—an empirical study on Chinesethree economic deltas and west regions. Journal ofFinance and Economics 31. 11, 98-107.
Yu, L (2005) Guangdong starts up new reform of land,Nanfang Weekends, 9, 29.
Zheng, Y. (2006) The comparison of FDI technologydiffusion between the Yangtze River Delta and the PearlRiver Delta. Commercial Research 344.12,23-34.


Western AvenueCardiffCF5 2SGtel: +44 (0)29 2041 6070fax: +44 (0)29 2041 6286email: [email protected]
Rhodfa’r GorllewinCaerdyddCF5 2SGffôn: +44 (0)29 2041 6070ffacs: +44 (0)29 2041 6286ebost: [email protected]
All wood/pulp used in this prospectus is sourced from sustainable producersand responsibly managed forests that create minimal environmental impact.