آنالیز سیستم پمپ و انتخاب پمپ
DESCRIPTION
www.iranpetrotech.comTRANSCRIPT
[email protected] www.cmmlearn.blogfa.com
-
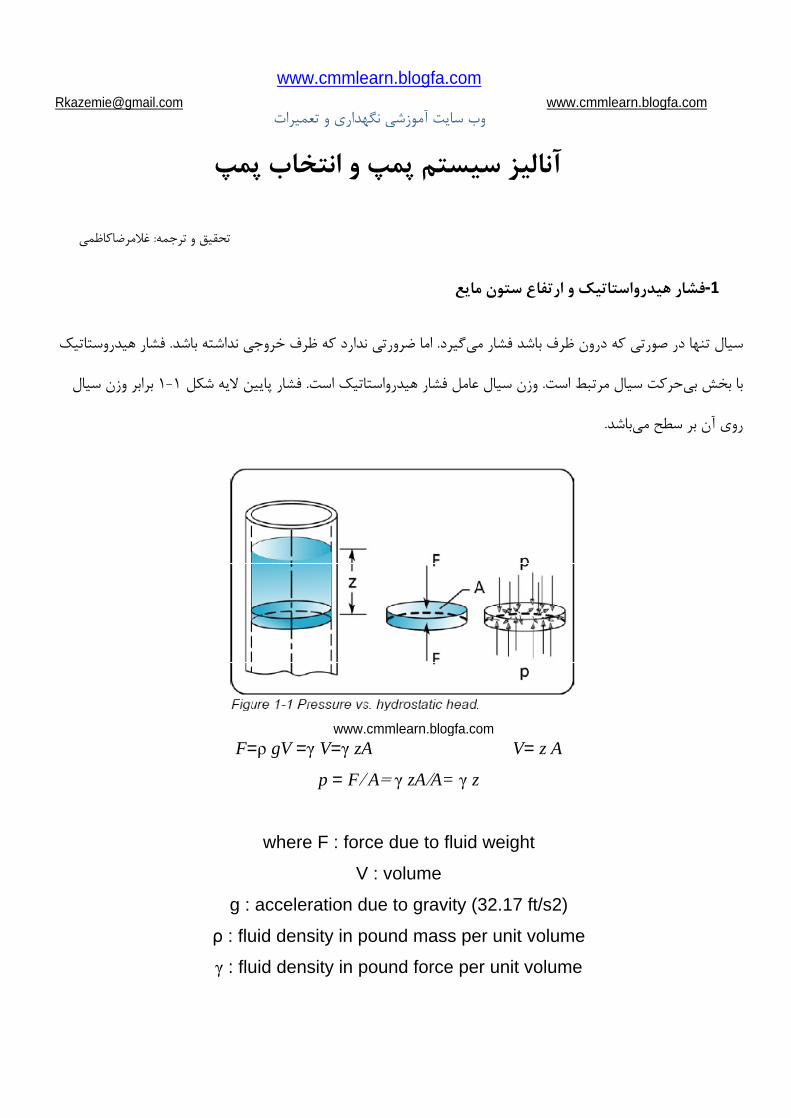
F=
gV =
V=
zA
V= z A
p = F
A
zA A=
z
where F : force due to fluid weight
V : volume
g : acceleration due to gravity (32.17 ft/s2)
: fluid density in pound mass per unit volume
: fluid density in pound force per unit volume
www.cmmlearn.blogfa.com
www.cmmlearn.blogfa.com
[email protected] www.cmmlearn.blogfa.com
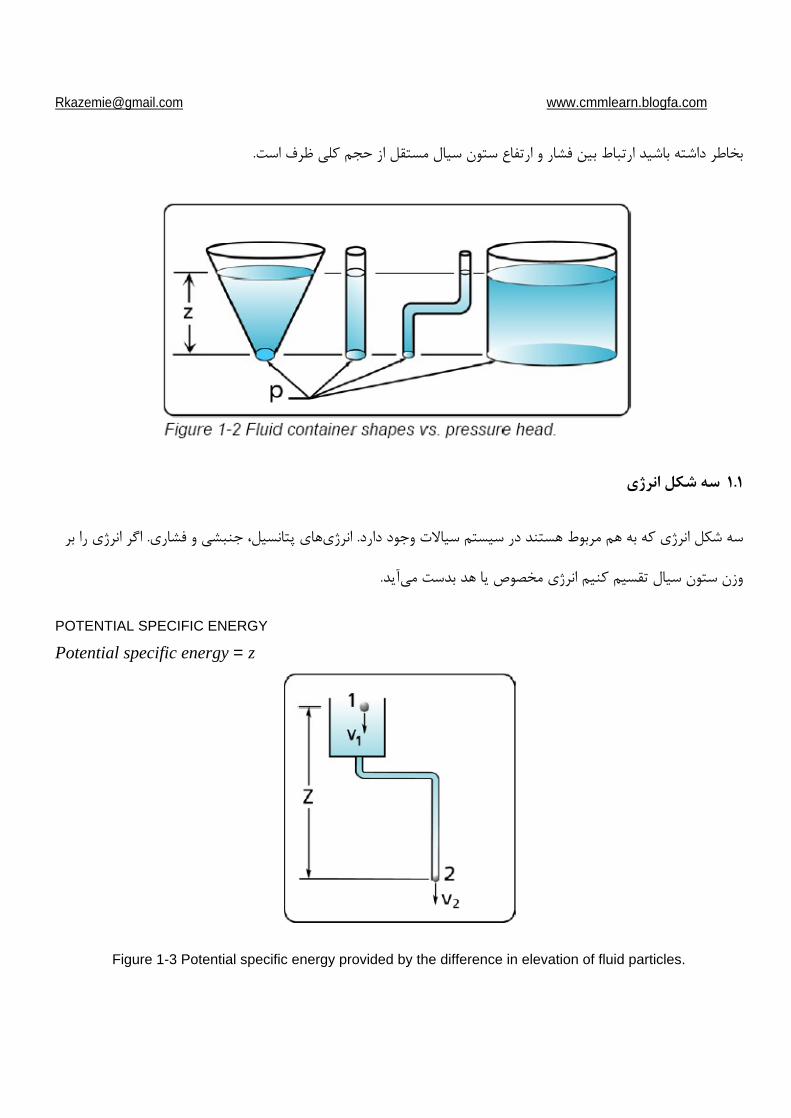
POTENTIAL SPECIFIC ENERGY
Potential specific energy = z
Figure 1-3 Potential specific energy provided by the difference in elevation of fluid particles.
www.cmmlearn.blogfa.com
www.cmmlearn.blogfa.com
[email protected] www.cmmlearn.blogfa.com
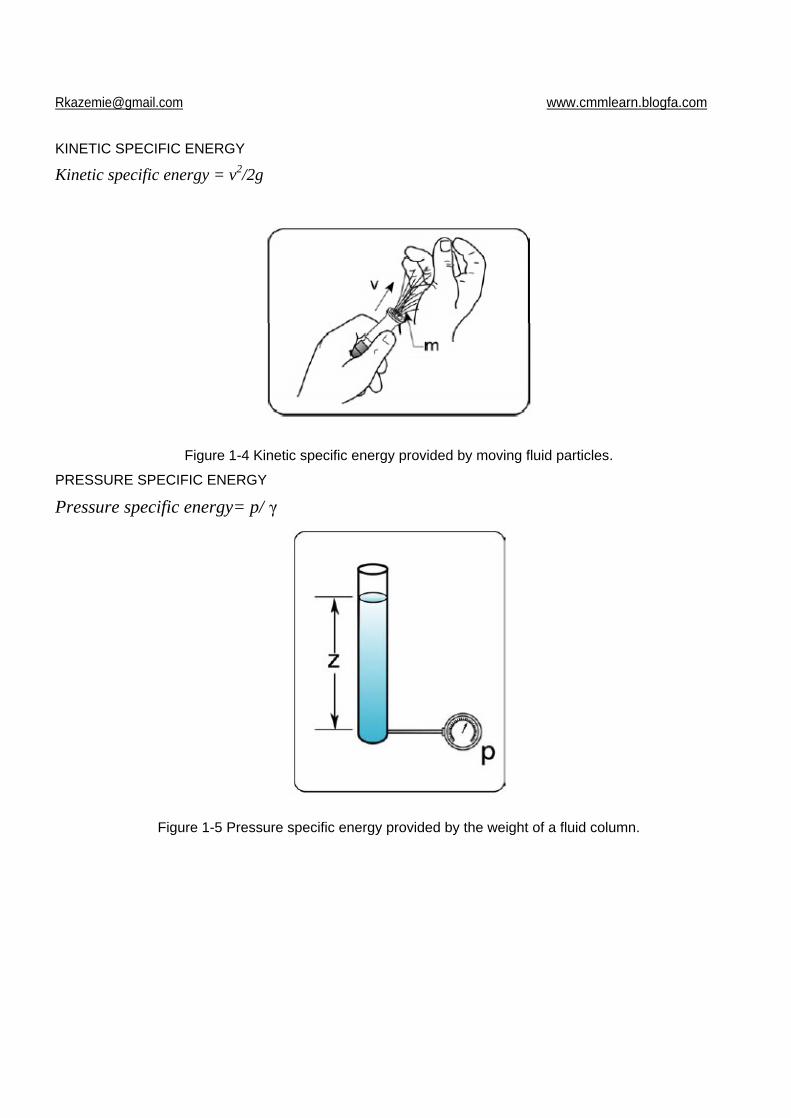
KINETIC SPECIFIC ENERGY
Kinetic specific energy = v2/2g
Figure 1-4 Kinetic specific energy provided by moving fluid particles.
PRESSURE SPECIFIC ENERGY
Pressure specific energy= p/
Figure 1-5 Pressure specific energy provided by the weight of a fluid column.
www.cmmlearn.blogfa.com
www.cmmlearn.blogfa.com
[email protected] www.cmmlearn.blogfa.com
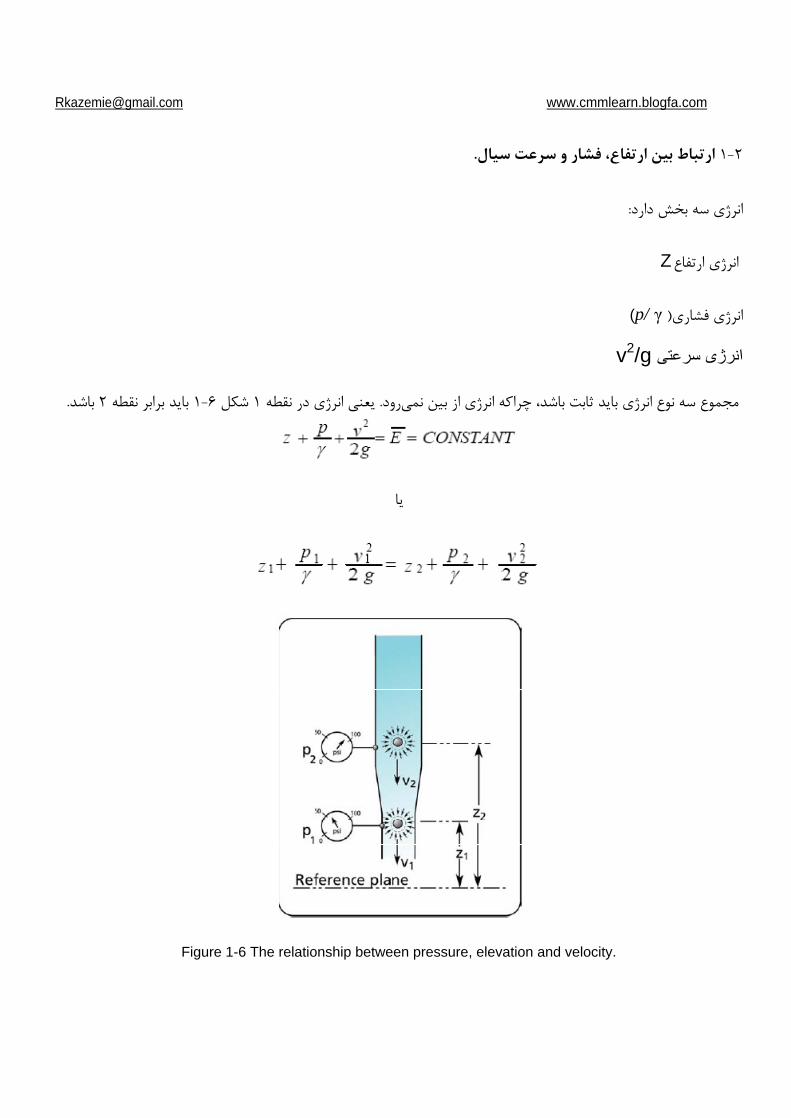
Z
(p/
v2/g
Figure 1-6 The relationship between pressure, elevation and velocity.
www.cmmlearn.blogfa.com
[email protected] www.cmmlearn.blogfa.com
-
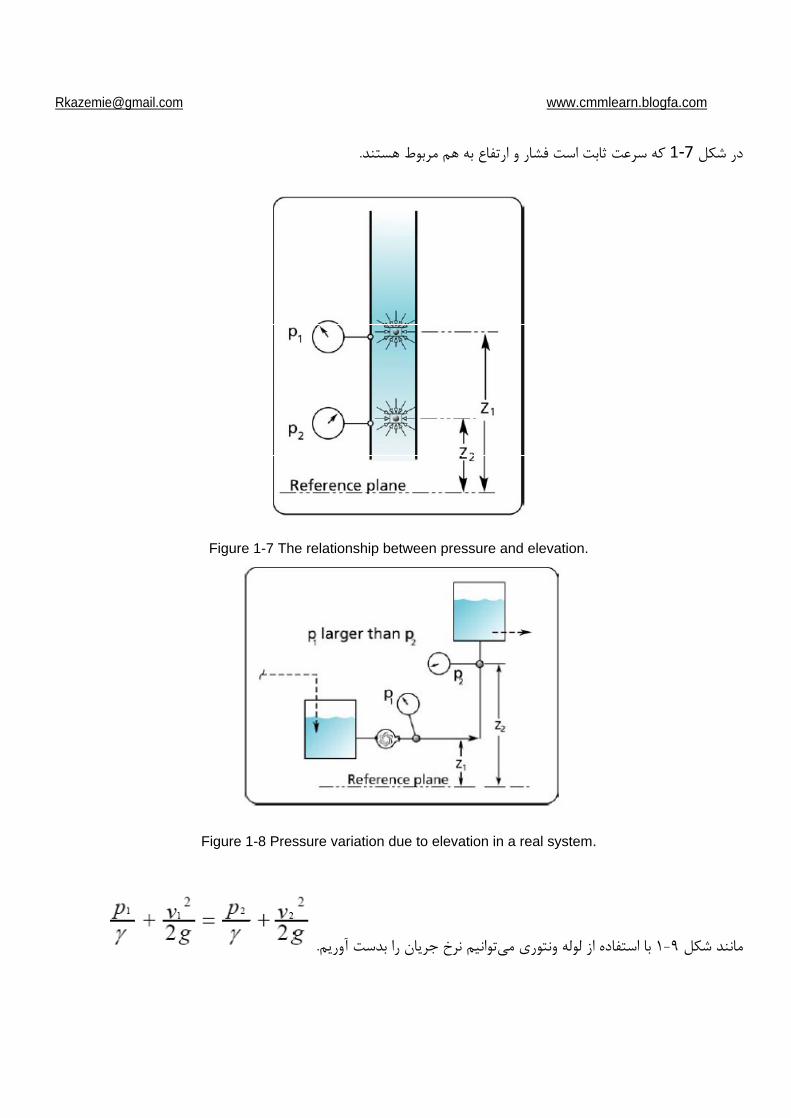
Figure 1-7 The relationship between pressure and elevation.
Figure 1-8 Pressure variation due to elevation in a real system.
www.cmmlearn.blogfa.com
www.cmmlearn.blogfa.com
[email protected] www.cmmlearn.blogfa.com
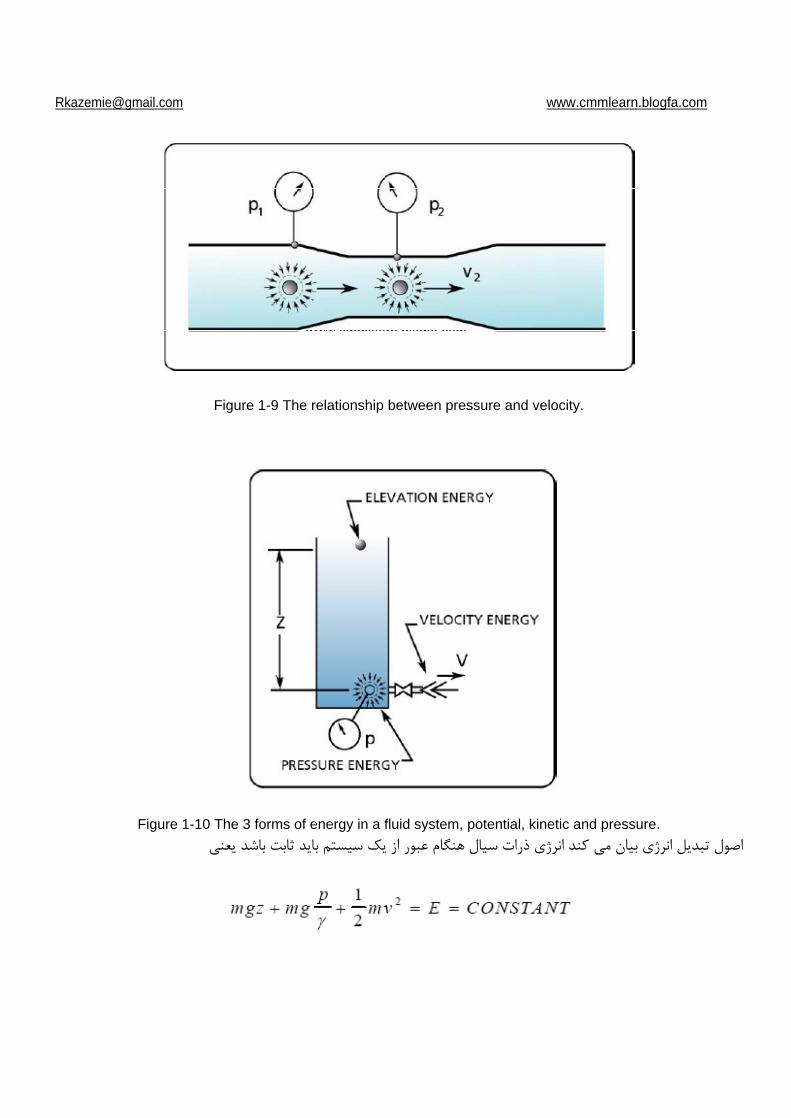
Figure 1-9 The relationship between pressure and velocity.
Figure 1-10 The 3 forms of energy in a fluid system, potential, kinetic and pressure.
www.cmmlearn.blogfa.com
www.cmmlearn.blogfa.com
[email protected] www.cmmlearn.blogfa.com
Emvmgzmgp/
mvE
mg
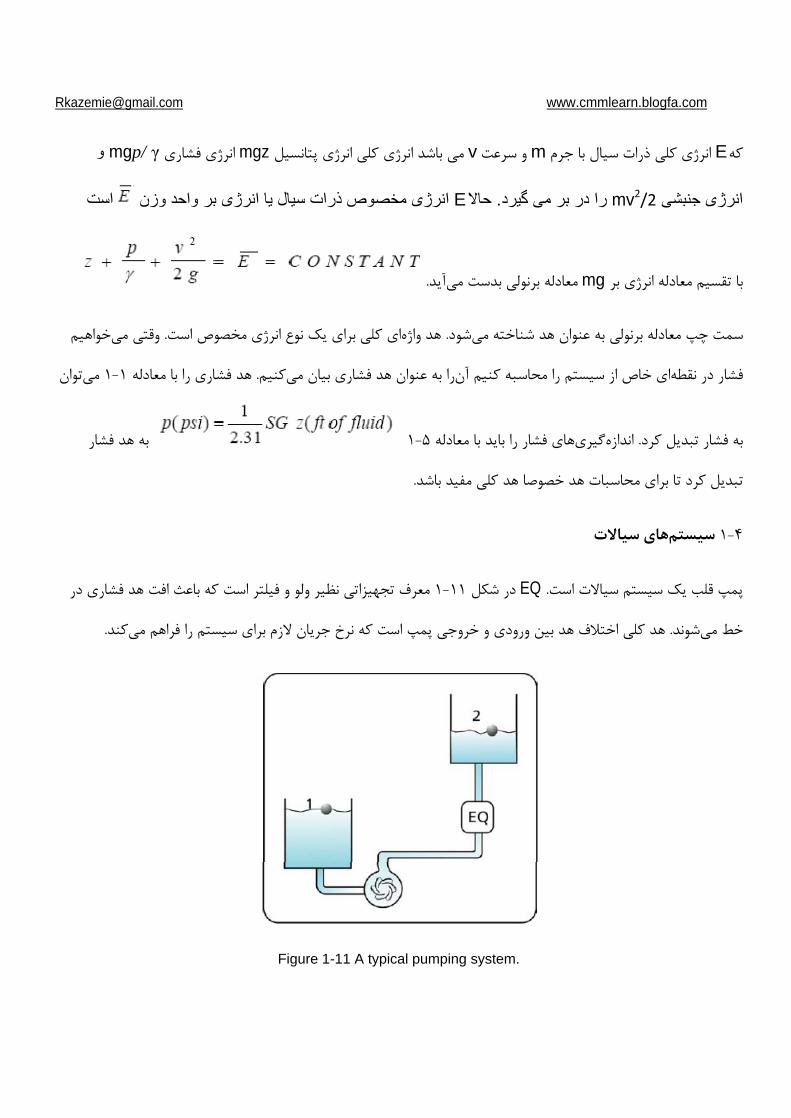
EQ
Figure 1-11 A typical pumping system.
www.cmmlearn.blogfa.com
[email protected] www.cmmlearn.blogfa.com
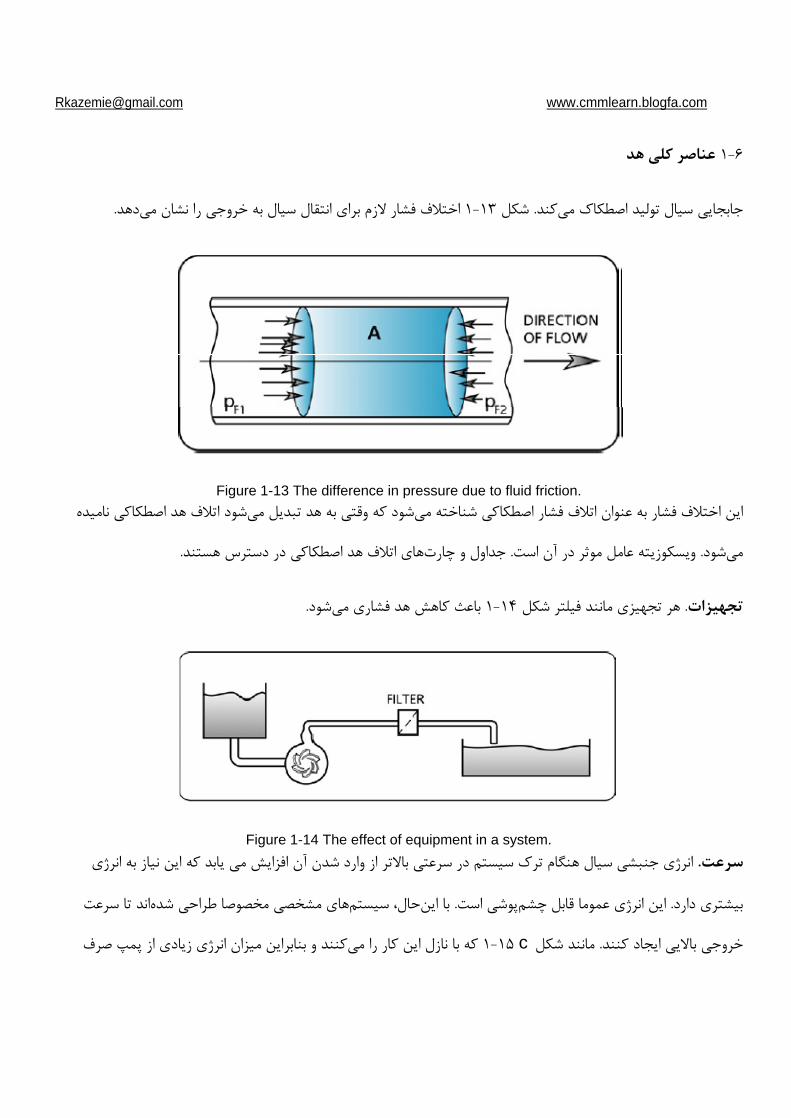
Figure 1-13 The difference in pressure due to fluid friction.
Figure 1-14 The effect of equipment in a system.
c
www.cmmlearn.blogfa.com
www.cmmlearn.blogfa.com
[email protected] www.cmmlearn.blogfa.com
A
VCV
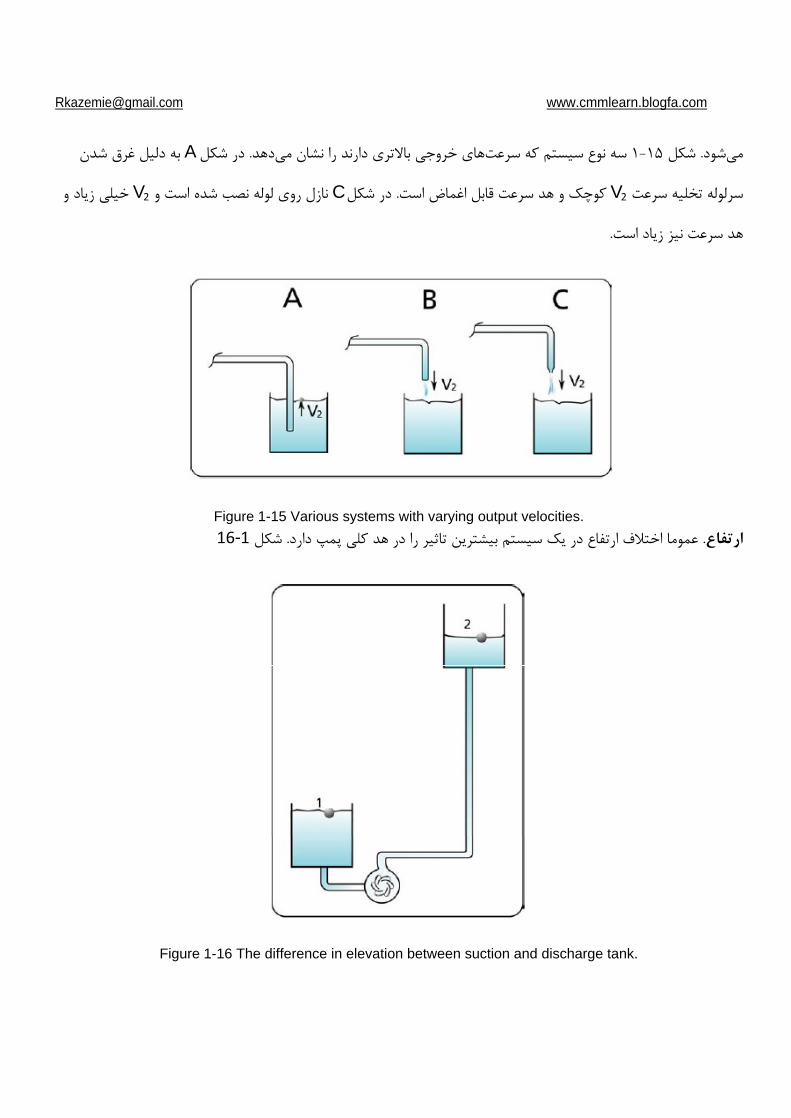
Figure 1-15 Various systems with varying output velocities.
-
Figure 1-16 The difference in elevation between suction and discharge tank.
www.cmmlearn.blogfa.com
www.cmmlearn.blogfa.com
[email protected] www.cmmlearn.blogfa.com
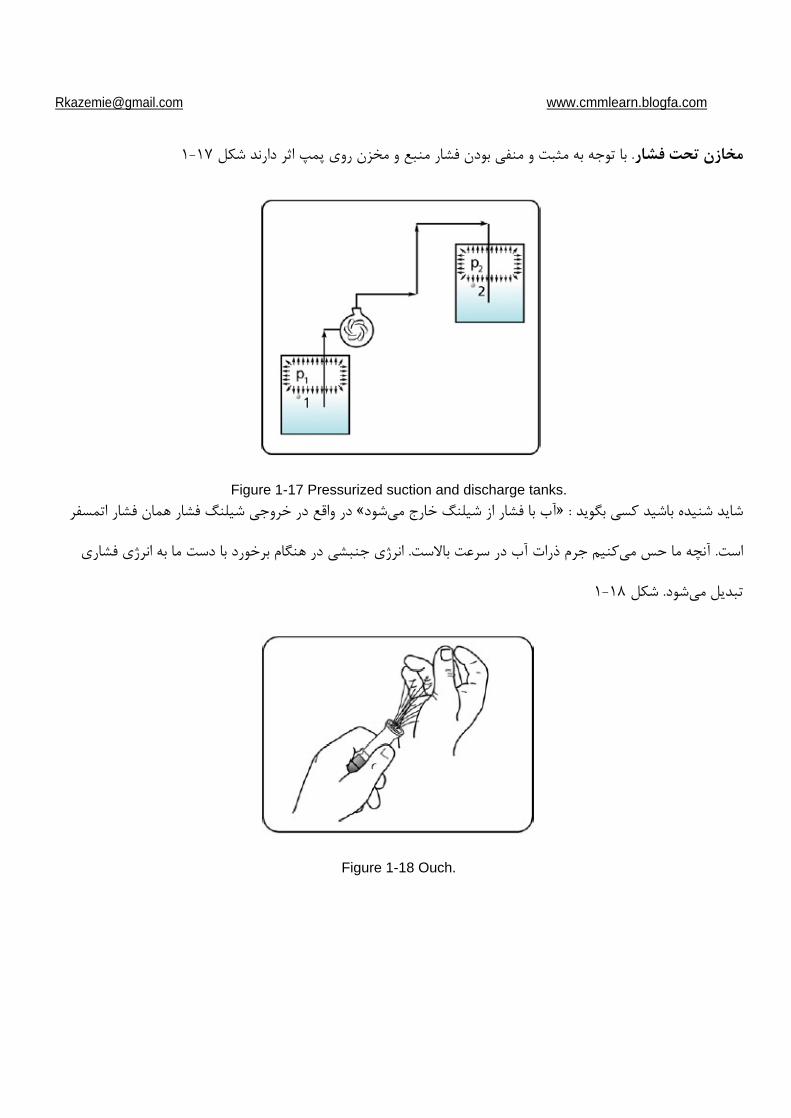
Figure 1-17 Pressurized suction and discharge tanks.
Figure 1-18 Ouch.
www.cmmlearn.blogfa.com
www.cmmlearn.blogfa.com
[email protected] www.cmmlearn.blogfa.com
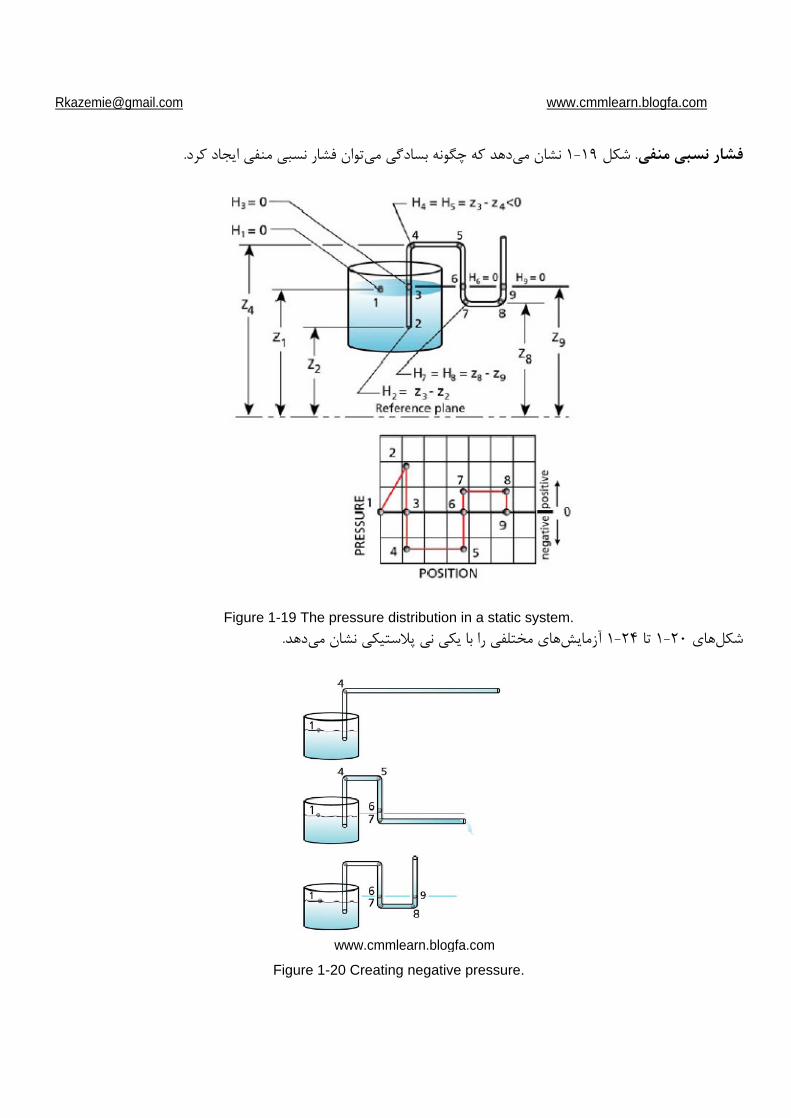
Figure 1-19 The pressure distribution in a static system.
Figure 1-20 Creating negative pressure.
www.cmmlearn.blogfa.com
www.cmmlearn.blogfa.com
[email protected] www.cmmlearn.blogfa.com
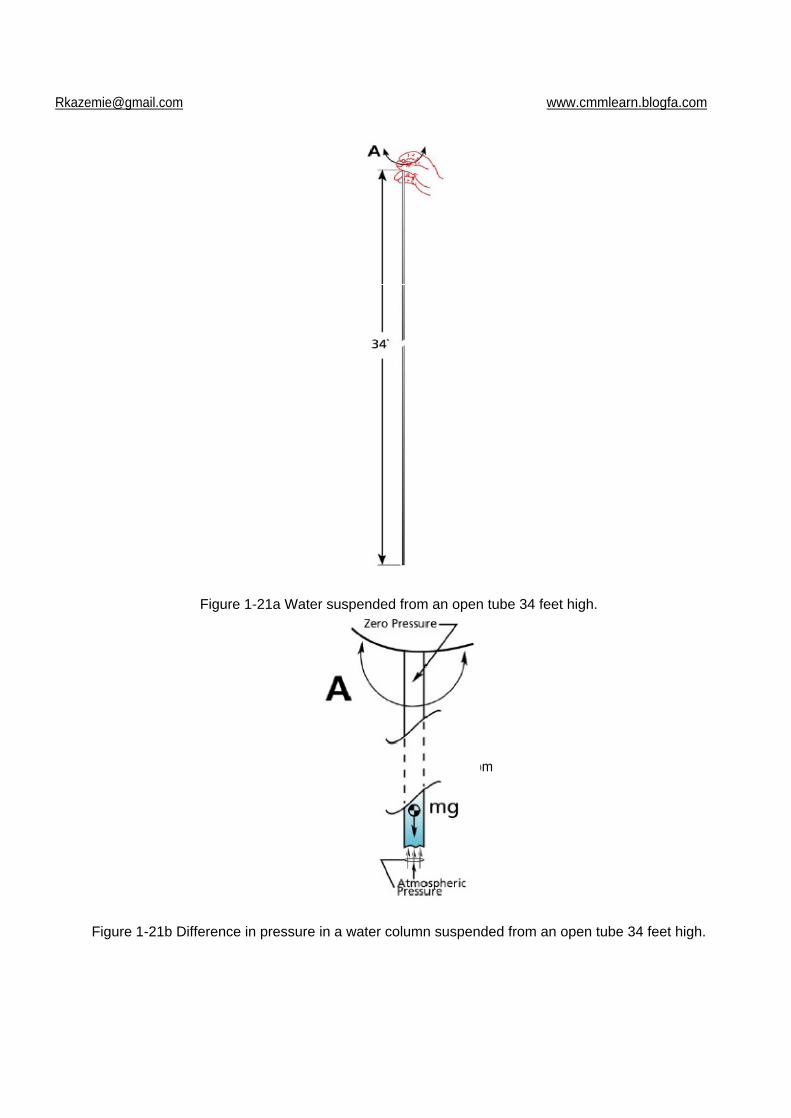
Figure 1-21a Water suspended from an open tube 34 feet high.
Figure 1-21b Difference in pressure in a water column suspended from an open tube 34 feet high.
www.cmmlearn.blogfa.com
[email protected] www.cmmlearn.blogfa.com
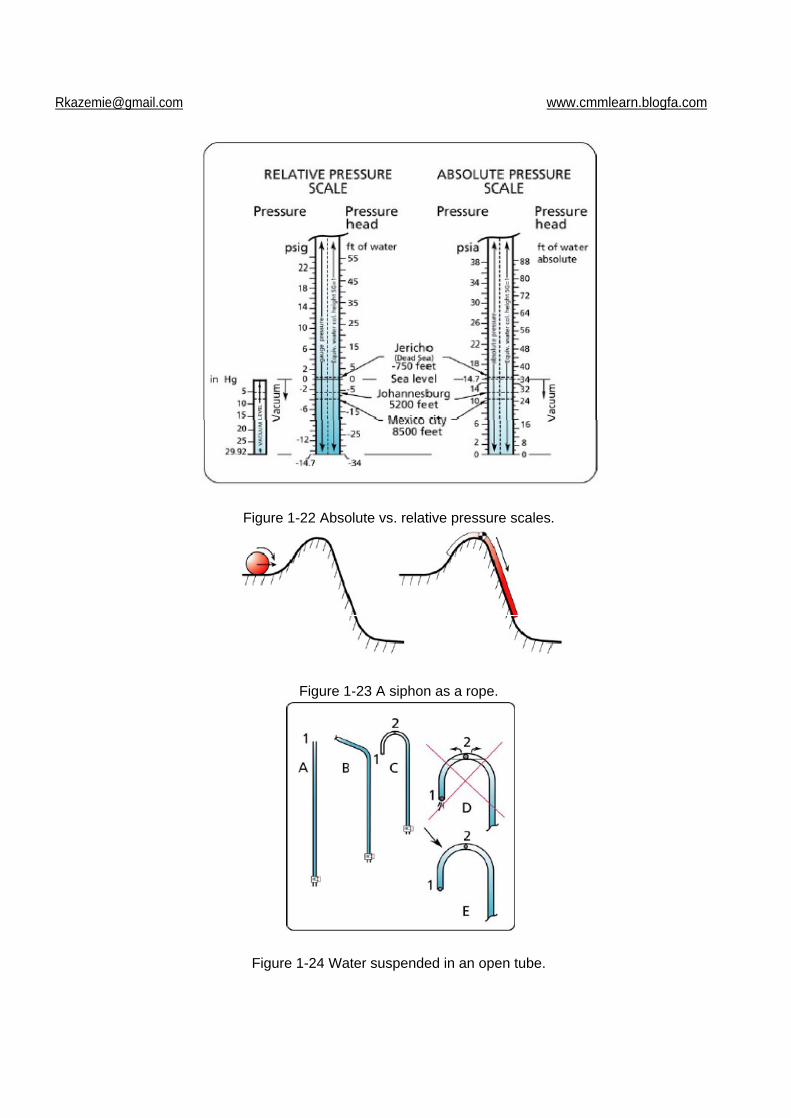
Figure 1-22 Absolute vs. relative pressure scales.
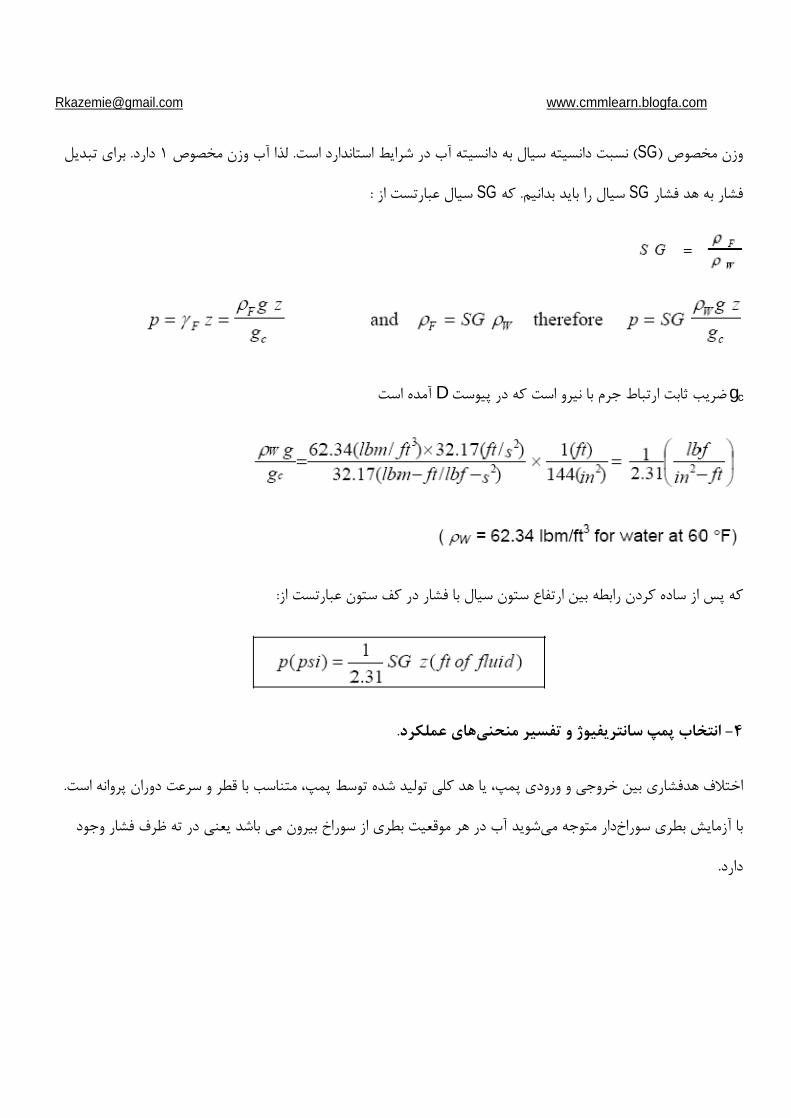
Figure 1-23 A siphon as a rope.
Figure 1-24 Water suspended in an open tube.
www.cmmlearn.blogfa.com
www.cmmlearn.blogfa.com
www.cmmlearn.blogfa.com
[email protected] www.cmmlearn.blogfa.com
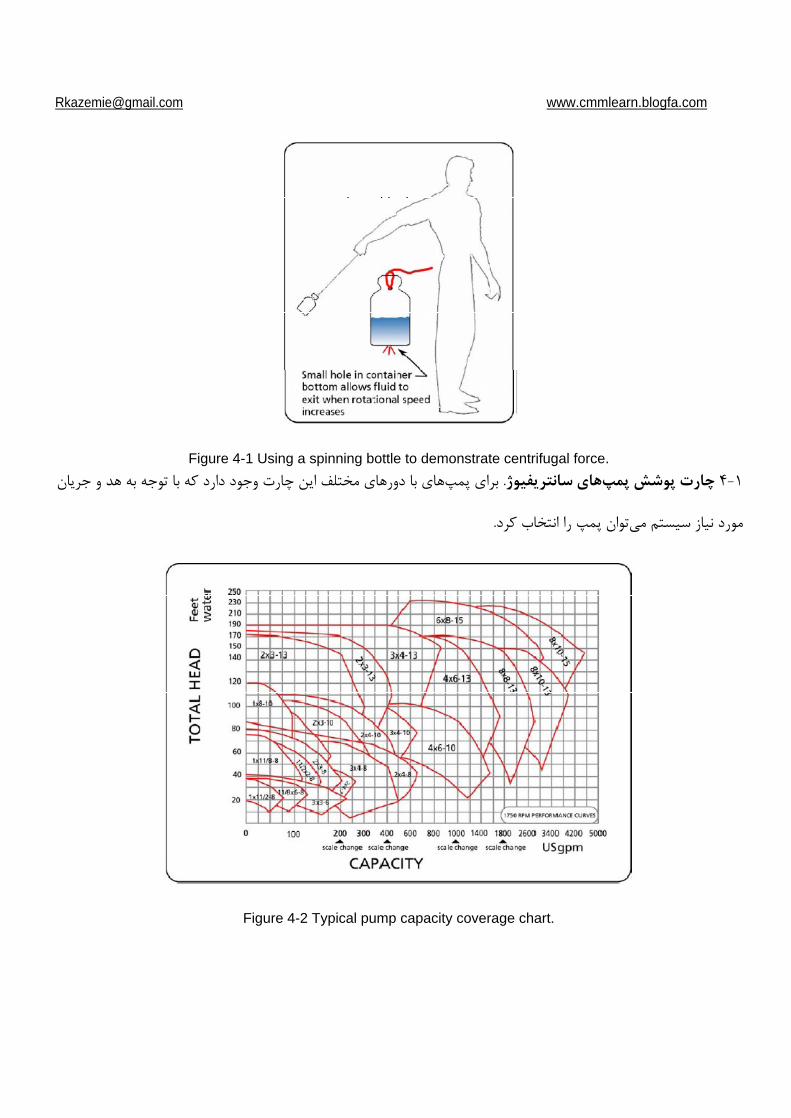
Figure 4-1 Using a spinning bottle to demonstrate centrifugal force.
Figure 4-2 Typical pump capacity coverage chart.
www.cmmlearn.blogfa.com
www.cmmlearn.blogfa.com
[email protected] www.cmmlearn.blogfa.com
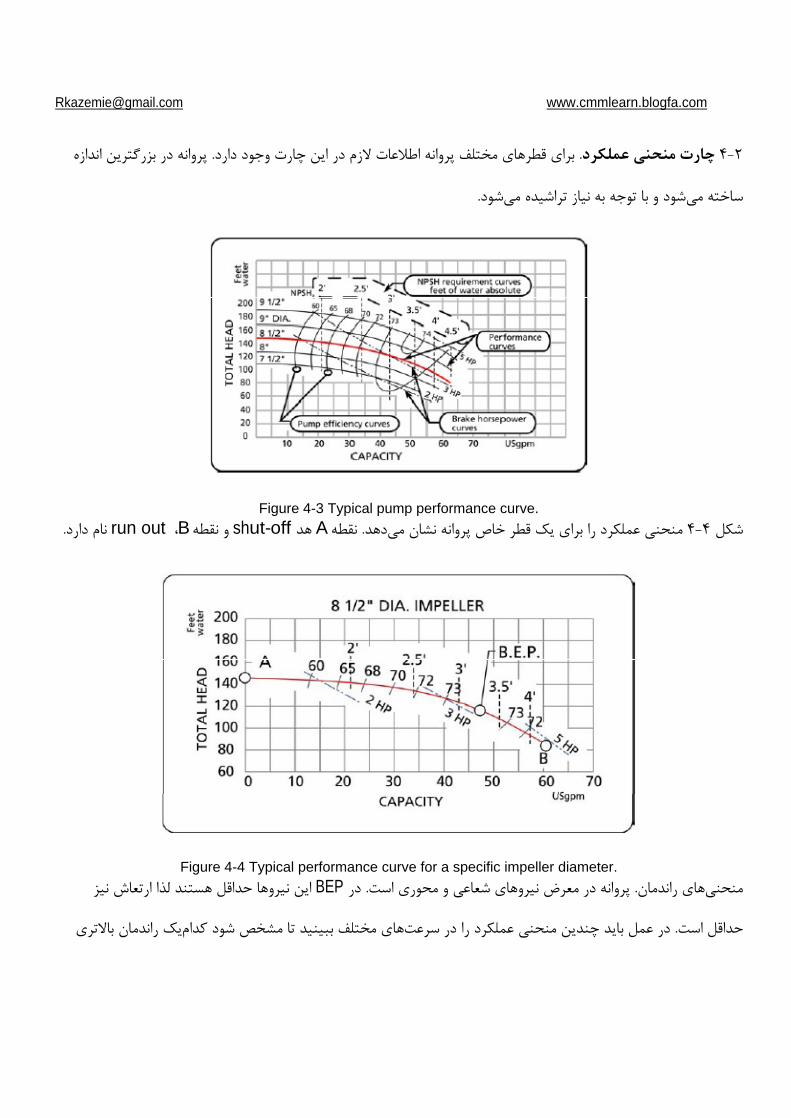
Figure 4-3 Typical pump performance curve.
Ashut-offB
run out
Figure 4-4 Typical performance curve for a specific impeller diameter.
BEP
www.cmmlearn.blogfa.com
www.cmmlearn.blogfa.com
[email protected] www.cmmlearn.blogfa.com
testing
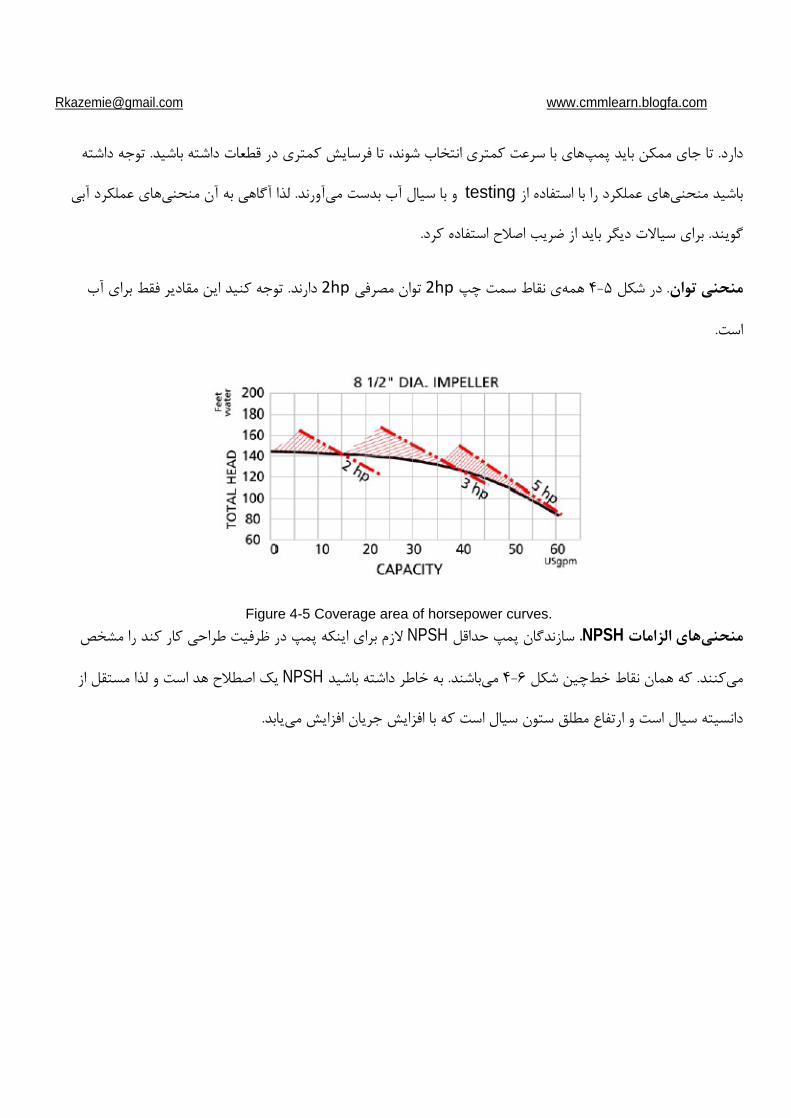
Figure 4-5 Coverage area of horsepower curves.
NPSHNPSH
NPSH
www.cmmlearn.blogfa.com
[email protected] www.cmmlearn.blogfa.com
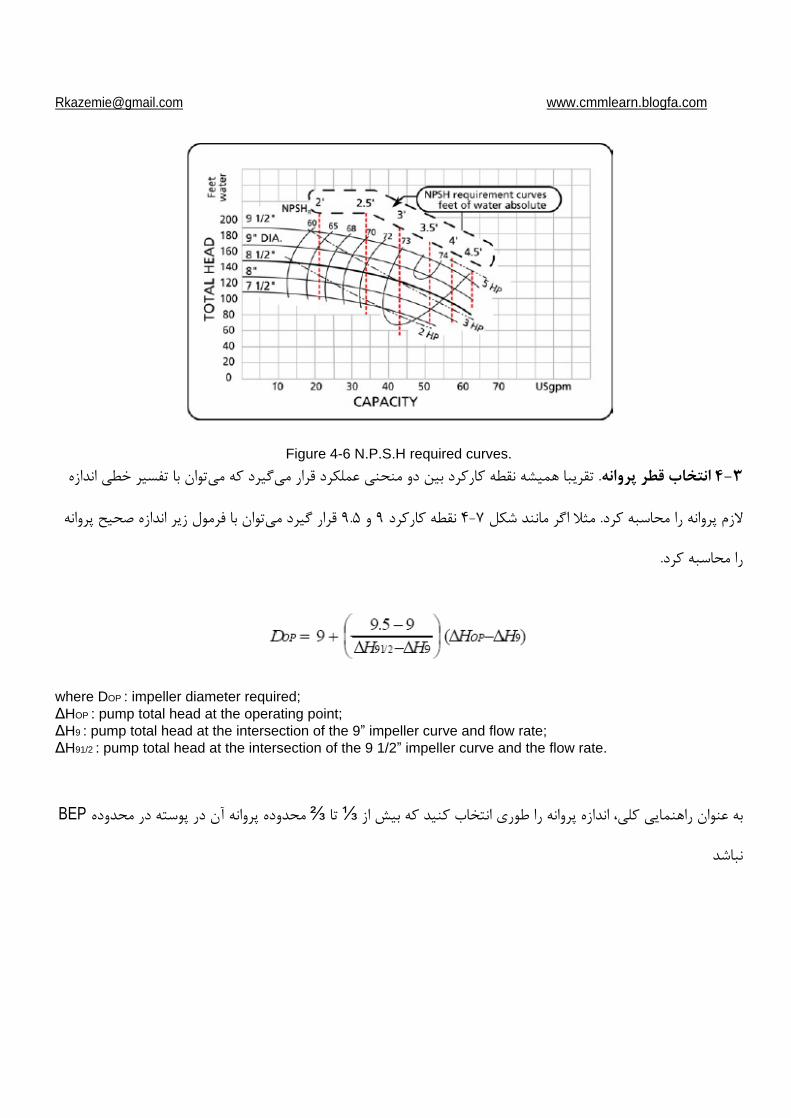
Figure 4-6 N.P.S.H required curves.
where DOP : impeller diameter required; HOP : pump total head at the operating point; H9 : pump total head at the intersection of the 9 impeller curve and flow rate; H91/2 : pump total head at the intersection of the 9 1/2 impeller curve and the flow rate.
BEP
[email protected] www.cmmlearn.blogfa.com
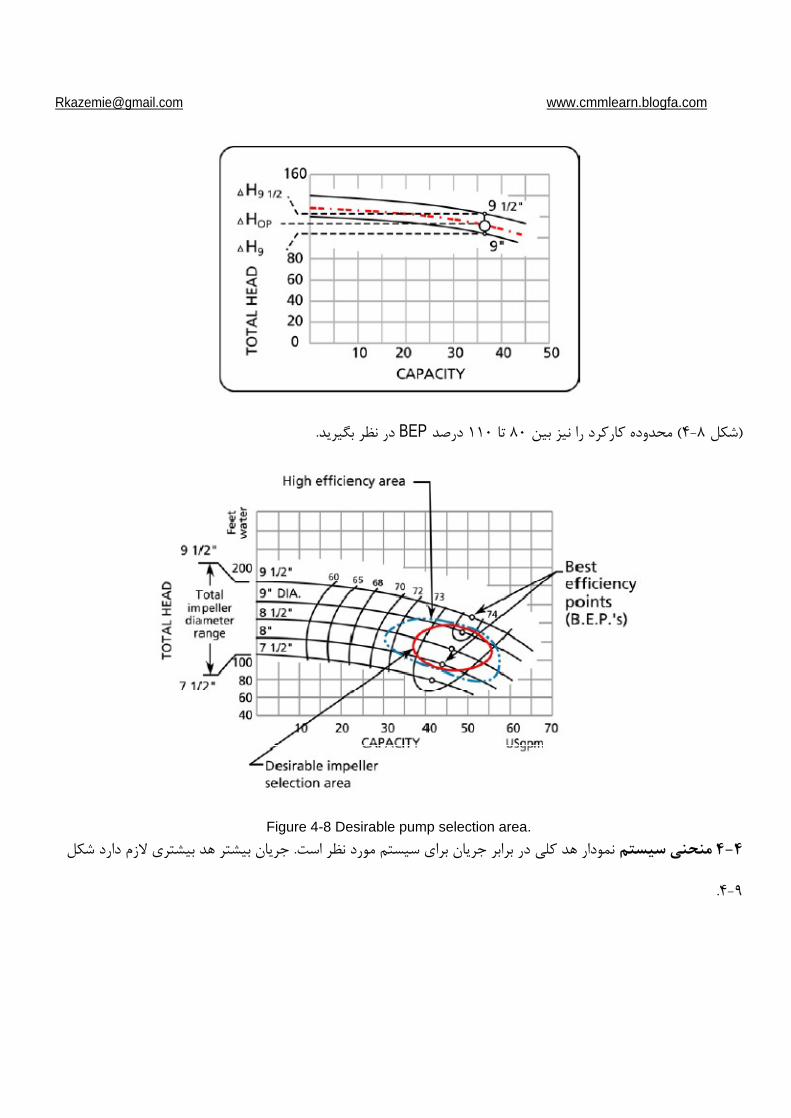
BEP
Figure 4-8 Desirable pump selection area.
www.cmmlearn.blogfa.com
www.cmmlearn.blogfa.com
[email protected] www.cmmlearn.blogfa.com
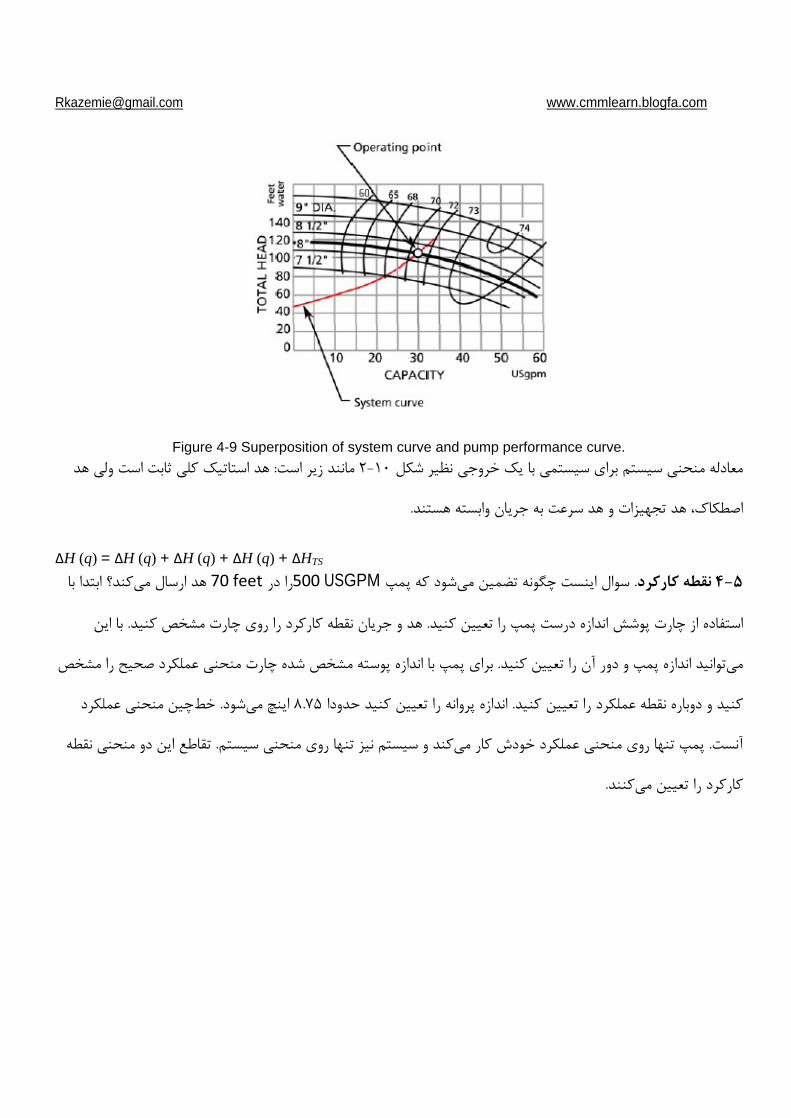
Figure 4-9 Superposition of system curve and pump performance curve.
H (q) = H (q) + H (q) + H (q) + HTS
USGPM
[email protected] www.cmmlearn.blogfa.com
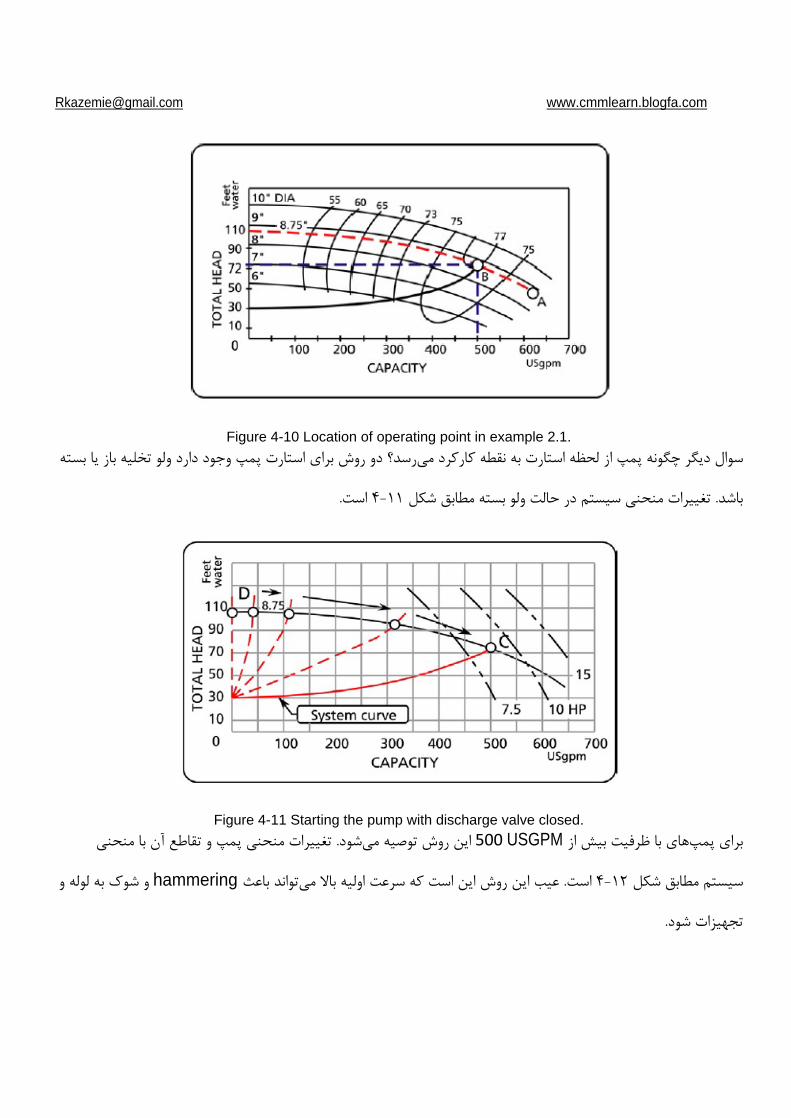
Figure 4-10 Location of operating point in example 2.1.
Figure 4-11 Starting the pump with discharge valve closed.
USGPM
hammering
www.cmmlearn.blogfa.com
www.cmmlearn.blogfa.com
[email protected] www.cmmlearn.blogfa.com
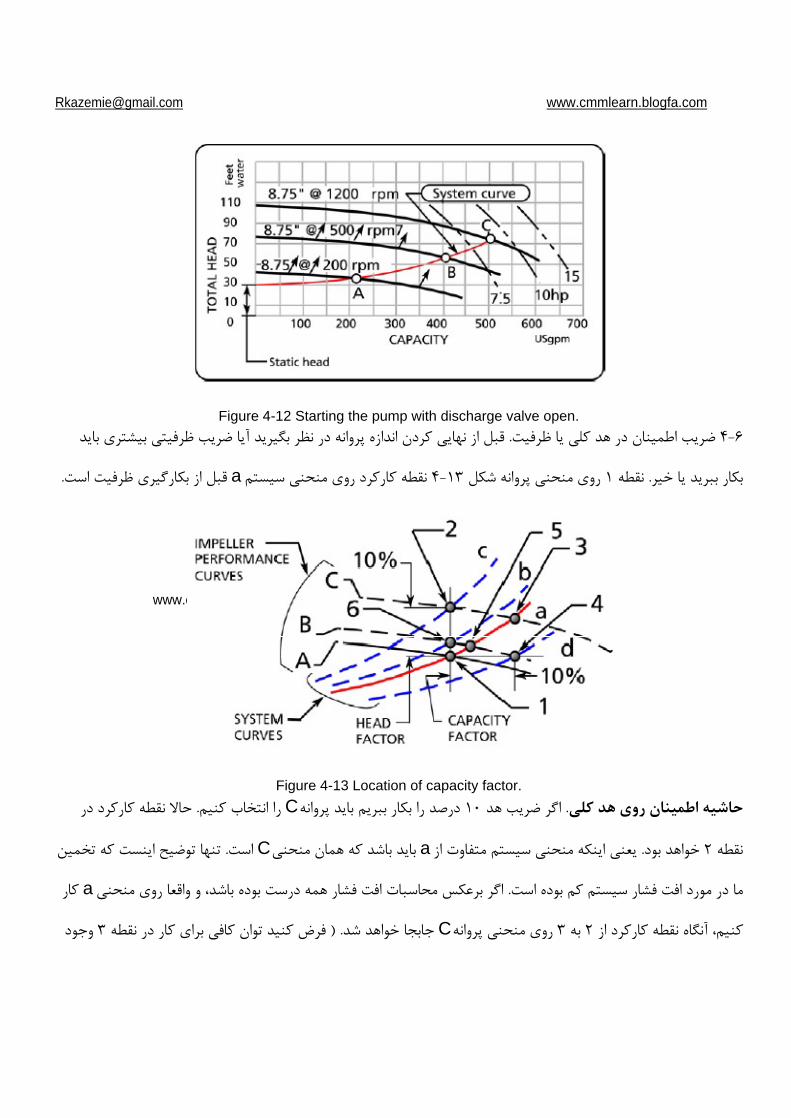
Figure 4-12 Starting the pump with discharge valve open.
a
Figure 4-13 Location of capacity factor.
C
aC
a
C
www.cmmlearn.blogfa.com
www.cmmlearn.blogfa.com
[email protected] www.cmmlearn.blogfa.com
C
B
d
b
aC
BEP
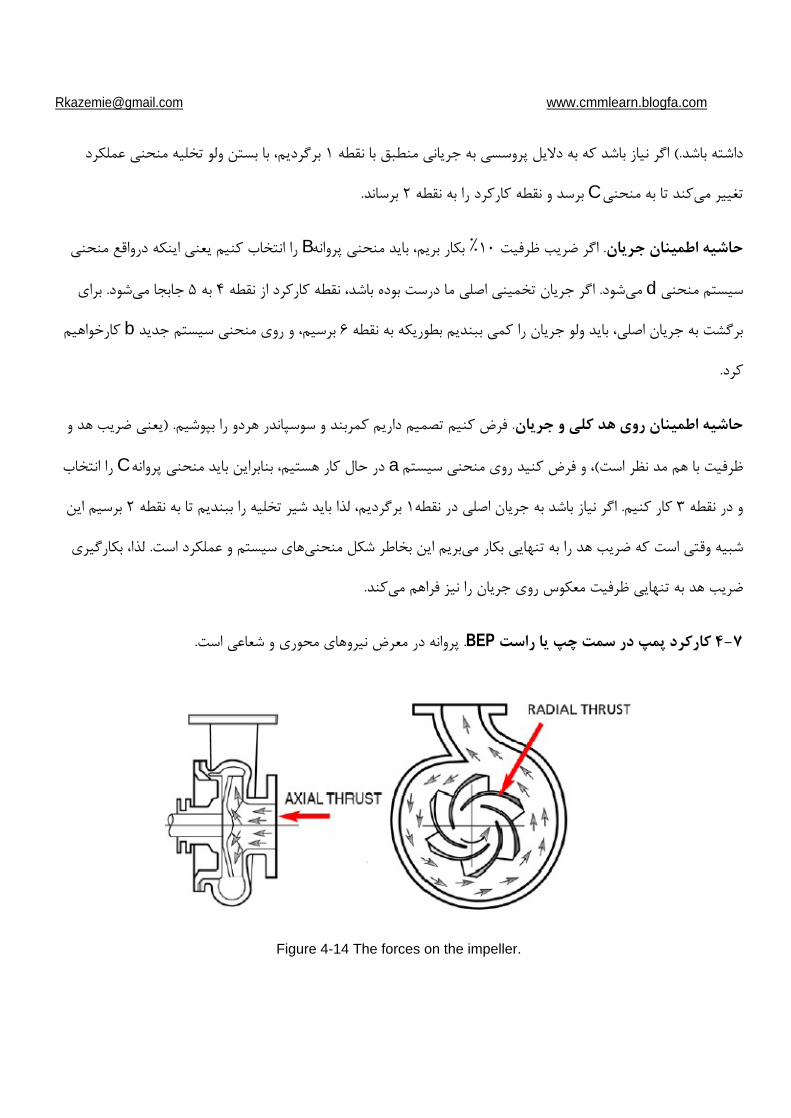
Figure 4-14 The forces on the impeller.
www.cmmlearn.blogfa.com
[email protected] www.cmmlearn.blogfa.com
BEP
BEP
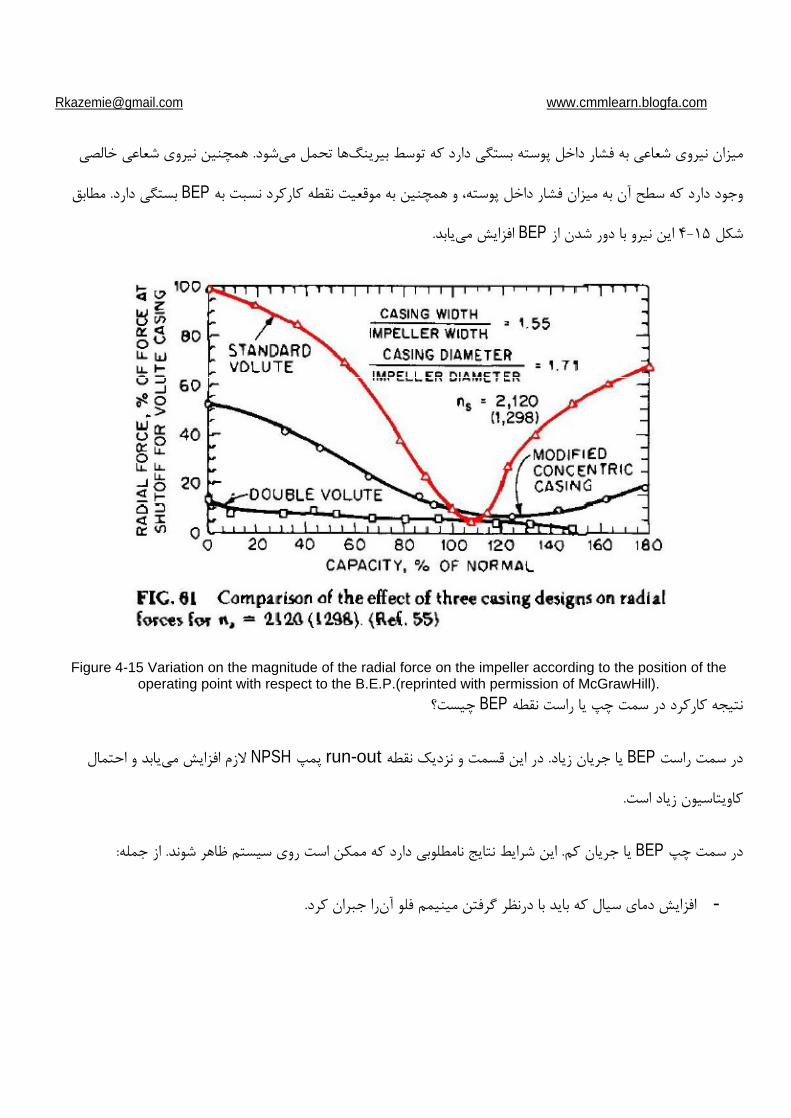
Figure 4-15 Variation on the magnitude of the radial force on the impeller according to the position of the operating point with respect to the B.E.P.(reprinted with permission of McGrawHill).
BEP
BEPrun-outNPSH
BEP
[email protected] www.cmmlearn.blogfa.com
BEP
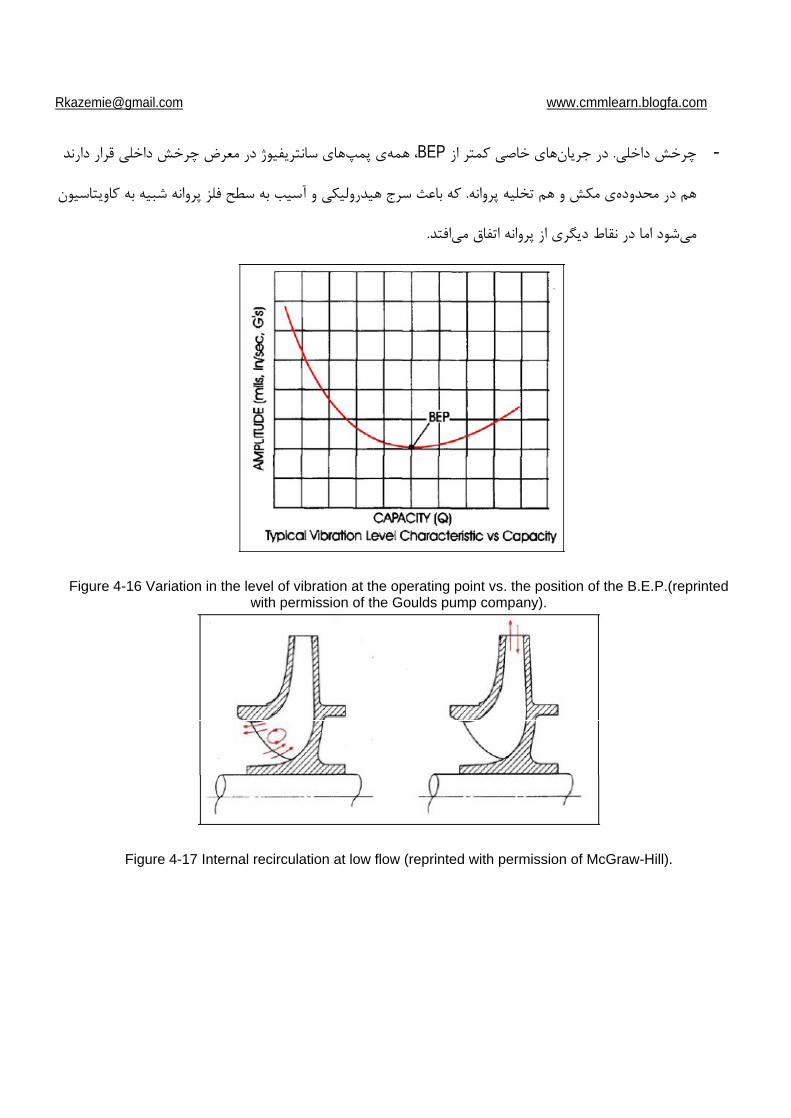
Figure 4-16 Variation in the level of vibration at the operating point vs. the position of the B.E.P.(reprinted with permission of the Goulds pump company).
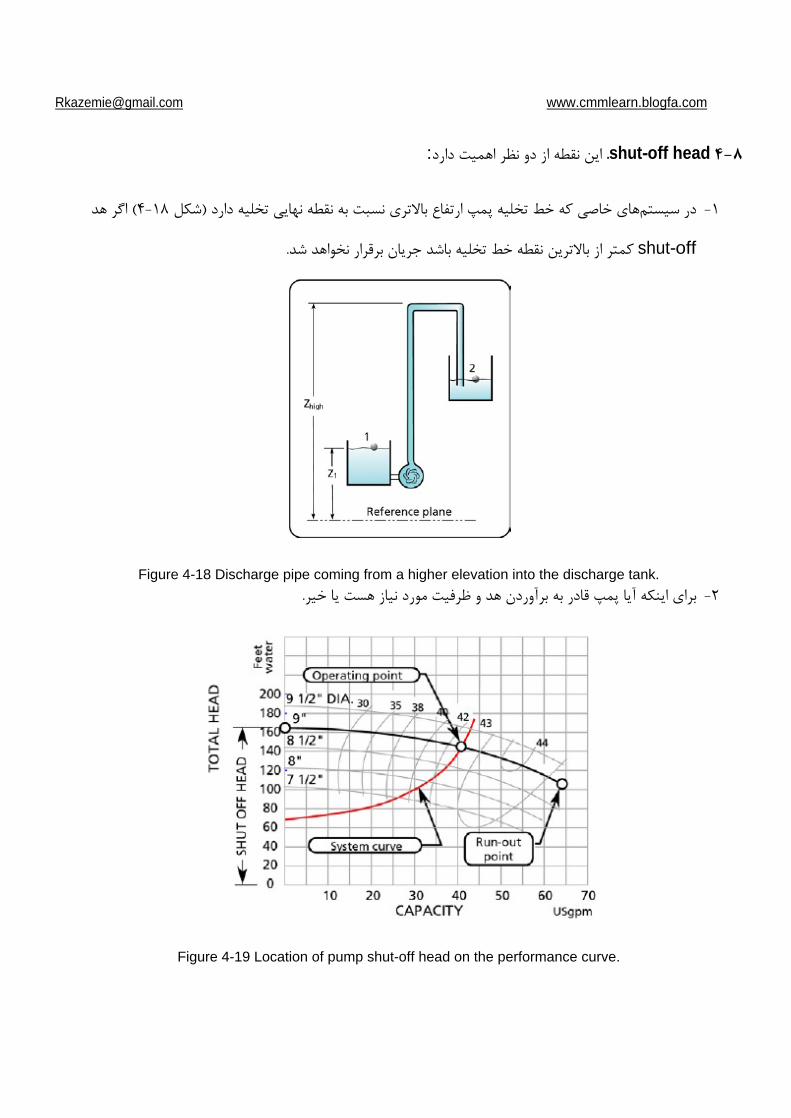
Figure 4-17 Internal recirculation at low flow (reprinted with permission of McGraw-Hill).
www.cmmlearn.blogfa.com
www.cmmlearn.blogfa.com
[email protected] www.cmmlearn.blogfa.com
shut-off head:
shut-off
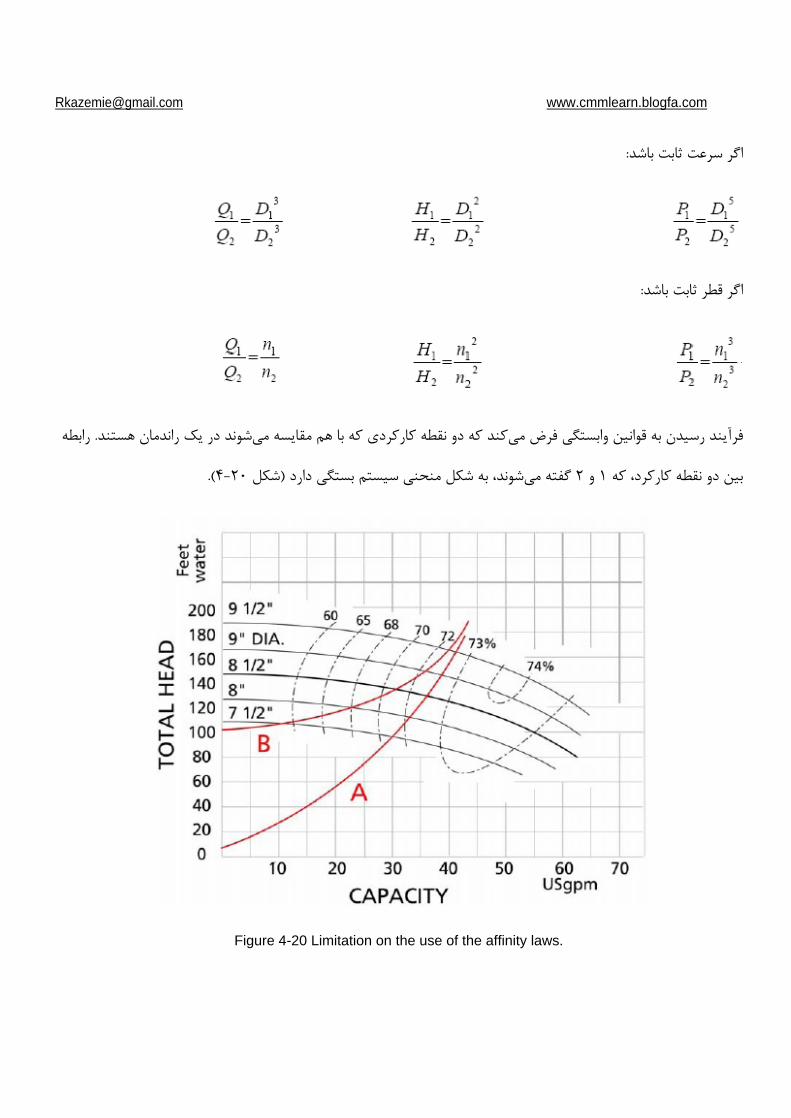
Figure 4-18 Discharge pipe coming from a higher elevation into the discharge tank.
Figure 4-19 Location of pump shut-off head on the performance curve.
www.cmmlearn.blogfa.com
www.cmmlearn.blogfa.com

[email protected] www.cmmlearn.blogfa.com
P = pP q
where pP is the difference in pressure at the inlet and the outlet of the pump, and q
the flow rate.
AFFINITY LAWS
4.9
PnDH
[email protected] www.cmmlearn.blogfa.com
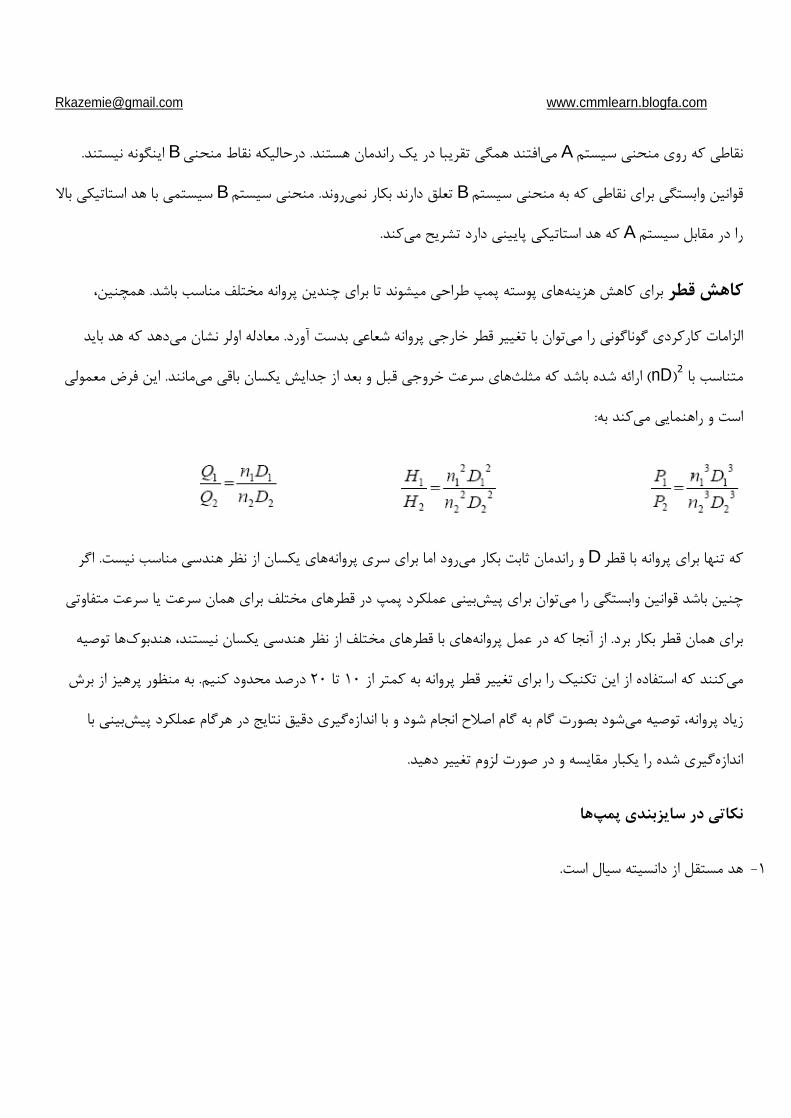
Figure 4-20 Limitation on the use of the affinity laws.
www.cmmlearn.blogfa.com
[email protected] www.cmmlearn.blogfa.com
spacerframe
BEP
shut-off
PUMP SYSTEM ANALYSIS AND SIZING BY JACQUES CHAURETTE p. eng.
CMField training
This document was created with Win2PDF available at http://www.daneprairie.com.The unregistered version of Win2PDF is for evaluation or non-commercial use only.