ספר תרשימים מקוצר en
TRANSCRIPT
Kohelet Economic Forum • November 2016 | Tishrei 5777
2016
Israel's Pathto Economic and Social Prosperity
Editors: Michael Sarel & Itamar Yakir
A s t o r y i n 2 5 c h a r t s

Israel's Path to Economic and Social ProsperityA story in 25 charts
© All rights reserved by Kohelet Policy ForumDesign and illustrations by Aaron Friedmann, Dov Abramson Studio
Printed in Israel 2016-5777ISBN: 978-965-7674-34-5
Compact Edition | November 2016 | Tishrei 5777
Israel's Path to Economic and
Social ProsperityA story in 25 charts
Editors:Michael Sarel & Itamar Yakir
Published by Kohelet Economic ForumSponsored by the Tikvah Fund
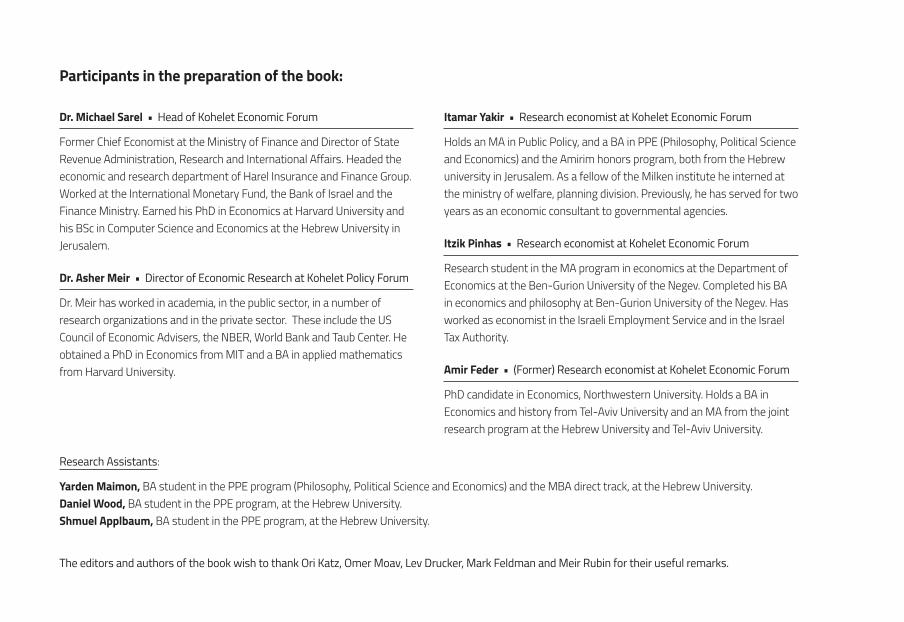
Participants in the preparation of the book:
Dr. Michael Sarel • Head of Kohelet Economic Forum
Former Chief Economist at the Ministry of Finance and Director of State Revenue Administration, Research and International Affairs. Headed the economic and research department of Harel Insurance and Finance Group. Worked at the International Monetary Fund, the Bank of Israel and the Finance Ministry. Earned his PhD in Economics at Harvard University and his BSc in Computer Science and Economics at the Hebrew University in Jerusalem.
Dr. Asher Meir • Director of Economic Research at Kohelet Policy Forum
Dr. Meir has worked in academia, in the public sector, in a number of research organizations and in the private sector. These include the US Council of Economic Advisers, the NBER, World Bank and Taub Center. He obtained a PhD in Economics from MIT and a BA in applied mathematics from Harvard University.
Itamar Yakir • Research economist at Kohelet Economic Forum
Holds an MA in Public Policy, and a BA in PPE (Philosophy, Political Science and Economics) and the Amirim honors program, both from the Hebrew university in Jerusalem. As a fellow of the Milken institute he interned at the ministry of welfare, planning division. Previously, he has served for two years as an economic consultant to governmental agencies.
Itzik Pinhas • Research economist at Kohelet Economic Forum
Research student in the MA program in economics at the Department of Economics at the Ben-Gurion University of the Negev. Completed his BA in economics and philosophy at Ben-Gurion University of the Negev. Has worked as economist in the Israeli Employment Service and in the Israel Tax Authority.
Amir Feder • (Former) Research economist at Kohelet Economic Forum
PhD candidate in Economics, Northwestern University. Holds a BA in Economics and history from Tel-Aviv University and an MA from the joint research program at the Hebrew University and Tel-Aviv University.
Research Assistants:
Yarden Maimon, BA student in the PPE program (Philosophy, Political Science and Economics) and the MBA direct track, at the Hebrew University. Daniel Wood, BA student in the PPE program, at the Hebrew University. Shmuel Applbaum, BA student in the PPE program, at the Hebrew University.
The editors and authors of the book wish to thank Ori Katz, Omer Moav, Lev Drucker, Mark Feldman and Meir Rubin for their useful remarks.

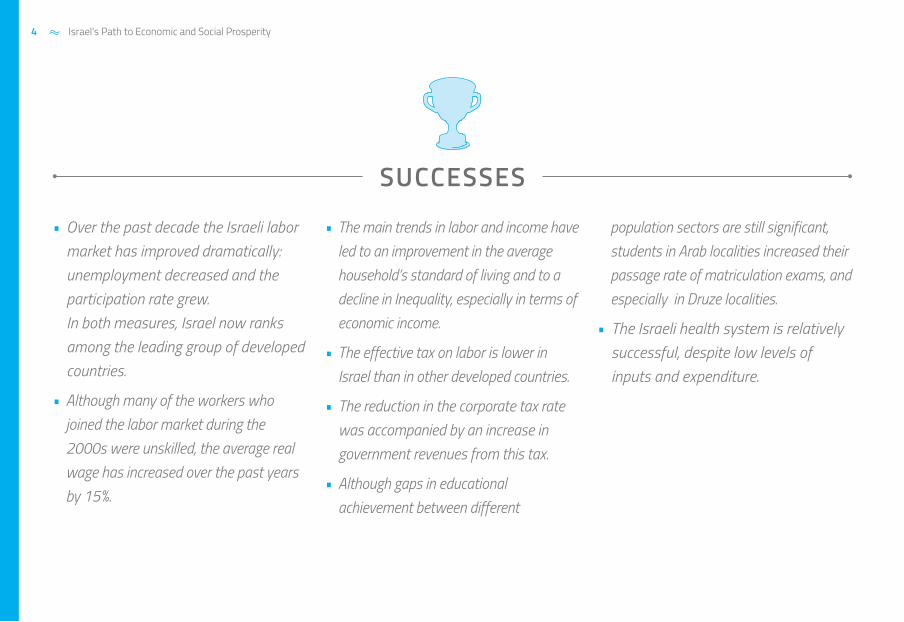
SUCCESSES
• Over the past decade the Israeli labor market has improved dramatically: unemployment decreased and the participation rate grew. In both measures, Israel now ranks among the leading group of developed countries.
• Although many of the workers who joined the labor market during the 2000s were unskilled, the average real wage has increased over the past years by 15%.
• The main trends in labor and income have led to an improvement in the average household’s standard of living and to a decline in Inequality, especially in terms of economic income.
• The effective tax on labor is lower in Israel than in other developed countries.
• The reduction in the corporate tax rate was accompanied by an increase in government revenues from this tax.
• Although gaps in educational achievement between different
population sectors are still significant, students in Arab localities increased their passage rate of matriculation exams, and especially in Druze localities.
• The Israeli health system is relatively successful, despite low levels of inputs and expenditure.
4 Israel's Path to Economic and Social Prosperity
OBSTACLES
• The productivity gap between Israel and other developed countries has grown since the 1980s. This is a product of the high barriers that characterize the Israeli marketplace; and the large fraction of Israeli youngsters lacking basic skills, among other factors.
• Haredi men and Arab women are characterized by low employment rates and wages regardless of education level, resulting in significant gaps in per capita income between the main population groups of Israeli society.
• The proportion of non-Haredi Jews in the population is projected to shrink considerably in the coming decades, and correspondingly the share of the Haredi population will increase. As a result, if current levels of employment and wages in the Haredi and Arab population remain the same, per capita income would be lower by 15% compared to the projection assuming static population composition.
• Without further changes in the retirement age, the duration of
retirement is expected to increase by a factor of 1.5 for men and even more for women.
• Israel's education expenditures are close to the median of developed countries, but performance is quite low by international standards.
5Israel's Path to Economic and Social Prosperity


SUCCESSES

79.9%
ParticipationUnemployment
2%
4%
6%
8%
10%
12%
72%
74%
76%
78%
80%
82%
20002001
20022003
20042005
20062007
20082009
20102011
20122013
20142015
11.7%
75.4%
4.6%
Source: Bank Of Israel
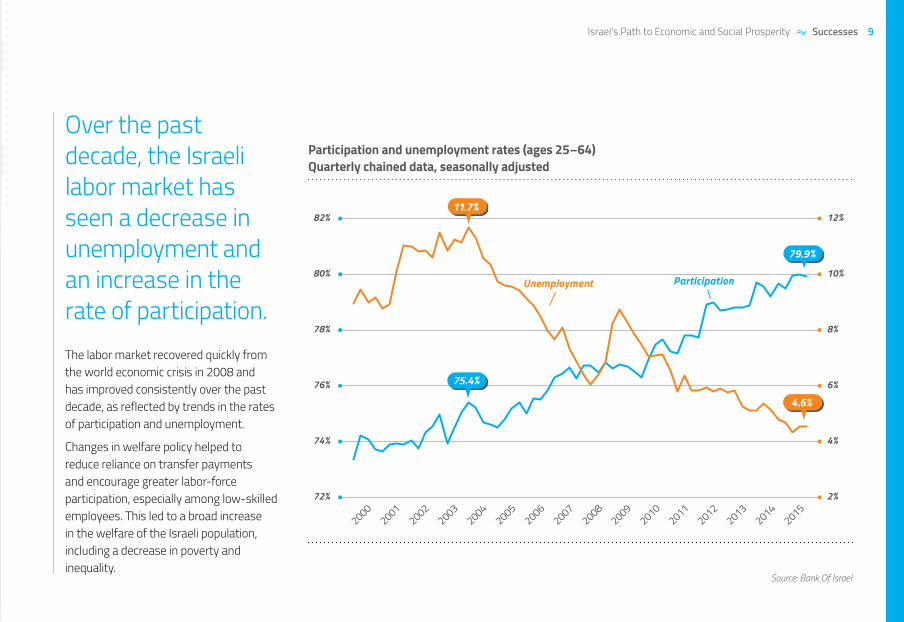
Over the past decade, the Israeli labor market has seen a decrease in unemployment and an increase in the rate of participation.The labor market recovered quickly from the world economic crisis in 2008 and has improved consistently over the past decade, as reflected by trends in the rates of participation and unemployment.
Changes in welfare policy helped to reduce reliance on transfer payments and encourage greater labor-force participation, especially among low-skilled employees. This led to a broad increase in the welfare of the Israeli population, including a decrease in poverty and inequality.
Participation and unemployment rates (ages 25–64) Quarterly chained data, seasonally adjusted
9Israel's Path to Economic and Social Prosperity Successes
Source: OECD.Stat
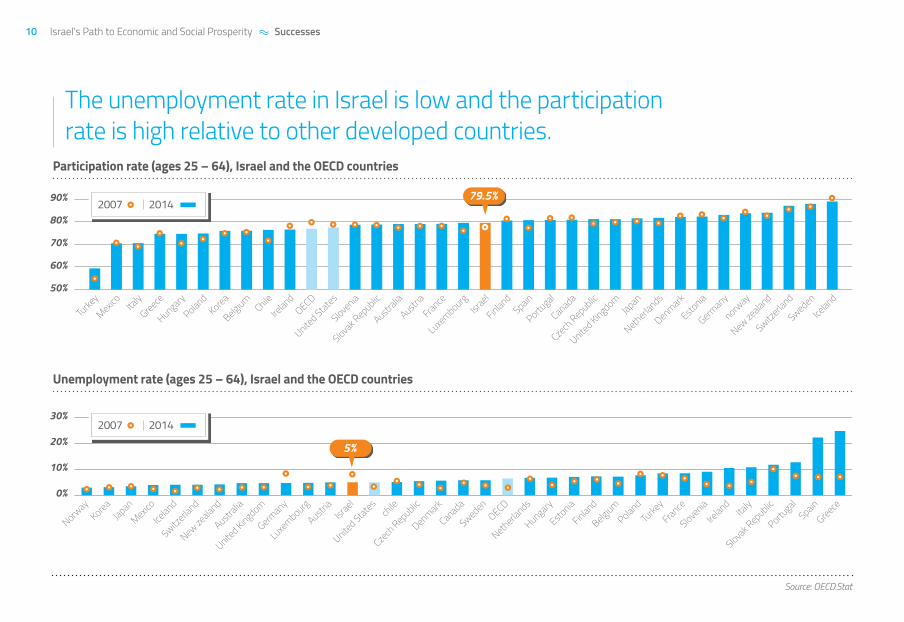
The unemployment rate in Israel is low and the participation rate is high relative to other developed countries.
Participation rate (ages 25 – 64), Israel and the OECD countries
0%
10%
20%
30%
50%
60%
70%
80%
90%
Norway
KoreaJapan
Mexico
Iceland
Switzerla
nd
New zealand
Australia
United Kingdom
Germany
Luxembourg
Austria
Israel
United States
chile
Czech
Republic
Denmark
Canada
SwedenOECD
Netherlands
Hungary
Estonia
Finland
BelgiumPoland
Turkey
France
Slovenia
Ireland
Italy
Slovak R
epublic
Portugal
SpainGreece
20142007
20142007
Turkey
Mexico
Italy
Greece
Hungary
PolandKorea
Belgium Chile
Ireland
OECD
United States
Slovenia
Slovak R
epublic
Australia
Austria
France
LuxembourgIsr
ael
FinlandSpain
Portugal
Canada
Czech
Republic
United Kingdom
Japan
Netherlands
Denmark
Estonia
Germany
norway
New zealand
Switzerla
nd
Sweden
Iceland
79.5%
7.3%5%
Unemployment rate (ages 25 – 64), Israel and the OECD countries
10 Israel's Path to Economic and Social Prosperity Successes
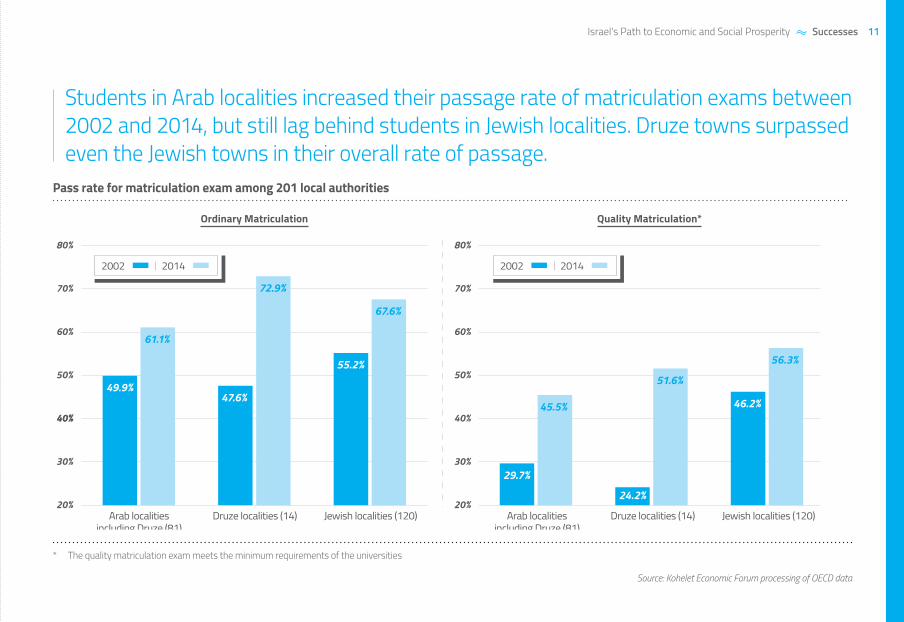
* The quality matriculation exam meets the minimum requirements of the universities
Source: Kohelet Economic Forum processing of OECD data
Students in Arab localities increased their passage rate of matriculation exams between 2002 and 2014, but still lag behind students in Jewish localities. Druze towns surpassed even the Jewish towns in their overall rate of passage.
Pass rate for matriculation exam among 201 local authorities
67.6%
72.9%
61.1%
55.2%
47.6%49.9%
20%
30%
40%40%
50%
60%
70%
80%
56.3%
51.6%
45.5% 46.2%
24.2%
29.7%
20%
30%
40%
50%
60%
70%
80%
Arab localitiesincluding Druze (81)
Druze localities (14) Jewish localities (120) Arab localitiesincluding Druze (81)
Druze localities (14) Jewish localities (120)
2002 20142002 2014
Quality Matriculation*Ordinary Matriculation
11Israel's Path to Economic and Social Prosperity Successes
31% 35%28%
62%
28%
112%
25%
97%
26%16%
0%
20%
40%
60%
80%
100%
120%
45-54 15-44
Age groupsJews
+55Jews & others(excl. Haredi)
Haredi
Religion
Jews &others(incl. Haredi)
Arabs
Sex
MenWomenTotal
* Haredim: by most recent educational institution
Source: Kohelet Economic Forum processing of CBS Income Surveys
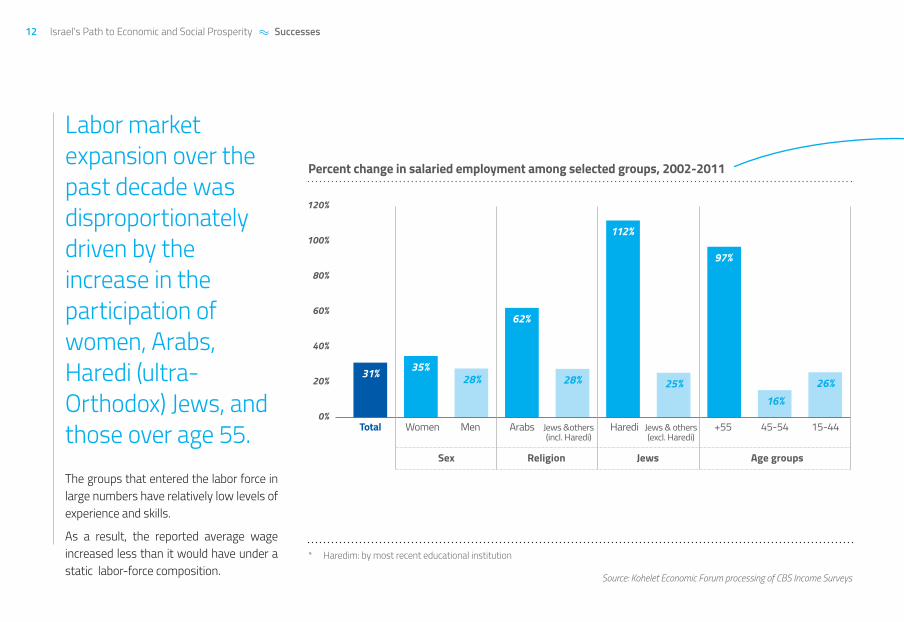
Labor market expansion over the past decade was disproportionately driven by the increase in the participation of women, Arabs, Haredi (ultra-Orthodox) Jews, and those over age 55.The groups that entered the labor force in large numbers have relatively low levels of experience and skills.
As a result, the reported average wage increased less than it would have under a static labor-force composition.
Percent change in salaried employment among selected groups, 2002-2011
12 Israel's Path to Economic and Social Prosperity Successes
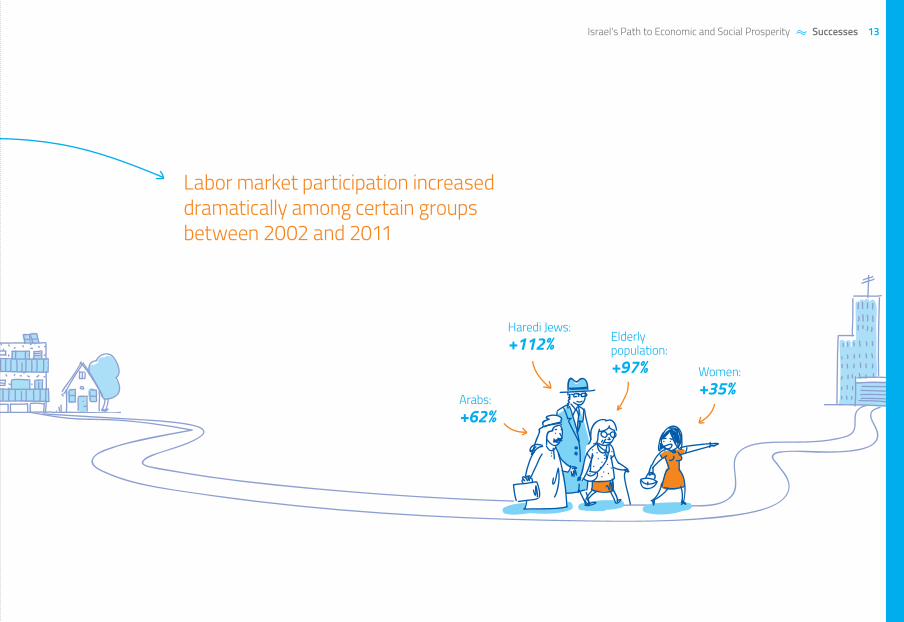
Arabs:+62%
Haredi Jews:+112% Elderly
population:+97% Women:
+35%
Labor market participation increased dramatically among certain groups between 2002 and 2011
13Israel's Path to Economic and Social Prosperity Successes
98
100
102
104
106
108
110
112
114
116
118
98
100
102
104
106
108
110
112
114
116
118
19971998
19992000
20012002
20032004
20052006
20072008
20092010
20112012
20132014
20151997
19981999
20002001
20022003
20042005
20062007
20082009
20102011
20122013
20142015
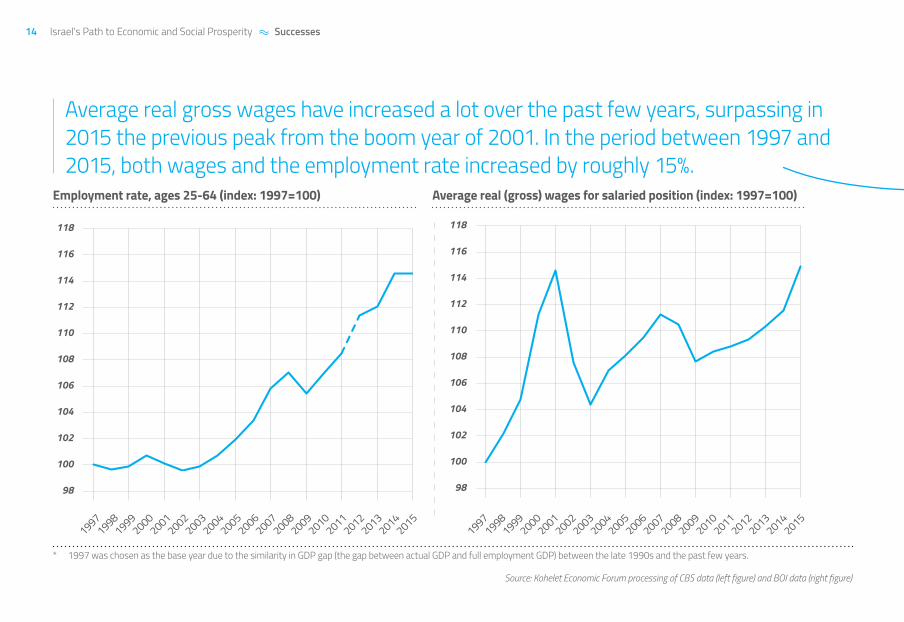
* 1997 was chosen as the base year due to the similarity in GDP gap (the gap between actual GDP and full employment GDP) between the late 1990s and the past few years.
Source: Kohelet Economic Forum processing of CBS data (left figure) and BOI data (right figure)
Average real gross wages have increased a lot over the past few years, surpassing in 2015 the previous peak from the boom year of 2001. In the period between 1997 and 2015, both wages and the employment rate increased by roughly 15%.
Employment rate, ages 25-64 (index: 1997=100) Average real (gross) wages for salaried position (index: 1997=100)
14 Israel's Path to Economic and Social Prosperity Successes
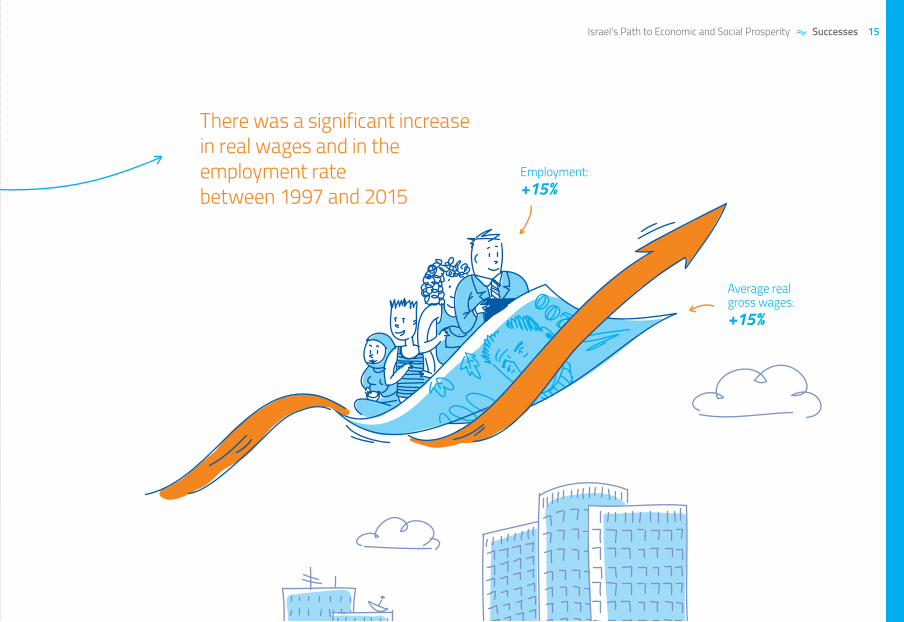
Employment:+15%
Average real gross wages:+15%
There was a significant increase in real wages and in the employment rate between 1997 and 2015
15Israel's Path to Economic and Social Prosperity Successes
-1.5% -3.4%
Income per standard person increased at a higher rate due to the decrease in the number of persons per households
Households' net income increased at a higher rate due to the increase in economic income and the decrease in income-tax ratesHouseholds’ income from
salaried work increased at a higher rate due to the increase in the number of wage-earners
Real wage increased by almost 5%
Income from salaried work per
employee
CPI Income from salaried work per employee,
2014 prices
Number of wage-earners
Household’s income from salaried work
Household’s gross money income from all sources
Household’s net money income from all sources
Persons per household
Standard persons per household
Real net income per standard
person
40.4%
34.2%
4.6%8.4%
13.3%16.7%
28.0%32.5%
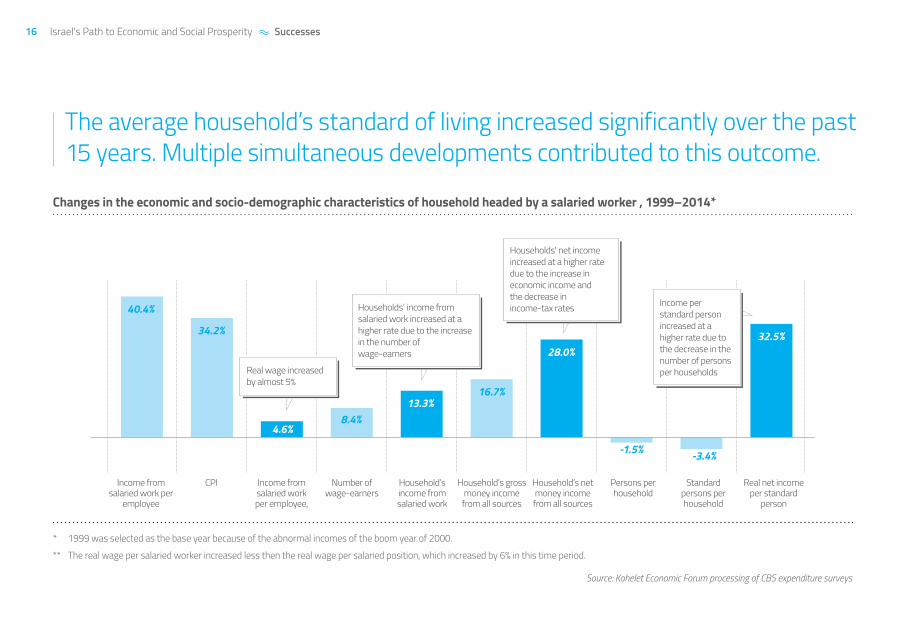
* 1999 was selected as the base year because of the abnormal incomes of the boom year of 2000.
** The real wage per salaried worker increased less then the real wage per salaried position, which increased by 6% in this time period.
Source: Kohelet Economic Forum processing of CBS expenditure surveys
The average household’s standard of living increased significantly over the past 15 years. Multiple simultaneous developments contributed to this outcome.
Changes in the economic and socio-demographic characteristics of household headed by a salaried worker , 1999–2014*
16 Israel's Path to Economic and Social Prosperity Successes
* "Total income" refers to monetary and non-monetary (in-kind) income, such as imputed income for self-used housing.
Source: Kohelet Economic Forum processing of CBS and National Insurance Institute data
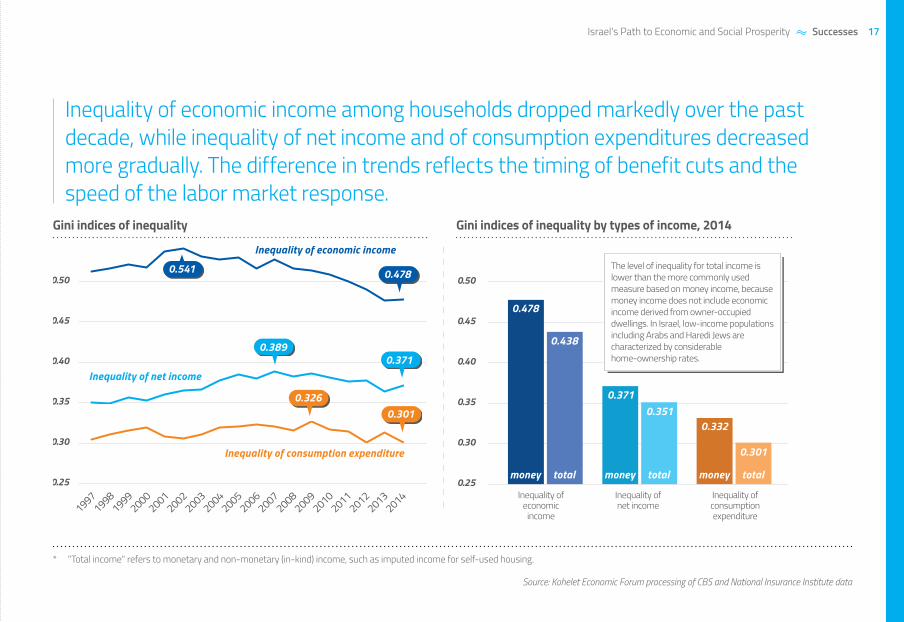
Inequality of economic income among households dropped markedly over the past decade, while inequality of net income and of consumption expenditures decreased more gradually. The difference in trends reflects the timing of benefit cuts and the speed of the labor market response.
Gini indices of inequality Gini indices of inequality by types of income, 2014
0.25
0.30
0.35
0.40
0.45
0.50
0.25
0.30
0.35
0.40
0.45
0.50
19971998
19992000
20012002
20032004
20052006
20072008
20092010
20112012
20132014
Inequality of economic income
Inequality of net income
Inequality of consumption expenditure
The level of inequality for total income is lower than the more commonly used measure based on money income, because money income does not include economic income derived from owner-occupied dwellings. In Israel, low-income populations including Arabs and Haredi Jews are characterized by considerable home-ownership rates.
Inequality of consumption expenditure
Inequality of net income
Inequality of economic
income
0.478
money total money total money total
0.438
0.3710.351
0.332
0.301
0.3890.371
0.3260.301
0.4780.541
17Israel's Path to Economic and Social Prosperity Successes
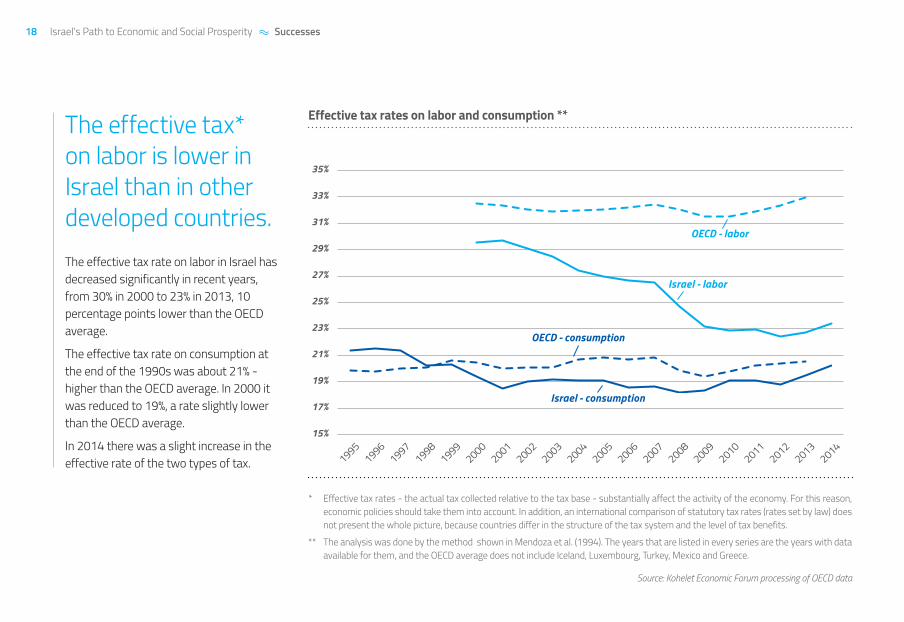
* Effective tax rates - the actual tax collected relative to the tax base - substantially affect the activity of the economy. For this reason, economic policies should take them into account. In addition, an international comparison of statutory tax rates (rates set by law) does not present the whole picture, because countries differ in the structure of the tax system and the level of tax benefits.
** The analysis was done by the method shown in Mendoza et al. (1994). The years that are listed in every series are the years with data available for them, and the OECD average does not include Iceland, Luxembourg, Turkey, Mexico and Greece.
Source: Kohelet Economic Forum processing of OECD data
The effective tax* on labor is lower in Israel than in other developed countries.The effective tax rate on labor in Israel has decreased significantly in recent years, from 30% in 2000 to 23% in 2013, 10 percentage points lower than the OECD average.
The effective tax rate on consumption at the end of the 1990s was about 21% - higher than the OECD average. In 2000 it was reduced to 19%, a rate slightly lower than the OECD average.
In 2014 there was a slight increase in the effective rate of the two types of tax.
Norway
KoreaJapan
Mexico
Iceland
Switzerla
nd
New zealand
Australia
United Kingdom
Germany
Luxembourg
Austria
Israel
United States
chile
Czech
Republic
Denmark
Canada
SwedenOECD
Netherlands
Hungary
Estonia
Finland
BelgiumPoland
Turkey
France
Slovenia
Ireland
Italy
Slovak R
epublic
Portugal
SpainGreece
15%
17%
19%
21%
23%
25%
27%
29%
31%
33%
35%
19951996
19971998
19992000
20012002
20032004
20052006
20072008
20092010
20112012
20132014
OECD - labor
OECD - consumption
Israel - labor
Israel - consumption
Effective tax rates on labor and consumption **
18 Israel's Path to Economic and Social Prosperity Successes
Source: Bank Of Israel
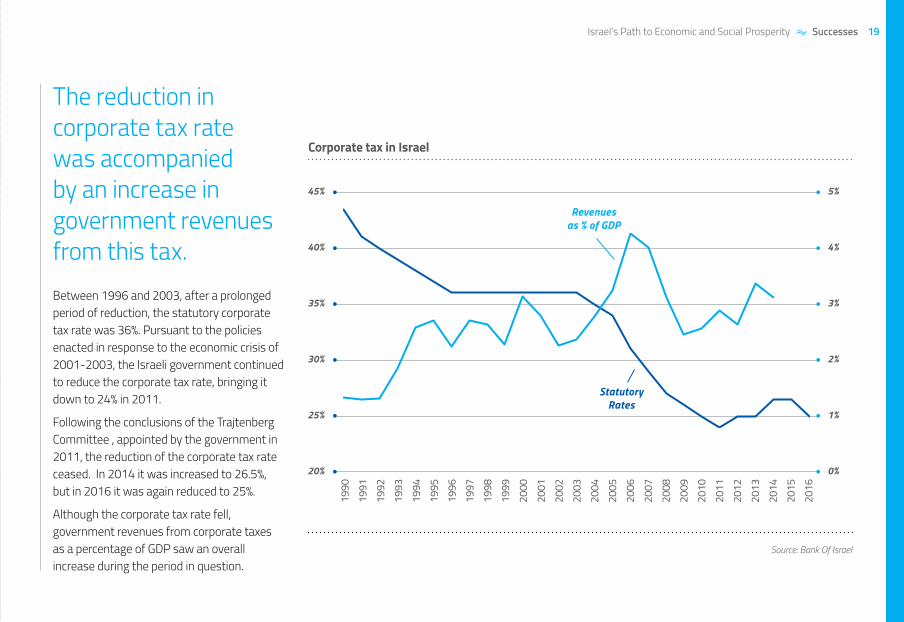
The reduction in corporate tax rate was accompanied by an increase in government revenues from this tax.Between 1996 and 2003, after a prolonged period of reduction, the statutory corporate tax rate was 36%. Pursuant to the policies enacted in response to the economic crisis of 2001-2003, the Israeli government continued to reduce the corporate tax rate, bringing it down to 24% in 2011.
Following the conclusions of the Trajtenberg Committee , appointed by the government in 2011, the reduction of the corporate tax rate ceased. In 2014 it was increased to 26.5%, but in 2016 it was again reduced to 25%.
Although the corporate tax rate fell, government revenues from corporate taxes as a percentage of GDP saw an overall increase during the period in question.
Corporate tax in Israel
0%
1%
2%
3%
4%
5%
20%
25%
30%
35%
40%
45%
1990
1991
1992
1993
1994
1995
1996
1997
1998
1999
2000
2001
2002
2003
2004
2005
2006
2007
2008
2009
2010
2011
2012
2013
2014
2015
2016
StatutoryRates
Revenuesas % of GDP
19Israel's Path to Economic and Social Prosperity Successes
Source: Kohelet Economic Forum processing of OECD data
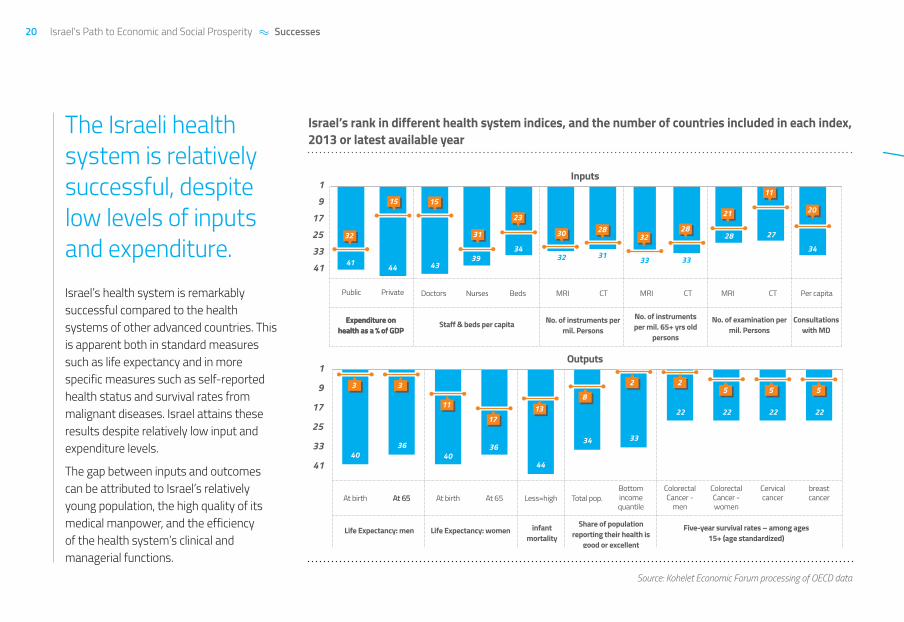
The Israeli health system is relatively successful, despite low levels of inputs and expenditure.Israel’s health system is remarkably successful compared to the health systems of other advanced countries. This is apparent both in standard measures such as life expectancy and in more specific measures such as self-reported health status and survival rates from malignant diseases. Israel attains these results despite relatively low input and expenditure levels.
The gap between inputs and outcomes can be attributed to Israel’s relatively young population, the high quality of its medical manpower, and the efficiency of the health system’s clinical and managerial functions.
Israel’s rank in different health system indices, and the number of countries included in each index, 2013 or latest available year
41 44 4339
3432 31 33 33
28 27
34
19
17253341
4036
4036
44
34 33
22 22 22 22
1
9
17
25
33
41
Per capitaCTMRICTMRICTMRIBedsNursesDoctors
Consultations with MD
No. of examination per mil. Persons
No. of instruments per mil. 65+ yrs old
persons
No. of instruments per mil. Persons
Staff & beds per capitaExpenditure on health as a % of GDP
Expenditure on health as a % of GDP
PrivatePublic
55522
813
17
11
33
32
15 15
31
23
30 2832
28
21
11
20
Life Expectancy: men
At 65At 65At birth At birth At 65 Less=highBottom income quantile
Colorectal Cancer -
men
Colorectal Cancer - women
Cervical cancer
breast cancerTotal pop.
Life Expectancy: women infant mortality
Share of population reporting their health is
good or excellent
Five-year survival rates – among ages 15+ (age standardized)
Inputs
Outputs
20 Israel's Path to Economic and Social Prosperity Successes
Despite low levels of inputs and expenditure, the Israeli health system is relatively successful
21Israel's Path to Economic and Social Prosperity Successes
* Haredi Jews: by most recent educational institution
** Bellow each group, its share out of the total number of rooms for living
Source: Kohelet Economic Forum processing of CBS expenditure Surveys
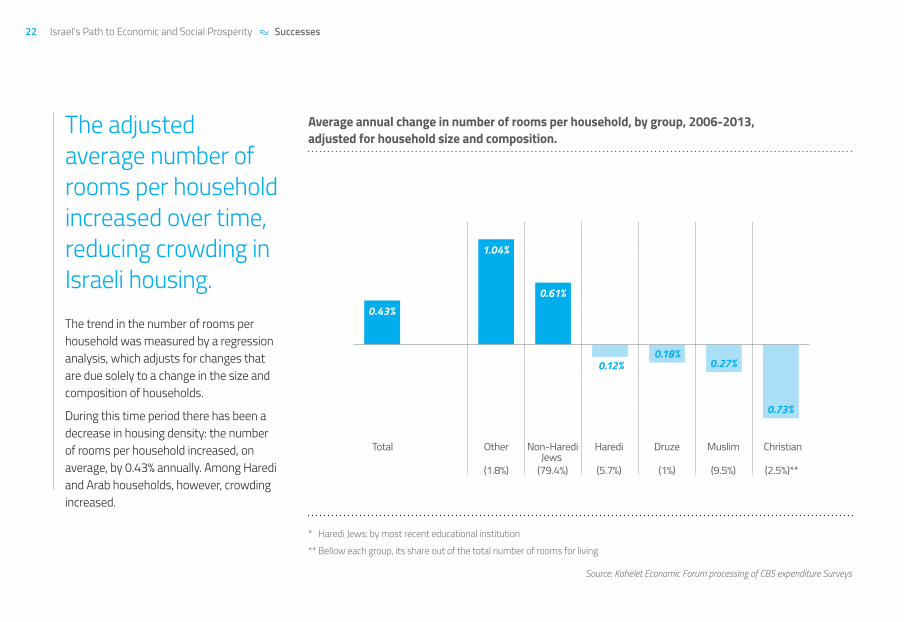
The adjusted average number of rooms per household increased over time, reducing crowding in Israeli housing.The trend in the number of rooms per household was measured by a regression analysis, which adjusts for changes that are due solely to a change in the size and composition of households.
During this time period there has been a decrease in housing density: the number of rooms per household increased, on average, by 0.43% annually. Among Haredi and Arab households, however, crowding increased.
Average annual change in number of rooms per household, by group, 2006-2013, adjusted for household size and composition.
0.43%
1.04%
0.61%
0.12%0.18%
0.27%
0.73%
Christian
(2.5%)**
Muslim
(9.5%)
Druze
(1%)
Haredi
(5.7%)
Non-HarediJews
(79.4%)
Other
(1.8%)
Total
22 Israel's Path to Economic and Social Prosperity Successes

OBSTACLES

* Average of all OECD countries except the Czech Republic, Estonia, Poland, Slovakia, Slovenia, New Zealand and Hungary
** Labels show average annual change in the relevant sub-period.
Source: Kohelet Economic Forum processing of Penn World Table 8.1, labor market data from the World Bank and the national accounting data according to the OECD
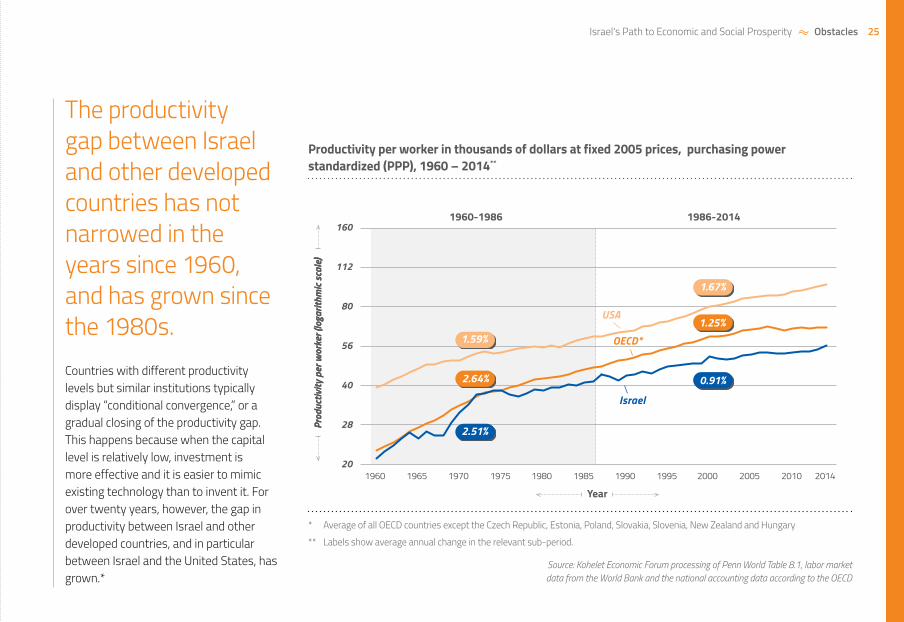
The productivity gap between Israel and other developed countries has not narrowed in the years since 1960, and has grown since the 1980s.Countries with different productivity levels but similar institutions typically display “conditional convergence,” or a gradual closing of the productivity gap. This happens because when the capital level is relatively low, investment is more effective and it is easier to mimic existing technology than to invent it. For over twenty years, however, the gap in productivity between Israel and other developed countries, and in particular between Israel and the United States, has grown.*
Productivity per worker in thousands of dollars at fixed 2005 prices, purchasing power standardized (PPP), 1960 – 2014**
20
Prod
uctiv
ity p
er w
orke
r (lo
garit
hmic
scal
e)Pr
oduc
tivity
per
wor
ker (
loga
rithm
ic sc
ale)
28
40
56
80
112
160
1960 1965 1970 1975 1980 1985 1990 1995 2000 2005 2010 2014
Year
1960-1986 1986-2014
USA
OECD*
Israel
1.67%
1.25%
0.91%
2.51%
2.64%
1.59%
25Israel's Path to Economic and Social Prosperity Obstacles
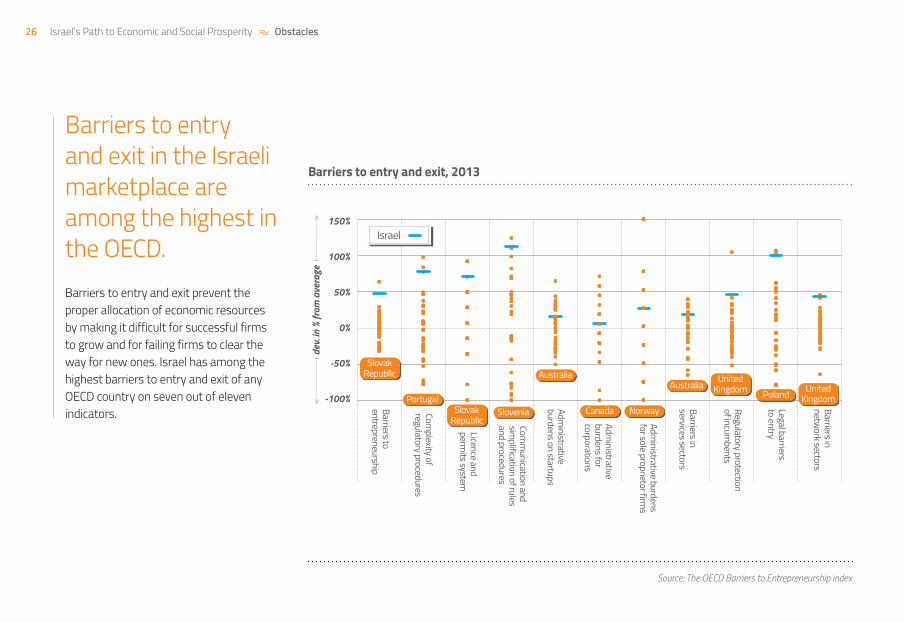
Source: The OECD Barriers to Entrepreneurship index
Barriers to entry and exit in the Israeli marketplace are among the highest in the OECD.Barriers to entry and exit prevent the proper allocation of economic resources by making it difficult for successful firms to grow and for failing firms to clear the way for new ones. Israel has among the highest barriers to entry and exit of any OECD country on seven out of eleven indicators.
Barriers to entry and exit, 2013
-100%
150%
-50%
100%
0%
50%
Israel
AustraliaAustralia
SloveniaPortugal
SlovakRepublic
SlovakRepublic
NorwayCanada
Poland
Complexity of
regulatory procedures
Barriers to entrepreneurship
Administrative
burdens on startups
Barriers in services sectors
Regulatory protection of incum
bents
Legal barriers to entry
Barriers in netw
ork sectors
Licence and perm
its system
Comm
unication and sim
plification of rules and procedures
Administrative
burdens for corporations
Administrative burdens
for sole proprietor firms
dev.
in %
from
ave
rage
UnitedKingdom
UnitedKingdom
26 Israel's Path to Economic and Social Prosperity Obstacles
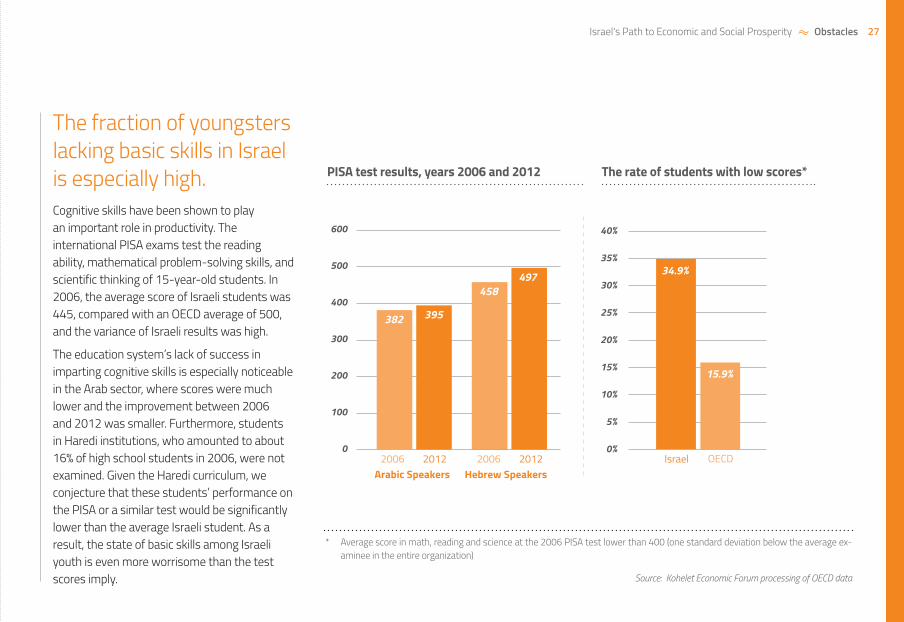
* Average score in math, reading and science at the 2006 PISA test lower than 400 (one standard deviation below the average ex-aminee in the entire organization)
Source: Kohelet Economic Forum processing of OECD data
The fraction of youngsters lacking basic skills in Israel is especially high. Cognitive skills have been shown to play an important role in productivity. The international PISA exams test the reading ability, mathematical problem-solving skills, and scientific thinking of 15-year-old students. In 2006, the average score of Israeli students was 445, compared with an OECD average of 500, and the variance of Israeli results was high.
The education system’s lack of success in imparting cognitive skills is especially noticeable in the Arab sector, where scores were much lower and the improvement between 2006 and 2012 was smaller. Furthermore, students in Haredi institutions, who amounted to about 16% of high school students in 2006, were not examined. Given the Haredi curriculum, we conjecture that these students’ performance on the PISA or a similar test would be significantly lower than the average Israeli student. As a result, the state of basic skills among Israeli youth is even more worrisome than the test scores imply.
395
497458
0
100
200
300
400
500
600
0%
5%
10%
15%
20%
25%
30%
35%
40%
2006 OECDIsrael2012
382
2006 2012
15.9%
34.9%
Hebrew SpeakersArabic Speakers
The rate of students with low scores*PISA test results, years 2006 and 2012
27Israel's Path to Economic and Social Prosperity Obstacles
95%90%
90%50%
90%77%
88%83%
88%65%
78%26%
3 5 7 9 11 13 15Thousands shekelsper month 17 19 21
Bubble size = employment rate
Bellow BA BA and above
MEN
WOM
EN
non-Haredi Jews
Haredi Jews
Arabs
non-Haredi Jews
Haredi Jews
Arabs
Source: Kohelet Economic Forum processing of CBS Expenditure Survey data
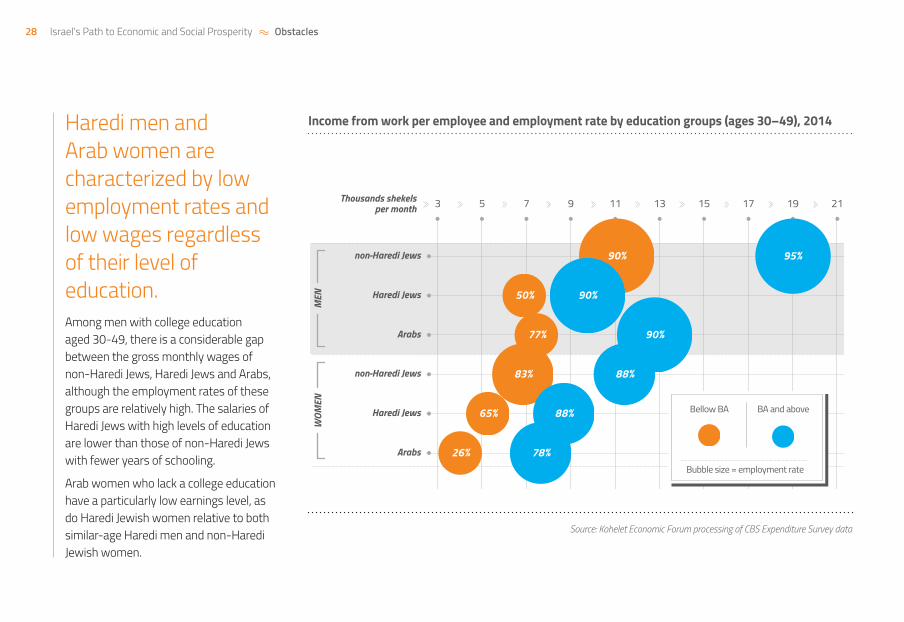
Haredi men and Arab women are characterized by low employment rates and low wages regardless of their level of education.Among men with college education aged 30-49, there is a considerable gap between the gross monthly wages of non-Haredi Jews, Haredi Jews and Arabs, although the employment rates of these groups are relatively high. The salaries of Haredi Jews with high levels of education are lower than those of non-Haredi Jews with fewer years of schooling.
Arab women who lack a college education have a particularly low earnings level, as do Haredi Jewish women relative to both similar-age Haredi men and non-Haredi Jewish women.
Income from work per employee and employment rate by education groups (ages 30–49), 2014
28 Israel's Path to Economic and Social Prosperity Obstacles
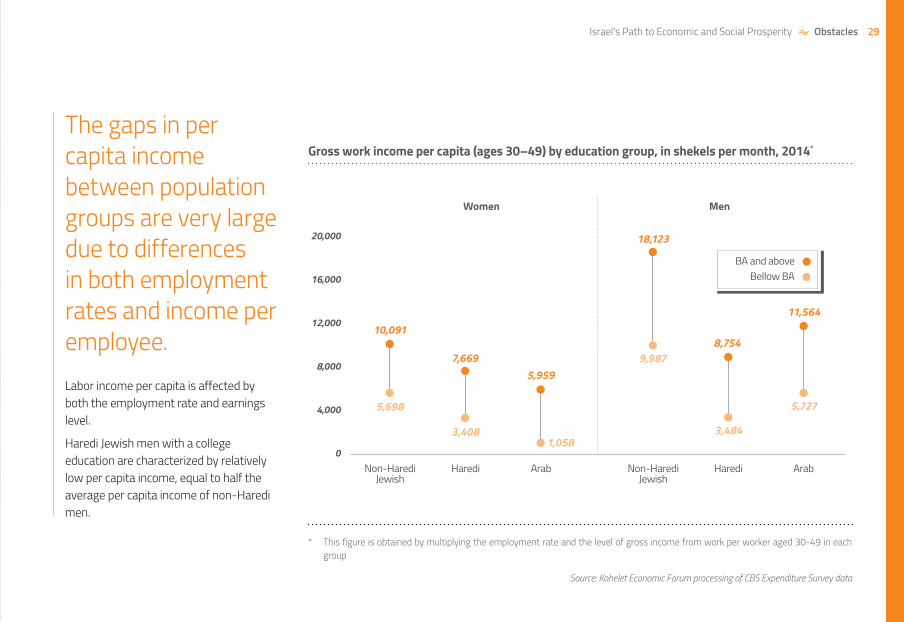
* This figure is obtained by multiplying the employment rate and the level of gross income from work per worker aged 30-49 in each group
Source: Kohelet Economic Forum processing of CBS Expenditure Survey data
The gaps in per capita income between population groups are very large due to differences in both employment rates and income per employee.Labor income per capita is affected by both the employment rate and earnings level.
Haredi Jewish men with a college education are characterized by relatively low per capita income, equal to half the average per capita income of non-Haredi men.
Gross work income per capita (ages 30–49) by education group, in shekels per month, 2014*
ArabHarediNon-HarediJewish
ArabHarediNon-HarediJewish
10,091
5,698
7,669
3,408
5,959
1,058
18,123
9,9878,754
3,484
BA and aboveBellow BA
11,564
5,727
0
4,000
8,000
12,000
16,000
20,000
Women Men
29Israel's Path to Economic and Social Prosperity Obstacles
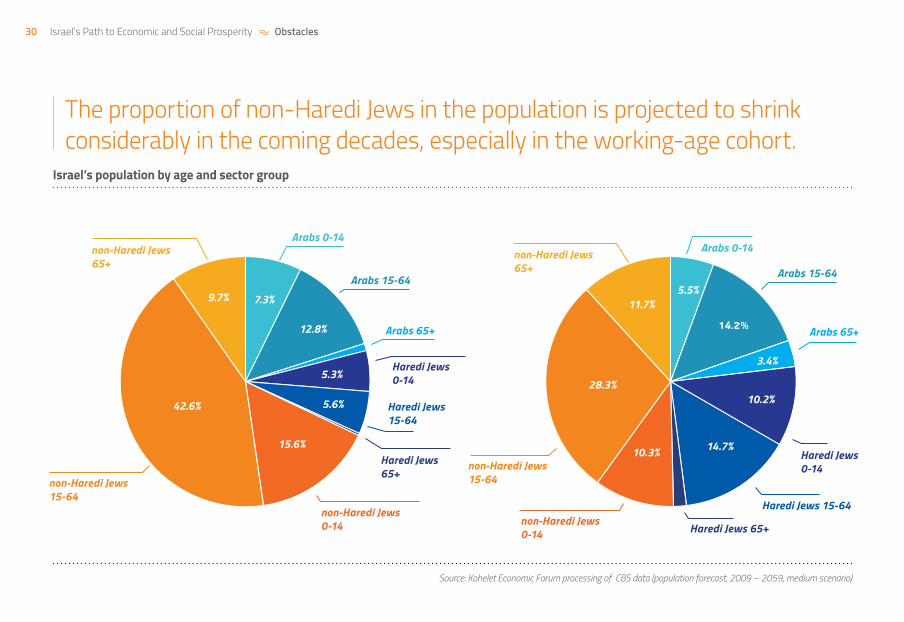
Source: Kohelet Economic Forum processing of CBS data (population forecast, 2009 – 2059, medium scenario)
The proportion of non-Haredi Jews in the population is projected to shrink considerably in the coming decades, especially in the working-age cohort.
Israel’s population by age and sector group
28.3%
11.7%
10.3%
14.2%
5.5%
10.2%
14.7%
3.4%
42.6%
9.7%
15.6%
7.3%
12.8%
5.3%
5.6%
Arabs 0-14Arabs 0-14
Arabs 15-64Arabs 15-64
Arabs 65+Arabs 65+
Haredi Jews0-14
Haredi Jews0-14
Haredi Jews 15-64
Haredi Jews 65+
Haredi Jews 15-64
Haredi Jews 65+non-Haredi Jews 0-14
non-Haredi Jews 0-14
non-Haredi Jews 15-64non-Haredi Jews
15-64
non-Haredi Jews 65+
non-Haredi Jews 65+
30 Israel's Path to Economic and Social Prosperity Obstacles
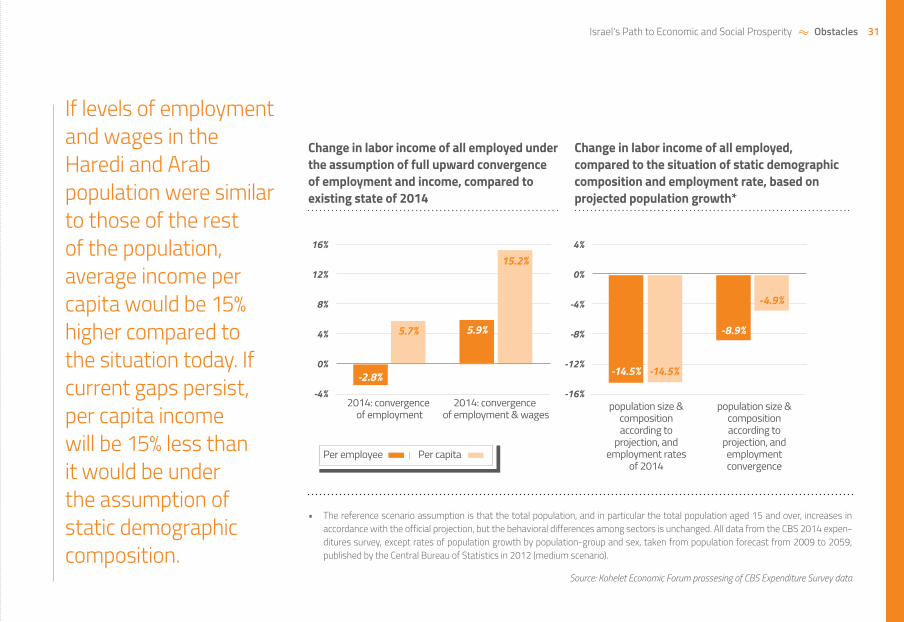
• The reference scenario assumption is that the total population, and in particular the total population aged 15 and over, increases in accordance with the official projection, but the behavioral differences among sectors is unchanged. All data from the CBS 2014 expen-ditures survey, except rates of population growth by population-group and sex, taken from population forecast from 2009 to 2059, published by the Central Bureau of Statistics in 2012 (medium scenario).
Source: Kohelet Economic Forum prossesing of CBS Expenditure Survey data
If levels of employment and wages in the Haredi and Arab population were similar to those of the rest of the population, average income per capita would be 15% higher compared to the situation today. If current gaps persist, per capita income will be 15% less than it would be under the assumption of static demographic composition.
Change in labor income of all employed under the assumption of full upward convergence of employment and income, compared to existing state of 2014
Change in labor income of all employed, compared to the situation of static demographic composition and employment rate, based on projected population growth*
-16%
-12%
-8%
-4%
0%
4%
-4%
0%
4%
8%
12%
16%15.2%
5.9%5.7%
-2.8%
2014: convergence of employment
2014: convergence of employment & wages
-4.9%
-8.9%
-14.5%-14.5%
population size & composition according to
projection, and employment rates
of 2014
population size & composition according to
projection, and employment convergence
Per employee Per capita
31Israel's Path to Economic and Social Prosperity Obstacles
Source: Kohelet Economic Forum processing of OECD data
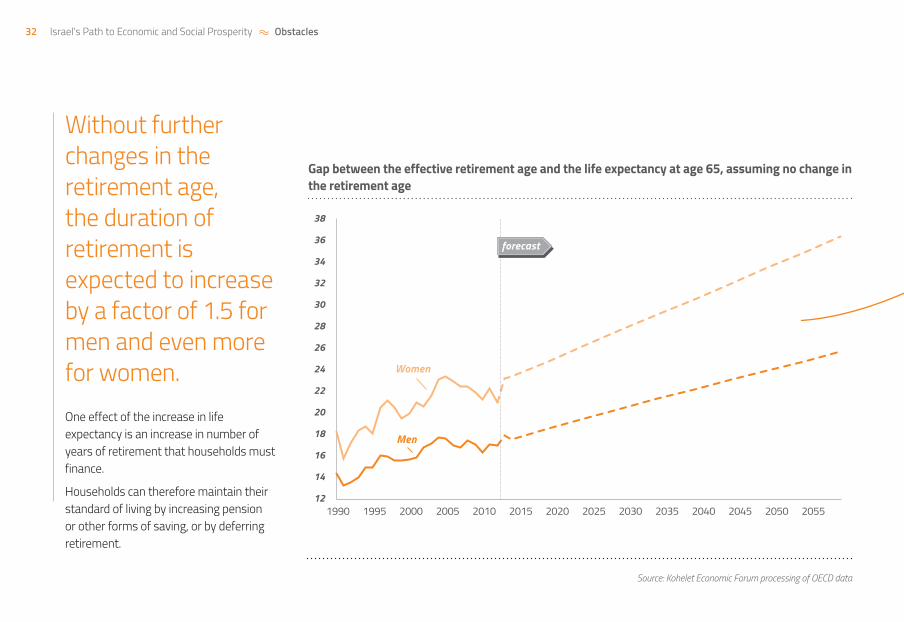
Without further changes in the retirement age, the duration of retirement is expected to increase by a factor of 1.5 for men and even more for women. One effect of the increase in life expectancy is an increase in number of years of retirement that households must finance.
Households can therefore maintain their standard of living by increasing pension or other forms of saving, or by deferring retirement.
Gap between the effective retirement age and the life expectancy at age 65, assuming no change in the retirement age
12
14
16
18
20
22
24
26
28
30
32
34
36
38
1990 1995 2000 2005 2010 2015 2020 2025 2030 2035 2040 2045 2050 2055
forecast
Men
Women
32 Israel's Path to Economic and Social Prosperity Obstacles
The duration of retirement is expected to increase by a factor of 1.5
33Israel's Path to Economic and Social Prosperity Obstacles
3838
38 3231
3835 36
14 14 14
17
131925313743
17
13192531374349
18
9 102
12 132630
2630
26 2720
35
17
2925
1818
22 92 3 4
Expenditure on education as a % of GDP
Share of pop. by level of education
Secondary and above
(25-34)
Higher Education
(25-34)
Higher Education
(55-64) Scientific Nobel prizes
Per capita
Average Grade
Grade of the 90th
percentile
Average Grade
Grade of the 90th
percentile
Average Grade
Grade of the 90th
percentile
Average Grade
Grade of the 90th
percentile
PISA: Reading PISA: Mathematics PISA: Science PISA: Problem Solving
Upper secondary
Lower secondary
PrimaryUpper secondary
Lower secondary
PrimarySecondaryPrimaryHigher Education
SecondaryPrimary
Students per classroom* Students per teacher* Teachers’ salary compared to workers
with similar qualification (25-64)
28283434
34343434
50444444
Inputs
Outputs
* In these categories, a higher rank is attributed to a lower ratio.
Source: Kohelet Economic Forum processing of OECD data
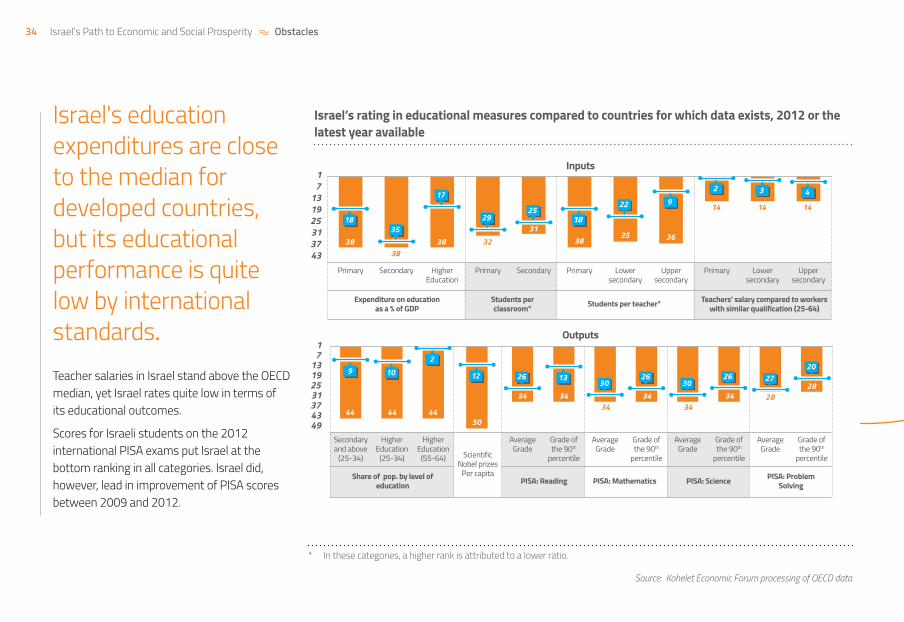
Israel's education expenditures are close to the median for developed countries, but its educational performance is quite low by international standards.Teacher salaries in Israel stand above the OECD median, yet Israel rates quite low in terms of its educational outcomes.
Scores for Israeli students on the 2012 international PISA exams put Israel at the bottom ranking in all categories. Israel did, however, lead in improvement of PISA scores between 2009 and 2012.
Israel’s rating in educational measures compared to countries for which data exists, 2012 or the latest year available
34 Israel's Path to Economic and Social Prosperity Obstacles
Israel's education expenditures are close to the median of developed countries, but performance is quite low
35Israel's Path to Economic and Social Prosperity Obstacles
* Simple average of the 25 OECD countries for which data is available.
** The forecast for Israel for 2015-2018 assumes annual growth of 3% in the average wage of full-time employees.
*** Link: www.oecd.org/israel/Employment-Outlook-Israel-EN.pdf
Source: Kohelet Economic Forum processing of OECD data
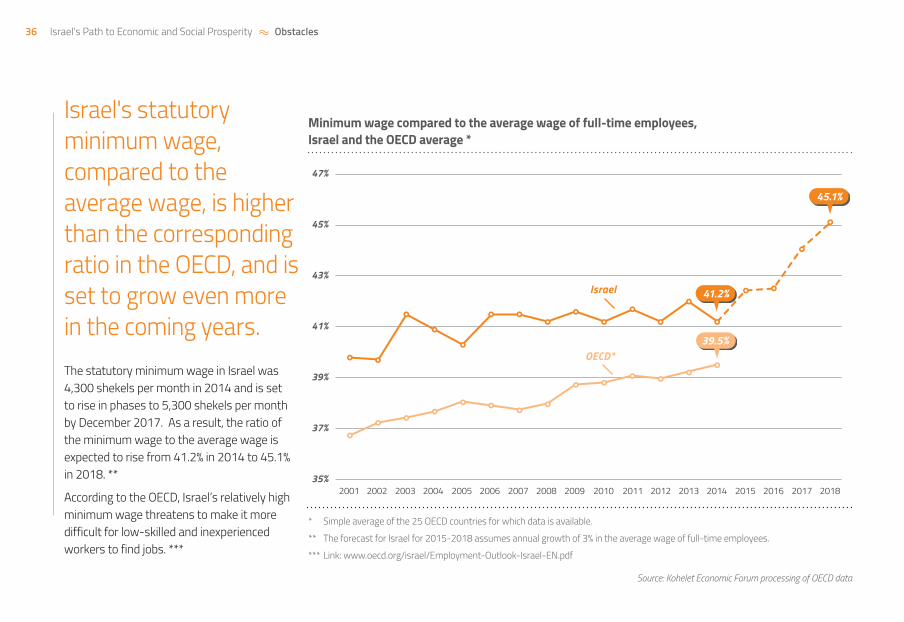
Israel's statutory minimum wage, compared to the average wage, is higher than the corresponding ratio in the OECD, and is set to grow even more in the coming years.The statutory minimum wage in Israel was 4,300 shekels per month in 2014 and is set to rise in phases to 5,300 shekels per month by December 2017. As a result, the ratio of the minimum wage to the average wage is expected to rise from 41.2% in 2014 to 45.1% in 2018. **
According to the OECD, Israel’s relatively high minimum wage threatens to make it more difficult for low-skilled and inexperienced workers to find jobs. ***
Minimum wage compared to the average wage of full-time employees, Israel and the OECD average *
35%
37%
39%
41%
43%
45%
47%
2001 2002 2003 2004 2005 2006 2007 2008 2009 2010 2011 2012 2013 2014 2015 2016 2017 2018
Israel
OECD*
45.1%
41.2%
39.5%
36 Israel's Path to Economic and Social Prosperity Obstacles
* 21 OECD countries. Data for 2013 or last year available.
Source: Kohelet Economic Forum processing of LIS data
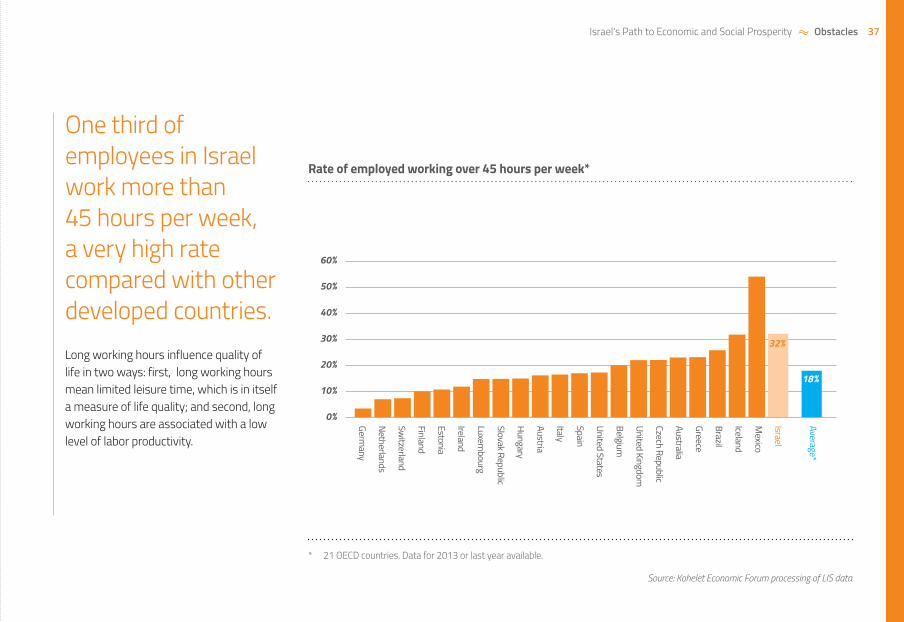
One third of employees in Israel work more than 45 hours per week, a very high rate compared with other developed countries.Long working hours influence quality of life in two ways: first, long working hours mean limited leisure time, which is in itself a measure of life quality; and second, long working hours are associated with a low level of labor productivity.
Rate of employed working over 45 hours per week*
0%
10%
20%
30%
40%
50%
60%
18%
32%
Israel
Mexico
Iceland
Brazil
Greece
Australia
Czech Republic
United Kingdom
Belgium
United States
Spain
Italy
Austria
Hungary
Slovak Republic
Luxembourg
Ireland
Estonia
Finland
Switzerland
Netherlands
Germany
Average*
37Israel's Path to Economic and Social Prosperity Obstacles
* OLS estimation of the unemployment rate in the settlement included as explanatory variables settlement size (logarithm) and dummy variables for sector and region. In calculating the forecast, we assumed settlement size equal to the average of the sample (195 settle-ments).
Source:Kohelet Economic Forum processing of Israeli Employment Service data (for both charts)
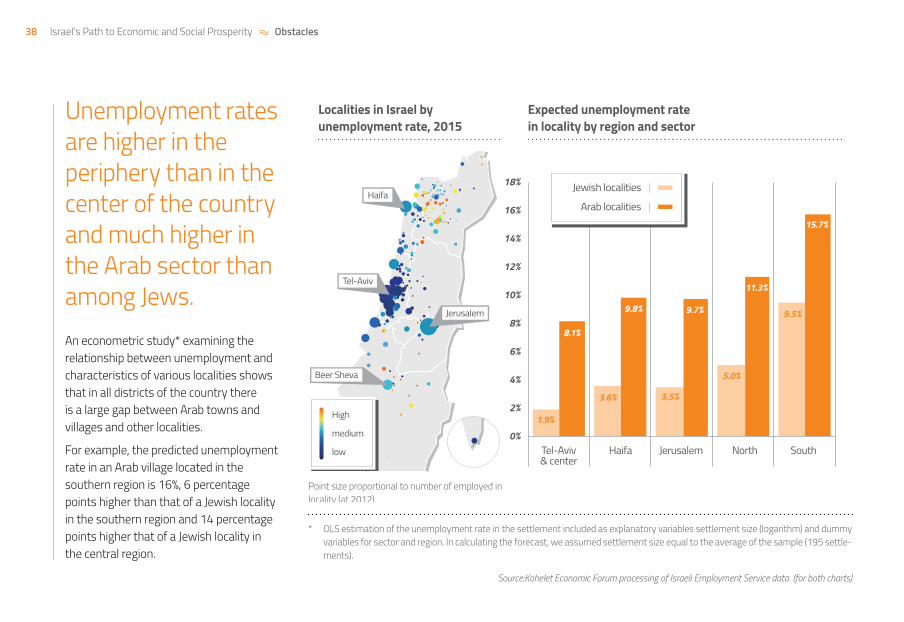
Unemployment rates are higher in the periphery than in the center of the country and much higher in the Arab sector than among Jews.An econometric study* examining the relationship between unemployment and characteristics of various localities shows that in all districts of the country there is a large gap between Arab towns and villages and other localities.
For example, the predicted unemployment rate in an Arab village located in the southern region is 16%, 6 percentage points higher than that of a Jewish locality in the southern region and 14 percentage points higher that of a Jewish locality in the central region.
Expected unemployment rate in locality by region and sector
Localities in Israel by unemployment rate, 2015
Point size proportional to number of employed in locality (at 2012)
1.9%
3.6% 3.5%
5.0%
9.5%
8.1%
9.8% 9.7%
11.3%
15.7%
0%
2%
4%
6%
8%
10%
12%
14%
16%
18%
SouthNorthJerusalemHaifaTel-Aviv& center
Jewish localities
Arab localitiesHaifa
Tel-Aviv
Jerusalem
Beer Sheva
High
medium
low
38 Israel's Path to Economic and Social Prosperity Obstacles
0.4
0.5
0.6
0.7
0.8
0.9
1.0
1.1
1.2
2001 2002 2003 2004 2005 2006 2007 2008 2009 2010 2011 2012 2013
0%
10%
20%
30%
40%
50%
60%
20%
15%
23%
14%
26%
26%
29%
23%
29%
29%
33%
26%
36%
31%
49%
44%
52%
47%
Jerusalem
Wage in all localities (simple average)
Beit ShemeshEladSafedBnei Brak
Beitar IllitModi’in Illit
PetahTikvah
Rehovot
Safed
Jerusalem
Beit Shem
esh
Bnei Brak
Elad
Beitar Illit
Modi’in Illit
heterogeneouslocalities
localities with largeHaredi population
haredi localities
20142002
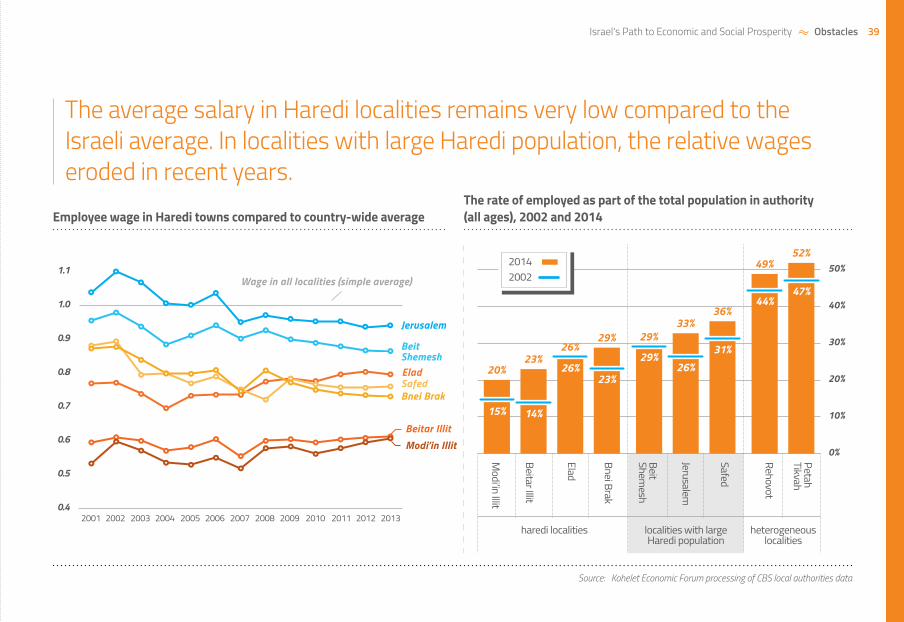
The average salary in Haredi localities remains very low compared to the Israeli average. In localities with large Haredi population, the relative wages eroded in recent years.
Employee wage in Haredi towns compared to country-wide averageThe rate of employed as part of the total population in authority (all ages), 2002 and 2014
Source: Kohelet Economic Forum processing of CBS local authorities data
39Israel's Path to Economic and Social Prosperity Obstacles
* Israel's territory does not include the Judea and Samaria and the Gaza Strip but has the Golan Heights and East Jerusalem; The popula-tion includes residents of Israel living in Judea and Samaria.
Source: population – OECD data; territory – CIA Factbook data
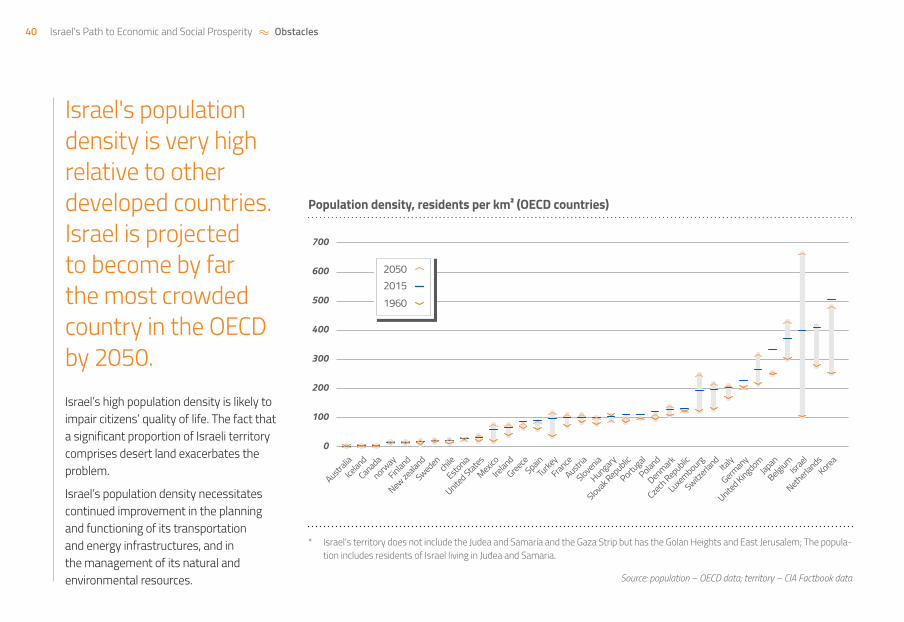
Israel's population density is very high relative to other developed countries. Israel is projected to become by far the most crowded country in the OECD by 2050.Israel’s high population density is likely to impair citizens’ quality of life. The fact that a significant proportion of Israeli territory comprises desert land exacerbates the problem.
Israel’s population density necessitates continued improvement in the planning and functioning of its transportation and energy infrastructures, and in the management of its natural and environmental resources.
Population density, residents per km² (OECD countries)
0
100
200
300
400
500
600
700
Australia
Iceland
Canada
norway
Finland
New zealand
Swedenchile
Estonia
United States
MexicoIre
landGreece
SpainTurke
y
FranceAustr
ia
Slovenia
Hungary
Slovak Republic
Portugal
Poland
Denmark
Czech Republic
Luxembourg
Switzerla
ndIta
ly
Germany
United Kingdom
Japan
BelgiumIsr
ael
Netherlands
Korea
205020151960
40 Israel's Path to Economic and Social Prosperity Obstacles
Israel's population density is relatively very high
41Israel's Path to Economic and Social Prosperity Obstacles

The Kohelet Economic ForumThe Kohelet Economic Forum promotes policy to support growth, competition and freedom, through economic and social policy research and the publication of policy proposals. The forum was founded in Jerusalem in September 2014 with the support of the Kohelet Policy Forum and the Tikvah Fund.
The Kohelet Policy ForumThe Kohelet Policy Forum is a non-partisan think tank that strives to secure the future of Israel as the nation-state of the Jewish people, to strengthen Israeli democracy, expand individual liberty and deepen free market principles in Israel.
The Tikvah FundThe Tikvah Fund is a philanthropic foundation and ideas institution committed to supporting the intellectual, religious, and political leaders of the Jewish people and the Jewish State. Tikvah runs and invests in a wide range of initiatives in Israel, the United States, and around the world, including educational programs, publications, and fellowships.

Kohelet Economic ForumThe Kohelet Economic Forum promotes policy to support growth, competition and freedom, through economic and social policy research and the publication of policy proposals. The forum was founded in Jerusalem in September 2014 with the
support of the Kohelet Policy Forum and the Tikvah Fund.
Kohelet Policy Forum (RA)Am V'Olamo 8, Jerusalem 9546306
Phone: 972-2-6312720 | Fax: 972-2-6312724
[email protected] | www.kohelet.org.il