1.2 resetting the australian table session 1. heather grieve
TRANSCRIPT

The double burden of malnutrition: a rising tide in the region
Source: Heather Grieve and Asian Development Bank, 2007
Heather Grieve
Senior Nutrition Specialist Australian Embassy Timor-Leste and the Office of his Excellency the President
of the Republic of Timor-Leste

• The situation where undernutrition (stunting, wasting, underweight and micro nutrient deficiencies) co-exists with overweight and obesity within the same country, population, household, or individual
• Many low middle income countries (LMIC) are experiencing early signs of the DBM and others are more advanced
The double burden of malnutrition (DBM)
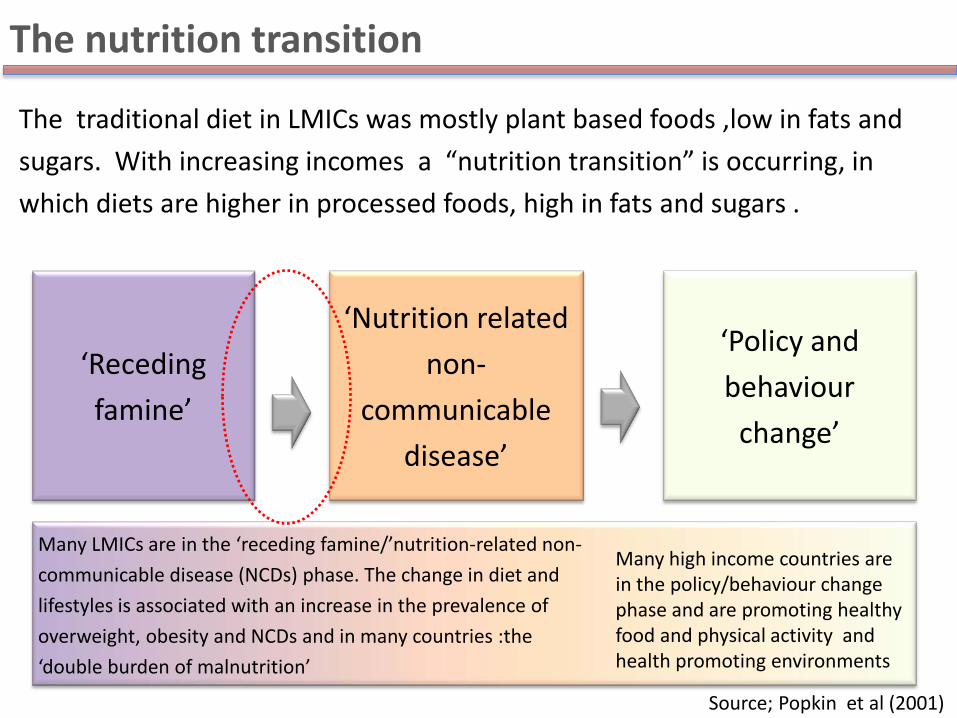
The traditional diet in LMICs was mostly plant based foods ,low in fats and sugars. With increasing incomes a “nutrition transition” is occurring, in which diets are higher in processed foods, high in fats and sugars .
The nutrition transition
‘Receding famine’
‘Nutrition related non-
communicable disease’
‘Policy and behaviour
change’
Many LMICs are in the ‘receding famine/’nutrition-related non-communicable disease (NCDs) phase. The change in diet and lifestyles is associated with an increase in the prevalence of overweight, obesity and NCDs and in many countries :the ‘double burden of malnutrition’
Many high income countries are in the policy/behaviour change phase and are promoting healthy food and physical activity and health promoting environments
Source; Popkin et al (2001)
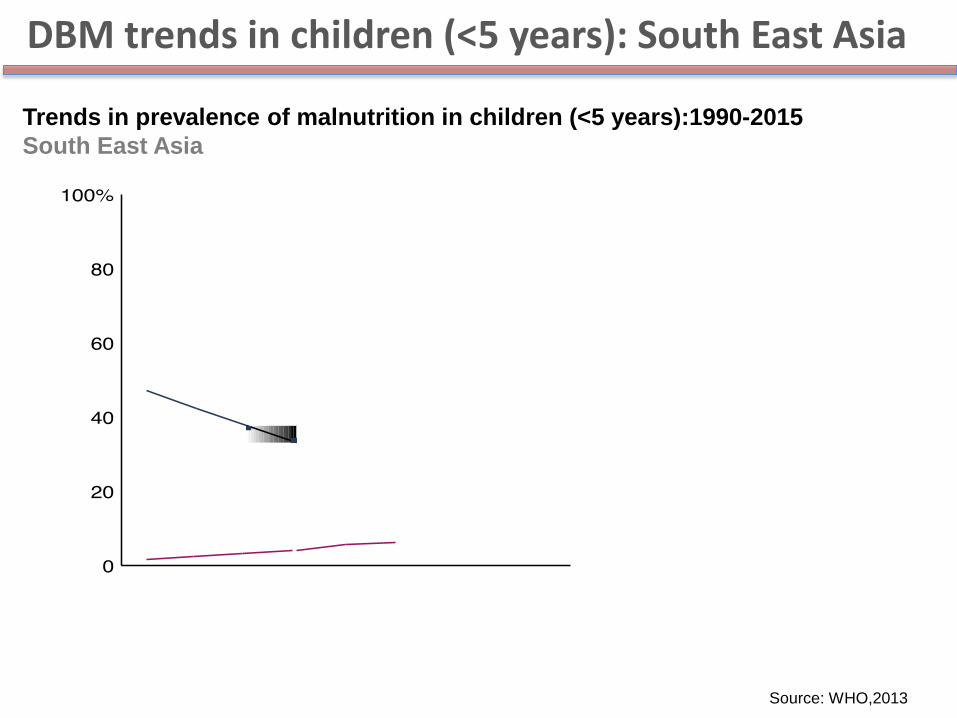
Trends in prevalence of malnutrition in children (<5 years):1990-2015 South East Asia
Source: WHO,2013
DBM trends in children (<5 years): South East Asia

Trends in prevalence of malnutrition in women of reproductive age (aged 20 -49 years) 1990-2008 : Asia
DBM trends in women of reproductive age: South East Asia
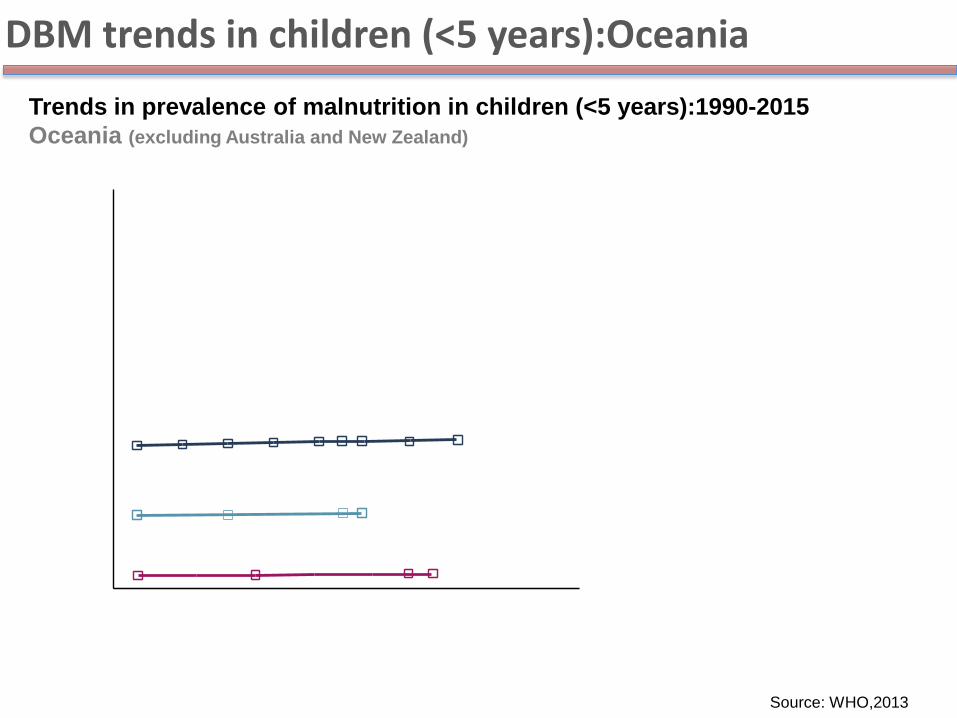
Trends in prevalence of malnutrition in children (<5 years):1990-2015 Oceania (excluding Australia and New Zealand)
Source: WHO,2013
DBM trends in children (<5 years):Oceania

Trends in prevalence of malnutrition in women of reproductive age ( aged 20-49 years):1990-2008 Oceania (excluding Australia and New Zealand)
DBM trends in women of reproductive age: Oceania
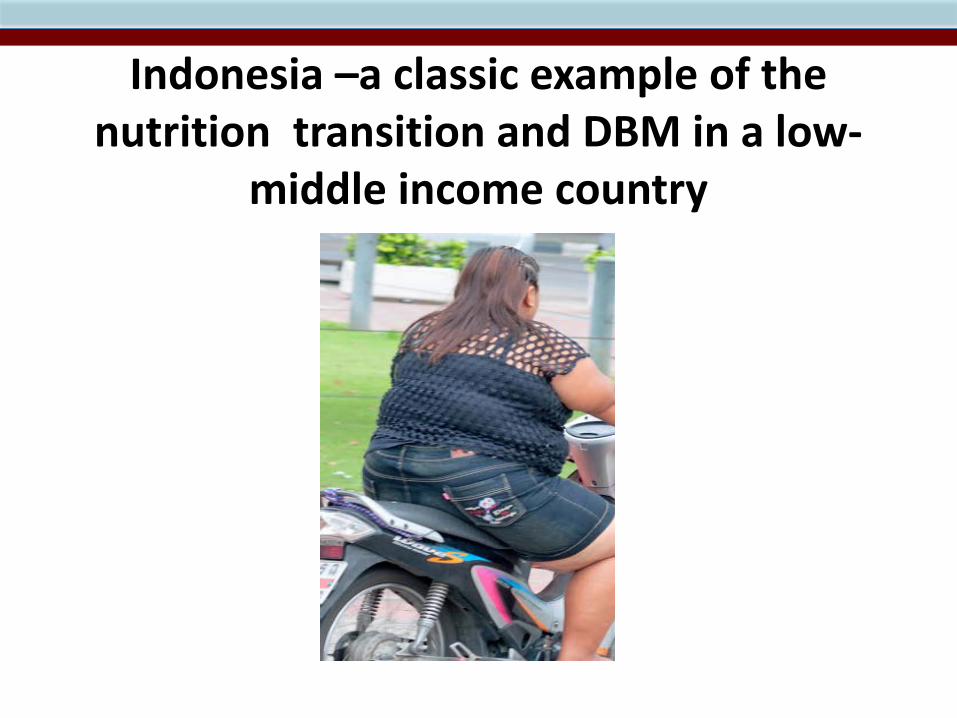
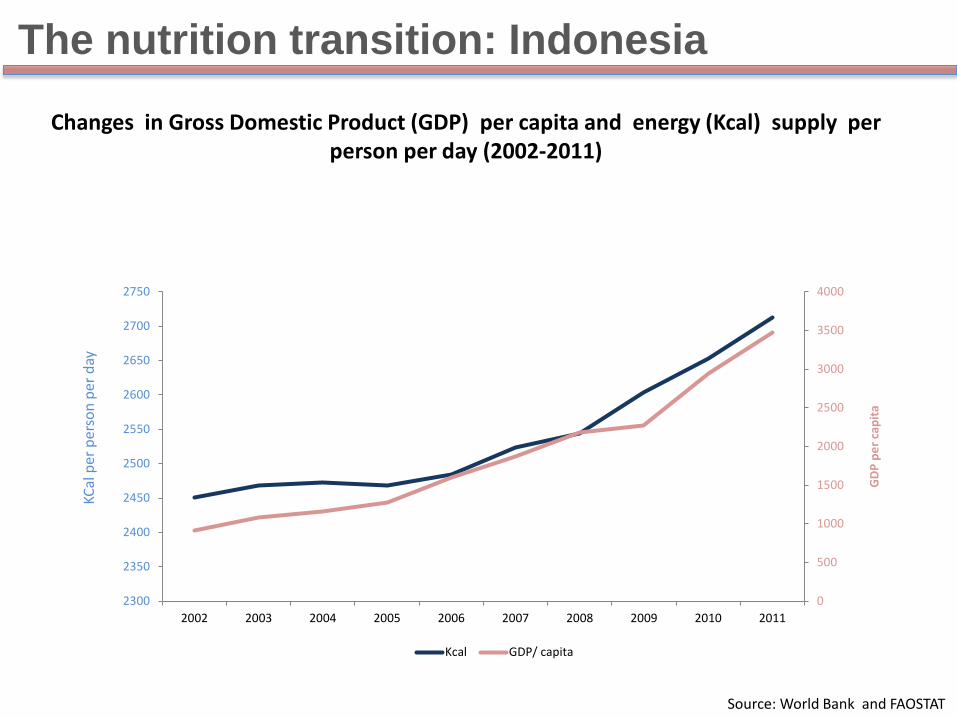
Indonesia –a classic example of the nutrition transition and DBM in a low-
middle income country
0
500
1000
1500
2000
2500
3000
3500
4000
2300
2350
2400
2450
2500
2550
2600
2650
2700
2750
2002 2003 2004 2005 2006 2007 2008 2009 2010 2011
GDP
per
cap
ita
KCal
per
per
son
per d
ay
Kcal GDP/ capita
Changes in Gross Domestic Product (GDP) per capita and energy (Kcal) supply per person per day (2002-2011)
Source: World Bank and FAOSTAT
The nutrition transition: Indonesia
0
500
1000
1500
2000
2500
3000
1991 2001 2011
Kcal
per
day
per
per
son
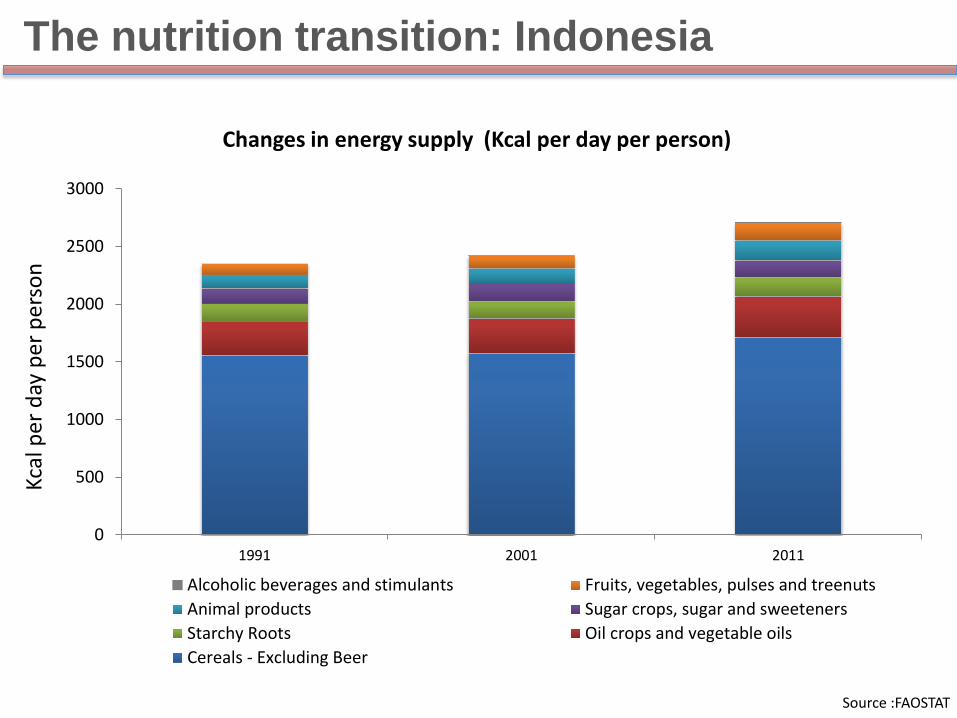
Alcoholic beverages and stimulants Fruits, vegetables, pulses and treenutsAnimal products Sugar crops, sugar and sweetenersStarchy Roots Oil crops and vegetable oilsCereals - Excluding Beer
Changes in energy supply (Kcal per day per person)
Source :FAOSTAT
The nutrition transition: Indonesia
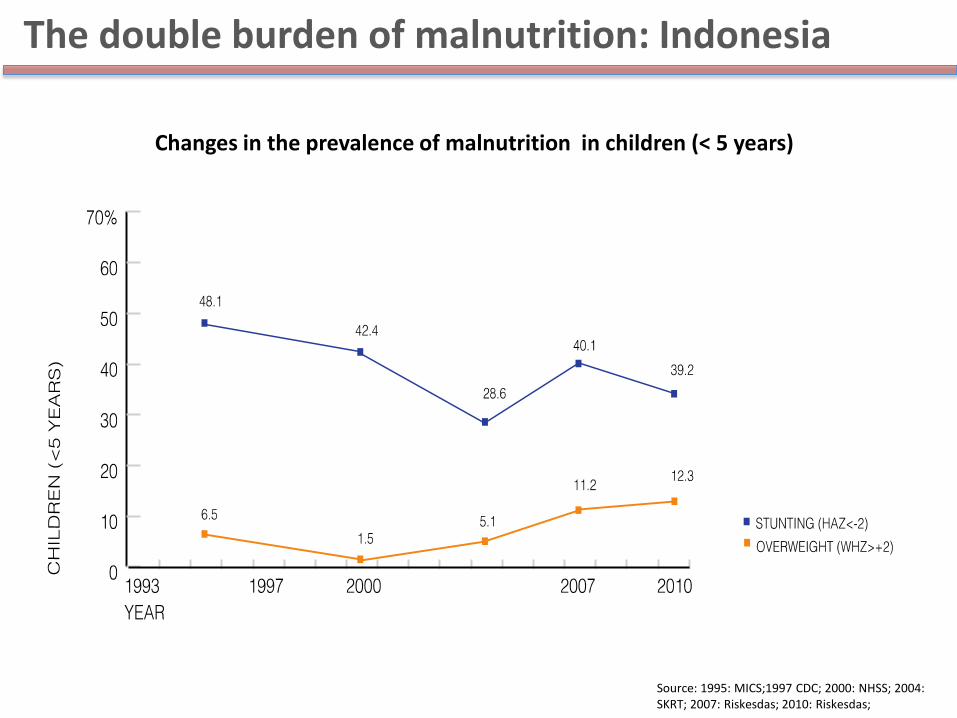
Source: 1995: MICS;1997 CDC; 2000: NHSS; 2004: SKRT; 2007: Riskesdas; 2010: Riskesdas;
Changes in the prevalence of malnutrition in children (< 5 years)
The double burden of malnutrition: Indonesia

Source: 1995: MICS;1997 CDC; 2000: NHSS; 2004: SKRT; 2007: Riskesdas; 2010: Riskesdas;
Changes in the prevalence of malnutrition in women of reproductive age (aged 15-49 years)
The double burden of malnutrition: Indonesia
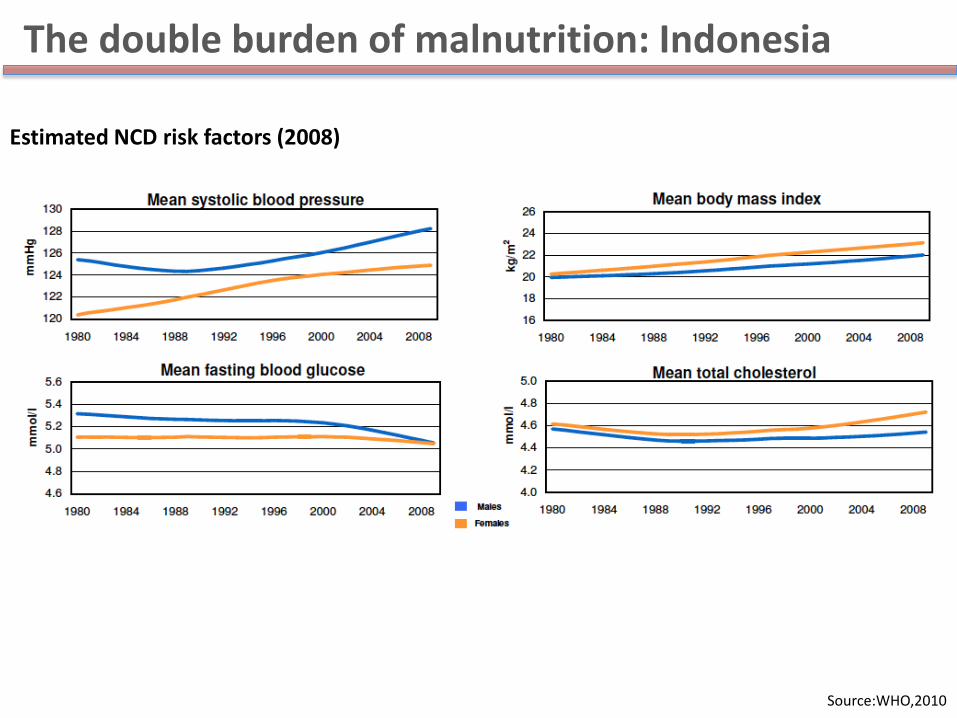
Source:WHO,2010
Estimated NCD risk factors (2008)
The double burden of malnutrition: Indonesia

050
100150200250300350400450
Men WomenCardiovascular diseases and diabetes CancersChronic respiratory disease Other
Source: WHO, 2011
Estimated age standardised NCD deaths per 100,000 people, Indonesia (2008)
In 2008 an estimated 582,000 men and 481,700 women died from NCD related deaths
The double burden of malnutrition: Indonesia

Thank you !