2015 sme-survey-results
Upload: united-nations-university-world-institute-for-development-economics-research
Post on 14-Apr-2017
258 views
TRANSCRIPT
2015 SME Survey Results Kasper Brandt, John Rand, Smriti Sharma, Finn Tarp, and Neda Trifkovic Hanoi, 5 May, 2016

Chapter 2 Sampling and data

Sampling • SME survey 2005, 2007, 2009, 2011, 2013 and now 2015
• Ten provinces
• Approximately 2,500 non-‐state manufacturing enterprises each year.
• Four quesIonnaires:
• Main (firm level), Employee (sub-‐sample), Economic accounts and Exit
• The report provides descripIve staIsIcs and analysis of key trends in the 2015 data.
• Joint effort of UNU-‐WIDER, CIEM, DoE (University of Copenhagen) and ILSSA.

Data (1) Interviewed in 2015 Interviewed in 2013
Ha Noi 296 285
Phu Tho 254 259
Ha Tay 371 347
Hai Phong 219 190
Nghe An 340 347
Quang Nam 171 167
Khanh Hoa 99 90
Lam Dong 92 88
HCMC 653 622
Long An 133 136
Total 2,628 2,531
Note: The balanced panel includes 2,097 firm observaLons each year.

Data (2) • 72 percent are micro firms (1-‐9 full Ime employees)
• …. and some of these are informal.
Micro Small Medium Total Percent Ha Noi 166 111 19 296 (11.3)
(56.1) (37.5) (6.4) (100.0) Phu Tho 239 10 5 254 (9.7)
(94.1) (3.9) (2.0) (100.0) Ha Tay 274 80 17 371 (14.1)
(73.9) (21.6) (4.6) (100.0) Hai Phong 151 48 20 219 (8.3)
(68.9) (21.9) (9.1) (100.0) Nghe An 288 39 13 340 (12.9)
(84.7) (11.5) (3.8) (100.0) Quang Nam 146 20 5 171 (6.5)
(85.4) (11.7) (2.9) (100.0) Khanh Hoa 72 19 8 99 (3.8)
(72.7) (19.2) (8.1) (100.0) Lam Dong 69 20 3 92 (3.5)
(75.0) (21.7) (3.3) (100.0) HCMC 377 207 69 653 (24.8)
(57.7) (31.7) (10.6) (100.0) Long An 106 22 5 133 (5.1) (79.7) (16.5) (3.8) (100.0) Total 1,888 576 164 2,628 (100.0) Percent (71.9) (21.9) (6.2) (100.0) Note: Figures in number of firms and for each locaLon the share of firms in each size category (group percentages in parenthesis). Micro: 1-‐9 employees; Small: 10-‐49 employees; Medium: 50-‐299 employees (World Bank definiLon).

Chapter 3 SME growth and dynamics
The link to formality

Perceived Constraints
0
5
10
15
20
25
Shortage of capital/credit
Current products have limited demand
Too much compeIIon
Inadequate premises/land
No constraints
• The Usual Suspects: (i) Credit, (ii) Limited Demand and (iii) CompeIIon • But improvements • Credit: 45% in 2011, 30% in 2013 and 24% in 2015
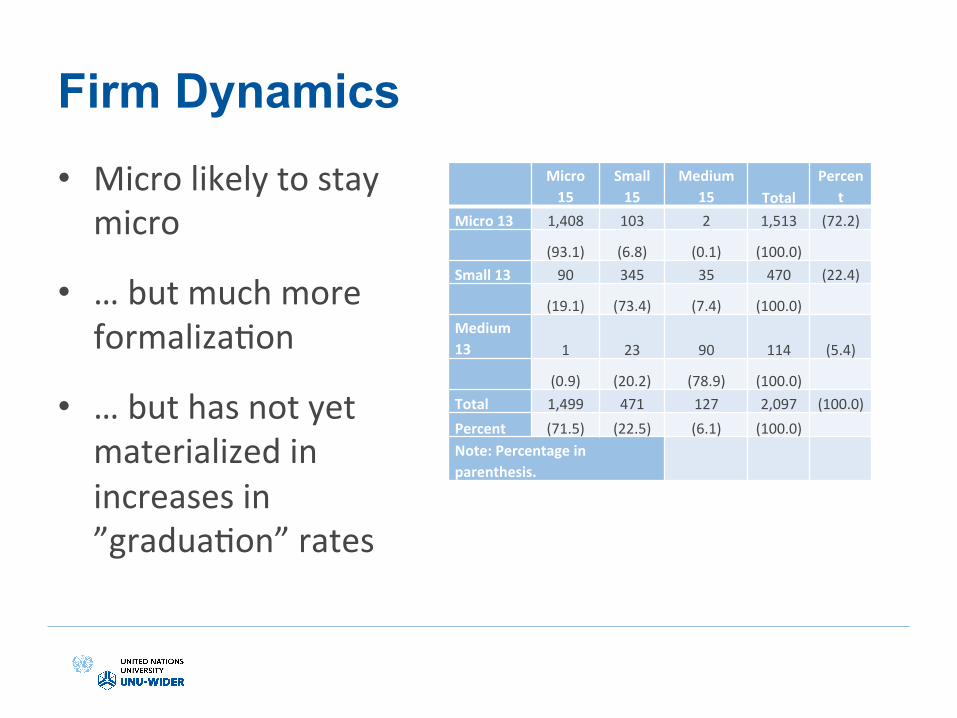
Firm Dynamics • Micro likely to stay micro
• … but much more formalizaIon
• … but has not yet materialized in increases in ”graduaIon” rates
Micro 15
Small 15
Medium 15 Total
Percent
Micro 13 1,408 103 2 1,513 (72.2)
(93.1) (6.8) (0.1) (100.0) Small 13 90 345 35 470 (22.4)
(19.1) (73.4) (7.4) (100.0) Medium 13 1 23 90 114 (5.4)
(0.9) (20.2) (78.9) (100.0) Total 1,499 471 127 2,097 (100.0) Percent (71.5) (22.5) (6.1) (100.0) Note: Percentage in parenthesis.

Employment Growth • Increase in total employment of 5.2 per cent over the two-‐year period 2013-‐15.
• But not equally distributed along the firm size dimension
• Non-‐HH versus HH • Formal versus Informal
HH enterprise
Non-‐HH
.75
1
1.25
1.5
Firm
Growth
5 10 30 100Firm size (permanent full-‐time employees)
HH ent/Non-‐HH
Informal
Formal
.75
1
1.25
1.5
Firm
Growth
5 10 30 100Firm size (permanent full-‐time employees)
kernel = epanechnikov, degree = 0, bandwidth = .8, pwidth = .6
Formal/Informal
Job Creation
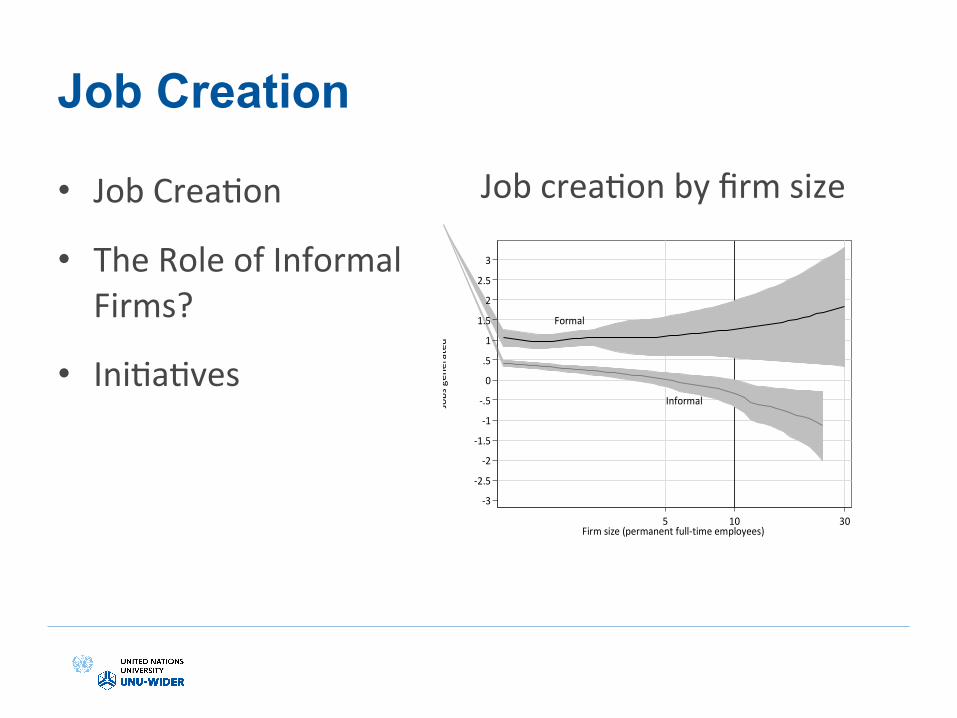
• Job CreaIon
• The Role of Informal Firms?
• IniIaIves
Job creaIon by firm size
Formal
Informal
-‐3
-‐2.5
-‐2
-‐1.5
-‐1
-‐.5
0
.5
1
1.5
2
2.5
3
Jobs gen
erated
5 10 30Firm size (permanent full-‐time employees)

Growth and Job Creation, by Rural/Urban • Job creaIon for mid-‐size firms
especially in rural areas
Urban
Rural
.75
1
1.25
Grow
th
5 10 30 100 300Firm size (permanent full-‐time employees)
Urban
Rural
-‐.5
0
.5
1
1.5
2
2.5
3
3.5
4
4.5
5
Jobs gen
erated
5 10 30 100Firm size (permanent full-‐time employees)

Growth and Job Creation, by Sector • Job creaIon especially within
food processing
• Effects firm size dependent
.75
1
1.25
1.5
1.75
Grow
th
5 10 30 100Firm size (permanent full-‐time employees)
Food Processing
.75
1
1.25
1.5
1.75
Grow
th
5 10 30 100Firm size (permanent full-‐time employees)
Wood Processing
.75
1
1.25
1.5
1.75
Grow
th
5 10 30 100Firm size (permanent full-‐time employees)
Fabricated Metals
.75
1
1.25
1.5
1.75
Grow
th
5 10 30 100Firm size (permanent full-‐time employees)
Furniture
-‐2
-‐1.5
-‐1
-‐.5
0
.5
1
1.5
2
Jobs gen
erated
5 10 30Firm size (permanent full-‐time employees)
Food Processing
-‐2
-‐1.5
-‐1
-‐.5
0
.5
1
1.5
2
Jobs gen
erated
5 10 30Firm size (permanent full-‐time employees)
Fabricated Metals

Exit Probabilities, by Firm Size • Annual exit rate of 8.2 per cent (lower than exit rates observed between 2009 and 2013).
• Non-‐HH vs. HH
• Formal vs. Informal
HH ent
Non-‐HH
0
.05
.1
.15
.2
.25
.3
Exit prob
ability
5 10 30 100Firm size (permanent full-‐time employees)
HH ent/Non-‐HH
Formal
Informal
0
.05
.1
.15
.2
.25
.3
Exit prob
ability
5 10 30Firm size (permanent full-‐time employees)
Formal/Informal

Exit by Location and Sector
Urban
Rural
0
.05
.1
.15
.2
.25
.3
Exit prob
ability
5 10 30 100 300Firm size (permanent full-‐time employees)
0
.05
.1
.15
.2
.25
.3
Exit prob
ability
5 10 30 100Firm size (permanent full-‐time employees)
Food Processing
0
.05
.1
.15
.2
.25
.3
Exit prob
ability
5 10 30 100Firm size (permanent full-‐time employees)
Wood Processing
0
.05
.1
.15
.2
.25
.3
Exit prob
ability
5 10 30 100Firm size (permanent full-‐time employees)
Fabricated Metals
0
.05
.1
.15
.2
.25
.3
Exit prob
ability
5 10 30 100Firm size (permanent full-‐time employees)
Furniture

Chapter 4 Informality and corruption

Reasons for remaining informal • Exclusion view: arduous entry regulaIons prohibit small firms from entering the formal sector.
• Exit view: decision to remain informal is a deliberate one. Firm owners willing to forego legal recogniIon in order to avoid incurring costs and taxes.
• Empirical studies report that transiIoning to formality results in significant and large benefits for firms in terms of profitability, investments, and access to credit (McKenzie and Sakho 2010; Rand and Torm 2012; Sharma 2014).
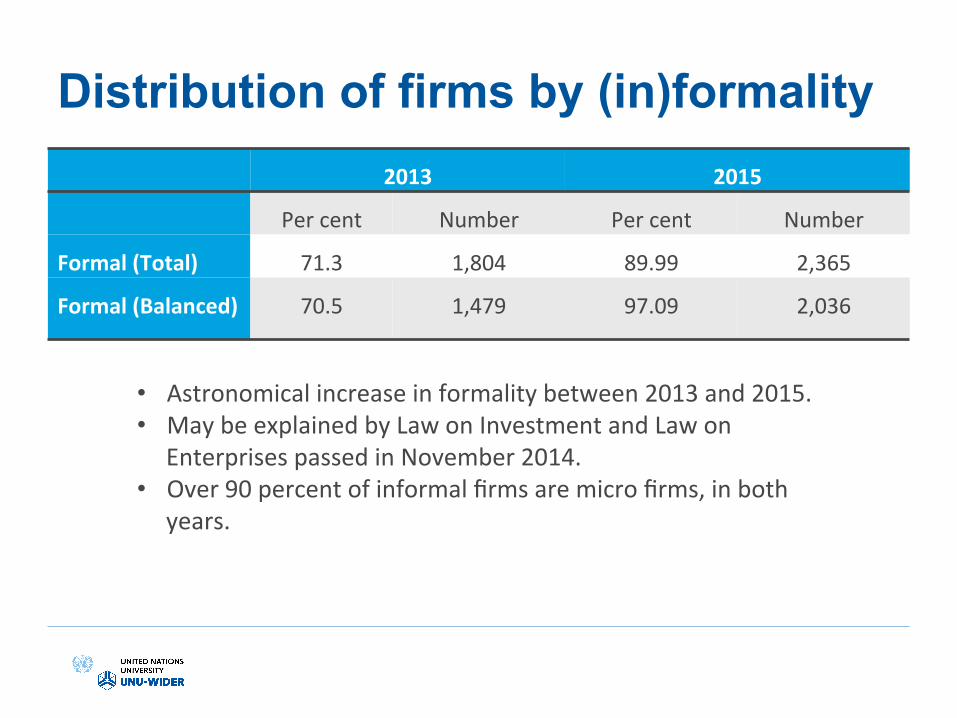
Distribution of firms by (in)formality 2013 2015
Per cent Number Per cent Number
Formal (Total) 71.3 1,804 89.99 2,365
Formal (Balanced) 70.5 1,479 97.09 2,036
• Astronomical increase in formality between 2013 and 2015. • May be explained by Law on Investment and Law on
Enterprises passed in November 2014. • Over 90 percent of informal firms are micro firms, in both
years.

Firm dynamics and formality Firm growth Firm exit Col. 1 Col. 2 Col. 3 Col. 4 Firm size -‐0.090*** -‐0.098*** -‐0.010 -‐0.020** (0.008) (0.008) (0.007) (0.008) Formal 0.093*** 0.096*** 0.040** 0.032 (0.017) (0.018) (0.018) (0.020) LocaIon dummies No Yes No Yes Sector dummies No Yes No Yes ObservaIons 2,088 2,087 2,516 2,466 Pseudo R-‐squared 0.077 0.094 0.00 0.03
• Firm growth is posiIvely associated with formal status.
• These results are robust to the inclusion of province and sector controls.
• Being formal also leads to greater probability of firm exit, but this result is not as robust.

How many enterprises pay bribes? All Balanced 2013 2015 2013 2015
All firms 1,135 (44.8)
1,126 (42.9)
936 (44.6)
896 (42.7)
Formal firms 971 (85.6)
1,079 (95.8)
792 (84.6)
877 (97.9)
Informal firms
164 (14.4)
47 (4.2)
144 (15.4)
19 (2.1)
• Marginal decline in fracIon of bribe-‐paying firms between 2013 and 2015.
• Overwhelming share of bribe-‐payers are formal firms: in accordance with Rand and Tarp (2012) who find that the “bribes to hide” hypothesis is not confirmed in Vietnamese context.
• Approx. 70 percent of firms paid bribes 2-‐5 Imes in the past year.

Reasons for paying bribes
0
5
10
15
20
25
30
35
40
45
To get connected to public services
To get licenses and permits
To deal with tax and tax collectors
To gain government contracts
To deal with customs Other reasons
2013 2015
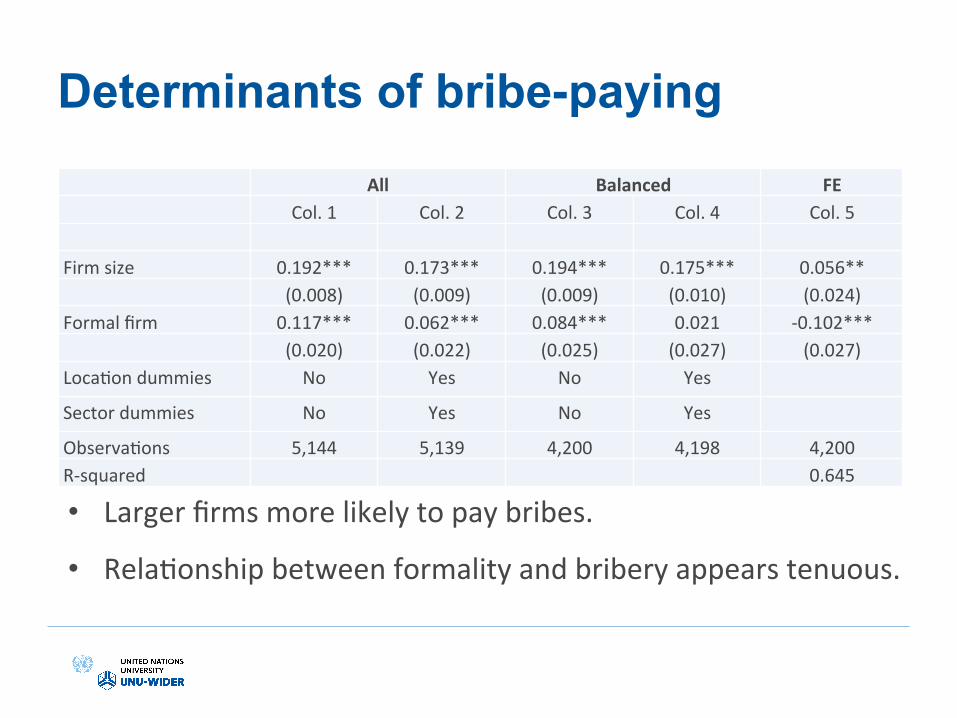
Determinants of bribe-paying
• Larger firms more likely to pay bribes.
• RelaIonship between formality and bribery appears tenuous.
All Balanced FE Col. 1 Col. 2 Col. 3 Col. 4 Col. 5 Firm size 0.192*** 0.173*** 0.194*** 0.175*** 0.056** (0.008) (0.009) (0.009) (0.010) (0.024) Formal firm 0.117*** 0.062*** 0.084*** 0.021 -‐0.102*** (0.020) (0.022) (0.025) (0.027) (0.027) LocaIon dummies No Yes No Yes
Sector dummies No Yes No Yes
ObservaIons 5,144 5,139 4,200 4,198 4,200 R-‐squared 0.645

Bribes, firm growth and firm exit
• No evidence that firm growth is correlated with bribery (as in the 2013 report).
• Bribe-‐paying is not associated with exit (in contrast to 2013 survey).
Firm growth Firm exit Col. 1 Col. 2 Col. 3 Col. 4 Firm size -‐0.093*** -‐0.102*** -‐0.011 -‐0.020** (0.008) (0.009) (0.008) (0.008) Formal firm 0.091*** 0.090*** 0.039** 0.028 (0.016) (0.018) (0.018) (0.020) Bribe 0.020 0.022 0.004 -‐0.011 (0.015) (0.016) (0.016) (0.016) LocaIon dummies No Yes No Yes Sector dummies No Yes No Yes ObservaIons 2,088 2,087 2,516 2,466 R-‐squared 0.078 0.092

Chapter 5 Investments and credit

Investments
• Higher share of investments compared to 2013 • 34% new and 64% repeated investments compared to 2013
• 725 firms (around 35% of the sample) did not make any investment in the past four years
• Increasing in enterprise size and locaIon in rural and northern provinces
47
49
0 10 20 30 40 50 60 70 80 90
Micro Small Medium HH Non-‐HH Urban Rural South North All
2013 2015
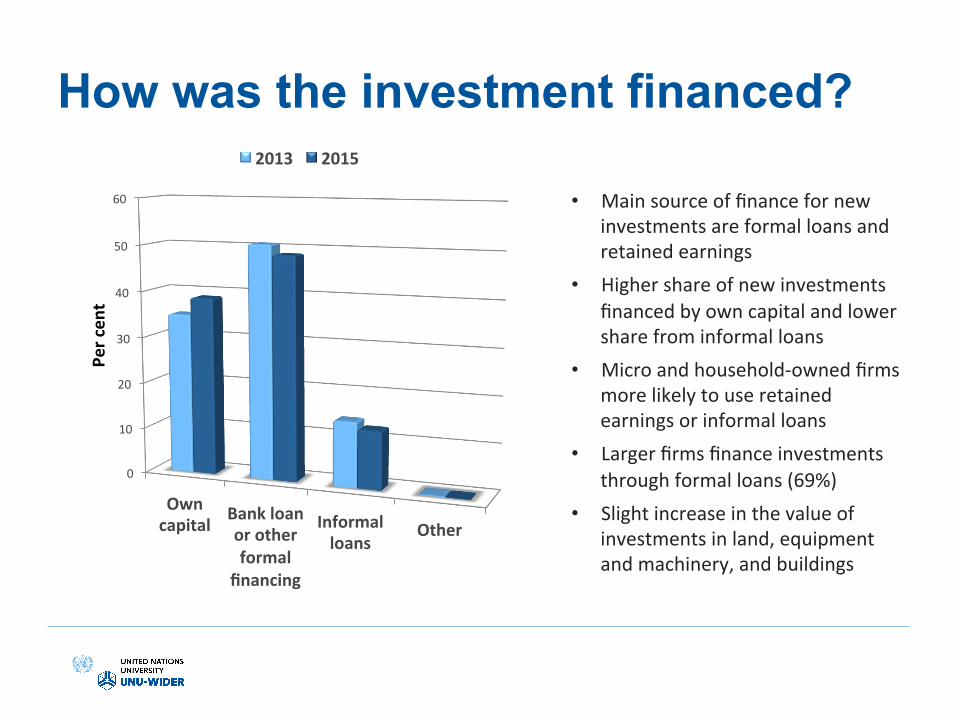
How was the investment financed?
• Main source of finance for new investments are formal loans and retained earnings
• Higher share of new investments financed by own capital and lower share from informal loans
• Micro and household-‐owned firms more likely to use retained earnings or informal loans
• Larger firms finance investments through formal loans (69%)
• Slight increase in the value of investments in land, equipment and machinery, and buildings
0
10
20
30
40
50
60
Own capital Bank loan
or other formal
financing
Informal loans
Other
Per cen
t
2013 2015

Credit
2013 (Full sample)
2013 (Balanced sample)
2015 (Full sample)
2015 (Balanced sample)
Yes No Yes No Yes No Yes No Enterprise applied for formal loan
% 25.8 74.2 25.3 74.7 24.6 75.4 25.1 74.9
Obs. 652 1,878 74.7 1,567 646 1,982 527 1,570
Problems ge_ng loan
% 23.9 76.1 23.5 76.5 15.0 85.0 14.6 85.4
Obs. 155 495 124 404 97 549 77 450
Source: Authors’ calculaIons based on SME data.
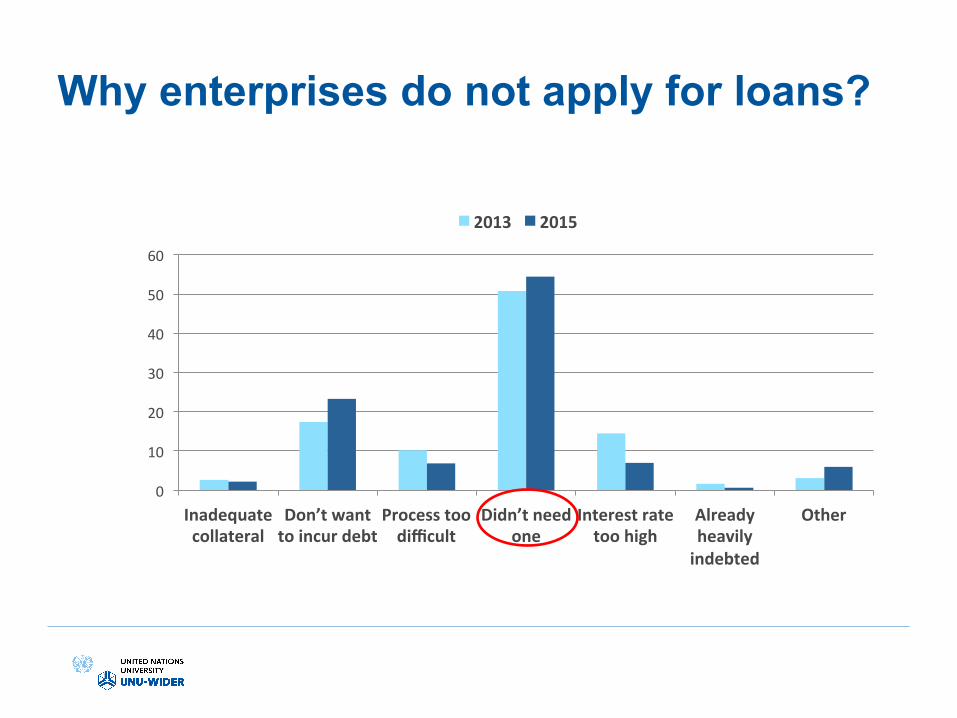
Why enterprises do not apply for loans?
0
10
20
30
40
50
60
Inadequate collateral
Don’t want to incur debt
Process too difficult
Didn’t need one
Interest rate too high
Already heavily indebted
Other
2013 2015
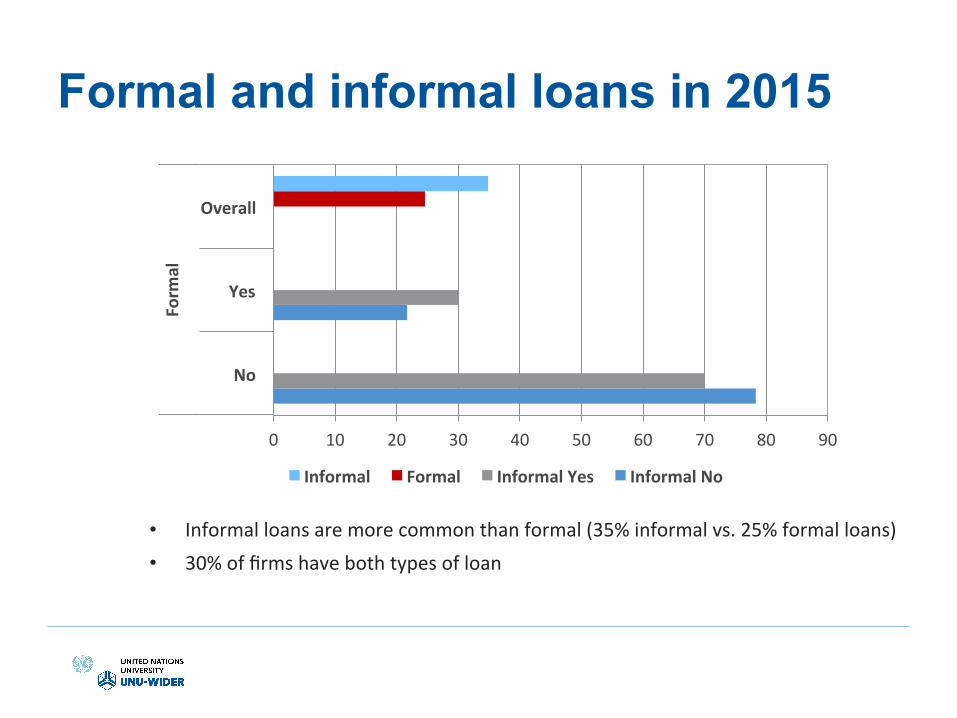
Formal and informal loans in 2015
• Informal loans are more common than formal (35% informal vs. 25% formal loans) • 30% of firms have both types of loan
0 10 20 30 40 50 60 70 80 90
No
Yes
Overall
Form
al
Informal Formal Informal Yes Informal No

Chapter 6 Production, technology, and labour productivity

Diversification and innovation
• An average Vietnamese SME is specialised (only 11.6% of firms produced more than one product) • New product development (InnovaIon 1) has largely increased but improvements of exisIng products
(InnovaIon 2) have declined
• Firms from the food and fabricated metal sectors tend to diversify and innovate more than other sectors
DiversificaLon (More than one 4-‐digit
ISIC)
InnovaLon 1 (New product development)
InnovaLon 2 (Improvement of exisLng
product) 2013 2015 2013 2015 2013 2015
All 11.1 11.6 0.7 23.8 16.4 13.2 Micro 9.1 10.1 0.4 23.9 12.9 10.0 Small 16.4 14.6 1.6 22.0 24.0 19.4
Medium 15.8 18.3 0.7 28.0 30.2 28.7 Urban 9.9 8.3 0.6 18.8 19.0 15.1 Rural 12.1 14.2 0.7 27.7 14.4 11.8
Industrial zone 18.2 15.1 1.5 24.5 30.3 24.5 Not in the industrial zone
10.8 11.5 0.6 23.8 15.6 12.8

Firm revenue and profits by diversification and innovation status
05
1015
Rev
enue
(ln)
0 100 200 300Firm size
Diversification
05
1015
0 100 200 300Firm size
Innovation 1
05
1015
0 100 200 300Firm size
Innovation 2-5
05
1015
Prof
it (ln
)
0 100 200 300Firm size
Yes No
Yes No
-50
510
15
0 100 200 300Firm size
Yes No
Yes No
-50
510
15
0 100 200 300Firm size
Yes No
Yes No

Labour productivity growth
0
5
10
15
20
25
All Micro Small Medium Urban Rural South North
Labour ProducLvity 1 Labour ProducLvity 2
• LP1 is real revenue per full-‐Ime employee and LP2 is real value added per full-‐Ime employee • Larger urban enterprises show advantages over smaller ones, with higher values of both real revenue
and value added per employee
• LP1 has higher growth than LP2

New technology adoption
0
2
4
6
8
10
12
14
16
18
All Urban Rural Micro Small Medium
Per cen
t 2013 2015

Chapter 7 Employment

Chapter 7 - Employment
• CharacterisIcs of enterprise respondents
• Workforce and hiring panerns disaggregated by size
• Wages from an employee survey
Age and gender of respondent • Owner or manager as respondents
• For all size categories, owners are older than managers
• Slightly older owners in medium-‐sized enterprises
• Slightly younger managers in small and medium-‐sized enterprises
• Owners tend to be male (71%), whereas managers tend to be female (68%)
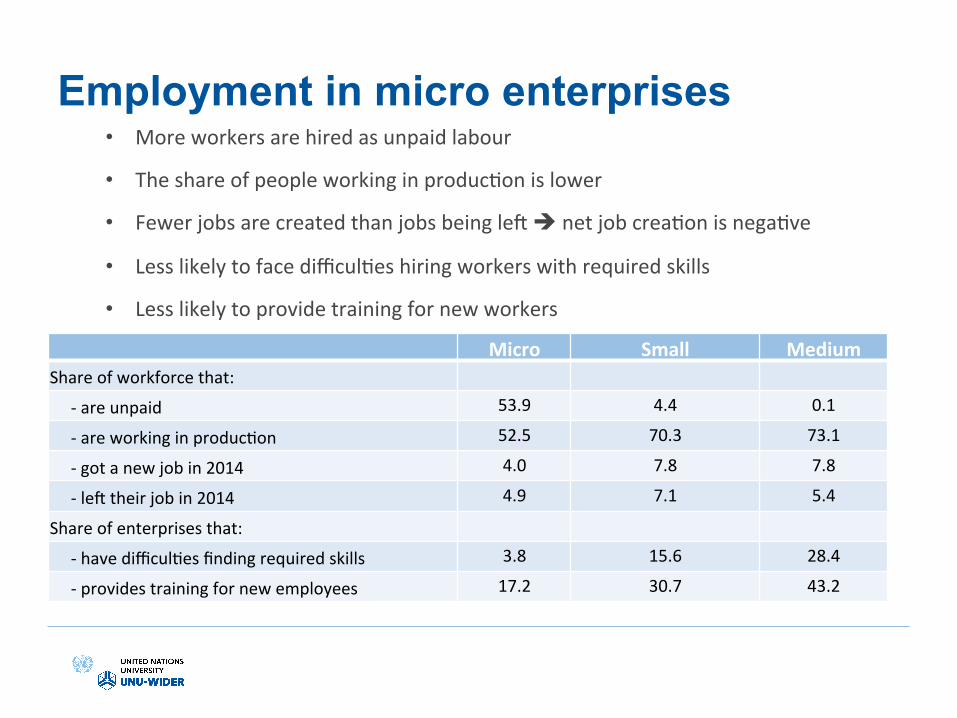
Employment in micro enterprises • More workers are hired as unpaid labour
• The share of people working in producIon is lower
• Fewer jobs are created than jobs being lep è net job creaIon is negaIve
• Less likely to face difficulIes hiring workers with required skills
• Less likely to provide training for new workers
Micro Small Medium Share of workforce that:
-‐ are unpaid 53.9 4.4 0.1
-‐ are working in producIon 52.5 70.3 73.1
-‐ got a new job in 2014 4.0 7.8 7.8
-‐ lep their job in 2014 4.9 7.1 5.4
Share of enterprises that:
-‐ have difficulIes finding required skills 3.8 15.6 28.4
-‐ provides training for new employees 17.2 30.7 43.2

Wage development from 2013 to 2015 • Overall increase in real wages by 15% from 2013 to 2015
• Increases in wages of 13 -‐ 31 percent depending on occupaIon category
(20.1%)
(13.0%) (15.9%) (31.3%)
(21.0%) (14.1%)
(14.8%)
0
500
1,000
1,500
2,000
2,500
3,000
3,500
4,000
4,500
5,000
Manager Professional Office Sales Service ProducIon All
2013 2015
Note: Monthly wages has been normalised using 2010 VND as base. Figures in parenthesis correspond to wage increase between 2013 and 2015.
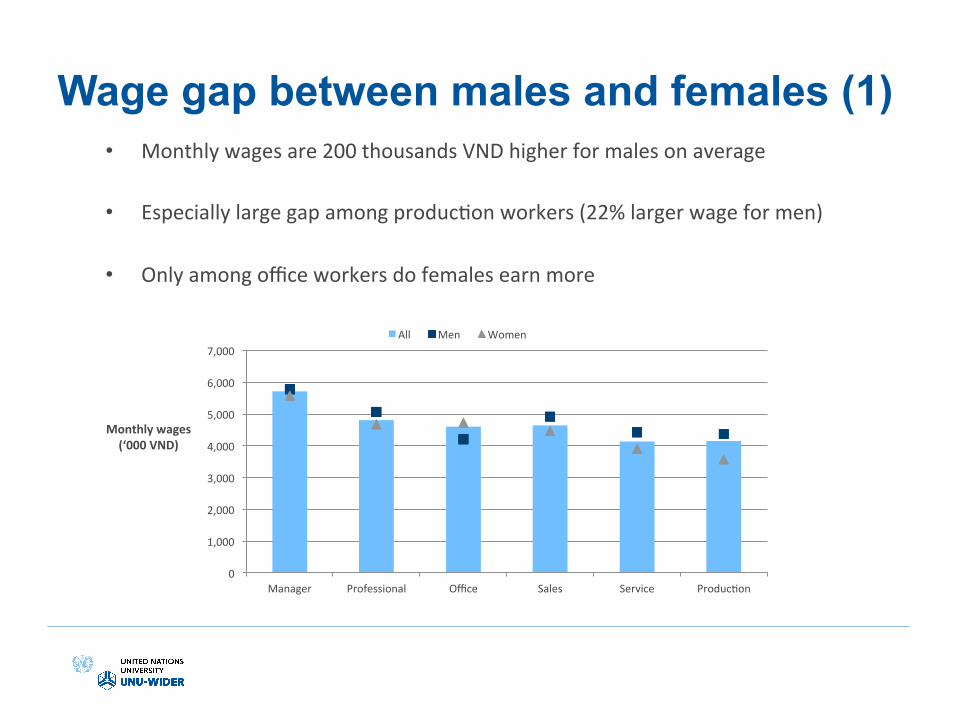
Wage gap between males and females (1) • Monthly wages are 200 thousands VND higher for males on average
• Especially large gap among producIon workers (22% larger wage for men)
• Only among office workers do females earn more
0
1,000
2,000
3,000
4,000
5,000
6,000
7,000
Manager Professional Office Sales Service ProducIon
Monthly wages (‘000 VND)
All Men Women

Wage gap between males and females (2) • Method: simple OLS regression framework
• Controls for various individual characterisIcs. In addiIon, (2) controls for
enterprise characterisIcs
• Result: No significant result on gender discriminaIon
More research is required to make robust conclusions

Chapter 8 Personality and behaviour
Motivation • Risk artudes and preferences maner for entry into
entrepreneurship, business performance, and also business survival.
• In a meta-‐analyIc study, Zhao and Seibert (2006) find entrepreneurial entry to be posiIvely correlated with the Big Five traits of conscienIousness, extraversion, and openness to experience, and negaIvely correlated with neuroIcism and agreeableness.
• New module added to the 2015 survey to measure these preferences and traits among firm owners/managers in Viet Nam.

Measurement • Risk artudes were elicited on an 11-‐point scale using ‘willingness-‐to-‐take-‐risk’ quesIons: general and context-‐specific.
• Big Five (Openness to experience, ConscienIousness, Extraversion, Agreeableness, NeuroIcism): 15 quesIons on a 1-‐7 scale
• Locus of control: 10 quesIons on a 1-‐7 scale
• InnovaIon index: 3 quesIons on a 1-‐5 scale
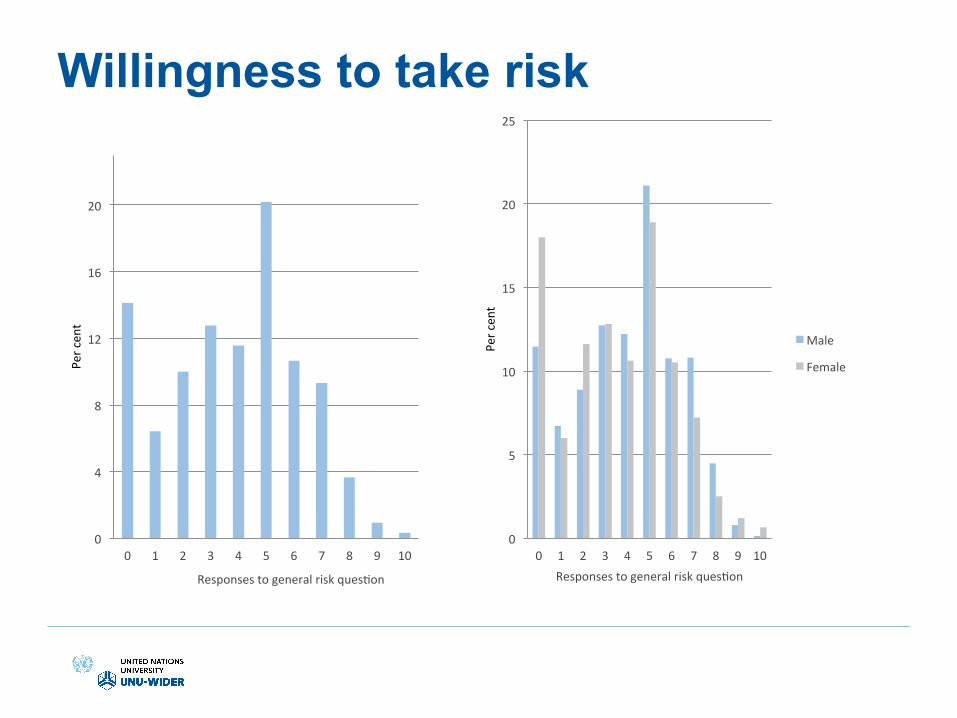
Willingness to take risk
0
4
8
12
16
20
0 1 2 3 4 5 6 7 8 9 10
Per cen
t
Responses to general risk quesIon
0
5
10
15
20
25
0 1 2 3 4 5 6 7 8 9 10
Per cen
t
Responses to general risk quesIon
Male
Female

Context-specific willingness to take risks
2.604
3.215
3.955
3.481
2.533
3.884
2.119
2.889
3.45
3.223
2.224
3.692
0
0.5
1
1.5
2
2.5
3
3.5
4
4.5
Driving Financial maners Hobbies OccupaIon Health Faith in others
Male Female

Personality traits Col. 1 Col.2 Col. 3 Col. 4
Overall Males Females p-‐value Big Five: Openness to experience
3.882 (1.44)
3.92 (1.43)
3.827 (1.47)
0.10
Big Five: ConscienLousness 5.535 (1.04)
5.479 (1.03)
5.616 (1.04)
0.00
Big Five: Extroversion 4.31 (0.99)
4.328 (0.98)
4.284 (0.99)
0.26
Big Five: Agreeableness 4.559 (0.90)
4.456 (0.9)
4.708 (0.88)
0.00
Big Five: NeuroLcism 3.037 (0.99)
2.996 (1.00)
3.095 (0.97)
0.011
Internal locus of control 5.115 (0.85)
5.151 (0.84)
5.063 (0.88)
0.009
External locus of control 3.005 (1.1)
2.981 (1.11)
3.039 (1.10)
0.185
InnovaLveness 3.613 (0.85)
3.6 (0.87)
3.62 (0.83)
0.53
Number of observaLons 2,648 1,564 1,084
Key findings The data indicates trends largely in line with previous literature:
• Females are significantly more risk-‐averse than males, in general and across all six contexts.
• Females report significantly higher scores on conscienIousness, agreeableness, and neuroIcism, and score significantly lower on the internal locus of control.
• Females also score lower on openness to experience and extroversion, and higher on external locus of control and innovaIveness.

Chapter 9 Certification

Quality standards
0
10
20
30
40
50
60
70
80
90
100
All Micro Small Medium ExporLng Not exporLng
InternaLonal cerLficate DomesLc cerLficate

Environmental Standards Certificate (ESC)
0
10
20
30
40
50
60
70
All Micro Small Medium Household Private CooperaLve LLC JSC
2013 2015

Differences between firms by application of international standards
05
1015
Real
reve
nue
(ln)
0 100 200 300Firm size
(a)
-20
24
68
Real
pro
fit p
er e
mpl
oyee
(ln)
0 100 200 300Firm size
(b)0
510
Real
labo
ur c
osts
(ln)
0 100 200 300Firm size
(c)
12
34
56
Labo
ur p
rodu
ctivi
ty (l
n)
0 100 200 300Firm size
(d)
No standards StandardsNo standards Standards
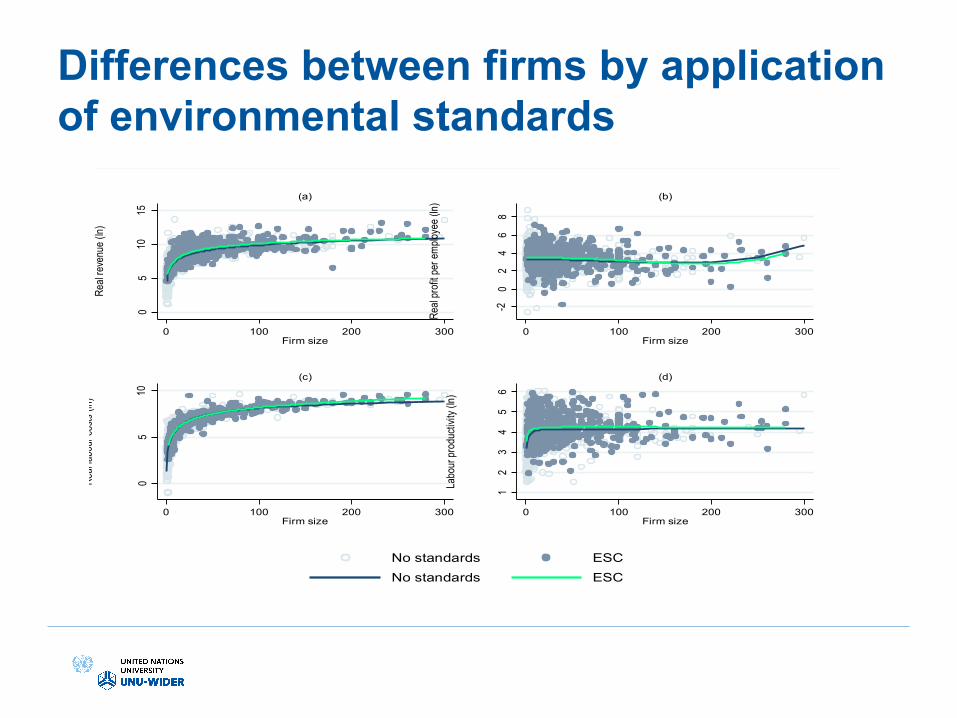
Differences between firms by application of environmental standards
05
1015
Real
reve
nue
(ln)
0 100 200 300Firm size
(a)
-20
24
68
Real
prof
it per
em
ploye
e (ln
)
0 100 200 300Firm size
(b)
05
10
Real
labou
r cos
ts (ln
)
0 100 200 300Firm size
(c)
12
34
56
Labo
ur p
rodu
ctivit
y (ln)
0 100 200 300Firm size
(d)
No standards ESCNo standards ESC

Chapter 10 Trade and sales structures

Chapter 10 – Trade and sales structures
• Export behaviour • CompeIIon
• Sales structures

Exporting vs. non-exporting enterprises • Clear size effect in exporIng behaviour
• Only micro exporters have larger revenues per full-‐Ime employee
• Non-‐exporters earn higher profits per full-‐Ime employee
All Micro Small Medium ExporIng enterprises (%) 6.8 1.0 13.9 42.2
Revenue per full-‐Ime employee (exporters) 355.4 276.0 386.0 344.2
Revenue per full-‐Ime employee (non-‐exporters) 277.9 209.5 496.9 513.1
Profit per full-‐Ime employee (exporters) 30.4 33.1 32.9 27.2
Profit per full-‐Ime employee (non-‐exporters) 36.9 36.3 39.6 32.3
Note: Revenues and profits are in million 2010 VND.
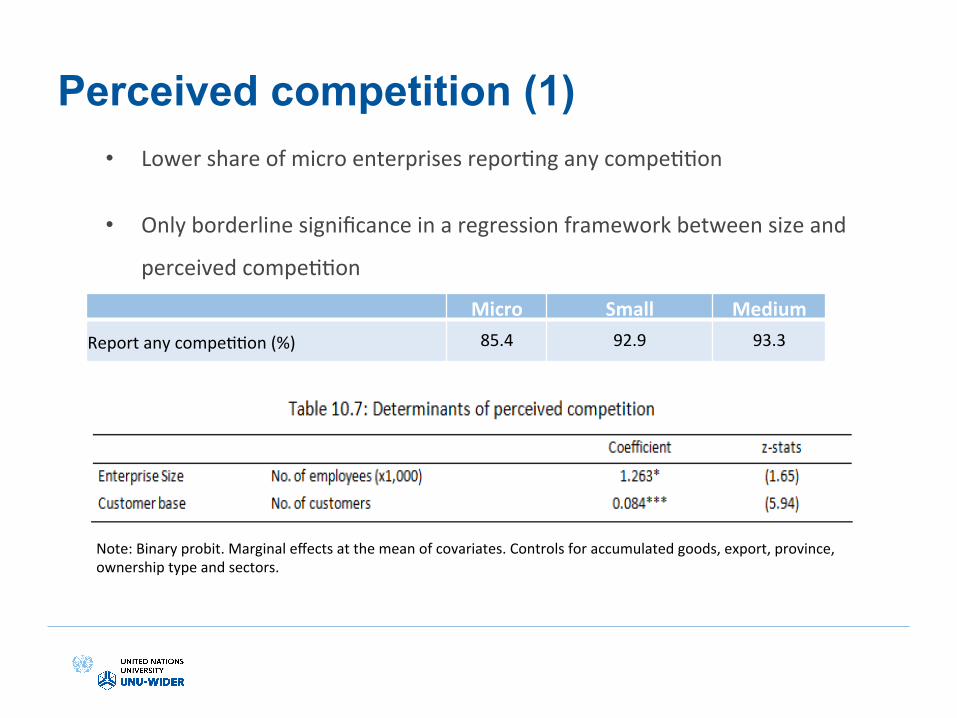
Perceived competition (1) • Lower share of micro enterprises reporIng any compeIIon
• Only borderline significance in a regression framework between size and
perceived compeIIon
Micro Small Medium Report any compeIIon (%) 85.4 92.9 93.3
Note: Binary probit. Marginal effects at the mean of covariates. Controls for accumulated goods, export, province, ownership type and sectors.

Perceived competition (2) • Private informal and formal enterprises consItute the main source of
compeIIon
• Likelihood of introducing new product lines, improving exisIng product lines
or introducing new technology increase with severity of compeIIon
Note: CompeIIon is ranked as follows: 4 = severe, 3 = moderate, 2 = insignificant, 1 = No compeIIon
Severity of compeLLon Source of compeIIon
-‐ State enterprises 2.0
-‐ Private formal enterprises 2.7
-‐ Private informal enterprises 2.9
-‐ Legal imports 1.7
-‐ Smuggling 1.6
-‐ Other sources 1.6
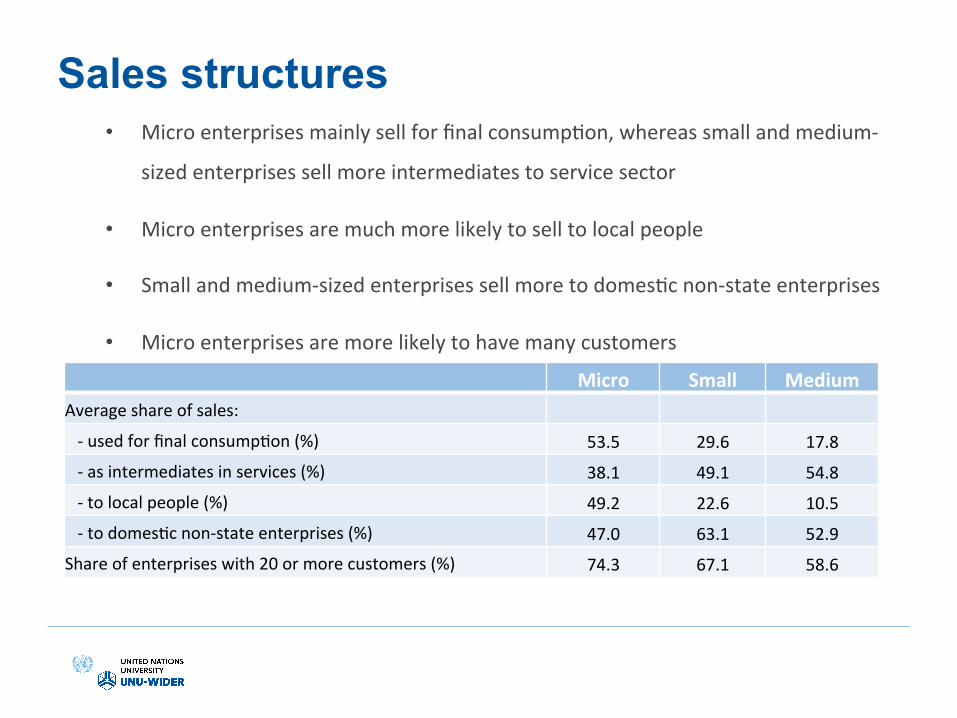
Sales structures • Micro enterprises mainly sell for final consumpIon, whereas small and medium-‐
sized enterprises sell more intermediates to service sector
• Micro enterprises are much more likely to sell to local people
• Small and medium-‐sized enterprises sell more to domesIc non-‐state enterprises
• Micro enterprises are more likely to have many customers
Micro Small Medium Average share of sales:
-‐ used for final consumpIon (%) 53.5 29.6 17.8
-‐ as intermediates in services (%) 38.1 49.1 54.8
-‐ to local people (%) 49.2 22.6 10.5
-‐ to domesIc non-‐state enterprises (%) 47.0 63.1 52.9
Share of enterprises with 20 or more customers (%) 74.3 67.1 58.6

Appendix: Age and gender of respondents
0
10
20
30
40
50
Micro Small Medium Micro Small Medium
(2,810) (553) (70) (685) (527) (221)
Owner Manager
18-‐24 25-‐35 36-‐45 46-‐55 56-‐65
Note: Data from both 2013 and 2015 are used and some enterprises are present in both years.

Conclusion and summing-up

Conclusion (1) • General improvement in business environment. FormalizaIon of business enIIes
has increased substanIally.
• But access to formal credit has remained challenging, especially for household enterprises.
• Employment growth has picked up to pre-‐crisis levels and firm exit rates have gone down as compared to the 2009–13 period.
• However, informal household firms are not very dynamic in job creaIon, which will have to come from formalized SMEs in the future.
• Not much change in bribe paying, but clearer that bribe-‐paying businesses do not have higher rates of growth than non-‐paying firms.
• The share of enterprises making investments has increased since 2013 driven by micro firms.
• The rate of new technology adopIon has declined since 2013; a cause for concern.
Conclusion (2) • Labour producIvity increased; the demonstrated link between innovaIon and
labour producIvity is a jusIficaIon for increased policy anenIon to innovaIon.
• Real wages have increased by almost 15 per cent during the considered two-‐year period.
• SubstanIal differences between men and women both in risk artude and personality traits.
• Vietnamese enterprises do not appear to be very acIve in foreign markets. This is not only illustrated by low export rates, but also by a low prevalence of internaIonally recognized standards.
• A large proporIon of SMEs do not have quality or environmental cerIficates and we have even observed a negaIve trend in cerIficaIon of both internaIonal and environmental standards.
• Almost 90 per cent of enterprises reported they face severe compeIIon in their line of acIvity. The compeIIve pressure increases with firm size. Moreover, enterprises feel that the degree of compeIIon has increased during the past two years.

www.wider.unu.edu Helsinki, Finland