3rd quarter fiscal 2012 update
DESCRIPTION
TRANSCRIPT

New Jersey Resources3rd Quarter Fiscal 2012 Update
August 9,2012
Regarding Forward-Looking Statements
Certain statements contained in this presentation are forward-looking statements within the meaning of the Private Securities Litigation Reform Act of 1995. Forward-looking statements can also be identified by the
use of forward-looking terminology such as “may,” “intend,” “expect,” or “continue” or comparable terminology and are made based upon management’s current expectations and beliefs as of this date concerning
future developments and their potential effect upon New Jersey Resources (NJR or the Company). There can be no assurance that future developments will be in accordance with management’s expectations or that the
effect of future developments on the Company will be those anticipated by management. NJR cautions persons reading or hearing this presentation that the assumptions that form the basis for forward-looking
statements regarding NJR's net financial earnings (NFE) guidance for the 2012 fiscal year, the contributions to NFE by New Jersey Natural Gas Company (NJNG), NJR Clean Energy Ventures (NJRCEV), NJR Energy
Services (NJRES) , the Company's Energy Holdings segment and NJR Home Services, expected contribution by new customers of New Jersey Natural Gas Company (NJNG) to utility gross margin, expected number of
new customers of NJNG, the completion of NJRCEV's planned solar projects in fiscal 2012, estimated capital expenditures in fiscal 2012 by NJNG and NJRCEV, and NJ’s Energy Master Plan include many factors that are
beyond the Company’s ability to control or estimate precisely.
The factors that could cause actual results to differ materially from NJR’s expectations include, but are not limited to, weather and economic conditions; demographic changes in the NJNG service territory and their
effect on NJNG's customer growth; volatility of natural gas and other commodity prices and their impact on NJNG customer usage, NJNG's incentive programs, NJRES' operations and on the Company's risk
management efforts; changes in rating agency requirements and/or credit ratings and their effect on availability and cost of capital to the Company; the impact of volatility in the credit markets; the ability to comply
with debt covenants; the impact to the asset values and resulting higher costs and funding obligations of NJR's pension and postemployment benefit plans as a result of downturns in the financial markets, a lower
discount rate, and impacts associated with the Patient Protection and Affordable Care Act; accounting effects and other risks associated with hedging activities and use of derivatives contracts; commercial and
wholesale credit risks, including the availability of creditworthy customers and counterparties, liquidity in the wholesale energy trading market and the Company’s ability to recover all of NJRES’ funds in the MF Global
liquidation proceedings; the ability to obtain governmental approvals and/or financing for the construction, development and operation of certain non-regulated energy investments; risks associated with the
management of the Company's joint ventures and partnerships; risks associated with our investments in solar energy projects, including the availability of regulatory and tax incentives, logistical risks and potential
delays related to construction, permitting, regulatory approvals and electric grid interconnection, the availability of viable projects and NJR's eligibility for federal investment tax credits (ITC), the future market for Solar
Renewable Energy Certificates and operational risks related to projects in service; timing of qualifying for ITCs due to delays or failures to complete planned solar energy projects and the resulting effect on our effective
tax rate and earnings; the level and rate at which NJNG's costs and expenses are incurred and the extent to which they are allowed to be recovered from customers through the regulatory process; access to adequate
supplies of natural gas and dependence on third-party storage and transportation facilities for natural gas supply; operating risks incidental to handling, storing, transporting and providing customers with natural gas;
risks related to our employee workforce; the regulatory and pricing policies of federal and state regulatory agencies; the costs of compliance with the proposed regulatory framework for over-the-counter derivatives; the
costs of compliance with present and future environmental laws, including potential climate change-related legislation; risks related to changes in accounting standards; the disallowance of recovery of environmental-
related expenditures and other regulatory changes; environmental-related and other litigation and other uncertainties; and the impact of natural disasters, terrorist activities, and other extreme events.
The aforementioned factors are detailed in the “Risk Factors” sections of our Annual Report on Form 10-K filed on November 23, 2011, as filed with the Securities and Exchange Commission (SEC) and which is
available on the SEC’s website at sec.gov. NJR disclaims any obligation to update and revise statements contained in these materials based on new information or otherwise.
2
Disclaimer Regarding Non-GAAP Financial Measures
This presentation includes the non-GAAP measures net financial earnings (losses), financial margin and utility gross margin. As an indicator of the company’s operating performance, these measures should not be considered an alternative to, or more meaningful than, GAAP measures such as cash flow, net income, operating income or earnings per share. Net financial earnings (losses) and financial margin exclude unrealized gains or losses on derivative instruments related to the company’s unregulated subsidiaries and certain realized gains and losses on derivative instruments related to natural gas that has been placed into storage at NJRES. Volatility associated with the change in value of these financial and physical commodity contracts is reported in the income statement in the current period. In order to manage its business, NJR views its results without the impacts of the unrealized gains and losses, and certain realized gains and losses, caused by changes in value of these financial instruments and physical commodity contracts prior to the completion of the planned transaction because it shows changes in value currently as opposed to when the planned transaction ultimately is settled. NJNG’s utility gross margin represents the results of revenues less natural gas costs, sales and other taxes and regulatory rider expenses, which are key components of the company’s operations that move in relation to each other.
Management uses net financial earnings, financial margin and utility gross margin as supplemental measures to other GAAP results to provide a more complete understanding of the company’s performance. Management believes these non-GAAP measures are more reflective of thecompany’s business model, provide transparency to investors and enable period-to-period comparability of financial performance. For a full discussion of our non-GAAP financial measures, please see Item 7 of our Annual Report on Form 10-K for the fiscal year ended September 30, 2011, filed on November 23, 2011.
3
4
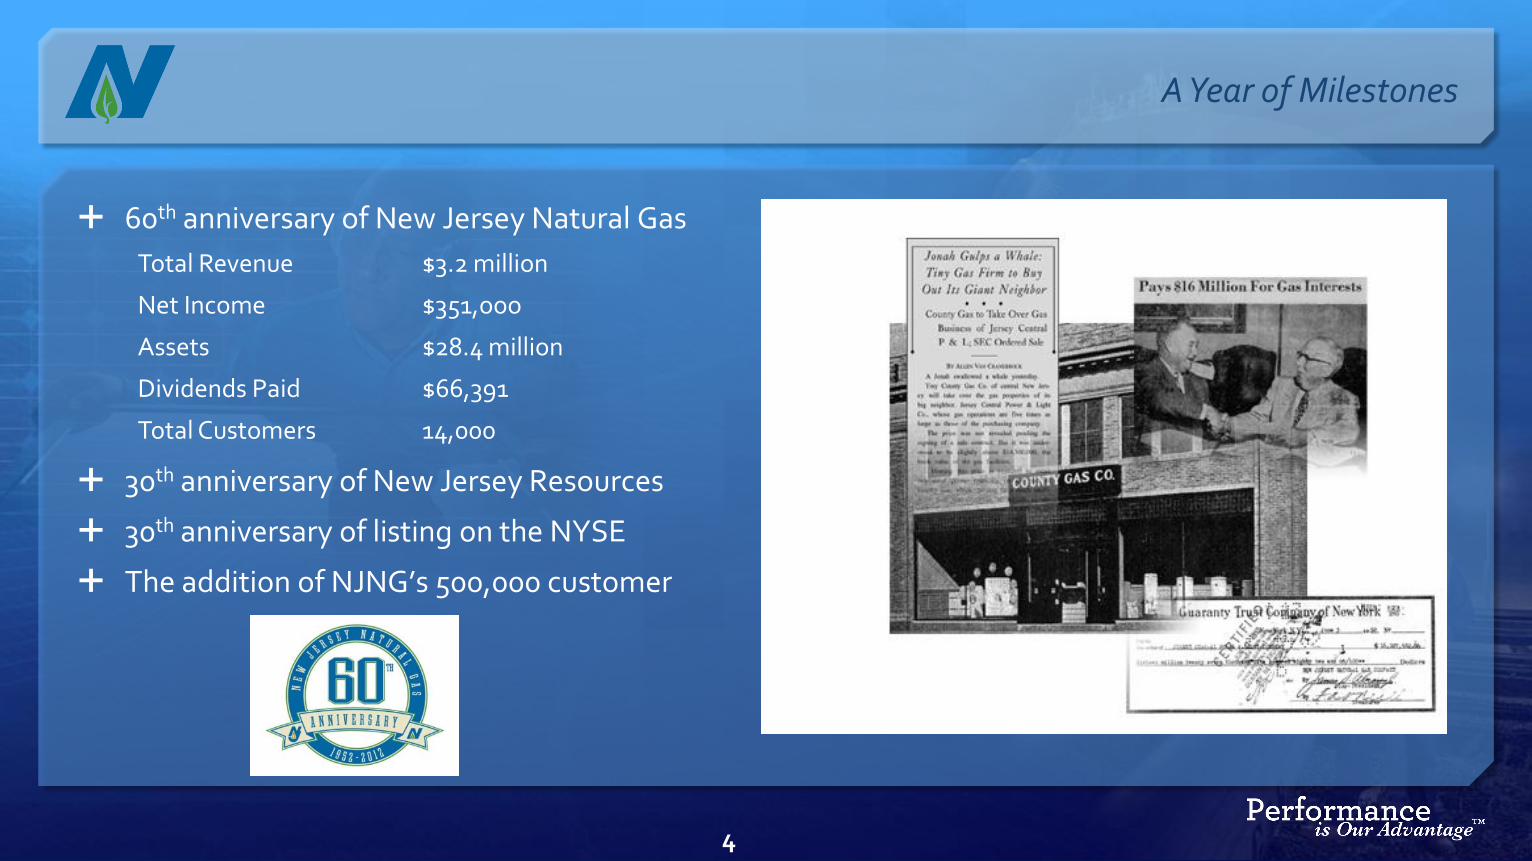
A Year of Milestones
Total Revenue $3.2 million
Net Income $351,ooo
Assets $28.4 million
Dividends Paid $66,391
Total Customers 14,000
60th anniversary of New Jersey Natural Gas
30th anniversary of New Jersey Resources
30th anniversary of listing on the NYSE
The addition of NJNG’s 500,000 customer
Net Financial Earnings Higher NFE for the nine months ended June 30, 2012
• $2.98 vs. $2.56 last year, a 16 percent increase
Guidance range narrowed for fiscal 2012 to $2.65 to $2.75 per basic share• On track for our 21st consecutive year of NFE growth
60 percent of total earnings from New Jersey Natural Gas
Dividends 19th dividend increase in 17 years
1-year growth rate of 5.6 percent compared with 3.7 percent for peers
Attractive yield of 3.3 percent
Share repurchases Repurchased 200,300 shares this fiscal year Over 7.5 million repurchased since 1995
5
Enhancing Shareowner Value
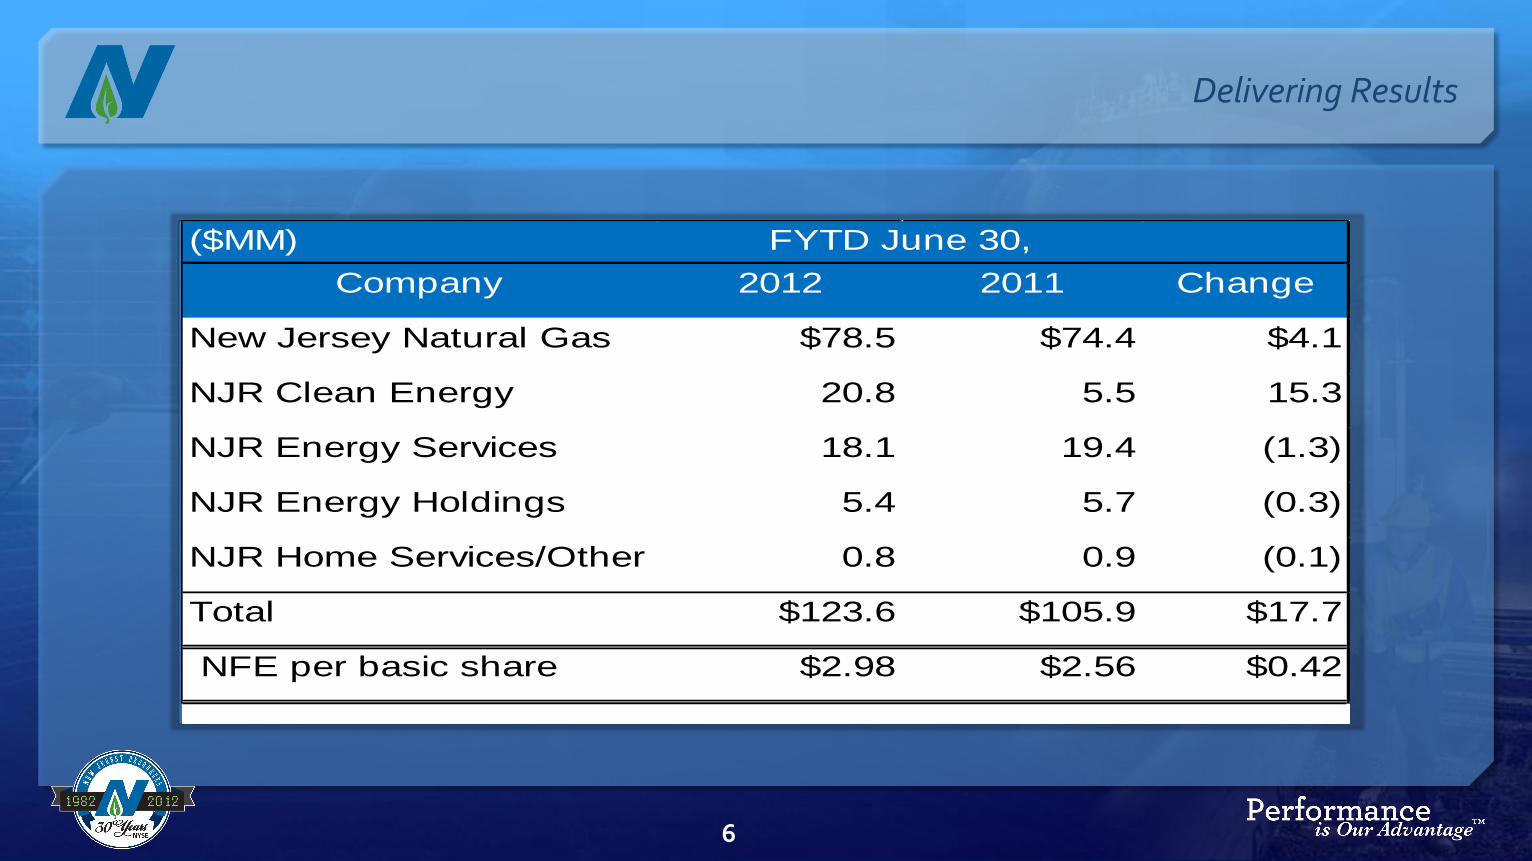
Delivering Results
($MM)
Company 2012 2011 Change
New Jersey Natural Gas $78.5 $74.4 $4.1
NJR Clean Energy 20.8 5.5 15.3
NJR Energy Services 18.1 19.4 (1.3)
NJR Energy Holdings 5.4 5.7 (0.3)
NJR Home Services/Other 0.8 0.9 (0.1)
Total $123.6 $105.9 $17.7
NFE per basic share $2.98 $2.56 $0.42
FYTD June 30,
6
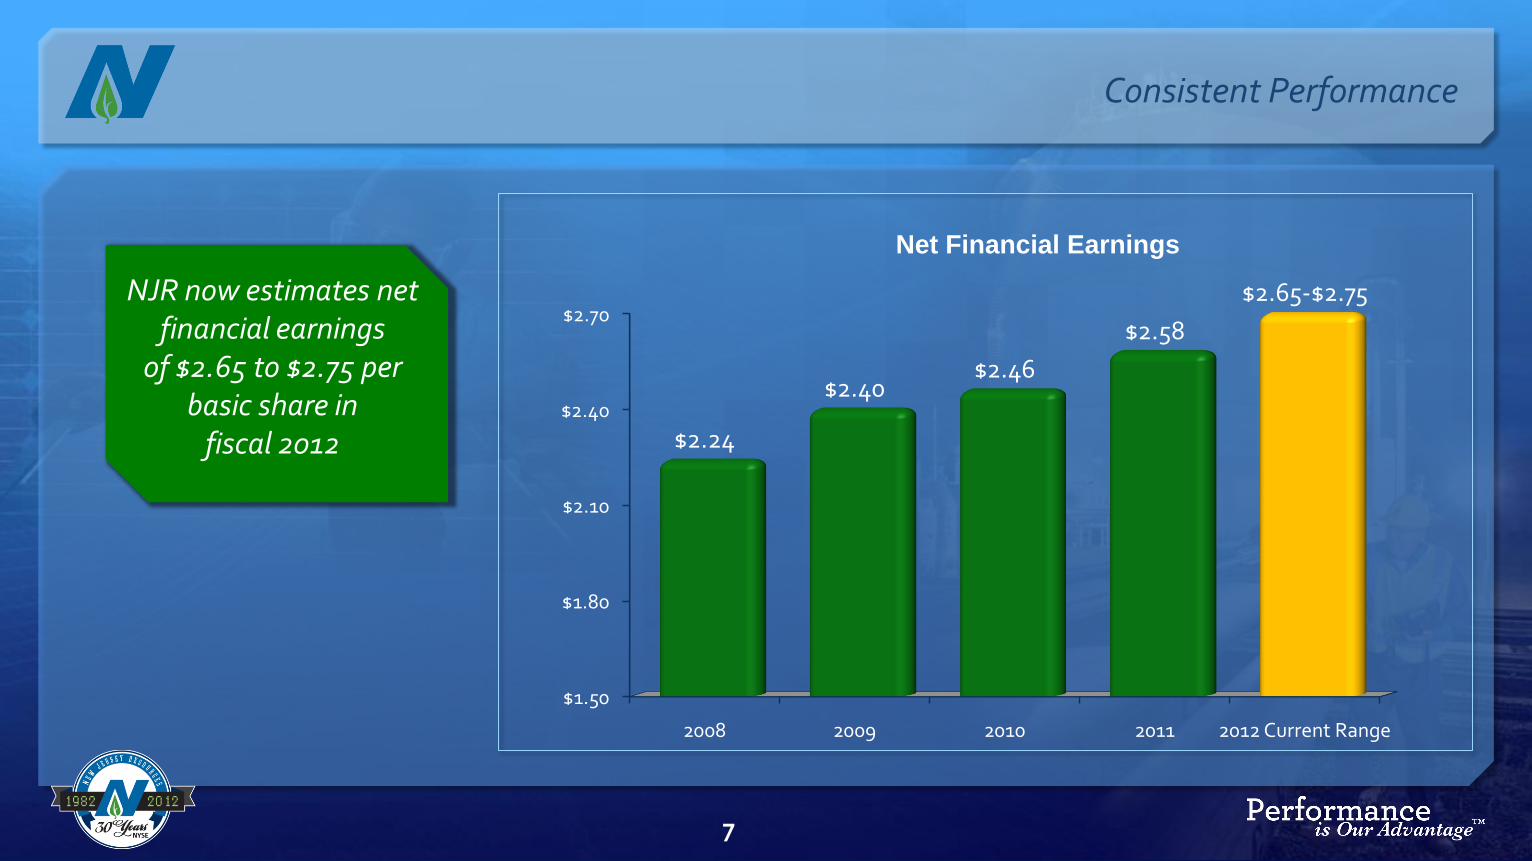
Consistent Performance
NJR now estimates net financial earnings
of $2.65 to $2.75 per basic share in
fiscal 2012
$1.50
$1.80
$2.10
$2.40
$2.70
2008 2009 2010 2011 2012 Current Range
$2.24
$2.40$2.46
$2.58
$2.65-$2.75
Net Financial Earnings
7
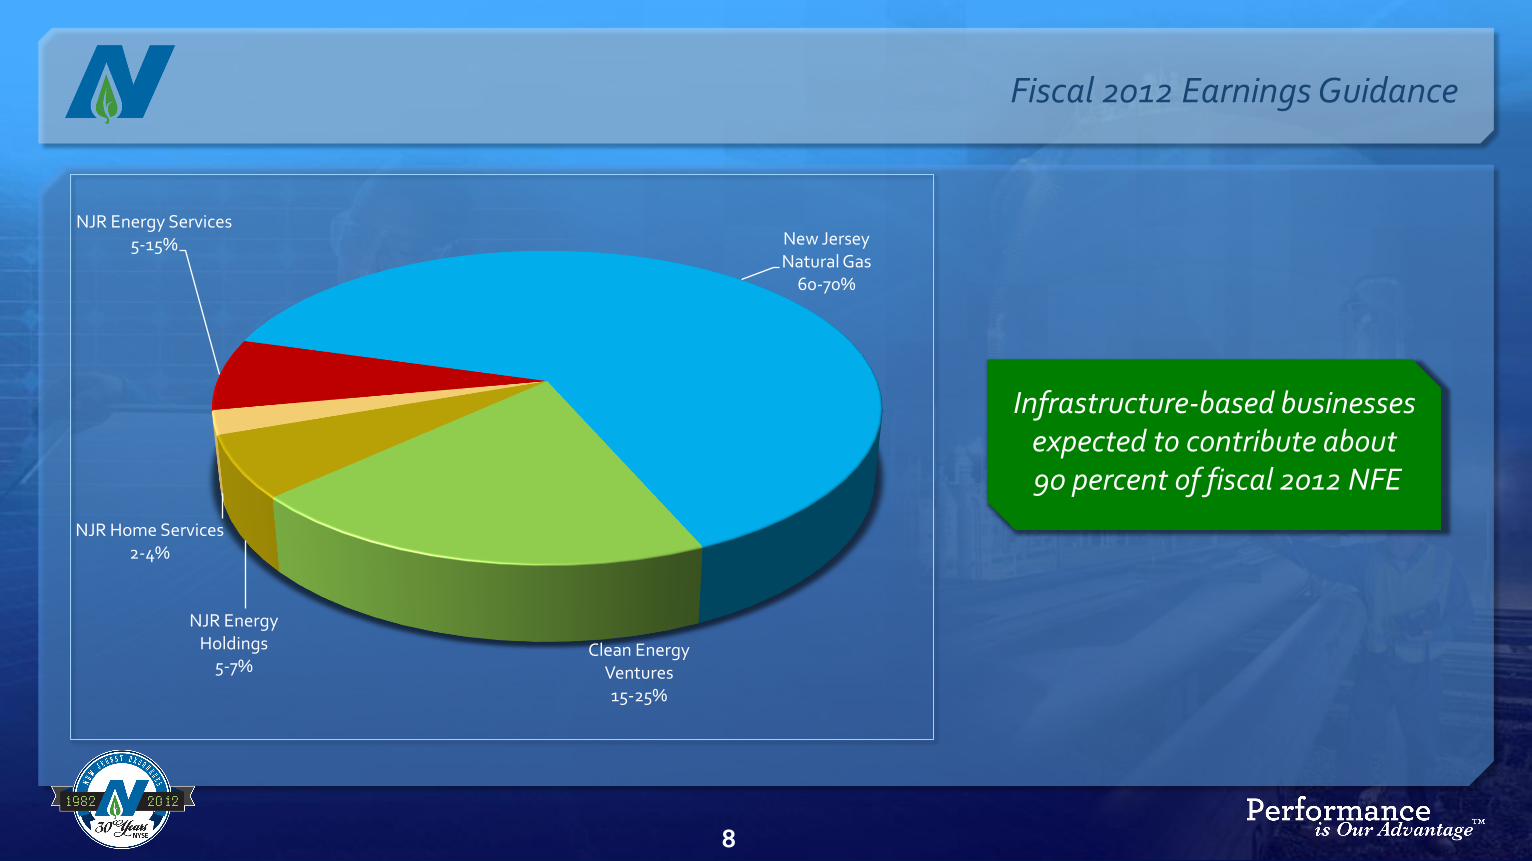
Fiscal 2012 Earnings Guidance
New Jersey Natural Gas
60-70%
Clean Energy Ventures15-25%
NJR Energy Holdings
5-7%
NJR Home Services2-4%
NJR Energy Services5-15%
Infrastructure-based businesses expected to contribute about90 percent of fiscal 2012 NFE
8
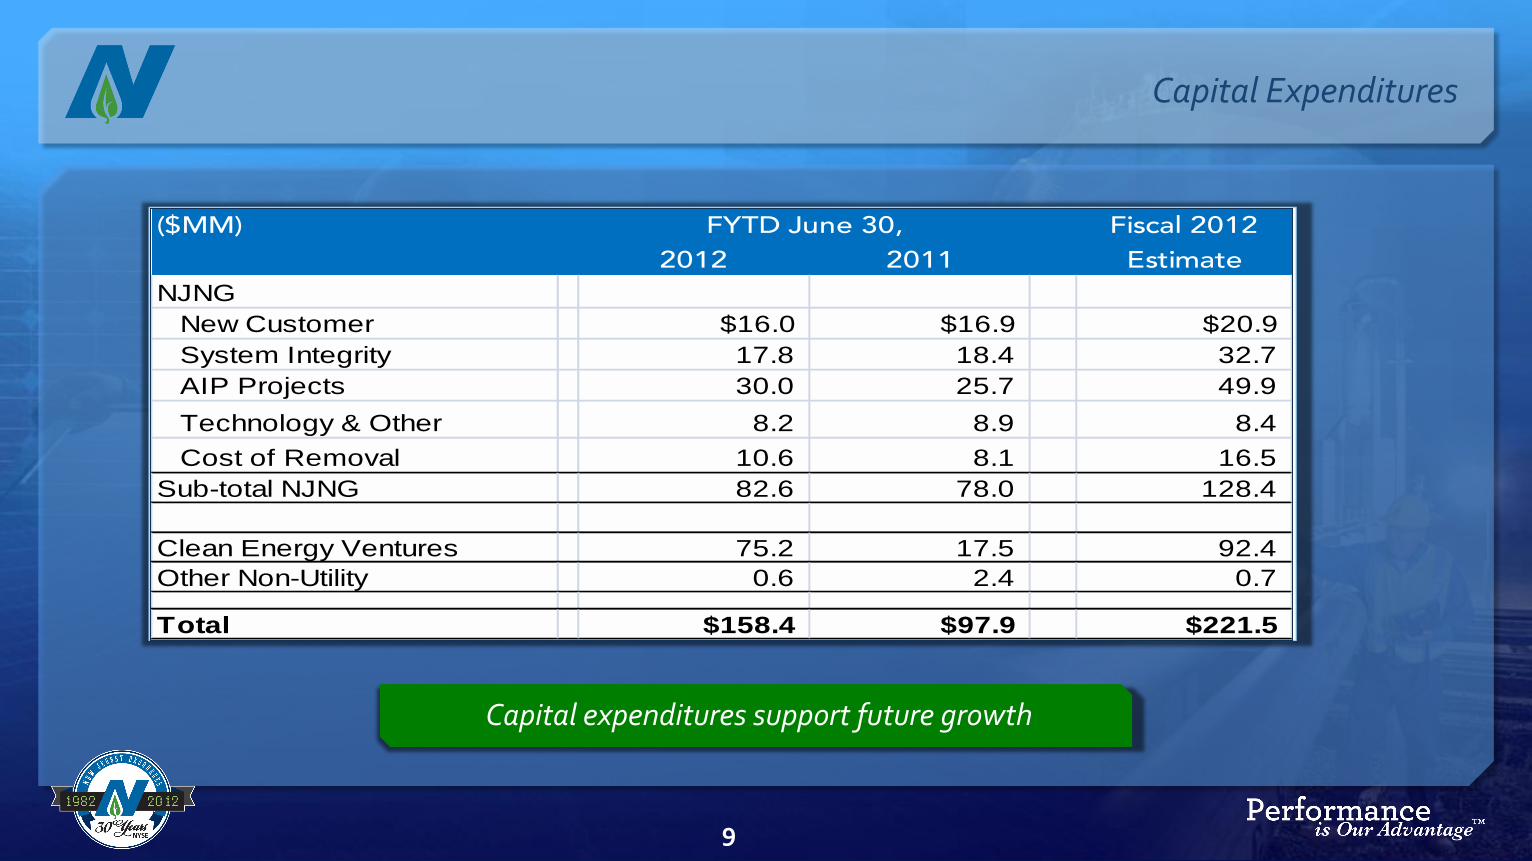
Capital Expenditures
($MM) Fiscal 2012
2012 2011 Estimate
NJNG
New Customer $16.0 $16.9 $20.9
System Integrity 17.8 18.4 32.7
AIP Projects 30.0 25.7 49.9
Technology & Other 8.2 8.9 8.4
Cost of Removal 10.6 8.1 16.5
Sub-total NJNG 82.6 78.0 128.4
Clean Energy Ventures 75.2 17.5 92.4
Other Non-Utility 0.6 2.4 0.7
Total $158.4 $97.9 $221.5
FYTD June 30,
Capital expenditures support future growth
9
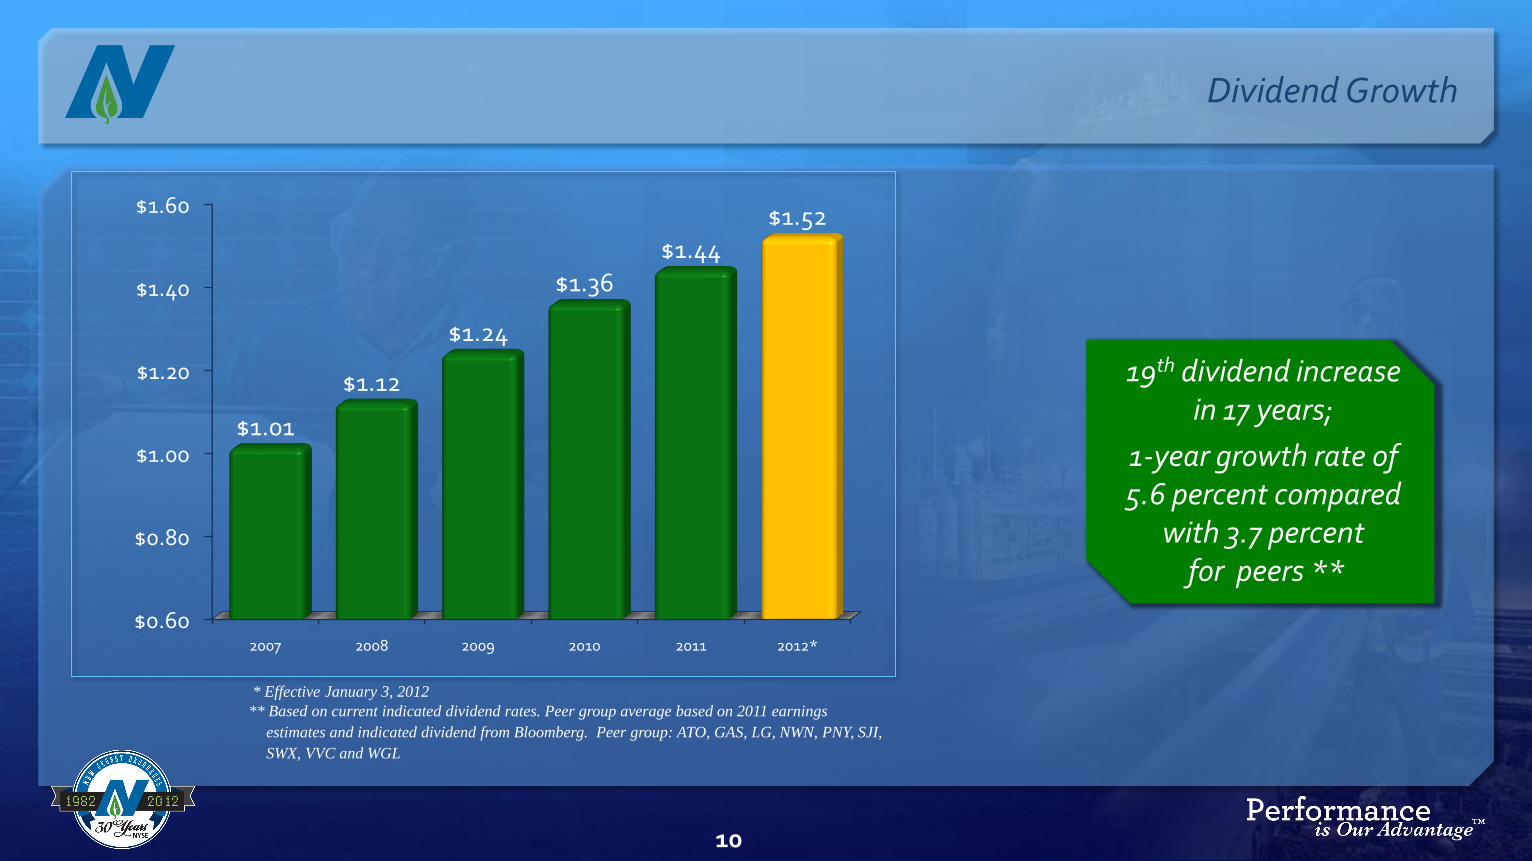
Dividend Growth
$0.60
$0.80
$1.00
$1.20
$1.40
$1.60
2007 2008 2009 2010 2011 2012*
$1.01
$1.12
$1.24
$1.36 $1.44
$1.52
19th dividend increase in 17 years;
1-year growth rate of 5.6 percent compared
with 3.7 percentfor peers **
* Effective January 3, 2012
** Based on current indicated dividend rates. Peer group average based on 2011 earnings
estimates and indicated dividend from Bloomberg. Peer group: ATO, GAS, LG, NWN, PNY, SJI,
SWX, VVC and WGL
10
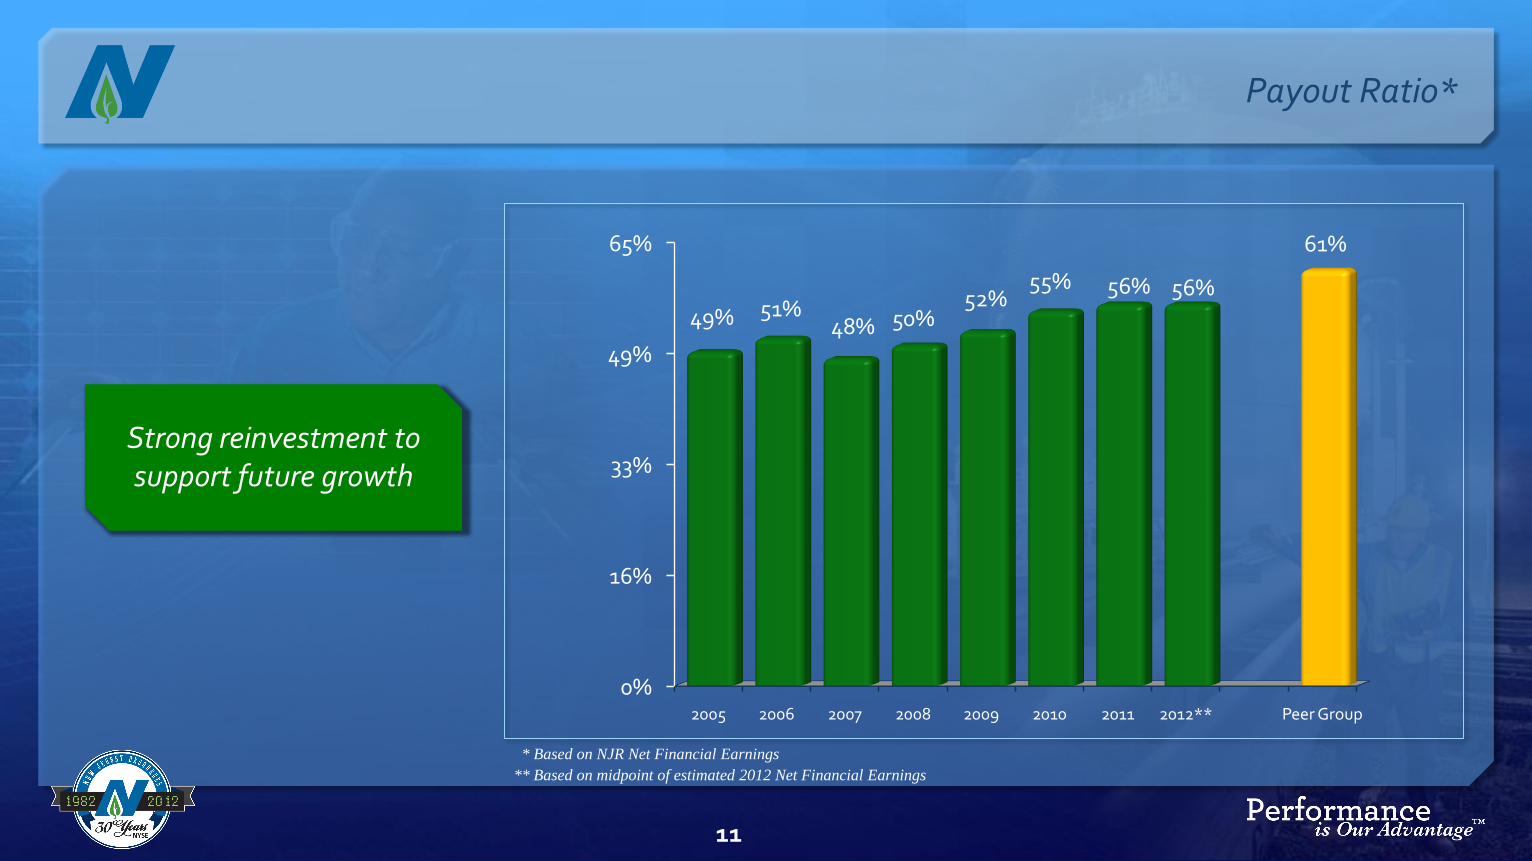
Payout Ratio*
0%
16%
33%
49%
65%
2005 2006 2007 2008 2009 2010 2011 2012** Peer Group
49% 51%48% 50%
52%55% 56% 56%
61%
Strong reinvestment to support future growth
* Based on NJR Net Financial Earnings
** Based on midpoint of estimated 2012 Net Financial Earnings
11
Program implemented in September 1996
One of the first in the utility industry to implement a program
7.5 million shares repurchased since inception
Fiscal 2012 activity
200,300 shares repurchased for $8.7 million
12
Share Repurchases
A strong financial profile has allowed for open
market repurchase of shares
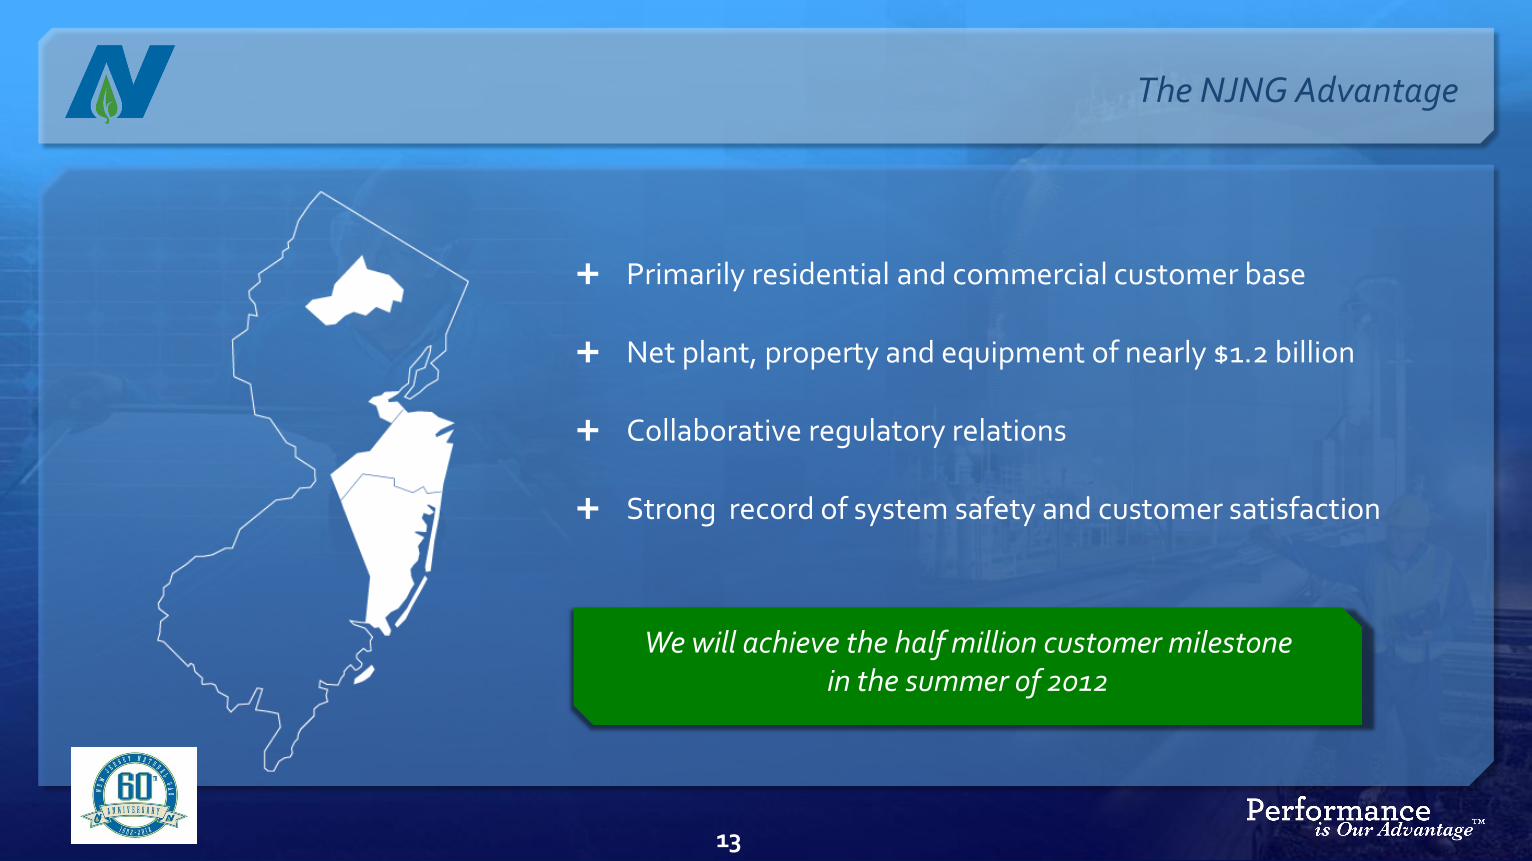
The NJNG Advantage
Primarily residential and commercial customer base
Net plant, property and equipment of nearly $1.2 billion
Collaborative regulatory relations
Strong record of system safety and customer satisfaction
We will achieve the half million customer milestone in the summer of 2012
13
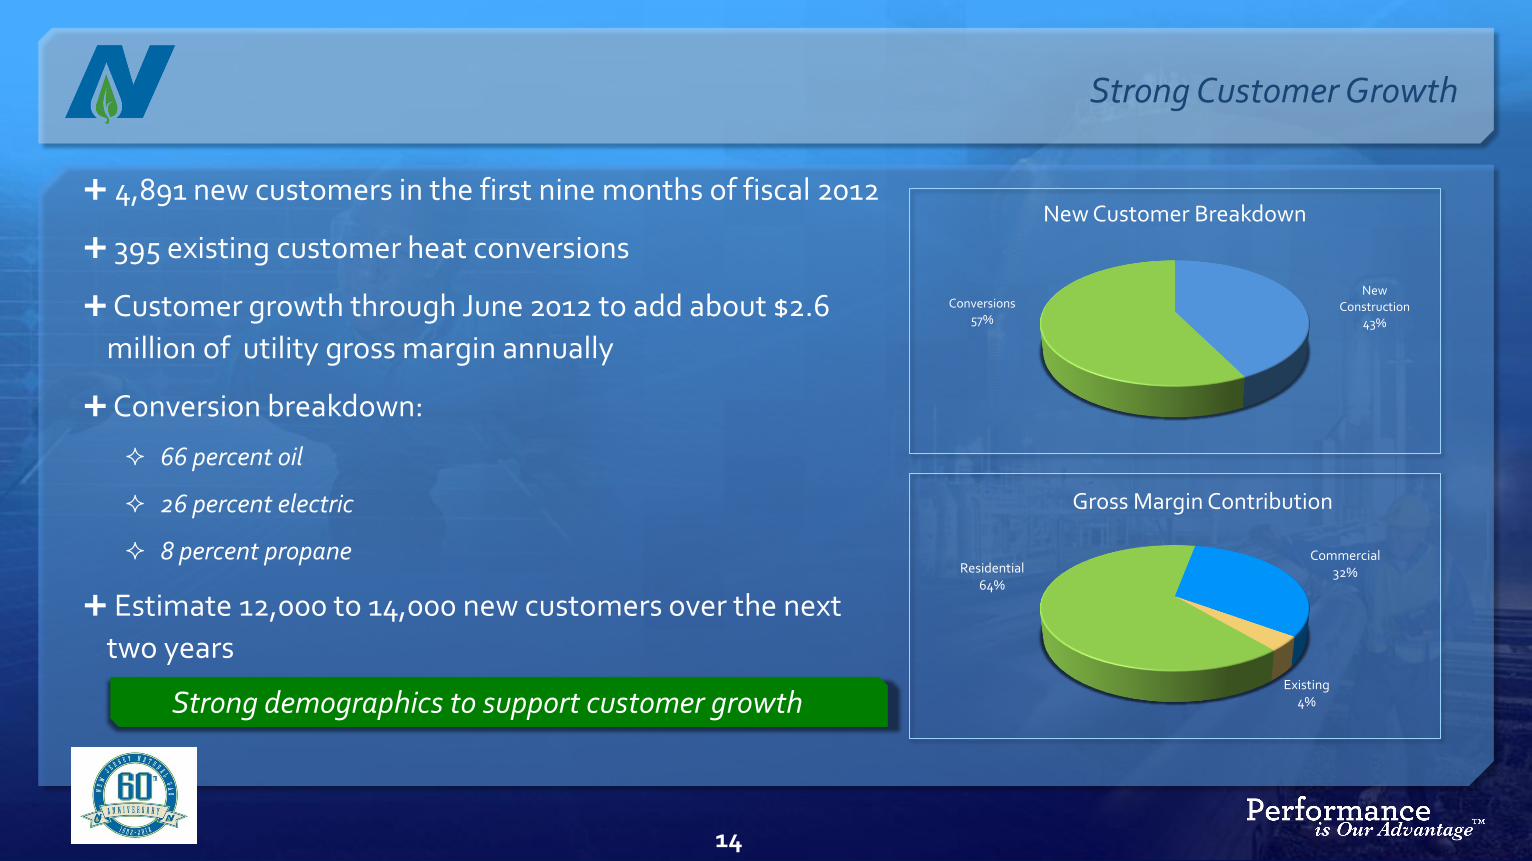
4,891 new customers in the first nine months of fiscal 2012
395 existing customer heat conversions
Customer growth through June 2012 to add about $2.6
million of utility gross margin annually
Conversion breakdown:
66 percent oil
26 percent electric
8 percent propane
Estimate 12,000 to 14,000 new customers over the next
two years
Strong Customer Growth
New Construction
43%
Conversions57%
New Customer Breakdown
Residential64%
Commercial32%
Existing4%
Gross Margin Contribution
Strong demographics to support customer growth
14
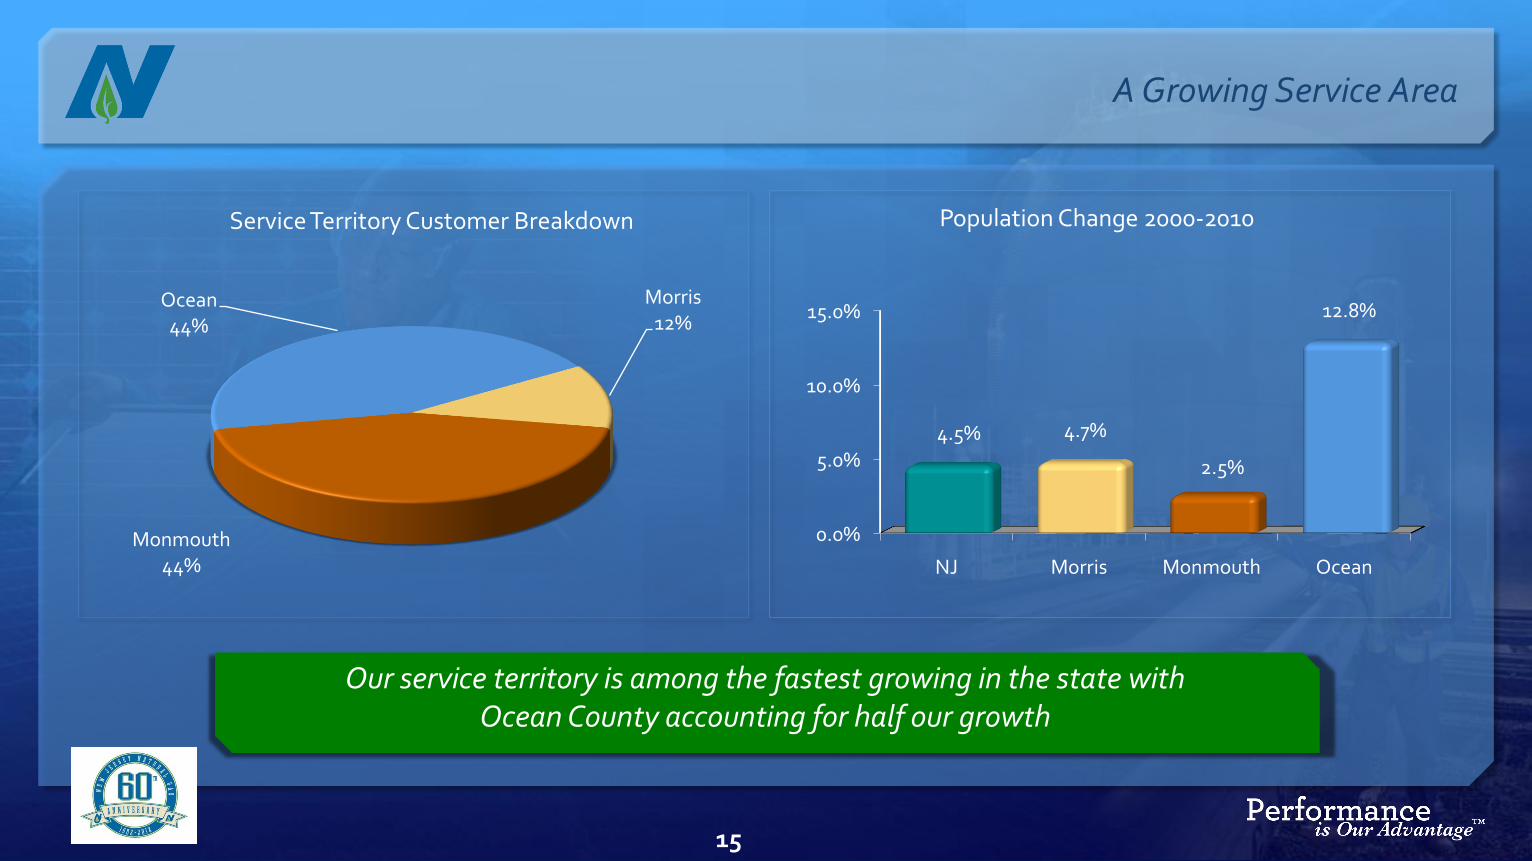
A Growing Service Area
0.0%
5.0%
10.0%
15.0%
NJ Morris Monmouth Ocean
4.5% 4.7%
2.5%
12.8%
Population Change 2000-2010
Monmouth44%
Ocean44%
Morris12%
Service Territory Customer Breakdown
Our service territory is among the fastest growing in the state withOcean County accounting for half our growth
15
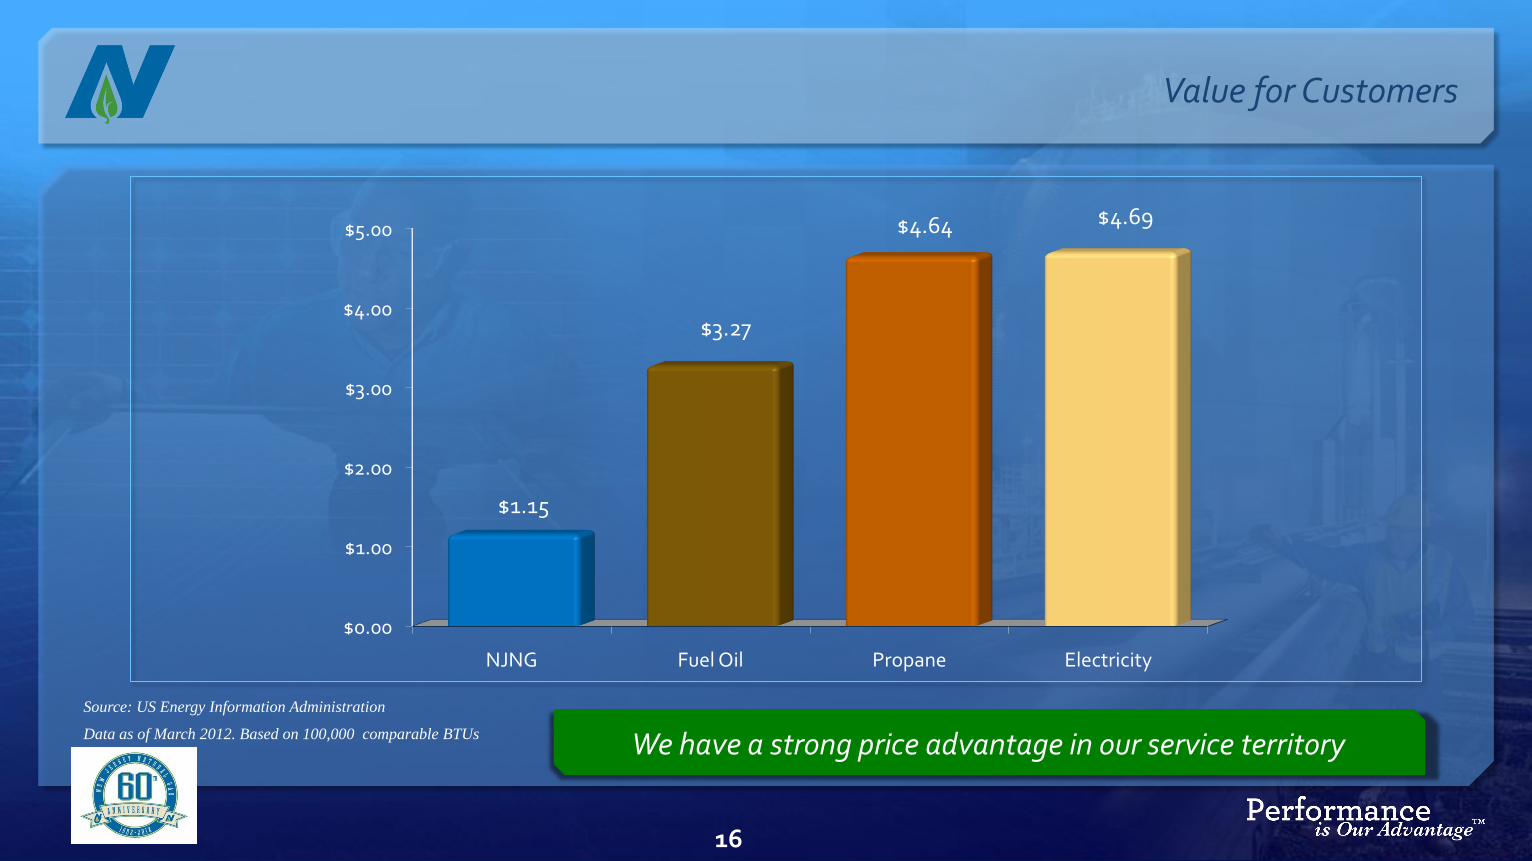
Value for Customers
$0.00
$1.00
$2.00
$3.00
$4.00
$5.00
NJNG Fuel Oil Propane Electricity
$1.15
$3.27
$4.64 $4.69
We have a strong price advantage in our service territory
Source: US Energy Information Administration
Data as of March 2012. Based on 100,000 comparable BTUs
16
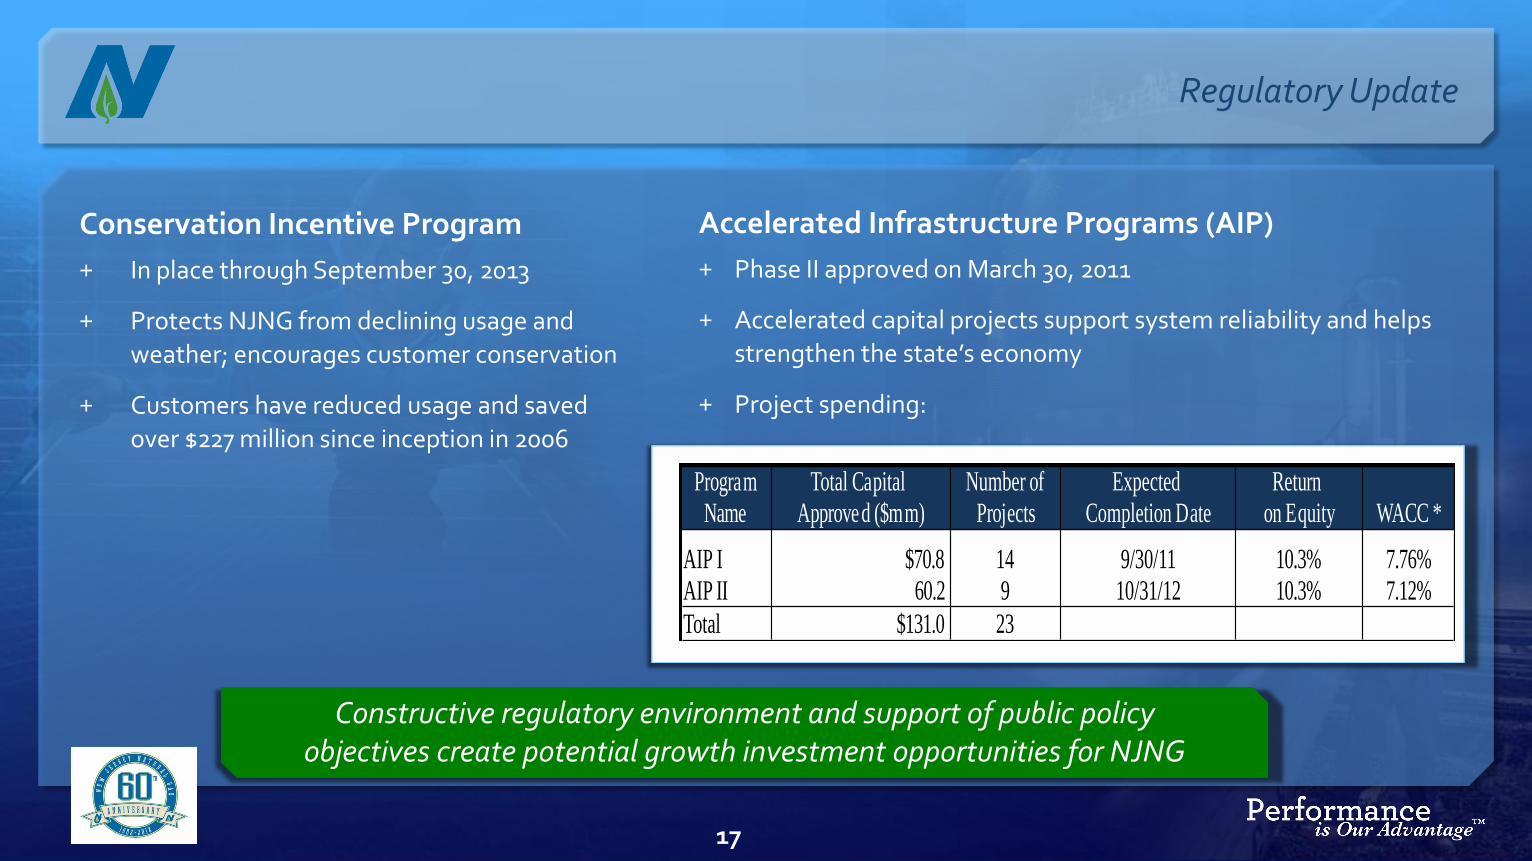
Conservation Incentive Program
+ In place through September 30, 2013
+ Protects NJNG from declining usage and
weather; encourages customer conservation
+ Customers have reduced usage and saved
over $227 million since inception in 2006
Regulatory Update
Accelerated Infrastructure Programs (AIP)
+ Phase II approved on March 30, 2011
+ Accelerated capital projects support system reliability and helps
strengthen the state’s economy
+ Project spending:
Constructive regulatory environment and support of public policy objectives create potential growth investment opportunities for NJNG
17
Program Total Capital Number of Expected Return Name Approved ($mm) Projects Completion Date on Equity WACC *
AIP I $70.8 14 9/30/11 10.3% 7.76%AIP II 60.2 9 10/31/12 10.3% 7.12%
Total $131.0 23
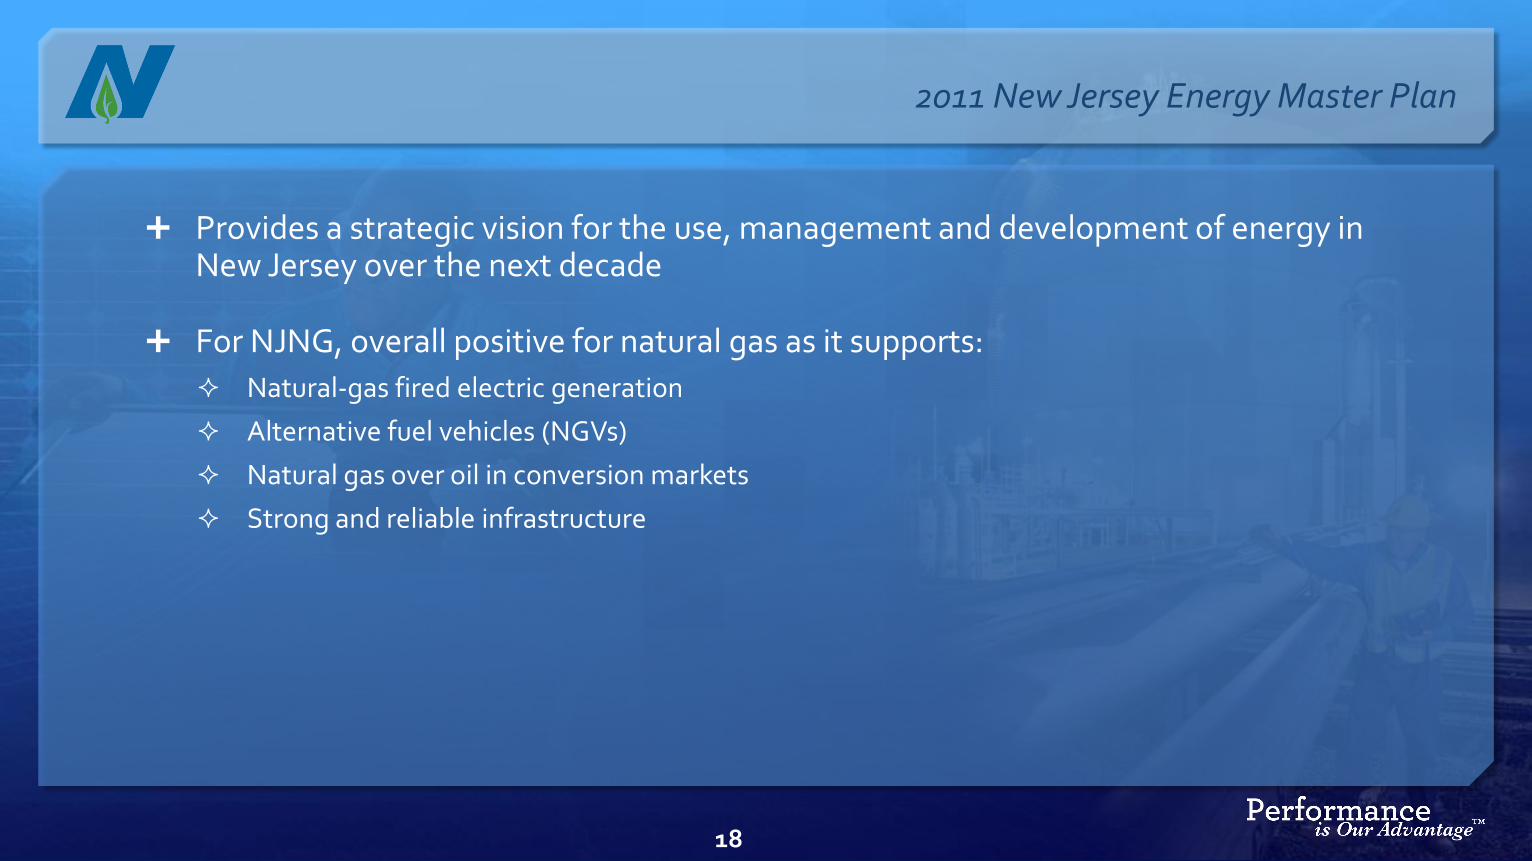
Provides a strategic vision for the use, management and development of energy in New Jersey over the next decade
For NJNG, overall positive for natural gas as it supports:
Natural-gas fired electric generation
Alternative fuel vehicles (NGVs)
Natural gas over oil in conversion markets
Strong and reliable infrastructure
18
2011 New Jersey Energy Master Plan
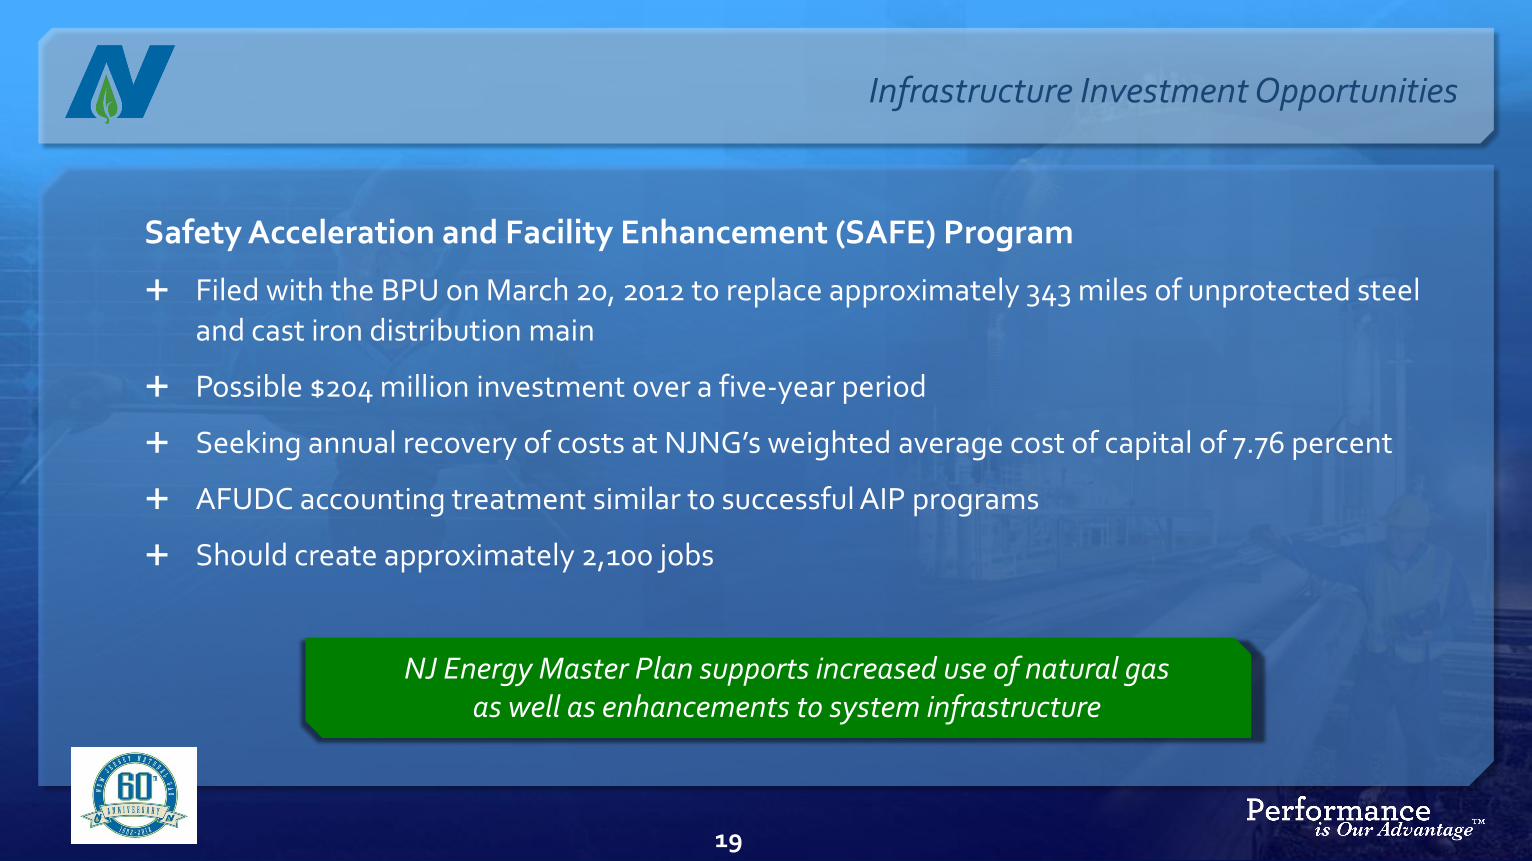
Safety Acceleration and Facility Enhancement (SAFE) Program
Filed with the BPU on March 20, 2012 to replace approximately 343 miles of unprotected steel
and cast iron distribution main
Possible $204 million investment over a five-year period
Seeking annual recovery of costs at NJNG’s weighted average cost of capital of 7.76 percent
AFUDC accounting treatment similar to successful AIP programs
Should create approximately 2,100 jobs
Infrastructure Investment Opportunities
NJ Energy Master Plan supports increased use of natural gasas well as enhancements to system infrastructure
19
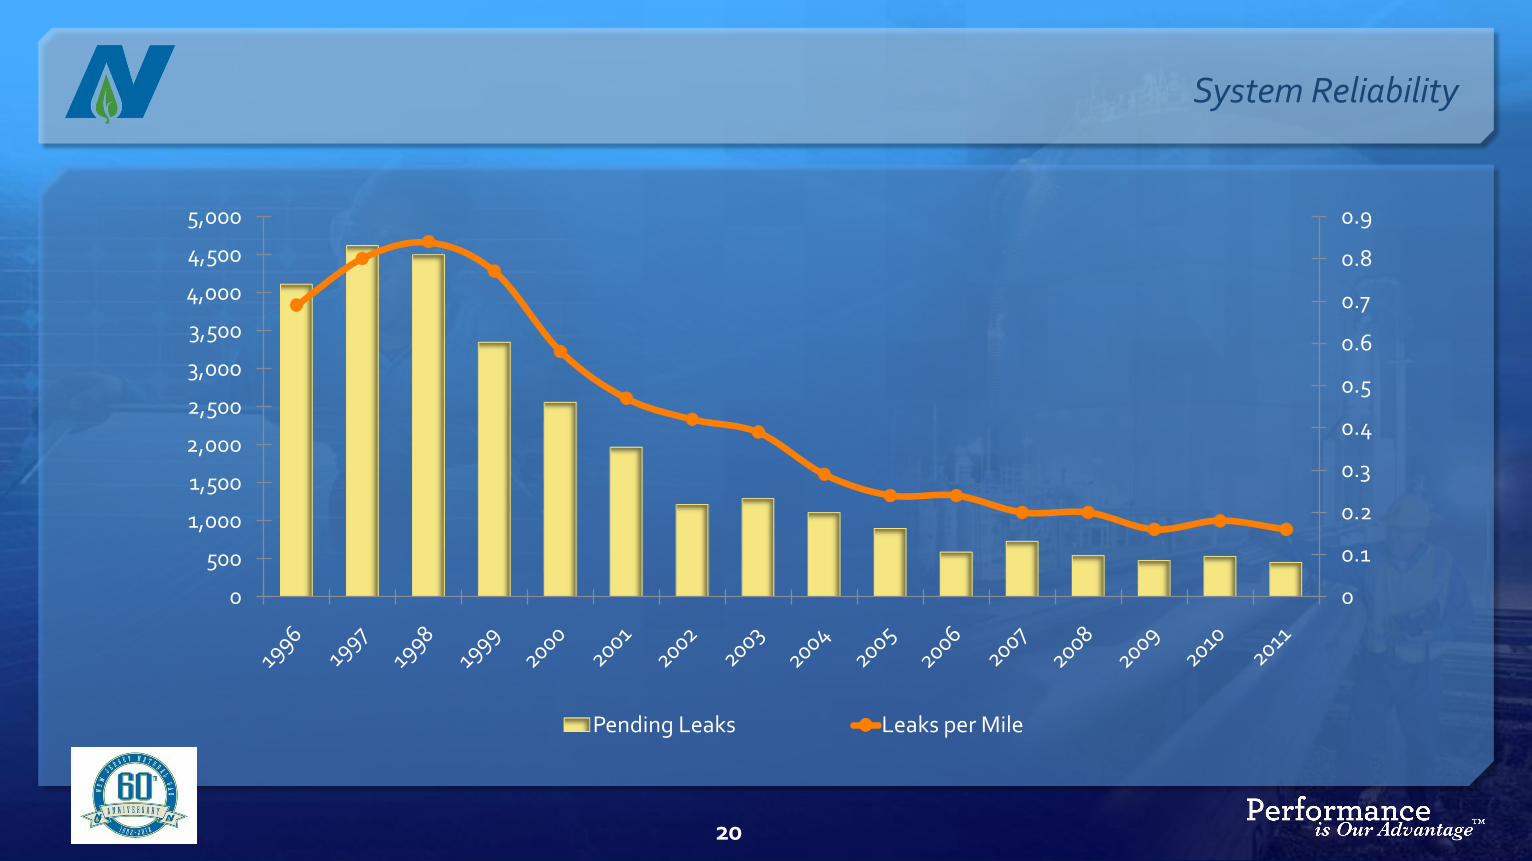
System Reliability
20
0
0.1
0.2
0.3
0.4
0.5
0.6
0.7
0.8
0.9
0
500
1,000
1,500
2,000
2,500
3,000
3,500
4,000
4,500
5,000
Pending Leaks Leaks per Mile
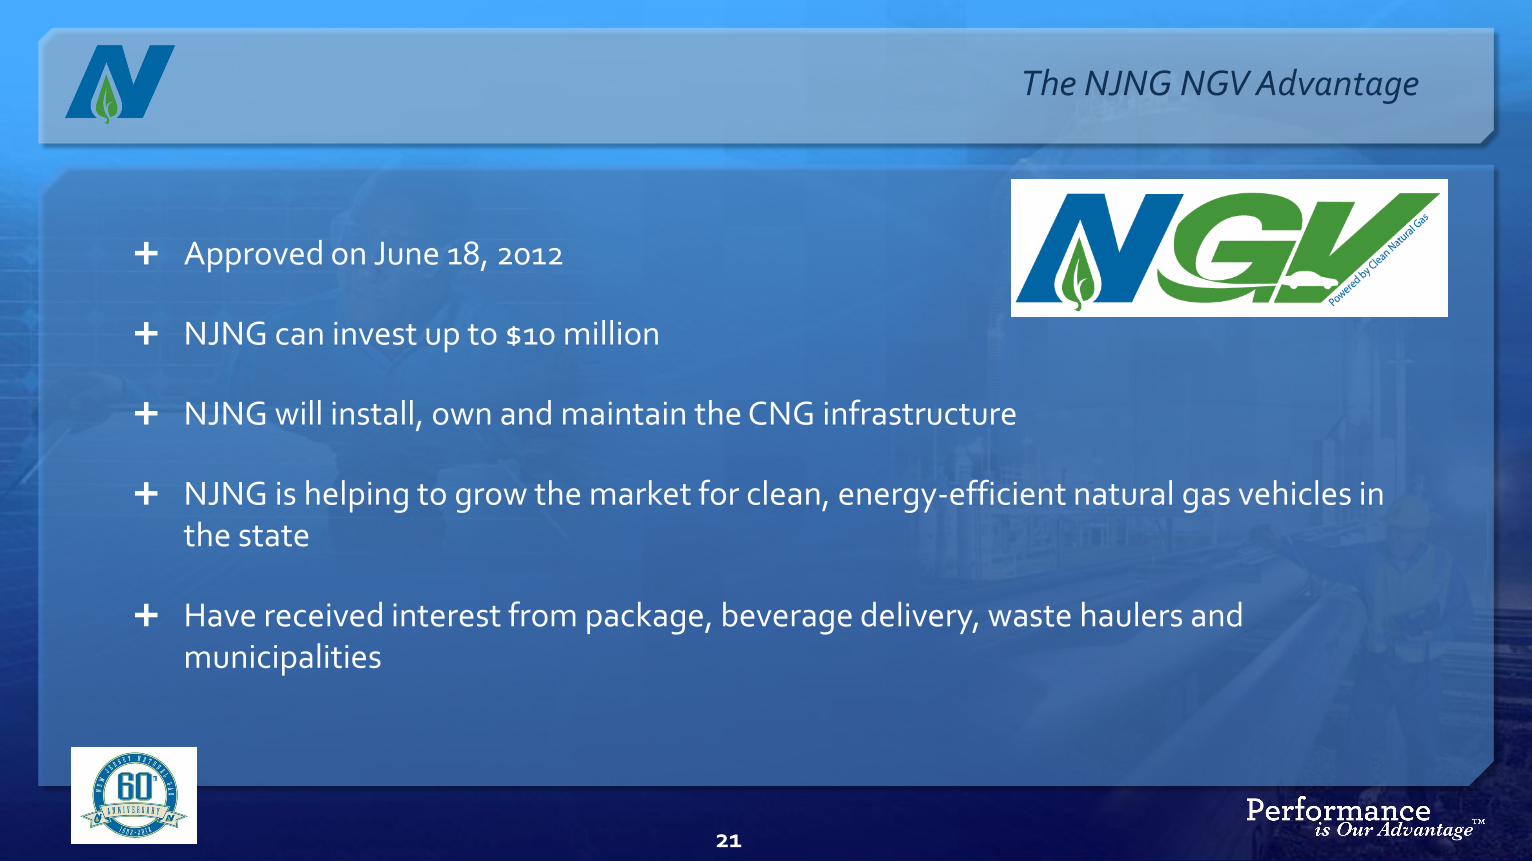
Approved on June 18, 2012
NJNG can invest up to $10 million
NJNG will install, own and maintain the CNG infrastructure
NJNG is helping to grow the market for clean, energy-efficient natural gas vehicles in the state
Have received interest from package, beverage delivery, waste haulers and municipalities
21
The NJNG NGV Advantage
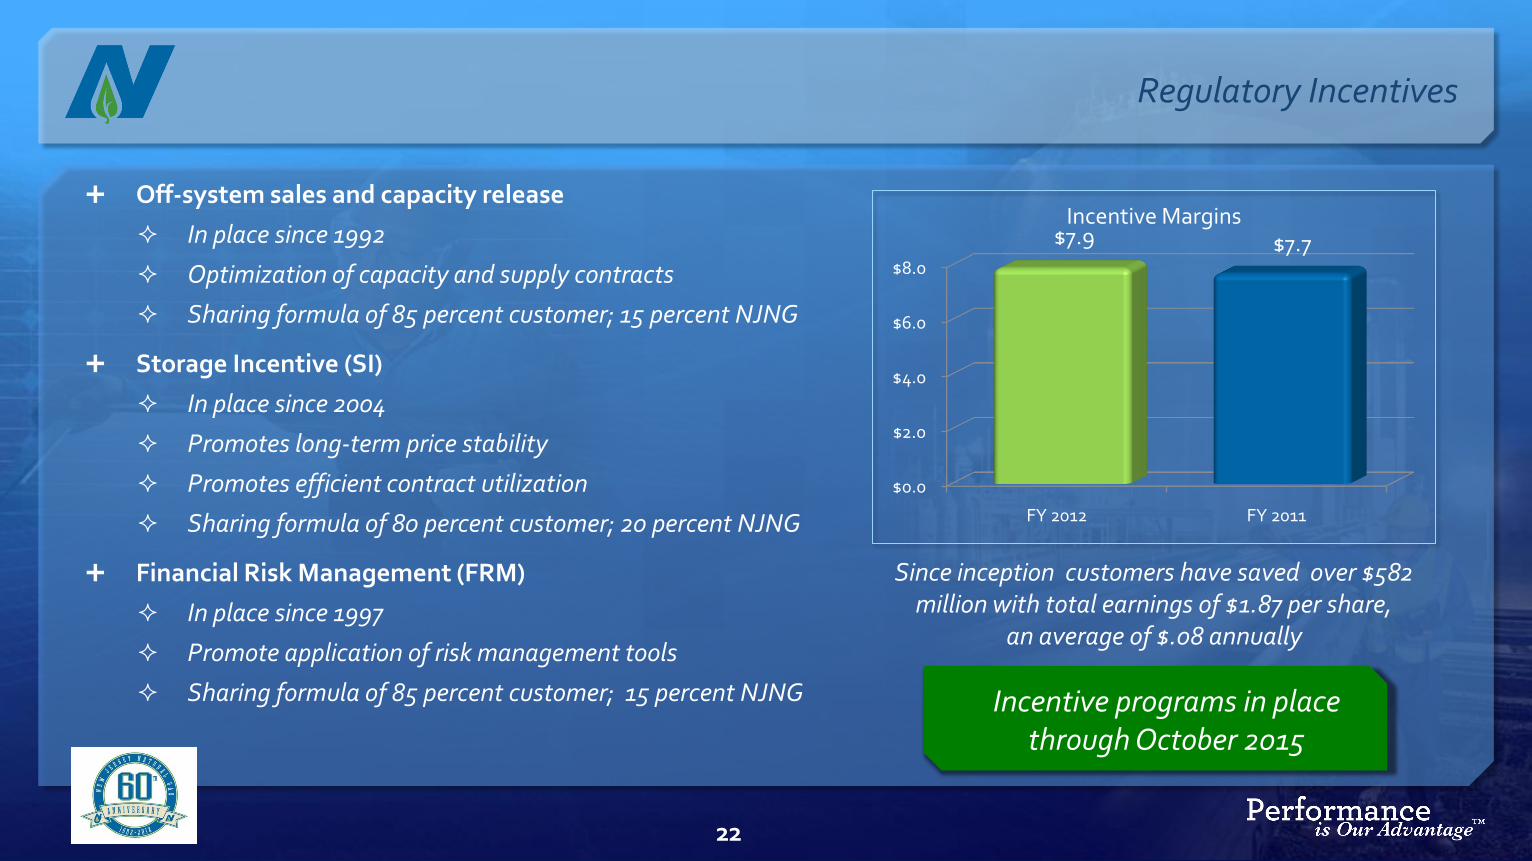
Off-system sales and capacity release
In place since 1992
Optimization of capacity and supply contracts
Sharing formula of 85 percent customer; 15 percent NJNG
Storage Incentive (SI)
In place since 2004
Promotes long-term price stability
Promotes efficient contract utilization
Sharing formula of 80 percent customer; 20 percent NJNG
Financial Risk Management (FRM)
In place since 1997
Promote application of risk management tools
Sharing formula of 85 percent customer; 15 percent NJNG
Regulatory Incentives
$0.0
$2.0
$4.0
$6.0
$8.0
FY 2012 FY 2011
$7.9 $7.7 Incentive Margins
Since inception customers have saved over $582 million with total earnings of $1.87 per share,
an average of $.08 annually
Incentive programs in place through October 2015
22
23
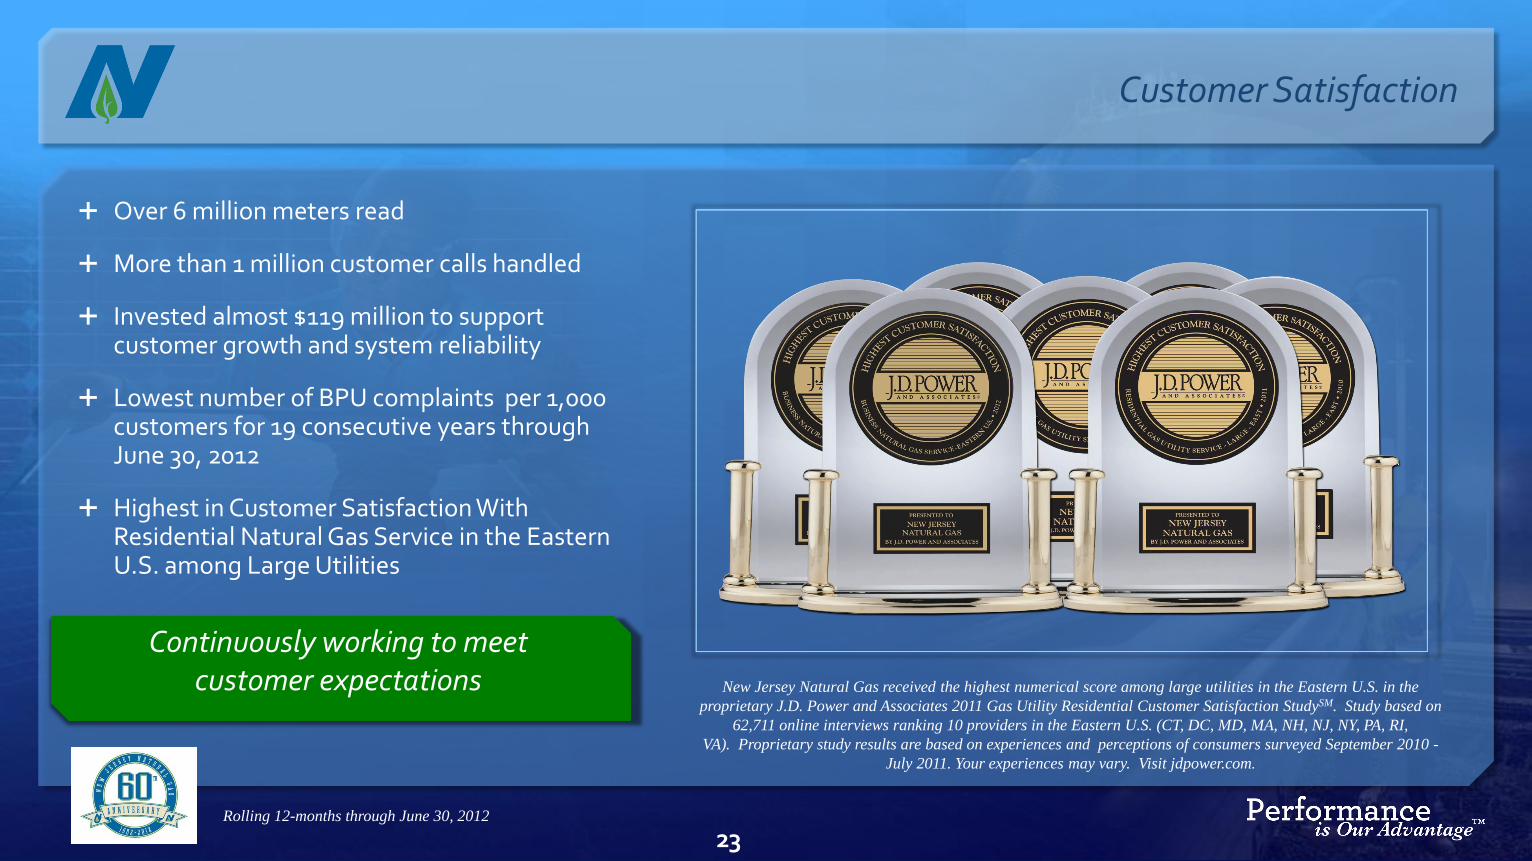
Over 6 million meters read
More than 1 million customer calls handled
Invested almost $119 million to support customer growth and system reliability
Lowest number of BPU complaints per 1,000 customers for 19 consecutive years through June 30, 2012
Highest in Customer Satisfaction With Residential Natural Gas Service in the Eastern U.S. among Large Utilities
Customer Satisfaction
Continuously working to meet customer expectations
Rolling 12-months through June 30, 2012
New Jersey Natural Gas received the highest numerical score among large utilities in the Eastern U.S. in the
proprietary J.D. Power and Associates 2011 Gas Utility Residential Customer Satisfaction StudySM. Study based on
62,711 online interviews ranking 10 providers in the Eastern U.S. (CT, DC, MD, MA, NH, NJ, NY, PA, RI,
VA). Proprietary study results are based on experiences and perceptions of consumers surveyed September 2010 -
July 2011. Your experiences may vary. Visit jdpower.com.
The Sunlight Advantage
New legislation signed by
Governor Christie in July
24
Clean energy investments contributed $20.8 million to NFE in the first nine months of fiscal 2012
Expected to contribute 15 to 25 percent of fiscal 2012 NFE
34MW of installed capacity; over 20,000 SRECs generated
Meaningful earnings growth opportunities
Competitively-priced electricity for customers
Strong legislative commitment to solar in NJ
Legislation designed to bring long-term stability to the state’s growing solar industry
Governor supports solar industry for environmental, job creation and energy cost benefits to New
Jersey
Renewable portfolio standard (RPS) significantly increased starting in energy year 2014
Solar alternative compliance payments (SACP) adjusted to better reflect current market
conditions
New Solar Legislation
25
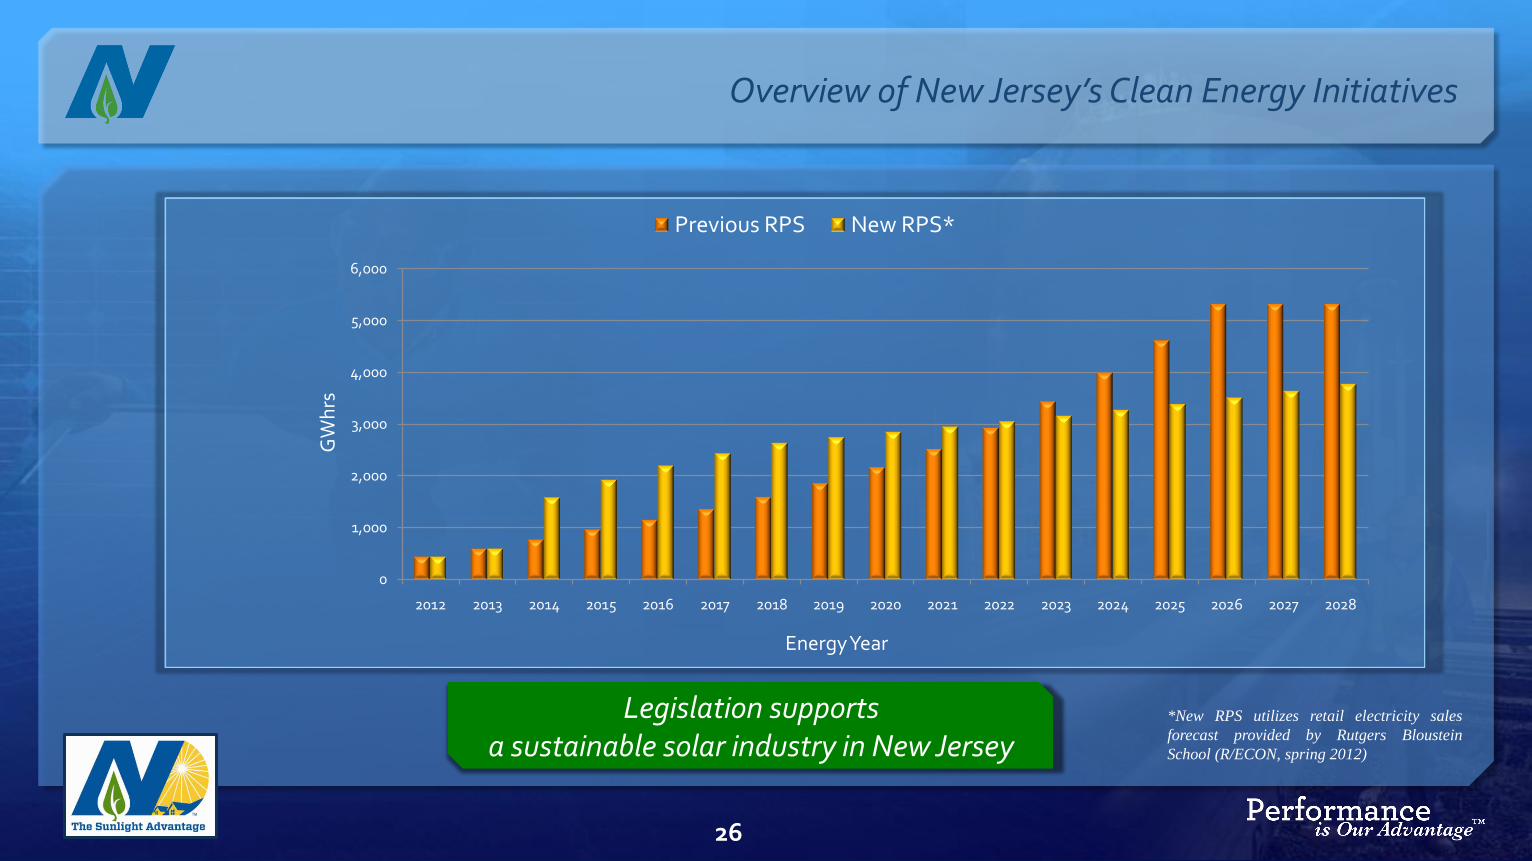
Overview of New Jersey’s Clean Energy Initiatives
Legislation supports a sustainable solar industry in New Jersey
26
0
1,000
2,000
3,000
4,000
5,000
6,000
2012 2013 2014 2015 2016 2017 2018 2019 2020 2021 2022 2023 2024 2025 2026 2027 2028
GW
hrs
Energy Year
Previous RPS New RPS*
*New RPS utilizes retail electricity sales
forecast provided by Rutgers Bloustein
School (R/ECON, spring 2012)
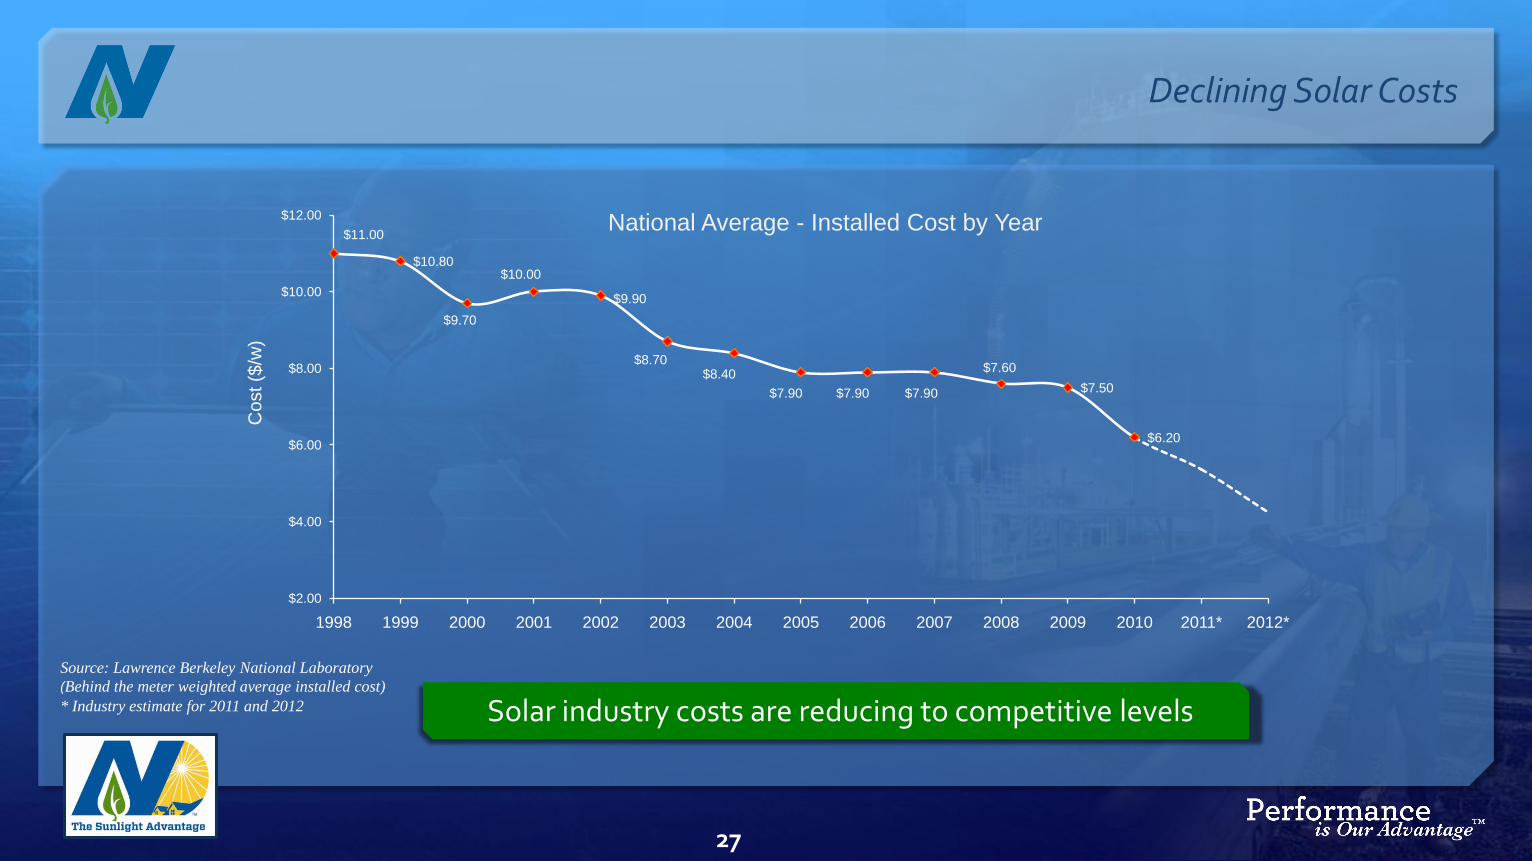
Declining Solar Costs
27
$11.00
$10.80
$9.70
$10.00
$9.90
$8.70 $8.40
$7.90 $7.90 $7.90
$7.60
$7.50
$6.20
$2.00
$4.00
$6.00
$8.00
$10.00
$12.00
1998 1999 2000 2001 2002 2003 2004 2005 2006 2007 2008 2009 2010 2011* 2012*
Co
st ($
/w)
National Average - Installed Cost by Year
Source: Lawrence Berkeley National Laboratory
(Behind the meter weighted average installed cost)
* Industry estimate for 2011 and 2012 Solar industry costs are reducing to competitive levels
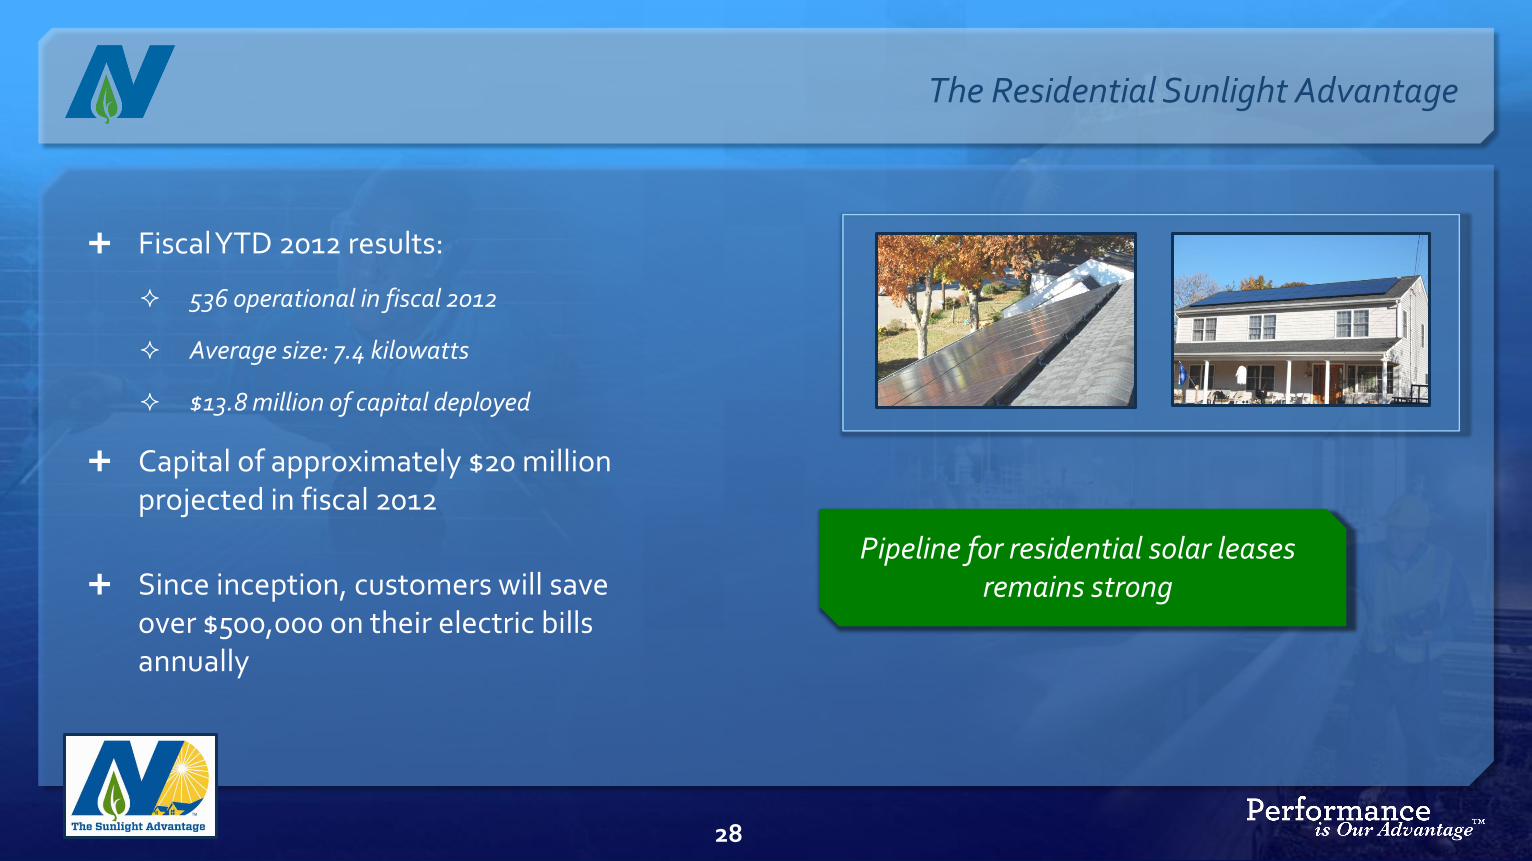
Fiscal YTD 2012 results:
536 operational in fiscal 2012
Average size: 7.4 kilowatts
$13.8 million of capital deployed
Capital of approximately $20 million projected in fiscal 2012
Since inception, customers will save over $500,000 on their electric bills annually
The Residential Sunlight Advantage
Pipeline for residential solar leases remains strong
28
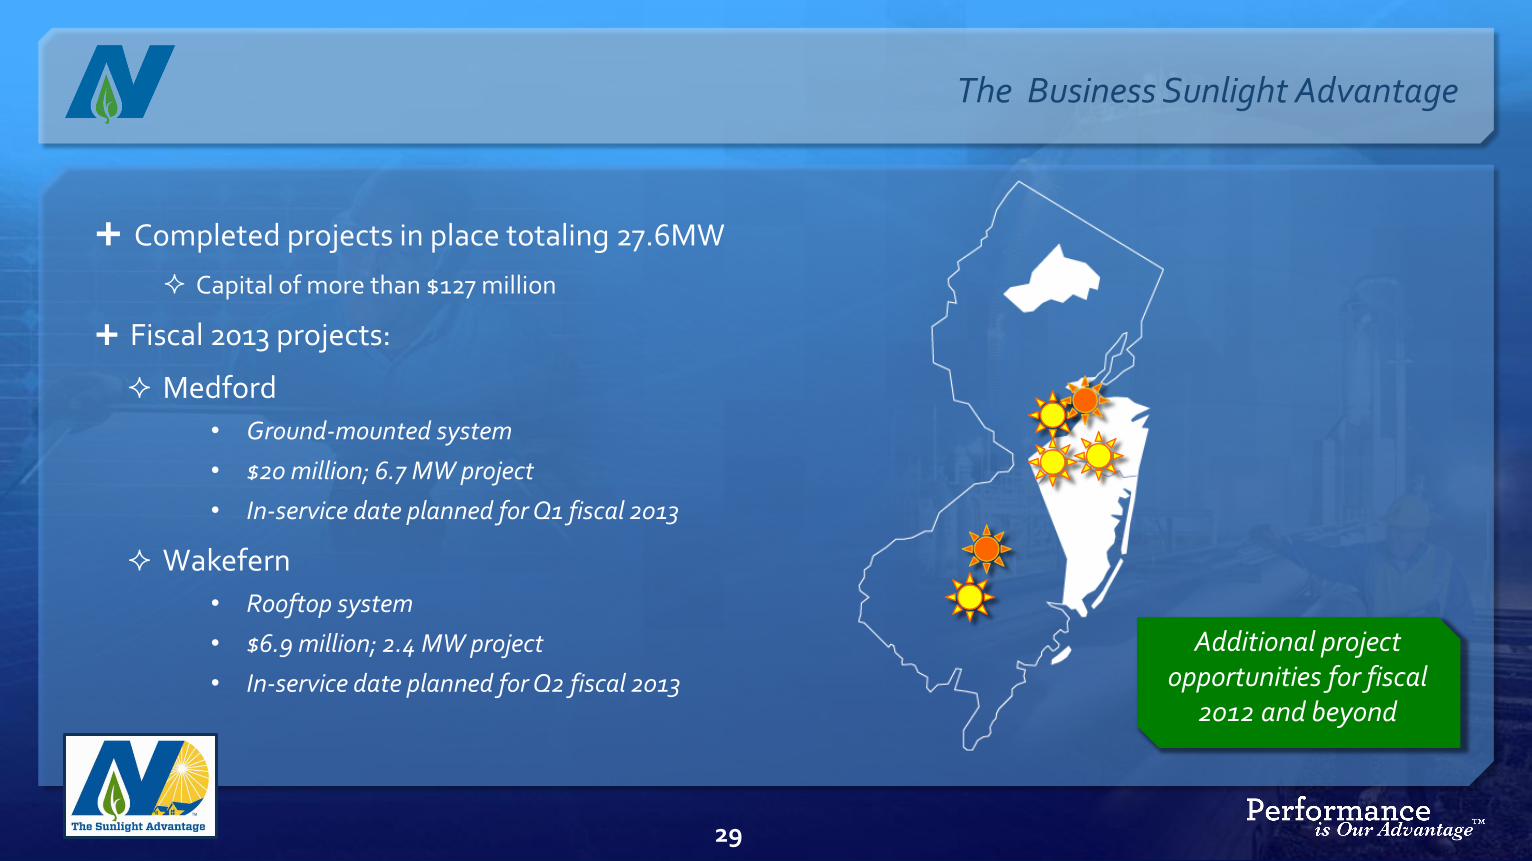
The Business Sunlight Advantage
Completed projects in place totaling 27.6MW
Capital of more than $127 million
Fiscal 2013 projects:
Medford
• Ground-mounted system
• $20 million; 6.7 MW project
• In-service date planned for Q1 fiscal 2013
Wakefern
• Rooftop system
• $6.9 million; 2.4 MW project
• In-service date planned for Q2 fiscal 2013
Additional project opportunities for fiscal
2012 and beyond
29
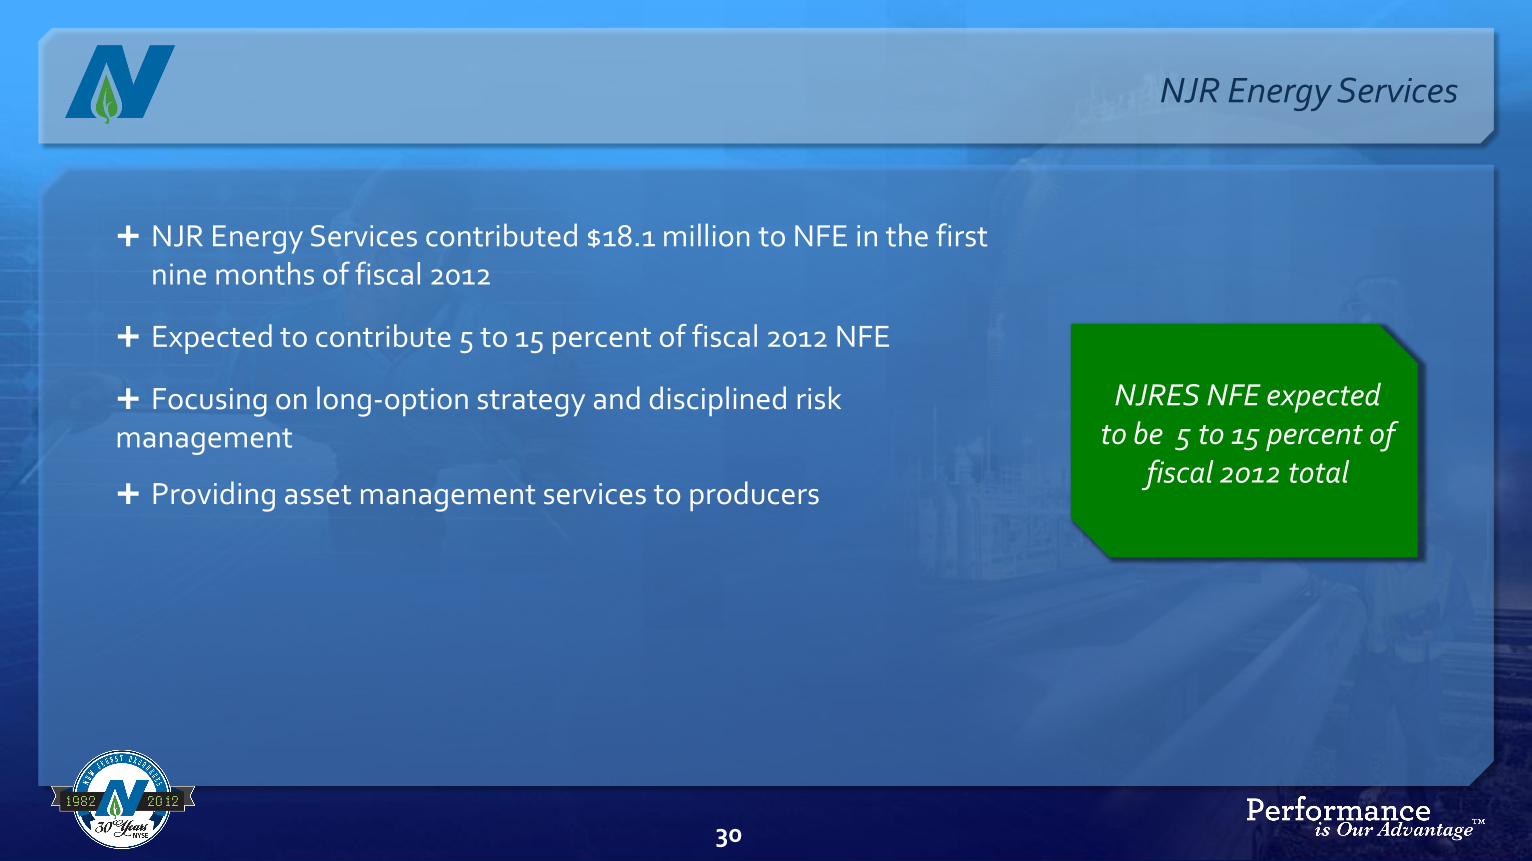
NJR Energy Services contributed $18.1 million to NFE in the first nine months of fiscal 2012
Expected to contribute 5 to 15 percent of fiscal 2012 NFE
Focusing on long-option strategy and disciplined risk management
Providing asset management services to producers
NJR Energy Services
NJRES NFE expected to be 5 to 15 percent of
fiscal 2012 total
30
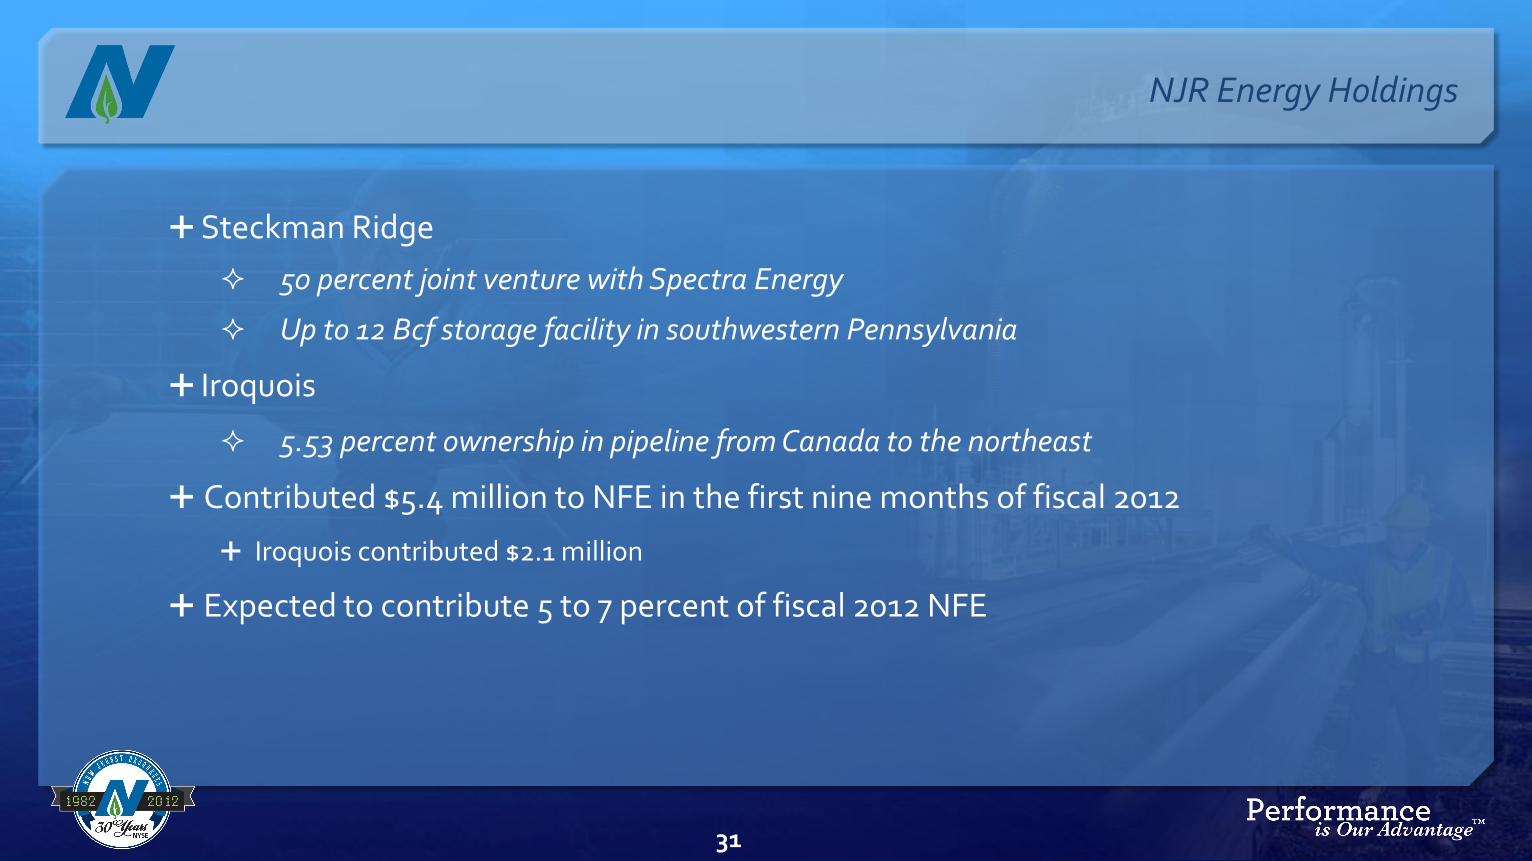
Steckman Ridge
50 percent joint venture with Spectra Energy
Up to 12 Bcf storage facility in southwestern Pennsylvania
Iroquois
5.53 percent ownership in pipeline from Canada to the northeast
Contributed $5.4 million to NFE in the first nine months of fiscal 2012
Iroquois contributed $2.1 million
Expected to contribute 5 to 7 percent of fiscal 2012 NFE
31
NJR Energy Holdings

Contributed $750,000 to NFE in the first nine months of fiscal 2012 vs. $568,000 last year, a 32 percent increase
Expected to contribute 2 to 4 percent of fiscal 2012 NFE
Pursing geographic expansion
Currently marketing in Sussex, Warren and Hunterdon counties
32
NJR Home Services
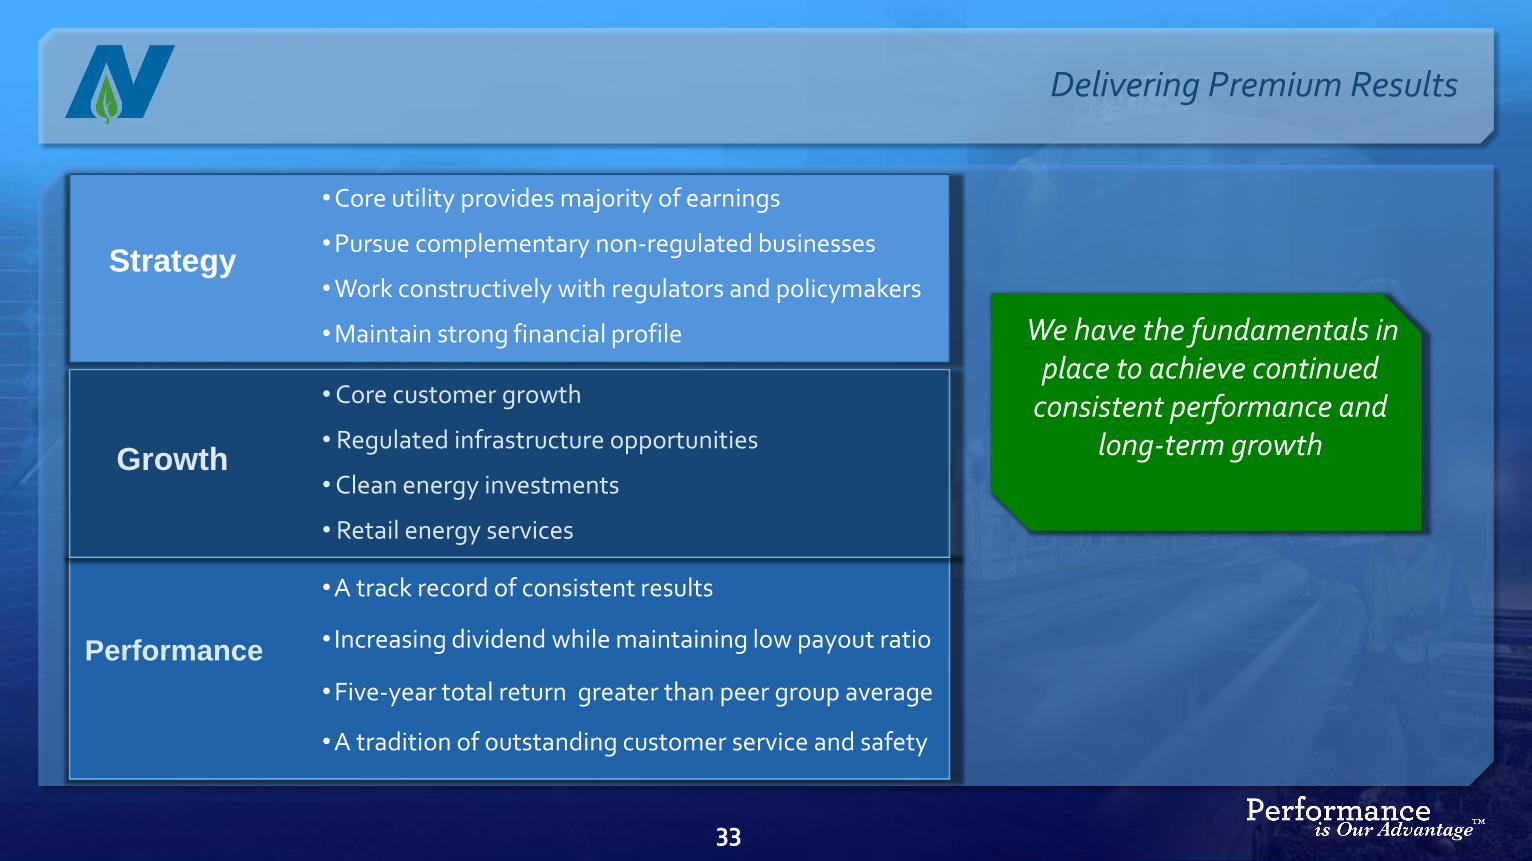
Strategy
Delivering Premium Results
Performance
Growth
We have the fundamentals in place to achieve continued
consistent performance and long-term growth
33
•Core utility provides majority of earnings
•Pursue complementary non-regulated businesses
•Work constructively with regulators and policymakers
•Maintain strong financial profile
•A track record of consistent results
• Increasing dividend while maintaining low payout ratio
•Five-year total return greater than peer group average
•A tradition of outstanding customer service and safety
• Core customer growth
• Regulated infrastructure opportunities
• Clean energy investments
• Retail energy services

New Jersey Resources3rd Quarter Fiscal 2012 Update
August 9,2012