automatic crash analysis system
TRANSCRIPT

Automatic Crash Analysis System
Anton Naumovich

About me
Anton NaumovichDevelopment Manager at LogicNowDeveloper at Microsoft (Hyper-V) in the pastSpecializing in performance, debugging, troubleshooting

Bad things happen

DivergenceCrashes Hangs
Overusage of processor and RAM
And more...

Large numbers

Sources of divergence
Developers’ mistakes
Thirdparty libraries issues
Environment diversity (software, hardware)

How to find the root cause?
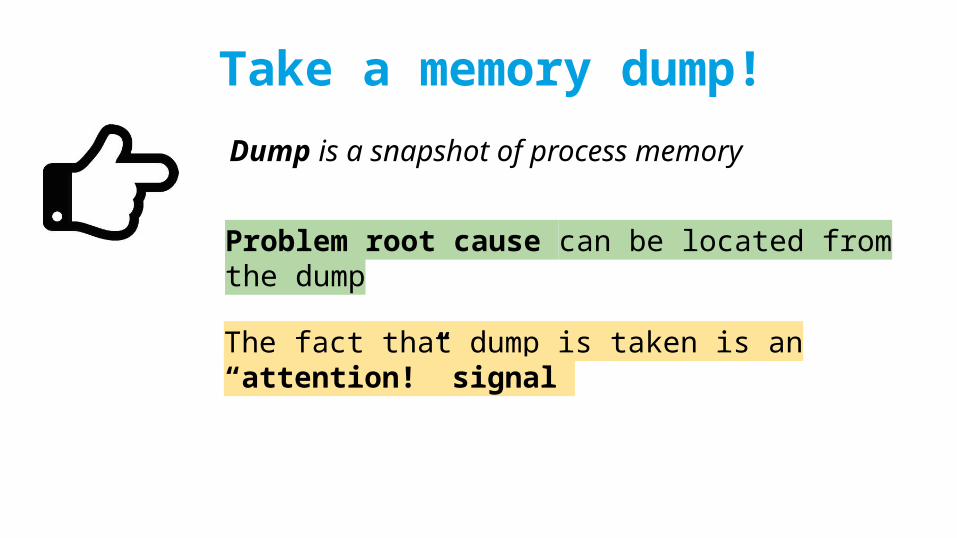
Take a memory dump!Dump is a snapshot of process memory
Problem root cause can be located from the dump
The fact that dump is taken is an “attention!” signal
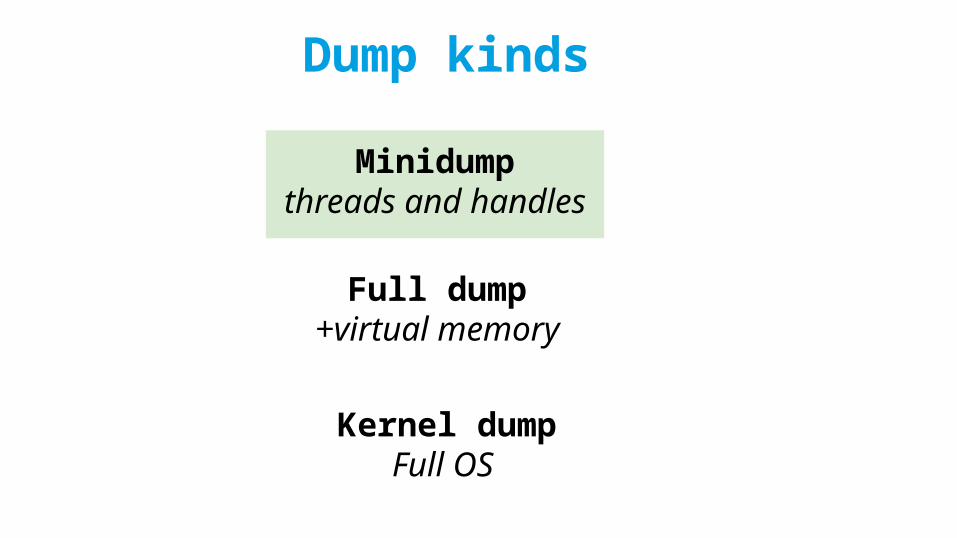
Dump kinds
Minidumpthreads and handles
Full dump+virtual memory
Kernel dumpFull OS
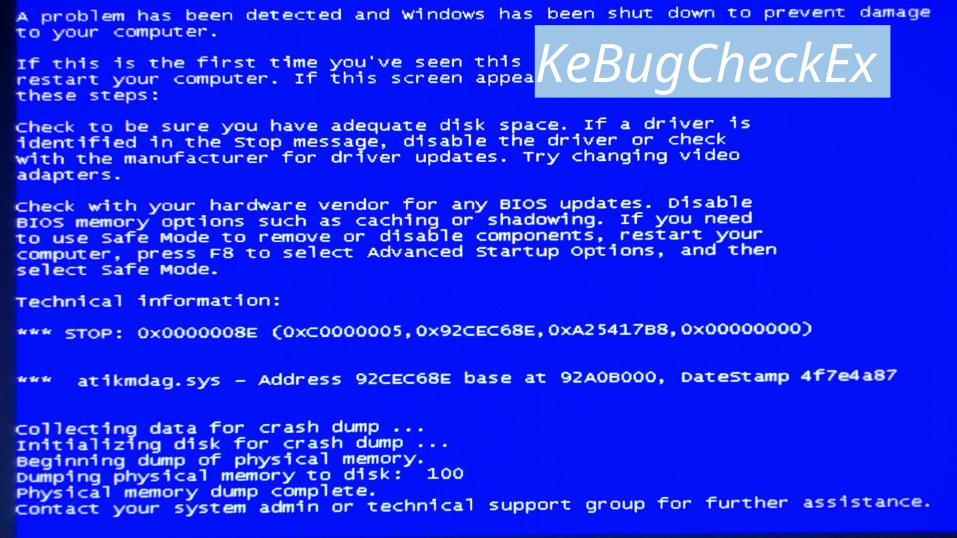
KeBugCheckEx

Taking a process dumpWe need a “non-involved” controller process
SuperController.exeController app
SuperApp.exeWorker app
Dump file
Monitoring
Taking dumps

Apps capable of taking dumps
Process Explorer (full, mini)
Task Manager (full)
ProcDump (full, mini, and much more)
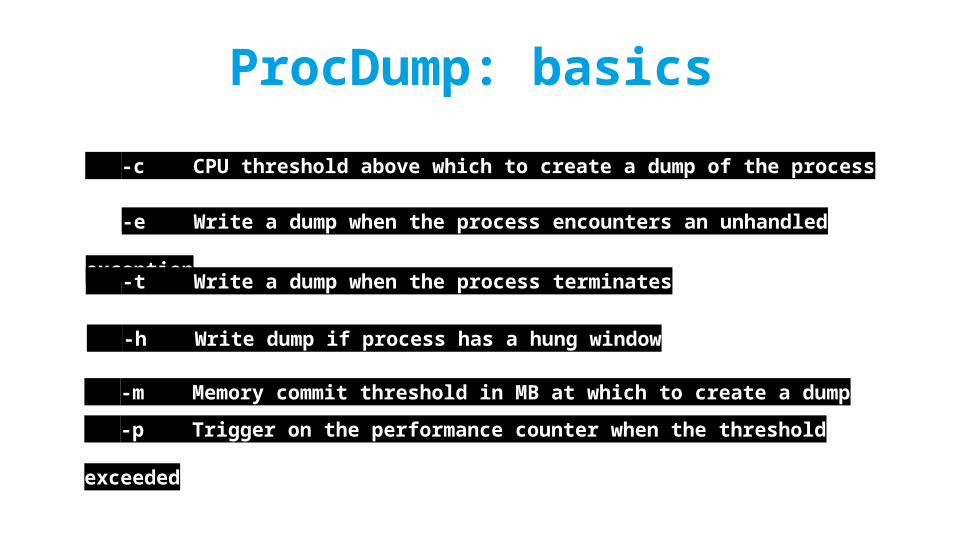
ProcDump: basics -c CPU threshold above which to create a dump of the process
-e Write a dump when the process encounters an unhandled
exception
-m Memory commit threshold in MB at which to create a dump
-t Write a dump when the process terminates
-h Write dump if process has a hung window
-p Trigger on the performance counter when the threshold
exceeded

ProcDump: advanced
-w Wait for the specified process to launch if it's not
running -s Consecutive seconds before dump is written (default is 10)
-n Number of dumps to write before exiting
-r Dump using a clone
-i Install ProcDump as the AeDebug postmortem debugger
-ma Write a dump file with all process memory

procdump: controlling apps
SuperApp.exeWorker app
procdump -c 30 SuperApp.exe
procdump -h SuperApp.exe
procdump -m 300 SuperApp.exe
procdump -t SuperApp.exe
procdump -p "\Process(SuperApp)\Handle Count" 1000 SuperApp.exe

Fetching info from the dump
Dump analysis is just static debugging
cdb.exe -y C:\lab -i C:\lab -z C:\lab\SuperApp.dmp -c "~*k;q" > C:\analysis.txt
Easily automatable:
Debugger
SuperApp.pdbDebugging
symbols
SuperApp.dmpMemory dump
SuperApp.exeApp executable

Analysis resultsIt’s all about thread stacks
008afcf0 MSVCP120!std::_Xout_of_range+0x36008fc86b SuperApp!WorkerProcessor::GetNextChunk+0x1e10061d914 SuperApp!WorkerProcessor::CalculateAverage+0x2020062875c SuperApp!WorkerModule::ProcessQueueEvent+0xdf0012877a SuperApp!WorkerModule::TakeSingleItem+0x54004dc89a SuperApp!WorkerModule::Run+0x6700bdc100 SuperApp!main+0x1955

Mission Control
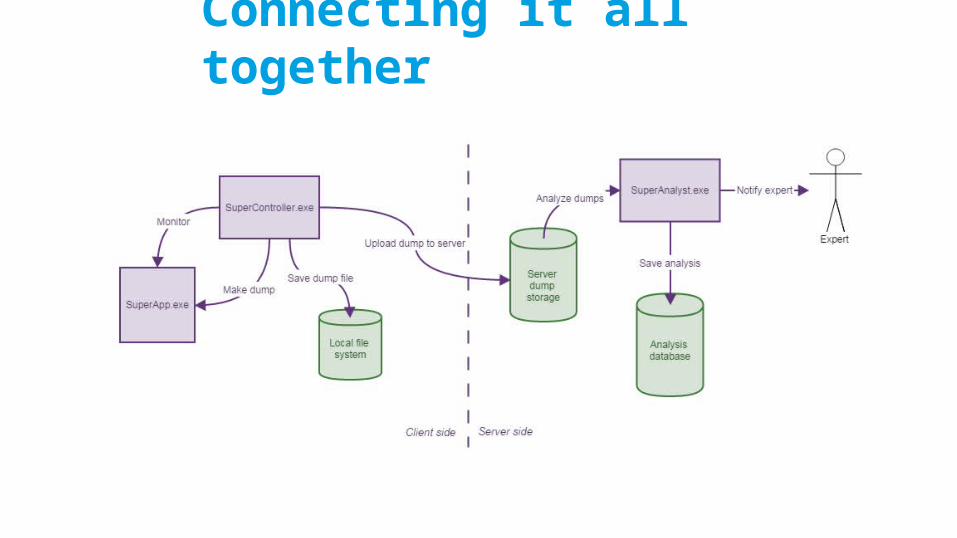
Connecting it all together
Key analysis features
Dump fuzzy matching and grouping by stack
Integration with issue tracking (Jira)
Analyze dump by user request
Notifications about new/critical problems
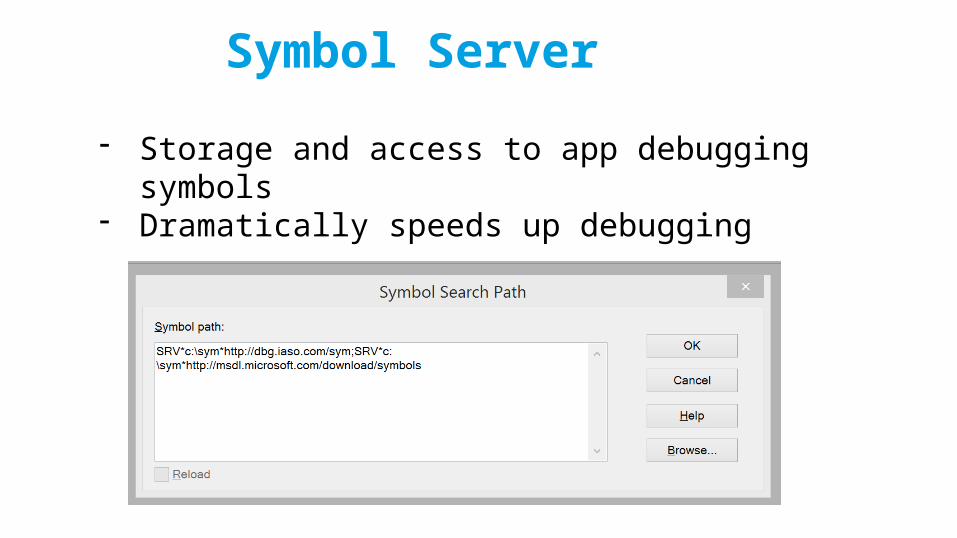
Symbol Server
- Storage and access to app debugging symbols- Dramatically speeds up debugging

Analogues
Windows Error Reportinghttp://msdn.microsoft.com/en-us/library/windows/desktop/bb513641(v=vs.85).aspx
Mozilla Crash Reporterhttps://support.mozilla.org/en-US/kb/mozillacrashreporter
Dr. Dumphttps://drdump.com/crash-reporting-system


What can you do tomorrow?
Setup symbol server (simply a shared folder)
Use a script to monitor problems and capture dumps
Use a script to analyze dumps
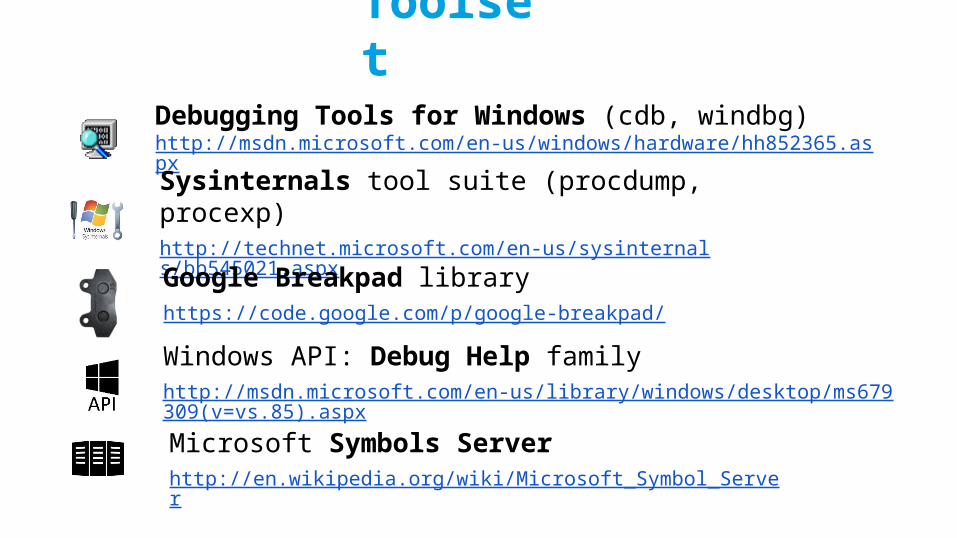
ToolsetDebugging Tools for Windows (cdb, windbg)http://msdn.microsoft.com/en-us/windows/hardware/hh852365.aspx
Sysinternals tool suite (procdump, procexp)http://technet.microsoft.com/en-us/sysinternals/bb545021.aspx
Google Breakpad libraryhttps://code.google.com/p/google-breakpad/
Windows API: Debug Help familyhttp://msdn.microsoft.com/en-us/library/windows/desktop/ms679309(v=vs.85).aspx
Microsoft Symbols Serverhttp://en.wikipedia.org/wiki/Microsoft_Symbol_Server

1. Speed up defect location2. Immediate reaction to critical problems3. Version quality indicators4. Improve stability
Profit
