axis bank project
DESCRIPTION
Capital structure of Axis, WACC, Dividend policy, intrinsic share value, Axis Bank, 2009-2010, 2010-2011TRANSCRIPT
!
!
!
!
!
!
!
!
!
Name: Akta Gupta
GDGWI ID: 100100
Course: BBA Business Studies
Module: Principles of Finance
Module Code: ACF214
Module Leader: Mr. Ajay Kumar Yadav
Semester: IV
Cohort: 2010-2013
!
Principles*of*Finance*Individual*Essay*
Financial*Management*Practices*in*India*
*
Axis*Bank*Ltd.*

Financial!Management!Practices!in!India!2!Axis!Bank!100100!
!
2!
Table o f Contents
A Company Overview…………………………………………………..……………3
Capital Structure……………………………………………………………………. 4
Weighted Average Cost of Capital………………………………………………….6
Dividend Policy…………………………………………………………………….....9
Axis Bank Announcements…………………………………………………………11
Intrinsic Share Value……………………………………………………………….13
Bibliography……………………………...…………………………………………14
Appendix 1…………………………………………………………………………..16
!

Financial!Management!Practices!in!India!2!Axis!Bank!100100!
!
3!
A Company Overv iew
After the government of India permitted the establishment of private sector banks in 1994, Axis Bank (formerly known as UTI, Union Trust of India) was the first to come into existence. The Unit Trust of India (UTI-I), Life Insurance Corporation of India (LIC) and General Insurance Corporation of India (GIC) and other four PSU insurance companies, i.e. National Insurance Company Ltd., The New India Assurance Company Ltd., The Oriental Insurance Company Ltd. and United India Insurance Company Ltd. jointly promoted the administration of the bank. Axis Banks’s shares are listed in the NSE (AXISBANK) and the BSE (532215).
The products and services provided by the bank deal with Personal Banking, Corporate banking, Priority Banking and NRIs. It is the third largest private sector bank in India that offers a wide variety of products and services of almost all-banking nature to large and Mid-Corporate, SME, Agriculture, Retail Businesses and individuals.
Mr. Adarsh Kishore leads the bank by being the Chairman and Mrs Shikha Sharma is the MD and CEO of Axis Bank with its registered office in Ahmedabad, India and its central office is located in Mumbai, India. As on 31st March 2011, it has webbed to a wide network of about 1281 branches including the 169 service branches/CPCs with 7591 ATMs as on 30th September 2011.
By, 31st December 2011, the bank had capitalized to ` 412.57 crores with the public holding (other than promoters and GDRs) at 53.63%.
Some of the recent achievements of Axis Bank are:
• “Bank of the Year –India” award - 2011 by the UK magazine “The Banker” • “Most Consistent Large Bank” award – 2011 by Business Today- KPMG Best
Banks study • “Fastest Growing Large Bank” award- 2009 and 2010 by Business World, Best
Bank Awards • “Best Bank 2009” by the ET Intelligence Group • “Best Private Bank” D & B Best Bank Awards 2009 • “The Best of Asia Pacific’s Biggest Listed Company: - 2009 by Forbes Fab 50
Also, Mrs. Shikha Sharma, MD & CEO of Axis Bank won the “Innovative Banker” award in 2010.
Financial!Management!Practices!in!India!2!Axis!Bank!100100!
!
4!
Capital Structure
In theory, the term “capital structure” means the mix of long-term debt, specific short-term debt, common equity and preferred equity. It is how a firm would finance its overall operations and growth by using different sources of above.
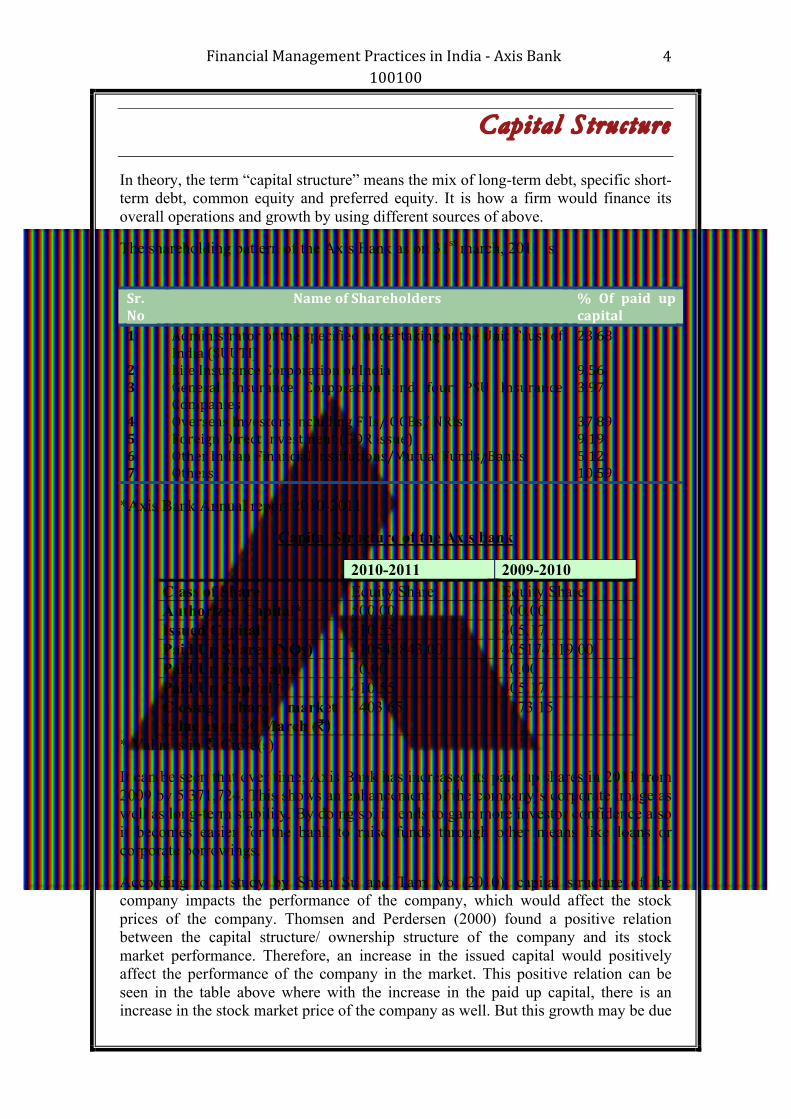
The shareholding pattern of the Axis Bank as on 31st march, 2011 is,
*Axis Bank Annual report 2010-2011
Capital Structure of the Axis bank
2010-2011 2009-2010 Class of Share Equity Share Equity Share Authorized Capital* 500.00 500.00 Issued Capital* 410.55 405.17 Paid Up Shares (NOs) 410545843.00 405174119.00 Paid Up Face Value 10.00 10.00 Paid Up Capital* 410.55 405.17 Closing share market value as on 30 March (`)
1403.65 1173.15
* Value is in `. Crore(s)
It can be seen that over time, Axis Bank has increased its paid up shares in 2011 from 2009 by 5,371,724. This shows an enhancement of the company’s corporate image as well as long-term stability. By doing so, it tends to gain more investor confidence also it becomes easier for the bank to raise funds through other means like loans or corporate borrowings.
According to a study by Shian Su and Tam Vo (2010), capital structure of the company impacts the performance of the company, which would affect the stock prices of the company. Thomsen and Perdersen (2000) found a positive relation between the capital structure/ ownership structure of the company and its stock market performance. Therefore, an increase in the issued capital would positively affect the performance of the company in the market. This positive relation can be seen in the table above where with the increase in the paid up capital, there is an increase in the stock market price of the company as well. But this growth may be due
Sr.*No*
* Name*of*Shareholders* * %* Of* paid* up*capital*
1* Administrator!of!the!specified!undertaking!of!the!Unit!Trust!of!India!(SUUTI)!
23.68!
2* Life!Insurance!Corporation!of!India! 9.56!3* General! Insurance! Corporation! and! four! PSU! Insurance!
Companies!3.97!
4* Overseas!Investors!including!FIIs/!OCBs/!NRIs! 37.89!5* Foreign!Direct!Investment!(GDR!issue)! 9.19!6* Other!Indian!Financial!Institutions/Mutual!Funds/Banks! 5.12!7* Others!! 10.59!
Financial!Management!Practices!in!India!2!Axis!Bank!100100!
!
5!
to or hindered by macroeconomic forces like market growth, market downturn or the volatility of the market.
When someone would refer to the capital structure, they would tend to refer to the firm’s debt-to-equity ratio that would provide an insight into how risky a business would be.
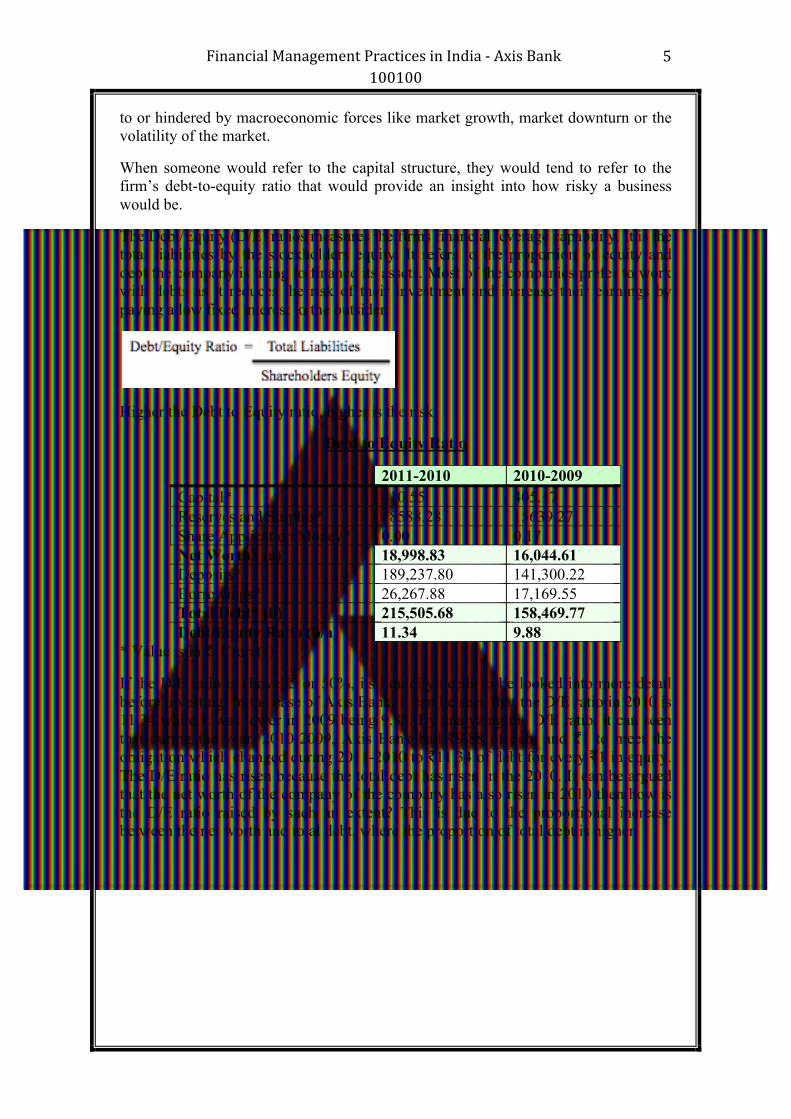
The Debt/Equity (D/E) ratios measures the firms financial leverage capability. It is the total liabilities by the stockholders equity. It refers to the proportion of equity and debt the company is using to finance its assets. Most of the companies prefer to work with debts as it reduces the risk of their investment and increase their earnings by paying a low fixed interest to the outsider.
Higher the Debt to Equity ratio, higher is the risk.
Debt to Equity Ratio
2011-2010 2010-2009 Capital* 410.55 405.17 Reserves and Surplus* 18588.28 15639.27 Share Application Money* 0.00 0.17 Net Worth* (a) 18,998.83 16,044.61 Deposits* 189,237.80 141,300.22 Borrowings* 26,267.88 17,169.55 Total Debt* (b) 215,505.68 158,469.77 Debt/Equity Ratio (b/a) 11.34 9.88
* Value is in `. Crore(s)
If the D/E ratio is above .5 or 50%, its liquidity needs to be looked into more detail before investing. In the case of Axis Bank, it can be seen that the D/E ratio in 2010 is 11.34 while it was lower in 2009 being 9.88. By analyzing the D/E ratio, it can seen that during the year, 2010-2009, Axis Bank had `9.88 of debt and `1 to meet the obligation which changed during 2011-2010 to `11.34 of debt for every `1 in equity. The D/E ratio has risen because the total debt has risen in the 2010. It can be argued that the net worth of the company of the company has also risen in 2010 then how is the D/E ratio raised by such an extent? This is due to the proportional increase between the net worth and total debt, where the proportion of total debt is higher.
Financial!Management!Practices!in!India!2!Axis!Bank!100100!
!
6!
Weighted Average Cost o f Capita l (WACC)
Weighted average cost of capital (WACC) is the firm’s cost of capital, where, each category of the capital is proportionately weighted. All the sources of capital, like the common stock, preferred stock, bonds and any other long-term debt is included in this calculation. All else equal the WACC of a firm increases as the beta and the rate of return on the equity increases, as an increase in WACC notes a decrease in valuation and a higher risk.
Formula to calculate WACC:
WACC= we × re + wp × rp + wd × rd (1-tax rate)
we =proportion of equity
re =cost of equity
wp =proportion of preference capital
rp =cost of preference capital
wd=proportion of debt
rd=cost of debt
In the case of Axis bank, it does not issue preference shares, due to which there is no preference capital. Due to this, the WACC formula applying to Axis bank is,
WACC=we × re + wd × rd (1-tax rate)
Cost of Equity:
The cost of equity for any company is the rate of return, which is both, the dividend and the capital gains on investment that the company’s shareholders require. The cost of equity tends to reflect the opportunity cost of investment for individual shareholders. The cost of equity would differ in every company, which is due to the differences in business risk and the financial risk in different companies.
To calculate the cost of equity, we use the capital asset pricing model (CAPM). It is a model used in finance to calculate the theoretical appropriate price of an asset such as a security.
CAPM= Rf+β (Rm-Rf)
Rf= risk free return
β= market risk factor
Rm=Average return of market
Rick free return is the return that is the lowest possible return on any investment. These are generally the government securities, which are least risky.

Financial!Management!Practices!in!India!2!Axis!Bank!100100!
!
7!
Here for the calculation for the cost of equity, we assume the risk free rate of return (Rf) as 4% or .04.
β (Beta) is the sensitivity to market risk.
To calculate the β, the slope of the return on the axis bank (NSE) and return on nifty was used dated from 2nd march 2010 to 28th February.
By calculating using Microsoft Excel,
The β is 0.62323276.
Market return (Rm) was computed by adding the Nifty returns dated from 2nd march 2010 to 28th February 2011. This was done in excel.
= 0.0755416
Cost of Equity:
Market Return Rm 0.0755416 Risk free market return Rf 0.04 Sensitivity to market risk β 0.62323276 CAPM or Cost of Equity [Rf+β (Rm-Rf)] Re 0.0621507
Cost of Debt:
The cost of debt is the rate of interest, which the company pays to the stakeholders who provide capital to the company for a fixed return to them. So it is the effective rate the company pays on its current debt.
The cost of debt is calculated by using the formula,
(Interest expenses ÷ previous years’ total debt)
=151548058000÷2155056800000 =0.0703
The tax rate for any company earning higher than `10,00,000 is 30%, due to this the tax rate for Axis bank is 30%.
WACC
Pre-Tax WACC
Source of Capital Cost of Capital Weights Weighted cost Debt 0.0703 0.91898 0.064604294 Equity 0.0621507 0.08102 0.005035449 WACC 0.06963 6.963% approx By the calculations in the above table, it can be seen that Axis Bank would have to earn an expected return of about 6.93% is there was no tax applicable, to generate a positive cash flow and have a positive net present value for the investors.

Financial!Management!Practices!in!India!2!Axis!Bank!100100!
!
8!
Post Tax WACC
Source of Capital Cost of Capital Weights Weighted cost Debt (1-tax rate) 0.0703 (1-0.30)= 0.04921 0.91898 0.045223 Equity 0.0621507 0.08102 0.005035 WACC 0.050258 5.03% approx
It can be seen that Axis bank needs to generate an expected return higher than 5.03% (WACC) to generate an additional cash flow and have a positive net present value for stockowners if a tax rate of 30% was applicable on the debt. Axis Bank’s investments that earn less than a 5.03% should be avoided as it reduces the stockholder’s value and also dilute the value of the company. Also it can be seen that by using outsider’s funds (debt) to make the company grow, the WACC is lower than it would be without tax. Therefore, by using others money would need the company to earn a low expected return.
It can be known that with a lower WACC, the expected return is lower, due to which the company can be valued at a higher price. This valuation will result in increasing the stock prices for the company. Therefore, it can be said that with a lower WACC, the stock value of the company is higher; they are inversely proportional to each other. A higher WACC makes the company and the investments unattractive as the company’s minimum return to make a profit or to break even is high, which at times maybe unachievable.

Financial!Management!Practices!in!India!2!Axis!Bank!100100!
!
9!
Dividend Pol i cy
A distribution of the company’s earnings, which is decided by the board of directors, that needs to be given to the shareholders for investing in the company is known as the dividend of the company. This can be in the form of cash, stock or more shareholding options.
Axis bank distributes dividends to its investors every year in the form of cash and shares their growth with the shareholders in the same way.
Over the last few years, the profits, in the form of dividends, which Axis Bank has shared with its investors, are as follows,
Dividend per Share
2010-2011 2009-2010 2008-2009 2007-2008 2006-2007 Face Value of the Share (`)
10.00 10.00 10.00 10.00 10.00
Dividend per share (`)
14.00 12.00 10.00 6.00 4.50
Dividend percentage
140% 120% 100% 60% 45%
It can be seen that Axis bank, in the year 2010, paid a dividend of `12 per share that accounted for 120% of the share face value. This was seen to rise in 2011 where the investors received an increase in 20% of the dividend face value as dividend, totally to 140% or `14. Overtime, Axis bank has seen to distribute an increasing rate of dividend to its investors. This will not only motivate the investors’ to stay with Axis bank and invest more, but this increase in the dividend shared will influence potential investors to investor with Axis bank to increase their profits.
To see the policy Axis bank might consider at the time of distributing dividends, we take into consideration the dividend payout ratio.
Dividend payout ratio= dividend per share ÷ earnings per share
The dividend payout ratio is the percentage of earnings that is paid to the shareholders in the form of dividends. This shows how well the earnings support the dividend payments in the company.
Earnings per share (EPS) are the amount of earnings for each share that is outstanding of the company’s stock.

Financial!Management!Practices!in!India!2!Axis!Bank!100100!
!
10!
Dividend Payout Ratio
2010-2011 2009-2010 2008-2009 2007-2008 2006-2007 Dividend per share (`)
14 12 10.00 6.00 4.50
Earnings per share (EPS)(`)
82.54 62.06 50.57 29.94 23.40
Dividend payout ratio
0.1696 16.96%
0.1933 19.33%
0.1977 19.77%
0.2004 20.04%
0.1923 19.23%
In the table above, we see that until the year 2010, the company issued a similar or close ratio of dividend payout, varying between 0.1923 and 0.2004. Since the difference between the dividend payout ratios is not high, we can say that Axis bank gave a standard or a similar rate as dividend to it investors until 2010, having a standard dividend policy.
But in 2011, it can be seen that the dividend payout ratio has fallen to 16.96%, which is a huge difference as compared to the previous years. This could be because the company in 2011 has incurred a high debt as compared to 2010. The increase in debt could have been a reason due to which the dividend payout ratio has reduced by a certain percentage. This in turn has reduced the profitability of Axis Bank, which might affect the future investments.
Also, there is a possibility that Axis bank is planning on future investments that could have reduced the present dividend payout, as it would desire to keep the income for the new project, which in the long term may benefit the shareholders of Axis Bank.
Through this we can conclude that Axis bank keeps into consideration the financial position of the company before declaring dividends and do not always pay dividends on a fixed value, which it might have done initially.
The affect of the dividend paid would affect the share price of the company as investors join hands with the company in order to earn profits and other benefits. If the company distributes a higher dividend, more investors will join the company. This will increase the equity held with the company thus increasing the share price as now the company would be valued at a higher price.

Financial!Management!Practices!in!India!2!Axis!Bank!100100!
!
11!
Axis bank Announcements
Axis Bank Ltd. merges with Enam Securities
Axis Bank Ltd., one of India’s top-ranked banks announced its merger with the Enam Group on the 17th November 2010. This was the first major acquisition of Axis Bank after Shikha Sharma (MD & CEO) took her position in Axis Bank. The valuation of this transaction was `2,067 crore ($455 million) in stock. By this transaction, Axis bank’s wholly owned subsidiary Axis Securities and Sales (ASSL) will acquire Enam securities investment banking and capital market transactions’ business.
Through this deal, the shareholders of Enam securities received 5.70 shares of Axis bank for every 1 share of Enam that they held. Axis Bank through this exchanged 1.38 crore shares to Enam shareholders resulting in an ownership of 3.37% in Axis Bank.
A unique feature of this deal was that there was no cash involved. This was an all-stock deal. No capital gain tax was levied for this transaction. Mr. Vallabh Bhansali who was the promoter of Enam Securities will now be a part of the Axis Bank’s board.
The reason behind Axis Bank indulging in this deal was to get access to a larger market capital. Through this deal Axis Bank Ltd. tried to enter the equity capital market related business where is was virtually absent and merging with Enam securities, which was leading the market would give them an advantage in the same. According to this deal, now Axis bank would manage Axis Bank’s investment banking along with the advisory service of Enam Securities. Along with this, Axis bank would manage Enam securities institutional and retail equities units and its non-banking finance company but not its portfolio management service and asset management units. Also, Axis Bank could use Enam’s brand name for 2 years.
Other benefits that Axis Bank would experience due to this merger are that, Axis Bank could take an advantage of the Enam Securities’ internet banking business along with its strong hold in the retail and institutional broking business. Axis Bank can now have an access to Enam’s clientele that would help it cross sell its own banking services and products, thus have a larger customer base. Also, it can provide a complete portfolio of financial services to it clients, which would increase its revenue.
What Axis Bank believed to be a deal which would give it a larger access to the markets and give it a stronger foothold in the financial industry, was believed to be a deal where Axis Bank paid a bit too much to Enam for the business services by its investors. This was because the book value of Enam Securities was `274 crore while Axis Bank paid `2067 crore for it, accounting for its intangible worth.
As a part of this deal, Enam would transfer 400 employees and net current assets worth `300 crore to Axis Bank.
The lack of trust in this merger by the investors dropped the value of the shares by 3% the day after this merger news was announced (18th November 2010) followed by a

Financial!Management!Practices!in!India!2!Axis!Bank!100100!
!
12!
2.7% drop the next day. This fall in share price could indicate a dilution in the value of the company.
Also, a study by the Keynote Capitals Institutional Research analyzed the merger and estimated the fall in the earnings per share (`) from 95.33 in FY12 to 93.37 in FY12.
This merger does have some risks that Axis Bank would be concerned in, which is the threat of competitors. The competition from the other private sector banks would affect the profitability and thus reduce the market share in future. Also, the restructuring of the company could have a negative impact on the profitability.
This merger took place accounting for the long-term profitability of having Enam associated with Axis Bank whose affect will be seen in the coming years.

Financial!Management!Practices!in!India!2!Axis!Bank!100100!
!
13!
Intr ins i c Share Value
The intrinsic value of the share is the actual value of the company as opposed to the market price or book value. This value would include values of the company that are intangible such as brand name, trademarks and also copyrights. The intrinsic value is at times difficult to calculate and not correctly shown in the market price of the firm. In other words, we could say that the intrinsic value of the share is the value the investors would be willing to pay for the share.
This intrinsic value can be computed by using the CAPM method.
Intrinsic value of the share = book value × CAPM
CAPM= Rf+β (Rm-Rf)
Rf= risk free return
β= market risk factor
Rm=Average return of market
Market Return Rm 0.0755416 Risk free market return Rf 0.04 Sensitivity to market risk β 0.62323276 CAPM or Cost of Equity [Rf+β (Rm-Rf)] Re 0.0621507
2010-2011 2009-2010 CAPM 0.0621507 0.0621507 Book Value (`) 462.77 395.99 Intrinsic value per share (`) 28.761 24.611
In the above calculation, it can be seen that in the year 2009-2010 the investors are willing to pay a maximum of ` 24.611 for every share which in the year 2010-2011 increases to ` 28.76 per share. Through this we can say that the company is growing as the intrinsic values of the share is increasing.
Through this analysis it can be seen that over the past two years, the value of Axis Bank Ltd. has risen, both in terms of book value and market value.

Financial!Management!Practices!in!India!2!Axis!Bank!100100!
!
14!
Bibl iography
A day after Enam deal, Axis Bank falls 2.7% - Economic Times. 2012. A day after Enam deal, Axis Bank falls 2.7% - Economic Times. [ONLINE] Available at: http://articles.economictimes.indiatimes.com/2010-11-19/news/27593803_1_axis-bank-banking-stocks-enam-deal. [Accessed 24 March 2012].
Axis Bank Acquired Enam Securities. 2012. Axis Bank Acquired Enam Securities. [ONLINE] Available at: http://www.jagranjosh.com/current-affairs/axis-bank-acquired-enam-securities-1290085207-1. [Accessed 24 March 2012].
Axis Bank investors frown at Enam buy | Indiabusinessview. 2012. Axis Bank investors frown at Enam buy | Indiabusinessview. [ONLINE] Available at: http://www.indiabusinessview.com/news/832/axis-bank-investors-frown-enam-buy. [Accessed 24 March 2012].
Axis Bank, 2011. Annual report 2010-2011. Mumbai: Axis Bank.
Axis Bank - About Us. 2012. Axis Bank - About Us. [ONLINE] Available at: http://www.axisbank.com/about-us/about-axis-bank.aspx. [Accessed 24 March 2012].
Calculating the WACC. 2012. Calculating the WACC. [ONLINE] Available at: http://www.valuepro.net/approach/wacc/wacc.shtml. [Accessed 24 March 2012].
Capital Structure Definition | Investopedia . 2012. Capital Structure Definition | Investopedia . [ONLINE] Available at: http://www.investopedia.com/terms/c/capitalstructure.asp#axzz1pdJUPPCK. [Accessed 24 March 2012].
Debt to Equity Ratio|Definition|Formula|Calculation|Example|Significance. 2012. Debt to Equity Ratio|Definition|Formula|Calculation|Example|Significance. [ONLINE] Available at: http://www.accountingformanagement.com/debt_equity_ratio.htm. [Accessed 25 March 2012]
Misra, A., Srivastav, R., 2011. Financial Management. 2nd ed. India: Oxford Higher Education.
Shah, H., 2011. Axis Bank Ltd. Mumbai: Keynote Capitals Ltd.

Financial!Management!Practices!in!India!2!Axis!Bank!100100!
!
15!
Shian Su, G. Tam Vo, H., 2010 The Relationship Between Coporate Strategy, Capital Structure and Firm Performance: An empirical Study of the Listed Companies in Vietnam. [ONLINE] Available at: http://www.eurojournals.com/irjfe_50_06.pdf. [Accessed 25 March 2012].
Weighted Average Cost Of Capital (WACC) Definition | Investopedia . 2012. Weighted Average Cost Of Capital (WACC) Definition | Investopedia . [ONLINE] Available at: http://www.investopedia.com/terms/w/wacc.asp. [Accessed 24 March 2012].

Financial!Management!Practices!in!India!2!Axis!Bank!100100!
!
16!
Appendix 1
Axis Bank Balance Sheet
March 2011 March 2010 Capital and Liabilities (` crore) Total Share Capital 410.55 405.17 Equity Share Capital 410.55 405.17 Share Application Money 0.00 0.17 Preference Share Capital 0.00 0.00 Reserves 18,588.28 15,639.27 Revaluation Reserves 0.00 0.00 Net Worth 18,998.83 16,044.61 Deposits 189,237.80 141,300.22 Borrowings 26,267.88 17,169.55 Total Debt 215,505.68 158,469.77 Other Liabilities & Provisions 8,208.86 6,133.46 Total Liabilities 242,713.37 180,647.84 Assets (` crore) Cash & Balances with RBI 13,886.16 9,473.88 Balance with Banks, Money at Call 7,522.49 5,732.56 Advances 142,407.83 104,343.12 Investments 71,991.62 55,974.82 Gross Block 3,426.49 2,107.98 Accumulated Depreciation 1,176.03 942.79 Net Block 2,250.46 1,165.19 Capital Work In Progress 22.69 57.24 Other Assets 4,632.12 3,901.06 Total Assets 242,713.37 180,647.87 Contingent Liabilities 429,069.63 296,125.58 Bills for collection 57,400.80 35,756.32 Book Value (`) 462.77 395.99