bn 2007 - 2014 operating budget savings final
TRANSCRIPT

Josie La Vita Director
Roberto Rossini
DCM & Chief Financial Officer Financial Planning City Hall, 7th Floor, East Tower 100 Queen Street West Toronto, ON M5H 2N2
Tel: 416 397-4229 Fax: 416 397-4465 [email protected]
2014 OPERATING BUDGET BRIEFING NOTE 2007– 2014 Budget Reductions and Other Budget Balancing Strategies
Background Budget Context – Post Amalgamation
Municipalities typically face challenges in balancing their annual operating budgets, however the
problem in Toronto intensified in the 1990s due to the impact of the Province downloading social
services costs to the City. These added pressures included funding responsibilities for social
housing, disability and drug benefits, all emergency services and public health, as well as
operating and capital grant funding for the Toronto Transit Commission. Since amalgamation in
1998, the Province did effectively acknowledge the impact on Toronto by implementing GTA
social services pooling of funding and providing several one-time assistance for transit needs
until 2010.
Long Term Fiscal Plan
In 2005, Council approved the City's Long Term Fiscal Plan (LTFP) which identified a number of
key financial issues that negatively impacted the City's finances and recommended strategies to
help ensure the City's long-term financial sustainability. On the expenditure side, the City had a
higher social services cost structure than other municipalities in the rest of the GTA due to
higher service needs (e.g., 90% of all public housing in the GTA is located in Toronto). On the
revenue side, the City lacked adequate and sustainable revenue sources to fund its municipal
responsibilities (e.g., existing transit operations, capital maintenance, expansion and social
housing).
The LTFP consisted of a two-pronged approach to reduce and eventually eliminate the City's
fiscal gap: reduce spending and protect, grow and diversify City revenues.
Revenues
Spending
Beginning Funding Gap Gap eliminated

2
Provincial-Municipal Fiscal and Service Delivery Review ("PMFSDR") Social Services Upload
In 2006, the Province initiated the Provincial-Municipal Fiscal and Service Delivery Review
which resulted in the Ontario Government uploading provincial program costs related to social
assistance, drug and disability benefits, and court security services.
City of Toronto Act Revenues
The City of Toronto Act went into effect on January 1, 2007, giving the City limited authority to
impose new taxes. The Act recognized the need for the City of Toronto to diversify and grow its
revenues. The Municipal Land Transfer Tax (MLTT) was implemented in 2008 and became the
most significant new source of revenue for the City since the City started receiving a share of
federal and provincial gas tax revenues in 2005. While the City also introduced the Personal
Vehicle Tax (PVT) in 2008, it was terminated in 2011.
Service Review Program
In an effort to mitigate operating budget pressures and eliminate the reliance on one-time
revenue sources, the City initiated a Service Review Program in 2011, consisting of a Core
Service Review, Service Efficiency Studies and a User Fee Review. A multiple year (beginning
in 2011) Service Review Program covering most significant City Programs is ongoing. Its
purpose is to ensure that services are being delivered in the most efficient and cost-effective
manner while maintaining appropriate service levels
The City has made much progress since introducing the comprehensive Long Term Fiscal Plan
in 2005. City Council has taken many steps to implement recommendations of the Plan, while
working with other orders of government to improve the funding of capital projects such as
transit and provincially cost-shared programs.
The City's progress on key issues identified in the 2005 report is demonstrated in this scorecard.
Fiscal Health Scorecard 2005-2014)
Implemented Not Implemented Implementation in progress
Identified in the Long Term Fiscal Plan (2005) Current Status Score
Well- Managed (Expenditures)
City has higher costs than other municipalities Costs reduced
Demands for growth need to be adequately funded
Expenditures growth slowed-but still growing
Upload of social services and transit partnership Social Services & Court Security upload. Restore 50% funding on OW admin costs
Upload of Social Housing costs
Restore 50% provincial funding for transit
operating costs
Affordable (Revenues)
Business taxes need to be more competitive Improving business competitiveness
Revenue growth need to match responsibilities/growth
Revenues diversified- Provincial upload on schedule; user fees enhanced
Province needs to properly fund income support programs
Secured permanent share of Fed/Prov Gas Tax
New revenues for City building and growth Share of Harmonized Sales Tax
Sustainable (Assets & Liabilities)
Aging infrastructure must be replaced while minimizing debt
10 Year Capital Plan- More than 70% to be spent on State of Good Repair (SOGR)
Employee benefits and other liabilities need to be adequately funded
Debt increase mitigated
Sick Pay liability partially capped, but some liabilities still growing or are not fully funded

3
Summary of 2007-2014 Budget Pressure Reductions & Other Budget Balancing Strategies Key Points – Budget Pressure and Savings/Reductions
Every year the City faces operating budget pressures arising from various factors such as
inflation and salary cost of living (COLA) increases, growth in service volumes and increasing
debt charges. At the beginning of each budget process, the City will first look at all the cost
drivers as well as all potential revenue changes in order to estimate the funding gap. This
analysis determines the opening budget pressure, and represents a forecast or outlook.
During the budget review process, these pressures are addressed by either expenditure
reductions or revenue increases. The expenditure reductions are primarily from efficiency
savings, reduced compensation or benefit costs, and other base budget savings and strategies
to offset or reduce expenditure increases. The revenue increases generally occur from
increased federal or provincial funding, uploading of services to the Province, increased user
fee or taxes from both rate and volume changes and other revenue sources. A property tax rate
increase is utilized as the funding source of last resort to balance the budget.
As illustrated in Graph 1 below, the City has made tremendous strides in reducing both the
magnitude of the opening budget pressures as well as the use of one-time funding strategies to
balance the operating budget. The use of one-time funding strategies such as one-time
provincial grants, reserve draws and use of the previous year's operating surplus, has been
dramatically reduced from a high of $447 million in 2009 to $26 million in 2013.
Graph 1
2007-2014 Major Long Term Balancing Strategies to Fund Budget Shortfall
Sustainable strategies have included a combination of cost reductions including service
efficiencies, base budget reductions, reduced capital financing costs through debt restructuring
and savings achieved in negotiating new collective bargaining agreements and uploading the
cost of social service programs back to the Province.
The City has also seen revenue increases from higher user fee revenues, new provincial/federal
Gas Tax revenues, growing Municipal Land Transfer Tax revenues, new Third Party Sign Tax
revenues, property assessment growth and property tax increases.
One-Time Provincial Funding
Other One-Time Strategies
Budget Reduction
MLTT
Upload
0
200
400
600
800
1,000
1,200
2007 2008 2009 2010 2011 2012 2013 2014
4
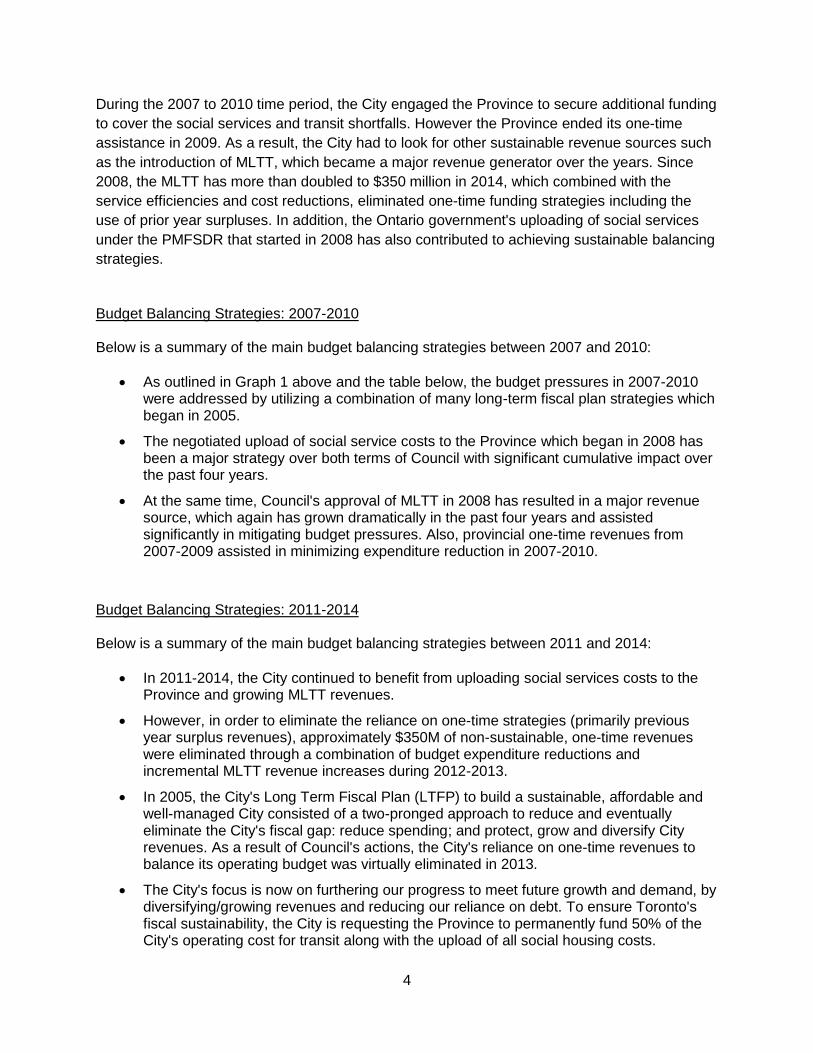
During the 2007 to 2010 time period, the City engaged the Province to secure additional funding
to cover the social services and transit shortfalls. However the Province ended its one-time
assistance in 2009. As a result, the City had to look for other sustainable revenue sources such
as the introduction of MLTT, which became a major revenue generator over the years. Since
2008, the MLTT has more than doubled to $350 million in 2014, which combined with the
service efficiencies and cost reductions, eliminated one-time funding strategies including the
use of prior year surpluses. In addition, the Ontario government's uploading of social services
under the PMFSDR that started in 2008 has also contributed to achieving sustainable balancing
strategies.
Budget Balancing Strategies: 2007-2010 Below is a summary of the main budget balancing strategies between 2007 and 2010:
As outlined in Graph 1 above and the table below, the budget pressures in 2007-2010 were addressed by utilizing a combination of many long-term fiscal plan strategies which began in 2005.
The negotiated upload of social service costs to the Province which began in 2008 has been a major strategy over both terms of Council with significant cumulative impact over the past four years.
At the same time, Council's approval of MLTT in 2008 has resulted in a major revenue source, which again has grown dramatically in the past four years and assisted significantly in mitigating budget pressures. Also, provincial one-time revenues from 2007-2009 assisted in minimizing expenditure reduction in 2007-2010.
Budget Balancing Strategies: 2011-2014 Below is a summary of the main budget balancing strategies between 2011 and 2014:
In 2011-2014, the City continued to benefit from uploading social services costs to the Province and growing MLTT revenues.
However, in order to eliminate the reliance on one-time strategies (primarily previous year surplus revenues), approximately $350M of non-sustainable, one-time revenues were eliminated through a combination of budget expenditure reductions and incremental MLTT revenue increases during 2012-2013.
In 2005, the City's Long Term Fiscal Plan (LTFP) to build a sustainable, affordable and well-managed City consisted of a two-pronged approach to reduce and eventually eliminate the City's fiscal gap: reduce spending; and protect, grow and diversify City revenues. As a result of Council's actions, the City's reliance on one-time revenues to balance its operating budget was virtually eliminated in 2013.
The City's focus is now on furthering our progress to meet future growth and demand, by diversifying/growing revenues and reducing our reliance on debt. To ensure Toronto's fiscal sustainability, the City is requesting the Province to permanently fund 50% of the City's operating cost for transit along with the upload of all social housing costs.

5
Summary of Budget Pressure Reductions & Other Budget Balancing Strategies
Summary of 2007-2010 Budget Pressure Reductions and Other Balancing Strategies
The City's operating budget faced opening budget pressures totaling $2.677 billion for the four year period (Appendix 1):
$591 million in 2007,
$615 million in 2008,
$710 million in 2009, and
$825 million in 2010.
Cost Reductions
In order to balance the budget the City approved and implemented a number of cost reduction initiatives in the 2007 to 2010 operating budgets totaling $371.0 million as outlined in Table 1 below:
Table 1 2007 to 2010 Budget Pressures Addressed by Cost Reductions and Base Budget Savings plus Collective
Agreement Savings ($ millions)
2007-2010 2011-2014
Reductions & Collective Agreements $545M $893M
User Fees $109M $102M
Operating Surplus & Reserve Draws $834M $571M
Other Revenues Sources & Measures $911M $596M
New Tax Revenue & Growth (excl. Property Tax) $222M $140M
Property Tax Increase $294M $147M
Budget Savings
Annual
Budget
Savings
#
Years Total
Service Efficiency Savings and Base Budget Reductions
2007 - Service Efficiency Savings and Base Budget Reductions 85 1 85
2008 - Service Efficiency Savings and Base Budget Reductions 17 1 17
2009 - Service Efficiency Savings and Base Budget Reductions 102 1 102
2010 - Service Efficiency Savings and Base Budget Reductions 167 1 167
Total Service Efficiency Savings and Base Budget Reductions 371
Collective Agreement (savings on benefits)
Reduced sick pay liability 174
Total Collective Agreement Savings 174
Total Savings and Reductions 545

6
In addition to the $371 million in cost reductions and base budget savings the City saved $174 million in Collective Agreement benefits for reduced sick pay liability, bringing the total expenditure related savings (excluding user fee and other revenue measures) for 2007 to 2010 to $545 million.
User Fee/ Tax/ Revenue Increases
As part of the balancing strategy the City also increased its user fees and taxes to offset the pressures as outlined in Table 2.
Table 2 2007-2010 Summary of User Fee/Tax Increases and Revenue Growth
User fees, including the TTC fare increase, totalled $109 million. Other tax revenue increases include the Municipal Land Transfer Tax, the Personal Vehicle Tax and the Third Party Sign Tax. Over the four-year period, user fees and taxes increased by $331 million before the property tax increase or $625 million including the property tax increase ($294 million) from 2007 to 2010.
Toronto Water and Solid Waste Management Services user fee revenues increased by $151 million over this time period.
Year over Year Increase (In $ millions) * 2007 2008 2009 2010 Total
User Fees (11) (7) (12) (30)
TTC Fare Increases (excludes Metropass Increases) (29) (50) (79)
Total User Fee Increases (29) (11) (7) (62) (109)
Municipal Land Transfer Tax (Rate & Volume Changes) (150) (10) (10) (170)
Personal Vehicle Tax (Rate & Volume Changes) (25) (21) (2) (48)
Third Party Sign Tax (Volume Changes) (4) (4)
Total Tax Increases (Rate and Volume) 0 (175) (31) (16) (222)
Property Tax Increase (Rate Changes) (73) (75) (83) (63) (294)
Total User Fee/Tax increase - Tax Supported Programs (102) (261) (121) (141) (625)
* represents annual incremental amount
Year over Year Rate Increase 2007 2008 2009 2010 Average
TTC Fare Increase (cents) 15 0 0 25 10
Water 9% 9% 9% 9% 9.0%
Solid Waste N/A N/A 0% 0% 0.0%
Residential Property Tax Increase * 3.80% 3.75% 4.00% 2.90% 3.6%
Non-Residential Property Tax Increase * 1.27% 1.25% 1.33% 0.97% 1.2%
Total Average Tax Increase 2.84% 2.92% 2.51% 1.83% 2.53%
Tax increase per Average Household $79.6 $72.9 $89.9 $67.7 $77.5
* Tax increase excluding CVA/policy impacts, which is tax neutral city wide.
Year over Year Increase (In $ millions) 2007 2008 2009 2010 Total
Toronto Water Rate Changes (Actual) (35) (26) (31) (59) (151)
Solid Waste Rate Changes (Actual) 0 0 0 0 0
Total User Fee - Rate Supported Programs (35) (26) (31) (59) (151)

7
Appendix 1 details the various expenditure and revenue changes that balanced the 2007 to 2010 Operating Budgets. In addition to the $371 million in cost reductions and base budget savings and $625 million in user fee and tax revenue increases discussed above, the City realized other revenue sources to balance the budget. These included $834 million one-time revenues:
Operating budget surplus of $435 million; and
Reserve draws of $399 million.
As well as other revenue sources and measures:
Provincial funding increase of $417 million in transit operating and debt service costs;
Provincial uploading of social services $158 million;
Incremental interest earnings and payments $22 million;
Hydro dividends $106 million; and
Surplus from closed capital projects $92 million.
The 2007 to 2010 balancing strategies had a strong focus on engaging the Province to provide additional funding including $417 million for transit operating and debt service costs as well as uploading $158 million in social services to the Province.
Summary of 2007 – 2010
In summary, budget and other savings during the 2007 to 2010 period that were used to offset budget pressures totaled $2.741 billion (excluding property tax increases):
Summary of 2011-2014 Budget Pressure Reductions and Other Balancing Strategies The City's operating budget faced opening budget pressures totalling $2.309 billion for the four year period (Appendix 2):
$706 million in 2011;
$774 million in 2012;
$465 million in 2013; and
$364 million in 2014.
$545 M Reductions and other savings of $371 million plus $174 Collective
Agreement savings
$109 M User fee
$834 M Operating Surplus & Reserve Draws
$911 M Other revenues sources and measures
$222 M New Tax Revenue & Growth (excluding property tax increase)
$294 M Property Tax Revenue

8
Cost Reductions
Budget guidelines and directions have been shaped to address the City's ongoing annual operating budget shortfall. The guidelines and directions for the operating budget process over the past four years included:
Budget reduction targets of -5% in 2011 and -10% in 2012 versus the opening pressure; and
In 2013 and 2014, the operating budget target was 0% increase versus the prior year, which means City divisions had to reduce their budget to absorb all the opening pressures.
In order to balance the budget and maintain tax increases below or in line with inflation, the City implemented and approved a number of initiatives in the 2011 to 2014 operating budgets totaling $753 million as outlined in Table 3.
Table 3
2011 to 2014 Budget Pressures Addressed by Cost Reductions and Base Budget Savings plus Collective Agreement Savings ($ millions)
The details of each year's cost reductions and base budget savings are published in the budget book and the Analyst Notes and summarized in Appendix 3.
In addition to the $753 million cost reductions and base budget savings, the City also saved $138 million in Local 416 and Local 79 Collective Agreement savings in employee benefits and productivity efficiency savings for a total of $893 million.
Permanent Savings
Annual
Budget
Savings
#
Years Total
Council Budget Reductions
Reduced the Mayors Budget 0.8 1 0.8
Reduction of City Council 0.8 1 0.8
Total Council Budget Reductions 1.6
Service Efficiency Savings and Base Budget Reductions - Permanent Savings
2011 - cost reductions 56.9 1 56.9
2012 - budget reductions ($267) & service reductions ($60) 327.1 1 327.1
2013 - budget reductions ($178) and reduced capital financing ($44) 222.1 1 222.1
2014 - budget reductions ($110) and reduced capital financing ($37) 147.3 1 147.3
Total Service Efficiency Savings and Base Budget Reductions 753.4
Collective Agreement (savings on benefits)
$54M in savings from reductions in city liabilities for post-age 65 retiree benefits (L416) 13.5 4 54.0
$35M in productivity efficiencies in productivity gains 8.8 4 35.0
Sub-total 89.0
$49 M in savings, efficiencies and benefits liability reductions (Local 79) 49.2
Total Collective Agreement Savings 138.2
Total Savings 893.2
Contract Out Garbage Collection Savings - 4 years 11.3 4 45.2
(Total over 7 years save $78.4 million excluding inflation)

9
The City also contracted out garbage collection services west of Yonge Street that saved about $45 million over the four year period in the rate supported City budget.
User Fee/ Tax/ Revenue Increases
As part of the balancing strategy the City increased user fees and benefitted from tax revenue growth to offset the pressures as outlined below in Table 4.
Table 4 2011-2014 Summary of User Fee/Tax Increases and Revenue Growth
Total user fees, including TTC fare increase, were $102 million. Other tax revenue growth, comprised of the Municipal Land Transfer Tax and Third Party Sign Tax which were offset by the elimination of the Personal Vehicle Tax, totaled $140 million. The property tax increase was $147 million from 2011 to 2014.
Toronto Water and Solid Waste Management Services user fee revenues increased by $258 million over this time period.
Year over Year Increase (In $ millions) * 2011 2012 2013 2014 Total
New User Fees (0.2) (2.7) (0.1) (0.2) (3.2)
User Fees Increase due to Inflation & Other Adjustments (1) (9) (12) (6) (28)
TTC Fare Increases (excludes Metropass Increases) (30) (18) (23) (71)
Total User Fee Increases (1) (42) (30) (29) (102)
Municipal Land Transfer Tax (Volume Changes) (50) (68) (27) (35) (179)
Personal Vehicle Tax (Rate & Volume Changes) 48 (2) 0 0 46
Third Party Sign Tax (Volume Changes) (5) 7 (8) (1) (7)
Total Tax Increases (Rate and Volume) (7) (63) (35) (36) (140)
Property Tax Increase (Rate Changes) 0 (57) (48) (42) (147)
Total User Fee/Tax increase - Tax Supported Programs (8) (162) (113) (107) (389)
* represents annual incremental amount
Year over Year Rate Increase 2011 2012 2013 2014 Average
TTC Fare Increase (cents) 0 10 5 5 5
Water 9% 9% 9% 9% 9.0%
Solid Waste 3% 0% 0% 3% 1.5%
Residential Property Tax Increase * 0.00% 2.50% 2.00% 2.23% 1.7%
Non-Residential Property Tax Increase * 0.00% 0.83% 0.67% 0.74% 0.6%
Total Average Tax Increase 0.00% 1.58% 1.29% 1.46% 1.1%
Tax increase per Average Household $0.0 $60.0 $49.7 $56.7 $41.6
* Tax increase excluding CVA/policy impacts, which is tax neutral city wide.
Year over Year Increase (In $ millions) 2011 2012 2013 2014 Total
Toronto Water Rate Changes (Actual) (41) (89) (55) (59) (244)
Solid Waste Rate Changes (Actual) (7) 0 0 (8) (14)
Total User Fee - Rate Supported Programs (48) (89) (55) (67) (258)

10
Appendix 1 details the various expenditure and revenue changes that balanced the 2011 to 2014 Operating Budget. In addition to the $753 million in cost reductions and base budget savings, and $389 million in user fee and tax increases, the City realized other revenue sources to balance the budget. These included $571 million of one-time revenues:
Operating budget surplus of $448 million; and
Reserve draws of $123 million.
As well other revenue sources and measures:
TTC ridership increase of $132 million;
Provincial Uploading $82 million;
Provincial funding increase of $30 million;
Incremental interest earnings and payments $30 million; and
Hydro dividends $3 million.
It is important to note that in both 2013 and 2014 the City eliminated the reliance on the prior year's surplus as a financing source to balance the budget.
Summary of 2011 - 2014
In summary, budget and other savings during the 2011 to 2014 period that were used to offset budget pressure totaled $2.309 billion (excluding property tax increase), as follows:
Conclusion
Operating budget reductions, other savings and revenue increases referred to above are part of the difference between the Council-approved net operating budget and the opening budget pressures as illustrated below.
$893 M Reductions and other savings of $753 million plus $138 million Collective
agreement savings
$102 M User fee
$571 M Operating Surplus & Reserve Draws
$596 M Other revenues sources and measures
$140 M New Tax Revenue & Growth (excluding property tax increase)
$147 M Property Tax Revenue
3,000
3,500
4,000
4,500
5,000
2007 2008 2009 2010 2011 2012 2013 2014
$M
illio
n
Opening Budget with Opening PressureCouncil Approved Net Operating Budget
Budget Savings &
Additional Revenues

11
The City faced a total combined budget pressure of $2.741 billion for the period 2007 - 2010 in comparison to $2.309 billion for the period 2011 to 2014. To overcome the shortfall, the City developed various strategies comprised of a combination of both cost reductions and revenue increases.
From 2007-2010, the City placed a strong emphasis in engaging the Province as a funding partner. Over the 4 years, in addition to the $545 million budget cost savings including the reduced sick pay liability, the City secured an additional $417 million in grants and transit investments, and an additional $158 million in funding for social services costs from the Province. However, the Province started to reduce funding in 2010 and as a result the City had to increase the use of previous surplus to offset the shortfall.
The use of the prior year's surplus as a one-time funding source peaked in 2011 to $346 million. From 2011-2014, in order to resolve the pressure, the City focused mainly on cost reduction, driven by reduced compensation costs as a result of the labour negotiation settlements, service efficiency, service change, and base budget changes from various cost reduction initiatives such as the Core Service Review and Service Efficiency Study.
The total cost reduced from the opening pressure during 2011 - 2014 is approximately $753 million. In addition, $138 million of savings resulted from benefits liability reductions and productivity efficiencies from the renewed employee benefit plan. Also, the Municipal Land Transfer Tax, introduced in 2008, has been growing year over year as driven by favourable market conditions and has more than doubled to $350 million in the 2014 budget. The MLTT has increasingly become an alternative funding source for the City.
The use of prior year surplus as a funding source was eliminated in 2013 and 2014.
Further information: Roberto Rossini, Deputy City Manager and Chief Financial Officer, (416) 392-8773, [email protected] Josie LaVita, Director, Financial Planning Division, (416) 397-4229, [email protected] Andy Cui, Manager, Financial Planning Division, (416) 397-4207, [email protected] Date: April 28, 2014

12
Appendix 1 2007 – 2010 Operating Budget Balancing Strategies ($ millions)
Description 2007 2008 2009 2010 4 Yr Total
Opening Pressures at Beginning of the Year 1
591 615 710 825 2741
Pressure Reduced From Revenue Changes:
Previous Operating Surplus (85) (74) (276) (435)
Reserve Draws (252) (37) (43) (67) (399)
Interest Earnings and Payments (22) (22)
TTC Fare (29) (50) (79)
Surplus from Close Capital Projects (92) (92)
Provincial Funding Change (30) (149) (238) (417)
Hydro Dividends 3
(106) (106)
User Fees Increase and New Fee (11) (7) (12) (30)
Provincial Upload (39) (119) (158)
MLTT / PVT (175) (31) (12) (218)
Third Party Sign Tax (4) (4)
Assessment Growth (16) (27) (40) (33) (116)
Total Revenue Changes (433) (523) (525) (595) (2,076)
Pressure reduced from Budget Reductions:
Efficiencies & Other Budget Reductions 2
(85) (17) (102) (167) (371)
Total Budget Reductions (85) (17) (102) (167) (371)
Total before Property Tax Increase (518) (540) (627) (762) (2,447)
Property Tax Increase (73) (75) (83) (63) (294)
Note 1: Opening Pressures adjusted for $29M TTC Fare Increases in 2007, $31M MLTT and PVT in 2009, and $4M Sign Tax in 2010.
Note 2: New and Enhanced costs for the following years are: 2007:$14M, 2008:$12M, 2009:$23.5M, 2010:$3M.
Note 3: Includes sale of Street Lighting to Hydro of $60M.
2007-2010 Efficiency Savings and Other Budget Reductions (371)
Collective Agreement ( savings on benefits), not included above (174)
Sub-total (545)
User Fees (109)
Operating Surplus & Reserve Draws (834)
Total Other Revenue savings and increases (911)
New Tax Revenue & Growth (Excluding Property Tax) (222)
Property Tax Increase (294)

13
Appendix 2 2011 – 2014 Operating Budget Balancing Strategies ($ millions)
Description 2011 1
2012 2013 2014 4 Yr Total
Opening Pressures at Beginning of the Year 706 774 465 364 2,309
Pressure Reduced From Revenue Changes:
Previous Operating Surplus (346) (102) (448)
Reserve Draws (26) (22) (47) (28) (123)
Other Revenues (56) (14) (4) (63) (137)
Interest Earnings and Payments (11) (9) (11) (30)
TTC Fare (30) (18) (23) (71)
TTC Ridership Increases (53) (30) (42) (7) (132)
Provincial Funding Change (22) (8) (30)
Hydro Dividends (15) (15)
New User Fees (0) (3) (0) (0) (3)
User Fees Increase due to Inflation & Other Adjustments (1) (9) (12) (6) (28)
Provincial Upload (63) (14) (5) (82)
MLTT (50) (68) (27) (35) (180)
Assessment Growth (45) (66) (33) (25) (169)
Total Revenue Changes (650) (390) (216) (193) (1,448)
Pressure reduced from Budget Reductions:
Efficiencies & Other Budget Reductions (56) (291) (179) (110) (636)
Reduced Capital Financing Costs (36) (44) (37) (117)
Total Budget Reductions (56) (327) (223) (147) (753)
New and Enhanced 2
21 18 39
Total before Property Tax Increase (706) (717) (417) (322) (2,162)
Property Tax Increase 0 (57) (48) (42) (147)
Note 1: 2011 Opening pressure reflects the elimination of PVT of $48 million.
Note 2: New and enhanced costs for 2011 and 2012 are $4.4M and $13M respectively and are included in the opening pressure.
2011-2014 Efficiency Savings and Other Budget Reductions (753)
Collective Agreement ( savings on benefits), not included above (138)
Sub-total (893)
User Fees (102)
Operating Surplus & Reserve Draws (571)
Total Other Revenue savings and increases (596)
New Tax Revenue & Growth (Excluding Property Tax) 1
(140)
Property Tax Increase (147)

14
Appendix 3: Budget Savings 2011 – 2014 ($000s)
Tax Supported Operating Budget 2011 2012 2013 2014
Total Cost
Reductions
Citizen Centred Services "A"
Affordable Housing Office -516 -88 0 0 -604
Children's Services -11,971 -1,490 0 -270 -13,731
Court Services 0 -406 0 -1,656 -2,062
Economic Development & Culture -588 -243 -300 0 -1,131
Emergency Medical Services 0 -626 0 0 -626
Long Term Care Homes & Services 0 -1,315 -47 -578 -1,941
Parks, Forestry & Recreation -960 -2,694 -7,080 -991 -11,724
Shelter, Support & Housing Admin -7,534 -7,314 0 -3,561 -18,410
Social Development, Finance & Admin -363 -536 0 -701 -1,600
Toronto Employment & Social Services -7,738 -5,204 0 0 -12,942
311 Toronto -375 -542 0 0 -917
Sub-Total Citizen Centred Services "A" -30,045 -20,458 -7,427 -7,757 -65,688
Citizen Centred Services "B"
City Planning -81 -299 0 0 -380
Fire Services 0 -86 -5,369 -2,450 -7,904
Municipal Licensing & Standards -1,162 -2,726 0 0 -3,888
Policy, Planning, Finance & Admin -652 -1,784 0 -252 -2,688
Engineering & Construction Services 0 0 0 0 0
Toronto Buildings 0 -265 0 -125 -390
Toronto Environment Office -288 -554 0 0 -842
Transportation Services -4,427 -9,140 -510 -1,585 -15,661
Waterfront Secretariat 0 0 0 0 0
Sub-Total Citizen Centred Services "B" -6,610 -14,853 -5,879 -4,412 -31,754
Internal Services
Office of the Chief Financial Officer -152 -376 -162 -346 -1,036
Office of the Treasurer -1,134 -2,630 0 -479 -4,243
Facilities Management & Real Estate -1,046 -3,823 -701 -1,655 -7,224
Fleet Services -1,006 -586 -391 0 -1,982
Information & Technology -3,015 -2,308 -332 -1,771 -7,426
Sub-Total Internal Services -6,352 -9,723 -1,585 -4,251 -21,910
City Manager
City Manager's Office -1,328 -814 -143 -575 -2,859
Sub-Total City Manager -1,328 -814 -143 -575 -2,859
Other City Programs
City Clerk's Office -1,560 -2,322 -907 -1,430 -6,219
Legal Services -899 -220 0 135 -985
Mayor's Office 0 0 -48 0 -48
City's Council 0 -144 -37 -262 -442
Sub-Total Other City Programs -2,459 -2,686 -991 -1,557 -7,693
Accountability Offices
Auditor General's Office -172 -124 0 0 -296
Integrity Commissioner's Office -9 -5 -5 -0 -19
Office of the Lobbyist Registrar -47 -27 -57 -20 -151
Office of the Ombudsman -61 -36 0 0 -97
Sub-Total Accountability Offices -288 -192 -62 -21 -563
TOTAL - CITY OPERATIONS -47,081 -48,726 -16,087 -18,573 -130,467
Agencies
Toronto Public Health -77 -1,471 0 -526 -2,075
Toronto Public Library -1,924 -6,840 -1,371 -1,109 -11,244
Association of Community Centres 0 -131 -16 159 12
Exhibition Place 0 0 0 0 0
Heritage Toronto 0 0 0 0 0
Theatres -43 -857 -383 -42 -1,325
Toronto Zoo 0 -171 0 -790 -961
Arena Boards of Management 0 0 0 0 0
Yonge-Dundas Square -15 0 0 0 -15
Toronto Region Conservation Authority -150 0 0 0 -150
Toronto Transit Commission-Conventional (Note 1) 0 -43,000 -31,288 0 74,288
Toronto Transit Commission - Wheel Trans -3,000 -1,572 0 -4,572
Toronto Police Service (Note 2) -7,600 -3,579 -21,400 0 -32,579
Toronto Police Services Board 0 -309 -7 0 -316
TOTAL - AGENCIES -9,809 -59,356 -56,037 -2,309 -127,511
Total City Programs and Agencies -56,890 -108,082 -72,124 -20,882 -257,978Other Reductions
Base budget reductions - various -29,000 -40,000 -69,000
Base Savings including Compensation -87,074 -87,074
TTC - fringe benefits liabilities (Note 3) -54,000 -54,000
Compensation reduction (Note 4) -28,000 -56,000 -84,000
Operating impact of capital projects (absorbed / delayed) -12,000 -1,883 -13,883
TOTAL - OTHER REDUCTIONS 0 -123,000 -96,000 -88,957 -307,957
SUBTOTAL -56,890 -231,082 -168,124 -109,839 -565,936
Service Changes -60,000 -10,000 -70,000
Capital Financing (Note 5) -36,000 -44,000 -37,441 -117,441
TOTAL COST SAVINGS -56,890 -327,082 -222,124 -147,280 -753,376
Total City Programs and Agencies savings can be identified in the Analyst Notes in Part III - Recommended Base
Budget, section - Recommended Service Changes of the Analyst Notes.
15
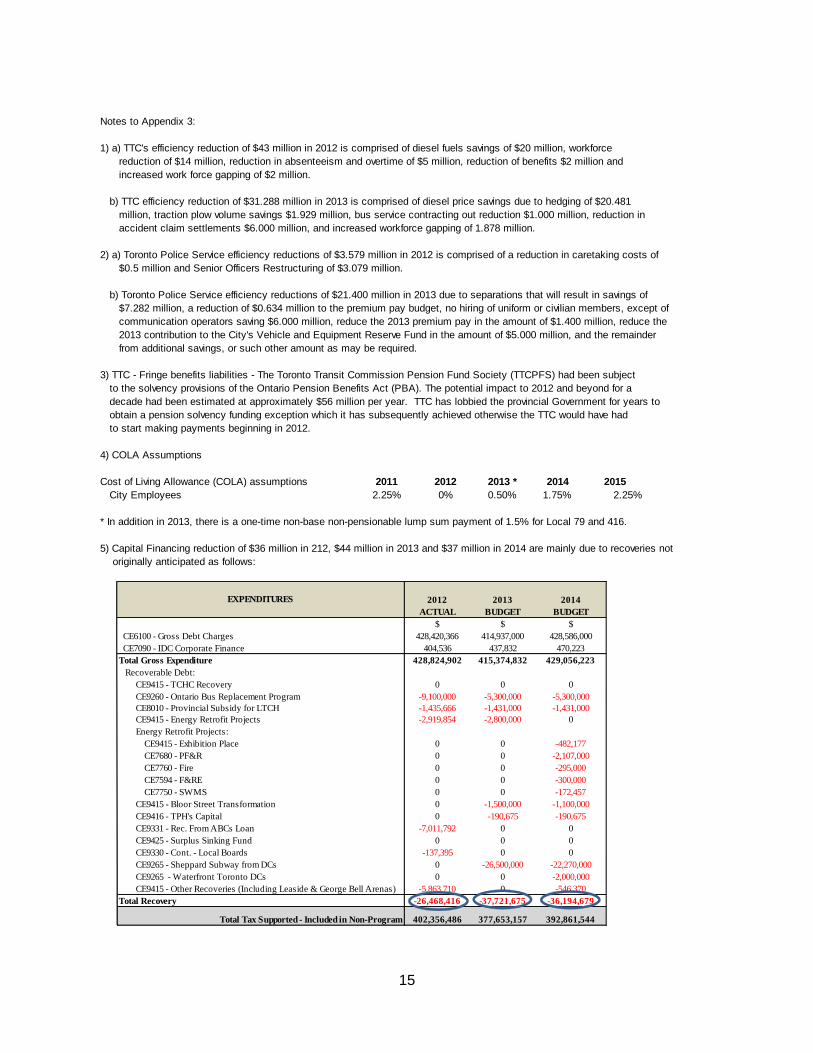
Notes to Appendix 3:
1) a) TTC's efficiency reduction of $43 million in 2012 is comprised of diesel fuels savings of $20 million, workforce
reduction of $14 million, reduction in absenteeism and overtime of $5 million, reduction of benefits $2 million and
increased work force gapping of $2 million.
b) TTC efficiency reduction of $31.288 million in 2013 is comprised of diesel price savings due to hedging of $20.481
million, traction plow volume savings $1.929 million, bus service contracting out reduction $1.000 million, reduction in
accident claim settlements $6.000 million, and increased workforce gapping of 1.878 million.
2) a) Toronto Police Service efficiency reductions of $3.579 million in 2012 is comprised of a reduction in caretaking costs of
$0.5 million and Senior Officers Restructuring of $3.079 million.
b) Toronto Police Service efficiency reductions of $21.400 million in 2013 due to separations that will result in savings of
$7.282 million, a reduction of $0.634 million to the premium pay budget, no hiring of uniform or civilian members, except of
communication operators saving $6.000 million, reduce the 2013 premium pay in the amount of $1.400 million, reduce the
2013 contribution to the City's Vehicle and Equipment Reserve Fund in the amount of $5.000 million, and the remainder
from additional savings, or such other amount as may be required.
3) TTC - Fringe benefits liabilities - The Toronto Transit Commission Pension Fund Society (TTCPFS) had been subject
to the solvency provisions of the Ontario Pension Benefits Act (PBA). The potential impact to 2012 and beyond for a
decade had been estimated at approximately $56 million per year. TTC has lobbied the provincial Government for years to
obtain a pension solvency funding exception which it has subsequently achieved otherwise the TTC would have had
to start making payments beginning in 2012.
4) COLA Assumptions
Cost of Living Allowance (COLA) assumptions 2011 2012 2013 * 2014 2015
City Employees 2.25% 0% 0.50% 1.75% 2.25%
* In addition in 2013, there is a one-time non-base non-pensionable lump sum payment of 1.5% for Local 79 and 416.
5) Capital Financing reduction of $36 million in 212, $44 million in 2013 and $37 million in 2014 are mainly due to recoveries not
originally anticipated as follows:
2012 2013 2014
ACTUAL BUDGET BUDGET
$ $ $
CE6100 - Gross Debt Charges 428,420,366 414,937,000 428,586,000
CE7090 - IDC Corporate Finance 404,536 437,832 470,223
Total Gross Expenditure 428,824,902 415,374,832 429,056,223
Recoverable Debt:
CE9415 - TCHC Recovery 0 0 0
CE9260 - Ontario Bus Replacement Program -9,100,000 -5,300,000 -5,300,000
CE8010 - Provincial Subsidy for LTCH -1,435,666 -1,431,000 -1,431,000
CE9415 - Energy Retrofit Projects -2,919,854 -2,800,000 0
Energy Retrofit Projects:
CE9415 - Exhibition Place 0 0 -482,177
CE7680 - PF&R 0 0 -2,107,000
CE7760 - Fire 0 0 -295,000
CE7594 - F&RE 0 0 -300,000
CE7750 - SWMS 0 0 -172,457
CE9415 - Bloor Street Transformation 0 -1,500,000 -1,100,000
CE9416 - TPH's Capital 0 -190,675 -190,675
CE9331 - Rec. From ABCs Loan -7,011,792 0 0
CE9425 - Surplus Sinking Fund 0 0 0
CE9330 - Cont. - Local Boards -137,395 0 0
CE9265 - Sheppard Subway from DCs 0 -26,500,000 -22,270,000
CE9265 - Waterfront Toronto DCs 0 0 -2,000,000
CE9415 - Other Recoveries (Including Leaside & George Bell Arenas) -5,863,710 0 -546,370
Total Recovery -26,468,416 -37,721,675 -36,194,679
Total Tax Supported - Included in Non-Program 402,356,486 377,653,157 392,861,544
EXPENDITURES