challenges in forecasting management for global companies
TRANSCRIPT
INOM EXAMENSARBETE ,AVANCERAD NIVÅ, 30 HP
, STOCKHOLM SVERIGE 2019
Challenges in forecasting management for global companies
PATRIK BORNELIND
KTHSKOLAN FÖR INDUSTRIELL TEKNIK OCH MANAGEMENT

TRITA TRITA-ITM-EX 2019:560
www.kth.se
Challenges in forecasting management for global companies
by
Patrik Bornelind
Master of Science Thesis TRITA-ITM-EX 2019:560 KTH Industrial Engineering and Management
Industrial Management SE-100 44 STOCKHOLM


Examensarbete TRITA-ITM-EX 2019:560
Utmaningar inom prognoshantering för globala företag
Patrik Bornelind
Godkänt
2019-08-30
Examinator
Jannis Angelis
Handledare
Luca Urciuoli
Uppdragsgivare
Ericsson AB
Kontaktperson
Mats Lundberg
Sammanfattning
I dagens snabbt utvecklande och växande landskap så är ett företags förmåga att anpassa sig
till marknadens behov en betydande konkurrensfaktor. Säljprognoser utgör grunden för all
planering inom försörjningskedjan och är en process som företag ofta inte erkänner som en
viktig bidragsgivare till företagets framgång. Olika marknadslandskap och förutsättningar
skapar olika utmaningar för företag att bemästra för att kunna bedriva ett effektivt
prognosarbete och matcha efterfrågan med utbud.
Detta examensarbete tittar på hela prognosprocessen, även kallad prognoshantering, hos ett
decentraliserat globalt företag för att identifiera de viktigaste utmaningarna i processen och
föreslå rekommendationer om hur man kan övervinna dem. Forskningen bygger på en enda
fallstudie där prognosprocessen undersöks utifrån fyra olika dimensioner: Funktionell
integration, strategi, system och prestandamätningar.
Studien identifierade tolv utmaningar i prognosprocessen där en majoritet kan kopplas till
utmaningar inom informationsdelning och brist på stöd i processen. Baserat på de
identifierade utmaningarna utvecklades åtta förbättringsåtgärder för att övervinna
utmaningarna och förbättra processen för ett decentraliserat globalt företag.
Nyckelord
Prognoser, Prognoshantering, Prognosprocesser, Efterfrågeprognoser, Försäljningsprognoser,
Planering av efterfrågan, Kvalitativ prognos
Master of Science Thesis TRITA-ITM-EX 2019:560
Challenges in forecasting management for global companies
Patrik Bornelind
Approved
2019-08-30
Examiner
Jannis Angelis
Supervisor
Luca Urciuoli
Commissioner
Ericsson AB
Contact person
Mats Lundberg
Abstract
In today’s fast-moving world, a company´s ability to align with changes in the market is
becoming a major competitive factor. Demand forecasting form the basis of all supply chain
planning and is a process that companies often fail to recognize as a key contributor to
corporate success. Different contexts and market dynamics creates different challenges for
companies to overcome in order to have an efficient forecasting process, matching demand
with supply.
This master thesis looks at the whole forecasting process, also called forecasting
management, at a decentralized global company to identify the main challenges within the
process and propose recommendations on how to overcome them. The research is based on a
single case study where the forecasting process is investigated using four different
dimensions: Functional Integration, Approach, Systems and Performance Measurements.
The study identified twelve challenges in the forecasting process where a majority can be
connected to issues within information sharing and lack of support in the process. Based on
the identified challenges, eight improvement suggestions where developed to target the
challenges and improving the process for a decentralized global company.
Keywords
Forecasting, Forecasting Management, Forecasting Processes, Demand Forecasting, Sales
Forecasting, Demand Planning, Qualitative Forecasting

Foreword
This master thesis was written at the Department of Industrial Engineering and Management
at the Royal Institute of Technology, Stockholm. The study corresponds to 30hp and was
conducted during January to August 2019 in cooperation with Ericsson AB.
Acknowledgements
Firstly, I would like to thank my supervisor – Luca Urciuoli Lecturer and researcher in supply
chain management at Industrial Economics and Management, as well as my seminar leader
Jannis Angelis Associate Professor of Operations Strategy at Industrial Management. Their
help and guidance have been an important and valuable part during the course of the study. I
would also like to thank my supervisor at Ericsson AB, Mats Lundberg, for giving me time
and support along with feedback during the course of the study. Furthermore, I would like to
thank Ingela Hansen at Ericsson for making this thesis possible, and all involved interviewees
at Ericsson for contributing with time and knowledge and thereby adding valuable input to
the thesis.
Lastly, I would also like to thank Karl Wiklund, Student at KTH, for his involvement and
contributions during the first phases of the study, his involvement and knowledge has
provided lots of value to the thesis.
Patrik Bornelind
Stockholm, Sweden
August, 2019

Table of Contents
1.Introduction ........................................................................................................................... 1
1.1 Background ...................................................................................................................... 1
1.2 Problem Formulation ....................................................................................................... 1
1.3 Case Problem ................................................................................................................... 2
1.4 Purpose and Research Questions ..................................................................................... 3
1.5 Delimitations .................................................................................................................... 3
1.6 Disposition ....................................................................................................................... 4
2. Theoretical Framework ....................................................................................................... 5
2.1 The Importance of Forecasting ........................................................................................ 5
2.2 Forecasting versus Planning ............................................................................................ 7
2.3 The Role of Forecasting in S&OP ................................................................................. 10
2.4 Forecasting Management ............................................................................................... 11
2.4.1 Factors Affecting the Forecasting Process .............................................................. 11
2.4.2 Forecasting Methods ............................................................................................... 13
2.4.3 Ways to Improve the Forecasting Process .............................................................. 19
2.5 Audit Framework ........................................................................................................... 23
2.5.1 Functional Integration ............................................................................................. 23
2.5.2 Approach ................................................................................................................. 26
2.5.3 Systems ................................................................................................................... 30
2.5.4 Performance Measurements .................................................................................... 33
3. Method ................................................................................................................................ 35
3.1 Choice of Methodological Approach ............................................................................. 35
3.2 Research Design............................................................................................................. 35
3.2.1 Pre-Study................................................................................................................. 37
3.2.2 Literature Study ...................................................................................................... 38
3.2.3 Interviews ................................................................................................................ 39
3.2.4 Data Analysis .......................................................................................................... 40
3.3 Assessment of the Quality of the Research.................................................................... 41

3.3.1 Reliability ................................................................................................................ 41
3.3.2 Validity ................................................................................................................... 42
3.3.3 Generalizability ....................................................................................................... 43
3.4 Ethical Considerations ................................................................................................... 43
4. Results ................................................................................................................................. 44
4.1 Ericsson AB ................................................................................................................... 44
4.2 The Forecasting Process at Ericsson .............................................................................. 45
4.2.1 Functional Integration. ............................................................................................ 48
4.2.2 Approach ................................................................................................................. 50
4.2.3 Systems ................................................................................................................... 53
4.2.4 Performance Measurements .................................................................................... 55
5. Discussion............................................................................................................................ 57
5.1 Challenges Identified in the Forecasting Process .......................................................... 57
5.1.1 Functional Integration ............................................................................................. 58
5.1.2 Approach ................................................................................................................. 63
5.1.3 Systems ................................................................................................................... 67
5.1.4 Performance Measurements .................................................................................... 70
6. Conclusion .......................................................................................................................... 73
6.1 Fulfilling the Purpose of the Research ........................................................................... 73
6.1.1 RQ1: What main challenges are present in the process? ........................................ 73
6.1.2 RQ2: How should the forecasting process be designed to overcome the identified
challenges? ....................................................................................................................... 74
6.1.3 Recommendations for Ericsson AB ........................................................................ 76
6.2 Implications on Sustainability........................................................................................ 78
6.2.1 Economic Sustainability ......................................................................................... 78
6.2.2 Social Sustainability................................................................................................ 78
6.2.3 Environmental Sustainability .................................................................................. 78
6.3 Limitations of the Research and Future Studies ............................................................ 79
References ............................................................................................................................... 80
Appendix I ................................................................................................................................ 1

i
List of Figures
Figure 1: Forecasting levels ....................................................................................................... 8
Figure 2: Sample of forecasting process .................................................................................... 9
Figure 3: Monthly S&OP process ............................................................................................ 10
Figure 4: Forecasting methods ................................................................................................. 13
Figure 5: Classification of predictability of demand ............................................................... 17
Figure 6: Forecasting process .................................................................................................. 18
Figure 7: Research design of study .......................................................................................... 37
Figure 8: Ericsson market areas ............................................................................................... 45
Figure 9: Ericsson S&OP process ............................................................................................ 46
Figure 10: Forecasting Hierarchy HDS 8000 Compute and Storage ....................................... 52
Figure 11: Summary Functional Integration at Ericsson ......................................................... 62
Figure 12: Summary Approach at Ericsson ............................................................................. 67
Figure 13: Summary Systems at Ericsson .............................................................................. 70
Figure 14: Summary Performance Measurements at Ericsson ................................................ 72
Figure 15: Recommendations for Ericsson AB ....................................................................... 76

ii
List of Tables
Table 1: Forecasting needs of different functions...................................................................... 6
Table 2: Seven keys to better forecasting ................................................................................ 19
Table 3: Functional Integration ................................................................................................ 24
Table 4: Approach.................................................................................................................... 27
Table 5: Systems ...................................................................................................................... 31
Table 6: Performance measurements ....................................................................................... 33
Table 7: List of interviewees.................................................................................................... 40
Table 8: Functional Integration at Ericsson ............................................................................. 58
Table 9: Approach at Ericsson ................................................................................................. 63
Table 10: Systems at Ericsson ................................................................................................. 67
Table 11: Performance Measurements at Ericsson .................................................................. 70
1
1.Introduction
This chapter presents a background to familiarize the reader with the current situation, some
terms and why the stated problem has emerged. This is followed by a problem formulation,
specifying the issue of the research, the purpose of the research and the formulated research
questions. Lastly, this chapter introduces the delimitations and boundaries of the research.
1.1 Background
Globalisation and digitalisation have changed the way business is managed. Improvements in
connectivity and communications connect people, places and applications from all over the
world and creates a new business landscape. A landscape that has come to be characterized
by Volatility, Uncertainty, Complexity and Ambiguity (VUCA) characteristics, challenging
the complex supply chains of global companies with matching demand and supply (Austin,
2018). Companies do not longer compete as single entities but rather as entire supply chains
where the success of the single business is determined by the managers ability to integrate its
supply chain (Christopher, 2011). Even though the importance of external integration is
echoing louder and louder in the field, a prerequisite to enable a rewarding integration of
external supply chains is the internal integration.
Demand forecasting form the basis of all supply chain planning and is a process that
companies often fail to recognise as a key contributor to corporate success (Chopra and
Meindl, 2014, Moon et al., 1998). Forecasting helps companies to establish necessary supply
channels, purchase the right inventory and deliver goods on a competitive basis, where at the
same time an effective forecasting process enables decision makers to take better strategic
decisions and enables the ability to respond to the future needs of the market (Ross, 2015).
But the process of forecasting does not only need to be effective in producing accurate
forecasts to gain competitive advantages, it also needs to be efficient in utilizing the
company’s resources to add value to the business (Gilliland, 2010).
In an VUCA environment the importance of forecasting is enhanced for companies to
compete and provide the service that is demanded by the customers. Alicke et al. (2016)
discusses that in the next generation of digital supply chains, forecasts are required to be
processed more frequently to support faster and more flexible supply chains. Something
which will further increase the importance of forecasting and its impact on competitive
advantage and quick response.
1.2 Problem Formulation
The literature on forecasting methods and techniques is heavy, but even though new
advanced forecasting methods and techniques have been introduced in the last decades,
researchers conclude how the accuracy of forecasting in general has only increased
marginally (Armstrong et al., 2015, Davis and Mentzer, 2007). This has resulted in a shift
within research where the attention have started to focus more on forecasting management

2
and forecasting processes. McCarthy et al. (2006) have raised the issue of how globalization
have resulted in decentralized organisations and how it affects the integration of the
forecasting process. Even though Sales & Operations Planning (S&OP) frameworks provides
a basic view on how the demand planning process should be designed in order to integrate the
internal processes, a detailed design depends on the context (Kristensen and Jonsson, 2018,
Sousa and Voss, 2008). For instance, in an environment of uncertain demand, Lapide (2009)
suggests how forecasting requires a higher level of integration with sales and marketing. It is
also argued by researchers that in the context of uncertain demand and many affecting
factors, there is a need for efficient forecasting processes that enables quicker response to
changes in demand (Makridakis, 2005, Ross, 2015, Thomopoulos, 2015) A study by
Kristensen and Jonsson (2018) exposes the need of future research with case studies into
different contexts to understand how contextual variables, such as uncertain demand, affect
the process.
1.3 Case Problem
Ericsson is a global information and communications technology (ICT) provider that offers
network and infrastructure solutions in over 180 countries worldwide. The company is one of
the biggest ICT providers in the world with approximately 100.000 employees worldwide
and over 200 billion SEK in revenue (Ekholm, 2018). The customers are mainly network
operators and the products are complex, expensive and consists of both hardware and
software. The research is conducted at one of Ericsson’s business areas called Digital
Services. Digital Services offers solutions with innovative customer engagement platforms,
automated operations and programmable networks.
With a Request For Proposal (RFP) based business and in a VUCA environment, Ericsson
are subject to intermittent demand which provides many challenges to the forecasting
process. As the company is decentralized geographically, the forecasting process involves a
large number of people globally with the purpose of creating and consolidating forecasts
from all customers to an aggregated market level which then is used for central supply and
business planning. Ericsson are facing multiple challenges where the forecasting process,
which is repeated every month, takes more than a month to complete and involves lots of
company resources. Despite all resources and time spent every month, the resulting accuracy
of the market forecast is low. Therefore, Ericsson need to review their forecasting process to
find ways to make it more efficient and provide more accurate forecasts.

3
1.4 Purpose and Research Questions
The purpose of this study is to investigate and review the forecasting process for a
decentralized global company to see what challenges that are present, and how to overcome
them to increase the performance. In order to reach this purpose, two research questions have
been formulated:
• What main challenges are present in the process?
• How should the forecasting process be designed to overcome the identified challenges?
1.5 Delimitations
With the field of forecasting including several possible venues of investigation, a number of
delimitations have been introduced in order to clarify the scope of the research.
First of all, rather than evaluating specific forecasting methods and techniques, this study
focuses on forecasting management and the overall forecasting process. That means that the
focus is directed towards functionalities of methods and forecasting tools rather than
reviewing methods and tools in detail. Furthermore, the study is oriented towards identifying
main challenges and propose areas of improvement which means that change management
and how to best implement changes to the studied organisation lie outside the scope.
The study investigates the context of the case company and will therefore be limited to that
context, which is represented by a geographically separated global organization, selling
products in a project-based market where the demand is intermittent.
The study is further delimited, as a consequence of the global size of the case company, to
only cover the market area; Europe and Latin America, which is one of five market areas in
which the company operates. The study investigates two large customer accounts within the
market area, which are chosen to best represent the market area and the investigated business
area of Digital Services. In other market areas there may be some cultural differences which
will affect the generalisability of the research.

4
1.6 Disposition
Introduction
• Background
• Problem Formulation
• Case Problem
• Purpose and Research Questions
• Delimitations
• Disposition
Theoretical Framework
• The Importance of Forecasting
• Forecasting versus Planning
• The Role of Forecasting in S&OP
• Forecasting Management
• Audit Framework
Method
• Choise of Methodological Approach
• Research Design
• Assesment of the Quality of the Research
Results
• Ericsson AB
• The Forecasting Process at Ericsson
Discussion
• Challenges Identified in the Forecasting Process
Conclusion
• Fulfilling the Purpose of the Research
• Implications on Sustainability
• Limitations of the Research and Future Studies

5
2. Theoretical Framework
This chapter accounts for previous research and key concepts that has been used in this study
i.e. forecasting, forecasting management, supply chain management, demand planning,
forecasting methods. These areas of research have been used in order to understand the
problematization and which challenges that are present within forecasting. The last section
within this chapter describes the main audit framework that has been used as a base for the
study.
2.1 The Importance of Forecasting
Forecasting is important for any business and is a key element in the everyday operations of a
company. Forecasts comes in many shapes and are used to fulfil different purposes, forecasts
are used to predict trends, weather and demand to mention a few. This thesis will have its
focus on demand forecasting which Moon (2018) defines as:
“A demand forecast is a firm’s best estimate of what demand will be in the future, given a set
of assumptions”
In the literature the term sales forecasting is sometimes used and widely accepted but for this
thesis the term demand forecasting will be used with a base in the presented definition. Moon
(2018) highlights the use of the word “estimate” in the definition as a forecast is always an
estimate, a guess about what might transpire in the future. This is further highlighted by other
researchers in the area who all agrees that the most important characteristic to understand
about forecasts is that they are always inaccurate and should be treated as such (Chopra and
Meindl, 2014, Ross, 2015, Moon, 2018).
The goal of a forecast is to gain knowledge about the future and use as input for successful
planning and as a base for better decision making. Ross (2015) raises the importance of
having sound plans, based on accurate forecasts, that enables the company to establish
necessary supply channels, purchase proper inventory and deliver products on a competitive
basis. Chopra and Meindl (2014) further highlights this for both pull and push organisations
as inventory and capacity needs to be planned in anticipation of demand regardless. But it is
not only the supply chain that requires a well-developed plan with input from an accurate
demand forecast. Almost all functions in a company uses forecast of different levels and
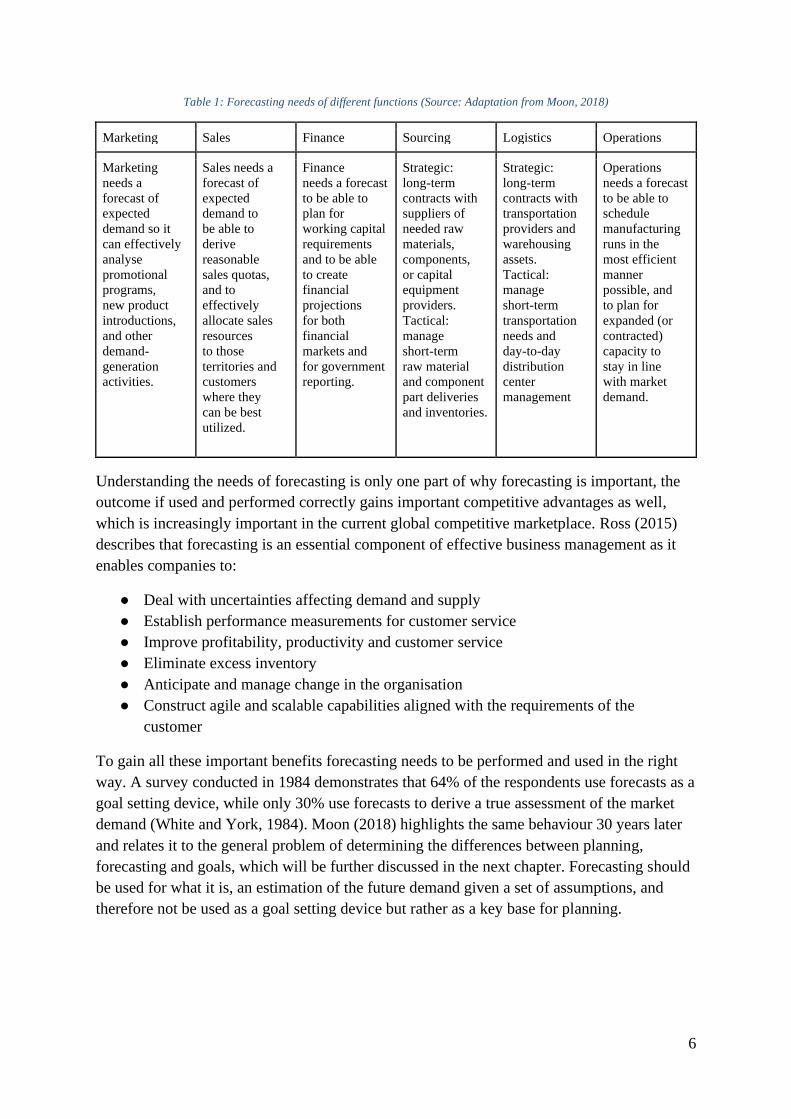
horizons to plan the business. Table 1 describes the forecasting needs of different business
functions which also can be used to emphasise the need of cross functional integration in the
process of developing demand forecasts, which will be further discussed later in the report.
6
Table 1: Forecasting needs of different functions (Source: Adaptation from Moon, 2018)
Marketing Sales Finance Sourcing Logistics Operations
Marketing
needs a
forecast of
expected
demand so it
can effectively
analyse
promotional
programs,
new product
introductions,
and other
demand-
generation
activities.
Sales needs a
forecast of
expected
demand to
be able to
derive
reasonable
sales quotas,
and to
effectively
allocate sales
resources
to those
territories and
customers
where they
can be best
utilized.
Finance
needs a forecast
to be able to
plan for
working capital
requirements
and to be able
to create
financial
projections
for both
financial
markets and
for government
reporting.
Strategic:
long-term
contracts with
suppliers of
needed raw
materials,
components,
or capital
equipment
providers.
Tactical:
manage
short-term
raw material
and component
part deliveries
and inventories.
Strategic:
long-term
contracts with
transportation
providers and
warehousing
assets.
Tactical:
manage
short-term
transportation
needs and
day-to-day
distribution
center
management
Operations
needs a forecast
to be able to
schedule
manufacturing
runs in the
most efficient
manner
possible, and
to plan for
expanded (or
contracted)
capacity to
stay in line
with market
demand.
Understanding the needs of forecasting is only one part of why forecasting is important, the
outcome if used and performed correctly gains important competitive advantages as well,
which is increasingly important in the current global competitive marketplace. Ross (2015)
describes that forecasting is an essential component of effective business management as it
enables companies to:
● Deal with uncertainties affecting demand and supply
● Establish performance measurements for customer service
● Improve profitability, productivity and customer service
● Eliminate excess inventory
● Anticipate and manage change in the organisation
● Construct agile and scalable capabilities aligned with the requirements of the
customer
To gain all these important benefits forecasting needs to be performed and used in the right
way. A survey conducted in 1984 demonstrates that 64% of the respondents use forecasts as a
goal setting device, while only 30% use forecasts to derive a true assessment of the market
demand (White and York, 1984). Moon (2018) highlights the same behaviour 30 years later
and relates it to the general problem of determining the differences between planning,
forecasting and goals, which will be further discussed in the next chapter. Forecasting should
be used for what it is, an estimation of the future demand given a set of assumptions, and
therefore not be used as a goal setting device but rather as a key base for planning.
7
2.2 Forecasting versus Planning
The understanding and differentiation between business forecasts and business plans are
crucial and something that many companies struggles with. When looking at historical data to
predict the future, a common mistake is to base the historical data on historical deliveries and
not on historical demand (Silver, 2017). If all demand can be met by the company this
mistake will not make much of a difference. But when some of the demand cannot be met by
the company, the historical deliveries will not represent the historical demand and will
therefore contribute to wrongfully assumptions taken about the future demand (Moon, 2018).
To avoid similar mistakes, it is important to understand what differentiates forecasts from
plans and how they are linked and related to each other. As defined in the previous chapter,
forecasts are estimates of the future given a set of assumptions to best anticipate how the
future will look like. Plans on the other hand, are decisions made about what actions to make
which is expressed in form of various operational, financial and demand plans (Moon, 2018).
Moon (2018) further argues that in an ideal process, forecasts precede plans, and decisions
about what actions to make should be based on forecasted estimates on future demand and
opportunities. Ross (2015) further discusses the alignment between forecasts and plans
meaning that forecasting methods should be chosen to support the business’s planning and
decision-making process. Companies often confuse forecasting and planning and uses
forecasts to simulate the outcomes of plans with an iterative process of reviewing plans and
forecasts until they match, and the forecasted outcome are satisfactory. A common mistake is
that when the actual events then unfold and do not match the forecasted estimates, companies
tend to revise their forecasts and not the plans, with the false impression that changing the
forecast will change the outcome (Ross, 2015).
To align forecasts with planning processes, it is important to consider forecasting levels and
planning horizons. Every business function needs to make plans and take decisions to run the
everyday operations and depending on the focus of the function, different levels of the
forecast will be of interest. The planning horizons and forecast level are related to the
production lead time and what kind of products the business offers as it will not yield any
knowledge forecasting for a shorter time horizon than the shortest lead time to produce a
product (Moon, 2018). Figure 1 illustrates four levels of forecasting and relates it to planning
horizon and resulted focus.

8
Figure 1: Forecasting levels (Source: adapted from Ross 2015)
Ross (2015) describes the different levels in relation to the planning horizon and what type of
decisions that the forecasts are used for:
● The highest level refers to strategic forecasts and has the longest planning horizon.
This level is used by top management to make strategic decisions about what goals
and objectives the business should strive for, structuring channel networks and how
the assets should be used in the organisation.
● The next level, tactical forecasts, has a time horizon covering around 3-12 months and
is often tied to operations planning for capacities and inventory levels. The forecasts
are often represented on an aggregated level showing the demand for product families
instead of for individual items.
● Operations forecasts refers to forecasts that are used for operative planning including
manufacturing, transportation and material handling. The forecasts are often focused
on item level and is conducted in weekly time frames.
● Immediate-range forecasts are used for everyday business and ongoing activities in
the organisation. This includes scheduling, order filling and transportation, to mention
a few.
For the demand forecast to provide good estimates of future demand it requires the
involvement of multiple functions which can contribute with knowledge on different levels to
the forecasts. A key component to fulfil this is to have a clear and mature process for how the
forecast is produced so that there can be a common understanding about how the process
works and how the forecasts is developed (Mentzer and Moon, 2005). This is especially
important in global organisations where the functions are decentralized and can be spread
across the world. Figure 2 illustrates a simple example of a forecasting process.

9
Figure 2: Sample of forecasting process (Source: adapted from Mentzer & Moon 2005)
Understanding the process and its purpose is key to understand the distinction between
forecast and planning, and at the same how they interact and are linked. This can be further
developed by including goals and objectives in relation to forecasts and planning. The
distinction between goals and forecasts can also be problematic for organisations and
especially in sales and marketing departments (Moon, 2018). The problem arises when the
goal for the forecasting process at the department differs from the ultimate goal of the
forecasting process: an estimate of the demand that is as near as possible to the true demand.
At the sales department, the ultimate goal is often to reach or exceed the sales target and
therefore it would seem strange to make a forecast that is below that target. This will lead to
deviations in the forecast where the assumptions taken does not refer to develop an estimate
of the demand as close to actual demand as possible.
Mentzer and Moon (2005) uses performance measures to separate forecasts, planning and
goal setting. The purpose of demand forecasting is to make as good projections of future
demand as possible, given a set of assumptions with the key measurement of accuracy. In
contrast, the goal of operational plans is not accuracy but rather efficiency and an effective
plan to meet the forecasted demand. The same goes for goal setting where accuracy is
irrelevant, and the ultimate goal is instead to reach the target or exceed it. The bottom line is
to understand that forecasting, planning and goal-setting are performed with different
purposes and should therefore not be confused in the process (Mentzer and Moon, 2005).

10
2.3 The Role of Forecasting in S&OP
Demand forecasting is in many organizations an integrated part of a larger and more crucial
process, being the S&OP process (Mentzer and Moon, 2005). The S&OP process has the
pure purpose of getting demand and supply in balance, and for decision makers to have
access to the most up-to date information. This is important in order to align the decisions
around common objectives (Silver, 2017) and to keep demand and supply in balance through
a cross-functional integration process (Jacobs et al., 2011, Wallace and Stahl, 2008). This
where the demand-side plans of sales and marketing aligns and gets coordinated with the
supply-side plans of operations, logistics and procurement (Lapide, 2004). The S&OP is
normally used for tactical planning, looking over a six month to two-year horizon where the
process consists of a pre-planned cycle of meetings with the norm of conducting these on a
monthly basis (Lapide, 2004, Ross, 2015). The two critical plans being the outcome of the
process is firstly the operational plan; including manufacturing plans, procurement plans and
distribution plans. The second one is the demand plan; regarding what to be sold and when
(Mentzer and Moon, 2005). Wallace and Stahl (2008) presents a basic structure of a monthly
S&OP process presented in figure 3.
Figure 3: Monthly S&OP process (Source: adapted from Wallace and Stahl, 2008)
Lapide (2004) states how most companies conduct three main meetings in the process; a first
one focusing on the creation of an unconstrained demand forecast, the second one with the
intent of generating a rough-cut supply plan and then finally a meeting to finalise and align
supply with demand.
Regardless of how the S&OP process is structured, the demand forecast is by Lapide (2011)
highlighted to be the main driver of the S&OP plans. The entire process starts off with the
need of an unconstrained, unbiased and consensus-based forecast where all known factors
that could affect the future demand have been taken into consideration (Lapide, 2004, Oliva
and Watson, 2009, Moon, 2018).

11
2.4 Forecasting Management
With the importance of forecasting highlighted in the previous chapters as well as its relation
to planning and how it acts as a main driver in a S&OP process, it is clear that forecasting is
more than just methods, tools and systems. Moon (2018) explains how forecasting is a
management process that needs to be organized carefully with attention to all involved
people, processes and methods. Therefore, organisational support is needed in order to in a
good way apply and use the right methods and control the process to jointly in the business
develop an accurate demand forecast (Makridakis et al., 2008).
Makridakis and Wheelwright (1989) suggested 30 years ago that the greatest gains within
forecasting would be gained through research focused on forecasting management practices:
“While there undoubtedly will be some improvements in available methodologies, it is
management’s knowledge and use of existing methods, in their specific organizational
context, that hold the greatest promise”. Makridakis and Wheelwrights suggestion is still
valid today where the common perception in the literature is that forecasting is a management
process and that the performance of the process is strongly related to how well the process is
managed in the specific business environment (Chopra and Meindl, 2014, Gilliland, 2010,
Moon, 2018).
2.4.1 Factors Affecting the Forecasting Process
When determining the forecasting process for a business there are multiple factors that will
affect the result. These factors will also affect what to expect from the forecasts and relates to
the question of how forecastable the business’s demand is. In cases where the demand is
highly volatile the resulted accuracy may not reach the expected levels, regardless of the
effort put into it. It is therefore important to know the affecting factors to understand what
expectations that can be had on the accuracy from the forecasting process (Gilliland, 2010).
These factors can also affect the forecasting process for different internal functions in an
organisation, meaning that the forecasting process may not be the same for all functions.
Moon (2018) have identified three major areas that affects the forecasting process and that
needs to be examined before developing a forecasting process, the three main factors are:
● Customer base
● Available data
● The products
Customer base
To understand and make decisions about what processes to use for the most effective demand
forecast process, the impact and nature of the customer base needs to be analysed and
considered. The size of the customer base is a key component to consider when choosing
forecast methods, for a very wide and large customer base, the demand will be more stable
and patterns in historical demand can be a good indicator about the future demand. For a
narrower customer base on the other hand, statistical models may not be as accurate and other

12
methods where the customer relation is used to forecast the estimated demand will result in
better accuracy.
Moon (2018) explains this by using two examples including the forecasting situation for
Boeing and Hershey, where the first mentioned manufactures commercial airplanes and the
other snacks. For Boeing who has a narrow and small customer base of commercial airliners,
the most efficient way to estimate demand is to ask all the customers what their demand is
likely to be. While at Hersey it would be impossible to ask all their customers buying their
snacks at the local convenience stores all over the world. In this case statistical analysis is the
best tool to analyse historical patterns and then apply qualitative adjustments to fine tune the
forecasts.
Available data
To achieve an effective forecasting process there are several categories of both internal and
external data that can and should be used. Internal data describing promotional activities,
historical demand and product life cycles, as well as external data describing trends and
competitor activities are examples of important data needed (Moon, 2018). The availability of
these kinds of data is a crucial factor affecting the results of the forecasts.
Silver (2017) highlights the lack of good historical data as one of the main problems when it
comes to available data, or rather that the wrong data is used to explain the historical events
and therefore generates a false estimation of the future demand. It is important to distinguish
historical demand from historical shipments delivered by the business. If not properly
interpreted, historical data with a stockout situation would imply that there was no demand
during that period and if backordering is used, the following periods would have shipments
well above the actual demand, leading to a mismatch between historical demand and
shipments. Moon (2018) raises the same problem and proposes a solution where businesses
should create records of “lost orders” to account for unfilled demand. It all relies on the
quality of the data and both previous mentioned authors states that a forecast process must be
created that can overcome this limitation.
The products
Within the category of the products there are multiple factors that affects the forecasting
process and many of them are closely related to the nature of customer base. Some main
factors affecting the nature of the products are price, complexity/mix and product lifecycle
(Moon, 2018).
To explain this, the examples of Hersey and Boeing used in the customer base section will be
used again. In the case of Hersey with low prices and a high mix of available snacks, the
challenge lies within forecasting the run rate of how many products that will be demanded,
and to predict the product mix of what snacks that will be demanded. To handle the
challenges related to this type of products, statistical analysis of historical demand is needed
augmented by qualitative insights from sales and marketing teams (Moon, 2018).

13
In the case of Boeing with multimillion-dollar products, there are other challenges present as
the purchase of capital heavy products often is through a formal Request for Proposal (RFP)
process, in which several companies would compete for the business. The main challenge is
then for forecasters to calculate the probability of winning the business. This is a common
challenge in project-based businesses with uncertainties in the probability of winning the
business, as well as the mix of products and timeline that will be required in the finalised deal
(Moon, 2018). In situations with project-based businesses, the sales team should be heavily
involved in the forecasting process to calculate the probability and risks for each business
opportunity.
Another product attribute that affects the forecasting process is the intensity of new product
introductions affecting the product life cycle. All companies introduce new products, but the
intensity and uncertainty around the product life cycle require complex phase in/phase out
forecasting and planning which needs to be supported by the forecasting process (Moon,
2018).
2.4.2 Forecasting Methods
Forecasting methods is a well explored area in research suggesting a numerous amount of
different methods and techniques that can be applied. Armstrong (2001) describes how “the
method should match the situation”, highlighting how the choice of the technique depends on
the characteristics of the product and the market. He further recommends striving for
selecting simple methods in favour for complex ones unless there is empirical evidence that
one is superior over the other.
Forecasting methods are generally divided into two categories consisting of qualitative and
quantitative methods, where qualitative methods are considered subjective and quantitative
methods are considered objective. In the literature the terms judgemental and statistical
methods is also used as an alternative to qualitative and quantitative. Figure 4 presents
examples of methods in each category.
Figure 4: Forecasting methods (Source: Adapted from Ross, 2015)

14
A key element in reaching forecasting excellence is to understand that forecasting in most
situations is held up by three legs and is an integration of quantitative methods, qualitative
input and the consensus process of bringing the right people together. If any of the three legs
is removed, forecasting excellence will be hard to reach (Moon, 2018).
Qualitative Methods
Qualitative forecasting is as earlier stated, subjective methods where the human judgement is
used to incorporate information and knowledge of how the future will look like. Qualitative
methods often consist of a process to gather knowledge and information from multiple
individuals with different insights and knowledge to be able to make as good estimates about
the future demand as possible. When using qualitative forecasting, the accuracy will depend
on the individuals contributing to the forecast and their knowledge domain which the
estimates are based upon.
Qualitative forecasting techniques should be used when there is a reason to believe that the
future will not look the same as the past (Moon, 2018) but also when little or no historic data
is available (Makridakis et al., 2008). Qualitative forecasts are based on judgement from
accumulated knowledge and information from the customers and from within the company.
A not so surprising implication of this that Makridakis et al. (2008) highlights is how such
methods put requirements on that sufficient qualitative knowledge domain exists.
Armstrong (2005) states that managers have a lot of useful knowledge as they have often
been in the business for a while and have good insights in the market. While this knowledge
is important and useful for forecasting, it is often ignored in the forecasting process.
However, it is not only the top managers who have useful knowledge domains, Moon (2018)
argues that there are lots of sources for qualitative forecasting and those with best knowledge
domain and insights in the company are:
• Senior executives
• Marketing or product management
• Sales
Senior executives have a good overview and insights in the market trends and how the
competitors are evolving and moving in the market, which makes their knowledge domain
focused on the “big picture” in the industry. Marketing and product management have
insights in product lifecycles and new products that will be introduced as well as their ability
to disrupt the market. Lastly the salespeople have the closest relations with the customers
which is an important insight in short term trends and contract negotiations in project-based
markets.
Sales Force Composite
Is a qualitative forecasting method which utilises the knowledge and experience available in
the sales department to create consolidated demand forecasts for the business (Gilliland,
2010). The advantage of this method is that it uses the specialised knowledge from those who

15
works closest to the market and customers (Ross, 2015). Moon (2018) discusses three
different approaches for sales force composite:
• The grass roots approach
• The sales management approach
• The distributor approach
The grass roots approach consolidates forecasts from individual salespeople covering
different regions, products and customers. The sales management approach instead uses sales
executives on a higher level to generate forecasts and the distributor approach uses
predictions from independent distributors of the company’s products.
A study into the subject of sales force forecasting was performed by McCarthy Byrne et al.
(2011) with some key findings presented below:
• Almost 82% of the salespeople surveyed participate in forecasting
• Only 14% of salespeople receive training in forecasting
• More than 47% of salespeople report that they have had either no, little, or some
knowledge of what happens to their forecasts after they are submitted
• Only 16% of salespeople have access to forecasting software to assist them in their
forecasting tasks.
• Less than half of the salespeople believe that the quality of their forecasts affects their
performance evaluations.
The conclusions drawn from the key findings from this study is that the sales department is in
most cases involved and responsible for the forecasting process, while not getting the
training, resources and support needed to perform the task in the best way (Moon, 2018). The
findings thereby illustrate a gap in expectations versus prerequisites for the sales force
composite forecasting method.
Despite this there are still important advantages linked to the sales force composite method.
Firstly, it has the advantage of incorporating the expertise and specialised knowledge of the
people who work closest to the customers and the market. Secondly, it places the
responsibility on those who are directly affected by the impact of the forecasts (Moon, 2018).
The sales force composite method has the greatest potential when it comes to business with
large project- or proposal-based markets. As the forecasts then becomes dependent on the
individual salesperson to estimate the likelihood of securing large orders. With this type of
businesses, the salespeople work closely with the customers and have good insights in what
quantities, timeframe and products that are involved in the proposal negotiation, which makes
them essential for the forecasting process.
Accuracy of qualitative forecasting
The accuracy of qualitative forecasts is highly dependent on the knowledge of the forecaster
and is often subject to individual biases and limitations. To counter this behaviour feedback is
essential in qualitative forecasting as it enables the forecaster to learn and improve the quality

16
(Moon, 2018). However, feedback is not enough to remove biases and different
organisational agendas that affects the forecasts. The two most common biases are inflicted
by the sales organisation where one bias is created when forecasters in the sales organisation
have the perception that the forecast will affect their quota or sales target, which leads to a
downward bias in the forecasts. The other common bias is created when there is a belief of
capacity constraints and the forecasts become upward biased to guarantee that enough
products are produced to satisfy the customer (Moon, 2018).
There are not only biases within the sales organisation, Syntetos et al. (2009) have in their
study found that judgemental adjustments also are subject to biases and other agendas. In
their findings they found that positive adjustments often are result of biases, positivism and
pressure form top management and have a negative effect on the accuracy. While negative
adjustments are more effective and leads to more accurate forecasts, both for intermittent and
stable demand (Fildes et al., 2009, Syntetos et al., 2009).
Quantitative Methods
Although the focus of this thesis is directed towards forecasting management, it is still
important to have an understanding about the strengths and weaknesses of quantitative
methods and when to incorporate them into the forecasting process. As earlier mentioned in
this chapter, accuracy can often be enhanced by the integration of both qualitative and
quantitative methods.
Gilliland (2010) explains quantitative methods as passive with respect to the behaviour of the
market it is estimating, meaning that it models the demand behaviour that it is given without
any possibility to change the behaviour. Therefore, stable markets with repeating patterns will
be forecasted with high accuracy and with low effort, while volatile markets with inconsistent
patterns will be forecasted inaccurate regardless of which quantitative method used. Moon
(2018) also highlights the passive characteristics of quantitative methods and that it is not
always useful. However, in most cases, he believes that quantitative forecasts are excellent
baselines to start forecasting from as understanding historical demand, whether there are
consistent patterns or not, can help reveal relationships between demand and other factors.
Quantitative methods can be divided into two categories depending on which patterns that is
used to predict the future. The first category refers to patterns that are associated with time,
where time-series is the most popular method. The other category is called associative which
uses regression or other methods to predict pattern that are influenced by various other factors
than time (Moon, 2018, Ross, 2015).
In most cases quantitative methods can be used to generate a baseline forecast, which then
can be developed further with use of qualitative input. It can also be used as an input to a
sales force composite forecast to test the reliability of the forecast. In any case the literature
agrees on that the incorporation of both quantitative and qualitative methods is the way to go
in the majority of forecasting applications (Armstrong, 2005, Gilliland, 2010, Moon, 2018,
Ross, 2015, Silver, 2017, Syntetos et al., 2009)
17
Integration of Qualitative and Quantitative Methods
By combining qualitative and quantitative methods the accuracy of the forecasting process
can be improved, Seifert and Hadida (2013) have identified that the optimal mix of
qualitative and quantitative methods depends on the context of the business, which includes
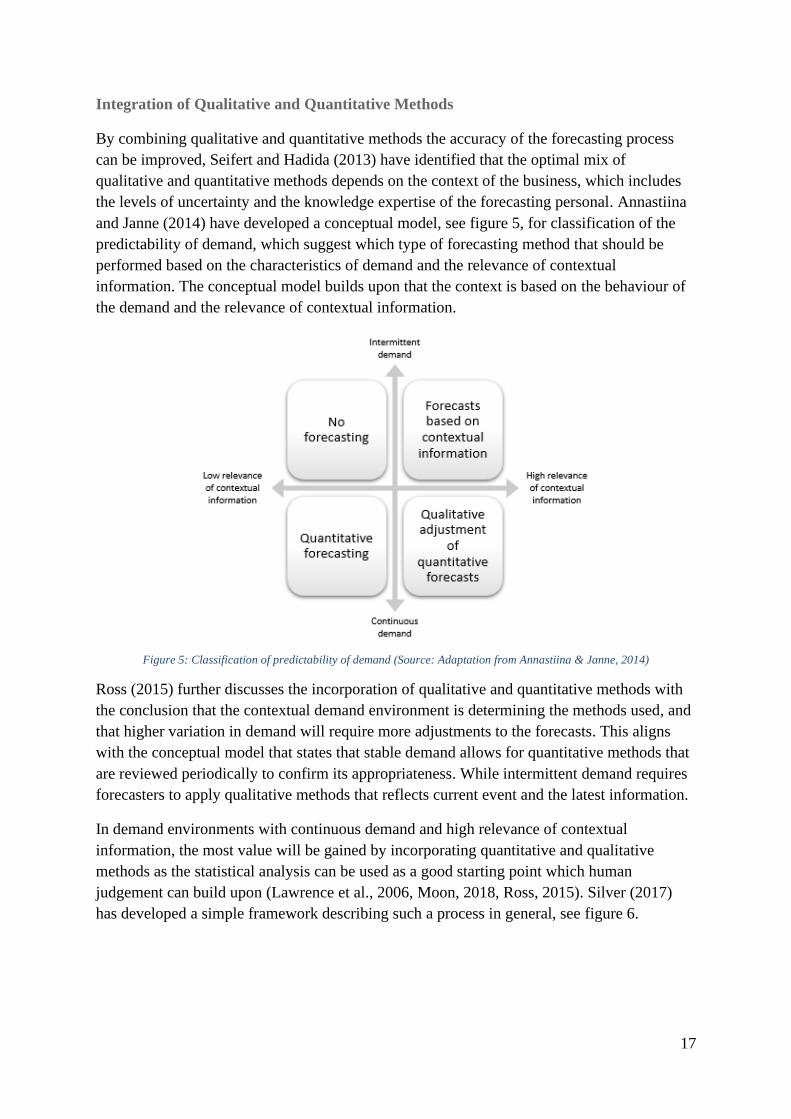
the levels of uncertainty and the knowledge expertise of the forecasting personal. Annastiina
and Janne (2014) have developed a conceptual model, see figure 5, for classification of the
predictability of demand, which suggest which type of forecasting method that should be
performed based on the characteristics of demand and the relevance of contextual
information. The conceptual model builds upon that the context is based on the behaviour of
the demand and the relevance of contextual information.
Figure 5: Classification of predictability of demand (Source: Adaptation from Annastiina & Janne, 2014)
Ross (2015) further discusses the incorporation of qualitative and quantitative methods with
the conclusion that the contextual demand environment is determining the methods used, and
that higher variation in demand will require more adjustments to the forecasts. This aligns
with the conceptual model that states that stable demand allows for quantitative methods that
are reviewed periodically to confirm its appropriateness. While intermittent demand requires
forecasters to apply qualitative methods that reflects current event and the latest information.
In demand environments with continuous demand and high relevance of contextual
information, the most value will be gained by incorporating quantitative and qualitative
methods as the statistical analysis can be used as a good starting point which human
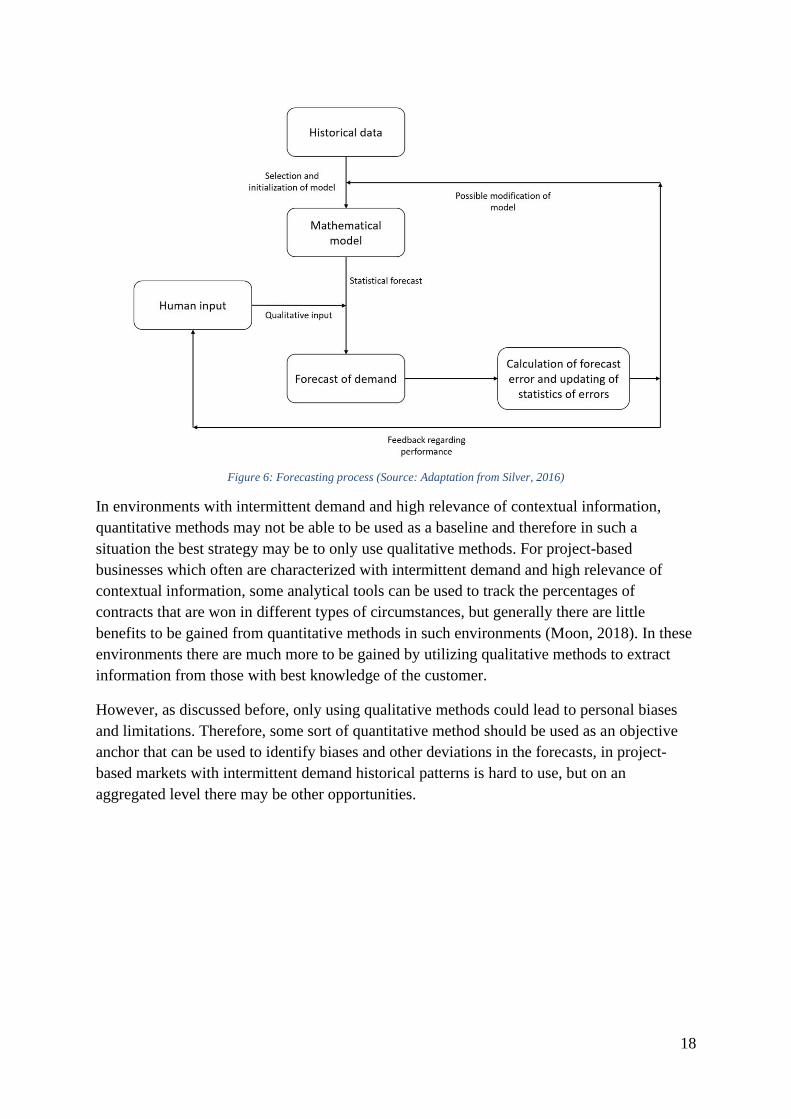
judgement can build upon (Lawrence et al., 2006, Moon, 2018, Ross, 2015). Silver (2017)
has developed a simple framework describing such a process in general, see figure 6.
18
Figure 6: Forecasting process (Source: Adaptation from Silver, 2016)
In environments with intermittent demand and high relevance of contextual information,
quantitative methods may not be able to be used as a baseline and therefore in such a
situation the best strategy may be to only use qualitative methods. For project-based
businesses which often are characterized with intermittent demand and high relevance of
contextual information, some analytical tools can be used to track the percentages of
contracts that are won in different types of circumstances, but generally there are little
benefits to be gained from quantitative methods in such environments (Moon, 2018). In these
environments there are much more to be gained by utilizing qualitative methods to extract
information from those with best knowledge of the customer.
However, as discussed before, only using qualitative methods could lead to personal biases
and limitations. Therefore, some sort of quantitative method should be used as an objective
anchor that can be used to identify biases and other deviations in the forecasts, in project-
based markets with intermittent demand historical patterns is hard to use, but on an
aggregated level there may be other opportunities.

19
2.4.3 Ways to Improve the Forecasting Process
There are multiple ways to improve forecasting performance for a company and as the
process differ between organisations, a solution that works for one company may not yield
the same results for another company. Moon et al. (1998) suggest seven key principles for
forecasting management which are key areas of common mistakes and opportunities for
improvement. The keys are based on multiple case audits and years of experience from the
authors and are still relevant today in forecasting management and supported by newer
literature (Fildes and Fotios, 2015, Moon, 2018). The keys are explained in table 2.
Table 2: Seven keys to better forecasting (Source: adapted from Moon et al 1998)
Keys Issues Actions Results
What
forecasting is
and what it is
not
● Computer systems as
focus, rather than
management processes
● Blurring of the
distinction between
forecasts, plans and
goals
● Establish a forecasting
group
● Implement management
control systems
● Derive plans from
forecasts
● Distinguish between
forecasts and goals
● An environment in
which forecasting is
acknowledged as a
critical business
function
● Accuracy emphasized,
and game-playing
minimized
Forecast
demand, plan
supply
● Shipment history as the
basis for forecasting
demand
● Too accurate forecasts
● Identify sources of
information
● Build systems to
capture key demand
● Improved capital
planning and customer
service
Communicate,
cooperate and
collaborate
● Duplication of
forecasting effort
● Mistrust of the official
forecast
● Little understanding of
the impact throughout
the firm
● Establish cross-
functional approach to
forecasting
● Establish independent
forecasting group
● All relevant information
used to generate
forecasts
● Forecasts trusted by
users
● More accurate and
relevant forecasts
Eliminate
islands of
analysis
● Mistrust and inadequate
information leading
different users to create
their own forecasts
● Build a single
forecasting
infrastructure
● Provide training for
both users and
developers of forecasts
● More accurate, relevant
and credible forecasts
● Optimized investments
in
information/communica
tion systems
Use tools
wisely
● Relying solely on
qualitative or
quantitative methods
● Cost/benefit of
additional information
● Integrate quantitative
and qualitative methods
● Identify sources of
improved accuracy and
increased error
● Process improvement in
efficiency and
effectiveness
Make it
important
● No accountability for
poor forecasts
● Developers not
understanding how
forecasts are used
● Training developers to
understand implication
of poor forecasts
● Include forecasts
performance in
individual performance
● Developers taking
forecasts seriously
● A striving for accuracy
● More accuracy and
credibility
Measure,
measure,
measure
● Not knowing if the firm
is getting better
● Accuracy not measured
at relevant levels of
aggregation
● Inability to isolate
sources of forecast error
● Establish
multidimensional
metrics
● Incorporate multi-level
measures
● Measure accuracy
whenever and wherever
forecasts are adjusted
● Forecast performance
included in individual
performance plans
● Sources of errors can be
isolated and targeted for
improvement
● Greater confidence in
forecasting process

20
What forecasting is and what it is not
One of the key principles to improve forecasting performance is to have complete
understanding of what it actually is and what it is not. A common mistake is thinking that the
most important aspect when designing a forecasting process is about which software or
system that should be used to prepare the forecasts. The mindset used is that with a good
forecasting software the forecasts will be of high quality and accurate as well. Moon et al.
(1998) have during their audits experienced multiple instances where advanced and
expensive forecasting systems have been put in place but fails to perform due to lack of
effective management to control and monitor the forecasting process.
Another common mistake is where companies mixes forecasting together with planning and
goal setting, leading to game-playing, i.e. intentional over or under forecasting (Moon et al.,
1998) which is a common source of bias affecting the forecasting accuracy.
Companies who have been more successful in recognising forecasting as a management
process have in some cases organised independent forecasting groups or departments with
full responsibility for the complete forecasting process. The group or department have full
ownership and accountability for all aspects connected to the forecast and provides training in
systems, processes and establishes communication between departments with valuable
information to the forecast (Moon et al., 1998).
Forecast demand, plan supply
Another key aspect and common mistake is to fail in forecasting the true demand and instead
forecasting the business ability to supply goods and services to the customer. It is important
to forecast the true demand and not involve constraints from the capacity in the supply chain.
By forecasting true demand and identifying where in the supply chain the capacity cannot
fulfil the demand, the company can gain valuable information regarding where the capacity
needs to be improved which will help establish long term capital planning of the business. If
the forecasting process would only forecast the constrained demand, the accuracy would
logically be very high, but it would fail to identify the hidden demand that could not be
fulfilled, which could reveal important business opportunities and market potential (Moon et
al., 1998). Gilliland (2010) describes constrained demand as a metric of how much of the true
demand that can be fulfilled after incorporating any limitations in the business ability to
provide the products or services demanded and thus constrained demand will always be equal
or less than the true demand.
Communicate, cooperate and collaborate
To achieve effective forecasting, it is critical to obtain input and information from different
departments within the organisation which all have different knowledge and insights that can
help improve the accuracy. Unfortunately, there is often unwillingness and barriers in
companies to work across functions to achieve higher performance in the forecasting process
(Moon et al., 1998). Overcoming the barriers and achieve higher performance relies on a

21
great deal of communication across departments. Moon et al. (1998) have distinguished three
levels of cross functional process maturity: communication, cooperation and collaboration.
The first level is communication, which takes form in a one-way communication where one
department, responsible for the forecasts, informs other functions about the results and efforts
of their work. A result of this low level of communication is mistrust in the information, as
there is no common understanding or reasoning behind the forecasts.
Cooperation is the next level where cooperative meetings are held but are often biased
towards one department who owns the forecasts and will work to persuade the other functions
to accept the forecast created. Cooperation is superior to communication as it is a two-way
communication where there is an opportunity to open a dialogue and question the decisions
taken. This leads to several consequences where critical information from other departments
may be lost and the forecasts will become non-trustworthy by the users in the organisation.
In order to reach high forecasting performance and higher accuracy, it is important to
establish mechanisms that enables people from different departments to gather in a spirit of
collaboration where the purpose is to reach an unbiased consensus forecast. This is most
easily organized by an independent forecasting group or function that can guarantee that all
information is considered in creating the forecast. This leads to a consensus-based forecast
that every department trusts and knows is the best estimation of the future demand, resulting
in a more effective forecasting process.
Eliminate islands of analysis
When communication is lacking across different functions and departments in a company,
island of analysis emerges. The situation where each department produces its own forecast in
lack of trust in the “official” one is a typical example of islands of analysis. This leads to the
same type of analysis in multiple departments where no one have access to all information
and department specific biases are introduced which leads to bad performance and
inefficiency in the business. Island of analysis are often supported by independent computer
systems that are not interlinked with other systems used in the organisation. This makes data
transfers hard and certain information are tied to certain systems which enhances the barrier
in cross-functionality. To solve this problem management must devote attention to
eliminating factors that enables island of analysis, one way to achieve this is to have clear
process structures that encourages cross functional collaboration and a central system that can
support the cross-functional collaboration (Moon et al., 1998).
Use tools wisely
The fifth key aspect to better forecasting management is to use systems and tools wisely. One
common phenomenon is the tendency to try and fix poor forecasting with new systems
(Moon, 2018). The belief that a sophisticated system will solve all problems should be
avoided, the important aspect is rather to understand what benefits that can be gained by the
tools and what strengths and weaknesses different methods have. Using tools and methods
22
wisely requires knowledge regarding each tool in order to design a process where the
advantage of each tool and method is used to its fullest extent.
There is also a tendency among companies to solely rely either on qualitative or quantitative
methods. The key is that qualitative and quantitative methods together delivers the best
performance, if used wisely and in the context of the business. A process should be
implemented that uses quantitative methods and tools to analyse historical demand and
relationships with external factors, and qualitative corrections and inputs from departments
and management with important knowledge regarding the market, products and financial
trends (Moon et al., 1998). This is a general recommendation that must be redesigned and
adopted to the specific context of the business environment.
Make it important
The phrase “What gets measured gets rewarded, and what gets rewarded gets done” by Moon
et al. (1998) is a development of the original cliché and phrase “If you can measure it, you
can manage it” which is a key foundation in the last two key principles.
The importance of the forecasting process is often recognised by management in
organisations but there is a gap between the words by management and their actions. Those
involved in the forecasting process is often told about the importance of the process but there
are seldom any rewards for doing a work well done or punish if the work is done poorly. This
perceived lack of interest has consequences in the accountability of the forecasts which leads
to manipulation of the forecast or in some cases island of analysis (Moon et al., 1998).
An important aspect of making the forecasting process important is to make everyone
involved familiar with the process, so there exists an understanding regarding the outcome of
the process and how it affects the success of the business. If the ones involved have a good
understanding of the impact of their input, the task will be taken more seriously and the
motivation for doing it right will improve. Some practical steps to take to lessen the gap in
forecasting importance is to give everyone involved training in forecasting techniques and
processes, as well as incorporate performance metrics that increases the understanding of the
impact of the forecasts.
Measure, measure and measure
A key to be able to reward good work and finding opportunities for improvements is to
measure performance in the process. Without performance metrics, changes in the process
cannot be analysed, and continuous feedback to improve the performance cannot be provided.
Therefore, performance measurements and feedback should be integrated in the process as a
standard for continuous improvements. This is of importance both for improvements in the
management process but also for those who contributing to the forecast, so they can learn
what was effective and correct, and what was not (Moon, 2018).
This is further strengthened by Lawrence et al. (2006) who presents the value of feedback as
one of the key findings in the last 25 years as it enables judgemental forecasters to learn and

23
improve. But even though it has been a key finding in the literature for a long time, it is still
one of the areas which lacks the most attention in today’s businesses (Moon, 2018).
With performance measurements and constant feedback loops of accuracy, the confidence in
the forecasting process will increase. With confidence in the process, users will trust the
mechanisms in place to eliminate sources of errors and the process will be able to support all
departments in the business, removing islands of analysis and enable the business to assess
the financial outcome from forecasting management improvements (Moon et al., 1998).
2.5 Audit Framework
The general key characteristics of forecasting that has been present during the literature study
is that forecasting is a management process that can differ greatly depending on the
contextual environment, organisational structure and size of the business. As a result, there is
no perfect forecast solution for all businesses, but rather that every forecast process needs to
be developed to fit with the context and prerequires of the specific business and the
characteristics of the associated demand. Moon and Mentzer are two authors that are among
the top in the field of forecasting and have been used frequently during this literature study.
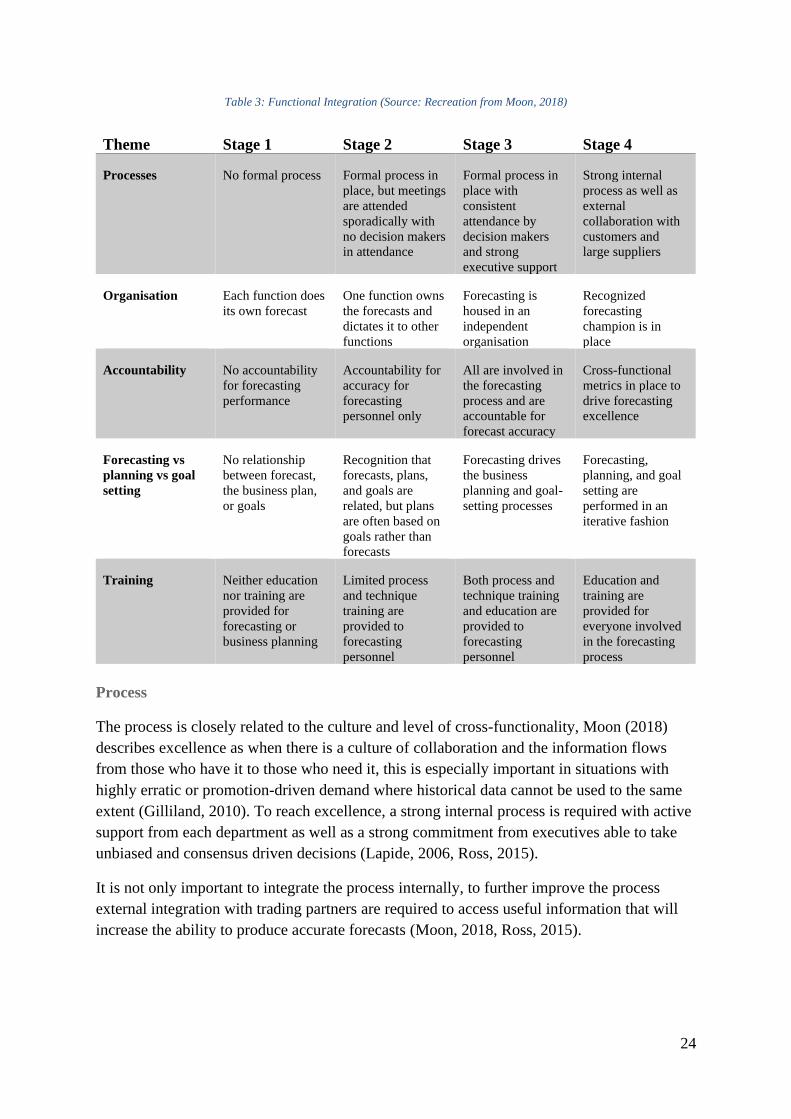
Moon and Mentzer have during multiple years and publications developed a framework for
auditing forecasting processes dividing the area into four dimensions: Functional Integration,
Approach, Systems and Performance Measurements (Mentzer and Moon, 2005, Moon, 2018,
Moon et al., 2003). In each of the dimensions they have identified a set of characteristics that
translate into different stages of forecasting sophistication. The characteristics are general but
still needs to be adapted to the specific context of the audited company.
2.5.1 Functional Integration
The dimension of functional integration aims to answer the general question of “How
successful is the company at getting information from those who have it to those who need it,
in order to support the forecasting of the demand?”. Functional integration is closely related
to the organisational structure and culture and aims to describe the transparency,
collaboration and coordination used in the forecasting process. To answer how well the
forecasting process is integrated in the business, Moon (2018) has in table 3 described
characteristics related to four stages of sophistication where stage four is considered best
practice or excellence.
24
Table 3: Functional Integration (Source: Recreation from Moon, 2018)
Theme Stage 1 Stage 2 Stage 3 Stage 4
Processes No formal process Formal process in
place, but meetings
are attended
sporadically with
no decision makers
in attendance
Formal process in
place with
consistent
attendance by
decision makers
and strong
executive support
Strong internal
process as well as
external
collaboration with
customers and
large suppliers
Organisation Each function does
its own forecast
One function owns
the forecasts and
dictates it to other
functions
Forecasting is
housed in an
independent
organisation
Recognized
forecasting
champion is in
place
Accountability No accountability
for forecasting
performance
Accountability for
accuracy for
forecasting
personnel only
All are involved in
the forecasting
process and are
accountable for
forecast accuracy
Cross-functional
metrics in place to
drive forecasting
excellence
Forecasting vs
planning vs goal
setting
No relationship
between forecast,
the business plan,
or goals
Recognition that
forecasts, plans,
and goals are
related, but plans
are often based on
goals rather than
forecasts
Forecasting drives
the business
planning and goal-
setting processes
Forecasting,
planning, and goal
setting are
performed in an
iterative fashion
Training Neither education
nor training are
provided for
forecasting or
business planning
Limited process
and technique
training are
provided to
forecasting
personnel
Both process and
technique training
and education are
provided to
forecasting
personnel
Education and
training are
provided for
everyone involved
in the forecasting
process
Process
The process is closely related to the culture and level of cross-functionality, Moon (2018)
describes excellence as when there is a culture of collaboration and the information flows
from those who have it to those who need it, this is especially important in situations with
highly erratic or promotion-driven demand where historical data cannot be used to the same
extent (Gilliland, 2010). To reach excellence, a strong internal process is required with active
support from each department as well as a strong commitment from executives able to take
unbiased and consensus driven decisions (Lapide, 2006, Ross, 2015).
It is not only important to integrate the process internally, to further improve the process
external integration with trading partners are required to access useful information that will
increase the ability to produce accurate forecasts (Moon, 2018, Ross, 2015).
25
Organisation
Information should be shared among the departments through formal communication
procedures to leverage all information available in the organisation (McCarthy et al., 2006).
Leaving out different department perspectives leads to biased forecasts that is solely based on
the objectives of the department generating the forecast, introducing islands of analysis. Oliva
and Watson (2009) argues that creation of an independent group that manages the consensus
forecasting process is an effective way of managing biases and different departmental targets.
Moon (2018) also suggests an independent group that is not organisationally aligned with any
department, but at the same time realises that it is not ideal in practise with existing
organisational structures. Instead Moon (2018) suggest that there should be a group that is
culturally independent and if it has to belong to some department it should belong to the
demand function as it is the department that should have the best insights into the demand
and market characteristics. The person leading the forecasting group should be known in the
organisation as culturally independent and unbiased (“Forecasting Champion”), and the
group should in addition to manage the process, also advocate for developing the culture,
processes and tools that are needed to make forecasting successful (Moon, 2018). It is
however important to remember that forecasting is a team effort and should not be entrusted
solely to one person or a forecast champion as it will create a “black box” where only the
expert knows what is happening without any transparency to the rest of the organisation
(Ross, 2015).
McCarthy et al. (2006) on the other hand argues how a true consensus forecast is not
developed by one department concluding the information from multiple departments into a
final forecast, but rather a forecast developed by an inter-functional group with each member
contributing with information from their specific perspective. With the common goal of
forecasting accuracy and no departmental targets, this is an approach that can reduce the
biases originating from departmental targets and other political agendas.
Accountability
As discussed previously regarding the forecasting process, it requires active support and
involvement from each department in the organisation. But it also requires accountability for
each contribution to the forecast, without accountability for each contribution biases and
other departmental targets will influence the forecast and affect the accuracy of the forecast
(Lapide, 2006). This is especially important in contexts where sales forecasting is used, and
the forecasting process is dependent on qualitative input from the sales department where
biases are common. Moon (2018) suggests that in such cases all contributions to the forecast
process must be measured, and held accountable through rewards and consequences
depending on their performance, which relates to the seventh principle in chapter 2.4.3,
“What gets measured gets rewarded, and what gets rewarded gets done” (Moon et al., 1998).
Measuring forecasting accuracy is however only a process measure that tells how well the
process performs, but is not connected to how it affects the business and its outcome. Davis
and Mentzer (2007) therefore argues that the performance metrics should include cross-

26
functional outcome measures as well that connects the forecasting performance to other
performance measurements like finished goods inventory.
Forecasting vs planning vs goal setting
Forecasting, planning and goal setting are three activities that are related in multiple ways
and the different characteristics in this theme describes how well related they are within the
process. In chapter 2.2, the main differences between forecasting and planning were
discussed which concluded that forecasts, a best guess about future demand, precedes plans,
which are the decisions on which actions to take. The main mistakes are when plans precedes
forecasts and when the events do not match the expected outcome, the forecasts is changed
with the belief that changing the forecasts will change the outcome (Ross, 2015).
Oliva and Watson (2009) highlights how forecasts tend to be biased by goal setting pressures
from upper management, which must be controlled in the way goal setting and forecasts
interacts and are related in the process.
Moon (2018) explains the ideal state where both forecasts and goals are input into the overall
planning process. If the forecasts do not match or live up to the goals, various gap closing
strategies can be developed that are translated into actions included in the resulting plan.
Based on the plan and the forecasts, new targets can be set to stimulate the businesses
motivational efforts.
Training
Training is an essential part of the functional integration, as extensive training and education
could influence the culture to better support the forecasting process and therefore increase the
performance. By providing training for those involved in the forecasting process, they does
not only learn how the process works and which tools to use, it also creates an holistic
understanding about why forecasting is essential which will influence the overall culture and
create prerequisites for higher forecasting performance (Moon, 2018). This is not only
important for the forecasting personnel, but also for the managers and executives making
corrections and ultimately sign-off on the forecasts. Ross (2015) highlights the importance
for managers to understand the methods and techniques used in developing the forecasts to be
able to trust the output produced and not applying informal techniques including own biases.
By being aware of the possible biases and being trained in how to utilize methods and tools to
counter bias and political pressure will lead to improvements in accuracy (Fildes et al., 2009).
Another important aspect of training is discussed by Silver (2017) who promotes feedback as
a means to learn from earlier successes and mistakes. By providing continuous individual
feedback, biases and targeted incentives can also be identified and corrected.
2.5.2 Approach
The second dimension called approach aims to answer the question of “What are the
techniques and processes used to create forecasts?”. This dimension aims to investigate what
elements and activities that are part of the process and how they are deployed to create

27
forecasts. This relates to literature covering different techniques and the integration between
qualitative and quantitative methods. Table 4 describes the included themes and
characteristics related to the approach dimension of forecasting.
Table 4: Approach (Source: Recreation from Moon, 2018)
Theme Stage 1 Stage 2 Stage 3 Stage 4
Forecasting point
of view
Plan-driven
forecasting
orientation
Bottom-up
forecasting
orientation
Both top-down and
bottom-up
forecasting
orientation
Top-down and
bottom-up
forecasting with
detailed
reconciliation
What is being
forecasted
Shipments are the
basis for historical
analysis
Shipments plus
backorder
adjustments are the
basis for historical
analysis
Shipments and
backorder
adjustments, plus
self-recognised
demand, are the
basis for historical
analysis
Complete visibility
of sell-in and sell-
through allows
modelling of true
demand
Forecasting
hierarchy
No hierarchy is in
place
Partially defined
hierarchy is in
place
Complete hierarchy
is in place
Complete hierarchy
in place, with
reconciliation
possible between
levels
Statistical analysis No statistical
analysis of
historical demand
Limited use of
simple statistical
models
Appropriate use of
time-series models
Both time-series
and regression
models used
appropriately
Incorporation of
qualitative input
Little to no
qualitative
judgments are used
to augment
statistical forecasts
Sales, marketing,
and senior
executives
participate in the
process, but their
input is often
highly biased
because of other
agendas
Sales, marketing,
and senior
executives provide
unbiased
judgement leading
to appropriate
adjustment of
statistical forecasts
Both internal and
external sources of
qualitative
judgement are
incorporated into
the forecasting
process
Forecasting point of view
Forecasting can be performed using two orientations, top-down or bottom-up, and which to
use depends on the context. When forecasting intermittent demand and using the salesforce to
gather information about the future demand is a typical bottom-up approach where the
forecasts is developed at component level for each customer and then consolidated into a
aggregated forecast for the market. Lapide (2006) highlights how the global market with
increased volatility needs more market intelligence incorporated into the forecasting process.
He argues how a top-down approach can increase the accuracy of bottom-up forecasts as the
top-down forecasts focuses on aggregated market demand which is less volatile than its
individual components. By combining the two the advantage of both can be utilized and
increase the accuracy (Armstrong, 2005). Moon (2018) also advocates the use of both in

28
conjunction with each other, but also highlights the importance of analysing the differences
between the two to gain more useful results and valuable insights about the market dynamics.
A bottom-up approach is however a very time-consuming approach, involving lots of people
and managers across the organisation and adding a top-down approach increases the already
high workload. Gilliland (2010) therefore discusses how the time and resources must be
considered when choosing approach, where a bottom-up approach is most suited and
provides highest value in contexts with intermittent demand.
What is being forecasted
When forecasting and especially when using historical data to predict the future, it is
important to acknowledge which type of data that is used and what the data represents when
used in the forecasting process. Silver (2017) explains that there needs to be a good way of
interpreting the historical data in order to distinguish between historical shipments and the
historical demand. Otherwise a period with a stockout would be interpreted as a period
without any demand. According to Ross (2015) it is also important to consider and look at
related information as sales promotions, price alterations, competitor actions and new
products to get an unbiased and true estimation of the true demand.
Moon (2018) suggests that by creating a record of lost orders, companies can recognise and
consider the uncaptured demand and thus base future predictions on historical data that in a
good way represents true historical demand.
Forecasting hierarchy
In chapter 2.1 the importance of forecasting was discussed and how multiple departments in
the organisation uses and depends on forecasts in different ways, see table 1. Different
departments use forecasts at different levels of hierarchy to get the information that is useful
for that specific business function. In the S&OP process, different forecasting hierarchies are
important to in an effective way leverage top-down and bottom-up forecasting approaches, as
forecasts needs to be reviewed and revised at multiple levels of aggregation (Lapide, 2006).
However, a common mistake is to include forecasting hierarchies that are more granular than
needed for the forecasting practice, which will increase the workload and resources spent on
processing data (Gilliland, 2010). A true stage four characteristics is by Moon (2018)
explained as when people are able to insert information at the level they know it and then
extract information at the level they need it. This characteristic enables information to flow
among the levels and support all functions in the business relying on different levels of
forecasts. It is however important to remember that the sum of each forecasting level should
be equal to all each other forecasting levels, so that the sum of the item level forecast is equal
to the warehouse level forecast and so on (Gilliland, 2010).

29
Statistical analysis
Quantitative and statistical methods is a broad subject within forecasting, but an important
thing to remember is that forecasting performance is more dependent by the forecastability of
the demand than by the sophistication of any statistical method (Gilliland, 2010). As
discussed in chapter 2.4.2, there is a common understanding in the literature that statistical
methods aren’t always applicable, statistical methods work well as long as there are patterns
to the historical demand and a low level of randomness and fluctuations in the demand
(Chopra and Meindl, 2014, Gilliland, 2010, Makridakis et al., 2008, Mentzer and Moon,
2005, Moon, 2018, Ross, 2015, Silver, 2017). While for project-based businesses with
intermittent demand, statistical forecasting will not provide much benefit as there are no
patterns in the historical demand. This does not mean that every project based company are
considered a stage one accordingly to the characteristics by Moon (2018), stage one are
characterized by companies that can gain important insights by using statistical methods but
does not utilize any.
However when it comes to excellence in statistical methods there are different opinions.
Moon (2018) argues that excellence is reached when using sophisticated software and
multiple techniques including both time-series algorithms and regression modelling to get the
most accurate forecasts and uncover relationships between independent variables in the
demand. Ross (2015) however, argues that forecasters should deploy simplistic methods that
are easy to use and understandable for everyone. When using complex techniques and
sophisticated calculations the forecasting process can be turned into a “black box” where only
a few experts know what the forecast is based on and how it is created. There is also a
common mistake of using over-complicated statistical techniques to solve relatively simple
forecasting problems which also enhances the “black box” effect and is a waste of resources
and processing power (Ross, 2015).
Incorporation of qualitative input
As discussed in the previous theme, statistical methods are not always applicable and when
used, often requires some sort of adjustment or correction which is why incorporation of
qualitative input is of such importance for forecasting practises. A business that blindly
executes a statistical forecast without gaining consensus and input from management and
other affected functions will get varied results (Ross, 2015).
Qualitative input and a collaborative approach are most vital in contexts where the demand is
intermittent as the more variation that occurs in the demand, the more the forecasts has to be
adjusted (Ross, 2015). For project-based businesses, where companies bid for contracts with
their customers, Moon (2018) describes how there is little to be gained from statistical
models and the focus should be to get insights from those who works closest to the customer
and have direct knowledge of the customer. The judgement and knowledge domain of the
sales department is in this situation a vital component in the establishment of an accurate
forecast. Consensus forecasting has also been proving a sufficient mechanism for managing
biases in the process as consensus and qualitative input is gained from multiple departments
30
and management teams (Oliva and Watson, 2009). Syntetos et al. (2009) however suggests
that consensus is not enough to avoid optimism and biases in the qualitative input and
highlights the need for the right motivation, monitoring and training in the forecasting
process.
Robert and Paul (2007) highlight the importance of documenting the rationale for each input
as a means to incorporate learning of when the use of judgement is appropriate and when it is
not. It also adds effort to making an adjustment and forces employees to think rationally
about their reason for adjusting and incorporates a feeling of accountability.
Research into the effects of qualitative adjustments has shown that positive adjustments tend
to be less effective than negative, and that the most common mistake is to overestimate the
demand (Fildes et al., 2009), which relates to the common bias of optimism (Ross, 2015).
Syntetos et al. (2009) has also researched about the effects of qualitative adjustments, but in
the context of intermittent demand, with the same finding that negative adjustments are more
effective than positive and contributes to more accurate forecasts. Another finding was that
large adjustments were more effective in contributing with high accuracy than small
adjustments.
Moon (2018) explains that consensus and collaboration efforts should not be limited to
internal functions, but also be extended to external entities such as customers and supply-
chain partners. Qualitative input and adjustments from external sources can contribute with
considerable insights about the future demand and market behaviour.
2.5.3 Systems
The third dimension refers to the systems and the technical support that is available to the
forecasting process. The different themes in this dimension describe the tools of forecasting
and how well they support the demand/supply integration. Earlier in the literature study when
studying the seven principles for better forecasting it was concluded that a forecasting system
cannot solve all forecasting problems and that the main priority should be to work with the
process instead of investing money in new systems. Moon (2018) presents a general rule of
thumb that the culture represents 60% of the challenge, the process represents 30% and the
tools only 10%. But while the tools only represent a small fraction of the challenge, it is still
an important fraction that are needed to support the process and culture. Table 5 describes the
themes of the dimension and characteristics for the different stages.
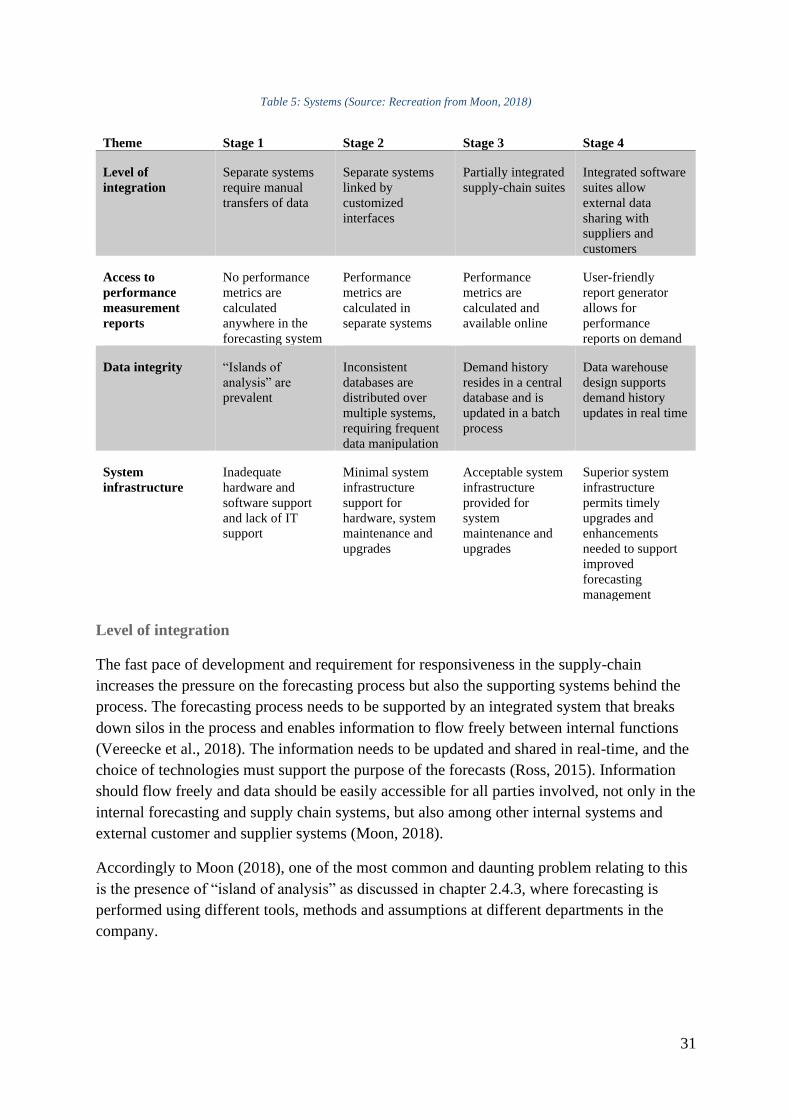
31
Table 5: Systems (Source: Recreation from Moon, 2018)
Theme Stage 1 Stage 2 Stage 3 Stage 4
Level of
integration
Separate systems
require manual
transfers of data
Separate systems
linked by
customized
interfaces
Partially integrated
supply-chain suites
Integrated software
suites allow
external data
sharing with
suppliers and
customers
Access to
performance
measurement
reports
No performance
metrics are
calculated
anywhere in the
forecasting system
Performance
metrics are
calculated in
separate systems
Performance
metrics are
calculated and
available online
User-friendly
report generator
allows for
performance
reports on demand
Data integrity “Islands of
analysis” are
prevalent
Inconsistent
databases are
distributed over
multiple systems,
requiring frequent
data manipulation
Demand history
resides in a central
database and is
updated in a batch
process
Data warehouse
design supports
demand history
updates in real time
System
infrastructure
Inadequate
hardware and
software support
and lack of IT
support
Minimal system
infrastructure
support for
hardware, system
maintenance and
upgrades
Acceptable system
infrastructure
provided for
system
maintenance and
upgrades
Superior system
infrastructure
permits timely
upgrades and
enhancements
needed to support
improved
forecasting
management
Level of integration
The fast pace of development and requirement for responsiveness in the supply-chain
increases the pressure on the forecasting process but also the supporting systems behind the
process. The forecasting process needs to be supported by an integrated system that breaks
down silos in the process and enables information to flow freely between internal functions
(Vereecke et al., 2018). The information needs to be updated and shared in real-time, and the
choice of technologies must support the purpose of the forecasts (Ross, 2015). Information
should flow freely and data should be easily accessible for all parties involved, not only in the
internal forecasting and supply chain systems, but also among other internal systems and
external customer and supplier systems (Moon, 2018).
Accordingly to Moon (2018), one of the most common and daunting problem relating to this
is the presence of “island of analysis” as discussed in chapter 2.4.3, where forecasting is
performed using different tools, methods and assumptions at different departments in the
company.
32
Access to performance measurement reports
Measuring performance is one of the most important aspects of improving a forecasting
process, and for management to be able to asses overall improvement efforts, good
performance metrics are needed. But to be able to do this, performance metrics needs to be
easily accessible in the forecasting system. The theme of performance measurements has
been discussed a lot in the literature, but the requirement for all affected parties to have easy
access to the metrics have only been discussed by a few authors.
Ross (2015) touches upon the matter by highlighting the importance of having the ability to
easily monitor and managing the forecasting process to continuously identify opportunities
for improvement in the process, improving the accuracy and reducing bias. Moon (2018)
develops this further and argues that performance metrics should be accessible directly from
the forecasting system, and that the system should have the capability to let the user design
their own performance reports to in a user-friendly way be able to analyse and compare the
metrics. The principle is that people should be able to access performance metrics in the
format that is needed, when it is needed (Moon, 2018).
Data integrity
As established in the dimensions of functional integration and approach, credibility is a major
factor in making the forecasting process work (Davis and Mentzer, 2007). There must be an
understanding and trust that the forecasts are properly produced, without biases and with
credible data. This results in the theme of data integrity which is crucial for maintaining
credibility throughout the process (Moon, 2018).
The prerequisites for maintaining data integrity is to have consistency in the data, as
discussed in the theme of forecasting hierarchies, data needs to be accessed at different levels
by multiple departments while the data must stay consistent (Gilliland, 2010). To keep
consistency, the data needs to be stored centrally with easy access for specified users (Moon,
2018), if stored at multiple locations consistency will be lost and island of analysis will
surface leading to bad data integrity and low credibility (Moon, 2006). Lapide (2006) also
highlights the requirement of keeping the data consistent and synchronised between all users
to support “slicing and dicing” of the data at different levels of aggregation.
System infrastructure
The final theme in the systems dimension is system infrastructure, which refers to the overall
infrastructural support for the forecasting systems used at the company. This subject have not
been researched in detail in the literature, but is mentioned as a prerequisite in the majority of
the literature touching upon the matter of forecasting systems and performance. Moon (2018)
has described the different stage characteristics, ranging from inadequate to superior, where
superior is characterised by full hardware support and is continuously updated for the best
possible performance.

33
2.5.4 Performance Measurements
The last dimension is called performance measurements and aims to answer the question of
“How demand forecasting performance is measured and rewarded?”. This dimension ties the
previous dimensions together by describing how well tools is used to measure the process in
order to influence the culture. The dimension of performance measurements only contains
two themes, shown in table 6, how performance is measured and how it is rewarded.
Table 6: Performance measurements (Source: Recreation from Moon, 2018)
Theme Stage 1 Stage 2 Stage 3 Stage 4
How is
performance
measured
Performance is not
measured
Accuracy is
measured,
primarily with
Mean Average
Percentage Error
(MAPE)
Accuracy is
measured with
MAPE, and bias is
graphically
depicted with PE
graphs
There are
multidimensional
metrics of
performance;
accuracy and bias
are tied to supply
chain metrics
How is
performance
rewarded
Performance is not
tied to any measure
of accuracy
Performance is tied
to accuracy for
forecasters only
Performance is tied
to accuracy for
everyone involved
in the demand
planning process
Supply chain
metrics and
customer service
metrics are shared
across the enterprise
How is performance measured
Measuring performance is one of the cornerstones in the forecasting process and is a
fundamental requirement in order to improve the process. When measuring performance in
forecasting processes there are two major factors that is being measured which is accuracy
and bias.
Gilliland (2010) suggests that it is better to measure performance against something that can
be unambiguously measured if the true demand cannot be measured in a reliable way. The
underlying principle is that the forecasts of what is going to happen is measured and
compared against what actually happened, which can be measured using actual orders or
shipments. Tracking and reviewing performance can also gain important insights in
improvement activities and should be used as a means to develop adjustments to the process
that increases the performance (Silver, 2017). Davis and Mentzer (2007) agrees that
performance measurements should be viewed as a source of information about forecasting
improvements, but also adds that it should be used to reward and promote success instead of
direct and affix blame.
Another way to identify improvement opportunities is to measure bias in the forecasting
process and locate systematic errors that decreases the performance (Moon, 2018). Ross
(2015) also highlights the importance of measuring biases in the process and suggests
measuring the magnitude of the variance between the cumulative forecasted demand and the
cumulative actual demand. In order to over time detect continuous divergence between the
forecasted demand and the actual demand.
34
Davis and Mentzer (2007) further highlights the importance to connect forecasting
performance to business performance as a means to evaluate and improve the business
forecasting capability. Business performance metrics can be referred to as outcome metrics
that are easier to set in perspective, such as inventory levels and expediting costs, which helps
management make better strategic decisions (Moon, 2018). It also helps the participants in
the forecasting process to understand the impact of their contribution to the forecasting
process (Vereecke et al., 2018).
How is performance rewarded
This theme is closely related to the accountability theme in the functional integration
dimension, as rewarding someone for their performance requires that they are accountable for
the performance. The underlying principle is that rewarding the performance will increase the
motivation and incentives to increase the performance (Moon, 2018). However, Davis and
Mentzer (2007) have found that rewarding performance in sales forecasting situations can
create personal incentives of altering with the demand to fulfil certain quotas, which leads to
an false estimation of the demand in the forecasts. Ross (2015) instead highlights feedback
and a clear structure of accountability as a means to inflict performance without rewarding it.
The authors are however consistent in suggesting supply-chain and business-related metrics
that should be shared across the company, whether it is for feedback, accountability or
rewarding purposes (Davis and Mentzer, 2007, Moon, 2018, Ross, 2015, Vereecke et al.,
2018).

35
3. Method
This chapter describes the different methods used to conduct the research. It aims to show
transparency and allow a critical assessment of the final conclusions and recommendations.
3.1 Choice of Methodological Approach
When conducting research there are three different approaches according to Yin (2009):
descriptive, exploratory and explanatory. In this study, an exploratory approach was used as
the purpose of the study was to research a contemporary problem within its real-life context
and extend the knowledge within forecasting rather than testing a hypothesis.
A case study research design was chosen following the recommendations of Collis (2014) as
it provides the possibility to study a phenomenon in depth and within its real-life context.
With Moon (2018) pinpointing how forecasting requires the involvement and insights from
multiple functions within the organization, it was further found well motivated to use a case
study design as it allows multiple units of analysis between the functions in the company.
Furthermore, case studies are appropriate when answering research questions beginning with
how or why and focuses on contemporary events (Blomkvist, 2015, Yin, 2009). Case studies
also allows for having an holistic approach (Yin, 2009) which is aligned with the reasoning of
Mentzer and Moon (2005) describing forecasting as a comprehensive process.
As the aim of the study was to get an understanding of how the forecasting process should be
designed to improve overall performance a qualitative method was used. A qualitative
method gives the ability to get a deep understanding about the studied subject and has the
opportunity to assemble both subjective and objective information. For collecting empirical
data semi-structured interviews was conducted together with observations at the company
which in combination contributes with creating validity to the study (Collis, 2014), as well as
it is a recommended approach for investigating a phenomenon or process in its real-life
context (Gephart and Rynes, 2004).
3.2 Research Design
The research design forms a plan on how the investigation was performed in a systematic
manner and to guide future researchers in the process of interpreting, collecting and analysing
data (Yin, 2014). It is important to document the research design for successful results and
for other researcher to be able to continue the work and develop further research studies
based on the work.
The study started off with an extensive pre-study to understand the subject of the
investigation and its context. The purpose of the pre-study was also to find out what work
that had been done earlier to address the problem and to understand the structure and
processes of the case company. The pre-study consisted of meetings, discussions with key
stakeholders in the investigated process and observations during meetings and workshops at
the company. From the pre-study, research problem, background and research questions were

36
developed. Relevant literature was also reviewed during the pre-study to extend the
knowledge within forecasting and to understand the observed behaviour, concepts and
problems.
During the pre-study, when the magnitude of the forecasting process at Ericsson became
clear, a decision was taken to delimit the study to only investigate two customer accounts
within one market area. The largest market area was chosen as it would yield the most
generalisable results and was also conveniently the closest area geographically, which made
interviews easier to conduct as there was no difference in time-zones. The two selected
customer accounts were chosen as they represented the biggest customers of Digital Services
products and could therefore provide the best and most valuable data for the investigated
business area. All decisions regarding how to best delimit the study to a feasible scope while
ensuring good data and generalisability was taken in consent with the case handler at
Ericsson.
Simultaneously with the pre-study an extensive literature study was performed to find
relevant information and knowledge within demand forecasting. This was done by reviewing
scientific journals, articles and books within the area of demand planning and forecasting.
The area of forecasting is extensive and involves a lot of literature, with help from the pre-
study the search could be limited to demand forecasting with focus on the management
process developing the forecasts, some methods and techniques was also reviewed that was
relevant for the context. During the literature study an audit framework was discovered that
was used as a base for the research design of this study. Figure 7 gives an overview of the
research design and is an adaptation from Moon et al. (2003) made to fit the context and
scope of this investigation.

37
Figure 7: Research design of study (Source: adaptation from Moon et al., 2003)
After the literature study was conducted the empirical data was gathered through semi-
structured interviews at the case company. The interviews were performed with key
stakeholders in the forecasting process and was with the individual’s permission recorded to
avoid misinterpretation. The collected data was used to map the current forecasting process
(As-Is State) and was assessed using the four dimensions from the audit framework by Moon
et al. (2003). The empirical results were then used together with the theory from the literature
to discuss and analyse how to best perform the process (Should-be State) in the specific
context of the company. Through discussions and analysis, conclusions were drawn with both
theoretical and managerial implications as well as limitations and suggestions for future
research.
3.2.1 Pre-Study
The research process started with a pre-study in order to formulate a scope for the research as
well as get an understanding regarding the analysis and purpose of the research. The process
started with multiple initial meetings with representatives at Ericsson and the supervisor at
KTH to discuss different possible areas to investigate. This was followed by reviewing
relevant literature to gain an understanding about the area, which gaps that were present in
the literature and which subjects that needed further research.
To further narrow the scope and get an understanding about the case context and problem
multiple unstructured meetings and interviews were performed with key stakeholders at
Ericsson, which is an effective method to get familiar with context in which the research
befalls suggested by (Collis, 2014). As Ericsson is such a large global company with a large

38
number of complex processes and abbreviations, the pre-study also included observations
where different meetings within the processes was attended to further get familiar with the
context and scope of the research.
Based on the information and knowledge gathered from the pre-study meetings, the literature
and Ericson’s problematization, a purpose and research questions were formulated for the
research. The extensive pre-study was an essential part of this study as it gave an important
contextual understanding about the problem area investigated.
3.2.2 Literature Study
An extensive literature study was conducted in order to understand and find relevant theories
within the context of the investigated subject of forecasting processes and management. The
literature study was an important part in designing and analysing the empirical study and
findings. The main purpose of the literature study was to give a detailed overview regarding
the current knowledge within forecasting and what findings that have been made previously.
The main literature areas reviewed concern forecasting management and processes, however
other areas like Sales & Operation Planning, Judgemental Forecasting and Demand Planning
have also been important parts of the literature study.
The literature used in this study was based on secondary sources with the majority being
books or articles from scientific journals. The data was collected through multiple online
databases with the main ones being Google Scholar, KTH Primo and Emerald. During the
search of relevant literature, some specific keywords was used in the previously mentioned
databases;
• Forecasting Management
• Forecasting Processes
• Demand Forecasting
• Sales Forecasting
• Demand Planning
• Qualitative Forecasting
• Judgemental Forecasting
• Sales & Operation Planning
When choosing literature, the articles and books with the most amount of citing were
prioritized, and books dedicated to forecasting was helpful in widening the search as
subchapters revealed important and interesting subjects within forecasting, such as qualitative
and judgemental forecasting. Literature from well-known authors was also prioritised in the
selection of theories and methodology for the research.

39
3.2.3 Interviews
The sales forecasting audit framework by Moon et al. (2003) was used as a base for the data
collection of this investigation. Data was collected through documentation, semi-structured
interviews and observations of the forecasting process. All contributors and key stakeholders
in the forecasting process for each selected account was interviewed and was considered
experts within the area. One of the global demand planners helped in identifying all key
stakeholders and contributors for the two selected accounts. Table 7 presents all interviewees
and corresponding title.
A interview protocol was developed based on the four dimensions of forecasting by Moon
(2018) that had been discussed and altered to fit with the specific context of the company in
chapter 2.5. The protocol was handed out before the interviews to allow the participants to
prepare for their interviews. The protocol is designed to cover the main subjects of all four
dimensions which covers the whole forecasting process, this means that not all participants
were able to answer all questions, which was expected and gave other insights in regard to
which information and knowledge that different key individuals in the process possesses. The
protocol used can be found in the appendix.
The conducted interviews were semi-structured in order to explore the interviewees responses
more in depth, as recommended by Collis (2014). This means that the protocol was followed
by the interviewer but if an answer were interesting or brought up a new subject of interest
the answer could be discussed and developed further. This allowed for a deeper
understanding of the situation which was beneficial for the As-Is state and used in the
analysis.
The interviewees were contacted by mail using the internal outlook service. In the e-mail the
purpose of the study was briefly explained as well as an explanation of how the interview
would be performed. The questionnaire was sent as an attachment to the mail for the recipient
to review before the interview to be able to prepare or delegate the interview to someone with
more insights regarding the purpose of the interview. Each interview was scheduled to one
hour which was enough time to go through the questions and discuss interesting answers.
The majority of the interviews were performed using Skype due to geographical difficulties
as the majority of the interviewees was stationed in other countries. The Skype program used
included the ability to share desktops and slideshows which made the interviews more
interacting. All interviews were recorded with permission from the interviewees to increase
the validity and decrease the risk of misinterpretation as suggested by (Yin, 2014). To
manage the ethical issue of protecting information from individuals, the names of each
interviewee was maintained anonymous during the study which also encourages the
discussion during the interviews to be more open and provide better answers (Collis, 2014).

40
Table 7: List of interviewees
Name Title Company Conducted Parts of protocol
answered
Interviewee 1 Customer Unit
Supply Head
Ericsson 24/04-19 All
Interviewee 2 Market Area
Demand Manager
Ericsson 29/04-19 All
Interviewee 3 Key Account
Manager
Ericsson 06/05-19 Process Mapping
Functional Integration
Approach
Ending Questions
Interviewee 4 Account Business
Manager
Ericsson 06/05-19 Process Mapping
Functional Integration
Ending Questions
Interviewee 5 Account Supply
Responsible
Ericsson 09/05-19 All
Interviewee 6 Global Demand
Planner
Ericsson 10/05-19 All
Interviewee 7 Global Demand
Planner
Ericsson 13/05-19 All
Interviewee 8 Customer Unit
Supply Head &
Acting Account
Supply
Responsible
Ericsson 14/05-19 All
3.2.4 Data Analysis
As presented in the research design the data analysis consists of two main objectives; map the
current forecasting process in its As-Is state and develop a vision of its Should-Be state,
which together is concluded in a way forward for the company to increase its forecasting
performance. Firstly, the As-Is state was assessed using the four dimensions of forecasting
management presented in the audit framework, the assessment was made identifying
characteristics in the company which then was compared to the different stages in the audit
framework.
To identify the stage characteristics, recordings from the interviews were transcribed and the
answers compared to find similarities and differences. For the most parts the answers were
aligned, and a good view of the characteristics of the process could be obtained. In some
cases, the answers were not completely aligned which often was a result of different
perspectives in the process. In such cases the different perspectives could give an even better

41
holistic view of the characteristics and was always cross compared to the answers of an
interviewee with a more holistic position in the process.
With the different stages highlighted for each dimension of forecasting management the As-Is
state was completed describing how the current process functions and which dimensions that
possesses the biggest challenges for the company and which dimensions that are performing
well. By analysing the results from the As-Is state opportunities for improvement could be
discovered and used for developing a Should-Be state using the theory from the literature
study. The analysis of characteristics at different stages of excellence in each dimension was
used as a base to discuss and identify which areas of improvements that should be prioritized,
as recommended by Moon et al. (2003).
When the As-Is state had been analysed and completed the Should-Be state was developed as
a guidance of where improvement should be prioritized what changes that was needed. The
Should-Be state is based on broad targets for managers to work towards and was developed
using stage four in the audit framework with adaptation to the specific context of the case
company and other literature in the subject area. Stage four describes the most advanced level
of forecasting excellence found in the literature study.
With all data analysed and established As-Is and Should-Be states, discussions and
conclusions were drawn presenting the way forward for the company to improve the
performance on the forecasting process.
3.3 Assessment of the Quality of the Research
With the conducted research being of qualitative nature where a case study research design
has been used, the quality of the research can be evaluated out of four dimensions; reliability,
construct validity and external validity (Yin, 2009).
3.3.1 Reliability
Reliability in research refers to the fact that all measurements and factors included in the
research needs to be accurate and exact. If conducted again, another researcher must be able
to gain the same results as the ones presented in this study (Collis, 2014). The overall goal of
reliability is to minimize errors and biases in the study in order to provide trustworthy and
exact results (Yin, 2014).
Semi-structured interviews were held for the main empirical data collection, the interviews
were conducted with key stakeholders in the forecasting process at the case company which
are considered experts within the area of forecasting and planning. All interviews were
recorded, in agreement with the interviewee, as a means to increase the reliability (Riege,
2003). The recorded interviews gave the researcher the ability to listen to the interview
several times, decreasing the risk of misinterpretations and increasing the chance of a correct
and high-quality analysis. As the interview study covered multiple geographical areas on a
global level some minor language barrier was encountered, in one case an extra participant
was invited to support to interviewee if some translations or clarifications were to be needed.

42
This could impact the validity as the interpreter could change answers to his/her own
interpretation, but it could also strengthen the validity as the interviewee could otherwise
misinterpret the question. In this case the interviewee spoke better English than anticipated
and the extra participant could instead contribute with own complementary answers and
discussions as the extra participant was also interacting with the forecasting process in some
cases.
Semi-structured interviews further allow discussions regarding interesting answers or topics
that arises during the interviews, which further decreases the risk of misinterpretations and
results in an increased reliability regarding all data obtained being considered accurate and
exact. However, data collected through semi-structured interviews can lead to subject or
participant bias (Saunders, 2009). A way to minimize subject and participant bias is to use
data triangulation by collecting data from multiple sources, which was done by interviewing
several participants of the same position, compare the answers to own observations from
attended meetings and discussions with the handler at Ericsson.
In order to maintain a high-level of reliability, literature that was cited frequently and
published in the last years was prioritised. Older literature was primarily used to narrate
historical aspects and in referral to concepts and theories with a slower pace of change.
3.3.2 Validity
Accordingly to Blomkvist (2015) the level of validity refers to how well the studied
phenomena is described correctly and that the measurements used are relevant to the purpose
of the study. To ensure validity in the literature review it is important that the subject is in
line with and in the same field as the problem formulation, purpose and research questions.
Furthermore, the empirical data must correspond with the problem formulation and be used
as a basis for relevant discussions and analysis that can answer the purpose of the study.
To maintain a high level of validity during the literature study, the majority of the secondary
sources were books written by known authors within the field of forecasting or articles
published in scientific journals. Important theories have been cross referenced and explained
using multiple sources to ensure a high level of validity and that the theories are accepted in
the literature.
To ensure a high level of validity in the collection of empirical data, the purpose and
information regarding the study was sent out to the interview participants prior to the
interviews in order to give them time to prepare (Collis, 2014). The questionnaire used for the
interviews were also sent beforehand to the participants for an increased understanding
regarding the purpose of the study. A way to further increase the validity would have been to
send transcripts of the interviews for the participants to read through to make sure that no
misinterpretations had taken place and that all information had been acknowledged. Since the
interviews in this study were recorded the author could listen multiple times to minimize
misinterpretations, and in cases where some information was unclear the participant was
contacted over mail for clarification or confirmation of the information.

43
To validate the findings, regular meetings with the demand planning team was attended
where the progress and findings could be discussed and validated. More frequent meetings
where also held with the handler at Ericsson where the preliminary findings could be
discussed and validated. The handler was head of the demand planning team and had good
insights in the process and the investigated problem. Before the findings were presented to
the leadership team at Ericsson, a preliminary presentation was held with the demand
planning team where the final findings and conclusions were reviewed and discussed.
3.3.3 Generalizability
The generalizability, which also can be called external validity, refers to how well the
findings of the study is applicable to other settings and contexts beyond those studied in this
thesis (Yin, 2014).
The results of this study are based on a single case which can have a negative impact on the
generalizability as it is only representative for the context of the case company. The results
can however be generalizable to some extent for businesses of similar size in project-based
markets where the demand is highly intermittent and dependent on an RFP process. The
study furthermore contributes with important knowledge and conclusions regarding
forecasting processes in the setting of project-based businesses which creates a general
understanding on which forecasting practises that are applicable in similar settings and which
is not.
The study was moreover delimited to only include two customer accounts located in Europe.
This implicates that the results of the study may not be generalizable to other continents
where cultural differences may pose other challenges in the process. The two studied
customer accounts can however be seen as generalizable for the selected market area; Europe
and Latin America. The selected customer accounts are kept anonymous per request from
Ericsson to not disclose sensitive information or reveal the identities of the participants in the
interview study.
3.4 Ethical Considerations
To ensure a high ethical standard during the study, all recommendations from the Swedish
Research Council’s four principal requirements were followed.
A non-disclosure agreement was signed between the researcher and Ericsson before the study
started and have been strictly followed from that point through the whole process. The name
of the company was agreed not to be disclosed while other specific information and numbers
that could be sensible to the company were agreed to be disclosed.
As mentioned in subchapter 3.2.3, the interviewees were before the interview informed about
the purpose of the study, the purpose of the interview as well as the confidentiality aspects.
Which according to Collis & Hussey (2009) further encourages the discussions to be more
open and provide better responses. To protect the participants identities, their names were
kept anonymous.

44
4. Results
This chapter contains the findings and results from the case study. The chapter begins with by
introducing Ericsson AB followed by a description of Ericsson’s current forecasting
practices.
4.1 Ericsson AB
Ericsson is a global information and communications technology (ICT) provider that offers
digital services, network solutions and infrastructure to customers in over 180 countries
worldwide. The company is one of the biggest ICT providers in the world with almost
100,000 employees worldwide and over 200 billion SEK in revenue. Ericsson has been
leading the development of digital communications and has been in the forefront of 3G, 4G
and is now investing for technology leadership in upcoming 5G networks.
Ericsson’s organisation is divided into four business areas (BA) consisting of Networks,
Digital Services, Managed Services and Technology. The focus of this thesis is directed
towards the offerings of Digital Services which consists of six product families;
• Automated Network Operations
• Cloud Communication
• Cloud Core
• Cloud Infrastructure
• Digital BSS
• Transform Business
The product families consist of a mix of both hardware and software focused on 5G-ready,
cloud-native, automated and industrialized solutions. The customers are mainly network
operators who seek to expand or upgrade existing mobile networks, the market is project-
based, where the ICT providers compete to win customer contracts and deliver a customer
specific solution. The hardware used has a dynamic structure where the components included,
and their application, often is chosen and designed specifically for each customer, resulting in
multiple possible configurations. At the same time, the products are expensive and have short
lifecycles, making it crucial to avoid both components and products piling up in inventories.
The complexity of the products further results in long lead times if the demand is not
forecasted or wrongly forecasted, which makes it hard to compete in the tough marketplace.
The products are distributed worldwide through a global supply chain with factories and
supply hubs across all continents. To manage the supply chain the organisation is further
divided into six Market Areas (MA) explained in figure 8, which together covers Ericsson’s
global presence. The focus of this thesis is towards the MA of Europe and Latin America as it
represents the biggest MA when it comes to net sales and number of employees.
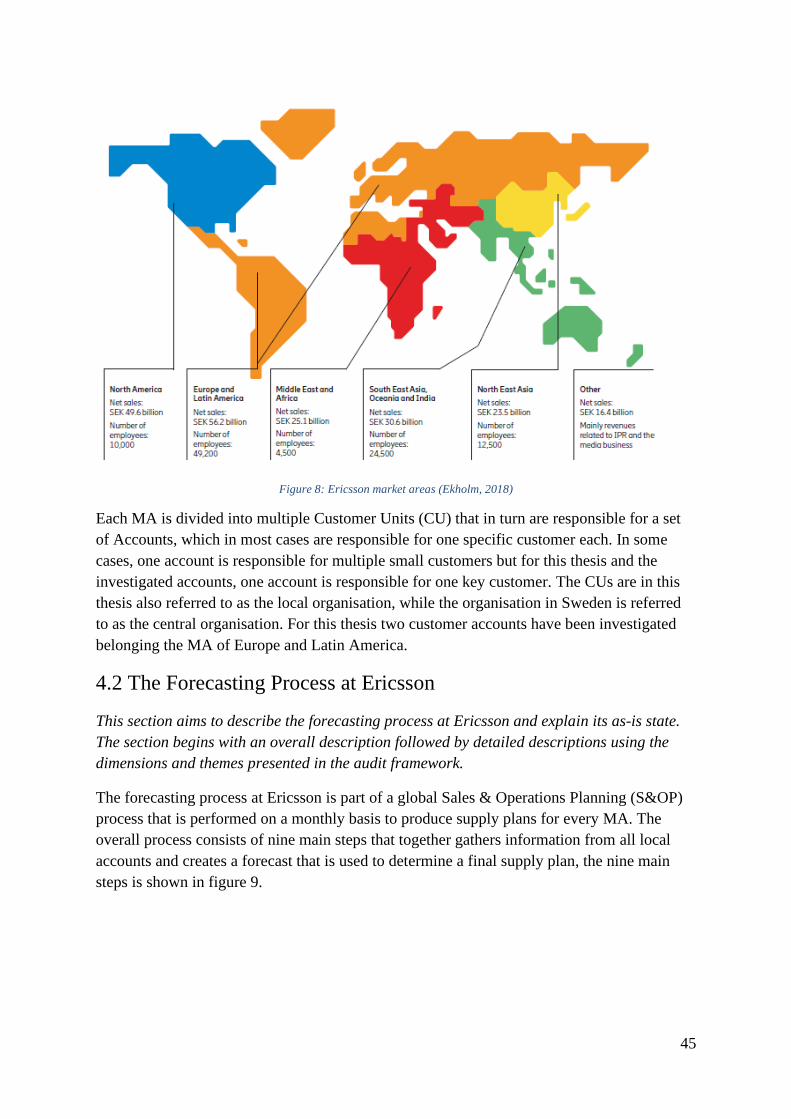
45
Figure 8: Ericsson market areas (Ekholm, 2018)
Each MA is divided into multiple Customer Units (CU) that in turn are responsible for a set
of Accounts, which in most cases are responsible for one specific customer each. In some
cases, one account is responsible for multiple small customers but for this thesis and the
investigated accounts, one account is responsible for one key customer. The CUs are in this
thesis also referred to as the local organisation, while the organisation in Sweden is referred
to as the central organisation. For this thesis two customer accounts have been investigated
belonging the MA of Europe and Latin America.
4.2 The Forecasting Process at Ericsson
This section aims to describe the forecasting process at Ericsson and explain its as-is state.
The section begins with an overall description followed by detailed descriptions using the
dimensions and themes presented in the audit framework.
The forecasting process at Ericsson is part of a global Sales & Operations Planning (S&OP)
process that is performed on a monthly basis to produce supply plans for every MA. The
overall process consists of nine main steps that together gathers information from all local
accounts and creates a forecast that is used to determine a final supply plan, the nine main
steps is shown in figure 9.
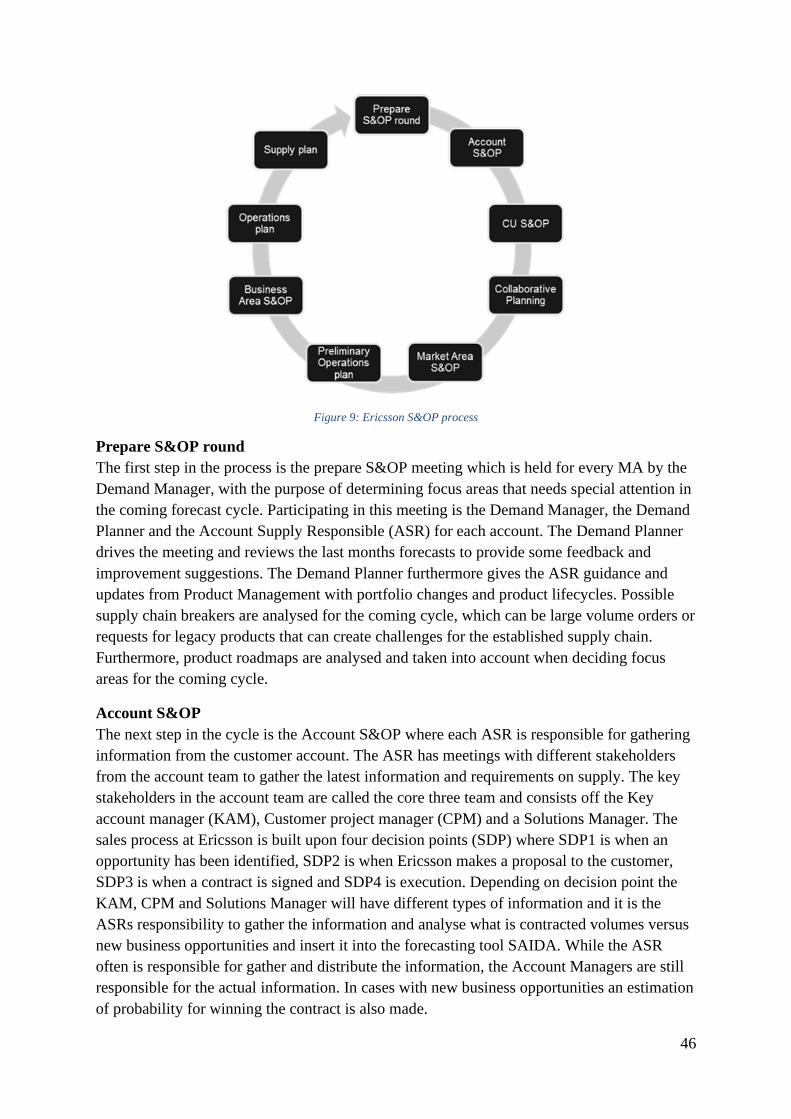
46
Figure 9: Ericsson S&OP process
Prepare S&OP round
The first step in the process is the prepare S&OP meeting which is held for every MA by the
Demand Manager, with the purpose of determining focus areas that needs special attention in
the coming forecast cycle. Participating in this meeting is the Demand Manager, the Demand
Planner and the Account Supply Responsible (ASR) for each account. The Demand Planner
drives the meeting and reviews the last months forecasts to provide some feedback and
improvement suggestions. The Demand Planner furthermore gives the ASR guidance and
updates from Product Management with portfolio changes and product lifecycles. Possible
supply chain breakers are analysed for the coming cycle, which can be large volume orders or
requests for legacy products that can create challenges for the established supply chain.
Furthermore, product roadmaps are analysed and taken into account when deciding focus
areas for the coming cycle.
Account S&OP
The next step in the cycle is the Account S&OP where each ASR is responsible for gathering
information from the customer account. The ASR has meetings with different stakeholders
from the account team to gather the latest information and requirements on supply. The key
stakeholders in the account team are called the core three team and consists off the Key
account manager (KAM), Customer project manager (CPM) and a Solutions Manager. The
sales process at Ericsson is built upon four decision points (SDP) where SDP1 is when an
opportunity has been identified, SDP2 is when Ericsson makes a proposal to the customer,
SDP3 is when a contract is signed and SDP4 is execution. Depending on decision point the
KAM, CPM and Solutions Manager will have different types of information and it is the
ASRs responsibility to gather the information and analyse what is contracted volumes versus
new business opportunities and insert it into the forecasting tool SAIDA. While the ASR
often is responsible for gather and distribute the information, the Account Managers are still
responsible for the actual information. In cases with new business opportunities an estimation
of probability for winning the contract is also made.

47
CU S&OP
The next step in the process is a prepare meeting held by the CU Supply Head where
information from all ASRs are gathered and reviewed for the coming 12-months period with
extra focus on month 3-6. The data is consolidated and prepared for the official CU S&OP
held by the CU Supply Head, this meeting is attended by the CU management team and the
consolidated CU forecast is reviewed, and decisions on risks and how to treat uncertainties
are made. The forecast is checked for new and legacy products that need special treatment
and financial alignment are controlled with the financial forecast made by the account team
and the financial department. The forecast is then approved and signed off by the CU Head.
Collaborative Planning
After the CU S&OP a collaborative planning meeting is held where the Demand Manager
presents the consolidated CU forecasts to the Demand Planner and the focus areas,
determined in the prepare meeting, are reviewed and answered. The outcome of the meeting
is a MA forecast proposal that the Demand Manager will present at the MA S&OP.
Market Area S&OP
The next step in the process is the MA S&OP meeting driven by the Demand Manager where
the MA leadership team is participating to make corrections and approve the market forecast.
The forecasts and major changes from the previous round including risks in opportunities are
reviewed and management corrections are made if needed. The final market forecast is then
signed off by the MA Head. Once the MA forecast has been closed and approved, the
Demand Manager calls for a follow up meeting with the ASRs where the outcome of the MA
forecast is presented with all corrections made. Performance is also reviewed with
measurements on forecast deviation from previous rounds.
Simultaneously, as the MA forecast has been closed and approved, the Demand Planners gain
access to the market forecast to start working on the final demand plan. The Demand
Planners have responsibility for one MA each during the creation of the market forecast, but
they are also responsible for a product family each. When the Demand Planners have
received the market forecasts from all market areas, they organise and consolidates the data
for each product family so the Demand Planner responsible for a specific product family have
all forecasts regarding those products. The Demand Planners reviews the forecasts and
compare it to historical numbers and trend lines. A Product Management S&OP meeting is
also held (not included in the figure above) where the Demand Planners sit down with
Product Management to receive the latest updates regarding the product portfolio, lifecycles
and information that can help improve the forecasts in the long range.
Business Area S&OP
A demand plan is created for all product families which is presented at the Business Area
(BA) S&OP meeting by the Head of Demand Planning. At this meeting the BA leadership are
attending, and the demand plan is reviewed, action points are decided, and the final demand
plan is approved.
48
This constitutes the end for the forecasting process within the overall S&OP process and the
other steps and meetings presented in figure 9 are used to create operational and supply plans
based on the final demand plan.
4.2.1 Functional Integration.
Process
Forecasting is part of a central S&OP process at Ericsson that is used globally in the company
to estimate the demand and plan the operations for the coming months. One interviewee
briefly explained the forecasting process as:
“Our fundamental process to predict which hardware will be needed in which time”
(Interviewee 1, CU Supply Head)
The process is performed in cycles once a month with set deadlines for when different
activities are taking place. The process starts at the beginning of every month and lasts for
about six weeks which means that the next round starts before the previous round is
completed. A system called SAIDA is the main tool used during the process which is
controlled by set deadlines which forces the process to progress. All interviewees agree upon
that the process is well developed and managed in a good way with executive support and
participation of decision makers.
The process is well documented with detailed descriptions regarding each meeting and what
activities that should be performed, and for the most part of the process the adherence is
good. The meetings are performed as they should with the right attendance and with
successful sign offs. However, all the actions and topics that should be performed during the
meetings, accordingly to the detailed process descriptions, are not always done. For example,
the descriptions states that a forecast value-added analysis should be performed every round,
which is not the case in the investigated process.
Furthermore, there is a need of increased collaboration between product management
(Interviewee 2, Demand Manager) and external vendors (Interviewee 1, CU Supply Head) to
increase transparency and receive updated information. One interviewee explains that the
information sharing between the central and local organisations needs improvement for the
local organisation to have the latest most updated information, especially as the market is
developing in a fast pace and new products are constantly being introduced (Interviewee 1,
Demand Manager).
There is also an overall lack of external involvement from customers in the process, at
account level the ASR is seldom in direct contact with the customer. The ASR is instead only
a receiver of data from different key stakeholders in the account team who interacts with the
customer. One interviewee explains that:
“Supply needs to be involved in the forecasting process towards the customer. For this
account we do that and push for that, but this is not the case for other countries, the ASR

49
needs to be involved and not only receive data. It is important to get a feeling with the
customer and the ability to communicate, forecasting is communication.”
(Interviewee 8, CU Supply Head)
Which is in line with other interviewees stating that the flow of information must be
improved between the account team and the ASR to have full transparency of changes in
demand and supply (Interviewee 2, Demand Manager; Interviewee 8, Demand Planner).
Organisation
When it comes to the organisation, most of the interviewees state that the Supply department
are responsible to drive the process while the accounts are responsible for providing the
necessary information. There is however not a clear owner of the forecast or a forecasting
champion, the forecasting process is driven by Supply both locally and centrally with
involvement from multiple other functions like business and product management. There is
however a dedicated process owner that is responsible for the overall S&OP process and sets
the timetable for each round and decides if any changes should be done to the process
(Interviewee 7, Demand Planner).
A financial forecast is also created parallel to the market forecast, however not by the same
function, the financial forecast is created by the account and the financial department using
another process. According to the process descriptions and in one of the studied accounts an
analysis is performed checking alignment between the financial forecast and the hardware
forecast (Interviewee 8, CU Supply Head). In the other studied account, alignment is not
always checked due to lack of financial data from the account.
Accountability
Most of the interviewees agree that everyone involved in the forecasting process are
accountable for their performance, but when asked how they are held accountable, the
answers differed. One interviewee explains that one problem has been that the local supply
functions have some targets and goals tied to forecasting quality. While the local accounts,
who are the key contributors of all information regarding the forecasts, have no targets or
metrics tied to forecasting quality, which creates irritation within the supply organisation
(Interviewee 2, Demand Manager). This also extends to the costs of bad forecasting quality,
if something is wrongly forecasted and therefore produced without any buyer, the supply
department becomes accountable to cover the costs, while the account who forecasted are not
affected and therefore not held accountable. There are however ongoing discussions on
whether there are any possibilities to split the costs associated with bad forecast quality with
the account.
Forecasting vs Planning vs Goal setting
In the S&OP process, forecasting drives the supply planning and demand plans are based on
forecasts rather than goals and targets. The two main inputs to the demand plans are the
market forecasts and product lifecycles which together gives an estimation of both short- and

50
long-term demand. During the forecasting process, forecasters cannot place forecasts for
months 0-2 as they are frozen in the system. The frozen period is implemented by
management to differentiate forecasting from execution, as some products have lead times up
to 2 months. In the local organisation, one interviewee explains that they would like to
remove the 2 months frozen period to be able to update changes in the short-term forecast
(Interviewee 5, ASR). The interviewee explains how the alternate way to change the forecasts
for months 0-2 must be done manually by mail and can be complex and time consuming.
Training
All interviewees from the supply organisation have received training regarding how to use
the tool SAIDA and the meaning of the used KPI for forecasting deviation, MAPE (Mean
Average Percentage Error). Workshops and seminars are sometimes arranged for some
participants in the process to discuss changes and improvements to the process. There is
however no education or training regarding forecasting methodology or practises, except
from knowledge sharing from colleagues that have been working with the subject for a long
time (Interviewee 7, Demand Planner). In the account team, no training is provided in
forecasting or planning practices (Interviewee 3, KAM).
4.2.2 Approach
Forecasting Point of View
The overall S&OP process at Ericsson is based on a bottom-up approach where information
is gathered from every customer account globally and is then consolidated to aggregated
levels. The first aggregation level is at CU level where top-down information from CU level
is used to check alignment (Interviewee 1, CU Supply Head). The same is then performed at
the MA S&OP which is the next aggregation level, but with top-down information from a
MA perspective including financial forecasts and market intelligence (Interviewee 2, Demand
Manager).
The next aggregation level is at the BA where the Demand Planners consolidates forecasts for
each product category using the market forecasts from all MAs. At the BA level top-down
information from Product Management is used to check alignment and make corrections to
the forecasts, the top-down information from Product Management includes product
lifecycles and roadmaps (Interviewee 6, Demand Planner). Historical data is also
incorporated at the BA level.
One interviewee explains that there is low visibility on which changes that are performed at
BA level and how the resulting forecasts and plans have been altered from the market
forecasts and why (Interviewee 2, Demand Manager). The performance metric MAPE is only
created using the market forecast and not the final demand plan.
One interviewee from the BA level explains that the most common correction performed by
the Demand Planners is to smoothen out the demand curve of the market forecast by
increasing the forecast in month 6-12 and decreasing the forecast slightly in month 2-6. The
51
market forecasts are very focused on the short to medium-term demand as the information
available from the accounts is mostly focused on that time frame and therefore most of the
forecasted volumes are in that area. With top down information from Product Management
and trends in historical data the Demand planners adds estimates of how the demand will
continue for the longer range through months 6-12 (Interviewee 7, Demand Planner). The
reason for slightly decreasing the forecast in the short term is to counter a positivism bias in
the forecasts.
What is Being Forecasted
The market forecasts are based on information from the customer accounts with data and
estimates from the sales process. Depending on where in the sales process the account team
are, the available information used for forecasting differs. In early stages the information
mainly comes from the account manager with probability of contract sign, volumes and
product mix on a high level. If the contract is won, the forecasts is instead based on
configurations and roll-out plans (Interview 3, KAM). The historical data used at BA level is
based on historical demand data including both historical orders and deliveries. One
interviewee explains that historical orders is mainly used, but that it is also important to
identify one-off orders that does not represent the average historical demand, as the demand
can be very volatile (Interviewee 7, Demand Planner). An example of a one-off order could
be a very large order that is multiple times larger than the average order. These orders happen
when a large country like Russia or China decides to build out their networks or update their
existing network infrastructure.
Forecasting Hierarchy
The demand is mainly forecasted on the hierarchy level that Ericsson calls VDP level which
stands for Volume Decision Product level and can be compared to a product family level. For
some products the forecasts are created at a more granular level called PL1 (Product Level 1)
or PL2 (Product Level 2) depending on the characteristics of the product family. An example
is shown in figure 10 for product family HDS 8000 Compute and Storage. The forecasts are
always created at the most granular level possible for the product (Interviewee 2, Demand
Manager). The interviewees explain that access to different levels of the forecasts depends on
specific work responsibilities and assigned MA or CU. One interviewee further explained
that SAIDA is mostly used to access the data and then separate excel reports is used to
present the data from different levels of hierarchy (Interviewee 7, Demand Planner).
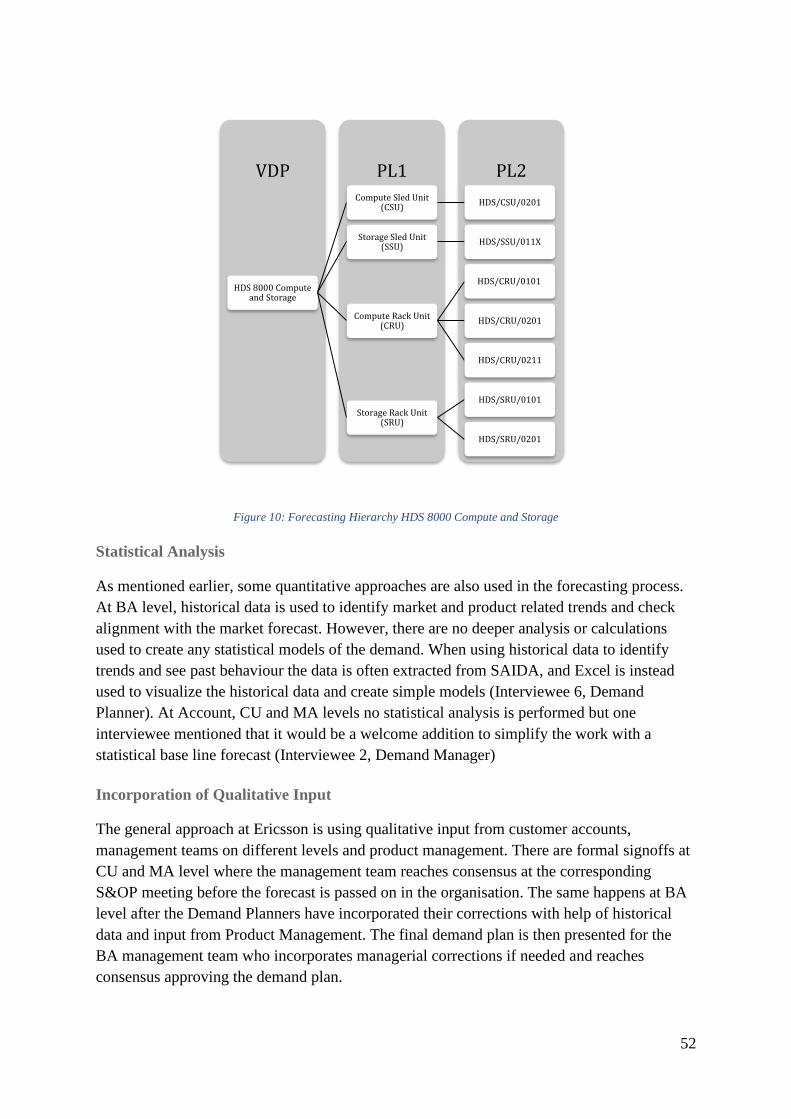
52
Figure 10: Forecasting Hierarchy HDS 8000 Compute and Storage
Statistical Analysis
As mentioned earlier, some quantitative approaches are also used in the forecasting process.
At BA level, historical data is used to identify market and product related trends and check
alignment with the market forecast. However, there are no deeper analysis or calculations
used to create any statistical models of the demand. When using historical data to identify
trends and see past behaviour the data is often extracted from SAIDA, and Excel is instead
used to visualize the historical data and create simple models (Interviewee 6, Demand
Planner). At Account, CU and MA levels no statistical analysis is performed but one
interviewee mentioned that it would be a welcome addition to simplify the work with a
statistical base line forecast (Interviewee 2, Demand Manager)
Incorporation of Qualitative Input
The general approach at Ericsson is using qualitative input from customer accounts,
management teams on different levels and product management. There are formal signoffs at
CU and MA level where the management team reaches consensus at the corresponding
S&OP meeting before the forecast is passed on in the organisation. The same happens at BA
level after the Demand Planners have incorporated their corrections with help of historical
data and input from Product Management. The final demand plan is then presented for the
BA management team who incorporates managerial corrections if needed and reaches
consensus approving the demand plan.
PL2PL1VDP
HDS 8000 Compute and Storage
Compute Sled Unit (CSU)
HDS/CSU/0201
Storage Sled Unit (SSU)
HDS/SSU/011X
Compute Rack Unit (CRU)
HDS/CRU/0101
HDS/CRU/0201
HDS/CRU/0211
Storage Rack Unit (SRU)
HDS/SRU/0101
HDS/SRU/0201

53
Most of the interviewees do however experience difficulties at the Account, CU and MA
S&OP meetings to get enough attention towards the BA and products of Digital Services.
The majority of the sales quota is on radio products which belongs to the BA of Networks,
which results in the main focus being on those products and the rest gets very little attention.
One interviewee exemplifies this by saying:
“The final sign off at the market level is handled by those responsible for radio and
microwave which turns focus towards that part of the portfolio. Heads from other parts of the
portfolio should be participating as well.”
(Interviewee 2, Demand Manager)
Another difficulty that has been present in the past and still is to some extent today, is biases
in the forecasts. In the past, forecasts from the accounts could be biased to manipulate the
financial forecast. By introducing more control on aligning the financial forecast with the
hardware forecasts the bias have been decreased, but is still present (Interviewee 1, CU
Supply Head). The same interviewee explained that:
“Sales tends to over dimension the forecasts as it does not cost them anything so “why not”.
When we started to check alignment between the hardware and financial forecast the
opposite occurred, the forecasts from sales started to become lower to influence the sales
target.”
(Interviewee 1, CU Supply Head)
This suggests that accounts where financial alignment is checked can be subject to
negativism bias to influence sales targets to be lower, while accounts without financial
alignment checks can be subject to positivism bias to guarantee products to its customers.
One interviewee explains that the accounts are often optimistic and always forecasts the best
scenario, which is something that the managers and Demand Planners need to take into
consideration when performing managerial adjustments (Interviewee 6, Demand Planner).
Another interviewee explains that biases have also occurred in situations where there are
supply constraints and each account gets allocated a certain amount of supply. The accounts
then tend to over forecasts to get a bigger allocation and receive the needed number of
products (Interviewee 7, Demand Planner).
4.2.3 Systems
Level of Integration
The main system used for the hardware forecasts is called SAIDA and was developed by
SAS Solutions for Ericsson. The system is used globally through all market areas and
customer units by all supply functions (Interviewee 1, CU Supply Head). The system is based
on Excel files that can be accessed by different key stakeholders in the process during
different timeslots in order to read and modify the forecast data without corrupting it. The
system is only used by the supply functions and is connected to some other supply systems,
but not in real time. There is however no connection to any of the used sales systems.

54
The initial forecast data is inserted into the system by the ASR who collects data from the
accounts. The ASR receives data through multiple channels using different means of
communication, which result in excel files, mails and meeting notes which then needs to be
manually transferred and compiled into SAIDA (Interviewee 5, ASR). The information is
mainly received from the “Core three team” which consists of the KAM, CPM and Solution
Manager, depending on where in the sales decision process the account team is with the
customer. The account teams use their own systems for configuration, roll out and project
data (Interviewee 8, CU Supply Head). One interviewee expresses the need of a friendlier
tool which allows for easier and faster input as well as automation functionality to
automatically import new data and avoid the manual insertion of data (Interviewee 5, ASR).
There are not only manual transfers of information when the data is inserted, there are also
manual transfers of data when the Demand Planners review the data and perform analyses
and visualisations of the data in Excel. SAIDA have some included functionality to analyse
the data but is not used due to its limitations and non-user-friendly environment. The
preferred tool is instead Excel which requires manual export and import of the data
(Interviewee7, Demand Planner), the same goes for cases when the data is shared with or
presented for the customer (Interview 8, CU Supply Head).
Access to Performance Measurement Reports
When it comes to performance measurements, SAIDA does offer some functionality, but is
used to a very limited extent due to a lack of knowledge. Performance measurements reports
are instead mainly created manually using Excel or Tableau by the demand managers who are
responsible to create a basis for feedback and performance reviews (Interviewee 7, Demand
Planner). The local supply organisation then gets the report once a month with the main
performance indicators (Interviewee 5, ASR). As the performance reports are created by
individuals and stored locally on the LAN network, access to historical performance metrics
can be difficult for other involved in the forecasting process. Furthermore, the reports can
differ in layout and content depending on who has created them (Interviewee 7, Demand
Planner).
Data Integrity
The historical demand data is stored in a business warehouse that is accessible for selected
employees with the right clearance, the data is updated on a daily basis and is accessible for
the Demand Planners but not for the ASRs in the local supply organisation (Interviewee 7,
Demand Planner: Interviewee 5, ASR). There are however no performance measurements
stored in the business warehouse, those must be found in old reports or by creating new ones
using the historical master data (Interviewee 7, Demand Planner).
System Infrastructure
The overall supporting infrastructure for the forecasting process is well developed and
supported in a good way as the system has been used for a long time (Interviewee 1, CU
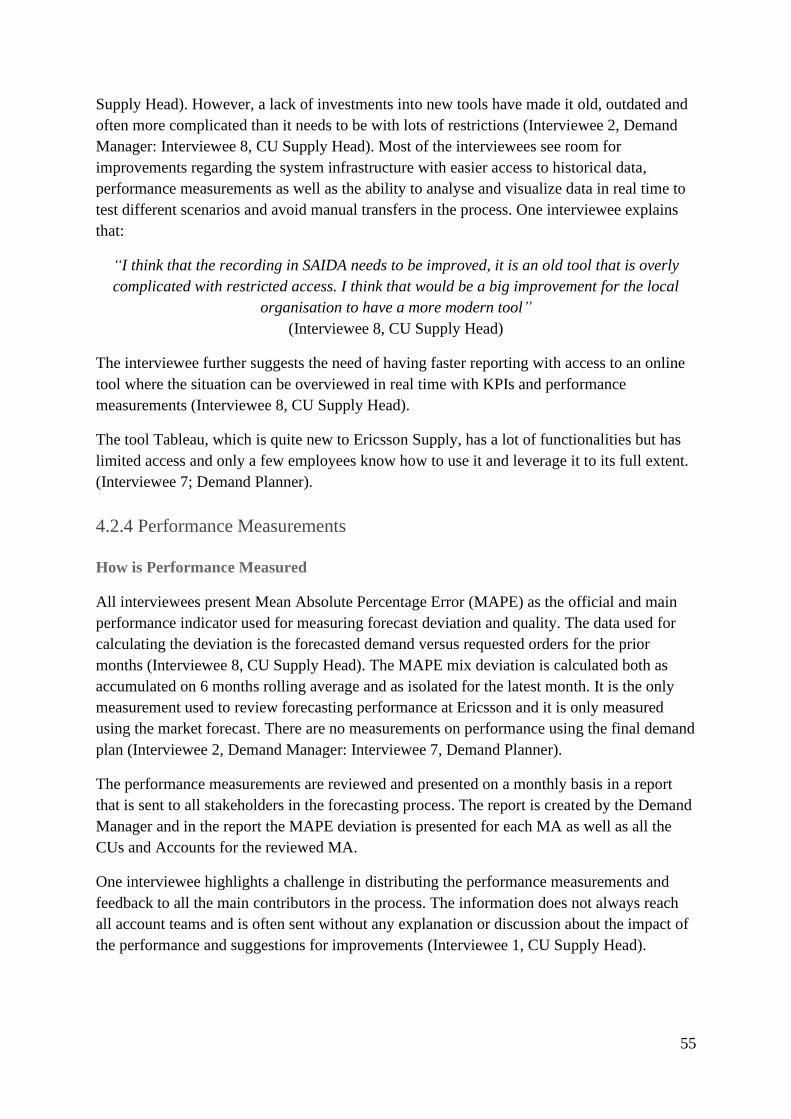
55
Supply Head). However, a lack of investments into new tools have made it old, outdated and
often more complicated than it needs to be with lots of restrictions (Interviewee 2, Demand
Manager: Interviewee 8, CU Supply Head). Most of the interviewees see room for
improvements regarding the system infrastructure with easier access to historical data,
performance measurements as well as the ability to analyse and visualize data in real time to
test different scenarios and avoid manual transfers in the process. One interviewee explains
that:
“I think that the recording in SAIDA needs to be improved, it is an old tool that is overly
complicated with restricted access. I think that would be a big improvement for the local
organisation to have a more modern tool”
(Interviewee 8, CU Supply Head)
The interviewee further suggests the need of having faster reporting with access to an online
tool where the situation can be overviewed in real time with KPIs and performance
measurements (Interviewee 8, CU Supply Head).
The tool Tableau, which is quite new to Ericsson Supply, has a lot of functionalities but has
limited access and only a few employees know how to use it and leverage it to its full extent.
(Interviewee 7; Demand Planner).
4.2.4 Performance Measurements
How is Performance Measured
All interviewees present Mean Absolute Percentage Error (MAPE) as the official and main
performance indicator used for measuring forecast deviation and quality. The data used for
calculating the deviation is the forecasted demand versus requested orders for the prior
months (Interviewee 8, CU Supply Head). The MAPE mix deviation is calculated both as
accumulated on 6 months rolling average and as isolated for the latest month. It is the only
measurement used to review forecasting performance at Ericsson and it is only measured
using the market forecast. There are no measurements on performance using the final demand
plan (Interviewee 2, Demand Manager: Interviewee 7, Demand Planner).
The performance measurements are reviewed and presented on a monthly basis in a report
that is sent to all stakeholders in the forecasting process. The report is created by the Demand
Manager and in the report the MAPE deviation is presented for each MA as well as all the
CUs and Accounts for the reviewed MA.
One interviewee highlights a challenge in distributing the performance measurements and
feedback to all the main contributors in the process. The information does not always reach
all account teams and is often sent without any explanation or discussion about the impact of
the performance and suggestions for improvements (Interviewee 1, CU Supply Head).

56
Another interviewee highlights the need for faster reporting using an online tool instead of
monthly reports, with the ability to get a fast overview of KPIs and configure own
measurements to perform fast and simple analyses (Interviewee 8, CU Supply Head).
How is Performance Rewarded
There are no rewards connected to the performance indicators, neither on a group, team or
individual level. One interviewee mentioned that the only form of reward for good
performance is a good service level from supply with promised lead times towards the
account (Interviewee 1, CU Supply Head). In the past, deviation and forecast quality was part
of individual performance targets and goals for Demand Planners, but that is not the case
anymore (Interviewee 7, Demand Planner).

57
5. Discussion
In this chapter, the forecasting process at Ericsson is analysed and discussed by examining
the empirical findings. The findings are analysed using the framework to identify the main
challenges and opportunities of improvement in the forecasting process. The findings are
furthermore discussed in relation to previous research in order to see what new knowledge
that can be gained. The chapter start with a brief general reflection followed by detailed
discussions for each dimension of forecasting.
5.1 Challenges Identified in the Forecasting Process
There are multiple challenges identified in this case study and many of them are affected by
each other, therefore, to solve or overcome some of the challenges only a handful of the
challenges needs to be targeted. For example, lack of accountability and training results in
lack of adherence and biases which reduces the trust and decreases both the efficiency and
accuracy.
Another interesting point is that, lack of adherence, limited feedback, limited support and
lack of training which are some of the main challenges that have been identified are all
connected to difficulties within information and knowledge sharing. Which seems logical for
a global decentralized company as the size and geographical spread makes it harder to share
information among all employees. Furthermore, the discussed solutions in the following
chapter are also directed towards increasing the flow of information. By increasing the
support and education throughout the organisation we are increasing the ability to share and
understand information. One of the interviewees in the case study mentioned that
“forecasting is communication” which further strengthens the importance of information
sharing within forecasting.
In the following chapters each dimension is discussed in more detail to reveal all challenges
and which improvement suggestions that are applicable to increase the performance.

58
5.1.1 Functional Integration
According to the theoretical framework, businesses need to have a functional integration
between all interlinked functions that are participating in the forecasting process. A high
degree of communication, coordination and collaboration are required to reach excellence
and support an efficient and accurate forecasting process.
Table 8 shows the dimension of Functional Integration at Ericsson with a brief characteristic
explanation and corresponding stage. Detailed analysis for each theme is presented below.
Table 8: Functional Integration at Ericsson
Theme Stage Characteristics
Processes Stage 3 Strong internal process with consistent attendance by decision makers and
strong executive support. Detailed process descriptions are available but
low adherence in regard to performing all activities. Limited external
collaboration with key customers in forecasting practises.
Organisation Stage 2 Overall S&OP process driven by Supply function but dictated to other
functions for information gathering i.e. Key Account, Solution Manager and
Product Management.
Accountability Stage 1 Overall limited accountability for forecasting quality.
Forecasting vs planning vs goal
setting
Stage 3 Forecasting drives the business planning and goal setting processes. The
process is iterated every month and the plans updated accordingly.
Training Stage 1-2 Limited training regarding the forecasting system SAIDA and the
performance metric MAPE are provided to the forecasting personnel.
Process
The forecasting process at Ericsson is well established and used globally through all market
areas. The empirical evidence shows strong support and high level of participation from
management and key stakeholders. However, while the process adherence on a high level is
good with strong participation and set meetings, the adherence on activity level within the
meetings is lower. When comparing the empirical evidence to process descriptions provided
at Ericsson, major gaps can be found in which activities that are performed compared to all
activities stated in the descriptions. The lack of adherence results in activities not being
performed which can result in a lack of data, lack of feedback distribution and decreased
performance. The lack of adherence can be connected to a lack of understanding, motivation
and accountability, which relates to the themes of accountability and training discussed later
in this chapter.

59
Another challenge within the process is the lack of external collaboration and involvement in
the forecasting process. In the setting of Ericsson, the customers are the most important
source of information when it comes to estimating the future demand and should therefore be
part of the forecasting process and be included in meetings with the ASR. One of the studied
accounts are working towards this and involves the customer in meetings with the ASR,
which is precisely in line with a stage 4 characteristics presented in the theoretical
framework. The empirical evidence states that this is unique for the investigated account and
that it is key to reach high quality and performance. Which also can be seen in performance
reports where the account in question is among the top performers when it comes to MAPE.
The involvement of customers is therefore something that should be prioritised at Ericsson as
it is proven to increase the performance of the forecast. These findings are as well supported
by previous research where both Moon (2018) and Ross (2015) have concluded that external
integration with trading partners are required to access useful information and increase the
ability to produce accurate forecasts.
There is also evidence of information regarding product roadmaps not getting distributed
completely from the central functions to the local accounts. Which also can be a result of the
fore mention lack of adherence where some steps and activities are skipped in the process.
This results in a misalignment in the forecasts where products that are phasing out are
forecasted as the key account does not know that a new better product is replacing the current
one. It can however also be an indication of that the information flow in the process are not
good enough, previous research by Gilliland (2010) have shown that a culture of
collaboration and information flow are especially important in situations with highly erratic
demand.
When comparing the empirical evidence to the characteristics of the four stages in the
theoretical framework we can place Ericsson as a stage three company with a strong
developed process, high level of support and attendance but with very limited involvement of
customers preventing a stage four classification. The lack of adherence in the process does
not affect the classification but is a major drawback and challenge for Ericsson’s forecasting
practises.
Organisation
The evidence reveals that the supply function at Ericsson are the main driver of the
forecasting process. Compared to the theoretical framework this is the suggested approach for
cases where it does not exist an independent function or department solely for forecasting.
The framework and previous literature by Olivia and Watson (2009) states that having a
complete independent department for forecasting would be the best case if possible, but for
some companies it would not be applicable which is the case for Ericsson. In such situations
Supply is the function of choice to drive the forecasting process which is in line with how the
empirical evidence describes Ericsson’s organisation.

60
However, the findings also indicate that multiple functions take part in the forecasting
process and affects its outcome. The other functions participate as information contributors
and to take part in consensus meetings.
According to the used theoretical framework, the described behaviour relates to stage two
characteristics which can seem quite low for an organisation that works well and includes
multiple departments. Following the theoretical framework, stage three and four relies on the
forecasting process being managed and provided by an independent organisation or
department, but the literature recognises that it is not the best case for every business
application. Therefore, the stage two classification for Ericsson is considered as excellence
within this context and striving towards reaching a higher level in the theoretical framework
is not practical and would most probably lead to more challenges than increase in
performance.
Accountability
The empirical evidence shows that there is a lack of accountability for performance within
the forecasting process. There is a perception that everyone is accountable for their
performance and contribution in the process but there are no performance measurements
connected to individual performance targets. Previous research by Lapide (2006) and Davis
& Mentzer (2007) suggest that forecasting must be made important to incorporate good
adherence and a prerequisite for that is to make every contributor accountable for their
contribution.
There is also evidence of the local supply function being the only involved function with
targets and goals connected to forecasting performance. This involves some sense of
accountability for the local supply function, but the problem is that the local supply function
is only a distributor of information between the local accounts and the central supply
function. Targets and goals connected to forecasting performance are most important for the
key contributors which in this case is the account team. The evidence furthermore indicates
that there are suggestions of dividing the costs related to bad forecast quality between the
participating functions which is a good step towards increasing the accountability.
In its current practice, Ericsson is aligned with a stage one characteristics in the framework,
and to reach higher stages, all contributors and key stakeholders in the forecasting process
must be accountable for their performance. To accomplish this the first step should be to
measure performance at all levels in the organisation (discussed further in later chapter) and
to include forecasting performance as a part of individual performance targets. By connecting
forecasting quality to individual performance targets, every contributor will become
accountable for their performance which also can improve the adherence and motivation
towards the process.
Forecasting vs Planning vs Goal setting
The empirical evidence shows that Ericsson utilizes an iterative forecasting process the drives
the demand and supply planning every month. The characteristics of Ericsson is in line with
61
the higher stages (3-4) found in the theoretical framework. The empirical evidence further
shows that there are some split opinions regarding the two months frozen period as it
prevents short term changes. This shows that there is a mixed understanding regarding the
differentiation of forecasting, planning and execution as a majority of the products have lead
times in the range of 3-6 weeks. Therefore, it is not possible to change the forecast one or two
months prior to delivery as it is no longer forecasting but rather planning or execution. Which
the supply chain may not support as the item has not been forecasted properly. This
behaviour can be connected to common mistakes identified in previous research by Ross
(2015), where one mistake was that some have the false impression of that changing the
forecast will change the outcome. This gap in understanding can also be related to lack of
training in forecasting methods and practices which will be discussed in the next subchapter.
To summarise the theme of forecasting vs planning vs goal setting, the empirical evidence
shows high-level characteristics in the process but with some lack of understanding in the
local functions regarding the differentiation between forecasting and planning. Applying the
theoretical framework shows that Ericsson’s practices are aligned with the characteristics of a
stage three company.
Training
Training is a crucial aspect of forecasting and has a substantial impact on the overall
performance of a company’s forecasting process. The theoretical framework reveals that well
educated and trained contributors provides superior performance and are more motivated than
contributors in the forecasting process that lack training within forecasting methods and
practises. Training and education are considered one of the main drivers to create
understanding, trust and influence the culture.
The empirical evidence shows a gap in the training provided at Ericsson, the training
currently provided is limited to the systems and performance metrics used and does not
include any form of methods or forecasting practises. According to the theoretical framework
this is in line with a stage one characteristics and is a major challenge that affects multiple
themes in the process. This means that a lot of the challenges detected in the process can be
solved by improved training and increased knowledge within forecasting practises.
Increasing the understanding will also increase the importance of forecasting which
according to the literature is one of the seven key principles to improved forecasting. This is
especially important for the key contributors in the process which possess the most domain
knowledge. To facilitate the use of this knowledge to its full potential, training in different
methods and practises are required. The training should not only focus on describing the
different methods available, but also include how to utilize each method and in which
situation and context they are most suitable. Previous research by Ross (2015) shows that
understanding which methods to use is of importance for managers to be able to trust the
outcome and not applying informal techniques including own biases.
An increased understanding will furthermore increase the adherence in the process which has
been detected as a challenge for Ericsson in the forecasting process. With increased

62
understanding it is easier to understand why all activities should be performed and how it
contributes to the overall performance, it will also be easier for each participant to improve
the workflow and process on a detailed level as no one knows the process as good as those
who works with it every day.
As some training is provided regarding the system and performance metrics used, Ericsson’s
practices are characterised as somewhere in between stage one and stage two.
Summary
To conclude the dimension of Functional Integration we can see that Ericsson has a well-
developed process for forecasting with overall good practises. The process is driven by
supply and the forecasting process drives the planning for both demand and supply.
There are however some main challenges identified relating to process adherence,
accountability and training, which is represented by low stages in the framework. Figure 11
summarises the analysis for the dimension of Functional Integration with the identified
challenges and potential improvement areas.
Figure 11: Summary Functional Integration at Ericsson
← Challenges
•Lack of process adherence in performed activities at meetings•Disconnections between local and central organisation•Limited accountability for forecasting quality•Insufficient training in forecasting methods and practices
Status Quo
•Strong, well developed process utilized by all market areas•Forecasting driven by supply function.•Demand- and supply plans based on monthly forecasts
Potenial Improvement Areas
•Increased customer collaboration and involvement in the forecasting process•Increased understanding and motivation through training in forecasting methods and practises

63
5.1.2 Approach
The dimension regarding a company’s forecasting approach consists of multiple themes that
needs to be considered when investigating a company’s forecasting practises. Table 9 shows
the themes and the characteristics of Ericsson with corresponding stage. Detailed analysis for
each theme is presented below.
Table 9: Approach at Ericsson
Theme Stage Characteristics
Forecasting point of view
Stage 4 A bottom-up approach is used with top-down market intelligence
incorporated at CU and MA aggregation levels. Furthermore, top-down
product life-cycle information is incorporated at BA level.
What is being forecasted
Stage 2 Estimated orders are being forecasted using a sales force composite
approach. Input based on historical data is created using historical orders
with adjustments for one-off situations.
Forecasting hierarchy
Stage 3 Complete forecasting hierarchy in place with reconciliation between levels.
However restricted access to input and extract data at different levels.
Statistical analysis
Stage 2 Limited use of simple statistical models and trend lines at BA level
performed using external systems.
Incorporation of qualitative input
Stage 2-3 Forecasting approach based on a consensus process including qualitative
input from multiple department and senior executives in the company.
Positivism bias are present to some extent from the accounts.
Forecasting Point of View
The theoretical framework suggests a forecasting approach that includes both bottom-up and
top-down information with detailed reconciliation between the two. The empirical evidence
shows that Ericsson utilizes an approach that is based on a sales force composite with a
bottom-up orientation. Top-down information is then incorporated at multiple aggregation
levels in the consensus process which is in line with a stage four characteristics. The evidence
shows that reconciliation is reached through consensus at sign-off meetings during the
process.
As the empirical evidence shows a stage four characteristics there are no areas of
improvements or major challenges related to the forecasting orientation.
Ericsson´s practices are as well supported by previous research where studies by Lapide
(2006) and Armstrong (2005) have concluded that combining both bottom-up and top-down
approaches can utilize the advantages of both approaches and increase the accuracy.
What is Being Forecasted
According to the literature and the theoretical framework the right historical data must be
used to get a correct estimation of the future demand. Historical data that does not represent
the historical true demand in a good way should be avoided.
64
At Ericsson, historical data is only used as an input to check alignment and is not used as the
base for the forecasts. The empirical evidence shows that the sales force composite approach
uses data gathered directly from the customers which is considered to represent the future
true demand in a better way than any historical data. Especially in the operating context of
Ericsson where the demand is volatile and patterns in the historical data are hard to identify.
The evidence furthermore shows that historical orders represents the historical data when
checking alignment with the bottom-up approach. Adjustments for one-off situations are
performed which shows that Ericsson has a good view of what is being considered true
historical demand and how it can be used to predict the true future demand.
When comparing Ericsson’s characteristics to the theoretical framework it results in a stage
two behaviour, but as the framework is focused towards processes which uses historical data
as the main base for the forecasts and not only as an input to check alignment. This does not
fully represent the practises in Ericsson’s forecasting process, the framework does not take
into consideration if a sales force composite is used which utilizes data directly from the
customers. Which should be considered the best estimation of the future demand.
With this in mind, Ericsson’s practises should be considered at a higher stage than what is
suggested by the framework as the framework does not include the approach used by
Ericsson. Which also means that the characteristics for stage three and four may not be
applicable for Ericsson’s practises and should not be considered improvement areas.
Forecasting Hierarchy
The empirical evidence shows that Ericsson has a complete forecasting hierarchy where
different levels in the forecasts can be accessed by different stakeholders in the process
depending on job role. These characteristics are in line with the theoretical framework’s
higher stages, where excellence is explained as when people can input information at the
level they know it and then extract information at the level they need.
Previous research by Gilliland (2010) has shown that a common mistake is to include
forecasting hierarchies that are more granular than needed. This mistake is however not
present at Ericsson where different forecasting levels are used for different products
depending on available information and the size of the product family.
However, the evidence further shows that the system support for forecasting hierarchies at
Ericsson are somewhat limited which results in a stage three characteristics for Ericsson’s
practises. The general system support will be further discussed in a later chapter.
Statistical Analysis
The empirical evidence shows a limited use of statistical analysis in the forecasting process at
Ericsson. Simple statistical models are only used at BA level using Excel worksheets where
the data is transferred manually from SAIDA to Excel. The statistical models are only used as
an input to check alignment with the data gathered from the customers and is therefore not

65
the primary base which the forecast is created upon. According to the theoretical framework
this behaviour is considered a stage two characteristic where there is limited use of simple
statistical models.
To reach higher stages and performance, the framework suggests more advanced methods
using both time series and regression models. However, the framework is created within the
context where historical data and statistical analyses forms the base of which the forecast is
created upon.
For Ericsson, more advanced statistical methods would most probably not gain any
performance increase as it would only enhance the risk of the “black box” effect where only a
few experts know how it is operated. Furthermore, it would not have any performance gains
in forms of accuracy as the market is characterised by high volatility and patterns in the
historical data are hard to identify.
Therefore, a higher stage is not considered as a possible improvement area for Ericsson.
Possible improvement areas are instead suggested regarding the availability and simplicity of
the methods where Ericsson can increase the performance by providing tools for using simple
statistical models to more participants in the process. Which the empirical evidence shows a
lack of and was suggested by the interviewees as an improvement area. It is also in line with
previous research by Ross (2015) who argues that excellence is reached by using simple
methods that are easy to understand and use for everyone.
Hence the focus of Ericsson should be to make simple statistical methods available for
everyone in the process without the need of manual transfers from SAIDA. Which could be
accomplished through the already available tool Tableau. The functionality of creating simple
trend lines and statistical analyses are available in Tableau but it is only used by a few
persons in the process that have the required knowledge and access to the tool. By improving
the understanding and knowledge regarding Tableaus functionalities and giving all
contributors access could therefore drastically increase the ability to incorporate simple
statistical analyses at multiple levels in the process.
The theme of statistical analysis results in a stage two behaviour following the theoretical
framework, but the improvement areas should not be to incorporate more advanced tools but
rather to enable access to simple methods and tools for all involved in the process. Which
enables all participants to easily check alignment and performing simple analyses to improve
the quality of the data.
Incorporation of Qualitative Input
Ericsson’s forecasting approach is heavily dependent on qualitative input as a sales force
composite approach is used as a base for the forecasts, where most of the inputs is of
qualitative nature. The empirical evidence shows that the whole S&OP process is built upon
consensus and sign-offs at multiple levels where qualitative and judgemental input is
incorporated to appropriate adjust the forecasts. When comparing this behaviour to the
theoretical framework we can see alignment with characteristics of higher stages.

66
However, the empirical evidence shows some perceptions of biases within the process that
results in a behaviour similar to the characteristics of a stage two company. The evidence
shows that multiple participants experiences biases in different ways in the process,
consisting of both positivism and negativism biases.
The most common bias according to the empirical evidence is however a positivism bias
from the accounts which will have a major impact of the quality as the accounts are the main
input contributors in the process. While bias can be hard to control in a decentralized
organisation, a good distribution of training and education can raise the understanding about
biases and in that way, make all participants reflect over their input to avoid common biases.
However, the most effective way of avoiding biases is through continuous feedback to the
parts of the process that are affected by continuous bias. In order to identify the affected
accounts, Ericsson needs to measure accuracy over time at all levels in the process to detect
where in the process continuous bias are present. By doing that, root cause analyses become
easier to perform and the feedback regarding improvement suggestions can be targeted
correctly.
The perception of biases will also affect the overall trust in the process where the participants
does not trust the data that they receive, which will lead to a lot of corrections that will
decrease the quality of the forecast and in some cases incorporate new biases.
Previous research by Fildes et al. (2009) and Syntetos et al. (2009) have concluded that the
most common bias is an overestimation of demand and that negative adjustments are the most
effective. The findings of this study further support this with a positivism bias being the most
common bias at Ericsson as well as the most common correction performed being to decrease
the short-term forecast.
Summary
To summarize the Approach dimension at Ericsson we can see a large focus, and lots of
resources spent, on a bottom-up approach with top-down input and reconciliation at multiple
levels in the process. Most of the inputs to the forecast is of qualitative nature with limited
use of quantitative methods to check alignment.
The main challenges identified are regarding the limited support for using statistical analyses
and a perception of biases within the process which will have negative effects on the quality
and accuracy of the forecasts. Figure 12 summarises the analysis for the Approach dimension
with the main identified challenges and potential improvement areas.
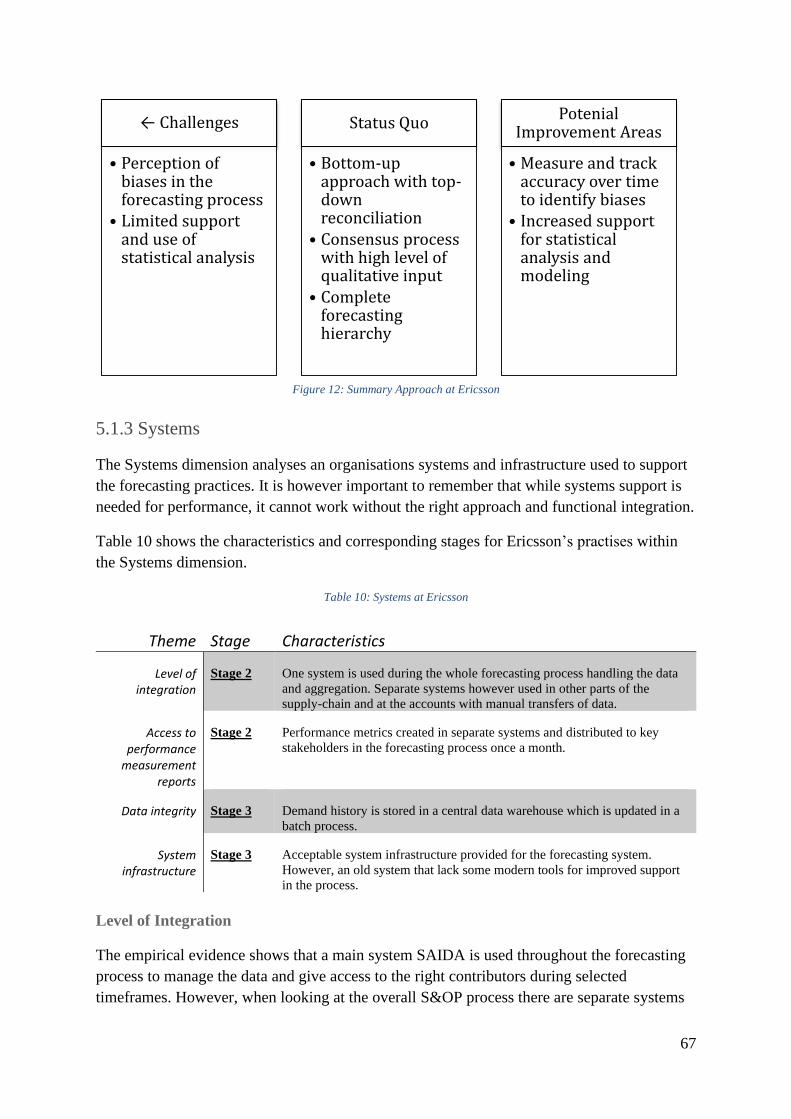
67
Figure 12: Summary Approach at Ericsson
5.1.3 Systems
The Systems dimension analyses an organisations systems and infrastructure used to support
the forecasting practices. It is however important to remember that while systems support is
needed for performance, it cannot work without the right approach and functional integration.
Table 10 shows the characteristics and corresponding stages for Ericsson’s practises within
the Systems dimension.
Table 10: Systems at Ericsson
Theme Stage Characteristics
Level of integration
Stage 2 One system is used during the whole forecasting process handling the data
and aggregation. Separate systems however used in other parts of the
supply-chain and at the accounts with manual transfers of data.
Access to performance
measurement reports
Stage 2 Performance metrics created in separate systems and distributed to key
stakeholders in the forecasting process once a month.
Data integrity Stage 3 Demand history is stored in a central data warehouse which is updated in a
batch process.
System infrastructure
Stage 3 Acceptable system infrastructure provided for the forecasting system.
However, an old system that lack some modern tools for improved support
in the process.
Level of Integration
The empirical evidence shows that a main system SAIDA is used throughout the forecasting
process to manage the data and give access to the right contributors during selected
timeframes. However, when looking at the overall S&OP process there are separate systems
← Challenges
• Perception of biases in the forecasting process
• Limited support and use of statistical analysis
Status Quo
• Bottom-up approach with top-down reconciliation
• Consensus process with high level of qualitative input
• Complete forecasting hierarchy
Potenial Improvement Areas
• Measure and track accuracy over time to identify biases
• Increased support for statistical analysis and modeling

68
used where some of the handovers are done manually or by using customized interfaces.
Which relates to a stage two behaviour presented in the theoretical framework.
The main challenge identified within the empirical evidence is the manual input of data into
SAIDA where the ASRs spends a lot of time collecting data from meetings, emails, sales
systems and conversations in the hallway. This approach is not only resource inefficient but
is also prone to human errors where data can easily be forgotten or misplaced and therefore
not be included in the forecasts. The empirical evidence further shows that there is a desire
from the ASRs to have a friendlier system that also have some automation functionality
where data from the sales systems can be transferred automatically into the forecasting
system. Which is exactly in line with previous research by Vereecke et al. (2018) who
concludes that forecasting needs to be supported by an integrated system that breaks down
silos in the process and enables information to flow freely between internal functions.
The empirical evidence furthermore shows manual transfers of data between SAIDA and
other tools like Excel for analysis and data visualisation which is a low stage characteristic
that can result in data loss and island of analysis.
The tool Tableau is connected to SAIDA and the forecasting data trough customized
interfaces but is only used to a limited extent. Therefore, there are further reasons to increase
the utilization of Tableau to increase the overall quality. An increased utilization of Tableau
will however not help Ericsson achieve a stage three characteristics within level of
integration, but it will increase the performance related to the level of integration and help
Ericsson achieve higher stages within other themes.
Access to Performance Measurement Reports
The empirical evidence shows that the main system SAIDA has some functionality of
creating performance reports, but due to limited knowledge regarding the system, other
systems like Excel or Tableau are used instead. The reports are created and distributed to the
main stakeholders in the process once a month by mail. The empirical evidence shows
characteristics relating to a stage two behaviour when applying the theoretical framework. To
reach a higher stage, performance metrics needs to be available for everyone in the process
with a user-friendly way of creating own reports on demand.
The interviewees point out the limited availability and access to performance metrics as a
challenge which goes in line with the improvements suggested in the theoretical framework.
Even though reports are created and distributed once a month, there is no possibility for the
participants to create customized reports with selected metrics that are of interest for the
specific task or function. If this was possible, Ericsson could also improve their feedback
distribution as every department head could create their own performance report connected to
the forecasting performance.
This is something that is possible in Tableau but is currently only utilized by the Demand
Manager who creates the monthly performance report. If access were given to all participants

69
in the process, Ericsson could reach a stage four characteristic and gain a lot of performance
in the process with customized performance reports available on demand.
Data Integrity
Data integrity at Ericsson is maintained through a central data warehouse where the demand
history is stored and updated in a batch process, which is in line with a stage three
characteristic described in the theoretical framework. To reach a stage four characteristic the
warehouse should support updates in real-time. But as the process at Ericsson is cycled
monthly and not in a faster pace, updates in real time would not be a significant improvement
over the existing practice as the demand does not change dramatically over a day. Therefore,
no major challenges are considered with the current practice and improvement work should
be directed towards other themes where bigger performance gains can be utilized.
System Infrastructure
The empirical evidence shows an established system at Ericsson with a supported
infrastructure that has been used for a long time and is thus well known by its users. The tool
Tableau is the newest addition and has only been used for a short while in the forecasting
process. However, the evidence also shows that the main system is getting outdated due to
lack of new investments and thus lacks some modern functionalities. Which can be seen in
other themes where lack of visualisation, performance metrics and analytical tools have been
identified as major challenges in the process.
Tableau has the ability to solve a lot of the challenges identified in both the analysis and by
the interviewees in the empirical evidence. By providing training and access for all
participants in the process, Tableau can be utilized to a much further extent and give better
support to the forecasting approach and functional integration. This furthermore shows that
investments into new systems does not guarantee increased performance, the performance
can be gained first when the systems and tools are utilized correctly by all participants.
When applying the theoretical framework, Ericsson fulfils the characteristics of a stage three
company. However, while the overall system infrastructure is acceptable there are lots to
improve that can gain substantial performance increases. To reach excellence the
functionalities of Tableau should be utilized to a greater extent, with access for everyone in
the process as well as being integrated into the main system SAIDA.
Summary
To summarize the Systems dimension we can see an overall acceptable system support at
Ericsson with stage two and three characteristics throughout the dimension. The main
challenges, and room for biggest improvements, are regarding the utilization of Tableau.
With increased knowledge and utilization of Tableau multiple themes can reach higher
stages, both within the Systems dimension and other dimensions that are affected by the
system support. Figure 13 summarizes the challenges and improvement areas within the
Systems dimension.

70
Figure 13: Summary Systems at Ericsson
5.1.4 Performance Measurements
The dimension of Performance Measurements only contains two themes; How performance
is measured and how it is rewarded. It is however one of the most important dimensions as
measurements enables feedback and analysis which are necessary to improve existing
practices. Table 11 shortly describes the characteristics of Ericsson within the dimension of
Performance Measurements and the corresponding stages. Detailed analysis for each theme is
described below.
Table 11: Performance Measurements at Ericsson
Theme Stage Characteristics
How is performance
measured
Stage 2 Performance is only measured using MAPE and only on the market level
forecasts. Bias is not graphically visualized, and performance is not
connected to any outcome metrics.
How is performance
rewarded
Stage 1 Individual performance is not tied to any measure of forecast quality.
How is Performance Measured
The empirical evidence shows that Ericsson measures performance with use of MAPE, which
is calculated for each MA, CU and Account. Furthermore, is the final performance metric
created using the market forecast and not the final demand plan. The empirical evidence
shows characteristics that are in line with a stage two company described in the theoretical
framework.
To reach higher levels of excellence the theoretical framework suggests that bias should be
graphically depicted, and that performance metrics should be connected to outcome metrics.
Which is related to the findings regarding the approach and qualitative input, where a
← Challenges
• Manual input of data into forecasting system
• Limited access to performance metrics and visualization tools
• Lack of training and knowledge regarding Tableau and included functionalities
Status Quo
• Separate systems with limited integration
• Performance metrics are created in separate systems once a month
• Acceptable system infrastructure with sufficient support
Potenial Improvement Areas
• Increased integration between forecasting and sales system
• Increased utilization of existing functionality in Tableau
71
perception of bias is present in the process and decreases the quality of the forecast.
Therefore, we can see a relation between the decreased performance in incorporation of
qualitative input and the low stage characteristics within how performance is measured.
Improvements within how performance is measured could therefore have a large effect on the
overall performance and affect multiple other themes and dimensions. This is also in line
with previous studies by Ross (2015) and Davis & Mentzer (2007) who concludes that there
are two major factors that needs to be measured in the forecasting process, which is accuracy
and bias.
The empirical evidence furthermore shows that the feedback provided does not always reach
every participant in the process, and most importantly, the main contributors in the Accounts.
Which is a major challenge, because if the feedback and improvement suggestions does not
reach the target audience, no changes can be made to improve. A solution to this that has
already been identified is to utilize the tools of Tableau to a greater extent and the ability to
create performance reports on demand with customized metrics. This would enable each
department head to create own performance reports and provide feedback directed to the
specific function, with forecasting metrics connected to outcome metrics used by the specific
function.
Another main challenge is that the used performance metric MAPE is created using the
market forecast and not the final demand plan, which means that only half of the process is
included in the performance metrics. A majority of the top-down information is incorporated
at BA level with information from product management and wide perspective market
intelligence. By not measuring the final demand plan, Ericsson cannot see the performance of
the Demand Planners and therefore not see if the forecast is improved or not by the BA. This
is also important when it comes to feedback, as of now the Demand Planners cannot get any
feedback on their performance as the final plan is not measured.
By utilizing Tableau to a further extent, with access to performance metrics and the ability to
track biases graphically over time, Ericsson could by quite small means, without any big
investments or organisational restructures, reach a stage three or four characteristics
described in the theoretical framework.
How is Performance Rewarded
The empirical evidence shows that Ericsson does not reward performance connected to
forecasting quality, nor do they have any connections between individual performance targets
and forecasting accuracy. When applying the theoretical framework, the characteristics at
Ericsson represents a clear stage one behaviour which represents a major challenge, but also
lots of room for improvement.
One major challenge connected to the characteristics of Ericsson is the lack of accountability
discussed earlier in this chapter, with forecasting performance not being tied to individual
performance targets there is a lack of accountability and motivation tied to each contributor.
As a result, the forecasting practises becomes less important than other work duties that may
be connected to individual performance targets. The importance of forecasting is one of the

72
seven key principles to increased forecasting performance which can only be maintained
through accountability, training and a structured process where the forecasting practice is
prioritised.
The theoretical framework suggests that to reach higher stages, forecasting accuracy needs to
be tied to performance for everyone participating and contributing in the forecasting process.
Which is needed at Ericsson to increase accountability and increase the importance of the
forecasting practice.
The next step would be to reward good performance to further increase the motivation and
accountability, while using bad performance as a source of feedback and analysis to improve
the process. It is however important to remember the market context of Ericsson and which
performance targets that are reasonable to reach in order to get rewarded. Rewards on the
Account levels can motivate the account team and ASRs to work closer with the customer in
order to get better information and demand data.
Summary
The dimension of Performance Measurements at Ericsson shows overall low stages in the
theoretical framework. A lot of the improvements rely on extending the access to
performance metrics to all participants in order to use them in an effective way and providing
feedback to all contributors in the process. The empirical evidence and analysis show that
Ericsson, with small changes and implementations, can reach stage three and four
characteristics as many of the desired functionalities exists but are not currently utilized.
Figure 14 presents a summary of the main drawbacks and improvements areas identified.
Figure 14: Summary Performance Measurements at Ericsson
← Challenges
• Limited distribution of perfromance feedback to accounts
• Forecasting performance not tied to individual targets and goals
• Perfromance only measured for market forecast
Status Quo
• Performance only measured using MAPE
• Performance report created and distributed monthly to key stakeholders
Potenial Improvement Areas
• Measure performance of the final demand plan
• Include forecasting quality in individual performance targets and goals for all key stakeholders and contributors in the forecasting process

73
6. Conclusion
In the next chapters the research questions are answered in the order to fulfil the purpose of
the study.
All conclusions are based on the findings from this case study research conducted at Ericsson
AB. The reason for mentioning this is because the market dynamics have a great impact on
how the forecasting practices are utilized and managed. Therefore, the conclusions presented
in this chapter are based on the specific context of Ericsson and the dynamic market
environment that the ICT branch is part of. Consequently, the conclusions of this thesis will
be relevant for companies in similar markets, with similar characteristics.
6.1 Fulfilling the Purpose of the Research
The purpose of this study was to investigate and review the forecasting process for a
decentralized global company to see what challenges that are present, and how to overcome
them to increase the performance. To answer the purpose, two research questions were
formulated which are answered below.
6.1.1 RQ1: What main challenges are present in the process?
Both the framework and empirical evidence shows that there are multiple challenges present
in the forecasting process. The challenges are often related to each other and is often rooted
in some main drawbacks within the process. When analysing the empirical evidence twelve
main challenges were identified.
Lack of process adherence: All activities are not performed in the forecasting process due to
individual takes on what is important for the forecasting process and what is not. The lack of
adherence is foremost related to the activities performed and not the overall structure of the
process. The challenge is related to lack of accountability in the process.
Disconnections between local and central organisation: The information sharing between
a central organisation and all local organisations in a global decentralized business are a great
challenge. This challenge is closely related to lack of adherence which complicates
information sharing.
Limited accountability for forecasting performance: With limited accountability for
forecasting performance, biases and own agendas will affect the forecast accuracy to not
represent an estimation of the true future demand. Biases and own agendas will instead affect
the forecast to fulfil own targets and goals that may not be connected to forecast quality.
Insufficient training in forecasting methods: Lack of training in forecast methods will
result in a lack of understanding and lack of importance for forecasting practices. Which will
lead to lack of adherence and decreased quality as wrong methods will be applied in wrong
situations.

74
Perception of biases: With perception of biases in the process there will be a lack of trust
among its participants. If there is a lack of trust in the information received, more corrections
and own estimations will be made that will corrupt the information and lower its quality.
Biases can be a result of lack of adherence, limited accountability and insufficient training.
Limited use and support of statistical analysis: A optimal forecasting process includes
both qualitative and quantitative data. Limited use and support for statistical analysis will
decrease the quality of the quantitative input which is important to create a good estimation
of the future demand.
Manual data transfers: Manual data transfers between systems and tools results in
inefficiency and increases the risk of human error. It can also create island of analysis where
the data loses its consistency when being transferred between systems.
Limited access to performance metrics: With limited access to performance metrics there
becomes harder to provide feedback and utilize feedback throughout the organisation. This
will lead to decreased level of improvements and control over how the process performs.
Limited utilization and access of existing tools: A major challenge identified at Ericsson
was that all the available tools were not utilized fully and available to all participants. This
affects and limits the access to performance metrics, visualisation and statistical tools. The
general challenge is to use the available tools wisely.
Limited distribution of feedback to Accounts: Limited feedback distribution is a challenge
that is closely related to the challenges of information sharing and limited access to
performance metrics. Without ways to distribute the feedback, the participants in the process
cannot learn how to improve their performance.
Forecasting performance not tied to individual performance targets: A prerequisite to
have accountability for forecasting performance is to connect forecast quality to individual
performance targets and goals. By not having forecast quality as part of individual
performance targets, forecasting practices will not be seen as an important part of the
business.
Accuracy only measured for market forecast: In a large organisation there are often
multiple levels or aggregation points in the forecasting process. To measure performance in a
good way and be able to provide good feedback, all levels must be measured and most
importantly the final output of the forecast must be measured to see the final accuracy of the
process.
6.1.2 RQ2: How should the forecasting process be designed to overcome the
identified challenges?
By analysing the identified challenges together with the empirical evidence and theoretical
framework, eight improvement suggestions were identified to overcome the challenges. The

75
improvement suggestions relate to multiple of the identified challenges and are targeted to
overcome the main challenges with the largest impact on performance.
Increased customer collaboration and involvement: The local organisation should strive
for a closer relationship with the customers where the customer does not only have meetings
and share information with the Key Account but also with the Supply function. Forecasting is
communication and it is important that supply can receive the necessary information. This
will increase the quality of the data, it will decrease the level of bias created by the sales
department and makes for a more efficient process with less manual handovers.
Increased training in forecasting methods: Every part of the organisation participating in
the forecasting process should be provided with continuous education and training in
forecasting methods and practices. It is important to understand which methods that are
applicable for which situations and how the data should be managed for increased
performance. Increased understanding will result in decreased level of bias, increased
adherence and increased ability for everyone to improve the process.
Measure and track bias: To overcome the challenge of perception of biases, the first step is
to track and measure bias. By tracking and measuring bias each month, patterns of continuous
bias can be identified and then root cause analysis and feedback will be much easier to
perform in order to counter the identified bias.
Increased support for statistical analysis and modelling: To increase the support of
statistical analysis it is important to increase the availability and access to the existing tools
and systems with such functionality. The key word is simplicity and that it should be easy to
perform simple analyses and create simple trend lines. The most important thing is not to
limit the use of such a tool to only some in the process, all should have access and ability to
perform simple analyses.
Increased integration between forecasting and sales system: To further overcome the
challenge of manual handovers the forecasting systems should be integrated with sales
systems used in the sales process. The sales systems contain lots of information that is of use
for the forecasting process. Therefore, the efficiency and accuracy could be increased by
having automatic transfers of data between the systems to avoid manual handovers and
human error.
Increased utilization of existing functionalities: One of the main challenges identified are
the lack of utilization of existing functionalities. Large global companies are often heavily
invested in system infrastructure and office suites but not all in the organisation have access
to them and can utilize them. Focus should be on providing access as well as training for the
tools so that both the local and central organisation can use the functionalities available and
overall increase the support and quality of the process. This affects multiple challenges as,
access to performance metrics, ability to visualise forecast data, and access simple statistical
models.

76
Measure performance of the final demand plan: By measuring the accuracy of the final
demand plan, feedback can be provided to all participants in the process and the total
performance can be reviewed. It is the final performance that is of interest to the leadership
team and is the metric that can be connected to business wide outcome metrics to see how the
forecasting performance affects the overall business.
Include forecasting quality in individual performance targets: To overcome the challenge
of limited accountability, forecasting performance needs to be included in individual
performance targets and goals. This tie forecasting performance to operational reviews and
performance appraisal which will increase motivation and accountability.
6.1.3 Recommendations for Ericsson AB
The figure presents four main recommendations for Ericsson in order to improve the
performance of their forecasting processes. The recommendations are based on the findings
from the case study and aims at improving the existing process without major changes to the
organisational structure or available tools.
Figure 15: Recommendations for Ericsson AB
The first step towards increased performance is to provide training within forecasting
methods and practices to all employees that are participating or contributing to the
forecasting process. Training in forecasting methods does not only provide an understanding
of which forecasting methods that are available, it also provides understanding regarding
which method that should be used for each situation and how the method affects the data and
final accuracy. By providing training for all participants, each contributor can use the
understanding and knowledge about forecasting methods to improve their own work
processes. This will both increase the accuracy and efficiency of the overall process as no one
knows each work process better than those who works with them on a daily basis. With
Provide training or workshops in forecasting methods for contributors and key stakeholders in the forecasting process
- Increased understanding
- Better adherence
- Decreased levels of biases
Include forecast performance in individual performance targets and goals for contributors and key stakeholders in the forecasting process
- Increased accountability
- Better adherence
- Increased motivation and strive for performance
Increase use Tableau through training and improved access for contributors and key stakeholders in the forecasting process
- Increased ability for analyses and visualization
- Ability to create customized performance reports
- Ability for all participants to create simple trend lines of historical data
Measure forecasting performance at BA level and graphically plot accuracy to detect biases
- Ability to focus improvement work towards accounts with continuous bias
- Ability to see the final accuracy of the demand plan
- Ability to provide feedback at BA level
77
increased understanding in the process we will see an increased adherence as well which is of
importance for a large and geographically spread company. Increased understanding will also
help prevent biases as each contributor will have a greater understanding of how the data can
be corrupted and which methods that can be utilized to avoid it.
The next step towards increased performance is to include and connect forecast performance
to individual performance goals and targets. This is important for all participants and
contributors in the process as it creates individual accountability and makes everyone more
accountable for their contribution. By increasing the accountability, the importance of
forecasting also becomes more acknowledged in the organisation which will help
performance and efficiency. With forecasting quality included in individual performance
targets, the motivation and adherence for forecasting processes will increase as well.
The third recommendation for increased performance is to increase the use of Tableau within
the organisation and make them available for all employees that are in some way interacting
with the forecasting process. By enabling all participants to access and use the tools, each
step in the process can increase its quality and make better estimations based on the data.
This is especially important for large and decentralized organisations where it is hard for
information to reach everyone involved in the process. A good example is feedback, if
feedback and performance reports are made by one person in the organisation it will be hard
for that person to distribute the feedback to everyone involved and ensure that they
understand and learns from the feedback. If each function head is instead able to create their
own performance reports and feedback, it will be much easier to distribute to everyone as the
distance the information needs to travel becomes shorter. It will also be more relevant as the
performance metrics of forecasting performance can be connected to relevant outcome
metrics that are of interest for each function. Lastly, actions to improve from the feedback
can be more easily managed for each function in the organisation and does not require the
same amount of change management.
The fourth and last recommendation is to measure forecasting performance at all levels in the
organisation and graphically plot accuracy for each level to detect biases within the process.
By measuring performance at every level in the process it will be easier to provide feedback
to every function and increase the quality of the process at each step. It will also enable the
ability to see how the accuracy of the forecast changes between each step and thus see if all
steps are necessary or if some actions are continuously decreasing the accuracy of the final
demand plan. The most important step to measure is the final demand plan to see how the
final forecasts differs from the actual demand. To detect continuous biases and effects of own
agendas it is important to also plot the accuracy for each level every forecasting cycle. This
will reveal if some customer accounts or functions are affected by continuous bias and
actions to counter the biases can be utilized correctly.
78
6.2 Implications on Sustainability
As todays companies are not only excepted to perform financially, but also to operate in a
sustainable way. The most accepted and quoted definition of sustainability is according to the
Brundtland commission; “development that meets the needs of the present without
compromising the ability of future generations to meet their needs.” (Barnaby, 1987). The
term is often divided into three aspects consisting of, economic, social and environmental
sustainability. This chapter will shortly discuss the thesis implications on these three
important areas.
6.2.1 Economic Sustainability
The economical sustainability is defined as a organisations long-term financial performance
and profitability (Jamali, 2006). By improving the efficiency and accuracy of the forecasting
process organisations will improve their demand and supply integration. An improved supply
and demand integration mean less inventory and decreased risk of scrape. This can have a
substantial economic impact on global organisations as less inventory results in less tied up
capital which can be invested in other parts of the organisation or other ventures.
Furthermore, forecasting processes in global organisations involves lot of resources and
consumes a lot of time. Therefore, even small improvements in efficiency can have a big
impact on the resources spent in the forecasting process, saving a company lots of costs.
6.2.2 Social Sustainability
The social sustainability is defined as the conditions of labour and ethics at an organisation
(Jamali, 2006). The conclusions of this thesis propose a set of directives on how the
forecasting process can become more efficient and with higher accuracy. The conclusions
suggest more focus on the participants in the process with increased efforts in training and
individual performance metrics. This will have effects on the social sustainability with
increased support and motivation for the tasks. A negative effect could be an increased
feeling of stress among the participants if the individual performance targets are set to
ambitious. It is therefore important to set them at a reachable level and use bad performance
as a source of feedback instead of punishment. If this is accomplished the social sustainability
will instead be affected positively.
6.2.3 Environmental Sustainability
The environmental sustainability is defined as the organisations impact on the worlds
environment and how the resources are managed in a sustainable way (Jamali, 2006). By
improving the efficiency and accuracy of the forecasting process a company can decrease
their impact on the world environment. Improvements in forecasting quality results in better
supply and demand integration which allows the company to have less inventory and the risks
for scrap and rest overs are decreased. This will in the long-term mean less facilities used for
inventory which have a substantial impact on the environment, especially for a large global
company with local storage facilities spread across the world.

79
6.3 Limitations of the Research and Future Studies
The case company Ericsson AB is one of the leading ICT providers in the world and can thus
be viewed as a general representative for the ICT market. However, the ICT marketplace is
small and there are only a few large companies that competes for customer contracts globally.
The market does however share some characteristics with other markets which makes the
study representative for a larger scale of businesses. Examples of such markets with similar
characteristics are within water and energy infrastructure, where global companies like
Xylem and ABB operates.
The study is furthermore limited to a single case study which in turn was limited to one
market area and two different countries which limits the results of this study further. To
strengthen the research multiple market areas needs to be investigated to see how culture
differences affect the results and forecasting management. Future studies should also include
multiple case companies to detect differences and get an increased generalization of the
results. The existing literature on forecasting management lacks case studies that studies how
forecasting management are affected by different cultures and market characteristics.
Therefore, further research is needed within the field of forecasting management to draw
conclusions that are generalizable for all markets.
Another limitation of this research is that the study involves all dimensions of forecasting and
is therefore broad in its perspective. To draw more detailed and specific conclusions a more
specific study is needed which only focuses on a specific dimension of forecasting e.g.
performance metrics. It is also of interest to study how other important aspects affects
forecasting management, such as information sharing.
This study invites for further studies within forecasting management. To be able to draw
good and general conclusions, more case studies are needed that investigates forecasting
within different contexts and market characteristics.

80
References
ALICKE, K., RACHOR, J. & SEYFERT, A. 2016. Supply Chain 4.0 - the next-generation
digital supply chain.
ANNASTIINA, K. & JANNE, H. 2014. The role of contextual information in demand
forecasting. Int. J. of Information and Decision Sciences, 6.
ARMSTRONG, J. S. 2001. Principles of Forecasting A Handbook for Researchers and
Practitioners, Boston, MA : Springer US : Imprint: Springer.
ARMSTRONG, J. S. 2005. The Forecasting Canon: Nine Generalizations to Improve
Forecast Accuracy. Foresight: the International Journal of Applied Forecasting, 1.
ARMSTRONG, J. S., GREEN, K. C. & GRAEFE, A. 2015. Golden rule of forecasting: Be
conservative. Journal of Business Research, 68, 1717-1731.
AUSTIN, L. Supply Chain Trends. Group Supply Knowledge Session, Jan 30, 2019 2018
Ericsson, Kista. SCM World/Gartner.
BARNABY, F. 1987. Our Common Future: The "Brundtland Commission" Report. Ambio,
16, 217-218.
BLOMKVIST, P. 2015. Method for engineering students : degree projects using the 4-phase
model, Lund, Lund : Studentlitteratur.
CHOPRA, S. & MEINDL, P. 2014. Supply Chain Management: Global Edition, Pearson
Education M.U.A.
CHRISTOPHER, M. 2011. Logistics and supply chain management, Harlow, Harlow :
Prentice Hall/Financial Times.
COLLIS, J. 2014. Business research : a practical guide for undergraduate & postgraduate
students, Place of publication not identified Palgrave Macmillan.
DAVIS, D. F. & MENTZER, J. T. 2007. Organizational factors in sales forecasting
management. International Journal of Forecasting, 23, 475-495.
EKHOLM, B. 2018. Ericsson Annual Report 2018.
FILDES, R. & FOTIOS, P. 2015. Improving Forecast Quality in Practice. Foresight: the
International Journal of Applied Forecasting.
FILDES, R., GOODWIN, P., LAWRENCE, M. & NIKOLOPOULOS, K. 2009. Effective
forecasting and judgmental adjustments: an empirical evaluation and strategies for
improvement in supply-chain planning. International Journal of Forecasting, 25, 3-
23.
GEPHART, R. & RYNES, S. 2004. Qualitative Research and the Academy of Management
Journal. Academy of Management Journal, 47, 454-462.
GILLILAND, M. 2010. The Business Forecasting Deal: Exposing Myths, Eliminating Bad
Practices, Providing Practical Solutions, Wiley.

81
JACOBS, F. R., BERRY, W. L., WHYBARK, D. C. & VOLLMANN, T. E. 2011.
Manufacturing planning and control for supply chain management, New York, New
York: McGraw Hill Professional.
JAMALI, D. 2006. Insights into triple bottom line integration from a learning organization
perspective. Business Process Management Journal, 12, 809-821.
KRISTENSEN, J. & JONSSON, P. 2018. Context-based sales and operations planning
(S&OP) research. International Journal of Physical Distribution & Logistics
Management, 48, 19-46.
LAPIDE, L. 2004. Sales and Operations Planning Part I: The Process. The Journal of
Business Forecasting.
LAPIDE, L. 2006. Top-Down & Bottom-Up Forecasting in S&OP. The Journal of Business
Forecasting, 25.
LAPIDE, L. 2009. It's Gotten Hard to Forecast. The Journal of Business Forecasting, 28.
LAPIDE, L. 2011. S&OP: The Linchpin Planning Porcess. Supply Chain Management
Review.
LAWRENCE, M., GOODWIN, P., AMP, APOS, CONNOR, M. & ÖNKAL, D. 2006.
Judgmental forecasting: A review of progress over the last 25 years. International
Journal of Forecasting, 22, 493-518.
MAKRIDAKIS, S., WHEELWRIGHT, S. C. & HYNDMAN, R. J. 2008. FORECASTING
METHODS AND APPLICATIONS, 3RD ED, Wiley India Pvt. Limited.
MAKRIDAKIS, S. G. 2005. Forecasting methods and applications.
MAKRIDAKIS, S. G. & WHEELWRIGHT, S. C. 1989. Forecasting Methods for
Management, Wiley.
MCCARTHY BYRNE, T. M., MOON, M. A. & MENTZER, J. T. 2011. Motivating the
industrial sales force in the sales forecasting process. Industrial Marketing
Management, 40, 128-138.
MCCARTHY, T. M., DAVIS, D. F., GOLICIC, S. L. & MENTZER, J. T. 2006. The
evolution of sales forecasting management: a 20‐year longitudinal study of
forecasting practices. Journal of Forecasting, 25, 303-324.
MENTZER, J. T. & MOON, M. A. 2005. Sales Forecasting Management: A Demand
Management Approach.
MOON, M. 2006. Breaking Down the Barriers to Forecast Process Improvement. Foresight:
The International Journal of Applied Forecasting, 26-30.
MOON, M. A. 2018. Demand and supply integration : the key to world-class demand
forecasting, Boston ; Berlin : DEG Press.
MOON, M. A., MENTZER, J. T. & SMITH, C. D. 2003. Conducting a sales forecasting
audit. International Journal of Forecasting, 19, 5-25.

82
MOON, M. A., MENTZER, J. T., SMITH, C. D. & GARVER, M. S. 1998. Seven keys to
better forecasting. Business Horizons, 41, 44-52.
OLIVA, R. & WATSON, N. 2009. Managing Functional Biases in Organizational Forecasts:
A Case Study of Consensus Forecasting in Supply Chain Planning. Production and
Operations Management, 18, 138-151.
RIEGE, A. 2003. Validity and reliability tests in case study research: a literature review with
'hands-on' applications for each research phase. Qualitative Market Research: An
International Journal, 6, 75-86.
ROBERT, F. & PAUL, G. 2007. Against Your Better Judgment? How Organizations Can
Improve Their Use of Management Judgment in Forecasting. Interfaces, 37, 570-576.
ROSS, D. F. 2015. Distribution Planning and Control Managing in the Era of Supply Chain
Management, New York, NY : Springer US : Imprint: Springer.
SAUNDERS, M. 2009. Research methods for business students, Harlow, Harlow : Financial
Times Prentice Hall.
SEIFERT, M. & HADIDA, A. L. 2013. On the relative importance of linear model and
human judge(s) in combined forecasting. Organizational Behavior and Human
Decision Processes, 120, 24-36.
SILVER, E. A. 2017. Inventory and production management in supply chains, Boca Raton :
Taylor & Francis.
SOUSA, R. & VOSS, C. A. 2008. Contingency research in operations management practices.
Journal of Operations Management, 26, 697-713.
SYNTETOS, A. A., NIKOLOPOULOS, K., BOYLAN, J. E., FILDES, R. & GOODWIN, P.
2009. The effects of integrating management judgement into intermittent demand
forecasts. International Journal of Production Economics, 118, 72-81.
THOMOPOULOS, N. T. 2015. Demand Forecasting for Inventory Control, Cham : Springer
International Publishing : Imprint: Springer.
WALLACE, T. F. & STAHL, R. A. 2008. Sales and Operations Planning: The How-To
Handbook, Steelwedge Software.
VEREECKE, A., VANDERHEYDEN, K., BAECKE, P. & VAN STEENDAM, T. 2018.
Mind the gap – Assessing maturity of demand planning, a cornerstone of S&OP.
International Journal of Operations & Production Management, 38, 1618-1639.
WHITE, H. R. & YORK, S. E. C. O. N. 1984. Sales forecasting: timesaving and profit-
making strategies that work, Scott, Foresman.
YIN, R. K. 2009. Case study research : design and methods, London, London : SAGE.
YIN, R. K. 2014. Case study research : design and methods, London, London : SAGE.

1
Appendix I
Interview questionnaire
Process Mapping
1. Could you give a brief introduction to your job and responsibilities?
a. How long have you worked at your current position?
b. Is forecasting part of your job description?
2. How would you describe the forecasting process?
a. Who do you receive the forecast from?
b. Who do you pass the forecast to?
c. Which meetings are you participating in?
3. Who are the key contributors to the forecasts?
a. Why are they key contributors?
4. What is your contribution to the forecasting process?
a. Is your contribution described somewhere?
5. How much time do you invest in developing a forecast?
a. How much time do you have to develop a forecast?
Functional Integration
1. Is there a formal forecasting process that everyone follows and are decision
makers/executives attending?
a. Are any external entities attending or collaborating with the process?
2. Which function, or department owns the forecasts?
3. Are those involved in the forecasting process accountable for the performance?
a. In what way are they held accountable?
b. Do you receive any feedback on your performance?
4. How would you describe the relationship between forecasts, planning and goals?
5. Have you got any training in forecasting or planning?
Approach
1. How would you describe the forecasting orientation, is a top-down or bottom-up
approach used?
a. If both are used, are any gap-analysis performed on the differences?
2. What is being forecasted and which data is used to determine the demand?
3. On which level are the products forecasted? E.g. SKU (Stock Keeping Unit) level or
product family level?
a. Can different levels of the forecast be accessed by the supply side?
4. Is any statistical analysis performed in the forecasting process?
a. If yes, which tool or statistical model?
5. How are qualitative input incorporated in the forecasting process?

2
a. Do you experience any biases in the qualitative input?
b. Is there any information or data that you believe are missing which would
improve the qualitative input?
Systems
1. Which system/systems are used and how are they integrated in the forecasting
process?
a. Are the data transferred between multiple systems?
b. Are there any manual transfers?
2. Are performance measurements reports easy to access?
a. Can everyone access them?
3. How is historical demand data stored and updated?
a. Is historical data easy to access?
4. Do you feel that the system infrastructure supports the forecasting process in a good
way?
Performance Measurements
1. How is forecasting performance measured?
a. Is bias measured in any way?
b. Are any outcome metrics used in measuring forecast performance? E.g.
inventory levels
2. Is forecasting performance rewarded in any way?
a. Who in the forecasting process gets rewarded?
b. What are the rewards based on?
Ending Questions
1. Do you have any suggestions for possible improvements in the forecasting process?
2. Where do you think the biggest challenges are in the forecasting process?