cloud-metric: a cost effective application development...
TRANSCRIPT
IT 16 049
Examensarbete 30 hpJuni 2016
CLOUD-METRIC: A Cost Effective Application Development Framework for Cloud Infrastructures
Alieu Jallow
Institutionen för informationsteknologiDepartment of Information Technology

Teknisk- naturvetenskaplig fakultet UTH-enheten Besöksadress: Ångströmlaboratoriet Lägerhyddsvägen 1 Hus 4, Plan 0 Postadress: Box 536 751 21 Uppsala Telefon: 018 – 471 30 03 Telefax: 018 – 471 30 00 Hemsida: http://www.teknat.uu.se/student
Abstract
CLOUD-METRIC: A Cost Effective ApplicationDevelopment Framwork for Cloud Infrastructures
Alieu Jallow
Classic application development model primarily focuses on two key objectives:scalable system architecture and best possible performance. However, This model ofapplication development works well on the private resources, but with the growingamount of public IaaS it is essential to find a balance between the cost and theperformance of an application. In this thesis, we have proposed CLOUD-METRIC: ACost Effective Application Development for Cloud Infrastructures. The frameworkallows users to estimate the cost of running applications on public cloudinfrastructures during the development phase. We will consider two major cloudservices providers, Amazon AWS and Google Cloud Platform. The providedestimates can be very useful to make improvements in the users' applicationarchitecture. In addition to cost estimation, the framework allows users to monitorresources utilized by their applications. Finally, we will provide users withrecommendation of instances on AWS and GCP based on resources utilized by theapplications over a period of time.
Tryckt av: Reprocentralen ITCIT 16 049Examinator: Edith NgaiÄmnesgranskare: Sverker HolmgrenHandledare: Salman Toor

Declaration
I hereby declare that except where specific reference is made to the work of others, thecontents of this dissertation are original and have not been submitted in whole or in partfor consideration for any other degree or qualification in this, or any other university.This dissertation is my own work and contains nothing which is the outcome of workdone in collaboration with others, except as specified in the text and Acknowledgements.
Alieu JallowJune 2016

Acknowledgements
I express my sincere gratitude to my supervisor, Salman Toor for his valuable guidanceand insights through out the project. I am sincerely thankful to Prof. Sverker Holmgrenfor being my reviewer and for his feedback on this report.
I am thankful to Google and Amazon for making their cloud pricing data accessiblefor developers.

Contents
Figures ix
Tables xi
Acronyms & Abbreviations xiii
1 Introduction 11.1 Problem Description . . . . . . . . . . . . . . . . . . . . . . . . . . . . 11.2 Aims of Project . . . . . . . . . . . . . . . . . . . . . . . . . . . . . . . 21.3 Motivation . . . . . . . . . . . . . . . . . . . . . . . . . . . . . . . . . . 21.4 Scope . . . . . . . . . . . . . . . . . . . . . . . . . . . . . . . . . . . . 31.5 Structure of Report . . . . . . . . . . . . . . . . . . . . . . . . . . . . . 4
2 Related Work 52.1 Overview . . . . . . . . . . . . . . . . . . . . . . . . . . . . . . . . . . . 52.2 Similar Works . . . . . . . . . . . . . . . . . . . . . . . . . . . . . . . . 62.3 Limitation of Related Work . . . . . . . . . . . . . . . . . . . . . . . . 7
3 Theoretical Concepts 93.1 Cloud Computing . . . . . . . . . . . . . . . . . . . . . . . . . . . . . . 9
3.1.1 Characteristics . . . . . . . . . . . . . . . . . . . . . . . . . . . 93.1.2 Deployment Models . . . . . . . . . . . . . . . . . . . . . . . . . 103.1.3 Services Models . . . . . . . . . . . . . . . . . . . . . . . . . . . 10
3.2 Public Clouds Providers . . . . . . . . . . . . . . . . . . . . . . . . . . 113.2.1 Amazon Web Services . . . . . . . . . . . . . . . . . . . . . . . 11
viii Contents
3.2.2 Google Cloud Platform . . . . . . . . . . . . . . . . . . . . . . . 133.3 Cloud Pricing Models . . . . . . . . . . . . . . . . . . . . . . . . . . . . 14
3.3.1 Pricing on AWS . . . . . . . . . . . . . . . . . . . . . . . . . . . 143.3.2 Pricing on GCP . . . . . . . . . . . . . . . . . . . . . . . . . . . 16
4 Design and Implementation 194.1 Overview . . . . . . . . . . . . . . . . . . . . . . . . . . . . . . . . . . . 194.2 Pricing Data . . . . . . . . . . . . . . . . . . . . . . . . . . . . . . . . . 19
4.2.1 Pricing Data Validation . . . . . . . . . . . . . . . . . . . . . . 194.3 Framework Architecture . . . . . . . . . . . . . . . . . . . . . . . . . . 20
4.3.1 Foreign Components . . . . . . . . . . . . . . . . . . . . . . . . 214.3.2 Native Components . . . . . . . . . . . . . . . . . . . . . . . . . 22
4.4 Test Environment . . . . . . . . . . . . . . . . . . . . . . . . . . . . . . 234.5 Framework Functionality . . . . . . . . . . . . . . . . . . . . . . . . . . 24
4.5.1 Metering Instance Resources . . . . . . . . . . . . . . . . . . . . 244.5.2 Cost Estimation . . . . . . . . . . . . . . . . . . . . . . . . . . . 254.5.3 Resource Monitoring . . . . . . . . . . . . . . . . . . . . . . . . 294.5.4 Instances Recommendation . . . . . . . . . . . . . . . . . . . . 31
5 Framework Evaluation 335.1 Recommendation Algorithm . . . . . . . . . . . . . . . . . . . . . . . . 33
5.1.1 Basic Hadoop jobs . . . . . . . . . . . . . . . . . . . . . . . . . 335.1.2 Stress CPU for maximum usage . . . . . . . . . . . . . . . . . . 34
5.2 Resource Monitor . . . . . . . . . . . . . . . . . . . . . . . . . . . . . . 355.3 Database . . . . . . . . . . . . . . . . . . . . . . . . . . . . . . . . . . . 355.4 Application . . . . . . . . . . . . . . . . . . . . . . . . . . . . . . . . . 36
6 Conclusion and Future Work 396.1 Future Work . . . . . . . . . . . . . . . . . . . . . . . . . . . . . . . . . 39
References 41
Appendix A 43

Figures
3.1 Services models in cloud computing and example of corresponding serviceproviders. . . . . . . . . . . . . . . . . . . . . . . . . . . . . . . . . . . 11
3.2 GCP Sustained Usage Discount scheme . . . . . . . . . . . . . . . . . . 18
4.1 Sample Pricing data from AWS on CSV format, showing region, instancetype, operating system, and hourly price . . . . . . . . . . . . . . . . . 20
4.2 Comparison of cost estimates between AWS SMC & estimator tool . . 21
4.3 Comparison of cost estimates between GCP PC & estimator tool . . . 22
4.4 CLOUD-METRIC framework architecture . . . . . . . . . . . . . . . . 23
4.5 CLOUD-METRIC framework database schema . . . . . . . . . . . . . 24
4.6 List of nodes in Hadoop cluster and their capacity of resources . . . . . 25
4.7 Estimated Cost of Hadoop Cluster on AWS . . . . . . . . . . . . . . . 28
4.8 Estimated Cost of Hadoop Cluster on GCP . . . . . . . . . . . . . . . 28
4.9 Estimated Cost of master AWS regions . . . . . . . . . . . . . . . . . . 29
4.10 Estimated Cost of master node on GCP regions . . . . . . . . . . . . . 29
4.11 Variation of hourly instance charges on AWS and GCP . . . . . . . . . 30
4.12 Visualization of CPU, memory, and disk utilization on an individual node 30
4.13 Visualization of resources usage on Hadoop cluster . . . . . . . . . . . . 31
5.1 Instances recommended by our recommendation algorithm on two testcases . . . . . . . . . . . . . . . . . . . . . . . . . . . . . . . . . . . . . 34
5.2 Visualization of resources monitor CPU usage on Hadoop cluster masternode . . . . . . . . . . . . . . . . . . . . . . . . . . . . . . . . . . . . . 35
5.3 Resources utilization of database . . . . . . . . . . . . . . . . . . . . . 37

x Figures
5.4 Resources utilization of the framework application . . . . . . . . . . . . 38
Tables
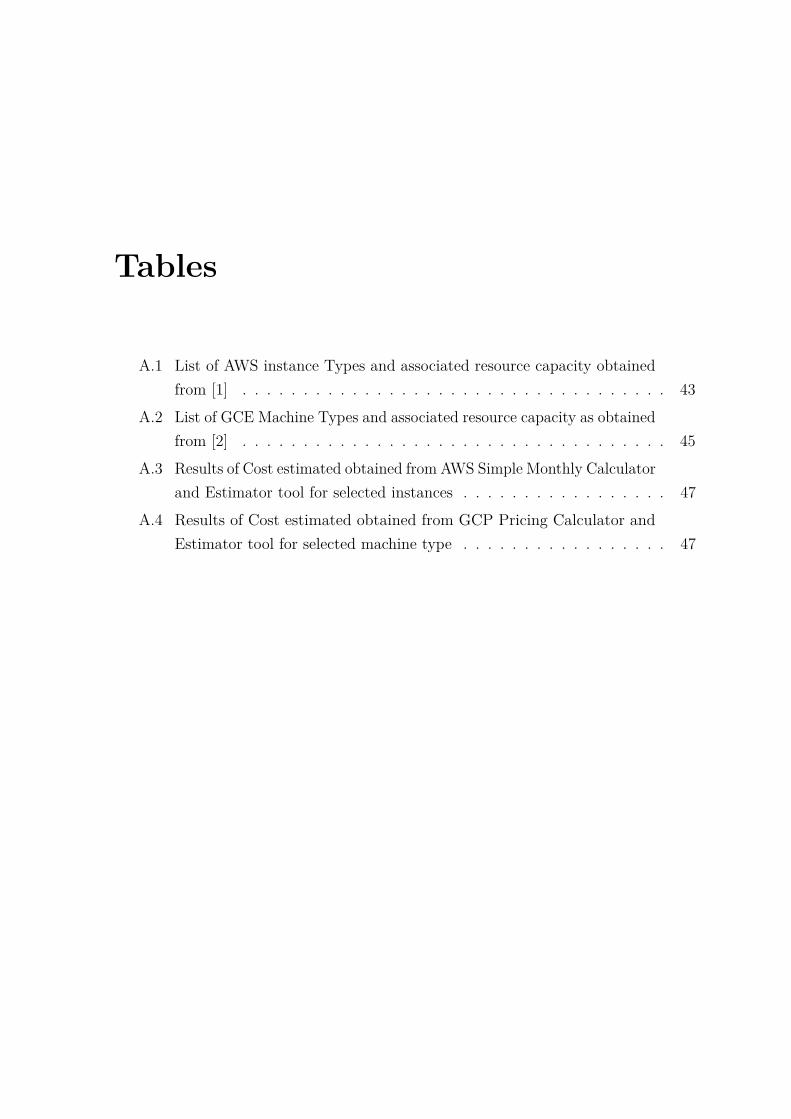
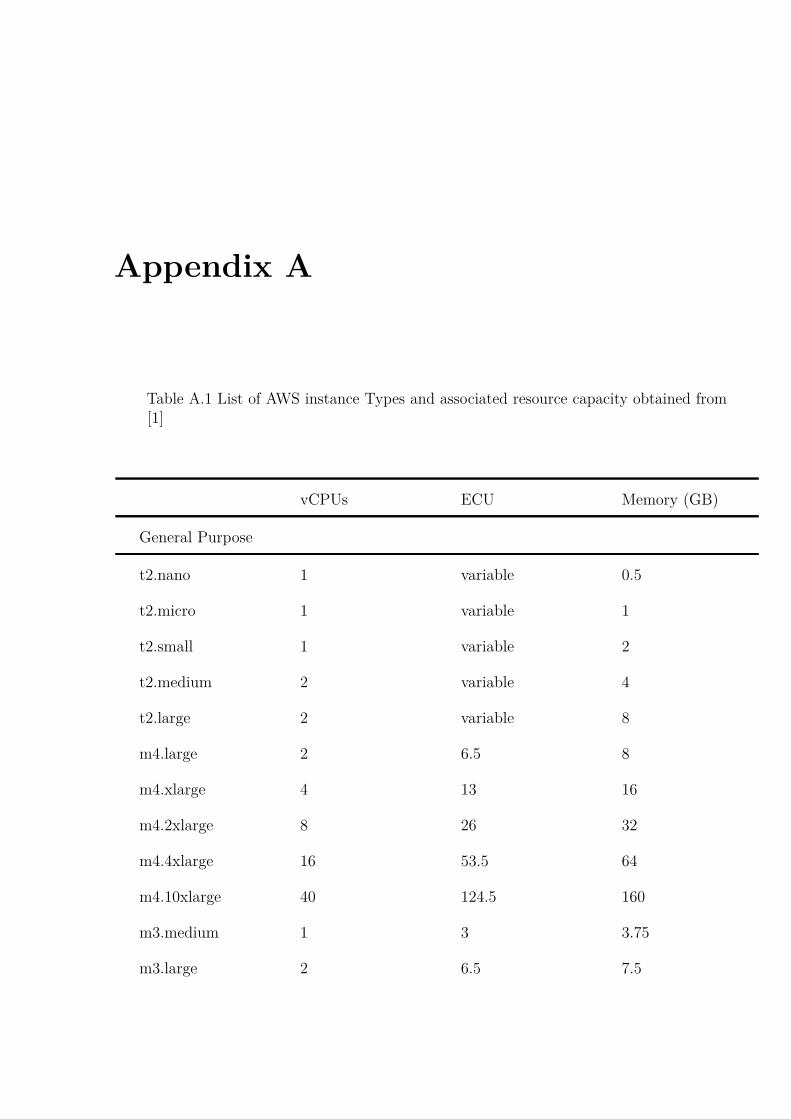
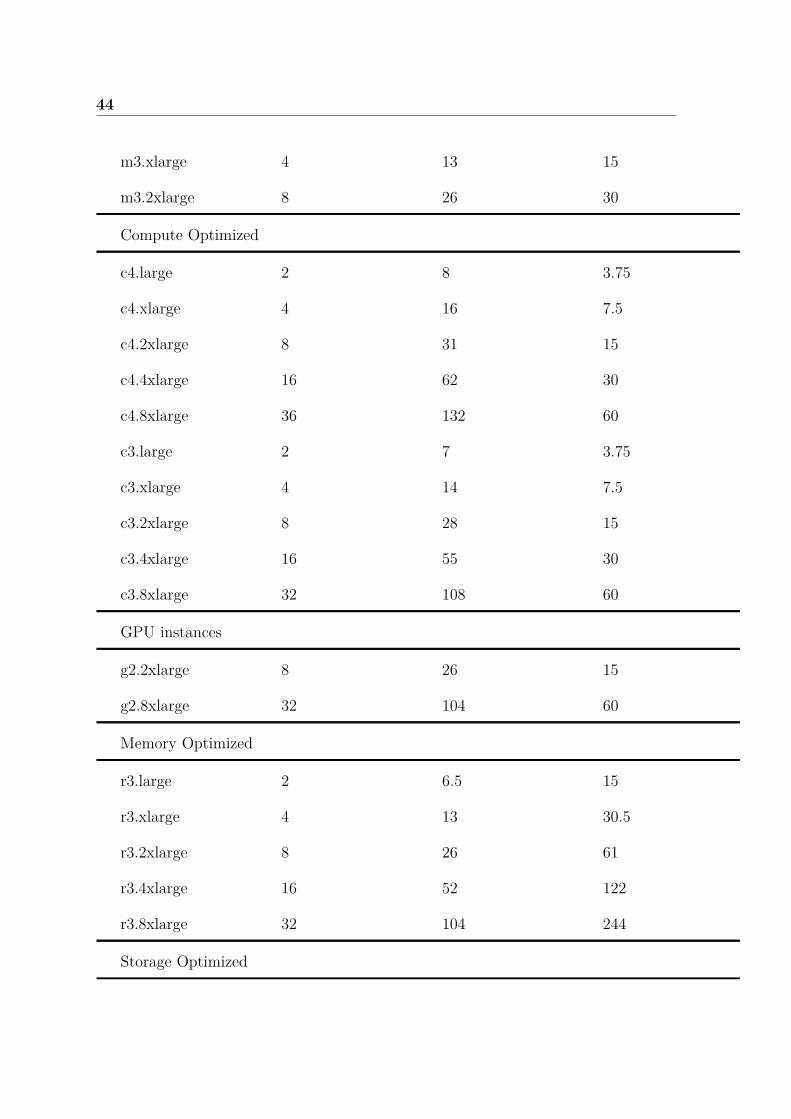
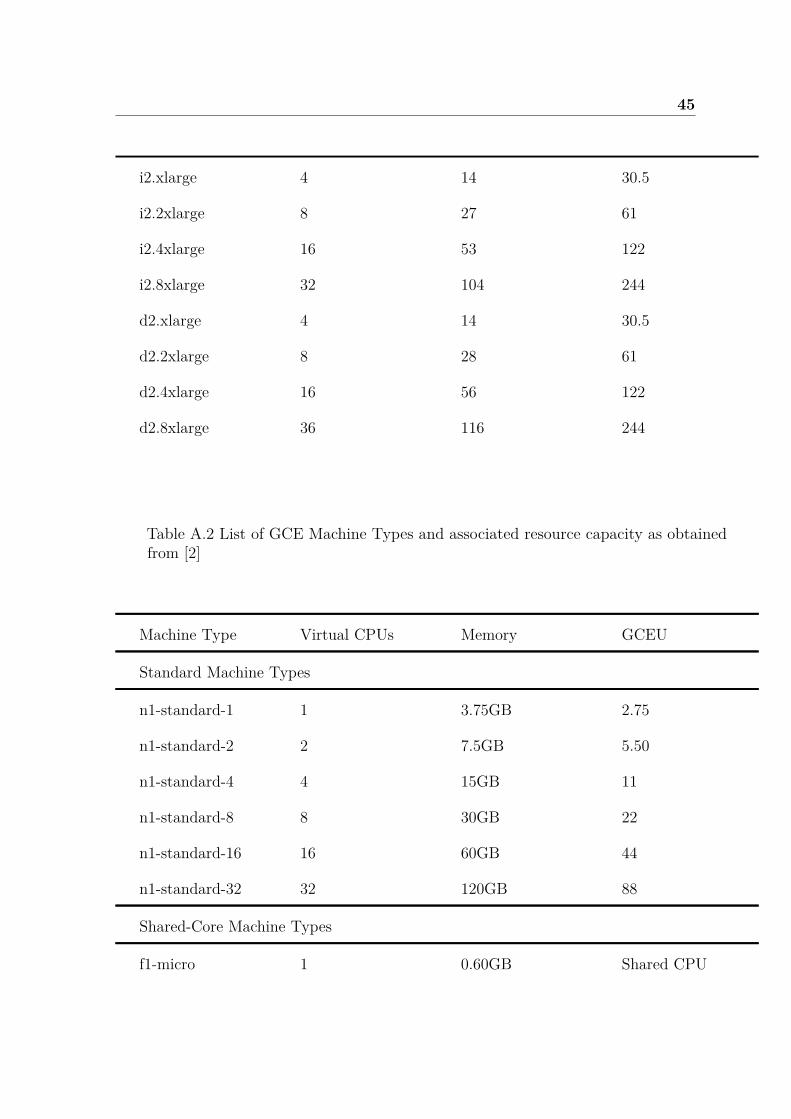
A.1 List of AWS instance Types and associated resource capacity obtainedfrom [1] . . . . . . . . . . . . . . . . . . . . . . . . . . . . . . . . . . . 43
A.2 List of GCE Machine Types and associated resource capacity as obtainedfrom [2] . . . . . . . . . . . . . . . . . . . . . . . . . . . . . . . . . . . 45
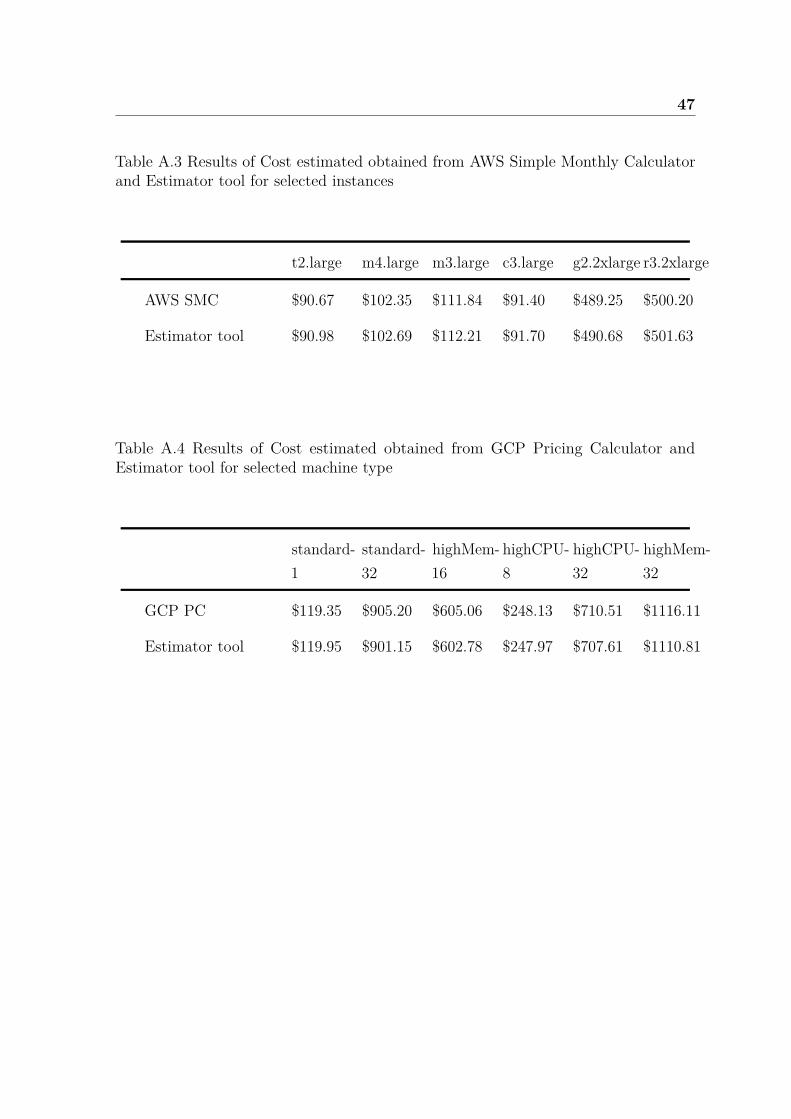
A.3 Results of Cost estimated obtained from AWS Simple Monthly Calculatorand Estimator tool for selected instances . . . . . . . . . . . . . . . . . 47
A.4 Results of Cost estimated obtained from GCP Pricing Calculator andEstimator tool for selected machine type . . . . . . . . . . . . . . . . . 47


Acronyms & Abbreviations
AWS Amazon Web Services
CPU Central Processing Unit
CSV Comma-Separated Values
DRA Durable Reduced Availability
EC2 Elastic Compute Cloud
ECU Elastic Compute Unit
GCE Google Compute Engine
GCEU Google Compute Engine Unit
GCP Google Cloud Platform
GCS Google Cloud Storage
HDD Hard Disk Drive
IaaS Infrastructure as a Service
IOPS Input/Output Operations Per Second
JSON JavaScript Object Notation
PaaS Platform as a Service
PC Pricing Calculator
S3 Simple Storage Service
xiv Acronyms & Abbreviations
SaaS Software as a Service
SCVMM System Center Virtual Machine Monitor
SMC Simple Monthly Calculator
SNIC Swedish National Institute of Computing
SSD Solid State Drive
UML Unified Modeling Language
Chapter 1
Introduction
1.1 Problem Description
The promise of Cloud computing is to deliver scalable access to a large pool ofcomputational, storage and network resources, commonly known as Infrastructure-as-a-Service (IaaS). Based on the IaaS it further enables set of high-level services such asPlatform-as-a-Service (PaaS) and Software-as-a-Service (SaaS). The model of efficientprovisioning of resources is in favor of both services provider and end-users. Users onlypay for the usage whereas service provides have well defined economic model togetherwith service level agreements.
Public Clouds offer competitive pricing model and platforms like Amazon Spot[3]market allows users to rent services on even lower cost. The cost model consists ofnumber of parameters such as number of CPUs, Memory and disk size, operatingsystem and network. However the cost of running large-scale applications are still abovethe borderline. One of the major reasons for this is often applications are designed toattain best performance. This model of application development works well on theprivate resources but with the growing amount of public IaaS it is essential to find abalance between the cost and the performance of an application.
In this project we developed a framework to estimate the cost of running anapplication in cloud environment. The aim is to estimate the execution cost duringthe development phase so that it will be possible to tune the application accordingly.CLOUD-METRIC will be used to maintain a balance between performance and theexecution cost of an application. Initially the focus will be on data-intensive processing
2 Introduction
environments like Hadoop and Spark. The framework will meter the execution andbased on the cost matrix it will estimate the overall price of the execution.
Finally, to provide the balance between cost and performance of application, theframework, through an optimization model, will provide recommendation for users onthe most cost-efficient instance types on Google Cloud Platform (GCP) and AmazonWeb Services (AWS) without compromising performance of application. The modelwill take parameters from resource monitoring data, pricing model from AWS andGCP, and instance types specifications from AWS and GCP.
1.2 Aims of Project
In this project we proposed a framework for estimating cost of running applications incloud infrastructures. The primary aim of this project is to provide users (developers)the ability to estimate cost of large-scale applications in public cloud infrastructuresspecifically, AWS and GCP. The estimated cost are calculated based on on-demandmonthly charges from GCP and AWS billings systems.
In addition to providing the estimated monthly cost on GCP and AWS, the proposedframework provides metrics on the resources utilization in the users developmentenvironment as well as a recommendation for instances types that minimizes themonthly estimated costs while maintaining or improving application’s performance.
1.3 Motivation
Cloud computing has gained significant popularity in the recent years. As a result,many researchers and industrial professionals are considering leveraging cloud comput-ing, which provides the compute power and the resources required to efficiently runapplications and store huge amounts of data. Although the cloud computing providesthe resources and computing power needed to support large-scale applications andmassive data storage, many researchers and professionals have reservations using thecloud for several factors. One of the major factors is cost. In fact Cost, Networking,and Elasticity are the top three dominant factors influencing the adoption of cloudcomputing for science[4].
Is it a myth that cloud resources is cheap? Our proposed cost-effective frameworkwill demystify this misconception of cloud computing by providing users cost estimates
1.4 Scope 3
of running applications in two public clouds, AWS and GCP. The framework will meterusers’ development environment and recommend instances on AWS and GCP thatmatches their environment. The overall impression of running applications in AWSand GCP will be provided by our proposed framework.
Several researchers including [5] and [6] provide guides to running applications inthe cloud. [6] proposed an approach to estimated the cost of running applications onAWS during design phase. [5] proposed a guide for deploying legacy web applicationson cloud infrastructures. However, the proposed approaches in [6] and [5] does notprovide cost estimates. [6] solution is limited in providing cost estimate that reflectbillings in public cloud providers because an application implementation may differfrom its initial design. Our framework in this project provides for users the ability toget cost of application while it is being developed. Simultaneously, the user will havethe functionality to see which part of their application is consuming more resources sothat they could tune the application.
1.4 Scope
In this thesis project, the focus is to provide an estimated cost of running applications inpublic cloud infrastructures such as Google Cloud Platform and Amazon Web Services.The estimated cost are not exactly same as the cost on the GCP Pricing Calculatorand AWS Simple Monthly Calculator. However, the estimated cost is very close to theexact AWS and GCP billing costs.
The estimation of the cost is based on metered computer resources usage parameterssuch as number of vCPUs, memory size, and disk storage size. Our framework passesthe metered parameters to our matching algorithm that maps them to a closelymatching instance on AWS and GCP that has the most minimal cost and returns anestimated cost for each of the instances in a month. However, the framework does notconsider the low-level differences in hardware resources between our test environmentand the Google Cloud and between test environment and AWS. These differencesinclude processor speeds, hardware vendors, and other hardware-specific parameterssuch as AWS’ ECU and GCP’s GCEU. The reason we have not considered this detailsis that the public cloud providers do not use these hardware-specific details to computethe cost of running their instances. Besides, it would be much more complicated toprovide cost estimate one instance type with varying hardware-specific details.
4 Introduction
In our proposed framework, we implemented a resource monitoring use case thatallowed us to provide recommendation for instance types on GCP and AWS thatminimizes cost and maintain or improve performance of users’ applications. In ourframework, the monitoring is limited to only basic parameters used by AWS and GCPfor cost estimation and instances type specifications such as number of CPUs, memoryusage, and disk usage.
1.5 Structure of Report
The rest of the report is organized as follows: In chapter 2, We discussed related worksin detail. We outlined relevant theoretical concepts, public cloud providers and theirrespective pricing model in chapter 3. In chapter 4 we describe our framework designand implementation. Chapter 5 discusses results of framework evaluations and inChapter 6 we outlined the conclusion, and future work.
Note: We have used on several occasions instances, nodes, machines, and virtualmachines or VMs interchangeably. We mean the same thing. We have also used instancetypes and machine types interchangeably. This is because Google uses machine typesto refer to Compute Engine virtual machines and AWS uses instance types to refer toEC2 virtual machines.
Chapter 2
Related Work
2.1 Overview
As cloud computing provides the needs of researchers and industry professional suchas on-demand self-service, rapid elasticity, broad network access, large pool of computeresources, and measured services [7] there has been an increase in its adoption overrecent years. On measured services characteristic of cloud computing, several tools havebeen developed, utilizing various billing models, to provide cloud services providersthe ability to bill users on for resources used on monthly basis. The most widely usedmodel is the “Pay-as-you-go”, which is adopted by all major cloud services providers.On the other hand, cloud services providers have developed tools such as GCP PricingCalculator, AWS Simple Monthly Calculator that allow users to estimate cost ofadopting services on cloud environments such as EC2, GCE, AWS S3 etc.
However, such estimation are limited as they do not provide the users the abilityto relate the estimated cost with application-specific characteristics such as design,implementation, performance, and resources usage. In addition, the actual cost ofrunning an application may be much more higher than what is being estimated usingthe calculators as the application might consume lots of resources such as network,CPU, and memory, which could be tune and optimized during development. And forlarge-scale distributed applications, there is need for framework that allow developersto see how much resources are being consumed during development. Such a frameworkwould allow the tuning of the application so that eventually resources utilization andcost are minimized while performance is improved or maintained. This is the problemwe are solving in this thesis project.
6 Related Work
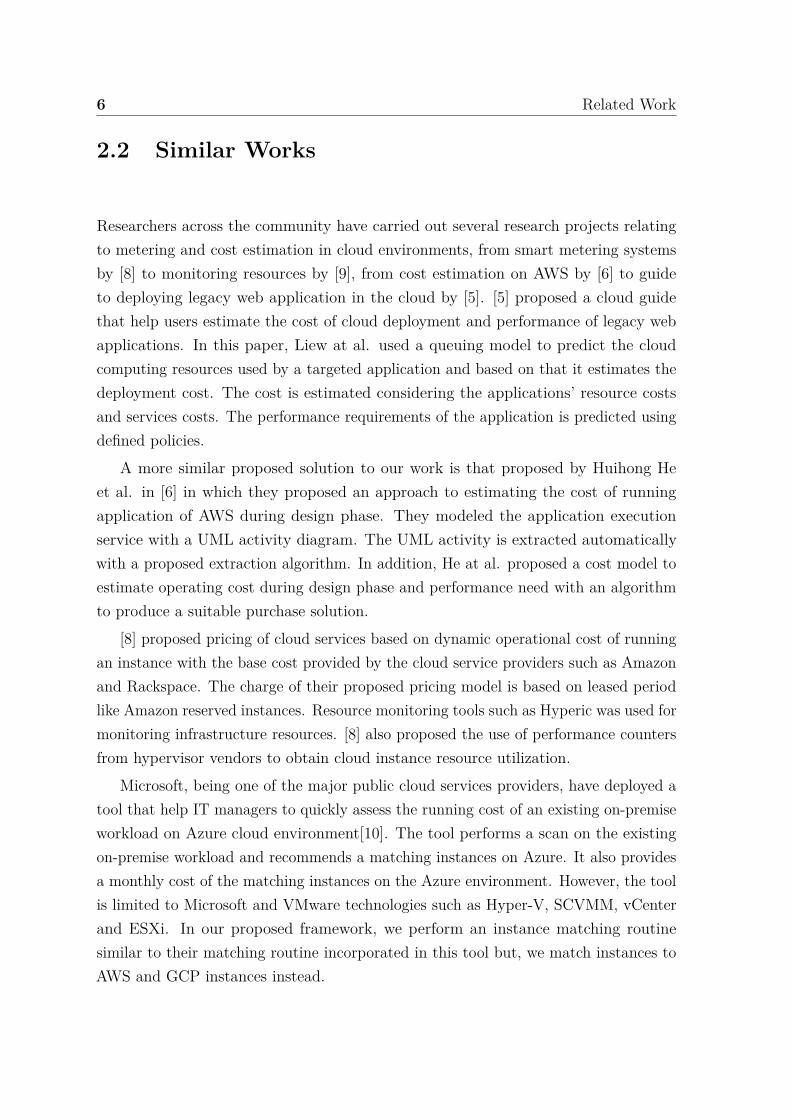
2.2 Similar Works
Researchers across the community have carried out several research projects relatingto metering and cost estimation in cloud environments, from smart metering systemsby [8] to monitoring resources by [9], from cost estimation on AWS by [6] to guideto deploying legacy web application in the cloud by [5]. [5] proposed a cloud guidethat help users estimate the cost of cloud deployment and performance of legacy webapplications. In this paper, Liew at al. used a queuing model to predict the cloudcomputing resources used by a targeted application and based on that it estimates thedeployment cost. The cost is estimated considering the applications’ resource costsand services costs. The performance requirements of the application is predicted usingdefined policies.
A more similar proposed solution to our work is that proposed by Huihong Heet al. in [6] in which they proposed an approach to estimating the cost of runningapplication of AWS during design phase. They modeled the application executionservice with a UML activity diagram. The UML activity is extracted automaticallywith a proposed extraction algorithm. In addition, He at al. proposed a cost model toestimate operating cost during design phase and performance need with an algorithmto produce a suitable purchase solution.
[8] proposed pricing of cloud services based on dynamic operational cost of runningan instance with the base cost provided by the cloud service providers such as Amazonand Rackspace. The charge of their proposed pricing model is based on leased periodlike Amazon reserved instances. Resource monitoring tools such as Hyperic was used formonitoring infrastructure resources. [8] also proposed the use of performance countersfrom hypervisor vendors to obtain cloud instance resource utilization.
Microsoft, being one of the major public cloud services providers, have deployed atool that help IT managers to quickly assess the running cost of an existing on-premiseworkload on Azure cloud environment[10]. The tool performs a scan on the existingon-premise workload and recommends a matching instances on Azure. It also providesa monthly cost of the matching instances on the Azure environment. However, the toolis limited to Microsoft and VMware technologies such as Hyper-V, SCVMM, vCenterand ESXi. In our proposed framework, we perform an instance matching routinesimilar to their matching routine incorporated in this tool but, we match instances toAWS and GCP instances instead.
2.3 Limitation of Related Work 7
2.3 Limitation of Related Work
Despite all the works of several researchers in the community and the industry relatingto cost estimation in cloud infrastructure, none of them have addressed the problem wehave solved in this thesis project: equipping developers with a lightweight frameworkthat allows them to know the cost of running applications in AWS and GCP whilein development phase and provide metrics on the resources utilized to not only allowapplication tuning, but also recommend optimal instances on AWS and GCP. Theproposed solution in [6] is liable to provide inaccurate cost estimates as the initialdesign of the application, with which the cost estimate were made, changes. To getaccurate cost estimate would require running the tool each time for each design changeswhich would be handy.

Chapter 3
Theoretical Concepts
In this chapter, we discussed the relevant theoretical concepts to the proposed frame-work. Later in the chapter, we outlined the public cloud providers we have consideredin the framework and their respective cloud services and pricing models.
3.1 Cloud Computing
Cloud computing, according to [7], is a model for enabling ubiquitous, convenient,on-demand network access to a shared pool of configurable computing resources (e.g.networks, servers, storage, applications and services) that can be rapidly provisionedand released with minimal management effort or service provider interaction. Acloud infrastructure is the collection of hardware and software that enables the fiveessential characteristics of cloud computing. The cloud infrastructure can be viewedas containing both a physical layer and an abstraction layer. The physical layerconsists of the hardware resources that are necessary to support the cloud servicesbeing provided, and typically includes server, storage and network components. Theabstraction layer consists of the software deployed across the physical layer, whichmanifests the essential cloud characteristics. Conceptually, the abstraction layer sitsabove the physical layer[7].
3.1.1 Characteristics
Cloud computing has several characteristics: rapid elasticity – capability to provisioncompute resources on demand or release resources so as to scale up or down on customers’
10 Theoretical Concepts
demand; on-demand self-service – capability that enables user to provision resourcesand services without intervention of services providers; Broad network access –capability to access resources and services over network or standard mechanism likethin or thick clients; Resources pooling – means computing resources are pooledto serve multiple customers on a multi-tenant model and resources are dynamicallyassigned and reassigned without customers knowledge; Measured Services – resourcesand services usage are measured, controlled, and monitored to provide transparencyfor both provider and consumer of the utilized service.
3.1.2 Deployment Models
Cloud computing has three deployment models namely public cloud, private cloud,community cloud, and hybrid cloud.
• Public Cloud – In this model, multiple tenants use a single virtual machineand each pay for the resources they consume. It is provided by a cloud serviceprovider. Examples include Amazon EC2, Microsoft Azure, Google ComputeEngine
• Private Cloud – In this model, a company manages its own data center thatprovides scalability, provisioning, automation and management. The companygains the benefits of cloud computing with private cloud, but incur the cost ofmaintaining it as well.
• Hybrid – This model allows a company to maintain an internal private cloudwhile using public cloud as needed.
3.1.3 Services Models
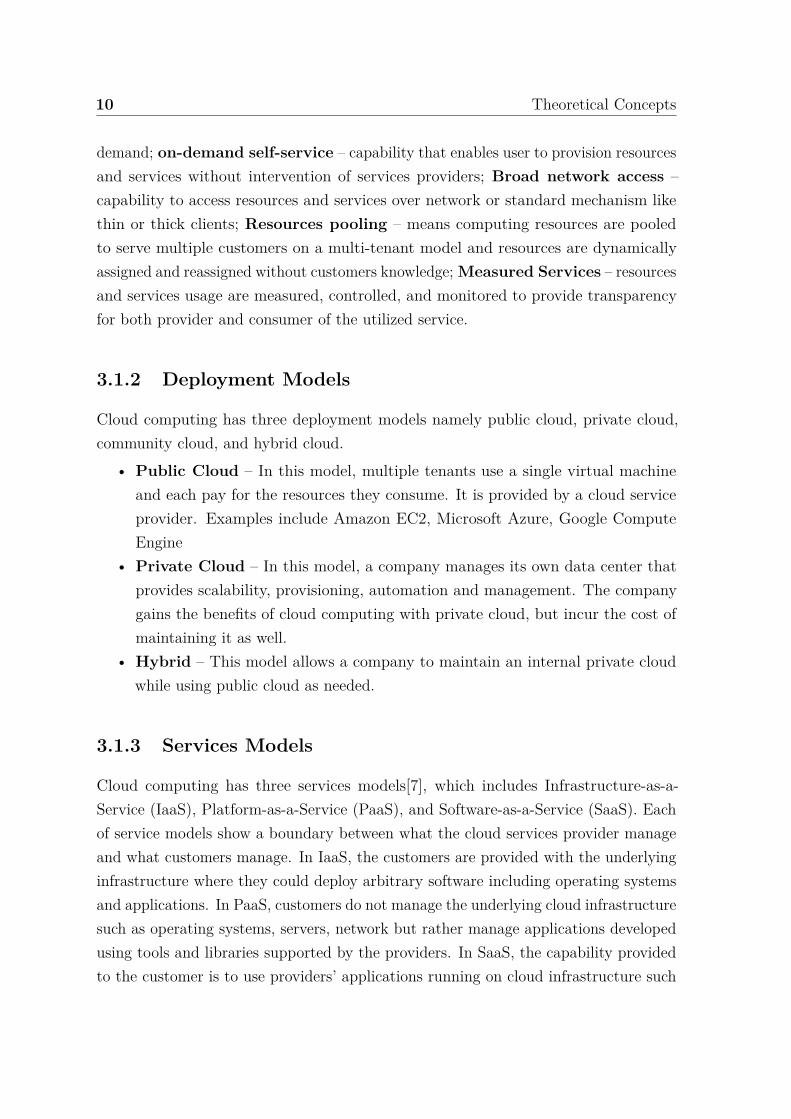
Cloud computing has three services models[7], which includes Infrastructure-as-a-Service (IaaS), Platform-as-a-Service (PaaS), and Software-as-a-Service (SaaS). Eachof service models show a boundary between what the cloud services provider manageand what customers manage. In IaaS, the customers are provided with the underlyinginfrastructure where they could deploy arbitrary software including operating systemsand applications. In PaaS, customers do not manage the underlying cloud infrastructuresuch as operating systems, servers, network but rather manage applications developedusing tools and libraries supported by the providers. In SaaS, the capability providedto the customer is to use providers’ applications running on cloud infrastructure such
3.2 Public Clouds Providers 11
as email services, spreadsheets and word processor applications. Our framework isdesigned to allow users to estimate cost of application running in the IaaS servicemodel. The figure 3.1 shows the the services models and associated providers.
Fig. 3.1 Services models in cloud computing and example of corresponding serviceproviders.
3.2 Public Clouds Providers
In this project, we provide estimated monthly cost from major public clouds providers.The chosen public cloud providers are Google Cloud Platform (GCP) and Amazon WebServices (AWS). Other public cloud providers include Microsoft Azure, and Rackspace.
3.2.1 Amazon Web Services
Amazon Web Services (AWS) is the collection of cloud computing services offered byAmazon[11]. Being the first public cloud services provider, provides a highly reliable,scalable, low-cost infrastructure platform in the cloud that powers hundreds of thou-sands of businesses in 190 countries around the world[12]. AWS offers services includingAmazon EC2, Amazon S3, Amazon DynamoDB, Amazon CloudFront, Amazon EBS,
12 Theoretical Concepts
Amazon Beanstalk, etc. In this project, we consider Elastic Compute Cloud (EC2),Elastic Block Store (EBS), and Simple Storage Service (S3).
Amazon EC2
EC2 is a web service that provides resizable compute capacity in the cloud. It providesan interface that allows users to obtain and configure capacity with minimal friction.The EC2 allows customers to take control of their provision compute resources. WithinEC2, there are several instance types classified in accordance with hardware resourcessuch as number of virtual CPUs , memory size, and an underlying hardware resourcecalled EC2 Compute Unit ECU. EC2 instances are further grouped into five classesnamely Compute Optimized, Memory Optimized, Storage Optimized, GPU Instances,and General Purpose. List of AWS EC2 instance types is outlined in Appendix A,table A.1. EC2 instance have attached EBS volumes, which provide persistent blockstorage. EBS volumes offer consistent and low-latency performance for workloads. Theavailable EBS volumes types include EBS General Purpose SSD, EBS ProvisionedIOPS SSD, Optimized Throughput HDD, Cold HDD, and older generation MagneticDisks.
Amazon S3
Amazon S3 provides secure, highly-scalable, and safe object storage. Via a web interfacecustomers could store and retrieve large amount of data from any where on the web.S3 provides the data storage needs of customers on AWS.
Amazon EBS
Amazon Elastic Block Store (EBS) provides persistent block-level storage volumesfor use with EC2 instances. It provides high availability and durability. It givescustomers the capacity to scale up and down with minutes while paying for only whatis provisioned. In AWS cloud, EC2 instances also differ with the kind of volume storageavailable – some flavors provide EBS, others provides SSD storage[1].

3.2 Public Clouds Providers 13
3.2.2 Google Cloud Platform
Google Cloud platform is the cloud computing platform that is provided by Google.GCP provides hosting and other cloud services on the same cloud infrastructure thatGoogle uses internally for its products such as Youtube, and Google Search. Over recentyears, Google has added several cloud services on top of the App Engine – the PaaSservice that was initially launched – to compete with it biggest competitor AmazonAWS, and Microsoft Azure. These services include Compute Engine, Container Engine,Storage, BigQuery, Vision API, etc. In this project, we are delving into its computeinfrastructure, and Storage.
GCP Compute Engine
Google’s cloud computing IaaS is GCP’s Compute Engine. Compute Engine providesprovides high-performance and scalable virtual machines (VM) running on Google’sinnovative data centers connected by a global fiber network[13]. Compute Engineprovides users the choices to create custom Machine Types or choose from a set ofpredefined sizes. A list of the predefined instances is outlined in Appendix A, tableA.2.
Disk Storage
Google provide persistent block storage for its Compute Engines. The persistent blockstorage is available in two types: persistent HDD volume and local SSD volumes.
Google Cloud Storage
Google Cloud Storage is the equivalent of AWS S3 on the GCP. It provides users withdurable and highly available object storage[14], which is available in three differentoptions for customers to choose from depending on the needs of their applications –Standard, DRA, and Nearline storage. The storage choices in this framework uses thestandard option.

14 Theoretical Concepts
3.3 Cloud Pricing Models
Cloud pricing models varies from provider to provider. For example, the pricing modelon Amazon Web Services varies from that of Google Cloud. The most important goalsfor cloud services providers is profitability and revenue maximization[15], whereas usersare more concerned with Quality of Services (QoS), high availability of resources, andcost-effectiveness. To handle this trade-off, cloud services providers have adopted thescheme of dynamic pricing models such as the Amazon Spot instances [3] [15]. Themost widely known pricing model is the “Pay-As-You-Go”[15] model, which is adoptedby all cloud service providers. Another pricing model is the subscription-based modelin which users subscribe to use compute resources for a fixed period of time (usuallybetween 1 to 3 years). As the demand for use of cloud services increases over theyears and provision of public cloud services became more competitive among Amazon,Microsoft, and Google, several pricing discounts schemes have been incorporated on topof existing pricing models. This has led to the huge reduction in cloud services costson all major providers over recent years. In the next few sections, we have outlined thepricing schemes from Amazon AWS and Google Cloud Platform.
3.3.1 Pricing on AWS
Apart from the free usage tier, which allows potential customers to get started onAWS services, AWS charge the rest of its cloud services. For each service, users payfor exactly the amount resources utilized. Amazon pricing models includes:
• Pay as you go. In this model, users pay for only what they use. For EC2instance, user pay for hourly charges from the time of starting an instance untiltermination. For data storage and transfer, AWS charges per gigabytes basis.Charge depends on the underlying infrastructure and resources consumed. Thisis also referred to as “On-demand” pricing model. We have used this pricingmodel in our framework for estimating the cost of running instances.
• Pay less on Reserve. Users could get up to 60% discount on reserve instancesover equivalent On-Demand capacity. This, however, depends on the instancetypes used.
• Pay even less per unit for 100% usage. For storage and data transfer,pricing is tiered. Users could pay less when they used more. For EC2, user couldget up to 10% discount when they reserve more.
3.3 Cloud Pricing Models 15
AWS has three fundamental characteristics that customers pay for and have thegreatest impact on cost[16]. This characteristics include compute, storage, and datatransfer out. Our framework considers compute infrastructure and its persistent storagecosts.
EC2 Pricing
Cost estimation on Amazon EC2 considers the following:• Clock Hours of Server Time – the total number hours server runs with a specified
period of time, e.g 30 days;• Machine Configuration – instance pricing varies from regions, OS, number of
vCPUs, and memory;• Machine Purchase Type – Prices varies from On-Demand, Reserve or spot
instances;• Number of Instances – No more instance used the more charges are incurred;• Operating Systems and Software Packages – Except for some Linux variants such
as Ubuntu, Debian,etc, OS are charge with the instance[16].
Pricing formula
Below is a formula for computing the monthly cost of a single AWS EC2 instance:
Costmonthly = Costhourly × Tuptime + Storagesize × Storageunitcost
where Costmonthly is instance monthly cost, Costhourly is hourly unit cost, Tuptime isuptime in hours per month, Storagesize is the disk size, and Storageunitcost is unit costof disk type per GB per month. In AWS, EC2 unit cost includes the operating systemcost as well.
S3 Pricing
AWS S3 pricing considers storage class, storage size, requests, and data transfer[16].Storage class includes standard storage and Standard – Infrequent Access storage, andGlacier. The former has a higher percentage of availability than the latter, while thepercentage of durability is same – 99.999999999%. The size of storage is charged on aper GB basis. As for requests, GET request gets more charges than others such as

16 Theoretical Concepts
PUT, and POST. Charges are incurred on data transferred out of region on a per GBbasis.
EBS Pricing
Amazon EBS provides persistent volumes storage for EC2 instances. EBS volumesare charged by the amount provisioned per GB per month. There are three types ofEBS on AWs: General Purpose (SSD), Provisioned IOPS (SSD), and Magnetic[16].Input Output Operations per Second (IOPS) are charge based on number of requestsmade to volume on Magnetic. IOPS charge is included in General Purpose SSD cost.In Provisioned IOPS, it is charged based on the number of IOPS provisioned. EBSprovides snapshot for backups of instances on S3 for durable recovery. EBS snapshotsare charged per GB-month of data stored.
3.3.2 Pricing on GCP
Google Cloud Platform offers pricing of up to 50% less than other cloud providers[17][18].The GCP offers per minutes billing and automatic discounts on increased usage.Customers pay monthly for on-demand usage of virtual machines instances. In addition,the minimum per minute billing is 10 minutes and usage is rounded up to the nearestminute. Furthermore, Google offers Sustained Usage discounts which means the morecustomer used, the greater the discount.
Compute Engine Pricing
Google offers two categories of machine types: Predefined machine types and Custommachine types. Predefined machine types have preset virtualized hardware propertiesand a set price while custom machine types are priced with number of virtual CPUsand memory the instance uses[17]. The Predefined machine types are further groupedinto several classes. These include Standard, Shared-core, High Memory, High CPUmachine types. This class of predefined machine types are qualified for the SustainedUsage Discount. All machine types on GCP are charged a minimum of 10 minutes andincrements after 10 minutes are rounded up to the nearest minute.
On Compute Engine, GCP charges for premium images and the prices differ basedon machine types where they are used. The prices for all premium images such asSUSE linux, Red Hat Enterprise Linux, and Window server images are added to the
3.3 Cloud Pricing Models 17
price of the machine type. The premium image prices differ per image and the machinetype it is running but the prices are same in all regions[19]. SUSE images are charged$0.02 per hour for f1-micro and g1-micro machine types and $0.11 per hour for allother machine types. RHEL images are charged $0.06 per hour for all machine typeswith 4 or fewer vCPUs and $0.13 per hour machine types with more than 4 vCPUs.Windows server images are charged $0.02 per hour for f1-micro and g1-micro machinetypes and $0.04 per core per hour for all other machine types. We have added all thisdetails to our cost estimation routines of the framework.
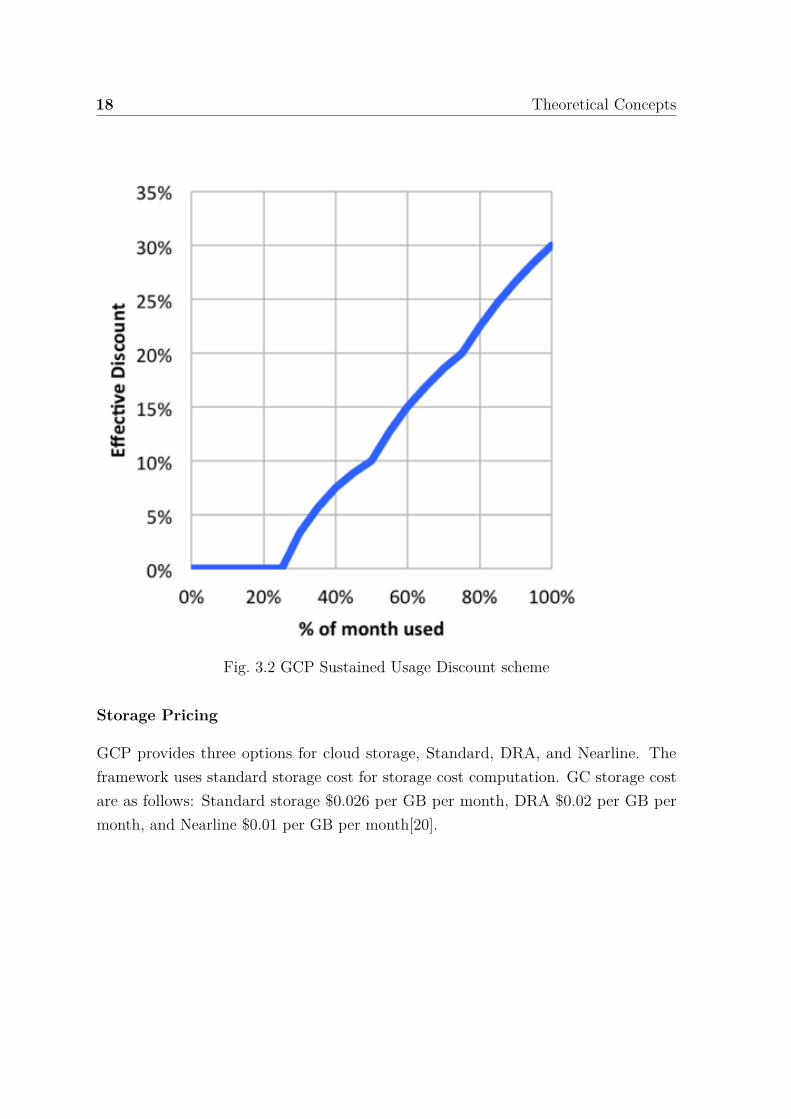
GCP provides a discount scheme called Sustained Usage Discount on all itspredefined regular machine types for on-demand subscription. When a predefinedmachine type runs more than 25% of a month, compute engine give an automaticdiscount on every minute added. This scheme gives a net discount of up to 30%(Seefigure 3.2) for an instance that run the entire month[19].
Pricing formula
Below is formula for computing the cost of a single instance on GCP:
Costmonthly = Costhourly×Tuptime×Discountsu+Storagesize×Storageunitcost+OSunitcost×Tuptime
where Costmonthly is instance monthly cost, Ch is hourly unit cost, Tuptime is uptime inhours per month, Storagesize is the disk size, Storageunitcost is unit cost of disk type,Discountsu is the Sustained Usage Discount which equals 0.70 for maximum monthlyusage, OSunitcost is premium operating system unit cost. In GCP, OS cost are notincluded in the machine type hourly unit cost. OS is computed separately.
Disk Pricing
Users has the option attach volumes to their machine types on GCP Compute Engine.GCP provides persistent disk, persistent snapshot and local SSD. Persistent disks arecharge for the amount of provisioned space per disk and the I/O operations charges areincluded in the charge for space provisioned. Persistent Snapshot are charged only forthe total size of the snapshot and local SSD are charged for the amount of provisionedspace per machine at a rate of $0.218 per GB per month. Local SSD are sold at 375GB increments[19].
18 Theoretical Concepts
Fig. 3.2 GCP Sustained Usage Discount scheme
Storage Pricing
GCP provides three options for cloud storage, Standard, DRA, and Nearline. Theframework uses standard storage cost for storage cost computation. GC storage costare as follows: Standard storage $0.026 per GB per month, DRA $0.02 per GB permonth, and Nearline $0.01 per GB per month[20].
Chapter 4
Design and Implementation
4.1 Overview
The proposed cost-effective framework is designed with portability and robustness inmind. It is developed with Python and Flask micro-framework. The framework used aNoSQL database – MongoDB – to store data relating to instances in users developmentenvironment. The framework portability allows it to be deployed either on the samenetwork as the development environment or on an entirely different network. In thischapter, we outlined the pricing data we used to estimate monthly cost, the frameworkarchitecture, and the functionality.
4.2 Pricing Data
First in the framework development was the thorough literature survey on the pricingmodels of GCP and AWS. You will find details of the pricing models in chapter 3.
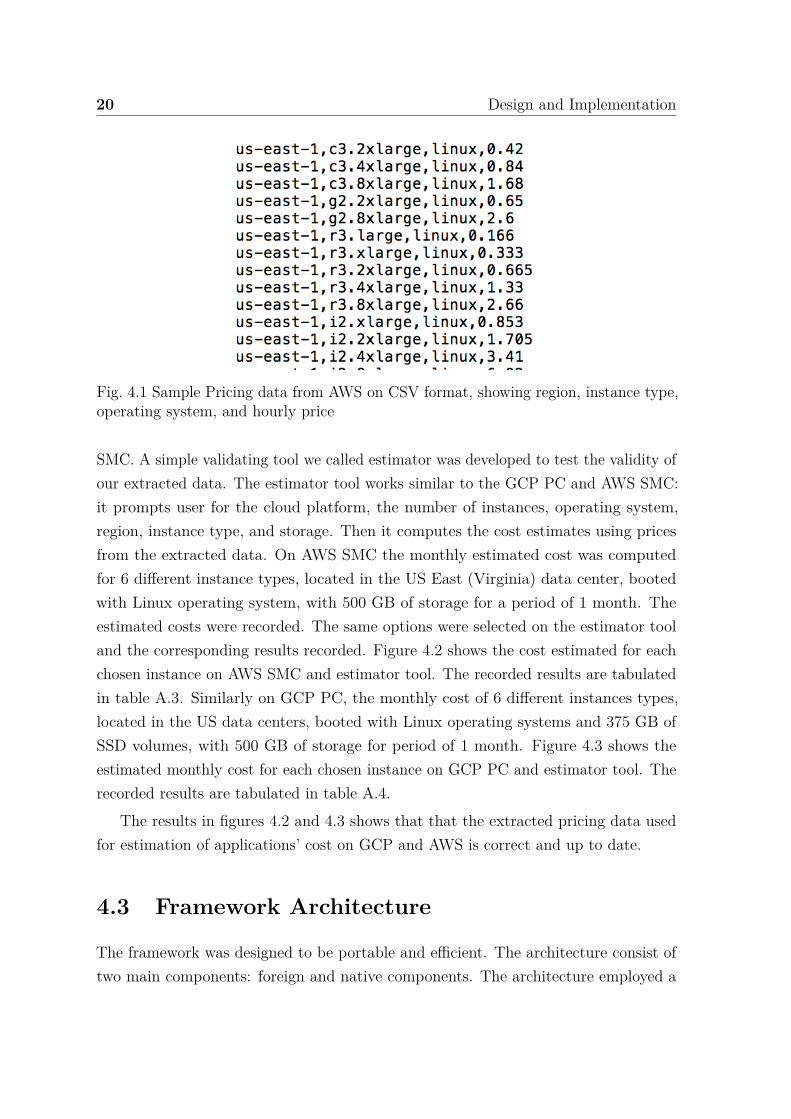
The pricing data lists of both GCP and AWS was extracted from [21] and [22].GCP pricing list was readily available for developers in JSON format. However, AWSpricing list was not readily available and had to extracted by Python scripts in CSVformats. Figure 4.1 shows the sample pricing data extracted from AWS.
4.2.1 Pricing Data Validation
Following the extraction of the price list data from AWS and GCP, is the validationof the data in comparison with currently used pricing data on GCP PC and AWS
20 Design and Implementation
Fig. 4.1 Sample Pricing data from AWS on CSV format, showing region, instance type,operating system, and hourly price
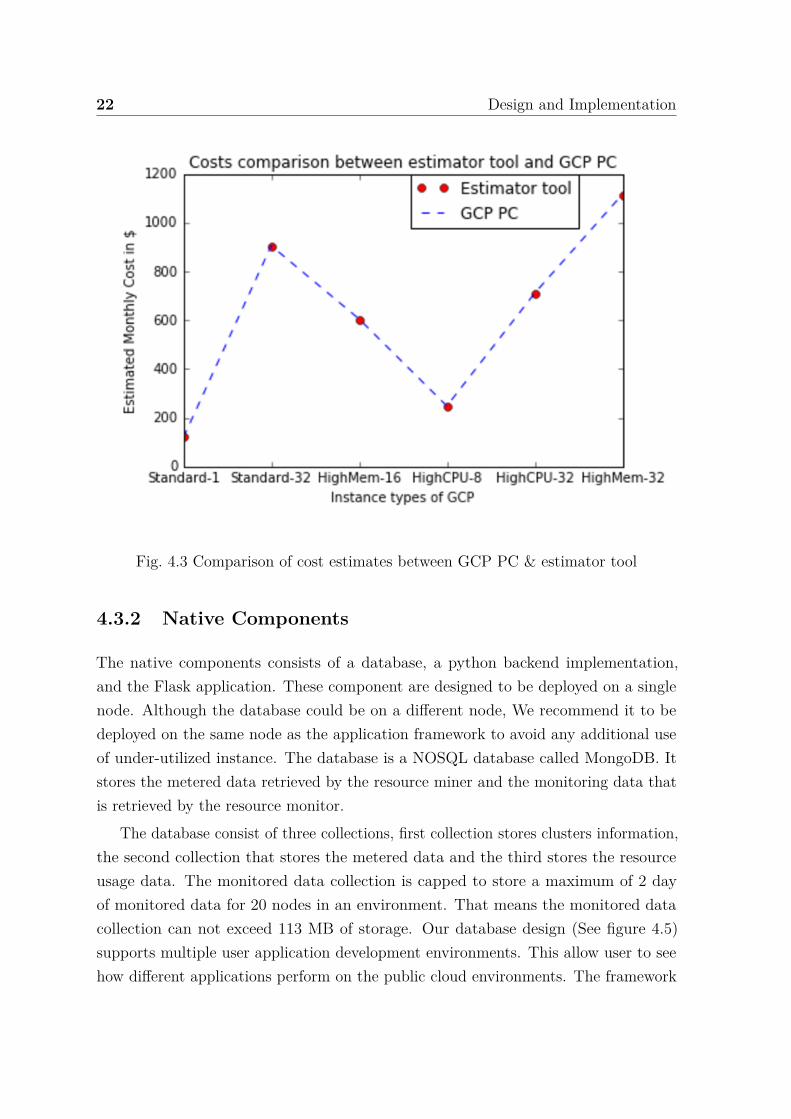
SMC. A simple validating tool we called estimator was developed to test the validity ofour extracted data. The estimator tool works similar to the GCP PC and AWS SMC:it prompts user for the cloud platform, the number of instances, operating system,region, instance type, and storage. Then it computes the cost estimates using pricesfrom the extracted data. On AWS SMC the monthly estimated cost was computedfor 6 different instance types, located in the US East (Virginia) data center, bootedwith Linux operating system, with 500 GB of storage for a period of 1 month. Theestimated costs were recorded. The same options were selected on the estimator tooland the corresponding results recorded. Figure 4.2 shows the cost estimated for eachchosen instance on AWS SMC and estimator tool. The recorded results are tabulatedin table A.3. Similarly on GCP PC, the monthly cost of 6 different instances types,located in the US data centers, booted with Linux operating systems and 375 GB ofSSD volumes, with 500 GB of storage for period of 1 month. Figure 4.3 shows theestimated monthly cost for each chosen instance on GCP PC and estimator tool. Therecorded results are tabulated in table A.4.
The results in figures 4.2 and 4.3 shows that that the extracted pricing data usedfor estimation of applications’ cost on GCP and AWS is correct and up to date.
4.3 Framework Architecture
The framework was designed to be portable and efficient. The architecture consist oftwo main components: foreign and native components. The architecture employed a

4.3 Framework Architecture 21
Fig. 4.2 Comparison of cost estimates between AWS SMC & estimator tool
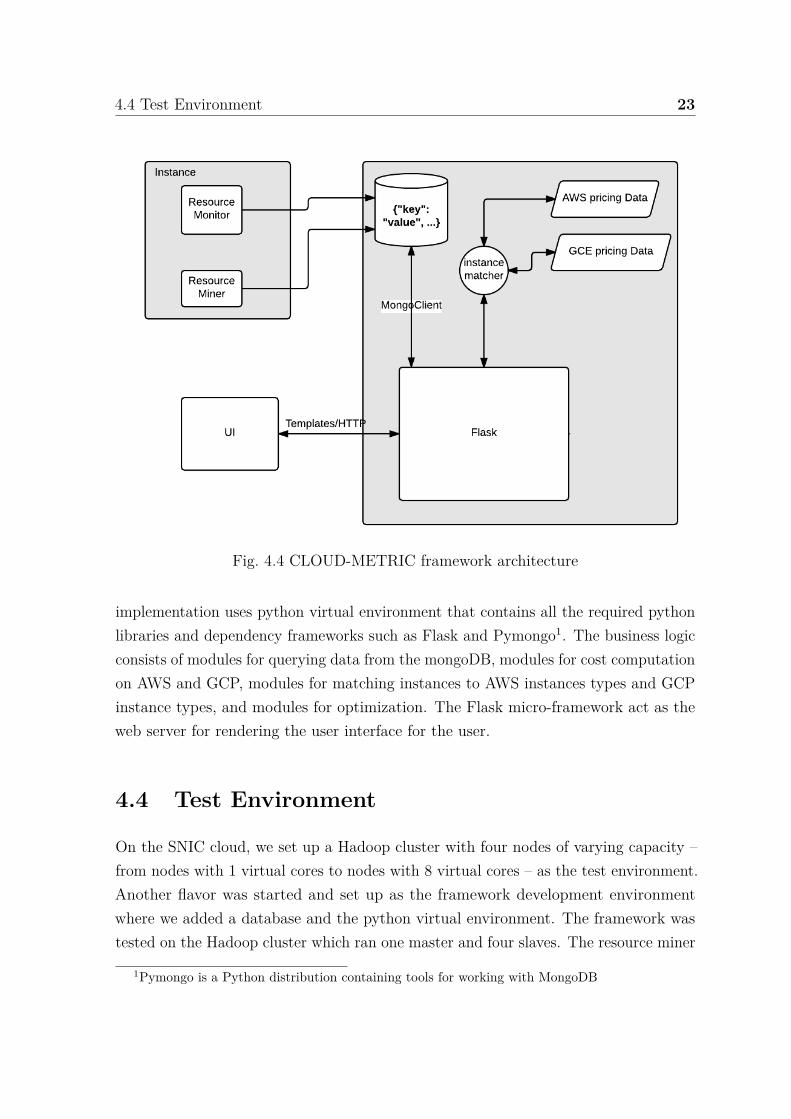
push-based model to register multiple nodes in users’ development environment to theframework application. This process is carried out by the foreign components resourceminer and resource monitor as shown in figure 4.4.
4.3.1 Foreign Components
These components are regarded external because they are designed to execute oneach node of users development environment. The external component consists ofthe resource miner and the resource monitor. These are python scripts that runon each node on the user’s development environment. The resource miner performthe metering activity of the framework and the resource monitor scripts perform theresource monitoring activity of the framework. The resource monitor sends resourcesusage data (CPU, memory, disk) every 60 seconds to the database whereas the resourceminer sends metered data (number of CPU cores, memory size, storage capacity) tothe database once.
22 Design and Implementation
Fig. 4.3 Comparison of cost estimates between GCP PC & estimator tool
4.3.2 Native Components
The native components consists of a database, a python backend implementation,and the Flask application. These component are designed to be deployed on a singlenode. Although the database could be on a different node, We recommend it to bedeployed on the same node as the application framework to avoid any additional useof under-utilized instance. The database is a NOSQL database called MongoDB. Itstores the metered data retrieved by the resource miner and the monitoring data thatis retrieved by the resource monitor.
The database consist of three collections, first collection stores clusters information,the second collection that stores the metered data and the third stores the resourceusage data. The monitored data collection is capped to store a maximum of 2 dayof monitored data for 20 nodes in an environment. That means the monitored datacollection can not exceed 113 MB of storage. Our database design (See figure 4.5)supports multiple user application development environments. This allow user to seehow different applications perform on the public cloud environments. The framework
4.4 Test Environment 23
Fig. 4.4 CLOUD-METRIC framework architecture
implementation uses python virtual environment that contains all the required pythonlibraries and dependency frameworks such as Flask and Pymongo1. The business logicconsists of modules for querying data from the mongoDB, modules for cost computationon AWS and GCP, modules for matching instances to AWS instances types and GCPinstance types, and modules for optimization. The Flask micro-framework act as theweb server for rendering the user interface for the user.
4.4 Test Environment
On the SNIC cloud, we set up a Hadoop cluster with four nodes of varying capacity –from nodes with 1 virtual cores to nodes with 8 virtual cores – as the test environment.Another flavor was started and set up as the framework development environmentwhere we added a database and the python virtual environment. The framework wastested on the Hadoop cluster which ran one master and four slaves. The resource miner
1Pymongo is a Python distribution containing tools for working with MongoDB

24 Design and Implementation
Fig. 4.5 CLOUD-METRIC framework database schema
was executed on each of the nodes and the resource monitor was executed as processon each node.
4.5 Framework Functionality
The proposed framework provides functionality that achieved the project goals. Thefunctionality implemented on the framework includes metering of instance resources,cost estimation for cluster on AWS and GCP, monitoring of individual nodes withincluster, monitoring of overall cluster environment, and recommendation for optimizedinstances type and instance number on both AWS and GCP.
4.5.1 Metering Instance Resources
The metering activity in our proposed framework is carried out by the resource miner,which is an external component of the framework. Each node in the users cluster mustran the resource miner once so that it could be detected by the framework as part of a
4.5 Framework Functionality 25
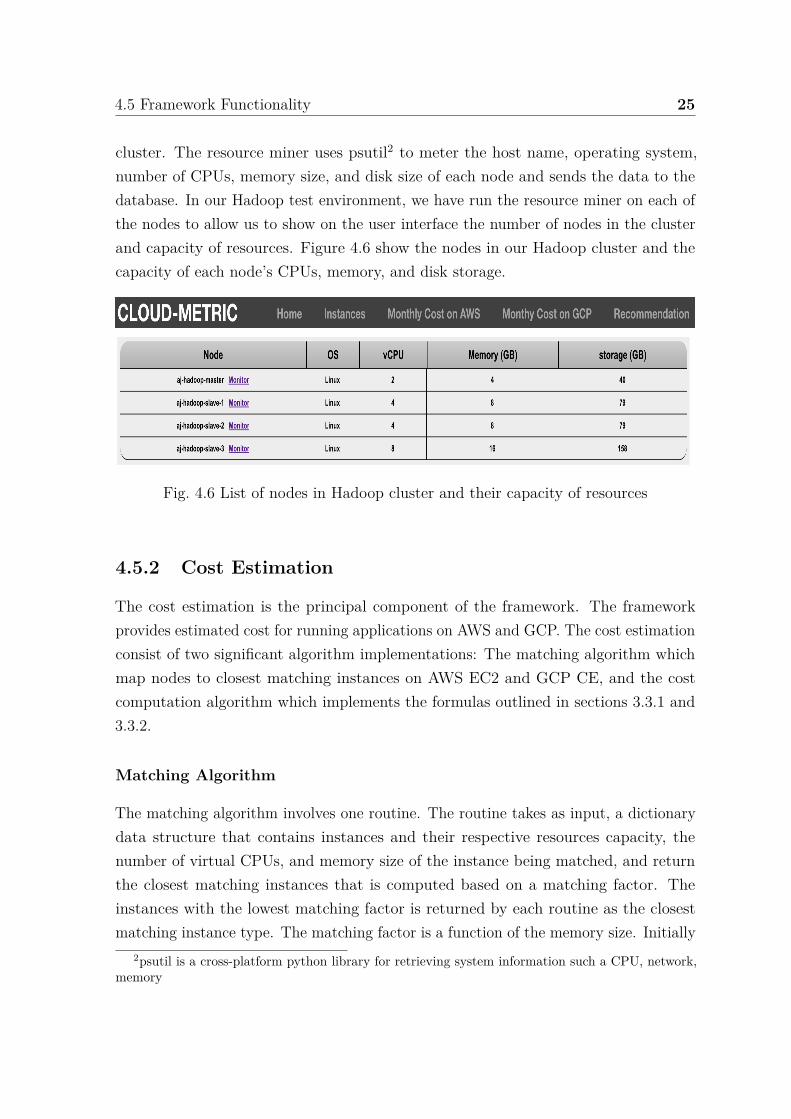
cluster. The resource miner uses psutil2 to meter the host name, operating system,number of CPUs, memory size, and disk size of each node and sends the data to thedatabase. In our Hadoop test environment, we have run the resource miner on each ofthe nodes to allow us to show on the user interface the number of nodes in the clusterand capacity of resources. Figure 4.6 show the nodes in our Hadoop cluster and thecapacity of each node’s CPUs, memory, and disk storage.
Fig. 4.6 List of nodes in Hadoop cluster and their capacity of resources
4.5.2 Cost Estimation
The cost estimation is the principal component of the framework. The frameworkprovides estimated cost for running applications on AWS and GCP. The cost estimationconsist of two significant algorithm implementations: The matching algorithm whichmap nodes to closest matching instances on AWS EC2 and GCP CE, and the costcomputation algorithm which implements the formulas outlined in sections 3.3.1 and3.3.2.
Matching Algorithm
The matching algorithm involves one routine. The routine takes as input, a dictionarydata structure that contains instances and their respective resources capacity, thenumber of virtual CPUs, and memory size of the instance being matched, and returnthe closest matching instances that is computed based on a matching factor. Theinstances with the lowest matching factor is returned by each routine as the closestmatching instance type. The matching factor is a function of the memory size. Initially
2psutil is a cross-platform python library for retrieving system information such a CPU, network,memory
26 Design and Implementation
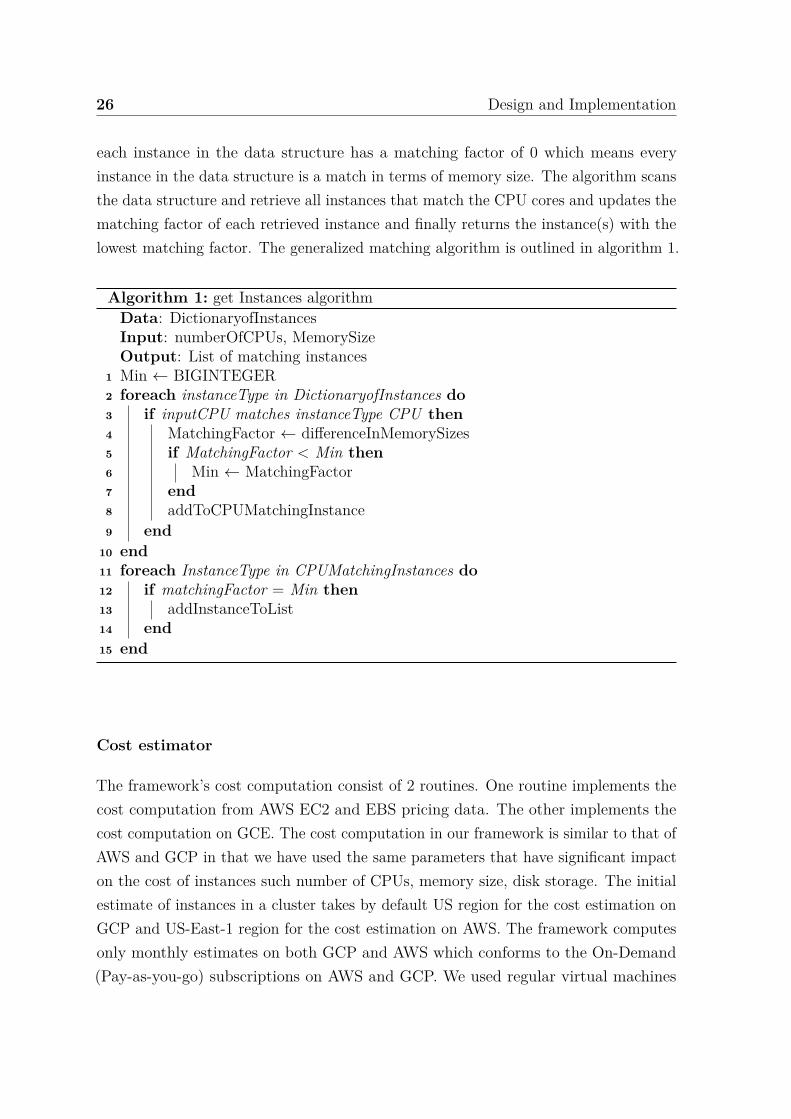
each instance in the data structure has a matching factor of 0 which means everyinstance in the data structure is a match in terms of memory size. The algorithm scansthe data structure and retrieve all instances that match the CPU cores and updates thematching factor of each retrieved instance and finally returns the instance(s) with thelowest matching factor. The generalized matching algorithm is outlined in algorithm 1.
Algorithm 1: get Instances algorithmData: DictionaryofInstancesInput: numberOfCPUs, MemorySizeOutput: List of matching instances
1 Min ← BIGINTEGER2 foreach instanceType in DictionaryofInstances do3 if inputCPU matches instanceType CPU then4 MatchingFactor ← differenceInMemorySizes5 if MatchingFactor < Min then6 Min ← MatchingFactor7 end8 addToCPUMatchingInstance9 end
10 end11 foreach InstanceType in CPUMatchingInstances do12 if matchingFactor = Min then13 addInstanceToList14 end15 end
Cost estimator
The framework’s cost computation consist of 2 routines. One routine implements thecost computation from AWS EC2 and EBS pricing data. The other implements thecost computation on GCE. The cost computation in our framework is similar to that ofAWS and GCP in that we have used the same parameters that have significant impacton the cost of instances such number of CPUs, memory size, disk storage. The initialestimate of instances in a cluster takes by default US region for the cost estimation onGCP and US-East-1 region for the cost estimation on AWS. The framework computesonly monthly estimates on both GCP and AWS which conforms to the On-Demand(Pay-as-you-go) subscriptions on AWS and GCP. We used regular virtual machines
4.5 Framework Functionality 27
class3 for monthly estimation on GCP CE instances and On-Demand instances onAWS EC2. The generalized algorithm for the cost computation is outlined in algorithm2.
Algorithm 2: General cost estimation algorithmData: PricingData, ComputedMatchingInstancesInput: instanceType, Region, StorageSize, NumberOfInstances,OS,Output: EstimatedMonthlyCost
1 data ← readPricingData2 uses 30.5 days as average number of days in month3 monthHours ← (30.5 ∗ 24)4 totalCost = 05 if instanceType in data then6 instanceHourlyCost ← data[region][instanceType]7 instanceMonthlyCost ← NumberOfInstances ∗ instanceHourlyCost ∗
monthHours8 osHourlyCost ← data[os]9 OSCost ← NumberOfInstances ∗ osHourlyCost ∗ monthHours
10 storageCost ← data[region][storage] * StorageSize11 totalCost ← OSCost + instanceMonthlyCost + storageCost12 end
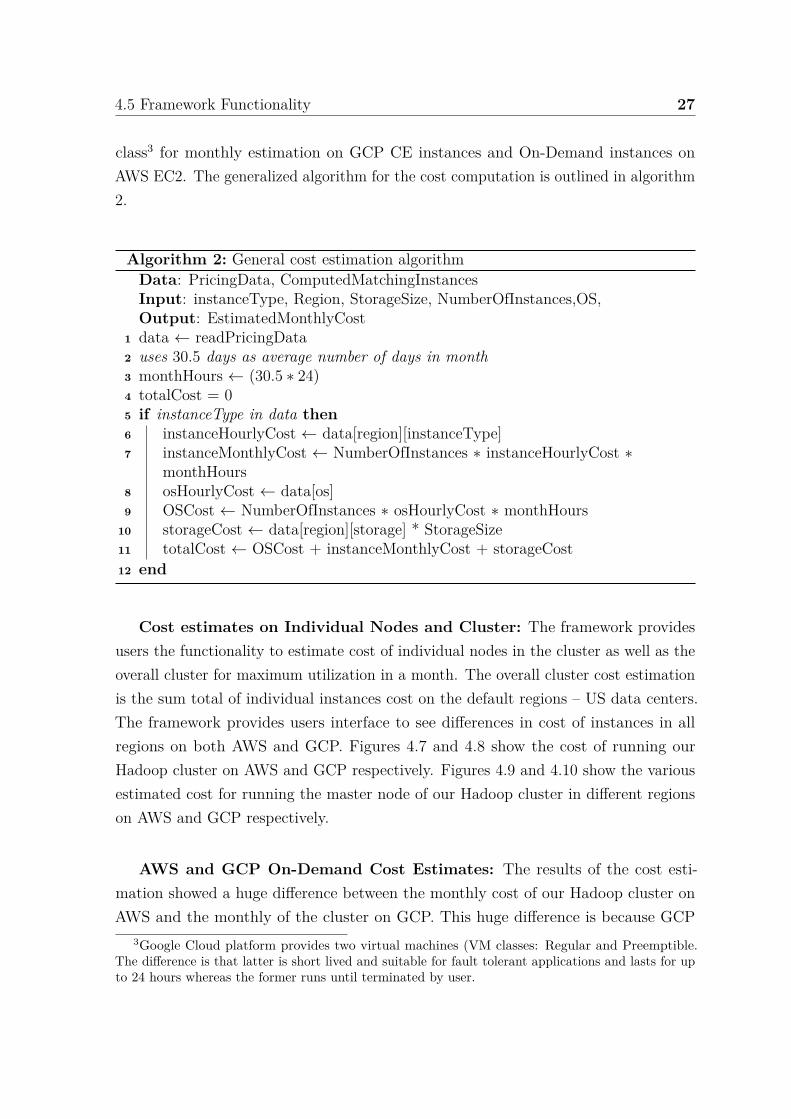
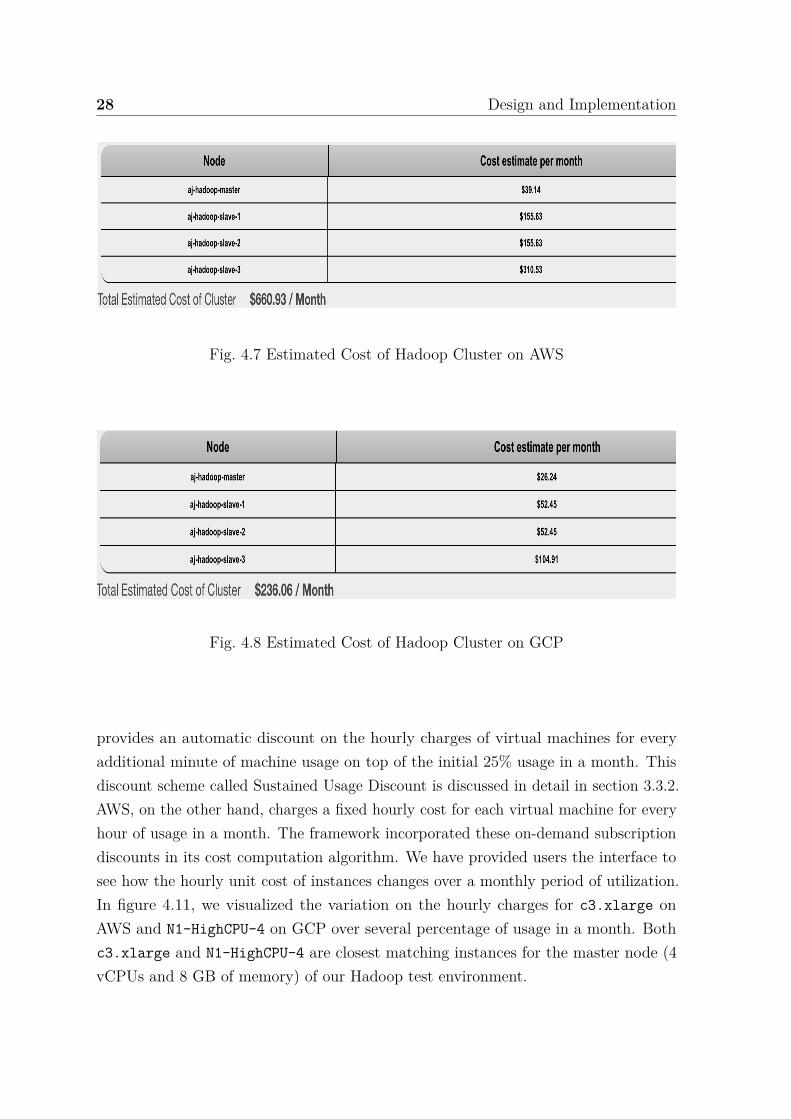
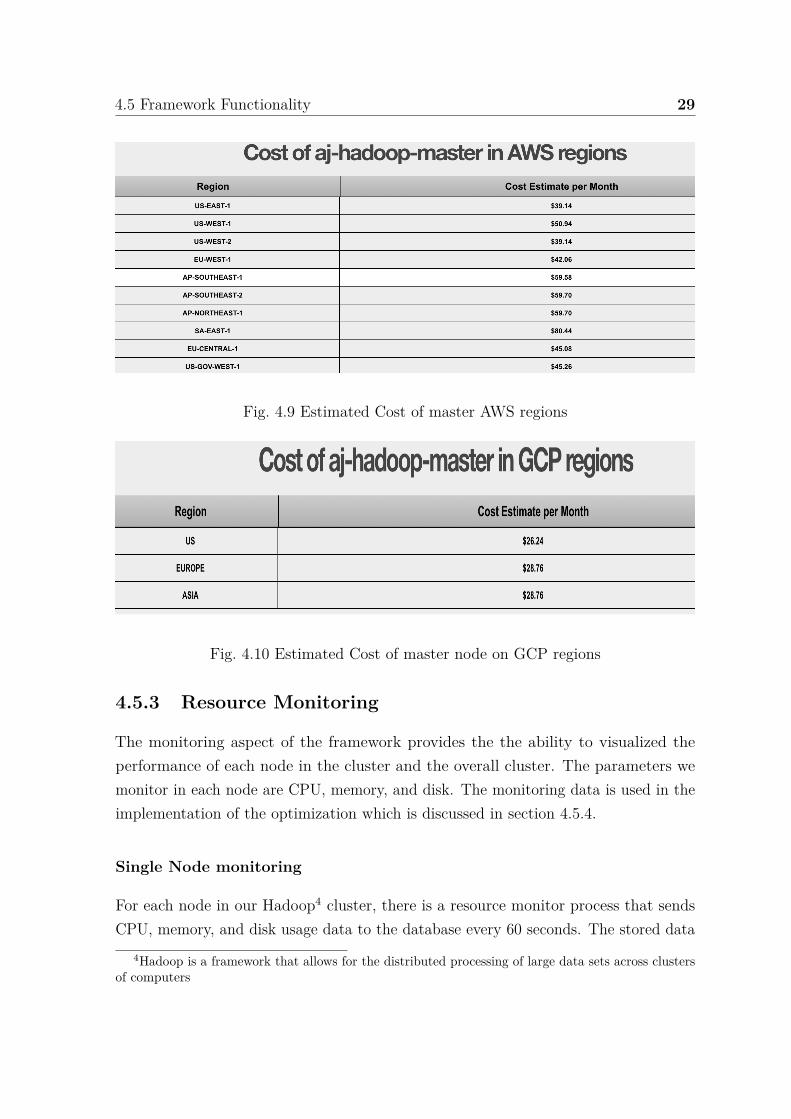
Cost estimates on Individual Nodes and Cluster: The framework providesusers the functionality to estimate cost of individual nodes in the cluster as well as theoverall cluster for maximum utilization in a month. The overall cluster cost estimationis the sum total of individual instances cost on the default regions – US data centers.The framework provides users interface to see differences in cost of instances in allregions on both AWS and GCP. Figures 4.7 and 4.8 show the cost of running ourHadoop cluster on AWS and GCP respectively. Figures 4.9 and 4.10 show the variousestimated cost for running the master node of our Hadoop cluster in different regionson AWS and GCP respectively.
AWS and GCP On-Demand Cost Estimates: The results of the cost esti-mation showed a huge difference between the monthly cost of our Hadoop cluster onAWS and the monthly of the cluster on GCP. This huge difference is because GCP
3Google Cloud platform provides two virtual machines (VM classes: Regular and Preemptible.The difference is that latter is short lived and suitable for fault tolerant applications and lasts for upto 24 hours whereas the former runs until terminated by user.
28 Design and Implementation
Fig. 4.7 Estimated Cost of Hadoop Cluster on AWS
Fig. 4.8 Estimated Cost of Hadoop Cluster on GCP
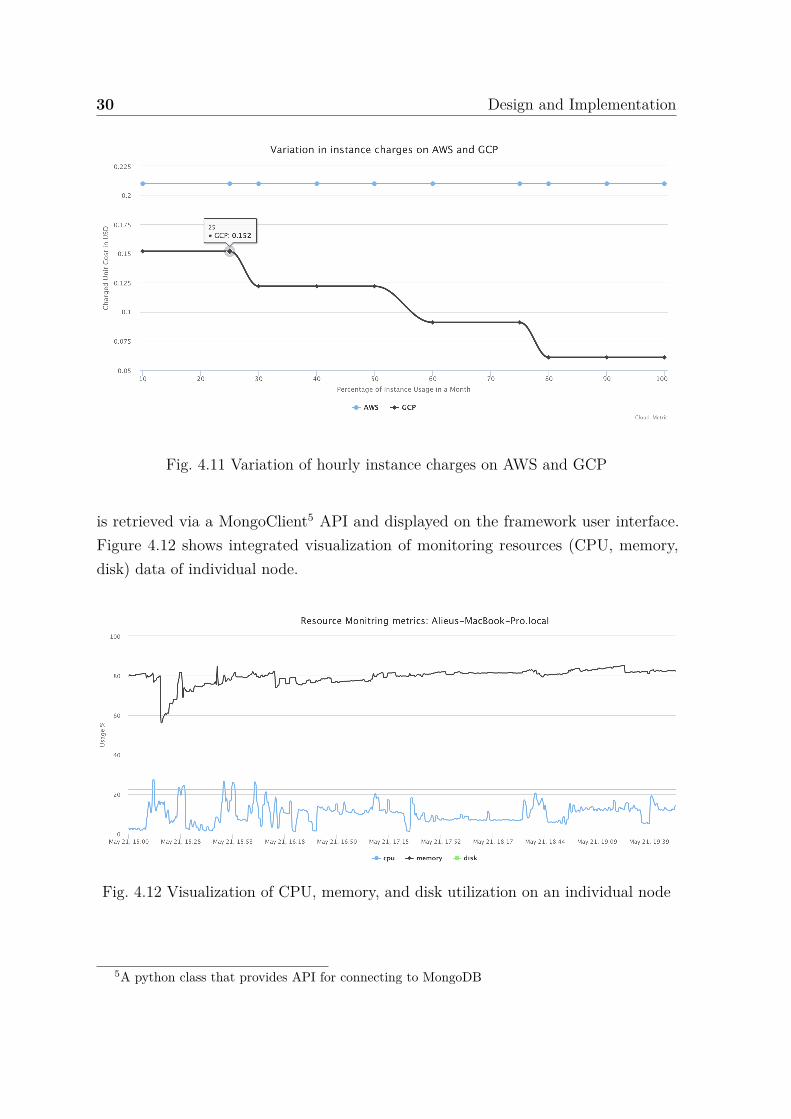
provides an automatic discount on the hourly charges of virtual machines for everyadditional minute of machine usage on top of the initial 25% usage in a month. Thisdiscount scheme called Sustained Usage Discount is discussed in detail in section 3.3.2.AWS, on the other hand, charges a fixed hourly cost for each virtual machine for everyhour of usage in a month. The framework incorporated these on-demand subscriptiondiscounts in its cost computation algorithm. We have provided users the interface tosee how the hourly unit cost of instances changes over a monthly period of utilization.In figure 4.11, we visualized the variation on the hourly charges for c3.xlarge onAWS and N1-HighCPU-4 on GCP over several percentage of usage in a month. Bothc3.xlarge and N1-HighCPU-4 are closest matching instances for the master node (4vCPUs and 8 GB of memory) of our Hadoop test environment.
4.5 Framework Functionality 29
Fig. 4.9 Estimated Cost of master AWS regions
Fig. 4.10 Estimated Cost of master node on GCP regions
4.5.3 Resource Monitoring
The monitoring aspect of the framework provides the the ability to visualized theperformance of each node in the cluster and the overall cluster. The parameters wemonitor in each node are CPU, memory, and disk. The monitoring data is used in theimplementation of the optimization which is discussed in section 4.5.4.
Single Node monitoring
For each node in our Hadoop4 cluster, there is a resource monitor process that sendsCPU, memory, and disk usage data to the database every 60 seconds. The stored data
4Hadoop is a framework that allows for the distributed processing of large data sets across clustersof computers
30 Design and Implementation
Fig. 4.11 Variation of hourly instance charges on AWS and GCP
is retrieved via a MongoClient5 API and displayed on the framework user interface.Figure 4.12 shows integrated visualization of monitoring resources (CPU, memory,disk) data of individual node.
Fig. 4.12 Visualization of CPU, memory, and disk utilization on an individual node
5A python class that provides API for connecting to MongoDB

4.5 Framework Functionality 31
Cluster Monitoring
The user is provided with the functionality within the framework to visualize the overallperformance of an entire cluster. In this case, the stored data of the nodes’ resources(CPU, memory, and disk) is grouped on hourly basis and the average is taken for eachof CPU, memory, and disk usages. The monitoring charts display the percentage usageagainst the hourly utilization of the entire cluster. Figure 4.13 shows an integratedvisualization of the CPU, memory, and disk usage of an our Hadoop cluster.
Fig. 4.13 Visualization of resources usage on Hadoop cluster
4.5.4 Instances Recommendation
The framework recommends for users instances on AWS and GCP that match resourcesusage of the cluster over a period of time. The recommended instances are result of anoptimization algorithm that creates a machine type from the resources utilization of anode in user environment over a period of time. Since the database stores just above5MB of resource utilization data, the time period the algorithm consider for resourceutilization is maximum of 2 days. The algorithm queries for average CPU and memoryutilization and construct an instance from the data retrieved. The constructed instanceis then matched with similar instance on AWS and GCP via matching algorithmoutlined in section 4.5.2. In addition, the costs of the matching instances on AWS
32 Design and Implementation
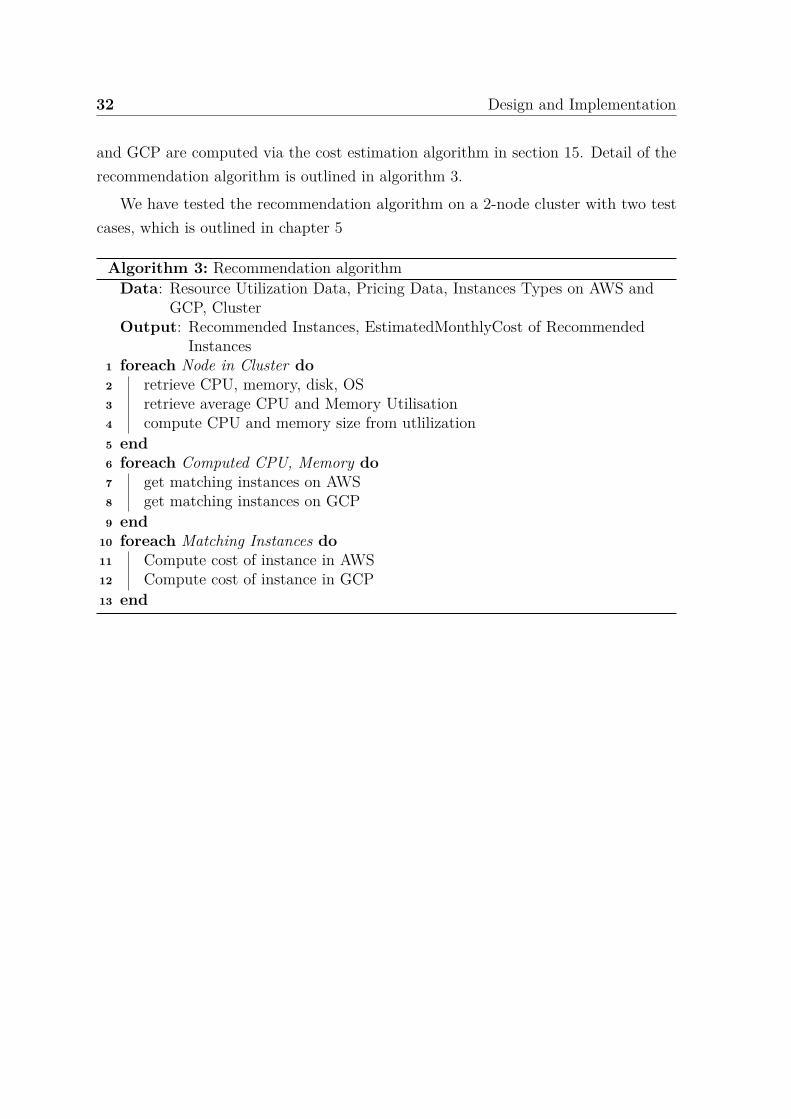
and GCP are computed via the cost estimation algorithm in section 15. Detail of therecommendation algorithm is outlined in algorithm 3.
We have tested the recommendation algorithm on a 2-node cluster with two testcases, which is outlined in chapter 5
Algorithm 3: Recommendation algorithmData: Resource Utilization Data, Pricing Data, Instances Types on AWS and
GCP, ClusterOutput: Recommended Instances, EstimatedMonthlyCost of Recommended
Instances1 foreach Node in Cluster do2 retrieve CPU, memory, disk, OS3 retrieve average CPU and Memory Utilisation4 compute CPU and memory size from utlilization5 end6 foreach Computed CPU, Memory do7 get matching instances on AWS8 get matching instances on GCP9 end
10 foreach Matching Instances do11 Compute cost of instance in AWS12 Compute cost of instance in GCP13 end
Chapter 5
Framework Evaluation
We have proposed a portable framework that would not consume much of users computeresources. To validate that, we have evaluated the resources utilization of both theexternal (resource monitor) and internal (application and database) components of theframework. The evaluation process for each of the framework components was carriedout with nmon
1 – read and store resource utilization data – and NMON Visualizer2 –visualizes stored data in charts.
In the following sections, we will present the result of our evaluation of each of theframework components – recommendation algorithm, resource monitor, database, andapplication.
5.1 Recommendation Algorithm
We have evaluated our recommendation algorithm using 2-node cluster. Each of thenodes has 8 vCPUs and 16G of memory. We tested the performance using the followingcases: ran basic Hadoop jobs and stress CPU for maximum utilization.
5.1.1 Basic Hadoop jobs
Initially, we set up the cluster and decided not to run any resource intensive jobs. We ranthe Hadoop jobs and our monitoring process on each node. Each node initially matchedc4.2xlarge instance on AWS EC2 and N1-HighCPU-8 on GCP CE. You will see
1nmon is a Linux performance and resources monitoring tool2A jar file developed purposely for nmon data visualization

34 Framework Evaluation
detail of the instances on AWS and GCP in appendix A. The algorithm recommendedc3.xlarge and N1-HighCPU-4 for each node on AWS and GCP respectively. Therecommended instances have 4 CPUs, that is half of the number of CPUs on each nodein the cluster. There is a cost reduction of about 50% on the recommended cost. (Seefigure 5.1).
5.1.2 Stress CPU for maximum usage
On each node in the cluster we ran 8 CPU-intensive processes to maximize CPU usagefor a period of 8 hours. Each process is the following command which utilizes a singlecore 100%: $ yes > /dev/null &. The recommendation algorithm recommendedc4.2xlarge for AWS and N1-HighCPU-8 (See figure 5.1) for each of the nodes in thecluster. In this case, the algorithm recommends the actual static matching instancesfor the CPUs were maximally utilized.
(a) Output of recommendation on case 1
(b) Output of recommendation on case 2
Fig. 5.1 Instances recommended by our recommendation algorithm on two test cases
5.2 Resource Monitor 35
5.2 Resource Monitor
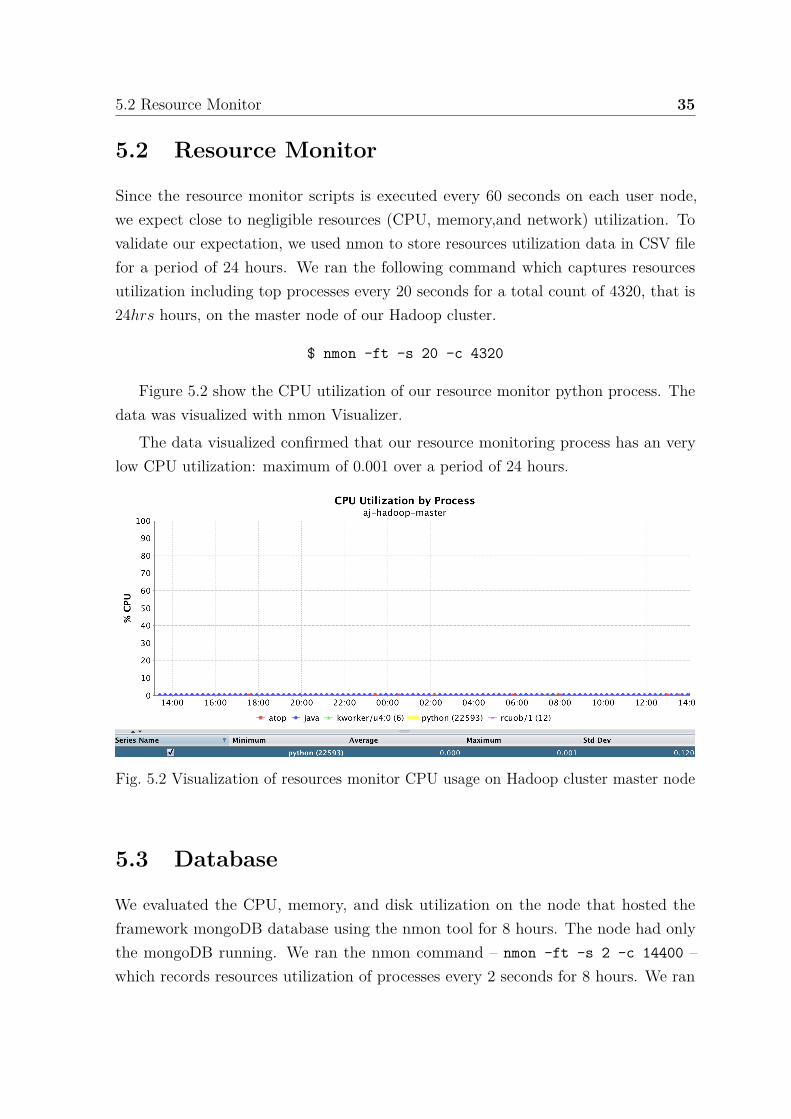
Since the resource monitor scripts is executed every 60 seconds on each user node,we expect close to negligible resources (CPU, memory,and network) utilization. Tovalidate our expectation, we used nmon to store resources utilization data in CSV filefor a period of 24 hours. We ran the following command which captures resourcesutilization including top processes every 20 seconds for a total count of 4320, that is24hrs hours, on the master node of our Hadoop cluster.
$ nmon -ft -s 20 -c 4320
Figure 5.2 show the CPU utilization of our resource monitor python process. Thedata was visualized with nmon Visualizer.
The data visualized confirmed that our resource monitoring process has an verylow CPU utilization: maximum of 0.001 over a period of 24 hours.
Fig. 5.2 Visualization of resources monitor CPU usage on Hadoop cluster master node
5.3 Database
We evaluated the CPU, memory, and disk utilization on the node that hosted theframework mongoDB database using the nmon tool for 8 hours. The node had onlythe mongoDB running. We ran the nmon command – nmon -ft -s 2 -c 14400 –which records resources utilization of processes every 2 seconds for 8 hours. We ran
36 Framework Evaluation
the application and accessed the interface while the nmon process records the resourceutilization data. The mongoDb process recorded a maximum CPU utilization of justabove 2%. Figures 5.3a, 5.3b, 5.3c) show the CPU, memory and and disk utilizationover the period.
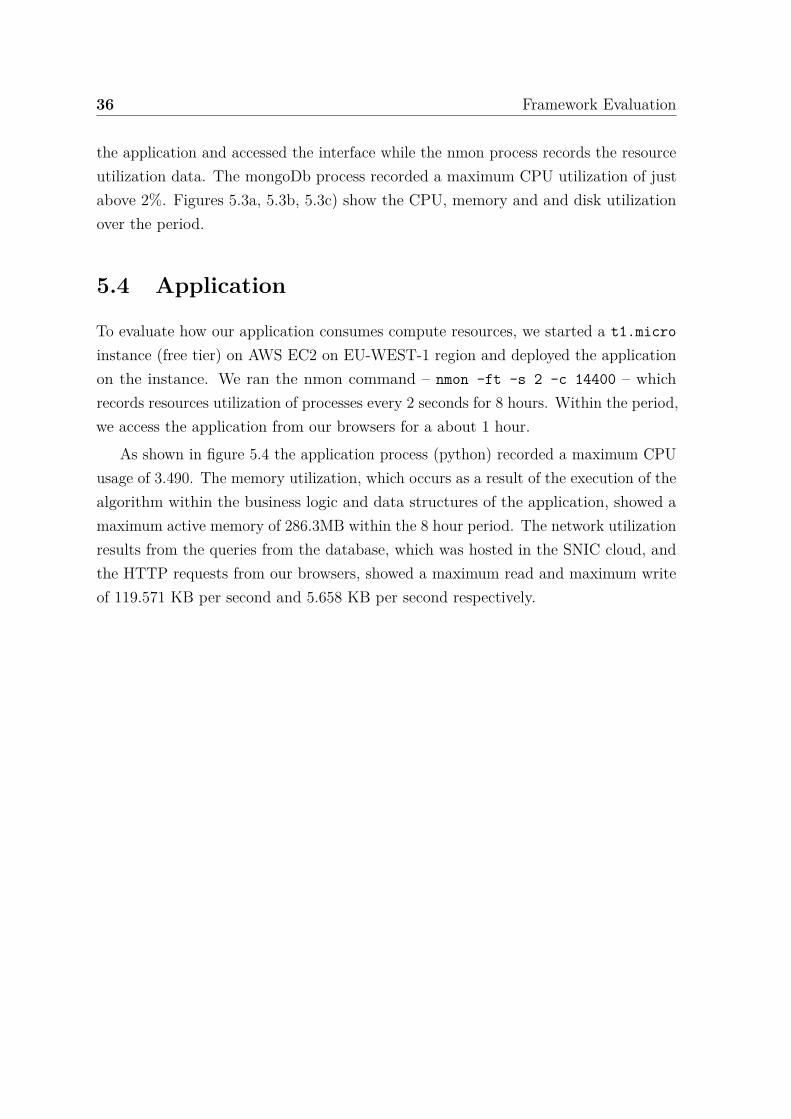
5.4 Application
To evaluate how our application consumes compute resources, we started a t1.micro
instance (free tier) on AWS EC2 on EU-WEST-1 region and deployed the applicationon the instance. We ran the nmon command – nmon -ft -s 2 -c 14400 – whichrecords resources utilization of processes every 2 seconds for 8 hours. Within the period,we access the application from our browsers for a about 1 hour.
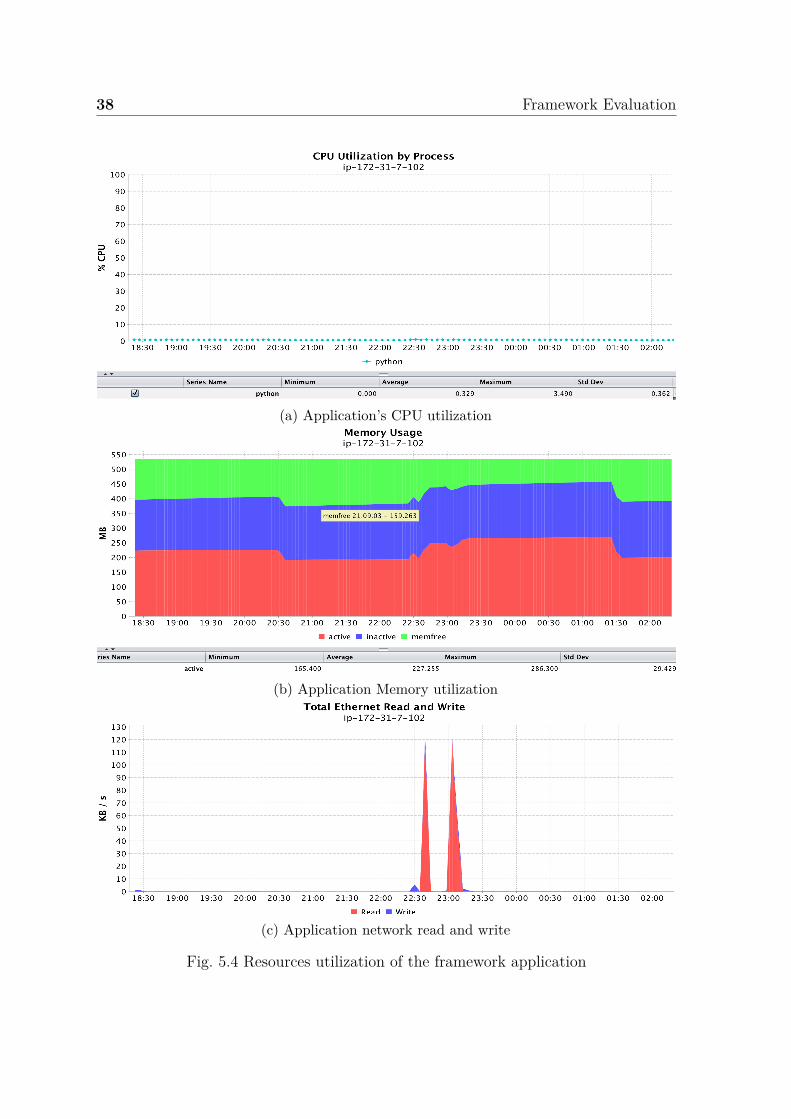
As shown in figure 5.4 the application process (python) recorded a maximum CPUusage of 3.490. The memory utilization, which occurs as a result of the execution of thealgorithm within the business logic and data structures of the application, showed amaximum active memory of 286.3MB within the 8 hour period. The network utilizationresults from the queries from the database, which was hosted in the SNIC cloud, andthe HTTP requests from our browsers, showed a maximum read and maximum writeof 119.571 KB per second and 5.658 KB per second respectively.

5.4 Application 37
(a) mongoDB’s CPU utilization on host
(b) mongoDB’s memory utilization on host
(c) mongoDB’s disk writes on host
Fig. 5.3 Resources utilization of database
38 Framework Evaluation
(a) Application’s CPU utilization
(b) Application Memory utilization
(c) Application network read and write
Fig. 5.4 Resources utilization of the framework application
Chapter 6
Conclusion and Future Work
We have proposed and developed CLOUD-METRIC as lightweight and portable frame-work that extends the classic application development model with cloud infrastructureexecution cost, better estimates of required resources, and recommendation for aboutexecution plan. Primarily, the framework provides estimated monthly cost of runningapplications on AWS and GCP. The framework provides the ability to monitor develop-ment environment both for single node and entire cluster to assess resources utilizationwhich also provides the basis for the recommendation of instances types on AWS andGCP.
The framework is designed to be pluggable to any development environment orresearch environment. It is a third party tool that developers could add to theirdevelopment environment to provide cost estimates of an application in developmentphase. In addition, researchers within the scientific community that consider leveragingpublic clouds infrastructures such as GCP and AWS as result of limited resources inprivate academic cloud deployments such as Uppmax at Uppsala University couldutilize the framework to get estimates of cost running similar workloads in the AWSand GCP.
6.1 Future Work
It would be interesting to incorporate a learning algorithm in the instance recommen-dation that recommend the number of instances and instance types based on resourceutilization and additional parameters such as application specific requirements suchmemory intensive, CPU intensive, storage intensive. In this case the algorithm would
40 Conclusion and Future Work
learn from data from public cloud providers about different instance types and scanthe user’s application environment and identify it as either CPU intensive, memoryintensive or data intensive labels. This would provide a much more perfect recommen-dation between applications and the instance types. Another interesting thing wouldbe to defined a model that tell the recommendation algorithm the condition for scalingin and out the number of instances the user have in their environment for optimalperformance and lowest cost possible. In addition, the framework could be enhancedto include the consideration of more details chargeable parameters that are used inbilling systems of public cloud providers, such as number of elastic IPs, number of loadbalances, Data Ingress and Egress. Another further improvement would be to providesupport for other cloud providers such as Microsoft Azure, and Rackspace.
References
[1] “Ec2 instance pricing – amazon web services (aws),” 2016/4/27/. [Online].Available: https://aws.amazon.com/ec2/pricing/
[2] “Google compute engine pricing - compute engine — google cloud platform,”2016/2/16/. [Online]. Available: https://cloud.google.com/compute/pricing
[3] “Amazon ec2 spot instances,” 2016/4/25/. [Online]. Available: https://aws.amazon.com/ec2/spot/
[4] C. L. Yang, B. N. Hwang, and B. J. C. Yuan, “Key consideration factors ofadopting cloud computing for science,” in Cloud Computing Technology andScience (CloudCom), 2012 IEEE 4th International Conference on, Dec 2012, pp.597–600.
[5] CloudGuide: Helping users estimate cloud deployment cost and performancefor legacy web applications, ser. 4th IEEE International Conference on CloudComputing Technology and Science Proceedings. IEEE. [Online]. Available:http://ieeexplore.ieee.org/lpdocs/epic03/wrapper.htm?arnumber=6427577
[6] An Approach to Estimating Cost of Running Cloud Applications Based on AWS, ser.2012 19th Asia-Pacific Software Engineering Conference. IEEE. [Online]. Available:http://ieeexplore.ieee.org/lpdocs/epic03/wrapper.htm?arnumber=6462712
[7] “http://nvlpubs.nist.gov/nistpubs/legacy/sp/nistspecialpublication800-145.pdf,”2016/4/26/. [Online]. Available: http://nvlpubs.nist.gov/nistpubs/Legacy/SP/nistspecialpublication800-145.pdf
[8] Smart metering of cloud services, ser. 2012 IEEE International Systems ConferenceSysCon 2012. IEEE. [Online]. Available: http://ieeexplore.ieee.org/lpdocs/epic03/wrapper.htm?arnumber=6189462
[9] Anatomy of Cloud Monitoring and Metering: A Case Study and Open Problems,ser. Proceedings of the 6th Asia-Pacific Workshop on Systems. ACM. [Online].Available: http://doi.acm.org/10.1145/2797022.2797039
[10] “Download microsoft azure cost estimator tool from official microsoft downloadcenter,” 2016/4/26/. [Online]. Available: https://www.microsoft.com/en-us/download/details.aspx?id=43376
42 References
[11] Feb 2016, ch. http: //media.amazonwebservices.com/AWS_Pricing_Overview.pdf.[Online]. Available: http://media.amazonwebservices.com/AWS_Pricing_Overview.pdf
[12] “https://d0.awsstatic.com/whitepapers/aws-overview.pdf,” 2016/4/26/. [Online].Available: https://d0.awsstatic.com/whitepapers/aws-overview.pdf
[13] “Compute engine – iaas – google cloud platform,” 2016/4/27/. [Online]. Available:https://cloud.google.com/compute/
[14] “Cloud storage – online data storage — google cloud platform,” 2016/4/27/.[Online]. Available: https://cloud.google.com/storage/
[15] A survey of Cloud computing variable pricing models, April 2015. [Online].Available: http://ieeexplore.ieee.org/stamp/stamp.jsp?tp=&arnumber=7320330&isnumber=7320302
[16] “Aws pricing overview,” 2016/4/26/. [Online]. Available: https://d0.awsstatic.com/whitepapers/aws_pricing_overview.pdf
[17] “https://cloud.google.com/files/esg-whitepaper.pdf,” 2016/4/27/. [Online]. Avail-able: https://cloud.google.com/files/esg-whitepaper.pdf
[18] “Pricing — price performance leadership — google cloud platform,” 2016/4/27/.[Online]. Available: https://cloud.google.com/pricing/
[19] “Google compute engine pricing - compute engine — google cloud platform,”2016/4/28/. [Online]. Available: https://cloud.google.com/compute/pricing
[20] “Google cloud storage pricing – cloud storage —- google cloud platform,”2016/5/6/. [Online]. Available: https://cloud.google.com/storage/pricing
[21] “Google cloud platform pricing calculator — google cloud platform,” 2016/5/9/.[Online]. Available: https://cloud.google.com/products/calculator/
[22] “Aws pricing data,” 2016/5/9. [Online]. Available: http://a0.awsstatic.com/pricing/1/ec2/
Appendix A
Table A.1 List of AWS instance Types and associated resource capacity obtained from[1]
vCPUs ECU Memory (GB)
General Purpose
t2.nano 1 variable 0.5
t2.micro 1 variable 1
t2.small 1 variable 2
t2.medium 2 variable 4
t2.large 2 variable 8
m4.large 2 6.5 8
m4.xlarge 4 13 16
m4.2xlarge 8 26 32
m4.4xlarge 16 53.5 64
m4.10xlarge 40 124.5 160
m3.medium 1 3 3.75
m3.large 2 6.5 7.5
44
m3.xlarge 4 13 15
m3.2xlarge 8 26 30
Compute Optimized
c4.large 2 8 3.75
c4.xlarge 4 16 7.5
c4.2xlarge 8 31 15
c4.4xlarge 16 62 30
c4.8xlarge 36 132 60
c3.large 2 7 3.75
c3.xlarge 4 14 7.5
c3.2xlarge 8 28 15
c3.4xlarge 16 55 30
c3.8xlarge 32 108 60
GPU instances
g2.2xlarge 8 26 15
g2.8xlarge 32 104 60
Memory Optimized
r3.large 2 6.5 15
r3.xlarge 4 13 30.5
r3.2xlarge 8 26 61
r3.4xlarge 16 52 122
r3.8xlarge 32 104 244
Storage Optimized
45
i2.xlarge 4 14 30.5
i2.2xlarge 8 27 61
i2.4xlarge 16 53 122
i2.8xlarge 32 104 244
d2.xlarge 4 14 30.5
d2.2xlarge 8 28 61
d2.4xlarge 16 56 122
d2.8xlarge 36 116 244
Table A.2 List of GCE Machine Types and associated resource capacity as obtainedfrom [2]
Machine Type Virtual CPUs Memory GCEU
Standard Machine Types
n1-standard-1 1 3.75GB 2.75
n1-standard-2 2 7.5GB 5.50
n1-standard-4 4 15GB 11
n1-standard-8 8 30GB 22
n1-standard-16 16 60GB 44
n1-standard-32 32 120GB 88
Shared-Core Machine Types
f1-micro 1 0.60GB Shared CPU

46
g1-small 1 1.70GB 1.38
High Memory Machine Types
n1-highmem-2 2 13GB 5.50
n1-highmem-4 4 26GB 11
n1-highmem-8 8 52GB 22
n1-highmem-16 16 104GB 44
n1-highmem-32 32 208GB 88
High CPU Machine Types
n1-highcpu-2 2 1.80GB 5.50
n1-highcpu-4 4 3.60GB 11
n1-highcpu-8 8 7.20GB 22
n1-highcpu-16 16 14.40GB 44
n1-highcpu-32 32 28.80GB 88
47
Table A.3 Results of Cost estimated obtained from AWS Simple Monthly Calculatorand Estimator tool for selected instances
t2.large m4.large m3.large c3.large g2.2xlarge r3.2xlarge
AWS SMC $90.67 $102.35 $111.84 $91.40 $489.25 $500.20
Estimator tool $90.98 $102.69 $112.21 $91.70 $490.68 $501.63
Table A.4 Results of Cost estimated obtained from GCP Pricing Calculator andEstimator tool for selected machine type
standard-1
standard-32
highMem-16
highCPU-8
highCPU-32
highMem-32
GCP PC $119.35 $905.20 $605.06 $248.13 $710.51 $1116.11
Estimator tool $119.95 $901.15 $602.78 $247.97 $707.61 $1110.81