college planning essentials - raymond · pdf filecollege planning essentials ... section 3...
TRANSCRIPT

inherit the thinking of j.p. morgan
College Planning EssentialsA comprehensive guide to saving and investing
InvEstmEnts arE nOt FDIC InsUrED | nO BanK GUarantEE | maY LOsE vaLUE

Section 1 College matters
Section 5 appendix
Section 4 saving and investing
Section 3 Financial aid
4 Higher education pays
5 more education, less unemployment
6 Return on a college investment
7 “major” differences in salaries
38 Sources of financial aid
39 Financial aid: Types of applications
40 Federal aid methodologies
41 Federal student aid: A sample of grant programs
42 Federal student aid: Loan programs
43 College-related tax breaks
44 Comparing college savings options
45 The 529 plan advantage
46 Checklist: Choosing a 529 plan
47 529 plans: State tax benefits
48 index definitions
49 Disclosures
23 Current saving and investing trends
24 Comparing college savings vehicles
25 investing versus borrowing
26 investing for long-term growth
27 performance pays
28 The benefits of compounding
29 invest more, pay less
30 Tax-efficient investing
31 making college savings a family affair
32 Asset allocation provided a smoother ride
33 Staying diversified over 18 years
34 The power of diversification
35 Good intentions, unexpected consequences
36 College planning checklist
Section 2 College costs
9 Rising college costs
10 Future four-year college costs
11 Tuition inflation
12 The real cost of college
13 How college costs affect behavior
15 Financial aid overview
16 Financial aid reality check
17 Federal financial aid eligibility
18 The effect of savings on financial aid
19 Student loan landscape
20 private loans
21 The burden of debt
2 | INHERIT THE THINKING OF J.P. MORGAN

Coll
ege
mat
ter
s
myth: “ College is too expensive.”
Fact: The return on an investment in college is nearly $1 million more in lifetime earnings. page 4
College mattersThe value of a college education is growing faster than the cost. Today, a college diploma has become a necessity for anyone seeking increased earning potential, job security and career opportunity.
Common myths and facts
sECtIOn 1
College Planning Essentials: A comprehensive guide to saving and investing
myth: “ Not even college graduates can find a job in this economy.”
Fact: The unemployment rate among college graduates is currently just 3.2%. page 5
myth: “ College just isn’t worth the student loan debt.”
Fact: A college graduate earns 38% more than a high school graduate, even after factoring in student loans. page 6
1. Source: Georgetown University, Failure to Launch: Structural Shift and the New Lost Generation, 2013.
By 2020, 65% of U.S. jobs will require a degree beyond high school, up from 28% in 1973.1
65%
20201973
28%

Coll
ege
mat
ter
sCO
LLEG
E CO
STS
fin
an
cia
l a
idsa
vin
g &
inv
esti
ng
4 | INHERIT THE THINKING OF J.P. MORGAN
app
end
ix
• Bachelor’s degree holders earn nearly $1 million more over a lifetime than high school graduates. Those with doctorate degrees earn nearly $2 million more.1
• people who attend college but don’t receive a degree earn only 12% more than high school graduates.2
Higher education pays
A college diploma opens the door to a lifetime of higher earnings.
1. Source: Bureau of Labor Statistics, 2013 dollars, based on 2013 earnings projected over a typical work life of ages 25 through 64.
2. Source: Current population Survey, U.S. Bureau of Labor Statistics, 2013 dollars, U.S. Department of Labor. j.p. morgan Asset management. Data are for persons age 25 and over. Earnings are for full-time wage and salary workers.
Average annual earnings by highest degree earned2
DEGrEEs OF DIFFErEnCE $100,000
$60,000
$80,000
$40,000
$20,000
$0
HIGH sCHOOL GraDUatE BaCHELOr’s DEGrEE PrOFEssIOnaL DEGrEE
71+29100+0+X163%GrEatEr
PaY
85+15+X70%GrEatEr
PaY
$33,852 $57,616 $89,128

Coll
ege
mat
ter
sCO
LLEG
E CO
STS
fin
an
cia
l a
idsa
vin
g &
inv
esti
ng
5 | INHERIT THE THINKING OF J.P. MORGAN
app
end
ix
more education, less unemployment
College graduates enjoy much better job security and opportunity, especially during economic downturns.
BrIGHt JOB PrOsPECts
• The number of college-educated americans with jobs has increased 9.1% since the beginning of the recession.1
• The unemployment rate for high school graduates aged 20 to 24 was 17.9% in 2012, more than double the rate for young college graduates.2
• a shortage of 5 million college-educated workers is projected by 2020.3
1. Source: New York Times, College Graduates Fare Well in jobs market, Even Through Recession, 5/3/2013.
2. Source: TiCAS/project on Student Debt, Dec. 2013.3. Source: Georgetown University Center on Education and Workforce, june 2013. Based on
current production rate.4. Source: j.p. morgan Asset management, Bureau of Labor Statistics, FactSet.
Unemployment rates shown are for civilians aged 25 and older. Data are as of 9/30/14.
19920%
2%
4%
8%
6%
10%
12%
14%
16%
18%
1994 2014201220102008200620042002200019981996
LEss tHan HIGH sCHOOL DIPLOmaHIGH sCHOOL, nO COLLEGE
sOmE COLLEGECOLLEGE Or GrEatEr
Unemployment rates by education level As of August 20144
9.1%Less than high school diploma
6.2%High school, no college
5.4%Some college
3.2%College or greater
Coll
ege
mat
ter
sCO
LLEG
E CO
STS
fin
an
cia
l a
idsa
vin
g &
inv
esti
ng
6 | INHERIT THE THINKING OF J.P. MORGAN
app
end
ix
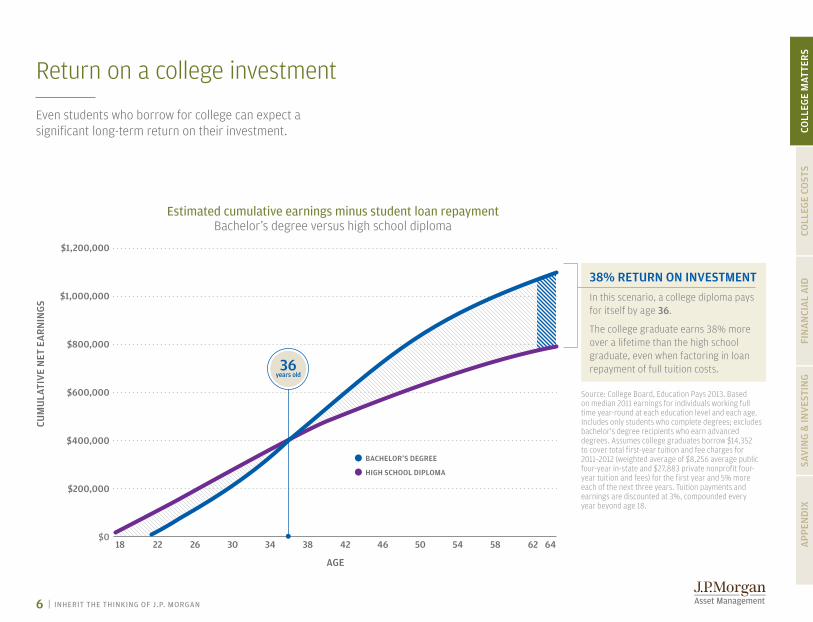
Return on a college investment
Even students who borrow for college can expect a significant long-term return on their investment.
Estimated cumulative earnings minus student loan repayment Bachelor’s degree versus high school diploma
CUm
ULa
tIv
E n
Et E
ar
nIn
Gs
aGE
18 22 26 30 34 38 42 46 50 54 58 62 64$0
$200,000
$1,200,000
$1,000,000
$800,000
$600,000
$400,000
BaCHELOr’s DEGrEE
HIGH sCHOOL DIPLOma
38% rEtUrn On InvEstmEnt
in this scenario, a college diploma pays for itself by age 36.
The college graduate earns 38% more over a lifetime than the high school graduate, even when factoring in loan repayment of full tuition costs.
Source: College Board, Education pays 2013. Based on median 2011 earnings for individuals working full time year-round at each education level and each age. includes only students who complete degrees; excludes bachelor's degree recipients who earn advanced degrees. Assumes college graduates borrow $14,352 to cover total first-year tuition and fee charges for 2011–2012 (weighted average of $8,256 average public four-year in-state and $27,883 private nonprofit four-year tuition and fees) for the first year and 5% more each of the next three years. Tuition payments and earnings are discounted at 3%, compounded every year beyond age 18.
36 years old

Coll
ege
mat
ter
sCO
LLEG
E CO
STS
fin
an
cia
l a
idsa
vin
g &
inv
esti
ng
7 | INHERIT THE THINKING OF J.P. MORGAN
app
end
ix
“major” differences in salaries
$0 $10,000 $20,000 $30,000 $40,000 $50,000 $60,000
Choice of college major has a significant impact on a graduate’s starting salary.
saLarIEs On tHE rIsE
• On average, starting salaries for the class of 2014 are 6.6% higher than for the class of 2012.
• if salaries continue rising at this pace, the average child born today would earn roughly $91,700 in the first year after college.
all degrees $45,473
math and sciences $43,414
Humanities and social sciences $38,365
Engineering $62,719
Computer science $61,741
Communications $43,924
Business $53,901
Health sciences $51,541
Education $40,863
Average yearly starting salary by college major for the class of 2014
Source: National Association of Colleges and Employers (NACE) survey, April 2014.

COLL
EGE
COST
S
myth: “ i know how expensive college is.”
Fact: many families underestimate just how much college costs and how quickly prices rise. pages 9 and 10
Common myths and facts
College Planning Essentials: A comprehensive guide to saving and investing
myth: “ i’m not concerned about college inflation. it has to slow down at some point.”
Fact: Tuition continues to rise at a much faster rate than other expenses, so your savings need to keep pace. page 11
myth: “ i’ll just make a few compromises to help pay for college.”
Fact: Non-savers often don’t realize the sacrifices needed to make college affordable. page 13
1. Source: Sallie Mae, How America Pays for College, 2014.
College costsSaving for college starts with a plan. And a plan starts with a goal. it’s important to understand college costs so you know how much to save by enrollment time.
sECtIOn 2
of families have to rule out colleges because of cost.1Two-thirds
COLL
EGE
COST
S
9 | INHERIT THE THINKING OF J.P. MORGAN
Coll
ege
mat
ter
sCO
LLEG
E CO
STS
fin
an
cia
l a
ida
ppen
dix
sav
ing
& in
ves
tin
g
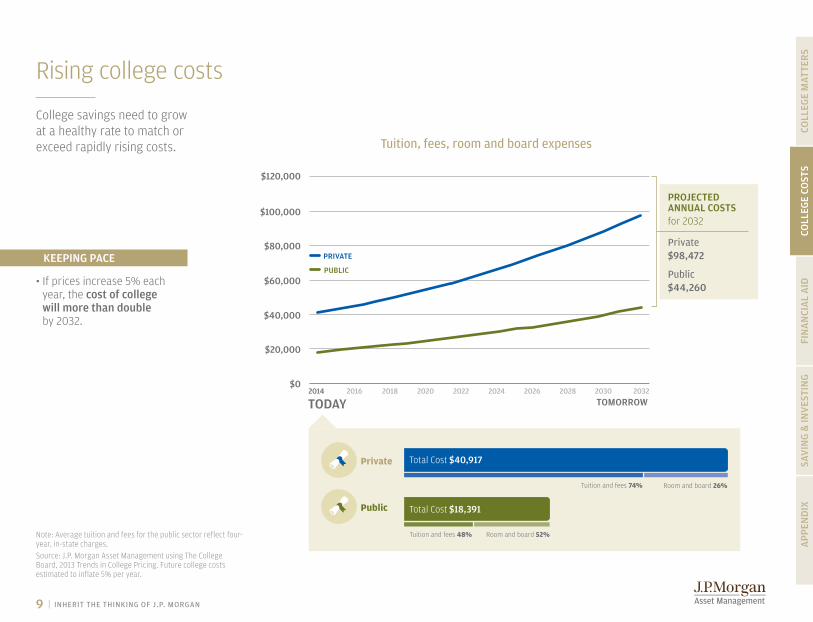
• if prices increase 5% each year, the cost of college will more than double by 2032.
Rising college costs
College savings need to grow at a healthy rate to match or exceed rapidly rising costs.
Note: Average tuition and fees for the public sector reflect four-year, in-state charges.Source: j.p. morgan Asset management using The College Board, 2013 Trends in College pricing. Future college costs estimated to inflate 5% per year.
KEEPInG PaCE
2016 2018 2020 2022 2024 2026 2028 2030 20322014$0
$60,000
$80,000
$100,000
$120,000
$40,000
$20,000
Tuition, fees, room and board expenses
PrOJECtED annUaL COsts for 2032 Private$98,472
Public $44,260
PrIvatE
PUBLIC
tODaY tOmOrrOW
Private
Public
Room and board 26%Tuition and fees 74%
Total Cost $40,917
Room and board 52%Tuition and fees 48%
Total Cost $18,391

10 | INHERIT THE THINKING OF J.P. MORGAN
Coll
ege
mat
ter
sCO
LLEG
E CO
STS
fin
an
cia
l a
ida
ppen
dix
sav
ing
& in
ves
tin
g
Future four-year college costs
Source: j.p. morgan Asset management, using The College Board, 2013 Trends in College pricing. Future college costs estimated to inflate 5% per year.
$0
$50,000
$100,000
$150,000
$200,000
$250,000
$300,000
$350,000
$400,000
$450,000
$500,000
Projected cost of a four-year college education Based on child’s current age
$117,114$106,226$96,350$87,392
$79,268
$260,560
$236,336$214,364
$194,434
$176,357
PUBLIC
PrIvatE
$287,268
$129,118
$316,713
$142,353
$349,176
$156,944
$384,966
$173,031
$424,425
$190,767
The younger the child, the more college is likely to cost. Add up four years per child, and it equals one of a family’s largest expenses.
newbornage 18 age 16 age 14 age 12 age 10 age 8 age 6 age 4 age 2

11 | INHERIT THE THINKING OF J.P. MORGAN
Coll
ege
mat
ter
sCO
LLEG
E CO
STS
fin
an
cia
l a
ida
ppen
dix
sav
ing
& in
ves
tin
g
Tuition inflation
College tuition costs have increased faster than any other household expense in recent decades.
• Colleges are spending more to attract the best students.
• Colleges are hiring more to reduce student-to-faculty ratios.
• Colleges are receiving less financial support from cash-strapped states.
WHY COsts arE rIsInG
Source: BLS, Consumer price index, j.p. morgan Asset management. Data represents cumulative percentage price change from 1983 through 2014.
108%
135%
174%
192%
330%
688%
25%
44%
0% 100% 200% 300% 400% 500% 600% 700%
Gas
apparel
Cars
Coffee
Housing
sweets
medical Care
tuition
Tuition versus other expenses Cumulative percent price change since 1983

12 | INHERIT THE THINKING OF J.P. MORGAN
Coll
ege
mat
ter
sCO
LLEG
E CO
STS
fin
an
cia
l a
ida
ppen
dix
sav
ing
& in
ves
tin
g
$40,920
The real cost of college
Net price is the “sticker price” (full cost) to attend a college, minus any grants and scholarships received. While most families don’t pay the full sticker price, actual costs vary considerably based on household income and the college’s financial aid policies.
aFFLUEnt FamILIEs PaY mOrEDue to financial aid policies, higher-income families paid 36% more than lower-income families in 2013–14.1
Public four-year institutions1
Private nonprofit, four-year institutions1
1. Source: The College Board, 2013 Trends in College pricing. Figures are in 2013 dollars.
2. Source: Sallie mae, How America pays for College, 2014.
$18,390
$0 $10,000 $20,000 $30,000 $40,000
$9,400
$10,850
$12,000
$10,370
$10,800
$12,620 –31.4%’13–’14
’13–’14
’11–’12
’11–’12
’09–’10
’09–’10
’07–’08
’07–’08
’05–’06
’05–’06
’03–’04
’03–’04
$0 $10,000 $20,000 $30,000 $40,000
$22,630
$23,940
$21,980
$23,190
$22,540
$23,290 –43.1%
Net price Sticker price
nEt PrICE On average, families paid 31% below sticker price at public colleges and 43% less at private colleges in 2013–14.
HIGH-INCOME FAMILIES income >$100,000+
LOW-INCOME FAMILIES income <$35,000

13 | INHERIT THE THINKING OF J.P. MORGAN
Coll
ege
mat
ter
sCO
LLEG
E CO
STS
fin
an
cia
l a
ida
ppen
dix
sav
ing
& in
ves
tin
g
45%
Parent reduces
spending
48%
Student works more
How college costs affect behavior
To better afford college, many families must choose less expensive schools or change their daily lifestyles.
Elimination of colleges based on cost
0% 20% 40% 60% 80% 100%
OFF tHE LIstAfter reviewing their financial aid package, 67% of families ruled out some colleges based on cost, up from 56% in 2009.
Source: Sallie mae, How America pays for College, 2013 and 2014.
Actions taken to make college more affordable percentage of people taking each action
Parent works more
19%
Student changes
major
19%
Student accelerates education
28%
Student reduces
spending
66%54%
Student lives at home
stUDEnt aCtIOns ParEnt aCtIOns
2009
2010
2011
2012
2013
2014
56%
63%
64%
69%
67%
67%

fin
an
cia
l a
id
Financial aidsECtIOn 3
Financial aid can help pay for college, but not all aid is free and not everyone qualifies. The more you save now, the less you may have to borrow later.
myth: “ Financial aid is free money.”
Fact: Nearly 40% of federal aid comes in the form of loans that must be paid back with interest. page 15
Common myths and facts
College Planning Essentials: A comprehensive guide to saving and investing
myth: “ i don’t need to save because my child will receive a scholarship.”
Fact: Only 0.3% of college students actually get a full ride. page 16
myth: “ Saving for college will hurt my chances for financial aid.”
Fact: Savings generally have little impact on financial aid eligibility when the funds are held in parents’ names. pages 17 and 18
1. Source: Project on Student Debt, The Institute for College Access & Success (TICAS), December 2013.
more than 7 in 10 college seniors graduated with student loan debt in 2012.1

15 | INHERIT THE THINKING OF J.P. MORGAN
COLL
EGE
COST
Sfi
na
nci
al
aid
app
end
ixsa
vin
g &
inv
esti
ng
Coll
ege
mat
ter
s
tOtaL aID In 2012–13
$185.1 billion
Financial aid overview
most college students require financial assistance of some kind, but 37% of all aid comes in the form of loans that must be paid back with interest.
aID Is DOWn, tUItIOn Is UP
• From 2001 to 2011, state and local financing per student declined 24% nationally. From 2001 to 2014, tuition and fees increased 79% at state colleges and nearly 32% at non-profit private institutions.
• Federal grants declined by $2.6 billion over the past year.
Undergraduate student aid by source and typein billions, 2012–13
Borrowed
Free money
$67.8
(37%)
(24%)
(19%)
(9%)
(5%)
$45.3
$34.9
$16.9
$9.8
Federal loans
State grants
Private and employer grants
Federal work study$0.9 (<1%)
Federal grants
Institutional grants
Education tax benefits
Note: percentages may not total 100% due to rounding.Source: The College Board, 2013 Trends in Student Aid.
Average aid package for full-time undergraduate
students, 2012–13
Federal loans $4,900
tax credits, deductions and federal work study $1,280
Grant aid from all sources $7,190
Average total aid package
$13,370
(5%)$9.6

16 | INHERIT THE THINKING OF J.P. MORGAN
COLL
EGE
COST
Sfi
na
nci
al
aid
app
end
ixsa
vin
g &
inv
esti
ng
Coll
ege
mat
ter
s
Financial aid reality check
many families expect more free money from grants and scholarships than they are likely to receive.
mOrE aPPLICatIOns, LEss aID
• Financial aid applicants include 85% of middle-income families and 65% of high-income families. The more people applying, the less aid there is to go around.1
1. Source: Sallie mae, How America pays for College, 2014.2. Source: finaid.org. Based on full-time students at four-year colleges.3. Source: Sallie mae, How America Saves for College, 2014 and The College
Board, Trends in College pricing, 2013.
of college students receive enough grants and scholarships
to cover all costs.2
0.3%
Financial aid expectations3
61%
61% of parents who are not yet
saving for college expect scholarships or grants to cover
the costs.
Grant reality 2013–14
Scholarship reality 2013–14
Private 23%
4-year Public 26%
2-year Public 30%
43%
44%
of total families received a grant, with an average amount of $6,6431
of total families received a scholarship, with an average amount of $8,0251
Percent of total costs covered by grants
Percent of total costs covered by scholarships
Private 37%
4-year Public 24%
2-year Public 20%

17 | INHERIT THE THINKING OF J.P. MORGAN
COLL
EGE
COST
Sfi
na
nci
al
aid
app
end
ixsa
vin
g &
inv
esti
ng
Coll
ege
mat
ter
s
1. Source: Sallie mae, How America pays for College 2014.2. Based on federal methodology for 2014–15 school year.3. protected amount for parents is dependent upon a number of factors, including household size and number of students in college.
Federal financial aid eligibility
The Department of Education processes the Free Application for Federal Student Aid (FAFSA) to determine the Expected Family Contribution (EFC). This is the amount parents and students are expected to pay directly from their income and savings.
FEDEraL aID
in 2013–14, 81% of families with a college-bound child applied for federal aid.1
tOtaL COLLEGE COsts EaCH YEar
EXPECtED FamILY COntrIBUtIOn (EFC)
FInanCIaL aID ELIGIBILItY
GranDParEnts/OtHErs
0%of income and assets considered in federal financial aid formulas.
However, withdrawals for college by grandparents or others may be considered student income and must be reported on the following year’s financial aid forms. Such income can reduce the amount of
aid by 50%.
ParEnts
Income
Up to 5.64%
of non-retirement assets above
protected amount, including 529 plans,
investments and savings
assets
+ 50%of income
above protected amount of $6,260
20%of all assets in bank accounts, CDs, UGmAs/
UTmAs and any other savings
Income
stUDEnts
+
assets
Colleges use the EFC to calculate the total cost of
attendance — tuition, fees and other expenses — which then
determines how much financial aid is available to a student.
tOtaL EFCHOW EFC Is CaLCULatED2
A family’s current annual income, including the student’s, counts far more in the formula than savings and investments, especially when they’re held in the parents’ names.
of adjusted gross income above the protected
amount3
22%–47%
18 | INHERIT THE THINKING OF J.P. MORGAN
COLL
EGE
COST
Sfi
na
nci
al
aid
app
end
ixsa
vin
g &
inv
esti
ng
Coll
ege
mat
ter
s
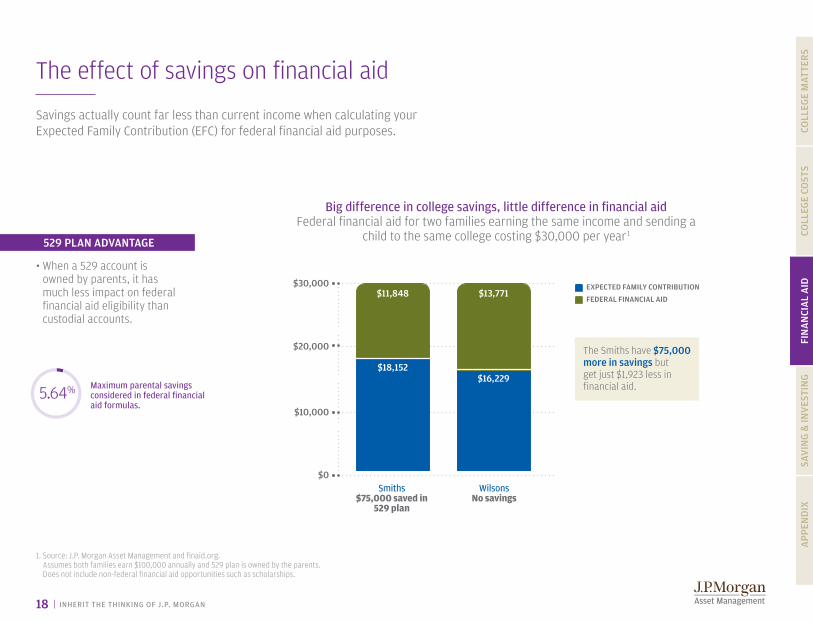
The effect of savings on financial aid
Savings actually count far less than current income when calculating your Expected Family Contribution (EFC) for federal financial aid purposes.
529 PLan aDvantaGE
• When a 529 account is owned by parents, it has much less impact on federal financial aid eligibility than custodial accounts.
Maximum parental savings considered in federal financial aid formulas.5+95T5.64%
Big difference in college savings, little difference in financial aid Federal financial aid for two families earning the same income and sending a
child to the same college costing $30,000 per year1
EXPECtED FamILY COntrIBUtIOn
FEDEraL FInanCIaL aID
$30,000
$20,000
$10,000
$0Smiths
$75,000 saved in 529 plan
WilsonsNo savings
$18,152$16,229
$11,848 $13,771
The Smiths have $75,000 more in savings but get just $1,923 less in financial aid.
1. Source: j.p. morgan Asset management and finaid.org. Assumes both families earn $100,000 annually and 529 plan is owned by the parents. Does not include non-federal financial aid opportunities such as scholarships.

19 | INHERIT THE THINKING OF J.P. MORGAN
COLL
EGE
COST
Sfi
na
nci
al
aid
app
end
ixsa
vin
g &
inv
esti
ng
Coll
ege
mat
ter
s
Student loan landscape
Student loan debt has soared in recent years, putting an increased financial burden on college graduates and their parents.
subsidized stafford Loans For undergraduate students with documented financial need. The government pays interest while the student is in college.
Unsubsidized stafford Loans For undergraduate and graduate students regardless of financial need. The government does not pay interest while the student is in college.
Grad PLUs For graduate students only.
Parents PLUs For parents only.
Perkins For students with high need at some institutions.
Private Education Loans* Offered by private lenders, they can either supplement or replace federally guaranteed loans.
$0 $10 $20 $30 $40 $50 $60 $70 $80 $90 $100 $110
2005–06
2007–08
2009–10
2011–12
2012–13
t$113.4
t$110.4
t$113.9
t$99.7
t$87.6
Issuance of federal and private loans Selected years, 2012 dollars in billions1
1. Source: The College Board, 2013 Trends in Student Aid.2. project on Student Debt, The institute for College Access & Success (TiCAS), December 2013.
* Note: private education includes loans to students from states and from institutions, in addition to private loans by banks, credit unions and Sallie mae.
In 2012, 71% of college seniors graduated
with student loan debt averaging $29,400.2
20 | INHERIT THE THINKING OF J.P. MORGAN
COLL
EGE
COST
Sfi
na
nci
al
aid
app
end
ixsa
vin
g &
inv
esti
ng
Coll
ege
mat
ter
s
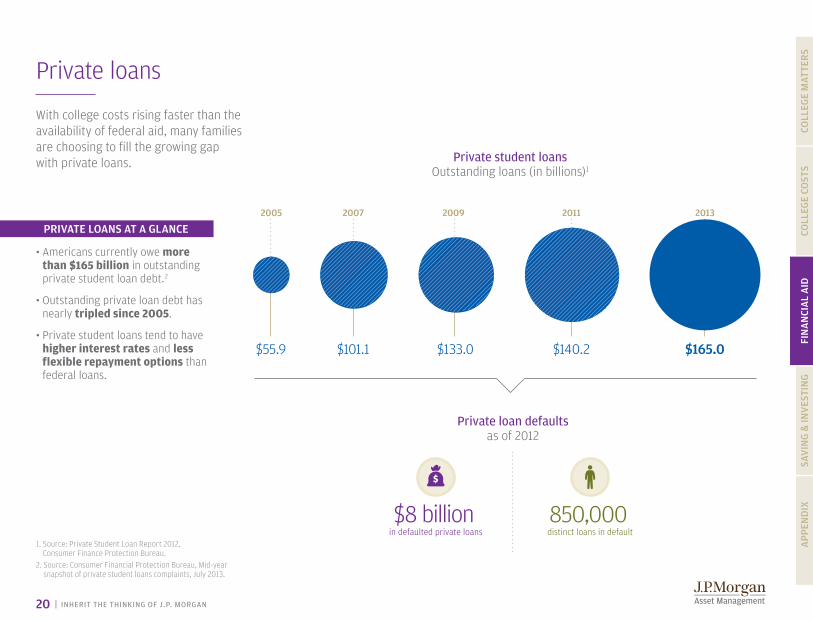
private loans
With college costs rising faster than the availability of federal aid, many families are choosing to fill the growing gap with private loans.
• Americans currently owe more than $165 billion in outstanding private student loan debt.2
• Outstanding private loan debt has nearly tripled since 2005.
• private student loans tend to have higher interest rates and less flexible repayment options than federal loans.
PrIvatE LOans at a GLanCE
1. Source: private Student Loan Report 2012, Consumer Finance protection Bureau.
2. Source: Consumer Financial protection Bureau, mid-year snapshot of private student loans complaints, july 2013.
Private student loans Outstanding loans (in billions)1
Private loan defaults as of 2012
$8 billionin defaulted private loans
850,000distinct loans in default
2005
$55.9
2007
$101.1
2011
$140.2
2009
$133.0
2013
$165.0
21 | INHERIT THE THINKING OF J.P. MORGAN
COLL
EGE
COST
Sfi
na
nci
al
aid
app
end
ixsa
vin
g &
inv
esti
ng
Coll
ege
mat
ter
s
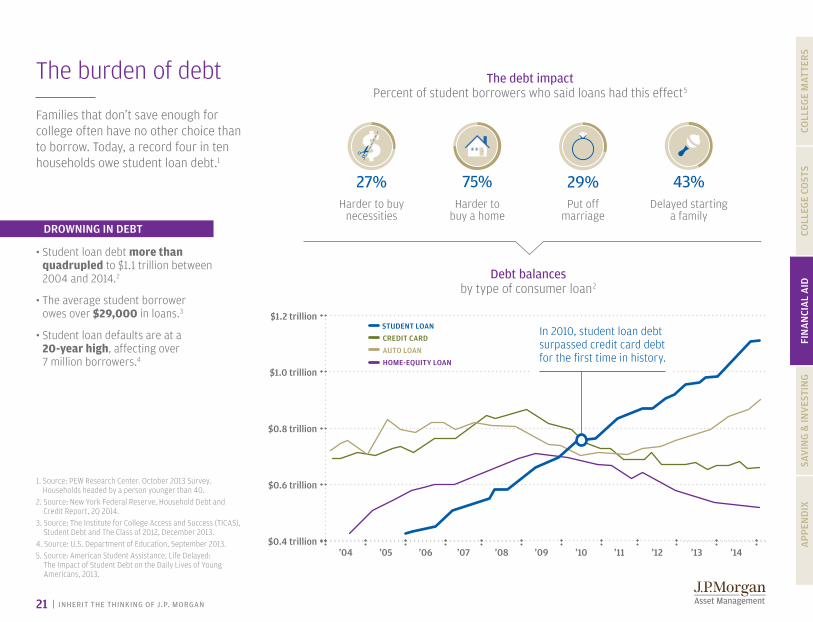
The burden of debt
Families that don’t save enough for college often have no other choice than to borrow. Today, a record four in ten households owe student loan debt.1
Debt balances by type of consumer loan2
The debt impact percent of student borrowers who said loans had this effect5
• Student loan debt more than quadrupled to $1.1 trillion between 2004 and 2014.2
• The average student borrower owes over $29,000 in loans.3
• Student loan defaults are at a 20-year high, affecting over 7 million borrowers.4
DrOWnInG In DEBt
Harder to buy necessities
27%Harder to
buy a home
75%put off
marriage
29%Delayed starting
a family
43%
1. Source: pEW Research Center. October 2013 Survey. Households headed by a person younger than 40.
2. Source: New York Federal Reserve, Household Debt and Credit Report, 2Q 2014.
3. Source: The institute for College Access and Success (TiCAS), Student Debt and The Class of 2012, December 2013.
4. Source: U.S. Department of Education, September 2013.5. Source: American Student Assistance, Life Delayed:
The impact of Student Debt on the Daily Lives of Young Americans, 2013.
$0.4 trillion
$0.6 trillion
$0.8 trillion
$1.0 trillion
$1.2 trillion
’04 ’05 ’06 ’07 ’08 ’09 ’10 ’11 ’12 ’13 ’14
stUDEnt LOan
CrEDIt CarD
aUtO LOan
HOmE-EqUItY LOan
in 2010, student loan debt surpassed credit card debt for the first time in history.
sav
ing
& in
ves
tin
g
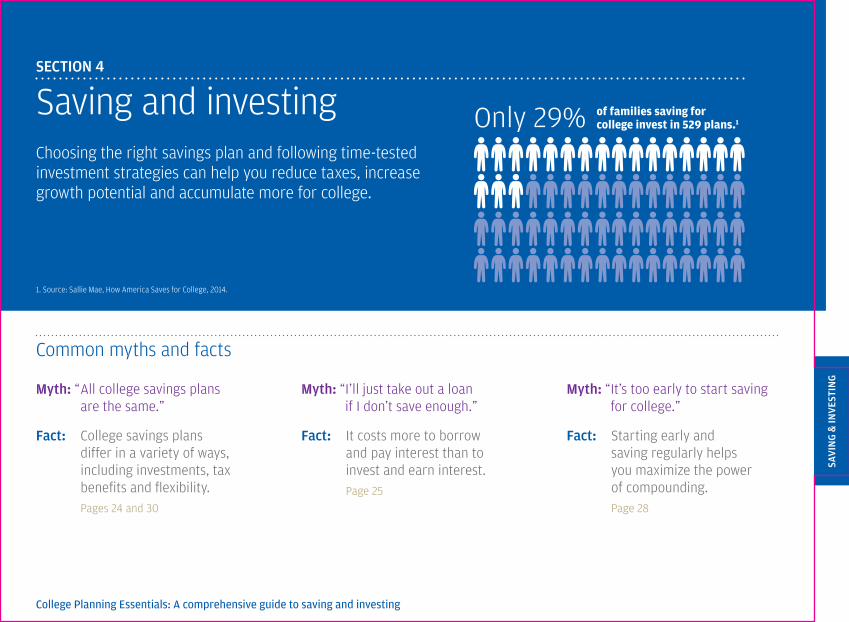
Saving and investingsECtIOn 4
Choosing the right savings plan and following time-tested investment strategies can help you reduce taxes, increase growth potential and accumulate more for college.
myth: “ All college savings plans are the same.”
Fact: College savings plans differ in a variety of ways, including investments, tax benefits and flexibility. pages 24 and 30
Common myths and facts
College Planning Essentials: A comprehensive guide to saving and investing
myth: “ i’ll just take out a loan if i don’t save enough.”
Fact: it costs more to borrow and pay interest than to invest and earn interest. page 25
myth: “ it’s too early to start saving for college.”
Fact: Starting early and saving regularly helps you maximize the power of compounding. page 28
1. Source: Sallie mae, How America Saves for College, 2014.
of families saving for college invest in 529 plans.1Only 29%

23 | INHERIT THE THINKING OF J.P. MORGAN
COLL
EGE
COST
Sfi
na
nci
al
aid
sav
ing
& in
ves
tin
ga
ppen
dix
Coll
ege
mat
ter
s
Current saving and investing trends
Half of U.S. families aren’t saving for college. The other half often choose vehicles that don’t maximize their growth potential, such as CDs, taxable investments or accounts intended for retirement.
Percentage of families using:
18%Retirement Savings Accounts
16%CDs
45%General Savings Accounts
29%529 College Savings Plan
20%Investments
11%Trust Fund
14%Prepaid or Guaranteed State College Savings Program
24%Checking Account
13%Coverdell Education Savings Accounts
Source: Sallie mae, How America Saves for College, 2014.
0% 50%10% 20% 30% 40%
10%UGMA/UTMA
FamILIEs DOn’t FULLY maXImIzE GrOWtH POtEntIaLmore parents—45%—save for college with low-yielding savings accounts than any other method.
FAMILIES USING A 529 PLAN
FAMILIES USING A TRADITIONAL
SAvINGS ACCOUNT
On average, those parents with a 529 plan save 68% more than those simply using a savings account.

24 | INHERIT THE THINKING OF J.P. MORGAN
COLL
EGE
COST
Sfi
na
nci
al
aid
sav
ing
& in
ves
tin
ga
ppen
dix
Coll
ege
mat
ter
s
7+93+U5+95+U
Comparing college savings vehicles
Understanding the different tax benefits and features of college savings vehicles can help you choose the right one for your needs.
of parents own UGMA/UTMA accounts
529 college savings plan Custodial account (UGMA/UTMA) Coverdell Education Savings Account
• Tax-free investing and withdrawals for any qualified higher education expense*
• Account owner control for the life of the account
• No income limits on contributors
• High contribution maximums
• Low impact on financial aid eligibility
• Funds must be used for the child’s benefit, not necessarily for college
• portion of investment earnings taxed at child’s and parents’ rates
• Child assumes control at age of majority, usually 18 or 21
• High impact on financial aid eligibility
• Tax-free investing and withdrawals for any level of education*
• income limits on contributors
• Age limits on beneficiaries
• maximum contribution of $2,000 annually per beneficiary
• Low impact on financial aid eligibility
of parents own 529 plans27+73+U29% 10% of parents own
Coverdell accounts13%
* Earnings on non-qualified withdrawals may be subject to federal income tax and a 10% federal penalty tax, as well as state and local income taxes.
Source: Sallie mae, How America Saves for College, 2014.

25 | INHERIT THE THINKING OF J.P. MORGAN
COLL
EGE
COST
Sfi
na
nci
al
aid
sav
ing
& in
ves
tin
ga
ppen
dix
Coll
ege
mat
ter
s
College savings plan versus student loan initial investment of $1,000 plus
monthly investment of $3002
investing versus borrowing
it costs less to invest now than to borrow later. When you borrow for college, you pay interest. When you invest, you earn interest and other forms of investment returns.
It taKEs a PLan
• Without a plan, families run the risk of not saving enough and borrowing too much. Yet 43% of high-income families and 61% of middle-income families don’t have a plan to pay for college.1
$200,000
$150,000
$100,000
$50,000
$0College savings plan
over 18 yearsCollege loan: principal and
interest
$119,143
InvEstmEnt GrOWtH
OUt-OF-POCKEt COst
out-of-pocket difference with 529 plan
$101,753
Average loan debt at graduation for parents3
$10,000
$15,000
$33,800
$7,500
$0
1993
2003
2012
$20,000 $40,000$30,000
a BUrDEn FOr EvErYOnE
The average parental debt load has more than doubled in a decade to $33,800 in 2012, while the average debt faced by students was more than $29,000 in 2012.4
1. Source: Sallie mae, How America pays for College, 2014.2. Source: j.p. morgan Asset management. The investing
illustration assumes an initial lump sum investment of $1,000, subsequent monthly investments of $300 thereafter for 18 years, and assumes an annual investment return of 6% and federal tax rate of 28%. investment losses could affect the relative tax-deferred investment advantage. Each investor should consider his or her current and anticipated investment horizon and income tax bracket when making an investment decision, as the illustration may not reflect these factors. The borrowing illustration assumes an interest rate of 7.21% and a payback period of 10 years. This hypothetical illustration is not indicative of any specific investment and does not reflect the impact of fees or expenses. The chart is shown for illustrative purposes only. past performance is no guarantee of future results.
3. Source: The Wall Street journal, parent Trap: What to Know Before Taking a College Loan, FinAid.org analysis of Department of Education data, march 24, 2013.
4. Source: The institute for College Access and Success (TiCAS), December 2013.
$167,553
$65,800

26 | INHERIT THE THINKING OF J.P. MORGAN
COLL
EGE
COST
Sfi
na
nci
al
aid
sav
ing
& in
ves
tin
ga
ppen
dix
Coll
ege
mat
ter
s
s&P 500
U.s. 30-DaY trEasUrY BILLs
COnsUmEr PrICE InDEX
COLLEGE tUItIOn anD FEEs
investing for long-term growth
Starting a college savings plan early allows more time to hold investments with higher return potential.
$100
$10
$1DEC ’78 DEC ’13DEC ’08DEC ’03DEC ’98DEC ’93DEC ’88DEC ’83
Growth of one dollar December 1978 to December 2013
Source: j.p. morgan Asset management. past performance is no guarantee of future results. Hypothetical value of $1 invested at the beginning of 1979. Assumes reinvestment of income and no transaction costs or taxes. This is for illustrative purposes only and not indicative of any investment. An investment cannot be made directly in an index.
stOCKs OUtPaCE tUItIOn InFLatIOnWhile short-term investments grew more slowly than tuition costs, stocks delivered high returns to help beat college inflation and achieve savings goals.
t$52.23
t$12.05
t$5.50
t$3.45
27 | INHERIT THE THINKING OF J.P. MORGAN
COLL
EGE
COST
Sfi
na
nci
al
aid
sav
ing
& in
ves
tin
ga
ppen
dix
Coll
ege
mat
ter
s
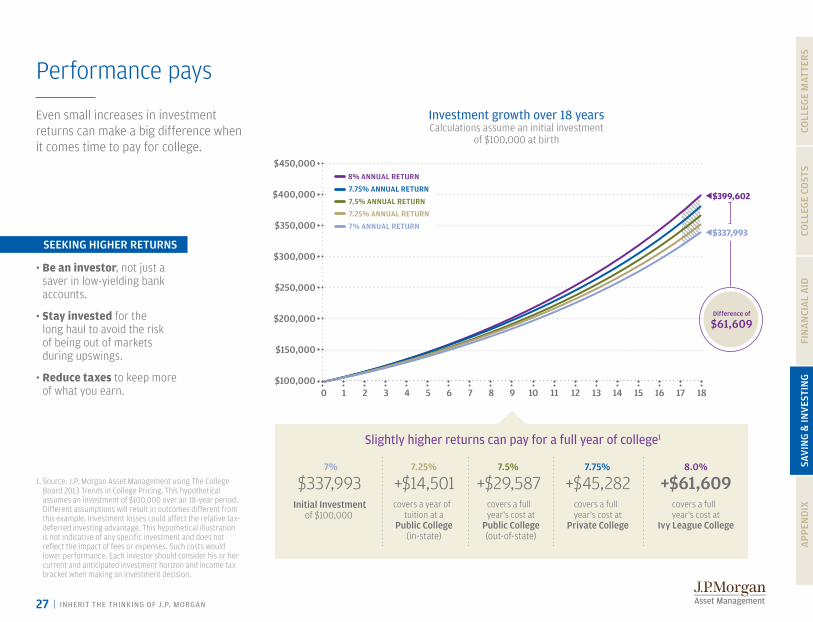
performance pays
Even small increases in investment returns can make a big difference when it comes time to pay for college.
sEEKInG HIGHEr rEtUrns
• Be an investor, not just a saver in low-yielding bank accounts.
• Stay invested for the long haul to avoid the risk of being out of markets during upswings.
• Reduce taxes to keep more of what you earn.
1. Source: j.p. morgan Asset management using The College Board 2013 Trends in College pricing. This hypothetical assumes an investment of $100,000 over an 18-year period. Different assumptions will result in outcomes different from this example. investment losses could affect the relative tax-deferred investing advantage. This hypothetical illustration is not indicative of any specific investment and does not reflect the impact of fees or expenses. Such costs would lower performance. Each investor should consider his or her current and anticipated investment horizon and income tax bracket when making an investment decision.
Investment growth over 18 years Calculations assume an initial investment
of $100,000 at birth
$450,000
$350,000
$400,000
$300,000
$250,000
$200,000
$150,000
$100,00010 2 3 4 5 6 7 8 9 10 11 12 13 14 15 16 17 18
t$399,602
of $100,000covers a year of
tuition at a Public College
(in-state)
covers a full year's cost at
Public College (out-of-state)
covers a full year's cost at
Private College
covers a full year's cost at
Ivy League College
Initial Investment
Slightly higher returns can pay for a full year of college1
+$14,501$337,993 +$29,587 +$45,282 +$61,6097.25%7% 7.5% 7.75% 8.0%
Difference of
$61,609
t$337,993
7.75% annUaL rEtUrn
7.5% annUaL rEtUrn
8% annUaL rEtUrn
7.25% annUaL rEtUrn
7% annUaL rEtUrn

28 | INHERIT THE THINKING OF J.P. MORGAN
COLL
EGE
COST
Sfi
na
nci
al
aid
sav
ing
& in
ves
tin
ga
ppen
dix
Coll
ege
mat
ter
s
The benefits of compounding
The sooner you start saving, the more time you may have to grow your college fund through the power of long-term compounding. Even small contributions add up over time.
Total accumulation
in 6 years
Total accumulation in 12 years
Total accumulation in 18 years
$50,000
$100,000
$150,000
$200,000
$0
$100 mOntHLY COntrIBUtIOns
$250 mOntHLY COntrIBUtIOns
$500 mOntHLY COntrIBUtIOns
Start early, small savings add up Total amounts accumulated over 6, 12 and 18 years1
if you start saving $500 per month when a child is born, you'll earn
$84,214 more than if you start at age six.
$8,3
70 $20
,926
$41,
852
$50
,610
$101
,220
$37,
087
$92,
717
$185
,434
$20
,24
4
1. Source: j.p. morgan Asset management. This hypothetical example illustrates the future values of different regular monthly investments for different time periods. Chart also assumes an annual investment return of 6% and a federal tax rate of 28%. investment losses could affect the relative tax-deferred investing advantage. This hypothetical illustration is not indicative of any specific investment and does not reflect the impact of fees or expenses. Such costs would lower performance. Each investor should consider his or her current and anticipated investment horizon and income tax bracket when making an investment decision, as the illustration may not reflect these factors. a plan of regular investment cannot assure a profit or protect against a loss in a declining market. the chart is shown for illustrative purposes only. Past performance is no guarantee of future results.
Start early, accumulate more
29 | INHERIT THE THINKING OF J.P. MORGAN
COLL
EGE
COST
Sfi
na
nci
al
aid
sav
ing
& in
ves
tin
ga
ppen
dix
Coll
ege
mat
ter
s
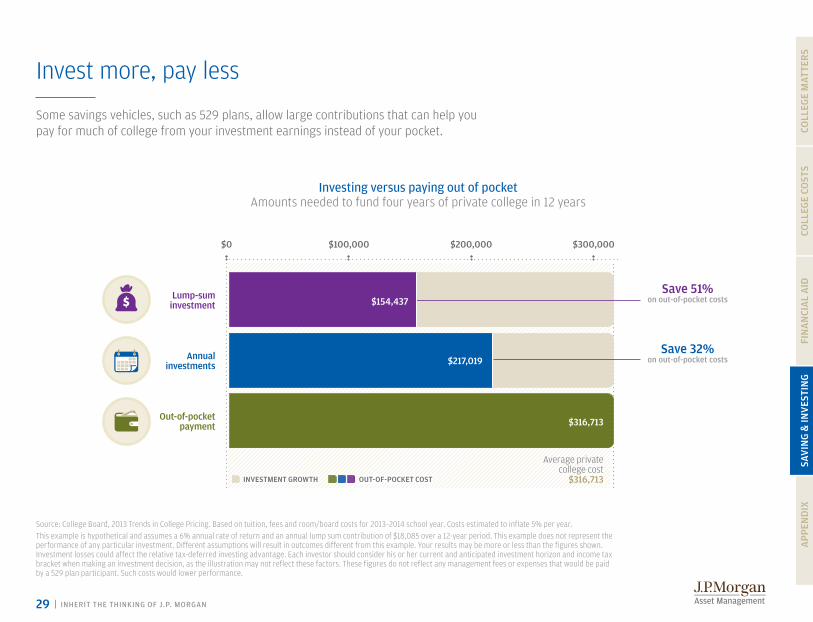
invest more, pay less
Some savings vehicles, such as 529 plans, allow large contributions that can help you pay for much of college from your investment earnings instead of your pocket.
Source: College Board, 2013 Trends in College pricing. Based on tuition, fees and room/board costs for 2013–2014 school year. Costs estimated to inflate 5% per year. This example is hypothetical and assumes a 6% annual rate of return and an annual lump sum contribution of $18,085 over a 12-year period. This example does not represent the performance of any particular investment. Different assumptions will result in outcomes different from this example. Your results may be more or less than the figures shown. investment losses could affect the relative tax-deferred investing advantage. Each investor should consider his or her current and anticipated investment horizon and income tax bracket when making an investment decision, as the illustration may not reflect these factors. These figures do not reflect any management fees or expenses that would be paid by a 529 plan participant. Such costs would lower performance.
$200,000$0 $100,000 $300,000
Average private college cost
$316,713
Lump-sum investment
Annual investments
Out-of-pocketpayment
InvEstmEnt GrOWtH OUt-OF-POCKEt COst
Investing versus paying out of pocket Amounts needed to fund four years of private college in 12 years
$154,437
$217,019
$316,713
save 32% on out-of-pocket costs
save 51% on out-of-pocket costs

30 | INHERIT THE THINKING OF J.P. MORGAN
COLL
EGE
COST
Sfi
na
nci
al
aid
sav
ing
& in
ves
tin
ga
ppen
dix
Coll
ege
mat
ter
s
Tax-efficient investing
A tax-advantaged account, such as a 529 plan, has the potential to grow faster for college than a taxable investment earning the exact same returns.
$15,477 more
with a tax-free 529 plan
$90,000 $120,000$60,000$30,000$0
Taxable account
Tax-free 529 plan
Lower taxes equal a larger college fund investment growth over 18 years1
1. Source: j.p. morgan Asset management. illustration assumes an initial $1,000 investment and monthly investments of $300 for 18 years. Chart also assumes an annual investment return of 6% and a federal tax rate of 28%. investment losses could affect the relative tax-deferred investing advantage. This hypothetical illustration is not indicative of any specific investment and does not reflect the impact of fees or expenses. Each investor should consider his or her current and anticipated investment horizon and income tax bracket when making an investment decision, as the illustration may not reflect these factors. These figures do not reflect any management fees or expenses that would be paid by a 529 plan participant. Such costs would lower performance. The chart is shown for illustrative purposes only. past performance is no guarantee of future results.
2. Earnings on non-qualified withdrawals may be subject to federal income tax and a 10% federal penalty tax, as well as state and local income taxes.
$103,666
$119,143
statE taX BEnEFIts
• many 529 plans offer state tax benefits in addition to federal tax-free investing.2 See the Appendix on page 47 for more information.

31 | INHERIT THE THINKING OF J.P. MORGAN
COLL
EGE
COST
Sfi
na
nci
al
aid
sav
ing
& in
ves
tin
ga
ppen
dix
Coll
ege
mat
ter
s
making college savings a family affair
Getting family, friends and students involved in college savings can increase the size of your account and reduce your share of the expenses.
taLK tO CHILDrEn
• Nearly half (47%) of college savers have discussed education costs with children, compared to just 28% of non-savers.1
Don’t go it aloneparents expect only 5% of college costs to be paid with contributions
from grandparents, friends and family.1
1. Source: Sallie mae, How America Saves for College, 2014.2. Source: j.p. morgan Asset management. This hypothetical example illustrates the future values of
regular monthly investments by the account owner and annual investment by other contributors over an 18-year period. investment losses could affect the relative tax-deferred investing advantage. This hypothetical illustration is not indicative of any specific investment and does not reflect the impact of fees or expenses. Such costs would lower performance. Each investor should consider his or her current and anticipated investment horizon and income tax bracket when making an investment decision, as the illustration may not reflect these factors. A plan of regular investment cannot assure a profit or protect against a loss in a declining market. The chart is shown for illustrative purposes only. past performance is no guarantee of future results.
More contributors equal a larger college fund investment growth over 18 years2
$36,906
$72,264
$185,434
Family and friends $1,000 annually
Total
Parents $6,000 annually
Grandparents $2,500 annually
$294,604
5%

32 | INHERIT THE THINKING OF J.P. MORGAN
COLL
EGE
COST
Sfi
na
nci
al
aid
sav
ing
& in
ves
tin
ga
ppen
dix
Coll
ege
mat
ter
s
Asset allocation provided a smoother ride
A diversified portfolio of many different asset classes fluctuated less than any one on its own.
DJ UBSCmdty9.0%
DJ UBSCmdty0.9%
MarketNeutral62.7%
MarketNeutral
5.0%
AssetAlloc.14.9%
MSCIEME
197.7%
MSCIEME
11.5%
Cumula
tive
Annualized
Cash
17.1%
Cash
1.6%
REITs
128.5%
REITs
8.6%
BarclaysAgg
56.0%
BarclaysAgg
4.5%
Russell2000
138.3%
Russell20009.1%
AssetAlloc.
100.1%
AssetAlloc.7.2%
S&P500
104.3%
S&P500
7.4%
MSCIEAFE
104.1%
MSCIEAFE7.4%
MSCIEME
–2.3%
Russell2000
38.8%
MSCIEAFE
23.3%
2013
REITs
2.9%
Cash
0.0%
BarclaysAgg
–2.0%
MarketNeutral7.9%
S&P500
32.4%
DJ UBSCmdty–9.5%
MSCIEME
34.5%
MSCIEME
39.8%
MSCIEME
79.0%
REITs
35.1%
REITs
27.9%
REITs
8.3%
REITs
19.7%
BarclaysAgg
5.2%
Russell2000
26.9%
MarketNeutral
1.1%
MarketNeutral4.5%
DJ UBSCmdty21.4%
DJ UBSCmdty16.2%
DJ UBSCmdty
–35.6%
MSCIEAFE
32.5%
MSCIEAFE
20.7%
MSCIEAFE
14.0%
MSCIEAFE
26.9%
MSCIEAFE11.6%
MSCIEAFE
17.9%
MSCIEME
26.0%
MSCIEME
32.6%
MSCIEME
18.6%
REITs
31.6%
20052007
20092006
20102011
20122008
2004
REITs
12.2%
REITs
–37.7%
REITs
–15.7%
Cash
1.8%
Cash
0.1%
Cash
4.8%
Cash
3.0%
Cash
1.2%
Cash
0.1%
Cash
0.1%
Cash
4.8%
Cash
0.1%
BarclaysAgg
7.8%
BarclaysAgg
7.0%
BarclaysAgg
5.9%
BarclaysAgg
4.3%
BarclaysAgg
2.4%
BarclaysAgg
4.3%
BarclaysAgg
6.5%
BarclaysAgg
4.2%
REITs
28.0%
MSCIEME
19.2%
MSCIEME
-53.2%
MSCIEME
–18.2%
Russell2000
18.3%
Russell20004.6%
Russell2000
–1.6%
Russell2000
18.4%
Russell2000
–33.8%
Russell2000
16.3%
Russell2000
–4.2%
Russell2000
27.2%
MarketNeutral9.3%
MarketNeutral
6.1%
MarketNeutral11.2%
MarketNeutral6.5%
MarketNeutral
4.1%
MarketNeutral–0.8%
MarketNeutral0.9%
AssetAlloc.
–24.0%
AssetAlloc.22.2%
AssetAlloc.12.5%
AssetAlloc.–0.6%
AssetAlloc.11.3%
AssetAlloc.12.5%
AssetAlloc.15.2%
AssetAlloc.8.3%
AssetAlloc.7.4%
DJ UBSCmdty16.8%
S&P5002.1%
S&P500
10.9%
S&P500
4.9%
S&P500
5.5%
S&P500
–37.0%
S&P500
15.8%
S&P500
26.5%
S&P500
15.1%
S&P500
16.0%
MSCIEAFE8.2%
MSCIEAFE
–43.1%
MSCIEAFE
–11.7%
DJ UBSCmdty9.1%
DJ UBSCmdty2.1%
DJ UBSCmdty–1.1%
DJ UBSCmdty18.9%
DJ UBSCmdty–13.3%
Asset class performance Ranked in order of annual returns, 2004–13
Source: Russell, mSCi, Dow jones, Standard & poor’s, Credit Suisse, Barclays Capital, NAREiT, FactSet, j.p. morgan Asset management.The “Asset Allocation” portfolio assumes the following weights: 25% in the S&p 500, 10% in the Russell 2000, 15% in the mSCi EAFE, 5% in the mSCi Emi, 25% in the Barclays Capital Aggregate, 5% in the Barclays 1-3m Treasury, 5% in the CS/Tremont Equity market Neutral index, 5% in the Dj UBS Commodity index and 5% in the NAREiT Equity REiT index. Balanced portfolio assumes annual rebalancing. All data represents total return for stated period. past performance is not indicative of future returns. Asset allocation does not guarantee investment returns and does not eliminate the risk of loss. Data are as of 12/31/13, except for the CS/Tremont Equity market Neutral index, which reflects data through 11/30/13. “10-yrs” returns represent period of 1/1/04–12/31/13 showing both cumulative (Cum.) and annualized (Ann.) over the period.please see disclosure page at end for index definitions.
*market Neutral returns include estimates found in disclosures.
33 | INHERIT THE THINKING OF J.P. MORGAN
COLL
EGE
COST
Sfi
na
nci
al
aid
sav
ing
& in
ves
tin
ga
ppen
dix
Coll
ege
mat
ter
s
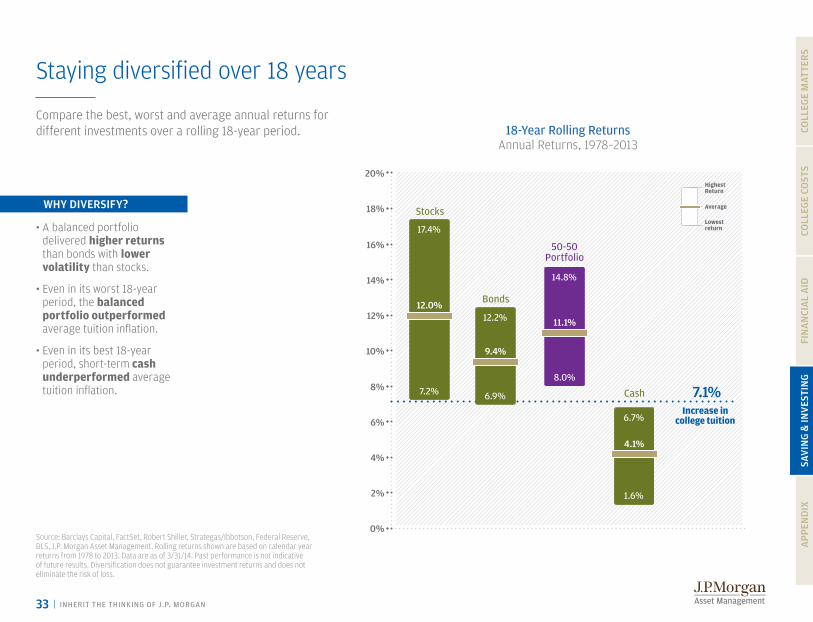
Staying diversified over 18 years
Compare the best, worst and average annual returns for different investments over a rolling 18-year period.
WHY DIvErsIFY?
• A balanced portfolio delivered higher returns than bonds with lower volatility than stocks.
• Even in its worst 18-year period, the balanced portfolio outperformed average tuition inflation.
• Even in its best 18-year period, short-term cash underperformed average tuition inflation.
Source: Barclays Capital, FactSet, Robert Shiller, Strategas/ibbotson, Federal Reserve, BLS, j.p. morgan Asset management. Rolling returns shown are based on calendar year returns from 1978 to 2013. Data are as of 3/31/14. past performance is not indicative of future results. Diversification does not guarantee investment returns and does not eliminate the risk of loss.
8%
16%
20%
6%
14%
18%
4%
12%
2%
10%
0%
Increase in college tuition
12.0%
11.1%
4.1%
7.1%
17.4%
14.8%
6.7%
7.2%8.0%
1.6%
18-Year Rolling Returns Annual Returns, 1978–2013
Stocks
Bonds
Cash
50-50Portfolio
9.4%
12.2%
6.9%
Average
Lowest return
Highest Return

34 | INHERIT THE THINKING OF J.P. MORGAN
COLL
EGE
COST
Sfi
na
nci
al
aid
sav
ing
& in
ves
tin
ga
ppen
dix
Coll
ege
mat
ter
s
The power of diversification
A more diversified portfolio has historically provided higher returns with lower risk.
S&p 500
mSCi EAFE
Barclays Agg. 55%
15%
30%
Traditional portfolio
26%
22%
13%
9%
8%
8%
8%4%
S&p 500
Russell 2000
Barclays Agg.
mSCi EAFE
REiT
Equity mkt. Neutral
mSCi Em
Commodities
Return
Standard Deviation
5.23%
10.88%
Return
Standard Deviation
6.85%
10.28%
More diversified portfolio
Source: j.p. morgan Asset management. indexes and weights of the traditional portfolio are as follows: U.S. stocks: 55% S&p 500, U.S. bonds: 30% Barclays Capital Aggregate, international stocks: 15% mSCi EAFE. portfolio with 25% in alternatives is as follows: U.S. stocks: 22.2% S&p 500, 8.8% Russell 2000; international Stocks: 4.4% mSCi Em, 13.2% mSCi EAFE; U.S. Bonds: 26.5% Barclays Capital Aggregate; Alternatives: 8.3% CS/Tremont Equity market Neutral, 8.3% Dj/UBS Commodities, 8.3% NAREiT Equity REiT index. Return and standard deviation calculated using morningstar Direct. Charts are shown for illustrative purposes only. past returns are no guarantee of future results. Diversification does not guarantee investment returns and does not eliminate risk of loss. Data as of December 31, 2013.
Portfolio risks and returns1999-2013

35 | INHERIT THE THINKING OF J.P. MORGAN
COLL
EGE
COST
Sfi
na
nci
al
aid
sav
ing
& in
ves
tin
ga
ppen
dix
Coll
ege
mat
ter
s
Good intentions, unexpected consequences
Saving for college is one of a family’s top financial priorities, but common mistakes can keep them from achieving goals.
Why save for college1
College degree is more important now
strOnGLY aGrEE sOmEWHat aGrEE
1. Source: Sallie mae, How America Saves for College, 2014.
Part of the American dream
Possible reasons why:
Child will earn more money
An investment in child’s future 60% 29%
51% 32%
51% 26%
89%
83%
47% 33%
80%
77%
56% of parents are not
confident about meeting college costs.1
• Not having a plan
• investing too conservatively
• Starting too late
• Using taxable or retirement accounts
• Overestimating financial aid
• Underestimating college costs
• Not getting others involved

36 | INHERIT THE THINKING OF J.P. MORGAN
COLL
EGE
COST
Sfi
na
nci
al
aid
sav
ing
& in
ves
tin
ga
ppen
dix
Coll
ege
mat
ter
s
College planning checklist
Set a goal
Review and adjustCreate your plan
What type of college should we consider?
What costs should i expect?
What is my family’s financial outlook?
How much of total costs do i want to pay?
What can i afford to save?
What does my financial advisor recommend?
Review plan annually
make adjustments based on life changes
Compare and choose college savings options
Understand my risk tolerance
Get startedOpen an account and select investments
Set up a schedule of monthly contributions

app
end
ix
AppendixsECtIOn 5
College Planning Essentials: A comprehensive guide to saving and investing
fafsa.ed.gov
finaid.org
irs.gov iRS publication 970, Tax Benefits for Education
ed.gov/finaid.html
collegeconfidential.com
collegesavings.org savingforcollege.com
iefa.org
How to apply for federal financial aid
Guide to grants, scholarships, loans and other aid
Guide to federal income tax benefits for education
Options from U.S. Department of Education
Resources to help pay for college
Information about 529 plans
Comprehensive guide to college funding
Aid for students studying in a foreign country
parents and others can learn more about obtaining financial aid for college through the following websites:
Financial Aid Resources

38 | INHERIT THE THINKING OF J.P. MORGAN
COLL
EGE
COST
Sfi
na
nci
al
aid
app
end
ixsa
vin
g &
inv
esti
ng
Coll
ege
mat
ter
s
Sources of financial aid
U.S. federal government
TYPES OF FINANCIAL AID DETAILS
Grants and scholarships
Loans
Work study
Allows qualified students to earn money for college expenses
In addition to aid from the U.S. Department of Education, scholarships and loan repayment may be available to qualified students through additional government entities.
Grants and scholarships
May be available even if families aren’t eligible for federal aid
Example: New York offers a Math and Science Teaching Incentive Scholarship to eligible students in approved programs that lead to math or science teaching careers.
Grants and scholarshipsAid may be available for attending a particular college and/or studying specific majors.
Grants and scholarships
Private loans
Possible sources include charitable foundations, religious and community organizations, local businesses, ethnicity-based organizations, students’ and parents’ employers, and civic groups and professional associations related to a field of study.
Tend to have higher interest rates and less flexible repayment options than federal loans.
States
Colleges
Non-profit or private organizations
Banks, credit unions or other lenders
Source: www.studentaid.ed.gov (U.S. Department of Education).
tYPEs OF FInanCIaL aIDGrants and scholarships are free gifts that generally don’t have to be repaid. Grants are typically need-based while scholarships are merit-based. Loans must be paid back with interest.

39 | INHERIT THE THINKING OF J.P. MORGAN
COLL
EGE
COST
Sfi
na
nci
al
aid
app
end
ixsa
vin
g &
inv
esti
ng
Coll
ege
mat
ter
s
Financial aid: Types of applications
There are over 250 institutions that require students to submit the CSS/Financial Aid pROFiLE in addition to the FAFSA.1 The pROFiLE is an online application that is administered by the College Scholarship Service, the financial aid division of the College Board. The pROFiLE is used to determine students’ eligibility for need-based institutional scholarships, grants or loans and is a more detailed assessment of the student’s and parents’ income and assets when calculating EFC.
1. Source: College Board, participating institutions and programs.2. See financial aid office or net price calculator at your desired institution for more information about what is used to calculate awards.
FaFsaCss/FInanCIaL aID PrOFILE2
Need-based institutional aid Need-based institutional aid
Standard, universal application
Required by every institution
Looks at assets and income at a high level and uses a standard EFC formula for every applicant.
College-specific application
Considers a deeper level of income and assets when calculating EFCApplicants may be asked to report additional assets or income such as home equity, business income and assets under a sibling’s name.
Required by about 250 institutions in addition to the FAFSAmajority of schools tend to be specialized,
highly selective or private schools.
40 | INHERIT THE THINKING OF J.P. MORGAN
COLL
EGE
COST
Sfi
na
nci
al
aid
app
end
ixsa
vin
g &
inv
esti
ng
Coll
ege
mat
ter
s
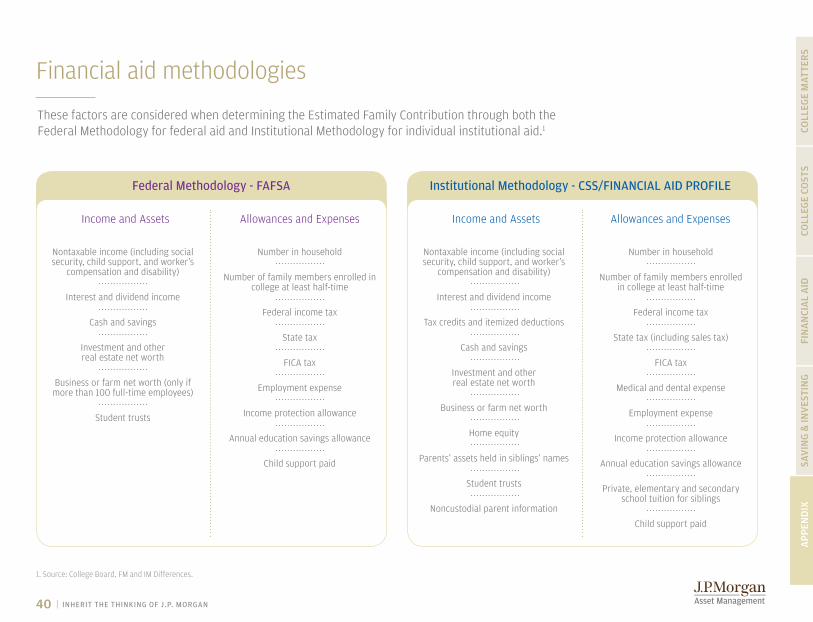
Financial aid methodologies
These factors are considered when determining the Estimated Family Contribution through both the Federal methodology for federal aid and institutional methodology for individual institutional aid.1
Federal Methodology - FAFSA Institutional Methodology - CSS/FINANCIAL AID PROFILE
Income and Assets Income and AssetsAllowances and Expenses Allowances and Expenses
Nontaxable income (including social security, child support, and worker’s
compensation and disability)
Nontaxable income (including social security, child support, and worker’s
compensation and disability)
Number in household Number in household
Number of family members enrolled in college at least half-time
Number of family members enrolled in college at least half-time
Federal income tax Federal income tax
State tax State tax (including sales tax)
FICA tax FICA tax
Employment expense
Employment expense
Medical and dental expense
Income protection allowance
Income protection allowanceAnnual education savings allowance
Annual education savings allowance
Private, elementary and secondary school tuition for siblings
Child support paid
Child support paid
Interest and dividend income Interest and dividend income
Tax credits and itemized deductionsCash and savings
Cash and savingsInvestment and other real estate net worth
Investment and other real estate net worthBusiness or farm net worth (only if
more than 100 full-time employees)
Business or farm net worth
Home equity
Parents’ assets held in siblings’ names
Noncustodial parent information
Student trusts
Student trusts
1. Source: College Board, Fm and im Differences.

41 | INHERIT THE THINKING OF J.P. MORGAN
COLL
EGE
COST
Sfi
na
nci
al
aid
app
end
ixsa
vin
g &
inv
esti
ng
Coll
ege
mat
ter
s
DETAILS ANNUAL AWARD LIMIT1
Federal student aid: A sample of grant programs
Awarded to undergraduate students with exceptional financial need
Federal pell Grant recipients receive priority
Not all colleges participate
Funds depend on availability at the college; apply by college’s deadline
For undergraduate, post-baccalaureate or graduate students who are taking or will be taking coursework necessary to become elementary or secondary teachers
must attend a participating college and meet certain academic achievement requirements
must agree to serve for a minimum of four years as a full-time teacher in a high-need field, serving low-income students
Failure to complete the teaching service commitment results in grant funds being converted to a Federal Direct Unsubsidized Stafford Loan that must be repaid
Non-need based, this grant is available to any undergraduate student who is not eligible for the pell Grant and whose parent or guardian died as a result of performing military service in iraq or Afghanistan after the events of 9/11
must have been less than 24 years old or enrolled at least part-time at the time of the parent’s or guardian’s death
Generally awarded to undergraduate students who are in financial need
2014–2015 Award Year
Federal Supplemental Educational Opportunity Grant (FSEOG)
Federal Pell Grant
Teacher Education Assistance for College and Higher Education (TEACH) Grant
Iraq and Afghanistan Service Grant
1. Awards are subject to availability of funds, and recipients must meet certain eligibility requirements. This is for informational purposes only.
up to
$5,730
up to
$5,500
up to
$4,000
up to
$4,000

42 | INHERIT THE THINKING OF J.P. MORGAN
COLL
EGE
COST
Sfi
na
nci
al
aid
app
end
ixsa
vin
g &
inv
esti
ng
Coll
ege
mat
ter
s
Loan amount based on financial need and availability of funds at college
up to
$5,500 (undergraduate)
up to
$8,000 (graduate)
$3,500–$5,500 depending on year in school
$5,500–$20,500 (minus any subsidized amount received for the same period), depending on year in school
and dependency status
Cost of attendance minus any other financial aid received
Cost of attendance minus any other financial aid received
5%
4.66%Student not charged
interest while in school and during deferment periods
4.66% for undergraduates
6.21% for graduate students
Student responsible for interest during all periods
7.21%Student responsible for interest during
all periods
7.21%Parent responsible for interest during
all periods
Federal student aid: Loan programs
Federal Perkins Loan
ELIGIBILITY INTEREST RATE1LENDER ANNUAL LOAN LIMIT
Undergraduate and graduate students enrolled
with financial need
Individual college
Undergraduate students enrolled at least half-time and demonstrating financial need
U.S. Department of Education
Undergraduate and graduate students enrolled
at least half-time
U.S. Department of Education
Parents of dependent students enrolled at least half-time
Parent must not have negative
credit history
Graduate or professional degree students enrolled
at least half-time2
Student must not have negative credit history
U.S. Department of Education
U.S. Department of Education
Direct Subsidized Stafford Loans
Direct Unsubsidized Stafford Loans
1. interest rates apply to loans first disbursed between july 1, 2014, and june 30, 2015.
2. if students have not requested the annual maximum Unsubsidized Stafford Loan amount for which they are eligible, the school must notify them of this eligibility and give them the opportunity to apply.
Direct PLUSLoan for Parents
Direct PLUSLoan for Graduate or Professional Students

43 | INHERIT THE THINKING OF J.P. MORGAN
COLL
EGE
COST
Sfi
na
nci
al
aid
app
end
ixsa
vin
g &
inv
esti
ng
Coll
ege
mat
ter
s
Federal tax credits Student loan interest deduction
Some states allow contributions to a 529 college savings plan to be deductible for state income tax purposes. Rules and deductible amounts vary by state. See page 47 for more information.
Contributions to 529 plans, Coverdell Education Savings Accounts, qualifying U.S. savings bonds and other college accounts are not typically deductible from federal taxes. However, they grow on a tax-deferred basis, and withdrawals are generally tax free for qualified expenses.
Tax-deferred college savings plans State tax deductions
The maximum deduction is
$2,500 per year.
You can claim a federal tax deduction for the interest paid on student loans taken out for yourself, your spouse or your dependents. This benefit applies to all loans used to pay higher education expenses, not just federal student loans.
• the american Opportunity Credit allows eligible taxpayers to claim up to $2,500 in qualified expenses per student per year for the first four years of college.
• the Lifetime Learning Credit allows eligible taxpayers to claim up to $2,000 in qualified expenses per student per year for an unlimited number of years of college.
Note: Taxpayers cannot claim both credits for the same student in the same year.
College-related tax breaks¹
Note: information as of August 2014. please consult a tax advisor for additional details.1. must meet certain eligibility requirements.

44 | INHERIT THE THINKING OF J.P. MORGAN
COLL
EGE
COST
Sfi
na
nci
al
aid
app
end
ixsa
vin
g &
inv
esti
ng
Coll
ege
mat
ter
s
Yes
Yes
Yes, to another member of the beneficiary’s family
Must contribute before beneficiary turns 18;
must use assets by 30
COvERDELL EDUCATION SAvINGS ACCOUNTS
Yes, for qualified expenses from
kindergarten through college
No
Yes
Yes
No
Yes
Yes, to another member of the beneficiary’s family
None
529 COLLEGE SAvINGS PLANS
Yes, for qualified higher education expenses
Yes1
Yes1
Yes
Typically more than
$300,000 per beneficiary2
$2,000 per beneficiary per year
Yes
Yes
N/A
Owner must be at least 24 when bond is issued
QUALIFYING U.S. SAvINGS BONDS
Yes, for qualified higher education expenses;
additional restrictions apply3
No gifting involved; bonds must be owned by
parents or guardians
No
No
No
No, counted as student’s assets
No
UGMA/UTMA CUSTODIAL ACCOUNTS
No, withdrawals may be taxed at
child’s and parent’s rates
No, if donor is also custodian
None3
Child assumes control at age of majority
(typically 18 or 21)
Comparing college savings options
Tax-free gifts of up to $140,000 per beneficiary in a single year
Assets intended specifically for education
Maximum contribution
Income restrictions to contribute or receive tax benefits
Minimal impact on financial aid when owned by parents
Tax-free withdrawals
Flexibility to change beneficiaries
Assets removed from taxable estate
Age restrictions on beneficiaries or contributors
1. No additional gifts can be made to the same beneficiary over a five-year period. if the donor does not survive the five years, a portion of the gift is returned to the taxable estate.
2. All contributions are subject to gift taxes where applicable.
3. Consult your tax advisor for more information.
$10,000 face value per year, per owner, per type of bond
No, gifts to child are irrevocable
No

45 | INHERIT THE THINKING OF J.P. MORGAN
COLL
EGE
COST
Sfi
na
nci
al
aid
app
end
ixsa
vin
g &
inv
esti
ng
Coll
ege
mat
ter
s
1. Earnings on non-qualified withdrawals may be subject to federal income tax and a 10% federal penalty tax, as well as state and local income taxes.
2. No additional gifts can be made to the same beneficiary over a five-year period. if the donor does not survive the five years, a portion of the gift is returned to the taxable estate.
3. Source: College Savings plan Network 2013 529 Report, march 2014.
4 . Source: Sallie mae, How America Saves for College, 2014.
a maJOr sOUrCE OF COLLEGE FUnDInGin 2013, Americans contributed $22 billion to 529 plans and withdrew $14 billion to pay higher education costs.3
BENEFIT
Tax-advantaged investing
• Tax-deferred compounding of contributions and earnings• Tax-free withdrawals for qualified higher education expenses1
• Tax-deductible contributions in some states
Estate planning benefits
• Contributions and investment gains removed from taxable estate
• Option to contribute up to five years of tax-free gifts in a single year —up to $140,000 per beneficiary from couples and $70,000 from individuals2
• The only gift that can be revoked under current laws
Control and flexibility
• Account owner retains full control over assets• Can change beneficiaries or transfer unused assets
to other family members• Covers any qualified expense at accredited schools
throughout the U.S. and overseas• minimal impact on financial aid eligibility when
owned by parents
Accessible • No income limits on contributors• No age limits on beneficiaries or contributors
Affordable• Very low investment minimums • High contribution limits, often $300,000 or more per
beneficiary
The 529 plan advantage
WHAT IT MEANS
29% of parents used a 529 plan in 20134
46 | INHERIT THE THINKING OF J.P. MORGAN
COLL
EGE
COST
Sfi
na
nci
al
aid
app
end
ixsa
vin
g &
inv
esti
ng
Coll
ege
mat
ter
s
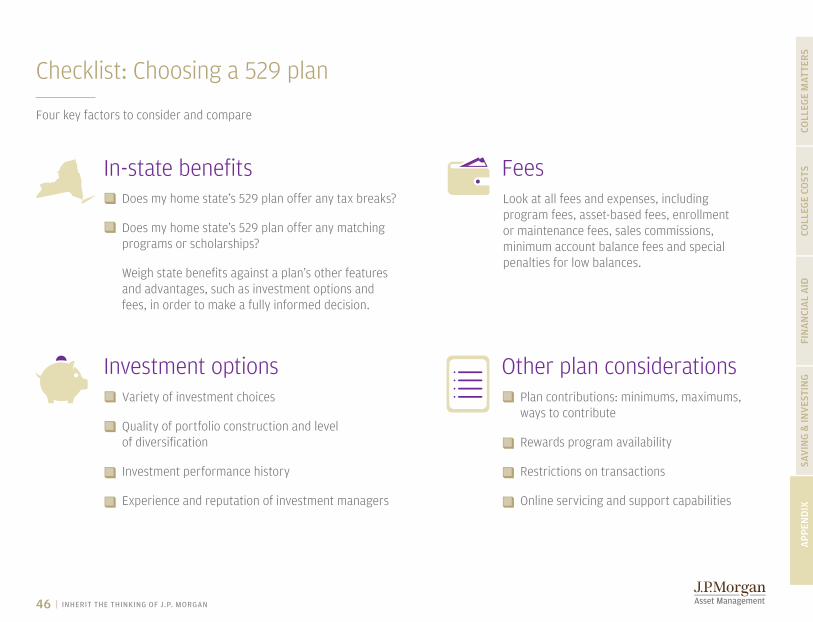
Variety of investment choices
Quality of portfolio construction and level of diversification
investment performance history
Experience and reputation of investment managers
plan contributions: minimums, maximums, ways to contribute
Rewards program availability
Restrictions on transactions
Online servicing and support capabilities
Checklist: Choosing a 529 plan
in-state benefits
investment options Other plan considerations
Does my home state’s 529 plan offer any tax breaks?
Does my home state’s 529 plan offer any matching programs or scholarships?
Weigh state benefits against a plan’s other features and advantages, such as investment options and fees, in order to make a fully informed decision.
FeesLook at all fees and expenses, including program fees, asset-based fees, enrollment or maintenance fees, sales commissions, minimum account balance fees and special penalties for low balances.
Four key factors to consider and compare
47 | INHERIT THE THINKING OF J.P. MORGAN
COLL
EGE
COST
Sfi
na
nci
al
aid
app
end
ixsa
vin
g &
inv
esti
ng
Coll
ege
mat
ter
s
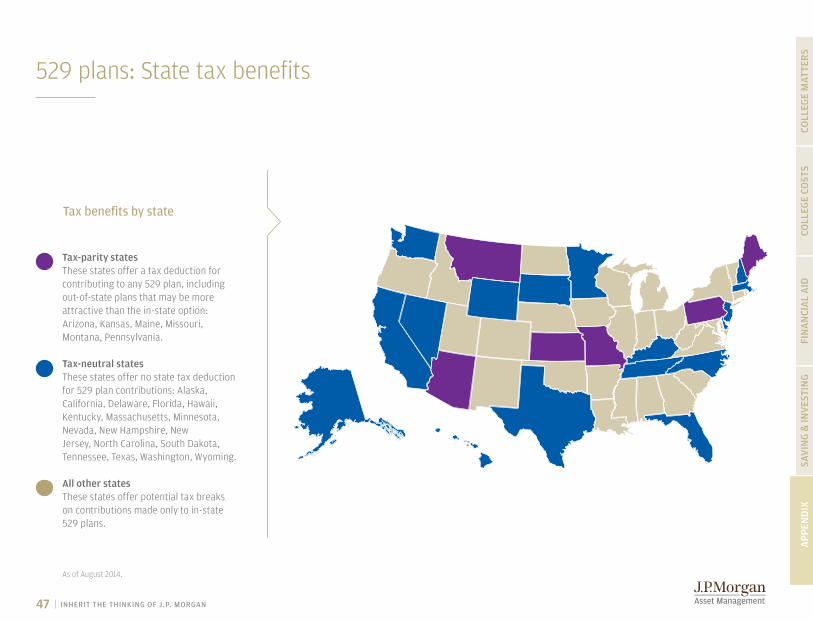
529 plans: State tax benefits
Tax benefits by state
tax-parity statesThese states offer a tax deduction for contributing to any 529 plan, including out-of-state plans that may be more attractive than the in-state option: Arizona, Kansas, maine, missouri, montana, pennsylvania.
tax-neutral statesThese states offer no state tax deduction for 529 plan contributions: Alaska, California, Delaware, Florida, Hawaii, Kentucky, massachusetts, minnesota, Nevada, New Hampshire, New jersey, North Carolina, South Dakota, Tennessee, Texas, Washington, Wyoming.
all other statesThese states offer potential tax breaks on contributions made only to in-state 529 plans.
As of August 2014.

48 | INHERIT THE THINKING OF J.P. MORGAN
COLL
EGE
COST
Sfi
na
nci
al
aid
app
end
ixsa
vin
g &
inv
esti
ng
Coll
ege
mat
ter
s
Indexes are unmanaged, and an individual cannot invest directly in an index. Index returns do not include fees or expenses.
The s&P 500 Index is widely regarded as the best single gauge of the U.S. equities market. This world-renowned index includes a representative sample of 500 leading companies in leading industries of the U.S. economy. Although the S&p 500 index focuses on the large cap segment of the market, with approximately 75% coverage of U.S. equities, it is also an ideal proxy for the total market. An investor cannot invest directly in an index.
The s&P midCap 400 Index tracks a diverse basket of medium-sized U.S. firms. A mid cap stock is broadly defined as a company with a market capitalization ranging from about $2 billion to $10 billion.
The s&P smallCap 600 Index invests in a basket of small cap equities. A small cap company is generally defined as a stock with a market capitalization between $300 million and $2 billion.
The russell 2000 Index® measures the performance of the 2,000 smallest companies in the Russell 3000 index.
The msCI® EaFE (Europe, australia, Far East) net Index is recognized as the pre-eminent benchmark in the United States to measure international equity performance. it comprises 21 mSCi country indexes, representing the developed markets outside of North America.
The msCI Emerging markets Indexsm is a free float-adjusted market capitalization index that is designed to measure equity market performance in the global emerging markets. As of june 2007, the mSCi Emerging markets index consisted of the following 25 emerging market country indices: Argentina, Brazil, Chile, China, Colombia, Czech Republic, Egypt, Hungary, india, indonesia, israel, jordan, Korea, malaysia, mexico, morocco, pakistan, peru, philippines, poland, Russia, South Africa, Taiwan, Thailand and Turkey.
The Cs/tremont Equity market neutral Index takes both long and short positions in stocks with the aim of minimizing exposure to the systematic risk of the market (e.g., a beta of zero).
* market Neutral returns for November 2008 are estimates by j.p. morgan Funds market Strategy and are based on a December 8, 2008, published estimate for November returns by CS/Tremont in which the market Neutral returns were estimated to be +0.85% (with 69% of all CS/Tremont constituents having reported return data). presumed to be excluded from the November return are three funds, which were later marked to $0 by CS/Tremont in connection with the Bernard madoff scandal. j.p. morgan Funds believes this distortion is not an accurate representation of returns in the category. CS/Tremont later published a finalized November return of -40.56% for the month, reflecting this mark-down. CS/Tremont assumes no responsibility for these estimates.
The nCrEIF Property Index is a quarterly time series composite total rate of return measure of investment performance of a very large pool of individual commercial real estate properties acquired in the private market for investment purposes only. All properties in the Npi have been acquired, at least in part, on behalf of tax-exempt institutional investors — the great majority being pension funds. As such, all properties are held in a fiduciary environment.
The FtsE narEIt EqUItY rEIt Index is designed to provide the most comprehensive assessment of overall industry performance and includes all tax-qualified real estate investment trusts (REiTs) that are listed on the NYSE, the American Stock Exchange or the NASDAQ National market List.
The Barclays Capital U.s. aggregate Index represents securities that are SEC-registered, taxable and dollar denominated. The index covers the U.S. investment-grade fixed rate bond market, with index components for government and corporate securities, mortgage pass-through securities and asset-backed securities. These major sectors are subdivided into more specific indexes that are calculated and reported on a regular basis.
The HFrI Equity market neutral Index is an equally weighted performance index. The HFRi is broken down into 33 different categories by strategy. The strategy of this index seeks to profit by exploiting inefficiencies between related equity securities, neutralizing exposure to market risk by combining long and short positions. in many cases, portfolios are structured to be market, industry, sector and dollar neutral. One example of this strategy is to build portfolios made up of long positions in the strongest companies in several industries and take corresponding short positions in those showing signs of weakness. Due to the mutual agreements with the hedge fund managers listed in the HFRi database, the index is not at liberty to disclose the particular funds behind this index.
The merrill Lynch Global Government Index tracks the performance of investment-grade sovereign debt publicly issued and denominated in the issuer’s own domestic market and currency. in order to qualify for inclusion in the index, a country (i) must be an OECD member; (ii) must have an investment-grade foreign currency long-term sovereign debt rating (based on an average of moody’s, S&p and Fitch); (iii) must have $50 billion (USD equivalent) outstanding face value of index qualifying debt (e.g., after imposing constituent level filters on amount outstanding, remaining term to maturity, etc.) to enter the index; (iv) must have at least $25 billion (USD equivalent) in outstanding face value of index qualifying debt in order to remain in the index; (v) must be available to foreign investors; and (vi) must have at least one readily available, transparent price source for its securities.
The merrill Lynch U.s. High Yield Index tracks the performance of U.S. dollar-denominated below-investment-grade corporate debt publicly issued in the U.S. domestic market. Qualifying securities must have a below-investment-grade rating (based on an average of moody’s, S&p and Fitch) and an investment-grade-rated country of risk (based on an average of moody’s, S&p and Fitch foreign currency long-term sovereign debt ratings).
The Dow Jones Industrial average measures the stock performance of 30 leading blue-chip U.S. companies.
The Dow Jones-UBs Commodity Index is composed of futures contracts on physical commodities and represents 19 separate commodities traded on U.S. exchanges, with the exception of aluminum, nickel and zinc.
index definitions

49 | INHERIT THE THINKING OF J.P. MORGAN
COLL
EGE
COST
Sfi
na
nci
al
aid
app
end
ixsa
vin
g &
inv
esti
ng
Coll
ege
mat
ter
s
Past performance is no guarantee of comparable future results.
Diversification does not guarantee investment returns and does not eliminate the risk of loss.
Bonds are subject to interest rate risks. Bond prices generally fall when interest rates rise.
The price of equity securities may rise or fall because of changes in the broad market or changes in a company’s financial condition, sometimes rapidly or unpredictably. These price movements may result from factors affecting individual companies, sectors or industries, or the securities market as a whole, such as changes in economic or political conditions. Equity securities are subject to “stock market risk,” meaning that stock prices in general may decline over short or extended periods of time.
small-capitalization investing typically carries more risk than investing in well-established “blue-chip” companies since smaller companies generally have a higher risk of failure. Historically, smaller companies’ stock has experienced a greater degree of market volatility than the average stock.
mid-capitalization investing typically carries more risk than investing in well-established “blue-chip” companies. Historically, mid cap companies’ stock has experienced a greater degree of market volatility than the average stock.
real estate investments may be subject to a higher degree of market risk because of concentration in a specific industry, sector or geographical sector. Real estate investments may be subject to risks including, but not limited to, declines in the value of real estate, risks related to general and economic conditions, changes in the value of the underlying property owned by the trust and defaults by borrower.
International investing involves a greater degree of risk and increased volatility. Changes in currency exchange rates and differences in accounting and taxation policies outside the U.S. can raise or lower returns. Also, some overseas markets may not be as politically and economically stable as the United States and other nations.
investments in emerging markets can be more volatile. As mentioned earlier, the normal risks of investing in foreign countries are heightened when investing in emerging markets. in addition, the small size of securities markets and the low trading volume may lead to a lack of liquidity, which leads to increased volatility. Also, emerging markets may not provide adequate legal protection for private or foreign investment or private property.
investments in commodities may have greater volatility than investments in traditional securities, particularly if the instruments involve leverage. The value of commodity-linked derivative instruments may be affected by changes in overall market movements, commodity index volatility, changes in interest rates or factors affecting a particular industry or commodity, such as drought, floods, weather, livestock disease, embargoes, tariffs and international economic, political and regulatory developments. Use of leveraged commodity-linked derivatives creates an opportunity for increased return but, at the same time, creates the possibility for greater loss.
investing in alternative assets involves higher risks than traditional investments and is suitable only for sophisticated investors. Alternative investments involve greater risks than traditional investments and should not be deemed a complete investment program. They are not tax efficient and an investor should consult with his/her tax advisor prior to investing. Alternative investments have higher fees than traditional investments and they may also be highly leveraged and engage in speculative investment techniques, which can magnify the potential for investment loss or gain. The value of the investment may fall as well as rise and investors may get back less than they invested.
Securities rated below investment grade are called high-yield bonds, non-investment-grade bonds, below-investment-grade bonds or junk bonds. They generally are rated in the fifth or lower rating categories of Standard & poor's and moody's investors Service. Although these securities tend to provide higher yields than higher rated securities, they may also carry more risk.
Disclosures

50 | INHERIT THE THINKING OF J.P. MORGAN
COLL
EGE
COST
Sfi
na
nci
al
aid
app
end
ixsa
vin
g &
inv
esti
ng
Coll
ege
mat
ter
s
Before you invest, consider whether your or the beneficiary's home state offers any state tax or other benefits that are only available for investments in that state's qualified tuition program.
The Comptroller of the State of New York and the New York State Higher Education Services Corporation are the program Administrators and are responsible for implementing and administering the Advisor-Guided plan. neither the state of new York nor its agencies insures accounts or guarantees the principal deposited therein or any investment returns on any amount or investment portfolio.
Ascensus Broker Dealer Services, inc. and Ascensus investment Advisors, LLC (formerly Upromise investments, inc., and Upromise investment Advisors, LLC) serve as program manager and Recordkeeping and Servicing Agent, respectively, and are responsible for day-to-day operations, including effecting transactions. j.p. morgan investment management, inc. serves as the investment manager. j.p. morgan Asset management is the marketing name for the asset management businesses of jpmorgan Chase & Co. jpmorgan Distribution Services, inc. markets and distributes the Advisor-Guided plan. jpmorgan Distribution Services, inc. is a member of FiNRA/SipC.
New York's 529 College Savings program includes two separate 529 plans. The Advisor-Guided plan is sold exclusively through financial advisors who have entered into Advisor-Guided plan selling agreements with jpmorgan Distribution Services, inc. You may also participate in the Direct plan, which is sold directly by the program and offers lower fees. However, the investment options available under the Advisor- Guided plan are not available under the Direct plan. The fees and expenses of the Advisor-Guided plan include compensation to the financial advisor. Be sure to understand the options available before making an investment decision.
For more information about new York's 529 advisor-Guided College savings Program, you may contact your financial advisor or obtain an advisor-Guided Plan Disclosure Booklet and tuition savings agreement at www.ny529advisor.com or by calling 1-800-774-2108. this document includes investment objectives, risks, charges, expenses, and other information. You should read and consider it carefully before investing.
The program Administrators, the program manager and jpmorgan Distribution Services, inc., and their respective affiliates do not provide legal or tax advice. This information is provided for general educational purposes only. This is not to be considered legal or tax advice. investors should consult with their legal or tax advisors for personalized assistance, including information regarding any specific state law requirements.
Disclosures
NOT FDiC iNSURED | NO BANK GUARANTEE | mAY LOSE VALUE

New York’s 529 Advisor-Guided College Savings program
Entrust your college fund to one of the world’s largest, most respected financial institutions. The Advisor-Guided plan is the only 529 plan offering you full access to the insights and investments of j.p. morgan.
rEasOns tO COnsIDEr tHE aDvIsOr-GUIDED PLan
• Investment options from j.p. morgan Asset management and State Street Global Advisors
• State tax deductions for account owners living or working in New York1
• High contribution limit of $375,000 per beneficiary
• Upromise® rewards program turns everyday purchases into funds for college
1. Deductions may be subject to recapture in certain circumstances, such as rollovers to another state’s plan or non-qualified withdrawals.
2. As of 9/30/14.
Investment choices
• One age-based portfolio with six different asset mixes between newborn and college age
• Seven asset allocation portfolios pursuing different risk/return objectives
• Sixteen individual portfolios for building your own custom-tailored investment solution
Broad diversification
• Access to asset classes and investment strategies not often found in 529 plans
• potential for higher returns and lower risk than less diversified portfolios
Expert management
Oversight by j.p. morgan’s Global multi-Asset Group
• Dedicated team of more than 100 professionals2
• more than $134 billion in global assets under management2
• Builds plan portfolios, selects investments and makes adjustments as market conditions change over time
to learn more, please consult a financial advisor, visit ny529advisor.com or call 1-800-774-2108.