글로벌 경제 및 투자전략 - schroders...글로벌 경제 및 투자전략 keith wade chief...
TRANSCRIPT

1
판매회사 임직원용 한정
본 자료는 판매회사임직원에 한정하여 정보제공 목적으로만 작성되었으므로 투자권유를 위한 목적으로 사용될 수 없으며, 최종 투자자에게
배포될 수 없습니다. 본 자료는 영어 원문의 국문 번역본입니다. 영어 원문과 차이가 있을 경우 영어 원문이 우선합니다. 해당 영어 원문은
www.schroderstalkingpoint.com 에서 다운로드 할 수 있습니다. 슈로더 준법감시인 승인 (2016-185)
슈로더 글로벌 경제 및 투자전략
Keith Wade Chief Economist and Strategist
Azad Zangana Senior European Economist and Strategist
Craig Botham Emerging Markets Economist
글로벌 전망: 성장 레이스 (페이지 2)
당사는 미국과 유로존에 대한 불확실성으로 금년 세계 경제성장률을 2.5%에서 2.3%으로 하향 조정하였습니다. 또한 경제회복으로 좋은 흐름을 보이고 있는 이머징마켓에 대한 전망치는 기존과 같이 유지하기로 하였습니다. 2017 년 세계 경제성장률은 2.6%에 그칠 것으로 전망합니다.
그럼에도 불구하고, 미국 연방준비제도가 발표한 경제활동 및 인플레이션률은 참조하면 2016 년 12 월에 금리인상을 위한 여건이 강화되었다고 생각합니다. 인플레이션율이 목표치에 부합할수록 미국 중앙은행은 2017 년에 통화긴축으로 전환 할 것으로 예상됩니다. 미국 외 중앙은행들은 통화완화 정책을 내세우고 있으며 이는 시장을 확대시키기 위한 것으로 해석됩니다.
당사의 시나리오는 기존과 동일하게 영속적인 글로벌 장기침체를 국면할 것으로 예상합니다. 혼란 속에서도 글로벌 리플레이션과 정책완화가 재무상들이 아닌 중앙은행들로부터 동시에 야기되고 있어 최악의 상황은 아닌 것으로 보입니다.
유럽 전망: 최대 브론즈 메달 (페이지 7)
유로존 전망은 소폭 수정하였으며 프랑스와 이탈리아에는 실망감을 보이고 있습니다. 경제를 옥죄고 있는 이탈리아 은행들의 부실채권 규모가 크게 늘었다는 분석에 실망감을 보이는 가운데 유럽중앙은행의 경우 추가적인 금융완화 의지를 확인하였으며 양적완화 연장여부도 고려될 것으로 보입니다.
영국의 경우 브렉시트 이후 시장의 예상보다 잘 버티고 있습니다. 당사는 영국에 대한 경제전망을 기존과 동일하게 정치적 불확실성에 직면해 있으며 전반적인 경제는 하향조정될 것이라고 생각합니다. 영란은행은 금리를 낮추고 양적완화를 다시 이행하겠다는 의지를 밝혔으나 시장에 큰 영향을 없을 것이며 추가적인 재정정책을 요구 할 것으로 생각됩니다.
이머징마켓 전망: 빠르고 높고 강하게 (페이지 14)
전반적으로 이머징마켓의 성과는 좋은 모습을 보이고 있습니다. 중국의 경우 급상승세를 보이다 주춤하는 모습을 보이고 있으며 러시아의 경우 방향성을 잡지 못하고 있습니다. 브라질 경제의 경우 부활 조짐을 보이는 가운데 인도의 경우 세금개혁으로 혼란을 겪고 있습니다.
한 눈에 보는 전망 (페이지 18)
당사의 거시 전망 및 글로벌 경제에 대한 위험 요인의 짦은 요약
차트: Chart: 스퀘어루트 이후 쉬지 않는 회복
Source: Thomson Datastream, Schroders Economics Group. 15 August 2016. Please note the forecast warning at the back of the document.
4.9
2.6
3.1
3.8
4.94.5
5.1 5.1
2.3
-1.0
4.8
3.5
2.6 2.6 2.8 2.62.3
2.6
-3
-2
-1
0
1
2
3
4
5
6
00 01 02 03 04 05 06 07 08 09 10 11 12 13 14 15 16 17
Contributions to World GDP growth (y/y), %
US Europe Japan Rest of advanced
BRICS Rest of emerging World
Forecast

2
판매회사 임직원용 한정
본 자료는 판매회사임직원에 한정하여 정보제공 목적으로만 작성되었으므로 투자권유를 위한 목적으로 사용될 수 없으며, 최종 투자자에게
배포될 수 없습니다. 본 자료는 영어 원문의 국문 번역본입니다. 영어 원문과 차이가 있을 경우 영어 원문이 우선합니다. 해당 영어 원문은
www.schroderstalkingpoint.com 에서 다운로드 할 수 있습니다. 슈로더 준법감시인 승인 (2016-185)
글로벌 전망: 성장 레이스
세계경제성장률은
선진국의
하향국면에 따라
조정되었습니다
미국에서는
인플레이션에
대한 압박이
높아졌습니다
“There are limits to what monetary policy can and, indeed, should do. The burden must also fall on fiscal and other policies to do their part to help create conditions conducive to economic stability”.
John C. Williams, President and Chief Executive Officer of the Federal Reserve Bank of San Francisco, 15 August 2016
Our forecast for global growth in 2016 has been revised down from 2.5% to 2.3%. Reductions in our forecasts for the US and the Eurozone are partially offset by increases to Japan and the UK. Meanwhile, the forecast for the emerging markets (EM) remains unchanged. Our global growth forecast for 2017 remains at 2.6%: there is no break from the square-root-recovery, with the world economy stuck with activity at around 2.5%, half its pre-crisis level.
Disappointing growth in the developed markets (DM) is driving the downgrade to 2016 growth with much of this reflecting US data for Q2 where destocking has taken the shine off an otherwise strong quarter for households. Europe has remained relatively resilient, while the UK is preparing for a barrage of weak data as a consequence of the vote to leave the EU.
By way of contrast there are signs of revival in the EM with the purchasing managers’ index picking up in June and July following a period in the doldrums (see chart 1). Significant improvements were seen in China, Taiwan and Brazil. From a sector perspective there are signs that the weakness in manufacturing is lifting as a result of a turn in the inventory cycle, a development t should be felt in supply chains in the EM.
차트 1: 이머징마켓 활기를 찾다
Source: Thomson Datastream, Schroders Economics Group, 15 August 2016.
The global inflation forecast is broadly unchanged with lower DM forecasts offset by higher EM projections in 2016 and 2017. A combination of weaker exchange rates, looser monetary policy and sticky prices account for the increase in EM inflation. Lower-than-expected oil prices have helped depress the DM figures for 2016.
The inflation outlook for the US differs somewhat as the economy is ahead in the cycle and we have raised our inflation forecast for 2017 to 2.3% (previously 2.1%). This reflects an increase in our projection for core inflation as a result of the decline in the US dollar (USD) and evidence of higher wage growth. The employment cost index picked up to 2.5% year-on-year in Q2 and, although the
35
40
45
50
55
60
2006 2007 2008 2009 2010 2011 2012 2013 2014 2015 2016
Markit PMI composites (output)
Developed markets Emerging markets
3
판매회사 임직원용 한정
본 자료는 판매회사임직원에 한정하여 정보제공 목적으로만 작성되었으므로 투자권유를 위한 목적으로 사용될 수 없으며, 최종 투자자에게
배포될 수 없습니다. 본 자료는 영어 원문의 국문 번역본입니다. 영어 원문과 차이가 있을 경우 영어 원문이 우선합니다. 해당 영어 원문은
www.schroderstalkingpoint.com 에서 다운로드 할 수 있습니다. 슈로더 준법감시인 승인 (2016-185)
미 연준 긴축적
12월에 통화정책,
하지만 다른
중앙은행들은
저금리정책에
나서고 있다
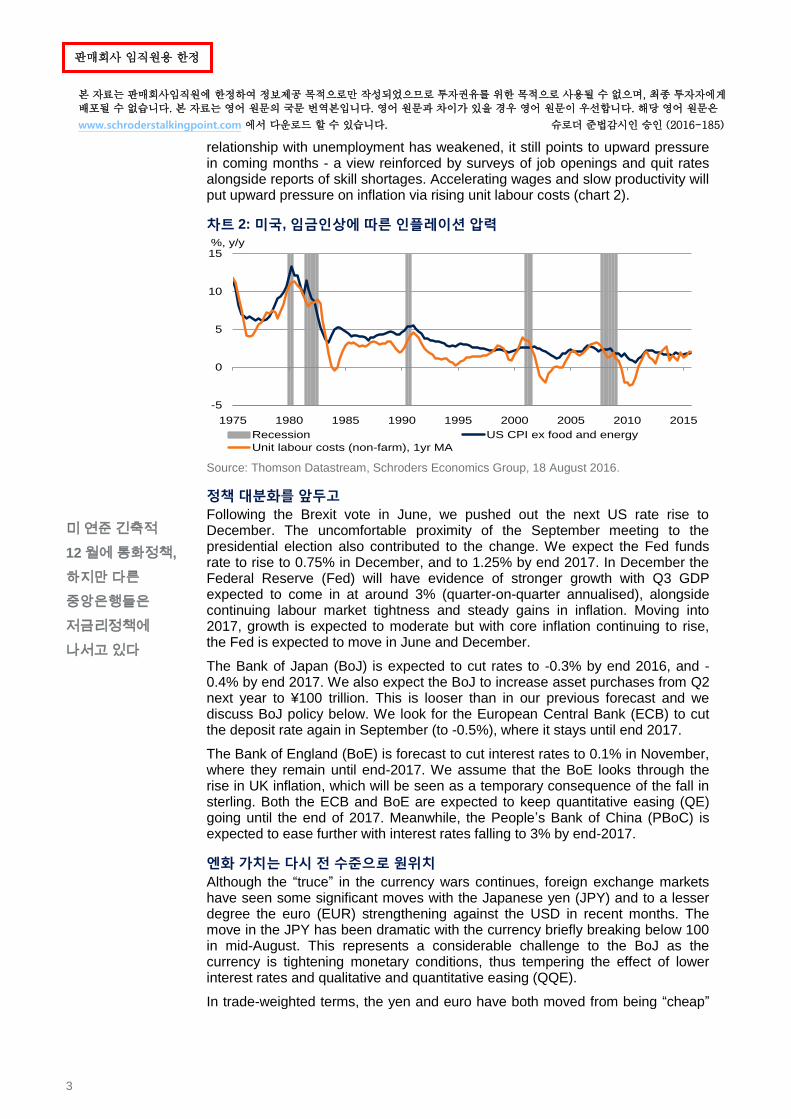
relationship with unemployment has weakened, it still points to upward pressure in coming months - a view reinforced by surveys of job openings and quit rates alongside reports of skill shortages. Accelerating wages and slow productivity will put upward pressure on inflation via rising unit labour costs (chart 2).
차트 2: 미국, 임금인상에 따른 인플레이션 압력
Source: Thomson Datastream, Schroders Economics Group, 18 August 2016.
정책 대분화를 앞두고
Following the Brexit vote in June, we pushed out the next US rate rise to December. The uncomfortable proximity of the September meeting to the presidential election also contributed to the change. We expect the Fed funds rate to rise to 0.75% in December, and to 1.25% by end 2017. In December the Federal Reserve (Fed) will have evidence of stronger growth with Q3 GDP expected to come in at around 3% (quarter-on-quarter annualised), alongside continuing labour market tightness and steady gains in inflation. Moving into 2017, growth is expected to moderate but with core inflation continuing to rise, the Fed is expected to move in June and December.
The Bank of Japan (BoJ) is expected to cut rates to -0.3% by end 2016, and -0.4% by end 2017. We also expect the BoJ to increase asset purchases from Q2 next year to ¥100 trillion. This is looser than in our previous forecast and we discuss BoJ policy below. We look for the European Central Bank (ECB) to cut the deposit rate again in September (to -0.5%), where it stays until end 2017.
The Bank of England (BoE) is forecast to cut interest rates to 0.1% in November, where they remain until end-2017. We assume that the BoE looks through the rise in UK inflation, which will be seen as a temporary consequence of the fall in sterling. Both the ECB and BoE are expected to keep quantitative easing (QE) going until the end of 2017. Meanwhile, the People’s Bank of China (PBoC) is expected to ease further with interest rates falling to 3% by end-2017.
엔화 가치는 다시 전 수준으로 원위치
Although the “truce” in the currency wars continues, foreign exchange markets have seen some significant moves with the Japanese yen (JPY) and to a lesser degree the euro (EUR) strengthening against the USD in recent months. The move in the JPY has been dramatic with the currency briefly breaking below 100 in mid-August. This represents a considerable challenge to the BoJ as the currency is tightening monetary conditions, thus tempering the effect of lower interest rates and qualitative and quantitative easing (QQE).
In trade-weighted terms, the yen and euro have both moved from being “cheap”
-5
0
5
10
15
1975 1980 1985 1990 1995 2000 2005 2010 2015
%, y/y
Recession US CPI ex food and energy
Unit labour costs (non-farm), 1yr MA

4
판매회사 임직원용 한정
본 자료는 판매회사임직원에 한정하여 정보제공 목적으로만 작성되었으므로 투자권유를 위한 목적으로 사용될 수 없으며, 최종 투자자에게
배포될 수 없습니다. 본 자료는 영어 원문의 국문 번역본입니다. 영어 원문과 차이가 있을 경우 영어 원문이 우선합니다. 해당 영어 원문은
www.schroderstalkingpoint.com 에서 다운로드 할 수 있습니다. 슈로더 준법감시인 승인 (2016-185)
강한 엔화 그리고
통화정책에 대한
실망감은
일본은행에 추가
완화정책을
요구하다
to “fair” on our box and whisker analysis, with the former threatening to move into expensive territory (see chart 3).
차트 3: 환율전쟁 – 일본 엔화는 더이상 저렴하지 않다
Source: Thomson Datastream , Schroders Economics Group. 15 August 2016.
In our previous forecast we had assumed that the BoJ would refrain from further rate cuts and although that has proven correct with the central bank disappointing expectations of easing in July, we now see scope for further action. Alongside the strength of the JPY, this also reflects the recently announced fiscal package, which we thought would provide a bigger boost to activity. Clearly, Prime Minister Shinzo Abe is still looking to the BoJ to provide further stimulus and the forthcoming review of monetary policy is expected to deliver more easing when the BoJ meets on 20–21 September. We would not hold our breath as the BoJ is already close to full tilt with monetary policy, but we would see this as another step on the long march toward helicopter money.
For the emerging markets, we have seen some of the extremes of last year reversed with the Brazilian real (BRL) strengthening and Chinese yuan (CNY) weakening. The decision by the Fed to pullback from rate hikes earlier in the year has clearly played a role in the BRL recovery by encouraging investors back into carry trades. Meanwhile, the Chinese authorities have been quietly nudging the CNY lower.
Looking ahead, it is possible that the dollar correction will continue with the currency softening further. However, our rate outlook points to a positive environment for the USD which is expected to strengthen over the forecast period as a result of policy divergence. This would take it further into the upper quartile of its ten year range, whilst the JPY, EUR and GBP drop back. The danger for the Fed is that mere talk of higher rates leads to a significant increase in the USD and greater financial market volatility (potentially resulting in a re-run of Q1 this year). It may then have to back track on rates to prevent monetary conditions tightening by more than desired.
점진적으로 재정 정책에 주목하다
Meanwhile, the debate over a move to fiscal policy will continue. Whilst we see further action by central banks, little impact on the real economy can be expected. The BoE’s QE programme is already running into limits in buying long dated bonds, but more fundamentally, as we have argued before, the monetary transmission mechanism is broken such that lower interest rates or increased QE have little effect on the real economy. The quote from San Francisco Fed President Williams is from a paper where he argues that the framework for monetary policy needs to change and other sources of stimulus should be
-3
-2
-1
0
1
2
3
4
EUR JPY GBP USDLower quartile
Upper quartile
Current nominal TW exchange rate (10yr z-score)
Last year
Expensive
Cheap-3
-2
-1
0
1
2
3
RUB BRL INR CNYUpper quartile
Lower quartile
Current nominal TW exchange rate (10yr z-score)
Last year
Expensive
Cheap

5
판매회사 임직원용 한정
본 자료는 판매회사임직원에 한정하여 정보제공 목적으로만 작성되었으므로 투자권유를 위한 목적으로 사용될 수 없으며, 최종 투자자에게
배포될 수 없습니다. 본 자료는 영어 원문의 국문 번역본입니다. 영어 원문과 차이가 있을 경우 영어 원문이 우선합니다. 해당 영어 원문은
www.schroderstalkingpoint.com 에서 다운로드 할 수 있습니다. 슈로더 준법감시인 승인 (2016-185)
1 http://www.frbsf.org/economic-research/publications/economic-letter/2016/august/monetary-policy-and-low-r-star-natural-rate-of-interest/?utm_source=mailchimp&utm_medium=email&utm_campaign=economic-letter-2016-08-15.
장기적 침체
시나리오 다시
부각
explored, topics that will no doubt feature significantly at the forthcoming Jackson Hole conference
1.
Despite this, we have not built much in the way of fiscal ease into the forecast beyond Abe’s package in Japan and to some extent the UK (where fiscal policy will be “reset” in the autumn). For the US, the political cycle argues against significant fiscal ease in year one of the new administration. Hillary Clinton has indicated that she would increase spending, but also raise taxes and we would expect a gradual easing of fiscal policy through her presidency. This would be different should we get a surprise Donald Trump victory – with a massive fiscal boost in prospect as tax rates are slashed.
In the Eurozone, fiscal policy has moved from being restrictive to more neutral. Austerity is over, but it is not clear that there is a willingness to go beyond this to a more expansive stance. We recently saw the rules on budget deficits relaxed for Portugal and Spain, but there is no sign that Germany and the core countries recognise the case for a fiscal boost.
시나리오 및 위험 밸런스
We have reviewed and updated our scenarios and are making one change: we are dropping the “China hard landing” scenario and adding “secular stagnation”. We still see a risk of a hard landing in China, but not a significant one within the timeframe of our scenarios which would require the event to start within the next two quarters. We also believe that the authorities have the means to deal with most short-term dips in the economy by adding stimulus. We remain concerned about the build up of debt in China and believe that the authorities will have to find a means of resolution, but this is a multi-year process.
In the meantime, we are bringing back the “secular stagnation” scenario where weak demand weighs on global growth as households and corporates are reluctant to spend, animal spirits remain muted and capital expenditure and innovation stay depressed. Supply side adjustment is slow with over capacity persisting around the world, particularly in China, with the result that commodity prices and inflation are also subdued. There are elements of the baseline here, but this scenario takes them to a greater extreme with considerably weaker capital investment such that global growth and inflation are some 0.5% lower in 2017 than in the base case (see chart 4).
차트 4: 시나리오 VS 베이스라인
Source: Schroders Economics Group. 15 August 2016. Please note the forecast warning at the back of the document.
Currency wars return
Global reflation
US recession
Secular stagnation
Trade wars
Baseline
US wages accelerate
Brexit shakes Europe
-1.0
-0.5
+0.0
+0.5
+1.0
-1.5 -1.0 -0.5 +0.0 +0.5 +1.0 +1.5
2017
Infla
tion
vs. b
asel
ine
fore
cast
2017 Growth vs. baseline forecast
Stagflationary Reflationary
Productivity boostDeflationary

6
판매회사 임직원용 한정
본 자료는 판매회사임직원에 한정하여 정보제공 목적으로만 작성되었으므로 투자권유를 위한 목적으로 사용될 수 없으며, 최종 투자자에게
배포될 수 없습니다. 본 자료는 영어 원문의 국문 번역본입니다. 영어 원문과 차이가 있을 경우 영어 원문이 우선합니다. 해당 영어 원문은
www.schroderstalkingpoint.com 에서 다운로드 할 수 있습니다. 슈로더 준법감시인 승인 (2016-185)
위험밸런스는
디플레이션에
기울어 있습니다
Although classified as deflationary we should add that the secular stagnation scenario differs from “US recession”, “Brexit shakes Europe” (and the previous “China hard landing”) as it represents a chronic condition for the world economy. Rather than an acute, one-off hit to growth, secular stagnation represents a slow grind lower in activity.
In terms of probabilities, the balance of risks is skewed toward deflation with “secular stagnation”, “US recession” and “Brexit shakes EU” all taking global growth and inflation lower in 2017 (see chart 5 and table 1). Note that the increase in probability on deflation risks compared with our last scenario analysis in May is largely due to a reclassification of the “Brexit shakes EU” scenario from stagflation.
On the other side of the coin we retain our two reflationary scenarios: “global reflation” and “US wages accelerate” where growth is stronger than in the baseline. The former represents a co-ordinated fiscal expansion by the major economies, whilst the latter assumes that wages pick-up sharply in the US, adding to demand in the near-term.
On the stagflation side, we retain our “trade wars” scenario where the US turns protectionist and pushes up tariffs on its trading partners, tearing up North American Free Trade agreement (NAFTA) in the process. The “currency wars” scenario is also seen as mildly stagflationary, although is close to a zero sum game.
차트 5: 시나리오 확률
Source: Schroders Economics Group. 15 August 2016. Please note the forecast warning at the back of the document.
테이블 1: 확률 밸런스 시나리오 vs 베이스라인
Scenario Probability August 2016, %
Probability May 2016, %
Change, %
Stagflationary 13 20 -7
Deflationary 23 7 +16
Reflationary 13 10 +3
Productivity boost 0 0 0
Baseline 50 60 -10
Source: Schroders Economics Group. 15 August 2016. Previous forecast from June 2016. Please note the forecast warning at the back of the document.
Baseline, 50%
Currency wars return, 5%
Global reflation, 7%
Trade wars, 8%
US recession, 5%
Secular stagnation, 10%
US wages accelerate, 6%
Brexit shakes Europe, 8%Other, 1%

7
판매회사 임직원용 한정
본 자료는 판매회사임직원에 한정하여 정보제공 목적으로만 작성되었으므로 투자권유를 위한 목적으로 사용될 수 없으며, 최종 투자자에게
배포될 수 없습니다. 본 자료는 영어 원문의 국문 번역본입니다. 영어 원문과 차이가 있을 경우 영어 원문이 우선합니다. 해당 영어 원문은
www.schroderstalkingpoint.com 에서 다운로드 할 수 있습니다. 슈로더 준법감시인 승인 (2016-185)

8
판매회사 임직원용 한정
본 자료는 판매회사임직원에 한정하여 정보제공 목적으로만 작성되었으므로 투자권유를 위한 목적으로 사용될 수 없으며, 최종 투자자에게
배포될 수 없습니다. 본 자료는 영어 원문의 국문 번역본입니다. 영어 원문과 차이가 있을 경우 영어 원문이 우선합니다. 해당 영어 원문은
www.schroderstalkingpoint.com 에서 다운로드 할 수 있습니다. 슈로더 준법감시인 승인 (2016-185)
유로존 전망 업데이트: 최대 브론즈 메달
유로존 성장률은
2 분기 부진한
모습을 보이고
있다.
프랑스와
이탈리아가
실망감을
안겨주었습니다
독일과 스페인은
회복 조짐을
보였습니다.
The Eurozone and UK growth forecasts are largely unchanged this quarter, with some small disappointments in France and Italy. We discuss the latest developments including the Italian banking system’s woes, the European Central Bank’s options as it runs out of bonds to buy, and the Bank of England’s latest policy shift.
유로존 성장률 둔화
Eurozone real GDP growth fell back to 0.3% in the second quarter compared to the strong 0.6% recorded in the first quarter. This was largely expected as growth in the first quarter was exceptional for the monetary union (chart 6).
차트 6: 유로존 2 분기 성장률 둔화
Source: Eurostat, Schroders Economics Group. 17 August 2016.
Within member states, France reported no GDP growth for the second quarter. We had expected a slowdown as growth in the first quarter had rebounded from the lull at the end of 2015, following the Paris terrorist attacks. However, to flat-line altogether is disappointing, and suggests worsening fortunes. Indeed, the French statistics agency (INSEE) reported a significant drop in domestic demand following three strong quarters. Consumption was flat, while investment contracted slightly. Exports fell marginally, but imports fell more sharply, leading to a positive contribution from net trade, and offsetting the weakness in domestic demand.
A more encouraging development in the French data was the destocking that took place in the second quarter. A sharp reduction in inventories shaved 0.4 percentage points from the headline GDP figure, but this suggests that inventories are now at a lower, healthier level, reducing the need for further destocking in coming quarters. However, the tragic events in Nice on 14 July may temporarily weigh on activity in the third quarter, as the Paris attacks did at the end of 2015.
Meanwhile, Germany saw growth moderate, as quarterly GDP growth fell from 0.7% to 0.4%, although the consensus had expected a larger slowdown to 0.2%. A detailed GDP breakdown is not available at the time of writing, but it appears that a contraction in investment was the main cause of the drag on growth. Some destocking may have also occurred, but otherwise, household demand remained firm.
-0.2
0.0
0.2
0.4
0.6
0.8
1.0
Ita Fra Aus Por Gre EZ19 Ger Bel UK Neth Spa
%, q/q
Q1 Q2

9
판매회사 임직원용 한정
본 자료는 판매회사임직원에 한정하여 정보제공 목적으로만 작성되었으므로 투자권유를 위한 목적으로 사용될 수 없으며, 최종 투자자에게
배포될 수 없습니다. 본 자료는 영어 원문의 국문 번역본입니다. 영어 원문과 차이가 있을 경우 영어 원문이 우선합니다. 해당 영어 원문은
www.schroderstalkingpoint.com 에서 다운로드 할 수 있습니다. 슈로더 준법감시인 승인 (2016-185)
이탈리아 은행들,
불안의 핵
경기둔화에 따른
부실채권 증가
Elsewhere, Spain matched expectations by growing by 0.7%, marginally lower than the 0.8% recorded in the first quarter. An expenditure breakdown is not yet available, but the figures highlight the resilience of the Spanish economy, which in June lowered its unemployment rate below 20% for the first time since May 2010.
Like France, Italy and Austria also failed to generate any growth in the second quarter. This is a problem for Italy in particular as the government is dealing with a mini banking crisis, while trying to win support for a referendum on political reform.
이탈리아 은행권 진퇴양난
Italy’s banking system has seen a general uptrend in non-performing loans (NPLs), despite falling interest rates on the vast majority of them. Italian loans are mostly arranged using a tracker interest rate, where the interest rate paid is derived from the interbank market (euribor) plus a fixed spread. Therefore, as the European Central Bank has cut interest rates over recent years, those loans should have become easier to service. However, a severe lack of real growth and a deflationary environment has meant that many borrowers (households and corporates) have struggled to service their debt. According to the Bank of Italy, NPLs as a share of total loans have risen from 10.5% in 2011 to 17.8% in the first quarter of 2016. This is while the NPL ratio for the European Union as a whole is declining according to the European Banking Authority (EBA).
In its regular assessment of the health of the European banking system, the EBA looks at a wide range of indicators, including the profitability of banks, the Tier 1 capital ratio, and provisioning against bad loans (known as the coverage of NPL ratio). Ideally, banks with elevated NPLs would hold additional reserves to cover their potential losses. Not all non-performing loans default, and even when they do, there is still some recovery of assets. Therefore, there is no need to have very high coverage of NPL ratios.
Chart 7 shows the latest NPL ratios plotted against the coverage ratios for all EU member states, excluding Greece and Cyprus (given their exceptional circumstances). Compared to the EU average, Italy currently has a much higher NPL ratio (17.8% vs. 5.7%), and only has a slightly higher coverage ratio (46% vs. 44%). Other countries that look vulnerable on these metrics are Portugal and Ireland. Portugal is also seeing rises in NPLs, putting pressure on its banking system. Ireland has seen NPLs fall recently, helped by much higher GDP growth.
차트 7: 유럽 부실채권 vs 커버리지
ItalyEU averages
Portugal
Ireland
20%
30%
40%
50%
60%
70%
0% 5% 10% 15% 20% 25%
Non-performing loans as % of total loans (Q1 2016)
Coverage of NPLs ratio (Q1 2016)

10
판매회사 임직원용 한정
본 자료는 판매회사임직원에 한정하여 정보제공 목적으로만 작성되었으므로 투자권유를 위한 목적으로 사용될 수 없으며, 최종 투자자에게
배포될 수 없습니다. 본 자료는 영어 원문의 국문 번역본입니다. 영어 원문과 차이가 있을 경우 영어 원문이 우선합니다. 해당 영어 원문은
www.schroderstalkingpoint.com 에서 다운로드 할 수 있습니다. 슈로더 준법감시인 승인 (2016-185)
유로 베일인 제도가
이탈리아 은행
베일아웃을 발목을
잡고 있습니다
하지만 앞으로의
실질성장률이 주요
불안요소 입니다
유로존 성장률은
소폭 하락
하였습니다
인플레이션 전망도
마찬가지
Source: European Banking Authority. Schroders Economics Group. 18 August 2016.
The main culprit for Italy’s woes is the oldest bank in the world, Banca Monte dei Paschi di Siena (MPS). Its NPL ratio was 31% at the end of 2015, which made the bank very vulnerable to the EBA’s stress tests at the end of July. In the adverse scenario, the bank had the worst-end point capital position of any European bank. MPS’s common equity Tier 1 ratio deteriorated by 14 times the average deterioration, leaving it with a negative position (effectively bust in this exercise). Other banks also struggled, such as Ireland’s AIB which had the second biggest fall, but it would simply need additional capital to safeguard its business, whereas MPS needs major help.
Complicated by EU rules on state aid and bail-ins of investors in the event a bank needs to be bailed out, the Italian government found itself between a rock and a hard place. MPS desperately needed a bail-out to satisfy regulators, but the Italian government did not want to bail-in bond-holders, who were essentially retail savers. Banking bonds had become very popular saving vehicles amongst households, attracted by the higher yields on offer, but perhaps not in the full understanding that their capital was at risk.
Instead, a private sector solution was found for MPS which was announced just before the publication of the EBA’s stress test results. MPS’s NPLs would be sold to a conglomerate of international banks at 33 cent in the euro, with the bank also announcing that it would raise fresh capital through a new share issue. Of course, this hit not only MPS’s share price, but also that of other Italian banks, especially due to the low valuation on MPS’s NPLs.
Italy’s NPL problem is a direct result of its chronic low growth. There is also an issue over the very long recovery period given Italy’s bankruptcy laws which needs reform. If Italy does not implement sufficient structural reforms to speed up NPL resolution and measures to boost growth, then the outlook for the banking sector will be bleak, especially as the ECB seems ready to keep interest rates in negative territory for some time, thereby compounding the problems for the banking sector’s profitability (for more on the latter, see the April Economics and Strategy Viewpoint).
유로존 전망 업데이트: 최대 브론즈 메달
Our forecast for Eurozone growth has been downgraded slightly for 2016 from 1.6% to 1.5%, while the 2017 forecast has been left unchanged at 1.3%. The main reason for the downgrades was the recent weaker growth numbers for both France and Italy. France is now forecast to grow at the slower pace of 1.2% this year, before slowing further to 0.7% in 2017. Italy has also been downgraded to 0.6% for both 2016 and 2017 (table 2).
테이블 2: 유로존 GDP 전망
2016 Previous 2017 Previous
Germany 1.7 1.8 1.8 1.7
France 1.2 1.4 0.7 0.8
Italy 0.6 0.8 0.6 0.8
Spain 2.9 2.9 2.3 2.3
Eurozone 1.5 1.6 1.3 1.3
Source: Schroders Economics Group. 15 August 2016. Previous forecast from June 2016. Please note the forecast warning at the back of the document.
11
판매회사 임직원용 한정
본 자료는 판매회사임직원에 한정하여 정보제공 목적으로만 작성되었으므로 투자권유를 위한 목적으로 사용될 수 없으며, 최종 투자자에게
배포될 수 없습니다. 본 자료는 영어 원문의 국문 번역본입니다. 영어 원문과 차이가 있을 경우 영어 원문이 우선합니다. 해당 영어 원문은
www.schroderstalkingpoint.com 에서 다운로드 할 수 있습니다. 슈로더 준법감시인 승인 (2016-185)
유럽중앙은행이
예금금리를 -0.5%
까지 낮출 가능성도
있습니다
2017 년에는
양적완화 확대
정책에 대한 고려도
필요합니다
The forecast for Germany is largely unchanged and only includes a small re-profiling of quarterly growth. Similarly, the forecast for Spain has not been changed.
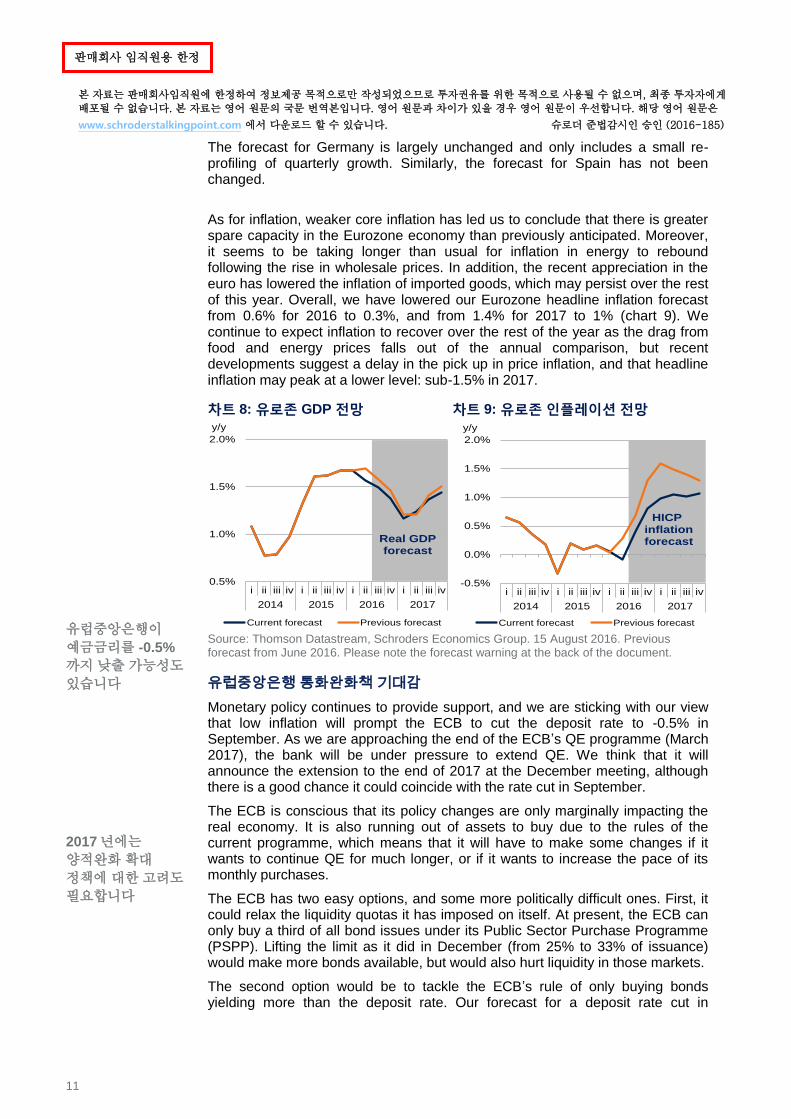
As for inflation, weaker core inflation has led us to conclude that there is greater spare capacity in the Eurozone economy than previously anticipated. Moreover, it seems to be taking longer than usual for inflation in energy to rebound following the rise in wholesale prices. In addition, the recent appreciation in the euro has lowered the inflation of imported goods, which may persist over the rest of this year. Overall, we have lowered our Eurozone headline inflation forecast from 0.6% for 2016 to 0.3%, and from 1.4% for 2017 to 1% (chart 9). We continue to expect inflation to recover over the rest of the year as the drag from food and energy prices falls out of the annual comparison, but recent developments suggest a delay in the pick up in price inflation, and that headline inflation may peak at a lower level: sub-1.5% in 2017.
차트 8: 유로존 GDP 전망 차트 9: 유로존 인플레이션 전망
Source: Thomson Datastream, Schroders Economics Group. 15 August 2016. Previous forecast from June 2016. Please note the forecast warning at the back of the document.
유럽중앙은행 통화완화책 기대감
Monetary policy continues to provide support, and we are sticking with our view that low inflation will prompt the ECB to cut the deposit rate to -0.5% in September. As we are approaching the end of the ECB’s QE programme (March 2017), the bank will be under pressure to extend QE. We think that it will announce the extension to the end of 2017 at the December meeting, although there is a good chance it could coincide with the rate cut in September.
The ECB is conscious that its policy changes are only marginally impacting the real economy. It is also running out of assets to buy due to the rules of the current programme, which means that it will have to make some changes if it wants to continue QE for much longer, or if it wants to increase the pace of its monthly purchases.
The ECB has two easy options, and some more politically difficult ones. First, it could relax the liquidity quotas it has imposed on itself. At present, the ECB can only buy a third of all bond issues under its Public Sector Purchase Programme (PSPP). Lifting the limit as it did in December (from 25% to 33% of issuance) would make more bonds available, but would also hurt liquidity in those markets.
The second option would be to tackle the ECB’s rule of only buying bonds yielding more than the deposit rate. Our forecast for a deposit rate cut in
0.5%
1.0%
1.5%
2.0%
i ii iii iv i ii iii iv i ii iii iv i ii iii iv
2014 2015 2016 2017
y/y
Current forecast Previous forecast
Real GDPforecast
-0.5%
0.0%
0.5%
1.0%
1.5%
2.0%
i ii iii iv i ii iii iv i ii iii iv i ii iii iv
2014 2015 2016 2017
y/y
Current forecast Previous forecast
HICP inflationforecast
12
판매회사 임직원용 한정
본 자료는 판매회사임직원에 한정하여 정보제공 목적으로만 작성되었으므로 투자권유를 위한 목적으로 사용될 수 없으며, 최종 투자자에게
배포될 수 없습니다. 본 자료는 영어 원문의 국문 번역본입니다. 영어 원문과 차이가 있을 경우 영어 원문이 우선합니다. 해당 영어 원문은
www.schroderstalkingpoint.com 에서 다운로드 할 수 있습니다. 슈로더 준법감시인 승인 (2016-185)
ECB 도 BOJ 처럼
새로운 차원의
금융완화 정책을
내놓을 것인가?
브렉시트는 일반
소비자들에게는 큰
영향이 없었습니다
하지만 기업분석을
통하면 경기가
둔화되고 있습니다
September would free up more bonds to buy, but eventually, markets would lower yields and we would be back to square one. Allowing the ECB to buy bonds with a lower yield than the deposit rate would remove this barrier, but it would come at a cost. Those bonds are guaranteed to make a loss for the ECB, which it would have to absorb.
The third option, which is growing in popularity amongst investors, would be for the ECB to abandon its rule to buy bonds along the capital key – that is, to buy bonds from countries in proportion to the size of the economies, and their government’s subscription to the ECB’s capital base. Ideally for markets, the ECB would focus purchases where stimulus is most required, such as peripheral Europe. However, this would amount to government financing, which would be illegal. In our view, this option is too politically difficult.
The fourth option for the ECB is to look at alternative asset classes. It has already added non-banking corporate credit to the mix of assets, but it could eventually move on to buying equities, potentially through exchange-traded funds (ETFs) like the Bank of Japan currently does. The Eurozone’s collective stock-markets were worth approximately €3.9 trillion, or around 37% of GDP at the end of 2015. Buying a significant stake would allow the ECB to keep QE going for a little while longer. A positive impact from this policy would be the rise in equity valuations, which would be particularly helpful for banks, as it would make it easier for them to issue new equity and raise the capital buffers. The risk from this policy is that the ECB creates a bubble in the market with valuations that become difficult to justify when the ECB stops buying.
In our view, once the first two options have been exhausted, the ECB will eventually turn to buying equities rather than discuss abandoning the capital key. Equity purchases are easier to explain, and are likely to be more popular. Although, we stress that this route is highly uncertain, and it is unlikely to be discussed for at least a year.
영국 전망: 거시적인 측면에서 메달 없음
Despite the tremendous success of team GB at the Rio Olympics, the UK will not be winning any medals for its macroeconomic performance. We continue to forecast a slowdown in coming quarters following the UK’s vote for Brexit.
So far, Brexit appears to have shaken the confidence of firms and households, but only the former may have actually changed its behaviour. Despite consumer confidence dropping to its lowest level since June 2013, the volume of retail sales in July were much better than expected – up 1.4% compared to June, and 5.9% compared to a year earlier. This is also in contrast to the Confederation of British Industry’s (CBI) distributive trade survey, which showed that sales volumes (which includes intermediary sales used for inventories) declined more rapidly than at any time since January 2012. It appears retailers may have reacted prematurely in cutting orders as households indulge in a little post-Brexit retail therapy.
For manufacturer and other non-retail service sector firms, we do not yet have any official activity data. Only the surveys which we highlighted last month are available. However, if corporates have cut back activity in the way the surveys suggest, then the risk of recession remains high.
The above developments are not surprising. Our view remains that the impact of Brexit will be felt by corporates first who cut back business investment initially on the back of heightened uncertainty. The fall in investment will also mean lower employment and eventually wages. Therefore, the household sector will not

13
판매회사 임직원용 한정
본 자료는 판매회사임직원에 한정하여 정보제공 목적으로만 작성되었으므로 투자권유를 위한 목적으로 사용될 수 없으며, 최종 투자자에게
배포될 수 없습니다. 본 자료는 영어 원문의 국문 번역본입니다. 영어 원문과 차이가 있을 경우 영어 원문이 우선합니다. 해당 영어 원문은
www.schroderstalkingpoint.com 에서 다운로드 할 수 있습니다. 슈로더 준법감시인 승인 (2016-185)
영란은행, 금리인하
및 양적완화 재개
당사는 영국이
금리를 0.1% 인하할
것으로 전망하며
2017 년에는 추가
양적완화를 보일
것으로 생각합니다
begin to feel the impact of Brexit until sometime in 2017.
차트 10: 영국 GDP 전망 차트 11: 영국 인플레이션 전망
Source: Thomson Datastream, Schroders Economics Group. 15 August 2016. Previous forecast from June 2016. Please note the forecast warning at the back of the document.
Our forecast for UK growth is largely unchanged, with a slight upgrade for 2016 to 1.7%, but a cut to 2017 to 0.6% (chart 10). This is a result of re-profiling and historic revisions. The inflation forecast has been lowered slightly for 2016 but raised for 2017 as we believe it will take slightly longer for the deprecation in the pound to feed through to consumer prices (chart 11).
영란은행 삼중침체 위기
Following the presentation of the August Inflation Report, the BoE cut interest rates from 0.5% to 0.25% – the first time in seven years. Concerned about the impact of Brexit on growth, the BoE also decided to restart QE, by adding £60 billion to the currently held £375 billion stock of assets – the first addition to the programme in four years.
In addition, a Term Funding Scheme (TFS) has also been introduced to help banks pass on interest rate cuts to borrowers, while £10 billion of corporate credit will also be purchased (over the next 18 months) to directly lower the cost of funding through credit markets.
The BoE cut its GDP growth forecast from 2.3% to 0.8% (matching the previous Schroders forecast), but raised its near-term inflation forecast, as it expects the depreciation in the pound to raise the cost of imports, which eventually feed through into higher prices for goods. However, it is clear that the BoE placed more weight on the expected slowdown in growth rather than the pickup in inflation. It believes that the currency effect on inflation will be short-lived, while the implications from slower growth could be more powerful over the medium-term.
In the MPC’s meeting minutes, the committee stated that a majority of members are minded to cut interest rates further, to close to but above zero if the incoming data proves to be broadly consistent with their latest forecasts. Given our growth forecast is very similar to the BoE’s, we are changing our forecast to include a further cut in interest rates to 0.1% for November. In addition, it seems odd to us that the BoE would halt its purchases of gilts while the economy is still slowing. The Bank’s forecast (chart 12 on next page) still has growth very weak at the start of 2017, which coincides with when the gilts part of its QE programme is supposed to stop. We think the BoE will extend QE until at least the end of 2017. As it has done in the past, it will want to be confident that the economy is growing above trend before stopping stimulus.
0.0%
0.5%
1.0%
1.5%
2.0%
2.5%
3.0%
3.5%
4.0%
i ii iii iv i ii iii iv i ii iii iv i ii iii iv
2014 2015 2016 2017
y/y
Current forecast Previous forecast
Real GDPforecast
-0.5%
0.0%
0.5%
1.0%
1.5%
2.0%
2.5%
3.0%
3.5%
i ii iii iv i ii iii iv i ii iii iv i ii iii iv
2014 2015 2016 2017
y/y
Current forecast Previous forecast
CPI inflationforecast

14
판매회사 임직원용 한정
본 자료는 판매회사임직원에 한정하여 정보제공 목적으로만 작성되었으므로 투자권유를 위한 목적으로 사용될 수 없으며, 최종 투자자에게
배포될 수 없습니다. 본 자료는 영어 원문의 국문 번역본입니다. 영어 원문과 차이가 있을 경우 영어 원문이 우선합니다. 해당 영어 원문은
www.schroderstalkingpoint.com 에서 다운로드 할 수 있습니다. 슈로더 준법감시인 승인 (2016-185)
하지만 지금 영국이
필요한건 추가적인
부양책 입니다.
차트 12: 영란은행은 양적완화를 종료할 수 있을 것인가?
Source: Thomson Datastream, Bank of England August Inflation Report, Schroders Economics Group. 17 August 2016.
Despite the comprehensive appearance of the BoE’s latest round of stimulus, we doubt it will have much of an impact on the economy. Indeed, given the adverse effects on company pension funding it could be counterproductive for business spending. Instead, we believe the government now needs to step forward to introduce significant fiscal stimulus. Chancellor of the Exchequer Philip Hammond is due to “reset” fiscal policy, which we hope will include tax cuts aimed at boosting both corporate investment and household consumption. We assume about 1% of GDP worth of stimulus over the next 1–2 years.
350
375
400
425
450
0.0%
0.5%
1.0%
1.5%
2.0%
2.5%
3.0%
Q1 Q2 Q3 Q4 Q1 Q2 Q3 Q4 Q1 Q2 Q3 Q4 Q1 Q2 Q3 Q4 Q1 Q2 Q3
2015 2016 2017 2018 2019
BoE gilt purchases, rhs BoE credit purchases, rhs
GDP Q/Q, lhs GDP Y/Y, lhs
£bn
BoEInflation Report
forecast
15
판매회사 임직원용 한정
본 자료는 판매회사임직원에 한정하여 정보제공 목적으로만 작성되었으므로 투자권유를 위한 목적으로 사용될 수 없으며, 최종 투자자에게
배포될 수 없습니다. 본 자료는 영어 원문의 국문 번역본입니다. 영어 원문과 차이가 있을 경우 영어 원문이 우선합니다. 해당 영어 원문은
www.schroderstalkingpoint.com 에서 다운로드 할 수 있습니다. 슈로더 준법감시인 승인 (2016-185)
이머징마켓: 빠르고 높고 강하게
이머징마켓을
압박하고 있는
인플레이션
이머징마켓
재정정책으로 강세
하지만, 당사는
지속여부는
의문입니다
There is little change to our growth expectations this quarter for the emerging markets. Domestic trajectories have largely played out as expected in this regard, though inflation has thrown up more surprises. China, it is true, did better than we had forecast in the first half of the year, but this looks to us to be the result of unsustainable stimulus, and a deceleration already appears to be underway. Higher-than-expected inflation has pushed back our rate cutting cycles in Russia and Brazil, but we still expect policy action this year. India too looks likely to engage in easing as current central bank governor Raghuram Rajan steps down in September, likely in favour of a more dovish appointee.
Overall we expect stronger growth going into 2017, despite the deceleration seen in China. Much of this comes from a recovery from recession in Russia and Brazil, though India also continues its steady march upwards as credit growth recovers and reform momentum helps encourage investment.
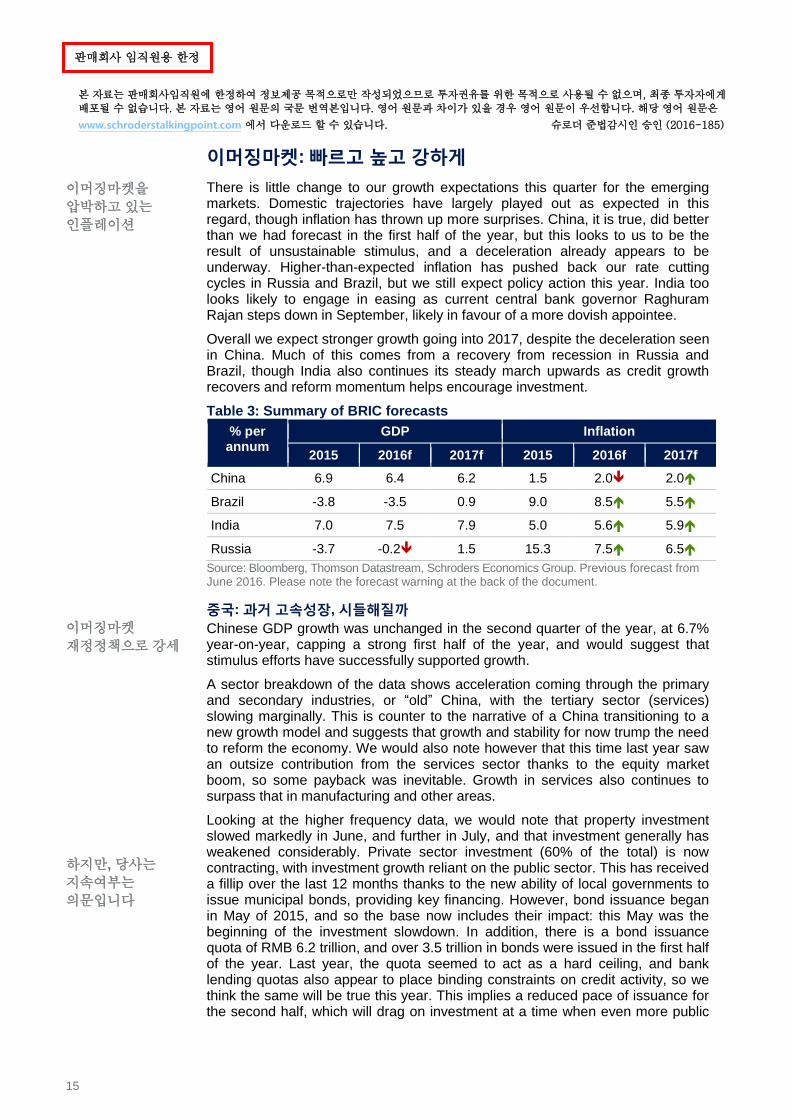
Table 3: Summary of BRIC forecasts
% per annum
GDP Inflation
2015 2016f 2017f 2015 2016f 2017f
China 6.9 6.4 6.2 1.5 2.0 2.0
Brazil -3.8 -3.5 0.9 9.0 8.5 5.5
India 7.0 7.5 7.9 5.0 5.6 5.9
Russia -3.7 -0.2 1.5 15.3 7.5 6.5
Source: Bloomberg, Thomson Datastream, Schroders Economics Group. Previous forecast from June 2016. Please note the forecast warning at the back of the document.
중국: 과거 고속성장, 시들해질까
Chinese GDP growth was unchanged in the second quarter of the year, at 6.7% year-on-year, capping a strong first half of the year, and would suggest that stimulus efforts have successfully supported growth.
A sector breakdown of the data shows acceleration coming through the primary and secondary industries, or “old” China, with the tertiary sector (services) slowing marginally. This is counter to the narrative of a China transitioning to a new growth model and suggests that growth and stability for now trump the need to reform the economy. We would also note however that this time last year saw an outsize contribution from the services sector thanks to the equity market boom, so some payback was inevitable. Growth in services also continues to surpass that in manufacturing and other areas.
Looking at the higher frequency data, we would note that property investment slowed markedly in June, and further in July, and that investment generally has weakened considerably. Private sector investment (60% of the total) is now contracting, with investment growth reliant on the public sector. This has received a fillip over the last 12 months thanks to the new ability of local governments to issue municipal bonds, providing key financing. However, bond issuance began in May of 2015, and so the base now includes their impact: this May was the beginning of the investment slowdown. In addition, there is a bond issuance quota of RMB 6.2 trillion, and over 3.5 trillion in bonds were issued in the first half of the year. Last year, the quota seemed to act as a hard ceiling, and bank lending quotas also appear to place binding constraints on credit activity, so we think the same will be true this year. This implies a reduced pace of issuance for the second half, which will drag on investment at a time when even more public

16
판매회사 임직원용 한정
본 자료는 판매회사임직원에 한정하여 정보제공 목적으로만 작성되었으므로 투자권유를 위한 목적으로 사용될 수 없으며, 최종 투자자에게
배포될 수 없습니다. 본 자료는 영어 원문의 국문 번역본입니다. 영어 원문과 차이가 있을 경우 영어 원문이 우선합니다. 해당 영어 원문은
www.schroderstalkingpoint.com 에서 다운로드 할 수 있습니다. 슈로더 준법감시인 승인 (2016-185)
경기 경착륙은
보이지 않고
있습니다
낮지만 성장률
회복을 보이는
브라질
support is needed (chart 13).
차트 13: Chart 13: 지방채는 투자둔화로 인해 시들해지고 있다
Source: Thomson Datastream, Deutsche Bank, Schroders Economics Group. 18 August 2016.
Given the downturn in the data, it may seem an odd time for us to drop our scenario of a Chinese hard landing. However, this has more to do with the time horizon of our scenarios – they must be triggered within six months – than a view on our part that all is well in China. In the near term, the state has sufficient resources to contain any flare ups in the economy or financial system, where risks abound. In its recent Article IV report on China, the International Monetary Fund (IMF) estimated that “debt at risk” in the economy amounted to 15.5% of total loans, with the potential for losses equivalent to 7% of GDP. What is missing for the moment, however, is a trigger. Bank funding is largely stable and derived from household deposits (though reliance on interbank funding is growing), and strict capital controls trap funds in the system while also greatly limiting the entry of foreign money. Financial crises are typically triggered by a sudden stop of capital flows to the financial system. Given the composition of funding, we think this is very unlikely in the next six months. We would be less sanguine over the next three years.
Currency policy, as we have noted previously, retains a clear weakening bias. However, capital outflows seem to have reduced and markets appear unperturbed by the ongoing weakness of the renminbi. All of this makes a big devaluation less likely, and we expect further gradual depreciation over the foreseeable horizon.
브라질: 출발대를 떠나다
High frequency data suggests a recovery of sorts is underway in Brazil, though it will still be a few quarters before we see positive growth. The PMIs have shown one of the sharpest turnarounds, though industrial production and retail sales have also reversed their decelerating trends. The improvement in the latter comes despite a labour market that is still shedding jobs.
Second quarter GDP data is not yet available, but first quarter growth improved on the back of government spending, net exports, and investment. Government spending is unlikely to be much of a driver given planned austerity, and this boost at least partially reflects the attempts by the outgoing president Dilma Rousseff to shore up support with largesse for her base. The contribution of net exports, boosted almost entirely by improved export performance, can be attributed to the weaker currency and lower unit labour costs. This should persist for most of the third quarter, after which the currency impact will begin to fade, particularly given the strength we have seen in the real and concomitant increase in unit labour
0
2
4
6
8
10
12
0
1
2
3
4
5
6
7
Jan 16 Mar 16 May 16 Jul 16 Sep 16 Nov 16
Cumulative issuance Issuance if quota used evenlyInvestment growth rate (rhs)
%, y/yMunicipal bonds (RMB trillion)

17
판매회사 임직원용 한정
본 자료는 판매회사임직원에 한정하여 정보제공 목적으로만 작성되었으므로 투자권유를 위한 목적으로 사용될 수 없으며, 최종 투자자에게
배포될 수 없습니다. 본 자료는 영어 원문의 국문 번역본입니다. 영어 원문과 차이가 있을 경우 영어 원문이 우선합니다. 해당 영어 원문은
www.schroderstalkingpoint.com 에서 다운로드 할 수 있습니다. 슈로더 준법감시인 승인 (2016-185)
잘 풀릴 것 같은 정치
뉴스가 보이지만
리스크는 공존하고
있습니다
costs.
Perhaps most interesting though is the performance of investment. Though still contracting, it was much less of a drag than in the fourth quarter of 2015. When we also consider a rebound in business confidence witnessed in survey data, we could conclude that the formation of a new government has returned investment confidence to the economy. If this narrative is correct, the revival is somewhat hostage to further political developments. On this front, it is encouraging that the impeachment of Rousseff looks to be on track, with a strong majority seemingly in President Temer’s camp. Business confidence surveys show the revival in sentiment has extended, reaching levels last seen in early 2014. This bodes well for further investment and industrial performance (chart 14), as does the interest taken by assorted foreign investors in Brazilian assets.
차트 14: Chart 14: 브라질 기업들 자신감 되찾으며 고공행진
Source: Thomson Datastream, Schroders Economics Group. 18 August 2016.
There are risks, however. President Temer and his government have been linked to the ongoing corruption scandal at Petrobras, which has metastasised also to Eletrobras. There is a chance this undermines Temer’s government as it undermined Rousseff’s, weakening its ability to implement reform. In addition, a number of reforms have already seen dilution. This might just be electoral calculation ahead of local elections in October, but investors would do well to keep one eye on developments here as a signal of the government’s commitment to reform.
In terms of monetary policy, the central bank under new governor Ilan Goldfajn has been forced into a more hawkish position than might have been anticipated given Goldfajn’s dovish commentary prior to taking the role. Inflation has proven stickier than expected, making a rate cut difficult to justify. Our own inflation forecast has been revised up on the stubbornness of inflation this year, and we have both pushed out and reduced the rate cutting cycle, with 75bps of cuts this year at most.
러시아: 경제 침체 해결 중
The Russian economy contracted 0.6% year-on-year in the second quarter of 2016, in line with our forecast but a better performance than expected by the market. The number is also an improvement on the first quarter reading of a 1.2% contraction.
As this is an advance reading, there is no breakdown available so the drivers of
-15
-10
-5
0
5
10
30
35
40
45
50
55
60
65
Aug 13 Feb 14 Aug 14 Feb 15 Aug 15 Feb 16 Aug 16
Industrial confidence Industrial production (rhs)
%, y/yIndex

18
판매회사 임직원용 한정
본 자료는 판매회사임직원에 한정하여 정보제공 목적으로만 작성되었으므로 투자권유를 위한 목적으로 사용될 수 없으며, 최종 투자자에게
배포될 수 없습니다. 본 자료는 영어 원문의 국문 번역본입니다. 영어 원문과 차이가 있을 경우 영어 원문이 우선합니다. 해당 영어 원문은
www.schroderstalkingpoint.com 에서 다운로드 할 수 있습니다. 슈로더 준법감시인 승인 (2016-185)
러시아 경제 회복
전환, 하지만
한계치가 낮습니다
인도 꾸준한
회복세를 보이고
있다
the improved performance can only be inferred from higher frequency data. Industrial production has expanded throughout the quarter in year-on-year terms as it recovers from low levels. This has likely been helped in part by a weaker currency; exports are on an improving path, though still down year-on-year. Retail sales are still anaemic, with the consumer facing headwinds of high unemployment, so consumption is unlikely to have been particularly strong.
The outlook from here remains one of gradual recovery, recent oil price weakness notwithstanding. We expect positive year-on-year growth by Q4, and a positive overall growth performance in 2017, though still muted. The worst of the oil price crash effects may be over, but Russia’s economy needs to address structural imbalances if it is going to grow strongly in a world of cheaper oil. The economy is also going to face fiscal headwinds given the balanced budget goal, which requires fiscal consolidation of around 4% of GDP by 2020. The planned rate of reduction has been a cut to the deficit of 1% of GDP each year, with presidential elections in early 2018 likely weighing against more aggressive consolidation.
The weakness in oil in July and early August generated some renewed currency weakness. The central bank has also mentioned that inflation expectations remain more elevated than they would like (chart 15), while wage growth is also a concern. We think there is still scope for 50–100bps of cuts this year provided the oil price firms, given lower indexation in regulated tariffs this year which will reduce the inflationary impact from regulated prices
차트 15: 러시아 인플레이션 심화, 중앙은행 억제
Source: Thomson Datastream, Schroders Economics Group. 18 August 2016.
인도: 경제성장 전망치 낙관
After a decade of waiting, India has finally passed a bill clearing the way for the implementation of a unified Goods and Services Tax (GST). This may sound dry, but when one considers that until this point India has been less of a “single common market” than the European Union, the implications seem much more significant.
By unifying tax rates across goods and services, removing taxes on the movement of goods and shifting the basis of taxation to consumption rather than production, the GST should remove a wide range of distortions and inefficiencies, benefiting investment, growth, and tax revenues in the medium to long run.
However, implementation could be messy; the GST will reduce taxes for manufacturers but increase them for service producers. This has potential
20
30
40
50
60
70
80
Q3 2008 Q3 2009 Q3 2010 Q3 2011 Q3 2012 Q3 2013 Q3 2014 Q3 2015
Significant increase (rhs) Little change
Expectations on inflation (% of respondents)

19
판매회사 임직원용 한정
본 자료는 판매회사임직원에 한정하여 정보제공 목적으로만 작성되었으므로 투자권유를 위한 목적으로 사용될 수 없으며, 최종 투자자에게
배포될 수 없습니다. 본 자료는 영어 원문의 국문 번역본입니다. 영어 원문과 차이가 있을 경우 영어 원문이 우선합니다. 해당 영어 원문은
www.schroderstalkingpoint.com 에서 다운로드 할 수 있습니다. 슈로더 준법감시인 승인 (2016-185)
은행들은
자본재구성을
통하여 성장에
이바지 해야 한다
inflationary impacts and a negative hit to growth in the short run, if manufacturers do not pass this reduction on, but service providers pass on their tax increase.
The passage of the legislation is positive for sentiment; investors had become somewhat jaded on the Indian reform story as Modi’s government became bogged down in the same mess of vested interests and political inertia that has plagued successive governments. That the Bharatiya Janata Party (BJP) can cooperate with the opposition Congress party to enact important legislation, and that it has built support in the upper house, improves the policy outlook and could encourage foreign direct investment and portfolio inflows. Some caution is warranted; the GST was in the interest of a range of parties in a way that other reform legislation may not be.
A boost to investment sentiment is sorely needed in India, given the performance of the private sector in this regard. According to HSBC, private sector investment contracted 1.4% in the 2016 fiscal year. Accounting for 75% of investment demand, this has a significant impact on headline investment growth despite strong public spending. Credit growth has also been weak, and may explain some of the softness (chart 16). A planned bank recapitalisation and clean up should shore up credit support from 2017. Budgeted public capital expenditure also remains strong, and can have a beneficial crowding in effect on private investment.
차트 16: 정부 차원의 대규모 투자유치 행사 속에서 저조한 크레딧 성장률
Source: Thomson Datastream, Schroders Economics Group. 18 August 2016.
We think a change in policy stance is likely from the central bank in Q3. Central bank governor Rajan is stepping down, and his replacement is likely to be more dovish. We modestly revise up our inflation expectations to reflect this probability, though the adoption of an official inflation target should provide some constraints. Rajan opted not to extend his term amidst fierce criticism from senior figures in the ruling party, suggesting that whoever is appointed to replace him will be more in tune with government thinking. This could mean looser policy in the form of rate cuts, but also acquiescing to the mooted use of central bank cash reserves to recapitalise troubled lenders, a move opposed by Rajan. An eye must be kept on the inflationary consequences.
7
9
11
13
15
17
19
21
-20
-15
-10
-5
0
5
10
15
20
25
10 11 12 13 14 15
Manuf. capex projects underway Domestic credit (rhs)
%, y/y %, y/y

20
판매회사 임직원용 한정
본 자료는 판매회사임직원에 한정하여 정보제공 목적으로만 작성되었으므로 투자권유를 위한 목적으로 사용될 수 없으며, 최종 투자자에게
배포될 수 없습니다. 본 자료는 영어 원문의 국문 번역본입니다. 영어 원문과 차이가 있을 경우 영어 원문이 우선합니다. 해당 영어 원문은
www.schroderstalkingpoint.com 에서 다운로드 할 수 있습니다. 슈로더 준법감시인 승인 (2016-185)
Schroder Economics Group: 전망 요약
거시경제 요약 – 2016 년 9 월
주요사항
기본전제
당사는 2016 년 세계경제 성장률을 2.3%로 하향 조정 하였습니다. 주요 원인으로는 미국과 유럽의 경기둔화 입니다.
2017 년에는 이머징국가들이 회복조짐을 보임에 따라 안정적인 경제활동으로 성장이 소폭 증가할 것으로 전망되며,
국제유가 상승으로 세계 인플레이션도 상승할 것으로 예상합니다.
미국 연준에서 12 월에 25bp 금리인상이 될 것으로 예상되며 연방준비기금금리가 올해말 0.75%가 될 것을 전망합니다.
인플레이션 상승과 더불어 추가 금리인상이 가능하며 2017 년 까지 1.25%로 상승을 보일 것 입니다. 미국 경제가
견실함으로 해석되며 연준이 점진적으로 기준금리를 올릴 것으로 예상합니다.
영국은 브렉시트 이후 가파른 둔화를 보였습니다. 첫번째 쇼크로인해 투자가 줄어들면서 고용부진과 임금상승이
감소되었습니다. 2017 년에는 일반가구들이 브렉시트 쇼크를 느낄 것으로 예상되지만 경기 침체기는 피할 것으로
전망합니다. 인플레이션 급등으로 인해 파운드화는 약세를 보이며 앞으로 하방 리스크가 나타날 것으로 보입니다.
영란은행은 8 월 금리인하를 시작으로 11 월까지 다시한번 금리인하를 이행하면서 0.1%까지 낮출 것으로 보입니다.
양적완화 또한 확장되며 2017 년까지 기간을 연장할 것으로 보입니다.
유로존 회복세는 2016 년에도 계속 될 것이나 브렉시트 쇼크로 인해 가속화 되지는 못할 것 입니다. 이는 2017 년에도
영향은 미치겠으나 유로존의 실질 가처분소득도 플러스를 기록함에 따라 구매력확대와 인플레이션 개선을 보일 것으로
전망합니다. 2017 년까지 유럽중앙은행은 예치금리를 -0.5%로 인하와 함께 양적완화 연장도 고려할 것입니다.
일본은 올해 0.7% 성장률을 기록할 것으로 예상되며 물가는 -0.1%으로 전망합니다. 엔화 강세로 인해 일본중앙은행은
금리인하와 추가 양적완화를 제시할 것을 전망합니다. 통화완화정책은 2016 년에 소폭 성장률을 이끌 것으로 보입니다.
소비세인상 여부는 2017 년에 또다른 논점이 될 것으로 전망합니다.
신흥국들은 선진국의 완만한 성장과 원자재 가격에 의하여 수혜를 받을 것이나 미국 통화 긴축 정책이 경제활동을 짓누를
것입니다. 중국 성장률에 대한 우려는 여전히 지속될 것이나 중국 인민은행의 추가적인 재정 지원 및 완화가 예상됩니다.
위험요인
위험요인으로는 장기적 침체현상과 브렉시트로 인한 유럽과 미국의 경기 둔화가 있습니다. 미국의 경기자극책이
인플레이션을 견인해 관새 개정과 임금상승으로 작용한다면 위험을 방어할 것으로 전망 합니다.
차트: 전세계 GDP 전망
Source: Thomson Datastream, Schroders Economics Group, August 2016 forecast. Please note the forecast warning at the back of the document.
4.9
2.6
3.1
3.8
4.94.5
5.1 5.1
2.3
-1.0
4.8
3.5
2.6 2.6 2.8 2.62.3
2.6
-3
-2
-1
0
1
2
3
4
5
6
00 01 02 03 04 05 06 07 08 09 10 11 12 13 14 15 16 17
Contributions to World GDP growth (y/y), %
US Europe Japan Rest of advanced
BRICS Rest of emerging World
Forecast

21
판매회사 임직원용 한정
본 자료는 판매회사임직원에 한정하여 정보제공 목적으로만 작성되었으므로 투자권유를 위한 목적으로 사용될 수 없으며, 최종 투자자에게
배포될 수 없습니다. 본 자료는 영어 원문의 국문 번역본입니다. 영어 원문과 차이가 있을 경우 영어 원문이 우선합니다. 해당 영어 원문은
www.schroderstalkingpoint.com 에서 다운로드 할 수 있습니다. 슈로더 준법감시인 승인 (2016-185)
Schroders Baseline Forecast
Real GDP
y/y% Wt (%) 2015 2016 Prev. Consensus 2017 Prev. Consensus
World 100 2.6 2.3 (2.5) 2.3 2.6 (2.6) 2.7
Advanced* 62.9 1.9 1.5 (1.7) 1.5 1.6 (1.5) 1.7
US 24.9 2.6 1.5 (2.0) 1.5 1.8 (1.7) 2.3
Eurozone 19.2 1.6 1.5 (1.6) 1.5 1.3 (1.3) 1.3
Germany 5.5 1.4 1.7 (1.8) 1.6 1.7 (1.7) 1.2
UK 4.2 2.2 1.7 (1.6) 1.6 0.6 (0.8) 0.6
Japan 6.6 0.6 0.7 (0.6) 0.5 1.4 (0.9) 0.8
Total Emerging** 37.1 3.6 3.8 (3.8) 3.8 4.4 (4.4) 4.4
BRICs 23.8 4.2 4.4 (4.4) 4.5 5.1 (5.1) 5.1
China 14.8 6.9 6.4 (6.4) 6.6 6.2 (6.2) 6.3
Inflation CPI
y/y% Wt (%) 2015 2016 Prev. Consensus 2017 Prev. Consensus
World 100 1.8 2.2 (2.2) 2.0 2.5 (2.5) 2.4
Advanced* 62.9 0.2 0.9 (1.0) 0.7 1.7 (1.8) 1.7
US 24.9 0.1 1.5 (1.7) 1.2 2.3 (2.1) 2.3
Eurozone 19.2 0.0 0.3 (0.6) 0.3 1.0 (1.4) 1.3
Germany 5.5 0.1 0.5 (0.5) 0.5 1.7 (1.7) 1.5
UK 4.2 0.0 1.0 (1.2) 0.7 2.6 (2.5) 2.4
Japan 6.6 0.8 -0.1 (-0.1) -0.1 1.2 (0.8) 0.6
Total Emerging** 37.1 4.4 4.4 (4.3) 4.2 3.8 (3.7) 3.6
BRICs 23.8 4.5 4.0 (3.9) 3.7 3.5 (3.4) 3.2
China 14.8 1.4 2.0 (2.2) 2.0 2.0 (2.0) 2.0
Interest rates
% (Month of Dec) Current 2015 2016 Prev. Market 2017 Prev. Market
US 0.50 0.50 0.75 (0.75) 0.92 1.25 (1.25) 1.07
UK 0.25 0.50 0.10 (0.25) 0.25 0.10 (0.25) 0.23
Eurozone (Refi) 0.00 0.05 0.00 (0.00) 0.00 (0.00)
Eurozone (Depo) -0.40 -0.30 -0.50 - -0.50
Japan -0.10 0.10 -0.30 (-0.10) 0.02 -0.40 (-0.10) -0.04
China 4.35 4.35 3.50 (3.50) - 3.00 (3.00) -
Other monetary policy
(Over year or by Dec) Current 2015 2016 Prev. 2017 Prev.
US QE ($Bn) 4466 4487 4475 (4496) 4493 (4514)
EZ QE (€Bn) 203 652 1552 (1548) 2512 (1788)
UK QE (£Bn) 375 375 438 (375) 565 (375)
JP QE (¥Tn) 433 383 453 (436) 493 (476)
China RRR (%) 17.00 17.50 15.00 15.00 13.00 13.00
Key variables
FX (Month of Dec) Current 2015 2016 Prev. Y/Y(%) 2017 Prev. Y/Y(%)
USD/GBP 1.30 1.47 1.25 (1.25) -15.2 1.20 (1.25) -4.0
USD/EUR 1.12 1.09 1.06 (1.06) -2.4 1.04 (1.06) -1.9
JPY/USD 101.3 120.3 100 (100) -16.9 105 (110) 5.0
GBP/EUR 0.86 0.74 0.85 (0.85) 15.1 0.87 (0.85) 2.2
RMB/USD 6.64 6.49 6.85 (6.85) 5.5 7.15 (7.15) 4.4
Commodities (over year)
Brent Crude 45.9 52.7 43.4 (46.1) -17.7 47.5 (51.8) 9.5
Consensus inflation numbers for Emerging Markets is for end of period, and is not directly comparable.
Previous forecast refers to June 2016
-0.34 0.23
Source: Schroders, Thomson Datastream, Consensus Economics, August 2016
Market data as at 11/08/2016
* Advanced markets: Australia, Canada, Denmark, Euro area, Israel, Japan, New Zealand, Singapore, Sw eden, Sw itzerland,
United Kingdom, United States.
** Emerging markets : Argentina, Brazil, Chile, Colombia, Mexico, Peru, China, India, Indonesia, Malaysia, Philippines, South Korea,
Taiw an, Thailand, South Africa, Russia, Czech Rep., Hungary, Poland, Romania, Turkey, Ukraine, Bulgaria, Croatia, Latvia,

22
판매회사 임직원용 한정
본 자료는 판매회사임직원에 한정하여 정보제공 목적으로만 작성되었으므로 투자권유를 위한 목적으로 사용될 수 없으며, 최종 투자자에게
배포될 수 없습니다. 본 자료는 영어 원문의 국문 번역본입니다. 영어 원문과 차이가 있을 경우 영어 원문이 우선합니다. 해당 영어 원문은
www.schroderstalkingpoint.com 에서 다운로드 할 수 있습니다. 슈로더 준법감시인 승인 (2016-185)
전망치 차트 업데이트 - 경제전망 신흥시장, 신흥 아시아, 태평양지역(일본제외)의 성장률과 인플레이션 전망치는 각 개별 국가의 전망치를 기반으로 GDP 가중 계산되었습니다.
Chart A: GDP 전망치
2016 2017
2016 2017
The forecasts included should not be relied upon, are not guaranteed and are provided only as at the date of issue. Our forecasts are based on our own
assumptions which may change. We accept no responsibility for any errors of fact or opinion and assume no obligation to provide you with any changes to
our assumptions or forecasts. Forecasts and assumptions may be affected by external economic or other factors. The views and opinions contained herein
are those of Schroder Investments Management’s Economics team, and may not necessarily represent views expressed or reflected in other Schroders
communications, strategies or funds. This document does not constitute an offer to sell or any solicitation of any offer to buy securities or any other instrument
described in this document. The information and opinions contained in this document have been obtained from sources we consider to be reliable. No
responsibility can be accepted for errors of fact or opinion. This does not exclude or restrict any duty or liability that Schroders has to its customers under the
Financial Services and Markets Act 2000 (as amended from time to time) or any other regulatory system. Reliance should not be placed on the views and
information in the document when taking individual investment and/or strategic decisions. For your security, communications may be taped or monitored.
본 자료는 참고 목적으로 작성되었으며 특정 상품이나 서비스의 매입 또는 매도 제의나 권유를 위한 것이 아니므로, 어떠한 투자결정도 본 정보에 의존하여서는 아니됩니다. 본 자료의 정보는 해당 공표일 기준으로 가능한 정확한 자료라고 할 수 있으나, 슈로더는 구체적으로 표시된 것이나 암시된 것을 불문하고, 모든 제공된 자료의 정확성, 적정성, 또는 완결성을 보증하지는 아니합니다.
0
1
2
3
4
5
6
7
8
Jan-15 Apr-15 Jul-15 Oct-15 Jan-16 Apr-16 Jul-16 Oct-16
%
EM
EM Asia
Pac ex Jap
UK
Japan
US
Eurozone
0
1
2
3
4
5
6
7
8
Jan Feb Mar Apr May Jun Jul Aug
%
EM
EM Asia
Pac ex Jap
UK
Japan
US
Eurozone
-1
0
1
2
3
4
5
Jan-15 Apr-15 Jul-15 Oct-15 Jan-16 Apr-16 Jul-16 Oct-16
%
EM
EM Asia
Pac ex Jap
UK
Japan
USEurozone
0
1
2
3
4
5
Jan Feb Mar Apr May Jun Jul Aug
%
EM
EM Asia
Pac ex JapUK
Japan
US
Eurozone
Chart B: 인플레이션 전망치
Source: Consensus Economics (August 2016), Schroders.
Pacific ex. Japan: Australia, Hong Kong, New Zealand, Singapore.
Emerging Asia: China, India, Indonesia, Malaysia, Philippines, South Korea, Taiwan, Thailand.
Emerging markets: China, India, Indonesia, Malaysia, Philippines, South Korea, Taiwan, Thailand, Argentina, Brazil, Colombia, Chile, Mexico, Peru, Venezuela, South Africa, Czech Republic, Hungary, Poland, Romania, Russia, Turkey, Ukraine, Bulgaria, Croatia, Estonia, Latvia, Lithuania.

23
판매회사 임직원용 한정
본 자료는 판매회사임직원에 한정하여 정보제공 목적으로만 작성되었으므로 투자권유를 위한 목적으로 사용될 수 없으며, 최종 투자자에게
배포될 수 없습니다. 본 자료는 영어 원문의 국문 번역본입니다. 영어 원문과 차이가 있을 경우 영어 원문이 우선합니다. 해당 영어 원문은
www.schroderstalkingpoint.com 에서 다운로드 할 수 있습니다. 슈로더 준법감시인 승인 (2016-185)
투자유의문구
본 자료에 포함된 정보는 슈로더가 제공하는 특정 상품이나 서비스의 매입 또는 매도 제의나 투자권유를
위하여 작성된 것이 아니며 별도의 사전통지 없이 언제든지 수정될 수 있습니다. 본 자료는 사전 동의 없이
가공 또는 제 3 자에게 유포, 출판, 복사 또는 배포 될 수 없으며, 어떠한 투자결정도 본 정보에 의존하여서는
안됩니다. 본 자료의 어떤 내용도 투자, 세금, 법률, 여타 전문 상담, 또는 특정한 사실 및 문제와 관련된
자문으로 해석되어서는 아니 됩니다.
본 자료는 단순 정보제공을 목적으로 작성되었으며 고객의 특정 투자목적, 재정상태와 특정한 요구를
반영하고 있지 않습니다. 슈로더 금융투자상품을 구입하고자 하는 경우 금융 관련 전문가와 상담하시기
바라며 전문가의 상담을 구하지 않을 경우, 펀드에 투자하시기 전에 선택한 금융투자상품이 본인에게
적합한지 여부를 반드시 고려하시기 바랍니다.
본 자료의 정보는 해당 공표일 기준으로 가능한 정확한 자료라고 할 수 있으나, 슈로더는, 구체적으로 표시된
것이나 암시된 것을 불문하고, 모든 제공된 자료의 정확성, 적정성, 또는 완결성을 보증하지는 않습니다. 또한
슈로더, 슈로더 계열사, 또는 슈로더 및 그 계열사의 임직원은 해당 정보의 오류 및 누락으로 인한 어떠한
책임(제 3 자 책임 포함)도 부담하지 않습니다.
• 본 상품은 예금자보호법에 따라 예금보험공사가 보호하지 않습니다. • 금융투자상품은 운용결과에 따라
투자원금의 손실이 발생할 수 있으며 그 손실은 투자자에게 귀속됩니다. • 가입 전에 투자대상, 투자위험,
환매방법, 보수 및 수수료 등에 관하여 투자설명서 또는 간이투자설명서를 반드시 읽어보시기 바랍니다. •
외화자산은 환율변동에 따라 자산가치가 변동되거나 원금손실이 발생할 수 있습니다. • 투자대상국가의 시장,
정치 및 경제상황 및 과세제도 변동 등에 따른 위험으로 자산가치의 손실이 발생할 수 있습니다. • 과거의
운용실적이나 전망이 미래의 수익을 보장하지 않습니다.