iasclip(forecast(forum(iff)( (issued(june(9,(2011)( ·...
TRANSCRIPT

IASCLiP FORECAST FORUM (IFF) (Issued June 9, 2011)
June-‐July-‐August 2011
Disclaimer: The forecast and the discussions in this forum in no way reflect the opinion of the contribuNng personnel’s insNtuNons and organizaNons. These forecasts are experimental with voluntary contribuNons from ECPC/SIO, NASA/GMAO, RSMAS/UM, APCC/KOREA, COAPS/FSU, IRI, and NCEP-‐CFS forecasts downloaded from their website.
Process: The forecast forum comprises of a coaliNon of climate scienNsts working on IASCLiP including the modeling working group of the IASCLiP. We hold discussions analyzing the model forecast and current condiNons to come with a “consensus” forecast. We expect to update this analysis forecasts for the forthcoming seasons of August-‐September-‐October in late July 2011.
Acknowledgements: APCC, COAPS-‐FSU, ECPC-‐SCRIPPS, IRI, NASA/GMAO, NCEP, RSMAS-‐UM
Special Thanks: Adam Frumkin and Steven DiNapoli (COAPS) 1

The observaNons in the past month conNnue to suggest that the strong La Nina in the boreal winter is in the wane. However, the posiNve anomalies of SST in the Caribbean Sea and in the northwestern AtlanNc would call for a growing AtlanNc warm Pool.
The convecNon in northern South America has been strong in the last 3 months which entails a stronger s u b s i d e n c e o v e r N A S H , strengthening it slightly, which would cause more evaporaNon and therefore cooling of the SST in the AWP region.
The NAO conNnues to remain posiNve for the past 3 months.
h_p://www.esrl.noaa.gov/psd/map/images/sst/sst.anom.month.gif
2 h_p://www.cpc.ncep.noaa.gov/products/GODAS/ocean_briefing_new/mnth_nao.gif
Observations

Courtesy: h_p://www.esrl.noaa.gov/psd/map/images/fnl/slp_90a.fnl.html
The SLP anomalies in the AWP region (leb top) last 90 days is consistent with the development of wester ly wind anomaly ( leb bo_om), which would entai l reducNon in the wind driven evaporaNon and an increase in SST. This may be a result of the forcing of La Nina and posiNve NAO.
In fact the observed SST anomaly tendency in the AWP region from Mar 2011 to Apr 2011 increased by ~10C (h_p://www.cpc.ncep.noaa.gov/products/GODAS/).
Courtesy: h_p://www.esrl.noaa.gov/psd/map/images/fnl/sfcwnd_90a.fnl.html
3
Observations

JJA 2011 forecast based on current condiNons
• In Feb2011 when we made the forecast for AWP we suggested a near normal or below normal AWP year.
• With the development of westerly wind anomalies in the tropical western AtlanNc, conNnued weakening of La Nina and persisNng with the current SST anomalies will call for a slightly above normal (or slightly large) AWP year.
• The other compeNng influences that are trying to cool AWP are the the strong convecNon across northern South America and the lingering influence of La Nina that has persisted through Spring.
• On balance, from examining current condiNons only, one would lean towards slightly above normal (or slightly large) AWP year.
4

Models Model Reference No. of Ensemble members Coupled to ocean?
NCEP CFS v1 A 10 Yes
CCSM3.0 B 6 Yes
NASA GMAO C 6 Yes
ECHAM-‐MOM D Yes
POAMA E 10 Yes
ECPC F 12 No . Prescribed (persisted SST & IRI forecasted SST)
CWB G 10 Yes
Index Reference
A h_p://cfs.ncep.noaa.gov/menu/doc/
B h_p://journals.ametsoc.org/doi/abs/10.1175/2009MWR2672.1
C h_p://gmao.gsfc.nasa.gov/research/modeling/cgcm/
D h_p://poama.bom.gov.au/
E h_p://iri.columbia.edu/climate/ENSO/currenNnfo/models/ECHAM_MOM.html
F h_p://ecpc.ucsd.edu/projects/GSM_model.html
G h_p://www.cwb.gov.tw/V6/climate/other-‐subject/WPGM_CWB2Ner_CFS.pdf 5

How have we faired?
So far we have a_empted forecasNng for Aug-‐Sep-‐Oct 2010 in late July 2010, AWP 2011 in early Feb 2011, and so this is our third such effort to forecast June-‐July-‐Aug 2011.
By the poor quality of the majority of models to even define AWP in its climatology, our forecast efforts in this forum has been unusually hard and have to rely on heurisNc models, persistence of current condiNons and over reliance on models that have AWP in its climatology. Moreover ocean observaNons in the AWP region are as sparse as that of the polar oceans. Therefore our understanding of the current ocean condiNons especially below the surface is very limited and dependent largely on available ocean analyses.
We have done okay at Nmes and have been wrong equally (see next slide). This forum engages experts of the field who are involved with research over the AWP region and its teleconnecNons. So we put forth in this forum our best possible esNmates of what can unfold in the ensuing season, with the caveat that nature indeed can behave contrary to our expectaNons and make us feel humble.
6

7
Forecasted feature
Forecast Anomaly
Forecast season
When forecast was made
Observed verificaJon
Size of AWP Large ASO 2010 Late Jul 2010 Yes, large AWP
Strength of NASH Weak ASO 2010 Late Jul 2010 Yes, weak
Shear in MDR Weak ASO 2010 Late Jul 2010 Yes, Weak
Rainfall over Southern Mexico
Dry ASO 2010 Late Jul 2010 No, Wet
Mid-‐west Dry ASO 2010 Late Jul 2010 No, Wet
Size of AWP Near normal or small
JJA 2011 Early Feb 2011 Remains to be verified
Low level easterlies
Normal or slightly stronger
JJA 2011 Early Feb 2011 Remains to be verified
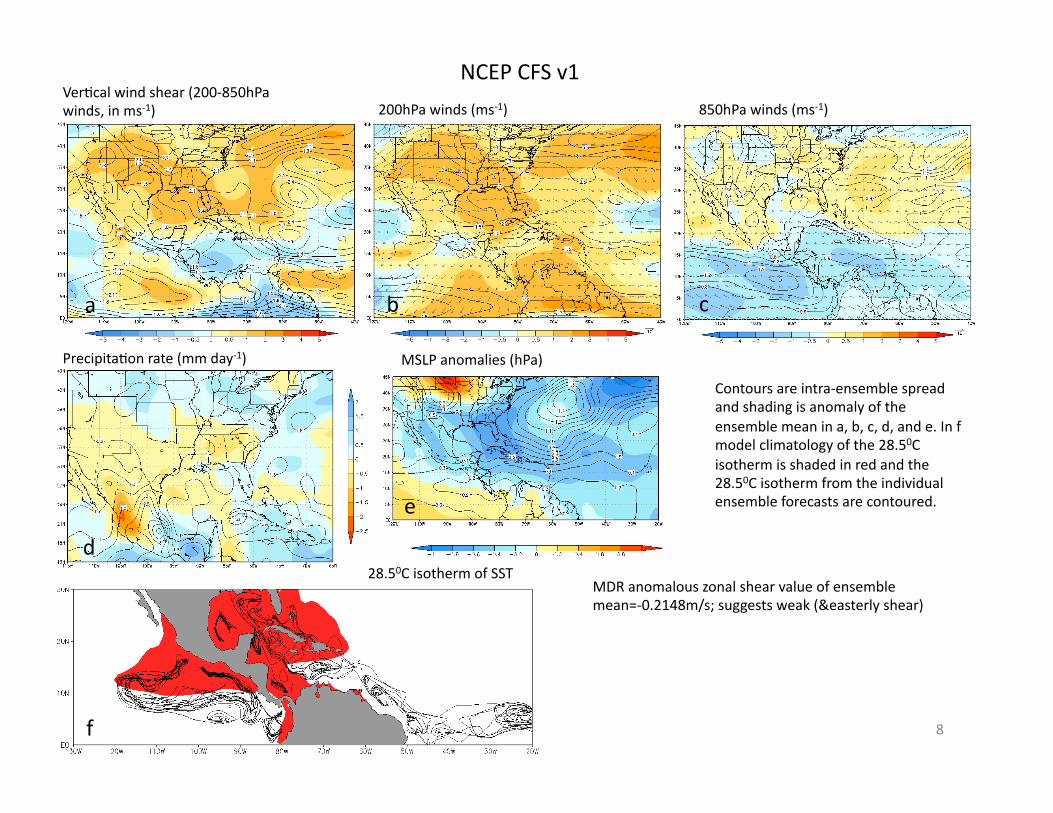
VerNcal wind shear (200-‐850hPa winds, in ms-‐1) 200hPa winds (ms-‐1) 850hPa winds (ms-‐1)
28.50C isotherm of SST
PrecipitaNon rate (mm day-‐1) MSLP anomalies (hPa)
Contours are intra-‐ensemble spread and shading is anomaly of the ensemble mean in a, b, c, d, and e. In f model climatology of the 28.50C isotherm is shaded in red and the 28.50C isotherm from the individual ensemble forecasts are contoured.
a
f
e
d
c b
NCEP CFS v1
8
MDR anomalous zonal shear value of ensemble mean=-‐0.2148m/s; suggests weak (&easterly shear)

VerNcal wind shear (200-‐850hPa winds, in ms-‐1) 200hPa winds (ms-‐1) 850hPa winds (ms-‐1)
MSLP anomalies (hPa)
Contours are intra-‐ensemble spread and shading is anomaly of the ensemble mean in a, b, c, d, and e. In f model climatology of the 28.50C isotherm is shaded in red and the 28.50C isotherm from the individual ensemble forecasts are contoured.
PrecipitaNon rate (mm day-‐1)
NASA GMAO
9
a
e
d
b c
28.50C isotherm of SST
f
MDR anomalous zonal shear value of ensemble mean=-‐0.3065m/s; suggests weak (&easterly shear)

28.50C isotherm of SST
PrecipitaNon rate (mm day-‐1)
Contours are intra-‐ensemble spread and shading is anomaly of the ensemble mean in a, b, c, and d. In e model climatology of the 28.50C isotherm is shaded in red and the 28.50C isotherm from the individual ensemble forecasts are contoured.
CCSM3 VerNcal wind shear (200-‐850hPa winds, in ms-‐1) 200hPa winds (ms-‐1) 850hPa winds (ms-‐1)
a
e
d
c b
10
MDR anomalous zonal shear value of ensemble mean= 0.0022m/s; suggests near normal shear

200hPa wind anomalies (ms-‐1) 850hPa wind anomalies (ms-‐1)
PrecipitaNon rate (mm day-‐1)
Shading is precipitaNon anomaly in c, and magnitude of wind anomaly in a and b. Vectors in a and b show direcNon of wind anomalies.
ECHAM-‐MOM
11
a b
c

VerNcal wind shear (200-‐850hPa winds, in ms-‐1) 200hPa winds (ms-‐1) 850hPa winds (ms-‐1)
MSLP anomalies (hPa)
Contours are intra-‐ensemble spread and shading is ensemble mean in a, b, c, d, and e.
PrecipitaNon rate (mm day-‐1)
CWB
a
e
d
b c
12
MDR anomalous zonal shear value of ensemble mean= 0.1462m/s; suggests slightly strong (&westerly shear)

VerNcal wind shear (200-‐850hPa winds, in ms-‐1) 200hPa winds (ms-‐1) 850hPa winds (ms-‐1)
MSLP anomalies (hPa)
Contours are intra-‐ensemble spread and shading is ensemble mean in a, b, c, d, and e. In f model climatology of the 28.50C isotherm is shaded in red and the 28.50C isotherm from the individual ensemble forecasts.
PrecipitaNon rate (mm day-‐1)
POAMA
a
e
d
b c
13
28.50C isotherm of SST
f
MDR anomalous shear value of ensemble mean=0.5159m/s; suggests strong (&westerly shear)

200hPa winds (ms-‐1) 850hPa winds (ms-‐1)
MSLP anomalies (hPa)
Contours are intra-‐ensemble spread and shading is ensemble mean in a, b, c, d, and e.
14
a
e
d
b c
VerNcal wind shear (200-‐850hPa winds, in ms-‐1)
PrecipitaNon rate (mm day-‐1)
ECPC-‐COAPS
MDR anomalous shear value of ensemble mean=-‐0.6928m/s; suggests weak (&easterly shear)

15
Feature NCEP CFS v1
NASA GMAO
CCSM3 ECHAM-‐MOM
CWB POAMA ECPC-‐COAPS
Model’s CONSEN.
AWP area anomaly
Large Large1 Large1 Not Avail.
Not Avail.
No AWP N/A Large
VerNcal shear anomaly in MDR
Weak (Easterly)
Weak Near Normal
Not Avail.
Westerly Westerly Weak (Easterly)
Weak (Easterly)
Strength of NASH or Bermuda high2
Weak Weak Not Avail.
Not Avail.
Weak Weak Weak Weak
Mid-‐west rain anomaly3
Southern Mexican rain anomaly3
1: Appearance of 28.50C isotherm in ensembles over AWP is considered large anomaly despite climatology of the model not showing AWP. 2: Based on the MSLP anomalies. 925hPa winds would have been be_er than 850hPa winds. 3: Unworthy of interpreNng summer seasonal rainfall anomaly from these models
Summary of Model Forecasts

16
Heuristic model forecasts If we interpret the model forecasts and the current conditions then we anticipate the likelihood of the following to happen in JJA 2011 based on our understanding (and research) of the AWP impacts on remote and local climate:
a) A slightly larger than normal AWP to occur b) A slightly weaker than normal Bermuda/North Atlantic subtropical high c) A weaker than normal (easterly) vertical shear from the lingering effects of rapidly weakening La Nina and appearance of weak warm ocean anomalies in the eastern equatorial Pacific and the slight weakening of NASH.
Based on a), b) and c) above we anticipate from our past research work the likelihood of the following to happen in JJA 2011:
i) Slightly below normal rainfall over mid-west US ii) Slightly above normal rainfall over southern Mexico iii) Slightly below normal summer rainfall activity along the northern US Gulf coast iv) Slightly above normal hurricane activity based on 1950-2010 climatology
We have a stronger consensus that this year is not going to be a very large anomalous AWP year. However in a relative sense, the forecasting of small anomaly years are much more difficult to verify.