indian rayon and industries limited - aditya birla · pdf filebank of america nt & sa ......
TRANSCRIPT
11111
INDIAN RAYON AND INDUSTRIES LIMITEDANNUAL REPORT 1999-2000
22222
Directors, Executives & Bankers ...................................................................... 3
Chairman�s Letter to the Shareholders ........................................................... 4
Management Discussion and Analysis ............................................................. 7
Corporate Governace Report .......................................................................... 18
Social Report .................................................................................................. 23
Directors� Report ............................................................................................ 25
Auditors� Report ............................................................................................. 32
Balance Sheet ................................................................................................ 34
Profit and Loss Account .................................................................................. 35
Schedules ....................................................................................................... 36
Notes forming part of accounts ...................................................................... 46
Cash Flow Statement ...................................................................................... 53
Subsidiaries .................................................................................................... 54
Shareholder Information ............................................................................... 62
Contents
33333
BOARD OF DIRECTBOARD OF DIRECTBOARD OF DIRECTBOARD OF DIRECTBOARD OF DIRECTORSORSORSORSORSShri Kumar Mangalam Birla, ChairmanSmt. Rajashree BirlaShri H. J. VaidyaShri D. S. DahanukarShri B. L. ShahShri Ashwini Kumar KanoriaShri P. MurariShri B. R. Gupta
MANAGERMANAGERMANAGERMANAGERMANAGERDr G. L. Moondra
COMPCOMPCOMPCOMPCOMPANY SECRETANY SECRETANY SECRETANY SECRETANY SECRETARYARYARYARYARYShri Ashok Malu
AUDITAUDITAUDITAUDITAUDITORSORSORSORSORSLodha & Co., MumbaiKhimji Kunverji & Co., Mumbai
BRANCH AUDITBRANCH AUDITBRANCH AUDITBRANCH AUDITBRANCH AUDITORSORSORSORSORSK. S. Aiyer & Co., MumbaiS. R. Batliboi & Co., Calcutta
SOLICITSOLICITSOLICITSOLICITSOLICITORSORSORSORSORSMulla & Mulla and Craigie, Blunt & Caroe, Mumbai
BANKERSBANKERSBANKERSBANKERSBANKERSState Bank of IndiaCorporation BankUnited Bank of IndiaUCO BankHDFC Bank Ltd.Bank of America NT & SAPunjab National BankCitibank N.A.ANZ Grindlays Bank p.l.c.American Express Bank LimitedStandard Chartered BankHongkong and Shanghai Banking Corporation Ltd.Canara BankCentral Bank of IndiaState Bank of SaurashtraAllahabad Bank
REGISTERED OFFICEREGISTERED OFFICEREGISTERED OFFICEREGISTERED OFFICEREGISTERED OFFICEVeraval - 362 266 (Gujarat)
EXECUTIVESXECUTIVESXECUTIVESXECUTIVESXECUTIVESRARARARARAYYYYYON DIVISON DIVISON DIVISON DIVISON DIVISIONShri V. T. Moorthy Director BMCr. PresidentShri C. P. Mathur Sr. PresidentShri V. G. Somani Jt. PresidentShri S. S. Gupta Jt. President (Admn. & Mktg.)Shri B. C. Upreti Jt. President (Production)Shri P. V. Gala Sr. Vice-President (Yarn Mktg.)Shri S. K. Nanda Sr. Vice-President (Caustic)
HI-HI-HI-HI-HI-TECH CARBONTECH CARBONTECH CARBONTECH CARBONTECH CARBONShri M. C. Bagrodia Group Executive PresidentShri Anil Kumar Sr. Exe. President (Chennai Unit)Shri D. C. Goel Sr. Exe. President (Renukoot Unit)Shri S. S. Rathi Sr. Jt. President (Renukoot Unit)Shri S. Balchandani Sr. Vice-President (Project)
JAJAJAJAJAYYYYYA SHREE INSULAA SHREE INSULAA SHREE INSULAA SHREE INSULAA SHREE INSULATTTTTORSORSORSORSORSShri Ravi Kastia Sr. PresidentShri B. K. Sethi Sr. Jt. President (Halol Unit)Shri S. S. Baid Jt. President (Halol Unit)Shri Anil Chand Lodha Sr. Vice-President (Rishra Unit)Shri Anil Mehta Sr. Vice-President (Rishra Unit)
TEXTILESTEXTILESTEXTILESTEXTILESTEXTILESShri S. B. Agarwal Advisor
JAJAJAJAJAYYYYYA SHREE TEXTILESA SHREE TEXTILESA SHREE TEXTILESA SHREE TEXTILESA SHREE TEXTILESDr. G. L. Moondra Sr. PresidentShri A. N. Choudhary President (Flax Mills)Shri P. C. Jain President (Rishra Cotton Mills)
RAJASHREE SYNTEXRAJASHREE SYNTEXRAJASHREE SYNTEXRAJASHREE SYNTEXRAJASHREE SYNTEXShri L. N. Rawat President
MADURA GARMENTSMADURA GARMENTSMADURA GARMENTSMADURA GARMENTSMADURA GARMENTSShri Vikram Rao Group Executive President
BIRLA PERICLASEBIRLA PERICLASEBIRLA PERICLASEBIRLA PERICLASEBIRLA PERICLASEShri D. R. Dhariwal Sr. Jt. PresidentShri K. B. R. Murthy Jt. President (Fin. & Comm.)
GLGLGLGLGLOBAL EXPORTS & MARKETINGOBAL EXPORTS & MARKETINGOBAL EXPORTS & MARKETINGOBAL EXPORTS & MARKETINGOBAL EXPORTS & MARKETINGShri S. R. Dutt President
CORPORACORPORACORPORACORPORACORPORATE FINANCE DIVISIONTE FINANCE DIVISIONTE FINANCE DIVISIONTE FINANCE DIVISIONTE FINANCE DIVISIONShri Adesh Gupta President & CFO
INDIAN RAYON AND INDUSTRIES LIMITED
44444
Dear fellow shareholders,
INDIAN RAYON � IN FOCUSINDIAN RAYON � IN FOCUSINDIAN RAYON � IN FOCUSINDIAN RAYON � IN FOCUSINDIAN RAYON � IN FOCUSIt was an eventful year for us at Indian Rayon. The Company successfully completed the de-mergerprocess, initiated last year and made several strategic moves with the singular objective of enhancingvalue for shareholders. These included the pre-payment of existing debt, a large buy-back programme toutilise surplus cash and exit from the Sea Water Magnesia business on value creation criteria. Above all, itacquired Madura Garments, the garments division of Madura Coats Limited, elevating Indian Rayon froma mere commodity player to a brand player.Madura Garments acquisition has catapulted the Company as the market leader in the apparels market.Its well renowned brands viz., Louis Philippe, Van Heusen, Allen Solley, Peter England, Byford and SanFrisco are brand leaders in their respective segments and together account for a 30% share of thebranded apparels market in India. The acquisition was dictated by the strong growth prospects for thebranded apparels and limited opportunities in some of our key businesses. These strategic moves, Ibelieve, will enable Indian Rayon deliver enhanced value for shareholders on a sustainable basis in theyears to come.Operationally, it was a difficult year. The Company�s core businesses suffered with lower volumes andrealisation due to sluggish market conditions, locally as well as internationally. The overall profitability,thus, came under pressure despite various proactive measures taken to improve efficiency and reducecosts.The overall revenues declined by 19% year-on-year to Rs.1,187.0 Crores and pre-tax profits nearly halvedto Rs.58.6 Crores during the year. Previous year�s figures include contributions from the Cement division,which was de-merged effective 1st September 1998, and hence cannot be strictly compared. The Companyalso took an extra-ordinary loss of Rs.298.9 Crores arising out of its decision to exit Sea Water Magnesiabusiness, during the year. This resulted in a net loss of Rs.241.2 Crores for the year vis-à-vis a profit ofRs.106.0 Crores reported for 1998-99.The overall financial position of the Company remains strong. The exceptional loss was set-off againstreserves and hence the Company�s cash flows remain healthy. More importantly, the performance of ourkey divisions has shown healthy improvement over the quarters, with most of them having bottomed-outduring the first half of 1999-2000. All these businesses have demonstrated considerable improvement interms of volumes and pricing during the second half, thus clearly pointing towards changing fortunes ofour key businesses, with the economy gearing towards improvement.OutlookIndian Rayon will focus on its identified growth businesses viz., Garments, Carbon Black and Insulators.Cashing on its existing strong position in the mature VFY industry will also be a priority area goingforward. In all these businesses, efficient utilisation of physical and strategic assets developed over theyears, will be the key driver of shareholder value in future.
GarmentsThe outlook for ready-made garments sector is extremely positive and offers a strong growth potential.The changing customer aspirations and lifestyles as well as emergence of large scale organised retailingappears to be catalysing the on-going shift towards branded apparels. This augurs well for us, being themarket leader in branded apparels. Our strategy for growth will be to focus on consolidation and leveragingbrand equity through launching of new seasonal collections and line extensions in the short term. Brandedexports and creation of new retail formats, including �Click and Mortar� are very much a part of thisstrategy. In the medium term, we will stress on accelerating conversions and entry into the high growthnew markets, like active-wear and women�s wear segments, to ensure growth ahead of the market.Carbon BlackThe nascent recovery in the carbon black industry, reported last year, is likely to gain further momentumin the next few years on the back of continuing buoyancy in the automobile sector. The Asian recovery willalso have positive impact, both in terms of lower imports as well as better exports in future. Our strategyis three pronged: Firstly, we will focus on improving volumes by increasing market share, wideningproduct range and developing new markets, coupled with leveraging advantages of our coastal location toimprove export volumes further. Secondly, we will unlock the full potential of existing assets and ensureoptimum utilisation of other assets including power assets. Finally, we will enhance margins throughintroduction of new grades and value-added products that offer higher realisation and strong competitiveadvantage in the market place.
The Chairman�s Letter to Shareholders
�Indian Rayonwill focus on its
identified growthbusinesses viz.,
Garments, CarbonBlack andInsulators.
Cashing on itsexisting strongposition in the
mature VFYindustry will also
be a priority areagoing forward.�
55555
InsulatorsThe Insulator sector appears to be heading for strong growth in the near future, especially giventhe likely increase in the Government�s spending on power infrastructure and proposed entry of theprivate sector in the transmission and distribution business. Our strategy for ensuring profitablegrowth will be to go on high value products, where competition from the unorganised sector isrelatively lower, explore new markets and leverage on existing relationship with customers, both inthe local as well as international markets. We will concentrate on enhancement of margins throughimprovement in yield and operational efficiencies. Development of new products, such as HVDC andhigh rating products as well as Isolators will be also central to our growth.
Viscose Filament Yarn (VFY)The industry is at the bottom of its cycle and appears to have a limited downside. The upside in thisbusiness is also limited due to changing fashion trends and its mature nature. We believe, the industrywould go through a consolidation in the foreseeable future, given the sluggish outlook and resultantpressure of lower volumes, prices and liquidity on small players. Indian Rayon, being one of the two largeplayers with cost advantages will gain from the consolidation process and generate reasonable growth inthe years to come.
Given such an outlook, our strategy will be to concentrate on increasing market share for higher volumesand on cost reduction for enhanced margins. We are focusing on improving quality further, wideningexport/regional presence to tap growth in specific user segments, rightsizing labour force and reducinginput costs further. These measures will enable us improve overall performance and profitability of thisdivision in future. Our overall focus will be to cash on the Company�s strong position, to the extentpossible, in this mature industry.
SummaryIn essence, the Company�s growth over the next few years will be driven by the Garments, Carbon Blackand Insulators businesses, which appear to have strong growth prospects. The expected positive outlookcoupled with well-thought strategies planned for these businesses will ensure improved volume andprofitability in our core area of operations. Our strategies are geared to deliver enhanced value forshareholders in future.
At this juncture, I would like to take the opportunity of placing on record my appreciation of our employeesand the management team at Indian Rayon. Their dedication and commitment have enabled us weatherthe trying times. Our employees are integral to our success and to sustain shareholder value creation. Iwould now like to brief you on some of the measures taken by us at the Group level.
THE ADITYA BIRLA GROUP � IN PERSPECTIVETHE ADITYA BIRLA GROUP � IN PERSPECTIVETHE ADITYA BIRLA GROUP � IN PERSPECTIVETHE ADITYA BIRLA GROUP � IN PERSPECTIVETHE ADITYA BIRLA GROUP � IN PERSPECTIVEAs you are aware tectonic shifts are changing the very contours of the economic and businessenvironment, regardless of geographic boundaries. Digitalisation, deregulation, globalisation andinvestor activism have altered the corporate landscape and ushered in an era of discontinuity.Organisations in India have had to reconstruct their very business architecture. And we in the AdityaBirla Group are no exception.
To face these challenges, over the last four years, we have been constantly re-inventing our Group.Our basic objective is to ensure sustainable success and continue to deliver value for our shareholders,customers, employees and the community at large.
A slew of proactive measures have been unveiled, riding on our renewed strategic thrust, innovativestructural initiatives and contemporary systems adoption. In my report to you last year, I had sharedseveral of these. Today, I wish to keep you abreast of the progress achieved in these areas and the growthtrajectory that we will traverse in this new millennium.
Renewed Strategic ThrustFundamental value creation and a razor-sharp business focus continue to be the pillars of our strategicthrust.Consequent to the in-depth review of our business portfolio by the Boston Consulting Group, we haveidentified the core business for each of our Companies. Businesses have been evaluated against stringentvalue-creation criteria. We have made a conscious decision to build and grow only those of our businessesthat have high value creation potential.
�Fundamentalvalue creationand a razor-sharp businessfocus continueto be the pillarsof our strategicthrust.�
66666
While in the past, our portfolio focused heavily on capital-intensive manufacturing oriented businesses,the future may see us move increasingly into knowledge-based, brand-management and servicesectors where again we will scout for a premium position � a position of leadership. At theportfolio level, we will continue to look into some of the businesses that are futuristic and add toenhancing shareholder value.
Knowledge-based industries offer enormous growth. This sunrise sector is far less capital intensiveand has the advantage of enhanced value-creation in a much shorter time frame. Acquiringmanagement control in Learning-Byte International by overseas companies of the Group, and thestrategic alliance with Lawson Software to set up the Lawson Competency Centre by Birla Consultancyand Software Services, a division of Grasim � are forward steps in this direction. Similarly, theacquisition of Madura Garments by Indian Rayon has overnight catapulted our Group to the top-of-the-league in the branded apparels sector. Importantly, these strategic moves have significantlyenhanced value for Indian Rayon and Grasim shareholders.
In the new economy, cellular services offers a significant growth platform in a sector that is rapidlyconsolidating. Our strategic alliance with Tata Telecommunications is a forward step that will help takeour telecom business ahead.
To bring in sharper business focus in each of our businesses, so as to realize better synergies, we haverecoursed to restructuring, where ever necessary. Restructuring of the cement business has not only createdsynergies and simplicity of operations, but has given us one resounding voice in the market place,propelling our growth from one strong platform vis-à-vis fragmented units in operation.
Structural InitiativesTo institutionalize enabling processes that help us benchmark with the best in the world, to align theinterest of shareholders and employees, and to better manage capital, we have chosen CVA (Cash ValueAdded) as our measurement metric. It is the cornerstone of the �value management� architecture, towhich I am personally committed. CVA helps us focus on the three key aspects of value creation, i.e.,profitability, asset-productivity and growth. Simply put, CVA is a structured, exhaustive process that entailsunderstanding business variables in depth and quantifying their effect on value creation. This in turnenables us put our finger on the key drivers of value creation in every single activity that we do.
In response to the changing times, we are continuously striving to make our Group as market-driven andagile as possible. To do so we are doing our utmost to create an organizational ambiance where talentcan bloom. Unleashing people power in a planned manner through a focus on their growth, developmentand learning is our priority. Our thrust is on developing our Group�s intellectual capital. Infusion of freshblood and talent at all levels coupled with the creation of thought leaders has gained momentum.
Six directors have been inducted at the Corporate level. Further, increasingly, professionals of high caliberhave been recruited. The retirement policy has been implemented. Succession plans are well in place.Building, developing and upgrading competencies across the Group through training and developmentcontinues as an integral ongoing activity.These steps will not only help us nurture leaders, but capable,self-assured colleagues across all levels. The push on growing the Group�s intellectual capital will propel itto new heights of value-creation.
Contemporary Systems AdoptionWe are institutionalising processes to realise better value for shareholders. To create a wired organisation,which will accentuate the quality of communication and information flow throughout the organisation, weare in the process of setting up the �Aditya Birla Information Highway�. �Gyanodaya� our temple oflearning has gone on-stream. It will help us constantly upgrade our knowledge base.
These slew of proactive measures, in my view, will help weave our Group into one seamless organisation,with the singular aim of creating value for our shareholders in 21st century and beyond.
Thank you,
Yours sincerely,
Kumar Mangalam Birla
�To institutionalizeenabling processes
that help usbenchmark with
the best in theworld, to align the
interest ofshareholders and
employees, and tobetter manage
capital, we havechosen CVA (CashValue Added) as
our measurementmetric.�
77777
OVERVIEWOVERVIEWOVERVIEWOVERVIEWOVERVIEWIt was a historic year for Indian Rayon and Industries Ltd. The Company successfully completed the cement de-merger process initiated during
1998-99. To further enhance shareholder value, the Company chartered several strategic moves viz., pre-payment of debt, completion of a share buy-back, exiting Sea Water Magnesia business and acquisition of the garments business.
It was a challenging year operationally. The Company�s core businesses suffered with lower volumes and realisation due to poor marketconditions. Overall profitability came under pressure despite various proactive measures taken to improve efficiency and reduce costs. Gross revenuesthus dropped 19% from Rs.1,466.6 Crores in 1998-99 to Rs.1,187.0 Crores in 1999-2000. Operating profits fell from Rs.322.6 Crores to Rs.205.3Crores during this period. Pre-tax profits were lower at Rs.58.6 Crores. As a result of this and an extra-ordinary and non-recurring charge associatedwith the exiting of the Sea Water Magnesia business, the Company reported a net loss of Rs.241.2 Crores for 1999-2000.
The current year�s financials are not strictly comparable with that of the previous year. The Company�s revenues and profits for the year 1998-99 includes performance of the cement divisions for 5 months (transferred to Grasim Industries Limited effective September 1998) while the currentyear results include performance of the Garments division for 3 months, which was acquired by the Company effective 1st January 2000. In addition,extra-ordinary loss of Rs.298.8 Crores was provided during the year due to the permanent closure of Sea Water Magnesia plant.
STRASTRASTRASTRASTRATEGIC MOVES TTEGIC MOVES TTEGIC MOVES TTEGIC MOVES TTEGIC MOVES TO ENHANCE SHAREHOLDER VO ENHANCE SHAREHOLDER VO ENHANCE SHAREHOLDER VO ENHANCE SHAREHOLDER VO ENHANCE SHAREHOLDER VALALALALALUEUEUEUEUEAcquisition of Madura Garments
The Company acquired Madura Garments (MG), the garments division of Madura Coats Limited, as a going concern during the year. MG is themarket leader in the ready-made garments business in India. Its brands viz., Louis Philippe, Van Heusen, Allen Solley, Peter England, Byford and SanFrisco are brand leaders in their respective segments and together account for a 30% share of the branded apparels market. The acquisition of MGhas transformed the Company from being a mere commodity player to a brand player. The Company invested Rs.187.75 Crores on this acquisition.This was funded through primarily internal cash. In a separate transaction, the Company also paid US$10.8 million, through a wholly ownedsubsidiary, towards technical know-how, overseas rights for trademark and perpetual license for India, Middle East and SAARC countries to CoatsViyella Plc., UK.Buy-back of shares
To utilise surplus cash and increase value for its shareholders, the Company bought back its own shares during the year. The Company madean offer to buy-back 25% of the outstanding equity capital within a price range of Rs.75-85 per share and received 76 lac shares (representing 11.3% of equity) at a price of Rs.85 per share. The Company has utilised Rs.65.6 Crores of surplus funds for this purpose.Exit from Sea Water Magnesia
The Company, after suspending operations of the Sea Water Magnesia (SWM) plant during the first half of the year, decided to exit from theSWM business effective 1st October 1999. Despite serious efforts, the business could not be sold as a going concern. It was therefore decided to disposethe assets and set off losses against accumulated profits. The Company has thus taken a one-time non-cash loss of Rs.298.8 Crores. The Company is inthe process of disposing off these assets.
The Company has also pre-paid Non-Convertible debentures to the tune of Rs.200 Crores, associated with the unit, with a view to reduce interestcharges. These moves will ensure improved cash flows for the Company due to the elimination of losses, saving in interest charges and above all betterutilisation of capital.SEGMENTAL ANALYSIS AND REVIEW
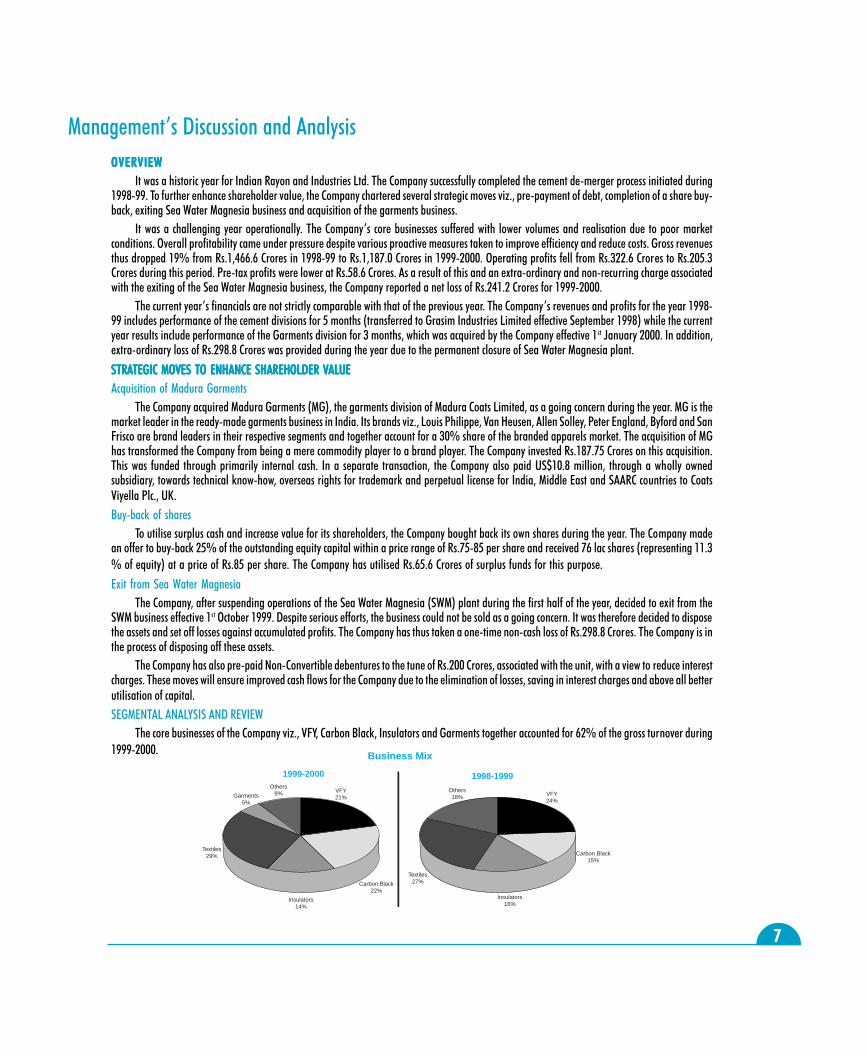
The core businesses of the Company viz., VFY, Carbon Black, Insulators and Garments together accounted for 62% of the gross turnover during1999-2000.
Management�s Discussion and Analysis
Garments5%
Others9% VFY
21%
1999-2000
Business Mix
1998-1999
Carbon Black22%
Insulators14%
Others18% VFY
24%
Carbon Black15%
Insulators16%
Textiles27%
Textiles29%
88888
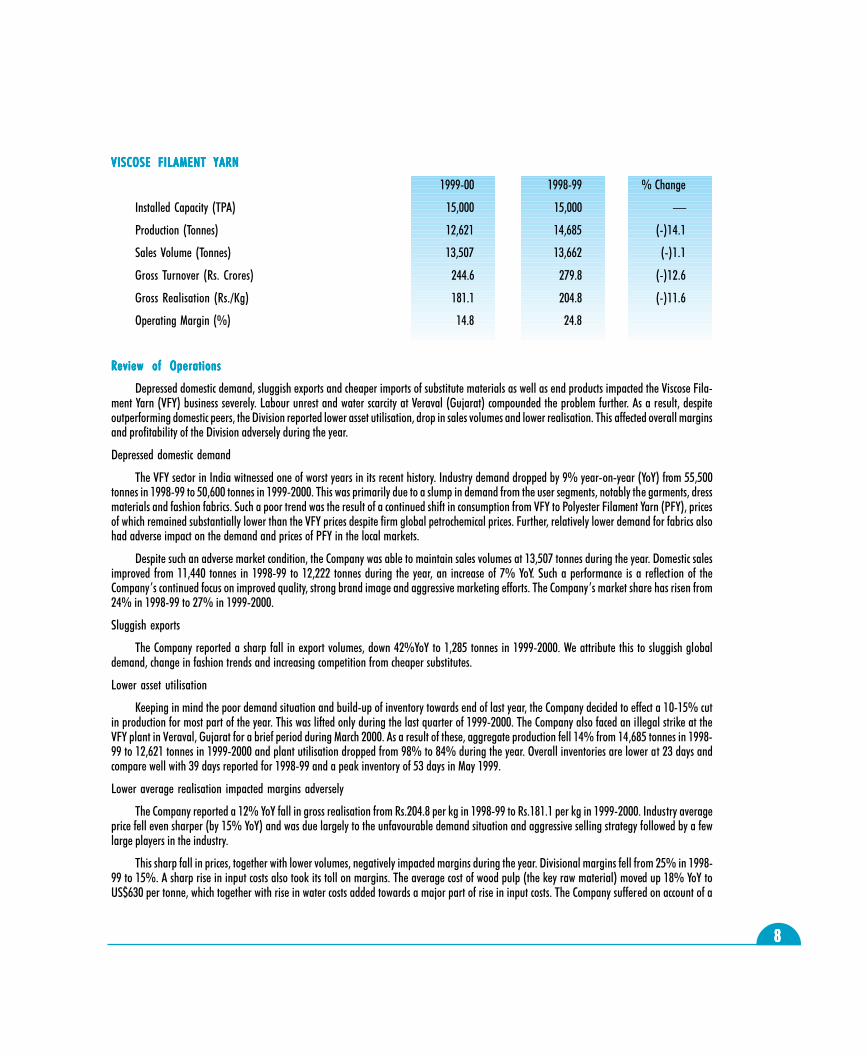
VISCOSE FILAMENT YARNVISCOSE FILAMENT YARNVISCOSE FILAMENT YARNVISCOSE FILAMENT YARNVISCOSE FILAMENT YARN
1999-00 1998-99 % Change
Installed Capacity (TPA) 15,000 15,000 �
Production (Tonnes) 12,621 14,685 (-)14.1
Sales Volume (Tonnes) 13,507 13,662 (-)1.1
Gross Turnover (Rs. Crores) 244.6 279.8 (-)12.6
Gross Realisation (Rs./Kg) 181.1 204.8 (-)11.6
Operating Margin (%) 14.8 24.8
Review of OperationsReview of OperationsReview of OperationsReview of OperationsReview of Operations
Depressed domestic demand, sluggish exports and cheaper imports of substitute materials as well as end products impacted the Viscose Fila-ment Yarn (VFY) business severely. Labour unrest and water scarcity at Veraval (Gujarat) compounded the problem further. As a result, despiteoutperforming domestic peers, the Division reported lower asset utilisation, drop in sales volumes and lower realisation. This affected overall marginsand profitability of the Division adversely during the year.
Depressed domestic demand
The VFY sector in India witnessed one of worst years in its recent history. Industry demand dropped by 9% year-on-year (YoY) from 55,500tonnes in 1998-99 to 50,600 tonnes in 1999-2000. This was primarily due to a slump in demand from the user segments, notably the garments, dressmaterials and fashion fabrics. Such a poor trend was the result of a continued shift in consumption from VFY to Polyester Filament Yarn (PFY), pricesof which remained substantially lower than the VFY prices despite firm global petrochemical prices. Further, relatively lower demand for fabrics alsohad adverse impact on the demand and prices of PFY in the local markets.
Despite such an adverse market condition, the Company was able to maintain sales volumes at 13,507 tonnes during the year. Domestic salesimproved from 11,440 tonnes in 1998-99 to 12,222 tonnes during the year, an increase of 7% YoY. Such a performance is a reflection of theCompany�s continued focus on improved quality, strong brand image and aggressive marketing efforts. The Company�s market share has risen from24% in 1998-99 to 27% in 1999-2000.
Sluggish exports
The Company reported a sharp fall in export volumes, down 42%YoY to 1,285 tonnes in 1999-2000. We attribute this to sluggish globaldemand, change in fashion trends and increasing competition from cheaper substitutes.
Lower asset utilisation
Keeping in mind the poor demand situation and build-up of inventory towards end of last year, the Company decided to effect a 10-15% cutin production for most part of the year. This was lifted only during the last quarter of 1999-2000. The Company also faced an illegal strike at theVFY plant in Veraval, Gujarat for a brief period during March 2000. As a result of these, aggregate production fell 14% from 14,685 tonnes in 1998-99 to 12,621 tonnes in 1999-2000 and plant utilisation dropped from 98% to 84% during the year. Overall inventories are lower at 23 days andcompare well with 39 days reported for 1998-99 and a peak inventory of 53 days in May 1999.
Lower average realisation impacted margins adversely
The Company reported a 12% YoY fall in gross realisation from Rs.204.8 per kg in 1998-99 to Rs.181.1 per kg in 1999-2000. Industry averageprice fell even sharper (by 15% YoY) and was due largely to the unfavourable demand situation and aggressive selling strategy followed by a fewlarge players in the industry.
This sharp fall in prices, together with lower volumes, negatively impacted margins during the year. Divisional margins fell from 25% in 1998-99 to 15%. A sharp rise in input costs also took its toll on margins. The average cost of wood pulp (the key raw material) moved up 18% YoY toUS$630 per tonne, which together with rise in water costs added towards a major part of rise in input costs. The Company suffered on account of a
99999
failed/delayed monsoon in the Saurashtra region in Gujarat. The Company uses large quantities of water for VFY manufacturing. The monsoonfailure compelled the Company to source water through tankers from nearby villages, pushing up overall costs significantly. The impact would havebeen larger but for excellent efforts taken by the Company to bring down water consumption. The average daily consumption has been brought downfrom 15,000 M3 per day in April 1999 to 9000 M3 per day currently.
The Company arrested a further fall in margins by reducing power costs. With the stabilisation of its captive power plants and the resultant risein share of captive power in total consumption, up from 15% in 1998-99 to 31% in 1999-2000. The aggregate power costs dropped by over 7% to Rs.2.9 Crores in 1999-2000, in turn impacting margins positively during the year.
OutlookOutlookOutlookOutlookOutlook
The outlook for the VFY industry remains challenging. We believe that the industry is at the bottom of its cycle and has a limited downside. Wealso see limited upside due to the changing fashion trends and the continuing shift in consumption in favour of PFY in the global as well as domesticmarkets. The prevailing gap in the prices of VFY and PFY is substantive. It is inducing consumers to shift to PFY, in turn adversely affecting long termprospects of this mature industry.
In our view, the industry is likely to go through a consolidation process, if current sluggish trend continue for sometime. We expect largeplayers to gain from the consolidation process with smaller players coming under pressure of lower volumes, prices and liqudity. This will enablelarge players increase market share and ensure reasonable growth in volumes over the next 2-3 years.
The Company expects prices to remain stable over the next few years. Given the mediocre demand outlook, VFY prices may not firm up in thenear future. At the same time, the Company does not expect prices to fall from these levels due to firm outlook for global petrochemical prices(which determine prices of competing materials) and the benefits of likely industry consolidation in the near future.
Outlook for Indian ROutlook for Indian ROutlook for Indian ROutlook for Indian ROutlook for Indian Rayonayonayonayonayon�s VFY Business�s VFY Business�s VFY Business�s VFY Business�s VFY Business
Indian Rayon, being one of the two largest players with a significant cost advantage, will benefit from the likely industry consolidation andreport a higher market share. It hopes to attain satisfactory growth in the future. The Company�s strategy for this business is to concentrate onincreasing its market share for higher volumes and focus on cost reduction to improve margins.
Increasing market share
Given its strong market position and cost advantages, the Company is fully geared to capitalise on the opportunities, likely to emerge with theindustry consolidation. The Company will focus on improving quality of products and customer service, leverage on the benefits of recent investmentsin technology to widen exports and strengthen regional presence to take advantage of growth in select user segments. The Company has set up acontinuous-spun-yarn plant set up at the existing location last year. This plant uses superior technology and generates high quality output. This willenable the Company to improve export volumes significantly in the future.
In addition, the Company is focussing on strengthening its presence in the Southern regional markets, where use of VFY in Saree manufacturingis gaining momentum due to the changing fashion trends. It aims to capitalise on this trend by strengthening its regional distribution network toensure higher volumes. These measures should enable utilisation of existing assets optimally in future.
Reducing costs further
Wood pulp, water and labour costs are the biggest cost components accounting for 51% of the cost of production. To enhance margins in future,the stress is on reducing these costs further. The options available with it, for reducing wood pulp cost, due to import dependence, is limited. It isevaluating possibility of sourcing Wood pulp from local suppliers, subject to quality issues.
To lower water costs and minimise the impact of the vagaries of monsoon, the Company is setting up a desalination plant at Veraval. The plantwill leverage on its proximity to sea and ensure uninterrupted water supply throughout the year.
The Company is also in the process of right-sizing its labour force at the VFY plant. It has already entered into an agreement with the labourunions for reduction of manpower and has floated a modified Voluntary Retirement Scheme (VRS) during mid-1999-2000.
1010101010
CARBON BLACKCARBON BLACKCARBON BLACKCARBON BLACKCARBON BLACK
1999-00 1998-99 % Change
Effective Installed Capacity (TPA) 98,750* 80,417* 22.8
Production (Tonnes) 95,828 63,968 49.8
Sales Volume (Tonnes) 94,656 61,243 54.6
Gross Turnover (Rs. Crores) 262.7 176.5 48.8
Gross Realisation (Rs./Ton) 27,751 28,826 (-)3.7
Operating Margin (%) 19.3 23.0
* Installed capacity moved up to 110,000 tonnes towards end of the year with the de-bottlenecking of existing plants.
RRRRReview of Operationseview of Operationseview of Operationseview of Operationseview of Operations
The Carbon Black division reported impressive performance on the back of a recovery in domestic demand and strong exports. Operatingmargins dropped marginally due to a sharp rise in feedstock prices, which could be passed on to customers only partially. The new plant near Chennaistabilised operations successfully and leveraged on the advantages of coastal location to improve exports substantially.
The aggregate sales volume jumped 55% from 61,243 tonnes in 1998-99 to 94,656 tonnes in 1999-2000, consequent to the improved localdemand and better exports. Aggressive marketing and support of increased supplies from the new plant also contributed towards sharp rise involumes during the year. The Company�s market share has risen from 28% in 1998-99 to 31% during the year.
The domestic carbon black demand grew by 11%YoY benefiting from a turnaround in the automobile sector and the resultant rise in demandfor tyres, the single largest user segment. The introduction of new cars by multinational corporations and the rising aspiration levels of consumersappear to have led to a high demand for cars. This had a positive impact on the demand for carbon black during the year.
On the export front, the Company benefited from a strong recovery in Asian demand and also leveraged on the coastal advantages of its newplant near Chennai commissioned last year. Consequently, export volumes soared from 1,572 tonnes in 1998-99 to 8,769 tonnes in 1999-2000,reflecting an increase of 58% YoY. Reflecting such a sharp rise in domestic as well as export sales volumes, the Company improved asset utilisationfrom 80% in 1998-99 to 97% during the year. This is commendable considering that the year under review was the first full year of operations for theCompany�s new plant near Chennai.
The average realisation is marginally lower at Rs.27,751 per tonne and indicates a fall of 4% YoY. The fall would have been sharper except fora rise in global carbon black prices and lower quantities of dumping by overseas players with the pick-up in demand in their respective countries.Global carbon black prices have grown from US$ 320 per tonne in April 1999 to around US$375 per tonne during March 2000.
The company suffered a set back in terms of operating margins, which fell from 23% in 1998-99 to around 19% in 1999-2000, despiteimproved volumes and marginally higher prices. The rise in the landed cost of Carbon Black Feed Stock (CBFS), a key input accounting for 65% of thedivisional production cost was the major influencing factor. CBFS prices have gone up by 50% to US$ 130 per tonne during the year, due to a spurt ininternational crude oil prices. The impact of such a sharp rise in feed stock prices would have been even larger, but for further improvement inconsumption norms and lower production costs. A significant portion of the increase in CBFS cost has been passed on to the customers.
OutlookOutlookOutlookOutlookOutlook
We see a positive outlook for the Division. We expect the automobile sector to report sustained strong performance over the next few years. Thisis likely to gain momentum in the years to come with the introduction of new models by multinational automobiles companies in India. Such adevelopment augurs well for the carbon black business, as the automobile sector drives growth in the demand for tyres. We forecast domestic carbonblack demand to grow by 6-8% annually.
The outlook for exports is buoyant as well. The recovery process in Asia, which began in 1999 is likely to continue in the short term. It will resultin a strong demand from Asian tyre manufacturers and offer better export prospects. In addition, the demand in Asia will lower the dumping of carbonblack in the domestic market at uneconomical prices.
1111111111
The domestic price of carbon black is expected to remain stable in the near future. Given the firm outlook for CBFS prices (in turn due to thefirm global oil price outlook) and continuing strong demand for carbon black in the global markets, international carbon black prices are not expectedto fall significantly in the near future.
Outlook for Indian ROutlook for Indian ROutlook for Indian ROutlook for Indian ROutlook for Indian Rayonayonayonayonayon�s Carbon Black Business�s Carbon Black Business�s Carbon Black Business�s Carbon Black Business�s Carbon Black Business
The Company is fully geared to capitalise on the emerging opportunities from the recovery in the domestic demand and pickup in exports toAsia. The Company�s strategy for this business is three pronged:
Improve volumes
The Company�s strategy to increase sales volume is through an increase in market share, widening product range and focus on marketdevelopment. The Company will pursue aggressive marketing strategies and offer unmatched customer service. The Company will fully exploit theadvantages of its split location i.e., one plant in Renukoot in North India and the other unit near Chennai in South India, to ensure timely and cost-effective distribution. Its coastal location will enable improve export volumes, which currently accounts for 9% of aggregate volumes.
Widening product range through introduction of new grades of carbon black, used in the manufacturing of high mileage, low resistance tyresis on the anvil. The Company is at an advanced stage of approval and these new grades of carbon black will open-up new segments and ensure highervolumes in future. The Company is also developing non-tyre markets for carbon black to augment volumes in future. Non-tyre applications currentlyaccount for only 15 �18% of the total volume.
Improve asset productivity
The Company�s strategy to improve asset productivity is to de-bottleneck existing facilities and unlock full potential of the existing assets. Thiswill offer significant cost advantage and also enable the Company capitalise on the distribution and export infrastructure developed by the companyover the years. The de-bottlenecking process initiated towards end of last year stands completed and has led to an increase in installed capacity from95,000 tonnes to 1,10,000 tonnes. This upscaled capacity will be operational for the full year during 2000-01 and enable the Company utilise theseassets optimally.
A renewed thrust is on the efficient utilisation of power assets in future. With the setting up of new turbines, the Company now is in a positionto generate additional quantities of power. Keeping this in mind, we have entered into an agreement with the Tamil Nadu Electricity Board for saleof surplus power, which should enable it utilise power assets optimally. In so doing, it also unlocks value for shareholders.
Enhance margins
The Company will benefit from the planned introduction of new grades of carbon black, which offers higher realisation, given the uniquefeatures of the new product. The intent is to fully capitalise on this opportunity and benefits of economies of scale, likely with improvement in volumesand capacity utilisation, to enhance margins in future. The emphasis on reducing manufacturing costs is ongoing.
INSULAINSULAINSULAINSULAINSULATTTTTORSORSORSORSORS
1999-00 1998-99 % Change
Installed Capacity (TPA) 34,000 34,000 -
Production (Tonnes) 24,353 24,026 1.4
Orders in Hand (Tonnes) 13,168 11,535 14.0
Gross Turnover (Rs. Crores) 167.0 185.8 (-)10.1
Operating Margin (%) 14.1 25.8
RRRRReview of Operationseview of Operationseview of Operationseview of Operationseview of Operations
It was a difficult year for the Insulator division. With the domestic demand situation turning sluggish and with continuing intense competitionglobally, overall volumes remained flat. The average realisation for the full year dropped sharply. The export sector helped to contain therealisation. The performance of the division was unsatisfactory during the first half of 1999-2000 due to factors beyond its control, but demonstratedconsiderable improvement during the subsequent quarters.
1212121212
Weak domestic demand
Domestic demand fell by over 25% in 1999-2000. The restructuring of the State Electricity Boards (SEB), resulted in a poor off-take from thissingle largest consuming sector. Lower than budgeted investments for development of infrastructure in the Power sector by the Government of Indiaadded to the poor demand situation during the year.
Intensified local competitionThe organised sector also suffered due to increased competition from the smaller manufacturers in the lower-end of the distribution segment
of the Insulators market.
Strong export performance supported volumes during 1999-2000
Mirroring this difficult industry environment, domestic sales volumes dropped 10% YoY despite aggressive marketing efforts by the Company.The Company consciously decided to focus on export markets, and leveraged its distribution network as well as excellent relationship with OEMs andutilities abroad to push export volumes. As a result, export volumes improved by 22% to 9,159 tonnes during the year. But for this strong supportfrom exports, the aggregate sales volumes would have taken a hit during the year.
Realisation down 13%YoYThe average net realisation was lower by 13% YoY. This was primarily due to a 15% fall in domestic realisation and is the reflection of lower
domestic demand and increased market competition. Export realisation was 47% higher than the average realisation in the local market, despitebeing 16% lower than that for 1998-99. The relatively better market conditions abroad and the Company�s focus on quality conscious customersfacilitated exports.
OutlookOutlookOutlookOutlookOutlook
The overall outlook for the insulators business is positive and is predicated on the likely increase in the Government�s spending on buildinginfrastructure for the power sector as well as the proposed entry of private sector in the Transmission and Distribution segment of the power sector. Thelikely completion of the restructuring process at the State Electricity Boards and resultant inflow of orders may boost the domestic demand over thenext few years. The probable shift in the procurement mechanism post-restructuring (insulators to be bought by EPC contractors instead of SEBs) is agood portend for the sector. No substantial increase in competition in the organised sector is foreseen due to the high entry barriers. The emergenceof substitute products like polymer insulators may have negative effect on the demand, but this is unlikely to be significant in the short to mediumterm.
On the export front, the outlook remains positive due to the improved demand from Asia with the economic recovery and strong demand fromother emerging markets. Competition from China is still an issue, but is unlikely to intensify in the immediate future due to quality concerns andmarked preference for quality products from the user segments.
Outlook for Indian ROutlook for Indian ROutlook for Indian ROutlook for Indian ROutlook for Indian Rayonayonayonayonayon�s Insulator Business�s Insulator Business�s Insulator Business�s Insulator Business�s Insulator BusinessThe Company carries forward a healthy order book of 6 months . The Compay�s strategy for ensuring profitable growth in this business is to
focus on high value products, explore new markets, leverage on existing relationship with customers and cut cost through improvement in operationalefficiencies and lower rejections.
Focus on high value products
To overcome competition from the unorganised sector and move up the value chain to ensure profitable growth, the Company is focusing onproducts which have high growth potential and offer better margins. In addition, the Company will be able to capitalise on its product quality in thisquality conscious, high value segment of the insulator industry.
Explore new markets
The Company is developing new products to meet the customer needs in the emerging new segment of the industry. New products for HighVoltage Direct Current (HVDC) segment and high rating products are in its pipeline. During the year, we successfully type tested the unit of high ratingDisc insulators of 210KN. New products such as Isolators will be launched. A push to Lightening Arrestors will augment its efforts to penetrate newermarkets.
1313131313
Leveraging on existing relationship
The Company has developed a strong relationship with large OEMs and overseas utility companies over the year, which it aims to leverage togrow export volumes in future. Given that these large customers focus primarily on quality, the Company expects to benefit immensely from such astrong relationship.
Focusing on further reduction in costs
The Company is one of the low cost producers of insulators globally. To accelerate upon its cost competitiveness further in the market place, theCompany will focus on greater optimisation through further improvements in consumption norms and reduced rejections. To control total businesscost, value engineering all aspects of business systems is being undertaken.
GARMENTS DIVISIONGARMENTS DIVISIONGARMENTS DIVISIONGARMENTS DIVISIONGARMENTS DIVISION
The Company acquired Madura Garments (MG), the readymade garments division of Madura Coats, Indian subsidiary of Coats Viyella, UK,during the year. MG was acquired as a going concern together with the employees, brands, manufacturing and distribution network for a sum ofRs.187.75 Crores.
Madura Garment�s brands viz., Louis Philippe, Van Heusen, Allen Solley, Peter England, Byford and San Frisco are brand leaders in theirrespective segments. These brands together have a market share of 30% in India. MG has an excellent, loyal and dynamic distribution networkconsisting of 4 mega stores, 2 Trouser Towns, 45 Dress Circles, 185 franchisee showrooms and over 1600 multi-brand outlets spread across the Country.
Strategically important, this will transform Indian Rayon from being a pure commodity player to a brand player. More importantly, MG is themarket leader in the ready made garments sector, which has grown at 30-40% per annum and is expected to grow by at least by 25% per annum inthe future. The acquisition will bring much needed growth for Indian Rayon and enhance value for shareholders.
RRRRReview of Operationseview of Operationseview of Operationseview of Operationseview of Operations
As the Company�s acquisition of Madura Garments became effective from 1st January 2000, the performance of the division relates only to thefourth quarter of 1999-2000. The Division reported a turnover of Rs.57.2 Crores, reflecting a growth of 19% over the corresponding quarter of theprevious year, when the Company was part of Madura Coats Limited.
Subsequent to the acquisition, the Company has made various strategic moves during the fourth quarter of 1999-2000, aimed at furtherstrengthening of its market position and ensuring sustainable growth in the future. The Company tied-up with an Italian contractor for technology anddesigns for manufacturing trousers. It opened two exclusive trousers show rooms - �Trouser Towns� � one in Chennai and the other in Ahmedabadduring the year.
OutlookOutlookOutlookOutlookOutlook
The outlook for readymade garments is extremely positive. The size of the men�s readymade garment market (RMG) is around Rs.6,000 Croresat present and is expected to reach the level of Rs.15,000 Crores by 2010, an increase of 10% per annum. However, the branded segment currentlyaccounts for only 25% of the RMG market and is expected to rise to 45-50% by 2010. This would mean a CAGR of 25% of the branded segment. Thegrowth is likely to be more prominent in the trouser and casual wear segments. Changing customer aspirations and lifestyles (an outcome of risingpurchasing power and impact of media explosion), emergence of large scale organised retailing in the country and increasing number of new brandsin the mid-value/economy segments, inducing the common man to shift towards the branded segment of RMG industry � will be pursuing this growth.
Outlook for Indian ROutlook for Indian ROutlook for Indian ROutlook for Indian ROutlook for Indian Rayonayonayonayonayon�s Garments Division�s Garments Division�s Garments Division�s Garments Division�s Garments Division
The Company took-over Madura Garments, keeping in mind such a growth opportunity. To capitalise on the emerging opportunity, the Com-pany will be focusing on consolidating and leveraging its existing brand equity in the short term and on growth by accelerating conversions, groomingaspirations and entering new markets that offer high growth potential.
Consolidating and Leveraging Brand Equity in the Short term
The Company�s strategy on this front is three pronged viz., Product strategy, Retailing strategy and Branded exports, as discussed below.
Product strategy
The Company will focus on vitalising existing brands by launching new seasonal collections. Action on this front has been initiated with thelaunching of Allen Solly �Uncrushables�, Van Heusen �Durafresh�, Louis Philippe �Super Permapress� and San Frisco �Zero Wrinkle�, as part of itsSummer 2000 initiatives. Appropriate line extensions to leverage on brand investments form its focal point. This is similar to its recent extensions
1414141414
like the introduction of �Elements�casuals from Peter England and �Byford Cargos� bottom-weights by Byford introduced during the year. TheCompany will strive to ensure growth ahead of the market by leveraging its existing brands and through optimum use of its strong distributionnetwork even in future.
Retailing Strategy
New retailing formats to grow its current portfolio and compliment traditional channels with innovative initiatives in �Click and Mortar� will becreated.
The Company created a net retail format by setting up exclusive all-trouser mega stores in the name of �Trouser Town� in the cities of Chennaiand Ahmedabad during last quarter of 1999-2000. These mega show-rooms have received excellent response from its target audience within a shorttime. Creation of such Trouser Towns as well as similar retail formats even in future is on cards.
Plans to take new initiatives in the �Click & Mortar�, which will compliment traditional distribution channels. It will go a long way in strength-ening our brand image and distribution network. This will be achieved through creation of its distinctive brand site as well as I-Malls and portals injoint venture with established players.
Branded Exports
The Company will focus on strengthening existing structure and create a new structure, where required, for exporting its brands to SAARCcountries and Middle East, while also focusing on expansion of existing distribution network for Van Heusen, Louis Philippe and Peter England. TheCompany aims to have a complete portfolio presence in its key markets of the SAARC countries and Middle East in the near future.
Growth Strategy for Medium Term
The Company�s strategy for growth in the medium term is through acceleration of conversions, addressing life styles and entering new marketsthat offer high growth potential. Its endeavour will be to accelerate the process of conversion from �tailor-made� to �ready-made� segments throughaggressive promotion and marketing efforts. These are expected to boost the industry demand and in turn benefit the Company, being the marketleader. The Company will work ceaselessly on grooming aspirations and addressing relevant lifestyles with wardrobe and line extensions, with theultimate objective of strengthening of its market position and ensuring a sustained growth in the future. Finally, the Company will evaluate possibili-ties of entering new markets with high growth potential to generate �critical mass� in the women�s wear as well as the active wear segments of theRMG industry. These measures, along with continued focus on leveraging existing strong brand equity discussed earlier, will go a long way in ensuringstrong, profitable growth in the Garments business going forward.
TEXTILESTEXTILESTEXTILESTEXTILESTEXTILES
RRRRReview of Operationseview of Operationseview of Operationseview of Operationseview of Operations
The company pursued rightsizing of its operations by emphasising on higher margin products and reducing the output of low margin products.The division concentrated on three key products viz., Flax yarn, Worsted yarn and Synthetic yarn during the year. Aggregate exports accounted for45% of divisional revenues.
Flax Yarn � the capacity utilisation increased by 9% due to higher fashion led demand. Realisations also saw an increase of 8.5% thoughmanufacturing cost went up on account of high raw material cost and adverse $-Rs parity.
Worsted Yarn - Despite capacity utilisation going up by 13%, the total volume decreased due to spinning of finer counts. This also helpedmaintain operating margins despite a 5% fall in average realisations during the year.
Synthetic yarn - The plant maintained its capacity utilisation at 97% though volume reduced by 18% on account of the ongoing downsizingprogramme. Realisation was up by 14% and enabled the unit make operating profits during the year.
OutlookOutlookOutlookOutlookOutlook
The demand for flax yarn is expected to grow at a CAGR of 10% in the next 3 years though competition is likely to intensify due to cheap importsfrom China. This is likely to keep the prices under pressure. In the worsted yarn industry over capacity is likely to continue. The company is activelydeveloping customised products to achieve better returns. To counter the poor domestic market for synthetic yarn, the company is developing exportsmarket and also developing new products. The company will continue to downsize its synthetic operations to make it more competitive in the worldmarket.
1515151515
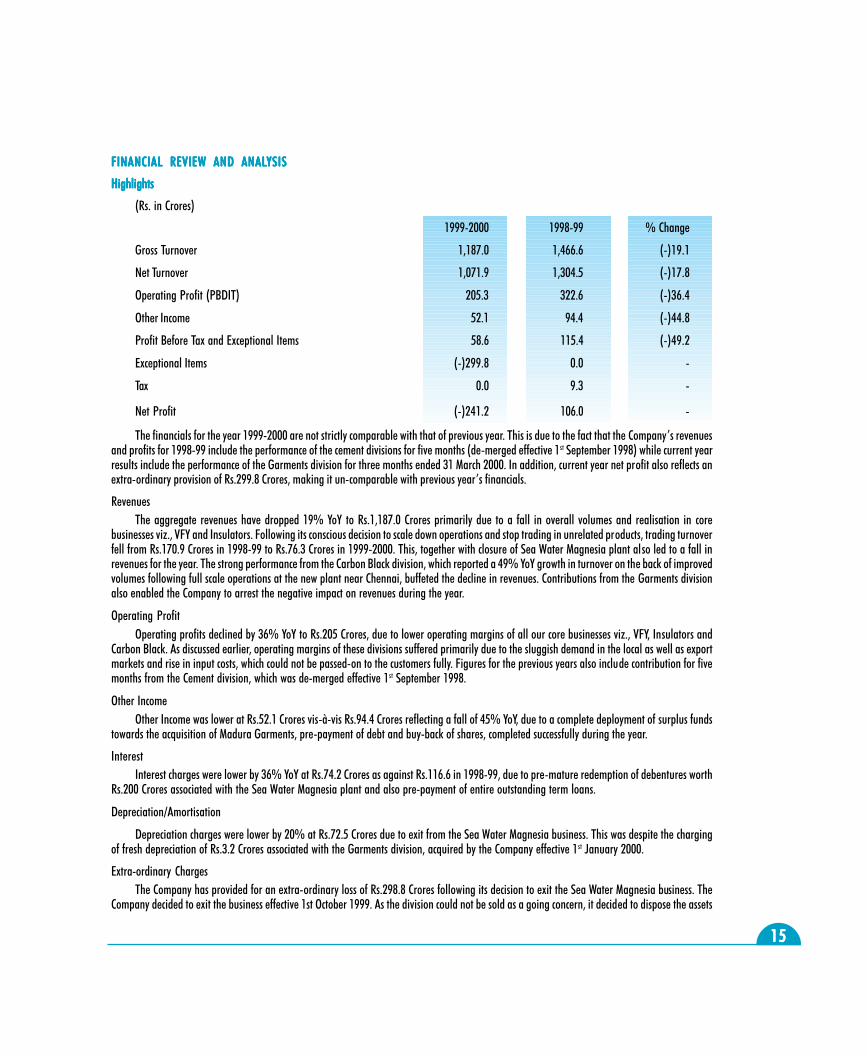
FINANCIAL REVIEW AND ANALFINANCIAL REVIEW AND ANALFINANCIAL REVIEW AND ANALFINANCIAL REVIEW AND ANALFINANCIAL REVIEW AND ANALYSISYSISYSISYSISYSIS
HighlightsHighlightsHighlightsHighlightsHighlights
(Rs. in Crores)
1999-2000 1998-99 % Change
Gross Turnover 1,187.0 1,466.6 (-)19.1
Net Turnover 1,071.9 1,304.5 (-)17.8
Operating Profit (PBDIT) 205.3 322.6 (-)36.4
Other Income 52.1 94.4 (-)44.8
Profit Before Tax and Exceptional Items 58.6 115.4 (-)49.2
Exceptional Items (-)299.8 0.0 -
Tax 0.0 9.3 -
Net Profit (-)241.2 106.0 -
The financials for the year 1999-2000 are not strictly comparable with that of previous year. This is due to the fact that the Company�s revenuesand profits for 1998-99 include the performance of the cement divisions for five months (de-merged effective 1st September 1998) while current yearresults include the performance of the Garments division for three months ended 31 March 2000. In addition, current year net profit also reflects anextra-ordinary provision of Rs.299.8 Crores, making it un-comparable with previous year�s financials.
RevenuesThe aggregate revenues have dropped 19% YoY to Rs.1,187.0 Crores primarily due to a fall in overall volumes and realisation in core
businesses viz., VFY and Insulators. Following its conscious decision to scale down operations and stop trading in unrelated products, trading turnoverfell from Rs.170.9 Crores in 1998-99 to Rs.76.3 Crores in 1999-2000. This, together with closure of Sea Water Magnesia plant also led to a fall inrevenues for the year. The strong performance from the Carbon Black division, which reported a 49% YoY growth in turnover on the back of improvedvolumes following full scale operations at the new plant near Chennai, buffeted the decline in revenues. Contributions from the Garments divisionalso enabled the Company to arrest the negative impact on revenues during the year.
Operating ProfitOperating profits declined by 36% YoY to Rs.205 Crores, due to lower operating margins of all our core businesses viz., VFY, Insulators and
Carbon Black. As discussed earlier, operating margins of these divisions suffered primarily due to the sluggish demand in the local as well as exportmarkets and rise in input costs, which could not be passed-on to the customers fully. Figures for the previous years also include contribution for fivemonths from the Cement division, which was de-merged effective 1st September 1998.
Other IncomeOther Income was lower at Rs.52.1 Crores vis-à-vis Rs.94.4 Crores reflecting a fall of 45% YoY, due to a complete deployment of surplus funds
towards the acquisition of Madura Garments, pre-payment of debt and buy-back of shares, completed successfully during the year.
InterestInterest charges were lower by 36% YoY at Rs.74.2 Crores as against Rs.116.6 in 1998-99, due to pre-mature redemption of debentures worth
Rs.200 Crores associated with the Sea Water Magnesia plant and also pre-payment of entire outstanding term loans.
Depreciation/Amortisation
Depreciation charges were lower by 20% at Rs.72.5 Crores due to exit from the Sea Water Magnesia business. This was despite the chargingof fresh depreciation of Rs.3.2 Crores associated with the Garments division, acquired by the Company effective 1st January 2000.
Extra-ordinary ChargesThe Company has provided for an extra-ordinary loss of Rs.298.8 Crores following its decision to exit the Sea Water Magnesia business. The
Company decided to exit the business effective 1st October 1999. As the division could not be sold as a going concern, it decided to dispose the assets
1616161616
and set off losses against free reserves. All outstanding assets at the year-end have been marked at their realisable value and the balance has beenprovided as an extra-ordinary provision during the year.
In addition, the Company charged Rs.1.0 Crores as an extra-ordinary expense incurred towards the share buy-back programme, thus taking thetotal extraordinary charge to Rs.299.8 Crores during the year.
Income TIncome TIncome TIncome TIncome TaxaxaxaxaxThe Company reported a pre-tax profit of Rs.58.6 Crores vis-à-vis Rs.115.4 Crores in 1998-99. The Company did not provide for taxes due to the
extra-ordinary write-off, which resulted in a net loss of Rs.241.2 Crores for the year.
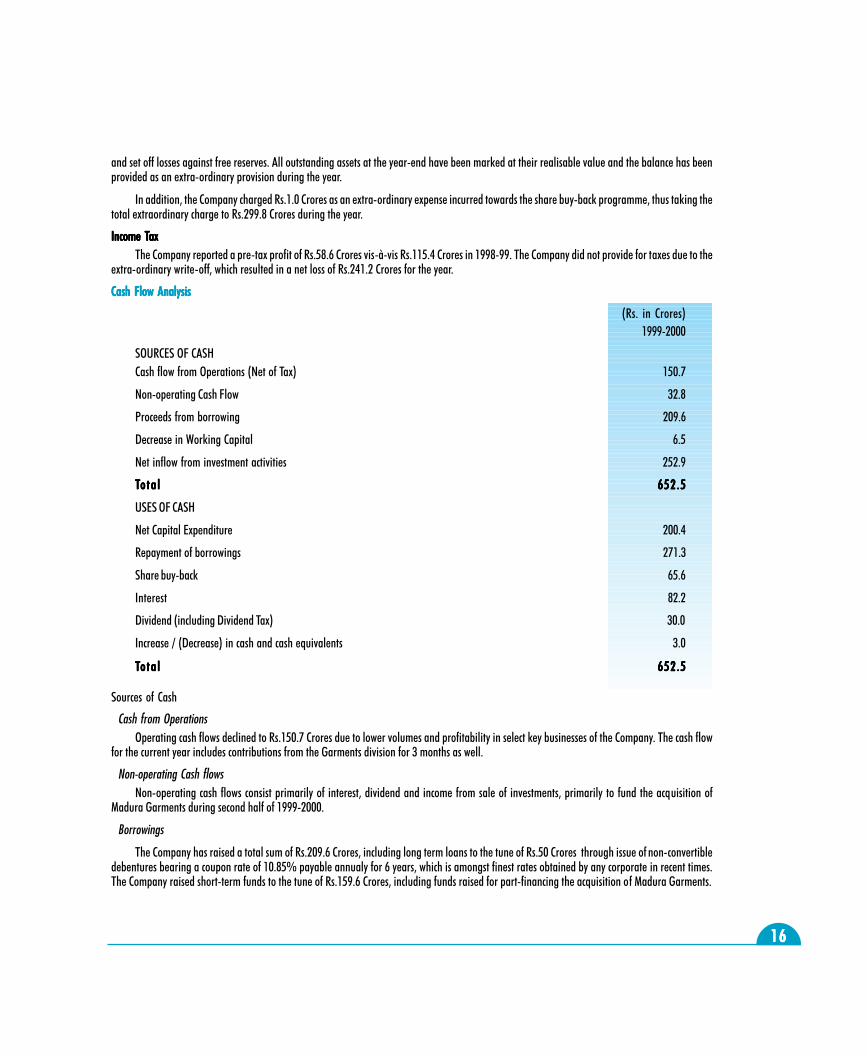
Cash Flow AnalysisCash Flow AnalysisCash Flow AnalysisCash Flow AnalysisCash Flow Analysis
(Rs. in Crores)1999-2000
SOURCES OF CASHCash flow from Operations (Net of Tax) 150.7
Non-operating Cash Flow 32.8
Proceeds from borrowing 209.6
Decrease in Working Capital 6.5
Net inflow from investment activities 252.9
TTTTTo ta lo ta lo ta lo ta lo ta l 652 .5652 .5652 .5652 .5652 .5
USES OF CASH
Net Capital Expenditure 200.4
Repayment of borrowings 271.3
Share buy-back 65.6
Interest 82.2
Dividend (including Dividend Tax) 30.0
Increase / (Decrease) in cash and cash equivalents 3.0
TTTTTo ta lo ta lo ta lo ta lo ta l 652 .5652 .5652 .5652 .5652 .5
Sources of Cash
Cash from OperationsOperating cash flows declined to Rs.150.7 Crores due to lower volumes and profitability in select key businesses of the Company. The cash flow
for the current year includes contributions from the Garments division for 3 months as well.
Non-operating Cash flowsNon-operating cash flows consist primarily of interest, dividend and income from sale of investments, primarily to fund the acquisition of
Madura Garments during second half of 1999-2000.
Borrowings
The Company has raised a total sum of Rs.209.6 Crores, including long term loans to the tune of Rs.50 Crores through issue of non-convertibledebentures bearing a coupon rate of 10.85% payable annualy for 6 years, which is amongst finest rates obtained by any corporate in recent times.The Company raised short-term funds to the tune of Rs.159.6 Crores, including funds raised for part-financing the acquisition of Madura Garments.
1717171717
Investments
The net inflow from liquidation of investment was Rs. 252.9 crores during the year. This was used to pre pay debt, buy back shares and partfinance acquisition of Madura Garments. The Company invested Rs.2.0 Crores in other companies of the Aditya Birla Group, including Rs.1.5 Croresin Birla AT&T Communications Limited and Rs.0.5 Crores in Bina Power Supply Co. Limited. These were part of commitments made by the Companyin the past few years.
Uses of Cash
Capital Expenditure
The Company has invested Rs.204.1 Crores during the year. Of this, Rs.166.1 Crores was invested towards acquisition of Madura Garments andbalance was used for normal capital expenditures.
Debt Repayment
The Company has pre-paid/re-paid long-term debt to the tune of Rs.271.3 Crores during the year. Consequent to this, despite fund raisedduring the year, the Company�s debt-equity ratio dropped from 0.37x in 1998-99 to 0.28x in 1999-2000.
Dividend
The Company paid a sum of Rs.30.0 Crores towards dividend for the year 1998-99. The Board has proposed a dividend of Rs.1.0 per share forthe year 1999-2000. This is the maximum permissible dividend that can be announced by the Company under the present regulations. With theCompany�s decision to write-off a sum of Rs.299 Crore following the closure of Sea Water Magnesia Plant and the resultant loss for the year 1999-2000, the Company was constrained to limit the dividend to the tune of 10% for the year. The proposed dividend, including the Corporate Tax onDividends would mean an outflow of Rs.6.6 Crores during the year under review.
DELIVERING ENHANCED VDELIVERING ENHANCED VDELIVERING ENHANCED VDELIVERING ENHANCED VDELIVERING ENHANCED VALALALALALUE TUE TUE TUE TUE TO SHAREHOLDERS IN THE NEW MILLENNIUMO SHAREHOLDERS IN THE NEW MILLENNIUMO SHAREHOLDERS IN THE NEW MILLENNIUMO SHAREHOLDERS IN THE NEW MILLENNIUMO SHAREHOLDERS IN THE NEW MILLENNIUM
The Company has gone through one of the more difficult years in its recent history. However, as discussed earlier, most of its core businesses areshowing visible signs of improvement and appear to be turning around smartly, after having bottomed out, during the second half of 1999-2000.
Having restructured its business portfolio during the past two years, the Company has now become focused and is poised for strong growth in itscore areas namely Garments, Carbon Black, Insulators and VFY. The Company�s strategy for delivering enhanced value to shareholders on a sustain-able basis in the new millennium is through a relentless focus on:
Optimum Asset Utilisation - This will be achieved through improving volumes in the local and export markets by capitalising on its product quality,strong brand equity and excellent distribution network.
Growth in Core Business - Indian Rayon will focus on development of new products, markets and applications in its core businesses to ensurecontinued strong growth in future. Research and Development will become a central area to ensure that the Company changes with the changingneeds of its customers in both traditional as well as new markets.
Improving Cost Competitiveness - The Company will concentrate on further improvements in operational efficiency and cost reduction throughprocess improvements.
Maintenance of a Strong Balance Sheet will be another focal point going forward
CAUTIONARY STCAUTIONARY STCAUTIONARY STCAUTIONARY STCAUTIONARY STAAAAATEMENTTEMENTTEMENTTEMENTTEMENT
Statement in this Management�s Discussion and Analysis describing the Company�s objectives, projections, estimates, expectations or predic-tions may be �forward-looking statements� within the meaning of applicable securities laws and regulations. Actual results could differ materiallyfrom those expressed or implied. Important factors that could make a difference to the Company�s operations include global and Indian demand-supply conditions, finished goods prices, feedstock availability and prices, cyclical demand and pricing in the Company�s principal markets, changes inGovernment regulations, tax regimes, economic developments within India and the countries within which the Company conducts business and otherfactors such as litigation and labour negotiations.
1818181818
CORPORATE GOVERNANCECorporate Governance refers to a combination of laws, regulations, procedures, implicit rules and voluntary practices that enables companiesattract financial and human capital, perform efficiently and thereby maximise long-term value for shareholders, while respecting the aspect ofmultiple stakeholders.Corporate Governance is not a matter of ticking off checklists, it is integral to the very existence of a Company. It strengthens investors� trustand ensures a long-term partnership that helps in fulfilling a company�s quest for higher growth and profits. Corporate governance rests uponfour pillars viz., transparency, full-disclosure, independent monitoring and being fair to all, especially to minority shareholders. A goodcorporate governance policy should ensure thatØ A best possible management team is in placeØ The Board is strong with non-executive and independent directors, who represent interests of all stakeholdersØ The Board effectively monitors management�s progress and key corporate decisionsØ The Board is aware of the concerns of the Company�s shareholdersØ The Management and employees have a stable environmentØ The Board is effectively in control of the Company�s affairsØ The Company�s policies benefit all its shareholdersIn sum, the essence of Corporate Governance is thus the phrase �Your Company�. It is �your� company because it belongs to you, theshareholders. The Chairman and Directors are your fiduciaries and trustees. Their objective is to push the business forward to maximise �your�long-term value.
A Beginning at Indian RayonA Beginning at Indian RayonA Beginning at Indian RayonA Beginning at Indian RayonA Beginning at Indian RayonCorporate Governance is an important cornerstone of the Aditya Birla Group�s objective of creating shareholder value on a sustainable basis.Your Company, a flagship company of the Aditya Birla Group, is no exception. Indian Rayon is committed to benchmarking itself with globalstandards in all areas including corporate governance. Towards this end, this year�s Annual Report has made substantial disclosures on theBoard of Directors, financial and stock performance. In addition, the Company has endeavoured to evaluate and benchmark �your company� withthe guidelines recommended by the SEBI Committee on Corporate Governance.
BOARD OF DIRECTORSComposition of BoardComposition of BoardComposition of BoardComposition of BoardComposition of BoardThe need for having a majority of non-executive directors on the Board is internationally well recognised. Indian Rayon�s board meets thisrequirement as it consists fully of non-executive and independent directors. Four directors on the Board are �Independent� i.e., they have nobusiness relationship with the Company. One director represents Life Insurance Corporation of India.
Director Executive/Non-executive/ Independent # No. of Outside Directorship held
Mr Kumar Mangalam Birla Non-Executive 18 *
Mrs Rajashree Birla Non-Executive 9 **
Mr B L Shah Non-Executive 4 ***
Mr B R Gupta Non-Executive@ 10Mr H J Vaidya Independent 2 ****
Mr D S Dahanukar Independent 6Mr Ashwini Kumar Kanoria Independent 3Mr P Murari Independent 16 ****
# An independent director is
· not a formal executive and has no professional relationship with the company
· not a large customer and / or vendor to the company
· not a close relative of the promoter and / or any executive directors
· not holding a significant stake
· not a nominee of any large shareholder / creditor.* - excluding 18 foreign companies, SEBI, G D Birla Medical Research & Education Foundation and 1 private limited company.
** - excluding 16 foreign companies, G D Birla Medical Research & Education Foundation and 1 private limited company.*** - excluding 1 foreign company and G D Birla Medical Research & Education Foundation
**** - excluding 1 private limited company@�Represents Life Insurance Corporation of India Limited (LIC)
Corporate Governance Report
1919191919
Director�s Interest in the CompanyIndian Rayon�s commitment to transparency goes beyond the statutory requirement. The Company has thus decided to make full disclosuresregarding the interests of, and payments to, all Directors on the Board.
Director Relationship with Business Loans and Remuneration paid during 1999-2000other Directors relationship advances (All figures in Rupees)
with the receivedCompany, from the Sitting Salary & Com- Total
if any Company* fees perks mission
Mr Kumar Mangalam Birla Son of Mrs Rajashree Birla - - 22,000 - - 22,000
Mrs Rajashree Birla Mother ofMr Kumar Mangalam Birla - - 16,000 - - 16,000
Mr B L Shah - - - 45,000 - - 45,000
Mr B R Gupta - Represents LIC - 18,000 - - 18,000
Mr H J Vaidya - - - 43,000 - - 43,000
Mr D S Dahanukar - - - 16,000 - - 16,000
Mr Ashwini Kumar Kanoria - - - 22,000 - - 22,000
Mr P Murari - - - 10,000 - - 10,000
*Note: Indian Rayon has a policy of not advancing any loans and paying any commission from profits to non-executive/independant directors
Attendance record of the DirectorsIt is important for the shareholders to know the number of times the Board had met during the past year as well as attendance record of theirDirectors. Indian Rayon has, therefore, decided to make full disclosure on the board meetings as well as attendance record of all Directors onthe Board.
Director No. of Meetings Attended Last AGM*
Held Attended
Mr Kumar Mangalam Birla 11 11 No
Mrs Rajashree Birla 11 8 No
Mr B L Shah 11 11 Yes
Mr B R Gupta 11 9 No
Mr H J Vaidya 11 10 No
Mr D S Dahanukar 11 2 No
Mr Ashwini Kumar Kanoria 11 11 No
Mr P Murari 11 5 No
* Annual General Meeting (AGM) held on 17th September, 1999 at the Company�s Registered Office at Veraval
2020202020
CORPORATE GOVERNANCE DISCLOSURESAs mentioned earlier, �Your Company� has endeavoured to benchmark itself with the guidelines issued by the Committee on Corporate Governance set up by theSecurities and Exchange Board of India (SEBI). Indian Rayon adheres to most of the recommendations made by the SEBI Committee, but for a few areasfor which the Company is taking steps to implement the same.
Recommendations Complied AlreadyRecommendations Complied AlreadyRecommendations Complied AlreadyRecommendations Complied AlreadyRecommendations Complied Already1. The Board should have an optimum combination of executive and non-executive directors and at least 50% of the Board should comprise
of non-executive directors. Further, at least one-third of the Board should comprise of independent directors where the Chairman is non-executive and at least half of the Board should be independent in case of an Executive Chairman.
The Board consists fully of non-executive and independent directors, with considerable experience in their respective fields. Independentdirectors account for 50% of the Board at present and they have no business and/or professional relationship with the Company.
2. The Board should set up a committee under the chairmanship of a non-executive / independent director to specifically look intoshareholder issues, including share transfers and redressal of shareholder complaints.
Indian Rayon has a Share Transfer Committee at the Board level. This comprises of Mr B L Shah, Mr H J Vaidya and Mr D S Dahanukarwho are the Non-executive / Independent directors of the Company.
The Committee meets at frequent intervals to look after the approval of share transfers and other related matters.
3. To expedite the process of share transfers, the Board should delegate the power of share transfer to an officer or a committee or to theregistrar and share transfer agents. The delegated authority should attend to share transfer formalities at least once in a fortnight.
The Company�s shares are traded in dematerialised form and have to be delivered in the dematerialised from in all Stock Exchanges. Toexpedite the transfer in physical segment, authority has been delegated to the Share Transfer Committee. Officers of the Company havealso been authorised to approve transfer of upto 5,000 shares/debentures each in physical form under one transfer deed.
The Board has also designated Mr Ashok Malu, Company Secretary, as the Compliance Officer.Details of complaints received, number of shares transferred as well as average time taken for effecting these transfers are highlighted inthe �Shareholder Information� section of the Annual Report.
4. The Corporate Governance Section of the Annual Report should make disclosures on remuneration paid to Directors in all forms includingsalary, benefits, bonuses, stock options, pension and other fixed as well as performance linked incentives.
Details of remuneration paid to the Directors are highlighted at the beginning of this section. Indian Rayon has a policy of not payingcommission on profits to any Director of the Company.
5. The Board meetings should be held at least four times in a year, with a maximum time gap of four months between any two meetingsand all information recommended by the SEBI Committee should be placed at the Board.
The Board of Indian Rayon met 11 times during the past year. Agenda papers were circulated to the members well in advance of eachmeeting. The Company places before the Board the working of all the units and all statutory reports from time to time. As regards variousitems recommended by the SEBI Committee on Corporate Governance the following items are not presented in a structured manner atpresent. However, necessary steps are being taken to present all items recommended by the SEBI Committee in a structured manner fromthe current year.
· Annual operating plans and budgets and any updates.
· Capital budgets and any updates.
· Quarterly details of foreign exchange exposures and steps taken by the Company to limit the risk of adverse movements in exchangerate, if material.
6. As a part of disclosures, in addition to the Director�s Report, Management�s Discussion and Analysis report should form part ofthe annual report to the shareholders.Management�s Discussion and Analysis forms part of the Annual Report. The Company introduced this new section in the AnnualReport for the year 1998-99.
2121212121
7. All company related information like quarterly results, presentation made to analysts may be put on the Company�s web-site or may besent in such a form so as to enable the Stock Exchanges on which the Company is listed to put it on its own web-site.
Indian Rayon makes presentation to investors as well as equity analysts following the announcement of quarterly results. A copy of the PressRelease and quarterly results announcement are made available on the Company�s web site (www.indianrayon.com) as well as on theAditya Birla Group�s website (www.adityabirla.com).
8. There should be a separate section on Corporate Governance in the Annual Report, with details on the level of compliance by the Company.Non-compliance of any mandatory recommendation with reasons thereof and the extent to which the non-mandatory recommendations havebeen adopted should be specifically highlighted.Indian Rayon has introduced a separate section on Corporate Governance in this year�s Annual Report.
9. No Director should be a member in more than 10 committees or act as Chairman of more than five committees across all companies inwhich he is a Director. Furthermore it should be a mandatory annual requirement for every Director to inform the Company about thecommittee positions he occupies in other companies and changes.None of the Director of the Company is a member in more than 10 committees or Chairman of more than 5 committees across allcompanies in which he is a Director.
10. The Non-Executive Chairman of the Company should be entitled to maintain an office at the Company�s expense and also allowedreimbursement of expenses incurred in performance of his duties. This will enable him to discharge the responsibilities effectively. (Thisis a non-mandatory recommendation).At present, the Chairman does not have a separate office in the Company. The Corporate Finance Division of the Company supports theChairman for discharging the responsibilities.
Recommendations Under ReviewRecommendations Under ReviewRecommendations Under ReviewRecommendations Under ReviewRecommendations Under Review11. A qualified and an independent �Audit Committee� should be set up by the Board of the Company. This would go a long way inenhancing the credibility of the financial disclosures and promoting transparency.
Indian Rayon does not have an active Audit Committee at present. The Company is in the process of re-activating the Audit Committee.12. The Board should set up a �Remuneration Committee� to determine on their behalf and on behalf of the shareholders with agreed terms
of reference, the Company�s policy on remuneration packages for Executive Directors, including pension rights and other compensationpayments.Indian Rayon does not have any Executive/ Wholetime Director on its Board. Hence Remuneration Committee is not required.
13. Disclosures to be made to the Board by the management relating to all material, financial and commercial transactions, where they havepersonal interest, that may have a potential conflict with the interest of the company at large. These include dealing in company shares,commercial dealings with bodies, which have shareholding of management and their relatives, etc.No transaction of material nature has been entered into by the Company with the Promoters, Directors or the Management, theirsubsidiaries or relatives etc., that may have a potential conflict with interests of the Company.
14. While appointing a new director or re-appointing an existing director, the Company should provide a brief resume, expertise in specificfunctional areas and names of companies, in which the person also holds the directorship and the membership of Committees of theboard. These should form part of notice to shareholders.
Relevant details forms part of the explanatory statement of the Notice of the Annual General Meeting.
15. The half-yearly declaration of financial performance including summary of the significant events in last six-months, should be sent to eachhousehold of shareholders.
The Company aims to send update on half-yearly performance to the individual shareholders from 2000-01 onwards.
Recommendation not pertaining to the CompanyRecommendation not pertaining to the CompanyRecommendation not pertaining to the CompanyRecommendation not pertaining to the CompanyRecommendation not pertaining to the Company
16. The financial institutions should under normal circumstances have no direct role in the decision making of the board of the company. Theyshould normally not have nominees on the board, merely by virtue of their financial exposure by way of investment in the securities ofthe Company. There is however a ground for the term lending institutions to have nominees on the Boards of the borrower companies,to protect their interests as creditors. In such cases, the nominee directors should take an active interest in the activities of the board andhave to assume equal responsibility, as any other director on the board.
Not a company level issue.
2222222222
Other disclosures recommended by the SEBI Committee1. Details on Annual / Extraordinary General Meetings
1.1. Location and time, where General Meetings held in last 3 years:
Year AGM/EOGM Location Date Time
1998-99 AGM Registered office of 17th September 1999 2.00 p.m.the Company at Veraval,
Gujarat
1998-99 EOGM - do - 12th December,1998 10.30 a.m.
1997-98 AGM - do - 6th August 1998 11.00 a.m.
1996-97 AGM - do - 15th July 1997 11.00 a.m.
1996-97 EOGM - do - 22nd November 1997 10.00 a.m.
1.2. Whether special resolutions were put through postal ballot last year? NO1.3. Are votes proposed to be conducted through postal ballot this year? NO
2. Disclosures on materially significant related party transactions i.e. transactions of the company of material nature, with its promoters, thedirectors or the management, their subsidiaries or relatives etc. that may have potential conflict with the interests of company at large.
There is no material transactions with related party which requires separate disclosure.
3. Details of non-compliance by the Company, penalties, strictures imposed on the company by Stock Exchange or SEBI or any statutoryauthority, on any matter related to capital markets, during the last three years.
Neither any non-compliance with any of the legal provisions of law has been made by the Company nor has any penalty, stricturehas been imposed by the Stock Exchanges or SEBI or any other statutory authority, on any matter related to capital markets, duringthe last 3 years.
4. Means of communication
Ø Half-yearly report sent to each household of shareholders No
Ø Quarterly results
Which newspapers normally published in All editions of Financial Express andAhmedabad edition of Indian Express
Any website, where displayed www.indianrayon.comwww.adityabirla.com
Ø Whether it also displays official news releases and Yespresentations made to institutional investors/ analysts
Ø Whether MD&A is a part of annual report Yes
Ø Whether Shareholder Information section forms Yespart of the annual report
2323232323
Beyond Business - Reaching out to Communities
To qualitatively impact the life of the weaker sections of society, we engage in a series of welfare driveninitiatives. These are carried out under the aegis of �The Aditya Birla Centre for Community Initiatives and RuralProjects�, spearheaded by Mrs. Rajashree Birla, who is our Director on the Board of your Company.
Our vision is �To actively contribute to the social and economic development of the communities in whichwe operate. In so doing, build a better, sustainable way of life for the weaker sections of society�.
Given this backdrop, we work in 500 villages, surrounding our Plants in Veraval in Gujarat, Renukoot inUttar Pradesh and Gummidipoondi near Chennai. We reach out to more than two lakhs of people. Our focusareas are health-care, sustainable livelihood and education.
MEDICAL CAMPS
To provide health care to villagers in the nook and cranny of the villages surrounding our Units, weorganise medical camps.
In nearly 30 medical camps conducted during the year, more than 8000 villagers were examined andtreated for diverse ailments including tuberculosis, leprosy, cataract, polio and skin-related diseases. Immunizationcamps form part of this activity. Hundreds of people have gained immensely. For instance, 239 patients benefittedfrom the Jaya Shree Textiles� Laproscopic, Eye Micro-surgery and Lense Implant Camps. The physically impairedare also serviced by us. Our teams of doctors examine the extent to which their disability can be reduced.Depending on their affliction, they are provided with tricycles, calipers, crutches, artificial limbs, and specialshoes - to cite a few examples. These supportive aids are instrumental in significantly enhancing their self-sufficiency levels. Additionally, an Intensive Care Unit, the first of its kind in a public hospital, has also beenprovided by Jaya Shree Textiles to Rishra Seva Sadan in Hooghly.
To look after the well-being of animals, veterinary camps are conducted at Veraval. Additionally, incentivesare given for artificial insemination of cows and buffaloes. This year 14,530 animals were benefited as a resultof these activities.
SPREADING LITERACY
To raise the literacy level, in the areas around our Plants, we recourse to various ways. These encompassthe setting up of adult education centers, �balwadis�, which are non-formal education centers and offering meritscholarships. At Veraval, 1,468 students received our Scholarship which not only enabled their educationalexpenses, but more importantly motivated them to study harder.
To espouse the cause of the girl-child, we provide educational support. Distribution of text books to thePanchayat Schools, and financial aid to needy educational institutions also forms part of our canvas. We havekindled the desire to learn among 5000 children.
We are supporting a College library at Renukoot.
TOWARDS SUSTAINABLE LIVELIHOOD
Farmer Focus
Acting as catalysts, our teams narrow in on farmers who can avail of the economic programmes launchedby the Government. They then assist the farmer in accessing the necessary funds which go towards enhancing hisyield. The farmer is thus assured of a sustainable income, given a normal monsoon.
Social Report
�Our Social engage-ment stems from ourfundamental beliefthat the organizationof the future will bejudged by the values itstands for, for itscontribution and forthe benefits it offers tocommunities amidstwhich it operates�.- Smt. Rajashree BirlaChairperson,The Aditya Birla Centrefor Community Initiativesand Rural Development
2424242424
To boost agricultural and horticultural activities, we reach out to thousands of farmers in manifold ways. Farmer training programmes,teaching them better farming techniques on demonstration plots and agricultural meetings where agricultural experts give them valuable inputs areproving most useful to them.
Training in nurturing bees is imparted to many farmers. Bee-keeping is a good source of generating income.
To enable villagers have a sustainable livelihood, hundreds of them have been trained in cottage industries as well.
Village development Schemes
We aim to embed the villages with at least the basic amenities, such as providing support towards better infrastructure through constructionof roads, check-dams, drains and the repair of buildings which house the Panchayats.
As Renukoot is an area prone to severe water scarcity during summer, our team supplies fresh drinking water to the nearby communities.Towards this end, water booths are specially set up during this period.
Garnering developmental aid
For the year 1999-2000, we mobilised over Rs.410 lakhs through different development programmes. This is apart from our own contribution.We influenced the lives of fifty thousand people in a direct manner, by ensuring their well-being physically, and for many others a sustainable meansof livelihood.
MAKING A DIFFERENCE
Our involvement in these community driven initiatives has made a perceptible difference to the lives of the marginalised villagers. Many ofthem are no longer below the poverty line and are in good-health. And that gives us a humble sense of fulfillment, and pride in the fact that we arehelping in shaping new societies.
2525252525
Directors� Report to the ShareholdersDDDDDear Shareholders,
Your Directors are pleased to present the 43rd Annual Report together with the Audited Accounts of the Company for the yearended 31st March, 2000.
At the outset, your Directors would like to dwell on the strategic moves made by your Company towards value creation during the year underreview. These pertain mainly to the restructuring process.
BUSINESS RESTRUCTURING
● The decision to exit from the Sea Water Magnesia business and dispose off the assets of the division individually.
● Entry into the Readymade Garments business with the acquisition of Madura Garments, who are industry leaders. World renowned brandssuch as VAN HEUSEN, LOUIS PHILLIPE, ALLEN SOLLY, PETER ENGLAND, BYFORD and SAN FRISCO now come into your Company�s fold.
● The formation of a wholly owned overseas subsidiary company in Mauritius for export and brand promotion.
FINANCIAL RESTRUCTURING
● Prepayment of 16.5% 15th Series Secured Reedemable Non-Convertible Debentures amounting to about Rs.200 Crores;
● Buyback of 76.06 lac equity shares of the Company, representing 11.27% of the total paid-up capital at Rs.85 per share aggregating toRs.64.65 crores;
Importantly, your Company continues to retain its sound financials and commands a leadership position in all of its core businesses.
The results on account of part of these major initiatives will be fully reflected in the ensuing period.
FINANCIAL PERFORMANCE
During the first half of the year, the performance of your Company was impaired. This was due to the downturn in the economy coupled withadverse conditions in the commodity business. In the second half, the economy showed signs of recovery. Alongside, your Company initiatedvarious proactive steps, which will benefit the Company in the long run. Consequently, your Company�s overall performance has been satisfactory.
OPERATIONAL REVIEWYour Company�s operational performance continues to be good. A summary is given below:-VOLUME (MT)
Products FY 2000 FY 1999 Variation
PRODUCTION :-
Viscose Filament Yarn 12,621 14,685 (-) 14.05%
Carbon Black 95,828 63,968 49.81%
Insulator 24,353 24,026 1.36%
SALES :-
Viscose Filament Yarn 13,507 13,662 (-) 1.13%
Carbon Black 94,656 61,243 54.56%
2626262626
TURNOVER (RS IN CRORES)
Products FY 2000 FY 1999 Variation
Viscose Filament Yarn 244.7 279.8 (-)12.54%
Carbon Black 262.7 176.5 48.84%
Insulator 167.0 185.8 (-)10.12%
Textiles 341.6 318.0 7.42%
Garments(3 months) 57.2 * **
Trading and Others 113.7 506.5 **
Total 1186.9 1466.6 �
*The Turnover for corresponding period in Madura Coats Ltd. stood at Rs. 48.1 crores.** Not comparable as previous year figures includes the 5 months turnover of Erstwhile Cement Division which was demerged w.e.f. 1.9.1998
The operational performance of each of your Company�s Division has been comprehensively explained in the Management Discussion and AnalysisReport as a part of this Annual Report .
FINANCIAL RESULTS
The table below gives the results:(Rs. in Crores)
Current PreviousYear ended Year ended 31.3.2000 31.3.1999
Operating Profit 205.32 322.63Less: Interest 74.24 116.57
Gross Profit 131.08 206.06Less : Depreciation / Know-how written off 72.50 90.70
Profit before Exceptional items and Tax 58.58 115.36Less : Exceptional loss due to exit from Sea Water Magnesia Business 298.82 �
Share Buyback Expenses 0.99 �
Provision for Taxation � 9.32
Net Profit/(Loss) after Exceptional items (241.23) 106.04Add : Transfers from Investment Allowance Reserve/Debenture Redemption Reserve 71.11 10.29
(170.12) 116.33Balance brought forward 207.32 131.95
Profit available for appropriation 37.20 248.28
2727272727
Appropriations are made as under:Proposed Dividend 5.99 26.99Provision for Corporate Tax on Dividend 0.66 2.97General Reserve � 11.00Balance carried forward to next year 30.55 207.32
37.20 248.28
Your Directors would like you to bear in mind the fact that the results for the year 1999 - 2000 are not comparable with those of the previousyear as the previous year�s result include the working of Cement Division for five months. This Division was demerged from the Company on the1st of September, 1998.
The current year�s result include the three months operations of the newly acquired Madura Garments business from 1 st January, 2000 to31 st March ,2000.
DIVIDEND
In view of the one time non cash loss of Rs. 298.82 crores provided by the Company on closure of Sea Water Magnesia Plant ,the Profit andLoss Account show losses for the year. In view of this extraordinary loss, your Directors are constrained to recommend a lower dividend of 10 %,which is the maximum permissible presently under law. The dividend will be paid after your approval at the Annual General Meeting, in accordancewith the regulations applicable at that time.
Current Year Previous YearRs. Crores Rs. Crores
On 5,98,76,742 fully paid-up Equity Sharesof Rs.10 each, @ Rupee One per share(Previous year @ Rupee Four per share on6,74,83,041 fully paid-up Equity Shares) 5.99 26.99
Corporate Tax @ 11% (Previous Year 11%) 0.66 2.97
6.65 29.96
STATUS OF Y2K COMPLIANCE
The Y2K transmission was smooth without any disruption to the operations of any of the divisions of your Company.
FINANCE
Your Company gave a serious re-look to its financial structure to align it with the present business focus. The following initiatives stemmedfrom this exercise:-
● Prepaid 16.5% 15th Series Secured Redeemable Non-Convertible Debenures of Rs.300 each aggregating to Rs.199.93 crores.
● Completed buyback of 76.06 lacs equity shares representing 11.27% of the total paid-up capital at Rs.85 per share aggregating to Rs.64.65crores.
● Completed acquisition of Madura Garments without any market borrowing.
To meet the requirement for ongoing capital expenditure and general corporate purposes, your Company has raised a sum of Rs.50 croresthrough private placement of Non-Convertible Debentures at very competitive rates during the year end.
Your Directors confirm that the proceeds of the various debentures issued were used/are being used for purposes stated. With the alignmentof its capital structure, your company has very strong financials.
2828282828
DEPOSITORY SYSTEM
As you are aware that your Company has entered into an agreement with the National Securities Depository Limited (NSDL) and the CentralDepository Services (India) Limited (CDSL). This enables you to hold your shares in a dematerialised form with either of these depositories. Inorder to expedite the demat process further, the Company is installing necessary equipment at the Registered Office at Veraval for having directconnectivity with NSDL.
The delivery of equity shares of your Company is now mandatory in the dematerialised form in all exchanges where your shares are listed.Since this move facilitates quick transfers and prevents forgery, those shareholders who have not opted for this facility are advised to dematerilisetheir shares in their own interest. Your Company has also made arrangements for simultaneous dematerilisation of the physical shares lodged fortransfer.
HUMAN RESOURCES DEVELOPMENT AND INDUSTRIAL RELATIONS
The integration of the Indian economy with the global economy has led to a shift in focus of the skills sets of people, which is now animperative to run a business enterprise successfully.
To meet with this change, your Company has charted a human resource policy that integrates the people, their skills and the needs of theorganisation.
Your Company firmly believes that people constitute the strength of an organisation. Proactive initiatives have been take to establish systemsthat foster performance, transparency, fairness and empowerment at all levels. The work processes in the Company are team driven. Your Organisationhas created a culture of knowledge sharing and is endeavouring to make it a way of life. The appraisal system has been institutionalised.Performance based reward mechanism is being evolved. Individual achievements and attainment of team objectives have been inter-linked.
These initiatives of your Company have facilitated extremely cordial industrial relations at practically all the Units of your Company barringa brief aberration at the Viscose Filament Yarn Plant. An illegal and unjustified strike by a section of the workers at the Viscose Filament YarnPlant affected operations from the 11th of March to 22nd March, 2000.
JOINT VENTURE COMPANIES
From time to time we have invested Rs. 209.08 crores in our joint venture companies encompasses Indo Gulf Corporation Limited, MangaloreRefinery & Petrochemicals Limited, Birla AT&T Communications Limited & Bina Power Supply Company Limited.
Indo Gulf �s performance for the year has been exemplary. It has achieved new highs in both its fertiliser and copper businesses. The profitsof the company are rising year after year.
Mangalore Refinery & Petrochemicals Limited is making serious efforts to curtail losses and create its competitive edge in the deregulatedHydro Carbon Sector.
With the announcement of the new telecom policy, Birla AT&T has already started making operating profits. The future outlook is promising.To take advantage of synergies and to expand the foot print, the Company has entered into a Memorandum of Understanding with Tata IndustriesLimited for merger of Tata Cellular Ltd.(the cellular licensee of Andhra Pradesh Circle) with Birla AT&T.
Bina Power is setting up a 578 MW Coal Based Power Generation facility at Bina in MP in Joint Venture with M/s. PowerGen of UK. Whileall Project Contracts and Agreements had been executed / finalised, the ongoing litigation for Escrow allocation had put a brake on the very fastprogress that was achieved. However, the Company has now received a favourable Supreme Court verdict and are hopeful to achieve Financialclosure within this calendar year.
2929292929
PARTICULARS AS PER SECTION 217 OF THE COMPANIES ACT, 1956.
The particulars of employees, as required under Section 217(2A) of the Companies Act, 1956, are given in a separate Annexure to thisReport. This annexure, however, is not sent with the Report and Accounts to the shareholders of the Company in line with the provisions of Section219(1)(b)(iv) of the Companies Act, 1956. Shareholders who are interested in obtaining these particulars may please write to the CompanySecretary, at the Company�s Registered Office.
Additional information relating to the conservation of Energy, Technology Absorption and Foreign Exchange Earnings and Outgo, requiredunder Section 217(1)(e) of the Companies Act, 1956, is set out in a separate statement attached to this report and forms part of it.
DIRECTORS
Consequent to repayment of all the term loans to the financial institutions, ICICI Limited and Life Insurance Corporation of India havewithdrawn the nomination of their respective nominees, Shri P.Murari and Shri B.R.Gupta respectively from the Board.
At the request of the Life Insurance Corporation of India, Shri B.R.Gupta has been appointed as an Additional Director at the Board Meetingheld on 28th January, 2000 to represent the investment institutions. He holds office upto the date of the forthcoming Annual General Meeting andis eligible for reappointment.
Shri P.Murari has been appointed as an Additional Director at the Board Meeting held on 28th January, 2000. He holds office upto the dateof the forthcoming Annual General meeting and is eligible for reappointment.
Smt. Rajashree Birla and Shri Ashwini Kumar Kanoria retire by rotation, and being eligible, offer themselves for reappointment.
CORPORATE GOVERNANCE
The concept of Corporate Governance has been attracting public attention for quite some time in India. Progressive firms like your Companyhave already initiated steps to put in place system of Corporate Governance. It is also gearing up to ensure that all the mandatory provisions arefully in place well before the deadlines prescribed by various authorities. A separate report on the Corporate Governance is enclosed as a part ofthe Annual Report.
AUDITORS
The observations made in the Auditors� Report are self-explanatory and therefore, do not call for any further comments under Section217(3) of the Companies Act, 1956.
Your Directors request you to appoint Auditors for the current year and fix their remuneration.
APPRECIATION
Your Directors wish to acknowledge and thank the Central and State Governments for their support and guidance.
Your Directors thank our esteemed shareholders, customers, business associates, Financial/Investment Institutions and Commercial banks forthe faith reposed in your Company and its management.
Your Directors place on record their deep appreciation of the dedication and commitment of your Company�s employees. They have been andcontinue to be instrumental to your Company�s ongoing success.
For and on behalf of the Board
KUMAR MANGALAM BIRLAKUMAR MANGALAM BIRLAKUMAR MANGALAM BIRLAKUMAR MANGALAM BIRLAKUMAR MANGALAM BIRLAMumbai, 20th April, 2000 Chairman
3030303030
Information under section 217(1)(e) of the Companies Act, 1956 read with Companies (Disclosure of particulars in the Report of Board of Directors) Rules, 1988 and formingpart of the Directors� Report for the year ended 31st March, 2000.
Annexure to Directors� Report
� Reengineering of solid core Insulators design resulting inreduction of weight at Insulator.
� Development of Woollen knitting yarn using �Finest MicronWool� at Textiles.
� On farm trial in cultivation of flax fibre in India at Textiles.� Use of high Alkali Pyro Phillite, Telsite and MDS Grade / HT-10
Grade low Soda Alumina for development of HVDC Insulators.2. Benefits derived as a result of the above R & D:
� Improvement in the Quality of product, production efficiencyat low cost and development of new range of products andnew markets and improved customer satisfaction.
3. Future Plan of action� Improvement in quality of products and process, achievement
of a better product mix, development of new application ofproducts, development of new products and reduction of cost.
4. R & D Expenditure :Capital Expenditure : Rs. 20.00 lacsRecurring Expenditure : Rs. 44.46 lacsPercentage of Turnover : 0.05%
5. Technology absorption, adaptation and innovation:i) Efforts in brief, made towards technology absorption,
adaptation and innovation:� Development of Coning Machines, including better
design at Rayon.� Incorporation of in-house reactor design and latest
dryer design at Carbon Black.� Compressed firing cycle (10 to 18 hours per cycle in all
Kilns) resulting in increased loading capacity & fuelefficiency at Insulator.
� Reengineering of metal hardware design to achievesaving of Rs.2.3 Lacs / month at Insulator.
� Use of C9 in place of SKO and LDO in place HSD inThermopack for cost saving at Insulator.
� Installation of Ultra Filter on compress air line atTextiles.
� Inter connection between Cooling Towers andHumidification Plant at Textiles.
� Development of Dyeable Package on T.F.O. Machine tooffer value-added products in export market at Textiles.
ii) Benefits derived as a result of the above efforts:� Improvement in quality of existing products,
development of new market segments, improvementin process and cost control and improvement inproductivity.
iii) Information regarding Technology imported during the last5 years� Membrane Cell Technology from M/s. UHDE GmbH,
Germany for manufacture of Caustic Soda.� Caustic Flaking Technology from M/s. Bertrams,
Switzerland.� Continuous Spinning Technology from M/s. Snia
Engineering, Italy for Continuous Viscose Filament Yarn.� Airjet Spinning Machines from Japan, Autoconer from
Italy and Japan, Hara Cherry Draw Frame from Japanand Cross Roll Cards from U.K. at Textiles.
C. FOREIGN EXCHANGE EARNING AND OUTGOThe information on foreign exchange earnings and outgo is contained inNote No. 20a and the annexure thereto.
A. CONSERVATION OF ENERGY
a) Energy conservation measures taken :
� Replacement of single speed motor by double speed motor inViscose Dissolver at Rayon.
� Use of Light Diesel Oil (LDO) in place of High Speed Diesel(HSD) in the DG Sets at Rayon.
� Installation of additional inverter / supermizer in processpumps of Caustic Soda.
� Installation of 9000 Air Preheater to decrease fuel consumptionand enrichment of tail gases at Carbon Black.
� Substitution of CBFS in place of LSHS as fuel oil in CarbonBlack.
� PGF timer replaced to reduce instair consumption saving 30KWH/hr at Carbon Black.
� Motor driver agitator replaced with air agitator saving 4 KWH/hr at Carbon Black.
� Modification of firing cycle resulted in saving of 2329 KWH/month at Insulator.
� Optimisation of loading of motors in worsted spinning atTextiles.
� Elimination of Indirect Cooling Humidifier at Textiles.� Use of Cooling Tower water in Air Washery in place of
chilled water for 5 months in a year at Textiles.� Stopping of 75 HP ELGI Compressor by full loading of ZR-4
compressor at Textiles.� Stopage of Chiller Plant by modification of Humidification
Plant & Cooling Tower at Textiles.b) Additional Investments & Proposals, if any, being implemented for
reduction of consumption of Energy.� Use of Extraction-II Steam of Power Plant Turbine in
Continuous Spinning Machines at Rayon.� Use of Electroflow Energy Saving Systems in Power Plant Load
Centres at Rayon.� Replacement of 6.0 MW Turbine�s Rotor at Carbon Black.� Seasonsal variation with inverter drive in Humidification at
Textiles.� Heat Recovery Unit in Dye House at Textiles.� To invest in Inverter Drive System for Auto Coner machines at
Textiles.c) Impact of measures listed at (a) and (b) for reduction of energy
consumption and consequent impact on the cost of production ofgoods:The above measures have resulted/will result in energy saving inthe consumption of fuel and power and consequent decrease in thecost of production.
d) Total Energy Consumption and Energy Consumption per Unit ofProduction as per prescribed Form � A :As per annexure attached.
B. TECHNOLOGY ABSORPTIONEfforts made in technology consumption (Form � B)RESEARCH AND DEVELOPMENT1. Specific areas in which R & D carried out by the Company.
� Replacement of Zinc by Alum for Spinbath at Rayon.� Use of purged lean Brine of Caustic Soda Plant in water
softeners at Rayon.� Developing new grades at Carbon Black and to carry out all
requisite test for quality control.� Development of 210 KN and 300 KN Disc Insulators high end
products at Insulator.
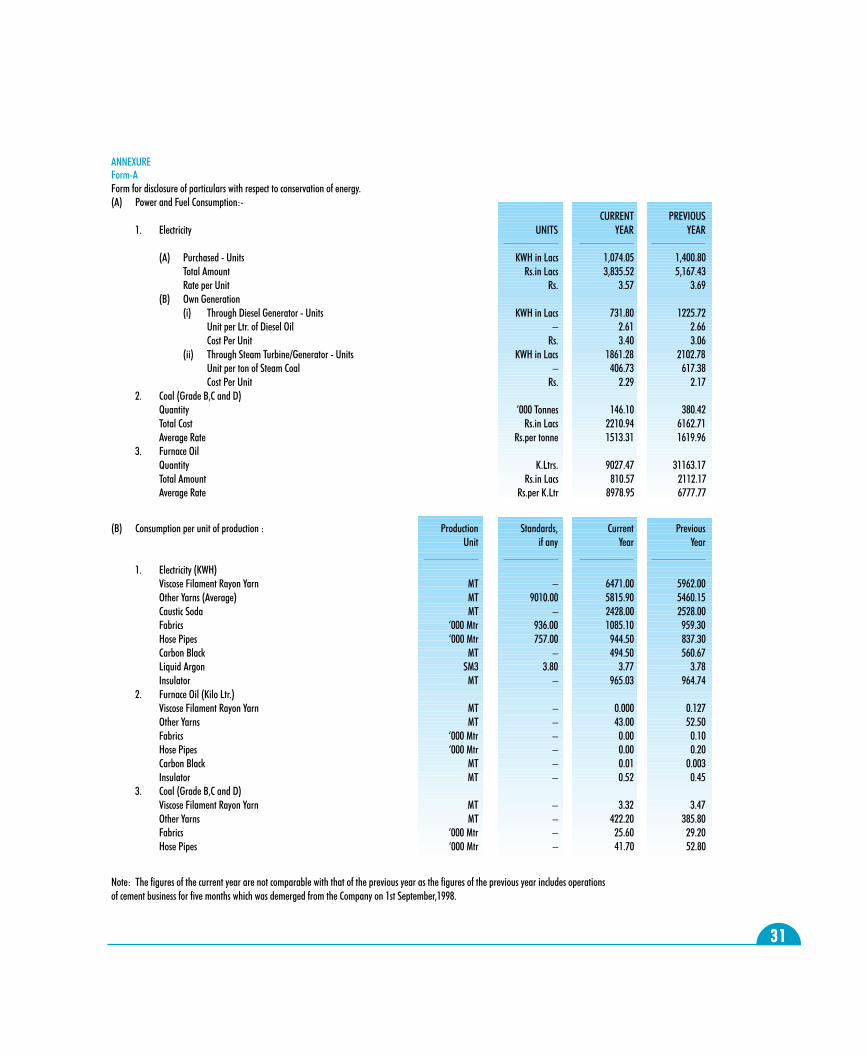
3131313131
ANNEXUREForm-AForm for disclosure of particulars with respect to conservation of energy.(A) Power and Fuel Consumption:-
CURRENT PREVIOUS1. Electricity UNITS YEAR YEAR
(A) Purchased - Units KWH in Lacs 1,074.05 1,400.80Total Amount Rs.in Lacs 3,835.52 5,167.43Rate per Unit Rs. 3.57 3.69
(B) Own Generation(i) Through Diesel Generator - Units KWH in Lacs 731.80 1225.72
Unit per Ltr. of Diesel Oil � 2.61 2.66Cost Per Unit Rs. 3.40 3.06
(ii) Through Steam Turbine/Generator - Units KWH in Lacs 1861.28 2102.78Unit per ton of Steam Coal � 406.73 617.38Cost Per Unit Rs. 2.29 2.17
2. Coal (Grade B,C and D)Quantity �000 Tonnes 146.10 380.42Total Cost Rs.in Lacs 2210.94 6162.71Average Rate Rs.per tonne 1513.31 1619.96
3. Furnace OilQuantity K.Ltrs. 9027.47 31163.17Total Amount Rs.in Lacs 810.57 2112.17Average Rate Rs.per K.Ltr 8978.95 6777.77
(B) Consumption per unit of production : Production Standards, Current PreviousUnit if any Year Year
1. Electricity (KWH)Viscose Filament Rayon Yarn MT � 6471.00 5962.00Other Yarns (Average) MT 9010.00 5815.90 5460.15Caustic Soda MT � 2428.00 2528.00Fabrics �000 Mtr 936.00 1085.10 959.30Hose Pipes �000 Mtr 757.00 944.50 837.30Carbon Black MT � 494.50 560.67Liquid Argon SM3 3.80 3.77 3.78Insulator MT � 965.03 964.74
2. Furnace Oil (Kilo Ltr.)Viscose Filament Rayon Yarn MT � 0.000 0.127Other Yarns MT � 43.00 52.50Fabrics �000 Mtr � 0.00 0.10Hose Pipes �000 Mtr � 0.00 0.20Carbon Black MT � 0.01 0.003Insulator MT � 0.52 0.45
3. Coal (Grade B,C and D)Viscose Filament Rayon Yarn MT � 3.32 3.47Other Yarns MT � 422.20 385.80Fabrics �000 Mtr � 25.60 29.20Hose Pipes �000 Mtr � 41.70 52.80
Note: The figures of the current year are not comparable with that of the previous year as the figures of the previous year includes operationsof cement business for five months which was demerged from the Company on 1st September,1998.
3232323232
We have examined the attached Balance Sheet of INDIAN RAYON AND INDUSTRIES LIMITED as at 31st March, 2000 and also the Profit and LossAccount annexed thereto for the year ended on that date, which are in agreement with the Company�s books of account and with the audited returnsfrom the branches.
As required by the Manufacturing and Other Companies (Auditor�s Report) Order, 1988, issued by the Company Law Board in terms of Section 227(4A) of the Companies Act, 1956, in our opinion and on the basis of such checks of the books and records as we considered appropriate and accordingto the information and explanations given to us during the course of the audit, we state on the matters specified in paragraphs 4 and 5 of the saidOrder as under:-
i) The Company has maintained proper records showing full particulars, including quantitative details and situation of Fixed Assets. TheFixed Assets were physically verified by the management at reasonable intervals. The discrepancies noticed on physical verification were notmaterial and the same have been properly dealt with in the books of account.
ii) None of the Fixed Assets have been revalued during the year.
iii) The stocks of finished goods, stores, spare parts and raw materials have been physically verified by the management at reasonable intervals.Stocks lying with third parties and in transit have been verified by the management with reference to the confirmations received/subsequentreceipt of goods.
iv) The procedures for physical verification of stocks, followed by the management are reasonable and adequate in relation to the size of theCompany and nature of its business.
v) No material discrepancies have been noticed on physical verification of stocks as compared to book records.
vi) On the basis of our examination of stock records, the valuation of stock, is fair and proper in accordance with the normally accepted accountingprinciples and except as stated in Note No. 17 in Schedule 19 is on the same basis as in the preceding year.
vii) The rate of interest and other terms and conditions of secured or unsecured loans taken from Companies and other parties listed in the registermaintained under Section 301 of the Companies Act, 1956 are, prima facie, not prejudicial to the interest of the Company. In terms of section370(6) of Companies Act, 1956 provisions of the said section are not applicable to a company on or after 31st October, 1998.
viii) The rate of interest and other terms and conditions of unsecured loans granted to companies listed in the register maintained under Section301 of the Companies Act, 1956, are, prima facie, not prejudicial to the interest of the Company. The Company has not granted any loans,secured or unsecured, to other parties listed in the said register.
ix) In respect of loans and advances in the nature of loan given by the Company, the parties have repaid the principal amounts as stipulated andhave also been regular in the payment of interest, where applicable.
x) There are adequate internal control procedures commensurate with the size of the Company and the nature of its business for the purchase ofstores, raw materials including components, plant and machinery, equipment and other assets and for the sale of goods.
xi) The transactions of purchase of goods and materials and sale of goods, materials and services made in pursuance of contracts or arrangementsentered in the register maintained under Section 301 of the Companies Act, 1956 and aggregating during the year to Rs.50,000 or more inrespect of each party have been made at prices are reasonable having regard to prevailing market prices for such goods, materials andservices or the prices at which transactions for similar goods or services have been made with other parties.
xii) The Company has a regular procedure for the determination of unserviceable or damaged stores, raw materials and finished goods. Adequateprovisions have been made in the accounts for the loss arising on the items so determined.
xiii) The Company has complied with the provisions of Section 58A of the Companies Act, 1956 and the rules framed thereunder, with regard to thedeposits accepted from the public.
xiv) The Company has maintained reasonable records for the sale and disposal of realisable scrap and by-products wherever applicable.
Auditors� Report to the Shareholders
3333333333
xv) The Company has an internal audit system commensurate with the size and nature of its business.
xvi) We have broadly reviewed the books of account maintained by the Company pursuant to the Rules made by the Central Government for themaintenance of cost records under Section 209(1) (d) of the Companies Act, 1956 and are of the opinion that, prima facie, the prescribedaccounts and records have been made and maintained. We are, however, not required to make a detailed examination of the records with aview to determine whether they are accurate or complete.
xvii) The Company is generally regular in depositing Provident Fund dues and Employees State Insurance dues with the appropriate authorities.
xviii) Non undisputed amounts payable in respect of Income Tax, Wealth Tax, Sales Tax, Customs duty and Excise duty were outstanding, as at 31st
March, 2000, for a period of more than six months from the date they became payable.
xix) No personal expenses of employees or directors have been charged to revenue account other than those payable under contractual obligationsor in accordance with generally accepted business practice.
xx) The Company is not a Sick Industrial Company within the meaning of clause (o) of sub-Section (1) of Section 3 of the Sick Industrial Compa-nies (Special provisions) Act, 1985.
xxi) In respect of the service activities, the Company has a reasonable system of recording receipts, issues and consumption of materials and storescommensurate with its size and nature of its business. In our opinion, the system provides for a reasonable allocation of materials consumedand man hours utilised to the relative jobs. Further, there is a reasonable system of authorisation at proper levels and an adequate internalcontrol system, commensurate with the size of the Company and the nature of its business on the issue of stores and allocation of stores andlabour to jobs.
xxii) In respect of trading activity, damaged goods which were not significant, have been determined and necessary provision for losses have beenmade in the accounts.
Further to the above, we have obtained all the information and explanations which to the best of our knowledge and belief were necessary for thepurposes of our audit.
In our opinion, proper books of account as required by law have been kept by the Company so far as appears from our examination of those books andproper returns adequate for the purposes of our audit have been received from the branches not visited by us. The Branch Auditors� Reports have beenforwarded to us and are appropriately dealt with.
In our opinion, the Balance Sheet and the Profit and Loss Account are drawn up in compliance with the Accounting Standards referred in Section 211(3C) of the Companies Act, 1956.
In our opinion and to the best of our information and according to the explanations given to us, the said accounts read with notes appearing inSchedule �19� and elsewhere in the accounts give the information required by the Companies Act, 1956 in the manner so required and the BalanceSheet and the Profit and Loss Account give a true and fair view, of the state of the Company�s affairs as at the close of the year and of the loss for theyear, respectively.
For LODHA & CO., For KHIMJI KUNVERJI & CO.Chartered Accountants Chartered Accountants
N.KISHORE BAFNA SHIVJI K. VIKAMSEYPartner Partner.
Mumbai, 20th April, 2000
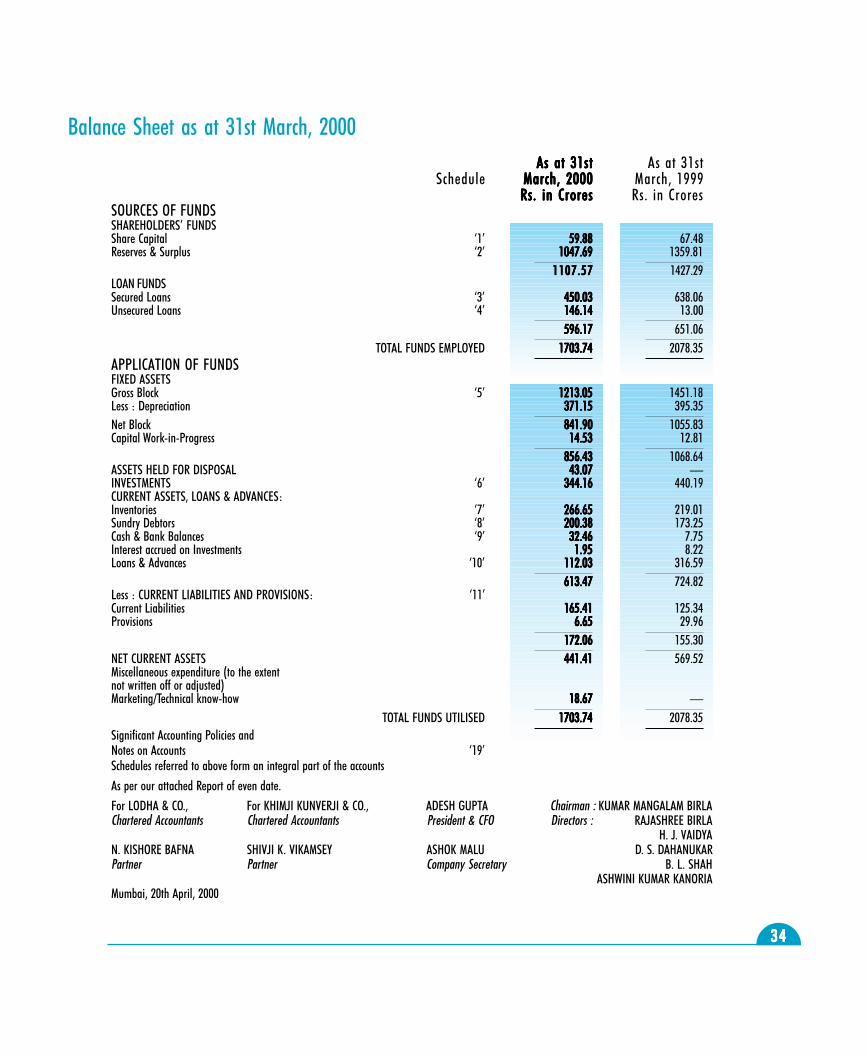
3434343434
Balance Sheet as at 31st March, 2000As at 31stAs at 31stAs at 31stAs at 31stAs at 31st As at 31st
Schedule March, 2000March, 2000March, 2000March, 2000March, 2000 March, 1999Rs. in CroresRs. in CroresRs. in CroresRs. in CroresRs. in Crores Rs. in Crores
SOURCES OF FUNDSSHAREHOLDERS� FUNDSShare Capital �1� 59.8859.8859.8859.8859.88 67.48Reserves & Surplus �2� 1047.691047.691047.691047.691047.69 1359.81
1107.571107.571107.571107.571107.57 1427.29LOAN FUNDSSecured Loans �3� 450.03450.03450.03450.03450.03 638.06Unsecured Loans �4� 146.14146.14146.14146.14146.14 13.00
596.17596.17596.17596.17596.17 651.06TOTAL FUNDS EMPLOYED 1703.741703.741703.741703.741703.74 2078.35
APPLICATION OF FUNDSFIXED ASSETSGross Block �5� 1213.051213.051213.051213.051213.05 1451.18Less : Depreciation 371.15371.15371.15371.15371.15 395.35Net Block 841.90841.90841.90841.90841.90 1055.83Capital Work-in-Progress 14.5314.5314.5314.5314.53 12.81
856.43856.43856.43856.43856.43 1068.64ASSETS HELD FOR DISPOSAL 43.0743.0743.0743.0743.07 �INVESTMENTS �6� 344.16344.16344.16344.16344.16 440.19CURRENT ASSETS, LOANS & ADVANCES:Inventories �7� 266.65266.65266.65266.65266.65 219.01Sundry Debtors �8� 200.38200.38200.38200.38200.38 173.25Cash & Bank Balances �9� 32.4632.4632.4632.4632.46 7.75Interest accrued on Investments 1.951.951.951.951.95 8.22Loans & Advances �10� 112.03112.03112.03112.03112.03 316.59
613.47613.47613.47613.47613.47 724.82Less : CURRENT LIABILITIES AND PROVISIONS: �11�Current Liabilities 165.41165.41165.41165.41165.41 125.34Provisions 6.656.656.656.656.65 29.96
172.06172.06172.06172.06172.06 155.30NET CURRENT ASSETS 441.41441.41441.41441.41441.41 569.52Miscellaneous expenditure (to the extentnot written off or adjusted)Marketing/Technical know-how 18.6718.6718.6718.6718.67 �
TOTAL FUNDS UTILISED 1703.741703.741703.741703.741703.74 2078.35Significant Accounting Policies andNotes on Accounts �19�Schedules referred to above form an integral part of the accounts
As per our attached Report of even date.
For LODHA & CO., For KHIMJI KUNVERJI & CO., ADESH GUPTA Chairman : KUMAR MANGALAM BIRLAChartered Accountants Chartered Accountants President & CFO Directors : RAJASHREE BIRLA
H. J. VAIDYAN. KISHORE BAFNA SHIVJI K. VIKAMSEY ASHOK MALU D. S. DAHANUKARPartner Partner Company Secretary B. L. SHAH
ASHWINI KUMAR KANORIAMumbai, 20th April, 2000
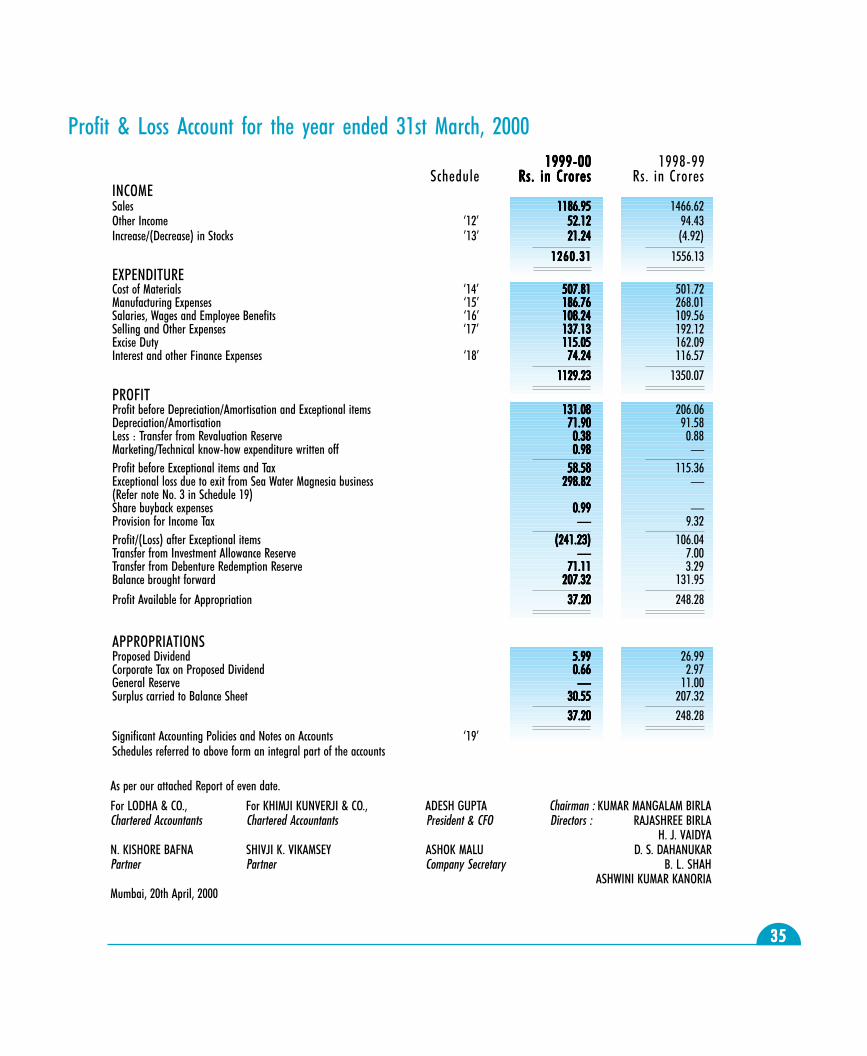
3535353535
Profit & Loss Account for the year ended 31st March, 2000
As per our attached Report of even date.
For LODHA & CO., For KHIMJI KUNVERJI & CO., ADESH GUPTA Chairman : KUMAR MANGALAM BIRLAChartered Accountants Chartered Accountants President & CFO Directors : RAJASHREE BIRLA
H. J. VAIDYAN. KISHORE BAFNA SHIVJI K. VIKAMSEY ASHOK MALU D. S. DAHANUKARPartner Partner Company Secretary B. L. SHAH
ASHWINI KUMAR KANORIAMumbai, 20th April, 2000
1999-001999-001999-001999-001999-00 1998-99Schedule Rs. in CroresRs. in CroresRs. in CroresRs. in CroresRs. in Crores Rs. in Crores
INCOMESales 1186.951186.951186.951186.951186.95 1466.62Other Income �12� 52.1252.1252.1252.1252.12 94.43Increase/(Decrease) in Stocks �13� 21.2421.2421.2421.2421.24 (4.92)
1260.311260.311260.311260.311260.31 1556.13EXPENDITURECost of Materials �14� 507.81507.81507.81507.81507.81 501.72Manufacturing Expenses �15� 186.76186.76186.76186.76186.76 268.01Salaries, Wages and Employee Benefits �16� 108.24108.24108.24108.24108.24 109.56Selling and Other Expenses �17� 137.13137.13137.13137.13137.13 192.12Excise Duty 115.05115.05115.05115.05115.05 162.09Interest and other Finance Expenses �18� 74.2474.2474.2474.2474.24 116.57
1129.231129.231129.231129.231129.23 1350.07
PROFITProfit before Depreciation/Amortisation and Exceptional items 131.08131.08131.08131.08131.08 206.06Depreciation/Amortisation 71.9071.9071.9071.9071.90 91.58Less : Transfer from Revaluation Reserve 0.380.380.380.380.38 0.88Marketing/Technical know-how expenditure written off 0.980.980.980.980.98 �Profit before Exceptional items and Tax 58.5858.5858.5858.5858.58 115.36Exceptional loss due to exit from Sea Water Magnesia business 298.82298.82298.82298.82298.82 �(Refer note No. 3 in Schedule 19)Share buyback expenses 0.990.990.990.990.99 �Provision for Income Tax ����� 9.32Profit/(Loss) after Exceptional items (241.23)(241.23)(241.23)(241.23)(241.23) 106.04Transfer from Investment Allowance Reserve ����� 7.00Transfer from Debenture Redemption Reserve 71.1171.1171.1171.1171.11 3.29Balance brought forward 207.32207.32207.32207.32207.32 131.95
Profit Available for Appropriation 37.2037.2037.2037.2037.20 248.28
APPROPRIATIONSProposed Dividend 5.995.995.995.995.99 26.99Corporate Tax on Proposed Dividend 0.660.660.660.660.66 2.97General Reserve ����� 11.00Surplus carried to Balance Sheet 30.5530.5530.5530.5530.55 207.32
37.2037.2037.2037.2037.20 248.28
Significant Accounting Policies and Notes on Accounts �19�Schedules referred to above form an integral part of the accounts
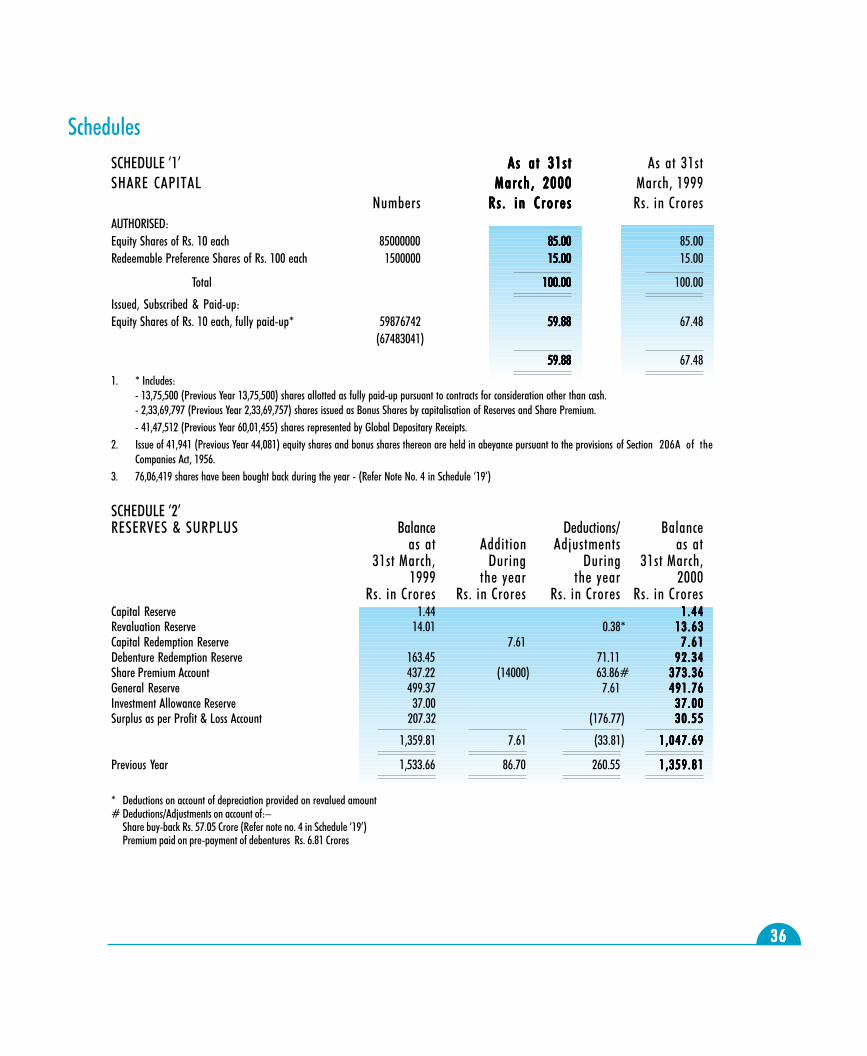
3636363636
SCHEDULE �2�RESERVES & SURPLUS Balance Deductions/ Balance
as at Addition Adjustments as at31st March, During During 31st March,
1999 the year the year 2000Rs. in Crores Rs. in Crores Rs. in Crores Rs. in Crores
Capital Reserve 1.44 1 .4 41 .4 41 .4 41 .4 41 .4 4Revaluation Reserve 14.01 0.38* 13 .6313 .6313 .6313 .6313 .63Capital Redemption Reserve 7.61 7 .6 17 .6 17 .6 17 .6 17 .6 1Debenture Redemption Reserve 163.45 71.11 92 .3492 .3492 .3492 .3492 .34Share Premium Account 437.22 (14000) 63.86# 373.36373.36373.36373.36373.36General Reserve 499.37 7.61 491.76491.76491.76491.76491.76Investment Allowance Reserve 37.00 37 .0037 .0037 .0037 .0037 .00Surplus as per Profit & Loss Account 207.32 (176.77) 30 .5530 .5530 .5530 .5530 .55
1,359.81 7.61 (33.81) 1 ,047 .691,047.691,047.691,047.691,047.69
Previous Year 1,533.66 86.70 260.55 1,359.811,359.811,359.811,359.811,359.81
* Deductions on account of depreciation provided on revalued amount# Deductions/Adjustments on account of:�
Share buy-back Rs. 57.05 Crore (Refer note no. 4 in Schedule �19�)Premium paid on pre-payment of debentures Rs. 6.81 Crores
SchedulesSCHEDULE �1� As a t 31s t As a t 31s t As a t 31s t As a t 31s t As a t 31s t As at 31stSHARE CAPITAL Mar ch , 2000 Mar ch , 2000 Mar ch , 2000 Mar ch , 2000 Mar ch , 2000 March, 1999
Numbers Rs . i n C ro re sRs . i n C ro re sRs . i n C ro re sRs . i n C ro re sRs . i n C ro re s Rs. in CroresAUTHORISED:Equity Shares of Rs. 10 each 85000000 85.0085.0085.0085.0085.00 85.00Redeemable Preference Shares of Rs. 100 each 1500000 15.0015.0015.0015.0015.00 15.00
Total 100.00100.00100.00100.00100.00 100.00
Issued, Subscribed & Paid-up:Equity Shares of Rs. 10 each, fully paid-up* 59876742 59.8859.8859.8859.8859.88 67.48
(67483041)
59.8859.8859.8859.8859.88 67.48
1. * Includes:- 13,75,500 (Previous Year 13,75,500) shares allotted as fully paid-up pursuant to contracts for consideration other than cash.- 2,33,69,797 (Previous Year 2,33,69,757) shares issued as Bonus Shares by capitalisation of Reserves and Share Premium.- 41,47,512 (Previous Year 60,01,455) shares represented by Global Depositary Receipts.
2. Issue of 41,941 (Previous Year 44,081) equity shares and bonus shares thereon are held in abeyance pursuant to the provisions of Section 206A of theCompanies Act, 1956.
3. 76,06,419 shares have been bought back during the year - (Refer Note No. 4 in Schedule �19�)
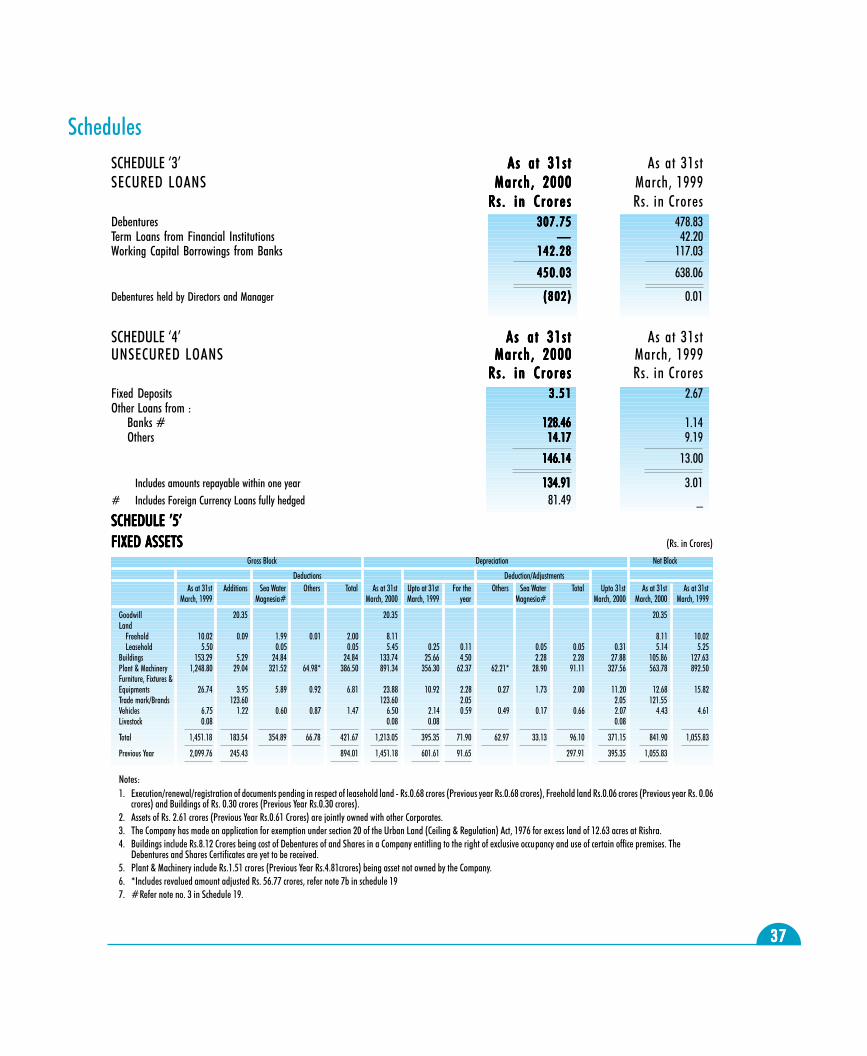
3737373737
SCHEDULE �3� As a t 31s t As a t 31s t As a t 31s t As a t 31s t As a t 31s t As at 31stSECURED LOANS Mar ch , 2000 Mar ch , 2000 Mar ch , 2000 Mar ch , 2000 Mar ch , 2000 March, 1999
Rs . i n C ro re sRs . i n C ro re sRs . i n C ro re sRs . i n C ro re sRs . i n C ro re s Rs. in CroresDebentures 307.75307.75307.75307.75307.75 478.83Term Loans from Financial Institutions ����� 42.20Working Capital Borrowings from Banks 142.28142.28142.28142.28142.28 117.03
450.03450.03450.03450.03450.03 638.06
Debentures held by Directors and Manager ( 8 0 2 )( 8 0 2 )( 8 0 2 )( 8 0 2 )( 8 0 2 ) 0.01
SCHEDULE �4� As a t 31s tAs a t 31s tAs a t 31s tAs a t 31s tAs a t 31s t As at 31stUNSECURED LOANS Mar ch , 2000 Mar ch , 2000 Mar ch , 2000 Mar ch , 2000 Mar ch , 2000 March, 1999
Rs . i n C ro re sRs . i n C ro re sRs . i n C ro re sRs . i n C ro re sRs . i n C ro re s Rs. in CroresFixed Deposits 3 . 513 .513 .513 .513 .51 2.67Other Loans from : Banks # 128.46128.46128.46128.46128.46 1.14 Others 14.1714.1714.1714.1714.17 9.19
146.14146.14146.14146.14146.14 13.00
Includes amounts repayable within one year 134.91134.91134.91134.91134.91 3.01# Includes Foreign Currency Loans fully hedged 81.49 _
Schedules
SCHEDULE �5�SCHEDULE �5�SCHEDULE �5�SCHEDULE �5�SCHEDULE �5�FIXED ASSETSFIXED ASSETSFIXED ASSETSFIXED ASSETSFIXED ASSETS (Rs. in Crores)
Gross Block Depreciation Net Block
Deductions Deduction/AdjustmentsAs at 31st Additions Sea Water Others Total As at 31st Upto at 31st For the Others Sea Water Total Upto 31st As at 31st As at 31st
March, 1999 Magnesia# March, 2000 March, 1999 year Magnesia# March, 2000 March, 2000 March, 1999
Goodwill 20.35 20.35 20.35Land Freehold 10.02 0.09 1.99 0.01 2.00 8.11 8.11 10.02 Leasehold 5.50 0.05 0.05 5.45 0.25 0.11 0.05 0.05 0.31 5.14 5.25Buildings 153.29 5.29 24.84 24.84 133.74 25.66 4.50 2.28 2.28 27.88 105.86 127.63Plant & Machinery 1,248.80 29.04 321.52 64.98* 386.50 891.34 356.30 62.37 62.21* 28.90 91.11 327.56 563.78 892.50Furniture, Fixtures &Equipments 26.74 3.95 5.89 0.92 6.81 23.88 10.92 2.28 0.27 1.73 2.00 11.20 12.68 15.82Trade mark/Brands 123.60 123.60 2.05 2.05 121.55Vehicles 6.75 1.22 0.60 0.87 1.47 6.50 2.14 0.59 0.49 0.17 0.66 2.07 4.43 4.61Livestock 0.08 0.08 0.08 0.08
Total 1,451.18 183.54 354.89 66.78 421.67 1,213.05 395.35 71.90 62.97 33.13 96.10 371.15 841.90 1,055.83
Previous Year 2,099.76 245.43 894.01 1,451.18 601.61 91.65 297.91 395.35 1,055.83
Notes:1. Execution/renewal/registration of documents pending in respect of leasehold land - Rs.0.68 crores (Previous year Rs.0.68 crores), Freehold land Rs.0.06 crores (Previous year Rs. 0.06
crores) and Buildings of Rs. 0.30 crores (Previous Year Rs.0.30 crores).2. Assets of Rs. 2.61 crores (Previous Year Rs.0.61 Crores) are jointly owned with other Corporates.3. The Company has made an application for exemption under section 20 of the Urban Land (Ceiling & Regulation) Act, 1976 for excess land of 12.63 acres at Rishra.4. Buildings include Rs.8.12 Crores being cost of Debentures of and Shares in a Company entitling to the right of exclusive occupancy and use of certain office premises. The
Debentures and Shares Certificates are yet to be received.5. Plant & Machinery include Rs.1.51 crores (Previous Year Rs.4.81crores) being asset not owned by the Company.6. *Includes revalued amount adjusted Rs. 56.77 crores, refer note 7b in schedule 197. #Refer note no. 3 in Schedule 19.
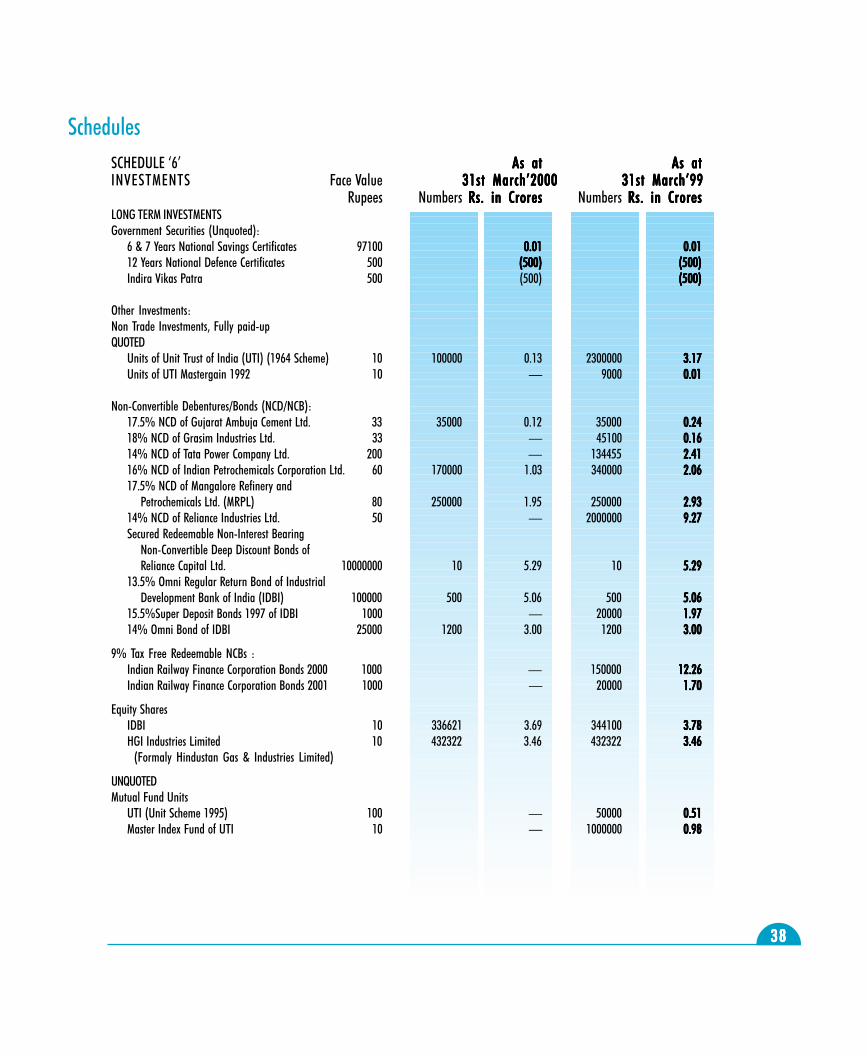
3838383838
SCHEDULE �6� As atAs atAs atAs atAs at As atAs atAs atAs atAs atINVESTMENTS Face Value 31st March�200031st March�200031st March�200031st March�200031st March�2000 31st March�9931st March�9931st March�9931st March�9931st March�99
Rupees Numbers Rs. in CroresRs. in CroresRs. in CroresRs. in CroresRs. in Crores Numbers Rs. in CroresRs. in CroresRs. in CroresRs. in CroresRs. in CroresLONG TERM INVESTMENTSGovernment Securities (Unquoted):
6 & 7 Years National Savings Certificates 97100 0.010.010.010.010.01 0.010.010.010.010.0112 Years National Defence Certificates 500 (500)(500)(500)(500)(500) (500)(500)(500)(500)(500)Indira Vikas Patra 500 (500) (500)(500)(500)(500)(500)
Other Investments:Non Trade Investments, Fully paid-upQUOTED
Units of Unit Trust of India (UTI) (1964 Scheme) 10 100000 0.13 2300000 3.173.173.173.173.17Units of UTI Mastergain 1992 10 � 9000 0.010.010.010.010.01
Non-Convertible Debentures/Bonds (NCD/NCB):17.5% NCD of Gujarat Ambuja Cement Ltd. 33 35000 0.12 35000 0.240.240.240.240.2418% NCD of Grasim Industries Ltd. 33 � 45100 0.160.160.160.160.1614% NCD of Tata Power Company Ltd. 200 � 134455 2.412.412.412.412.4116% NCD of Indian Petrochemicals Corporation Ltd. 60 170000 1.03 340000 2.062.062.062.062.0617.5% NCD of Mangalore Refinery and
Petrochemicals Ltd. (MRPL) 80 250000 1.95 250000 2.932.932.932.932.9314% NCD of Reliance Industries Ltd. 50 � 2000000 9.279.279.279.279.27Secured Redeemable Non-Interest Bearing
Non-Convertible Deep Discount Bonds ofReliance Capital Ltd. 10000000 10 5.29 10 5.295.295.295.295.29
13.5% Omni Regular Return Bond of IndustrialDevelopment Bank of India (IDBI) 100000 500 5.06 500 5.065.065.065.065.06
15.5%Super Deposit Bonds 1997 of IDBI 1000 � 20000 1.971.971.971.971.9714% Omni Bond of IDBI 25000 1200 3.00 1200 3.003.003.003.003.00
9% Tax Free Redeemable NCBs :Indian Railway Finance Corporation Bonds 2000 1000 � 150000 12.2612.2612.2612.2612.26Indian Railway Finance Corporation Bonds 2001 1000 � 20000 1.701.701.701.701.70
Equity SharesIDBI 10 336621 3.69 344100 3.783.783.783.783.78HGI Industries Limited 10 432322 3.46 432322 3.463.463.463.463.46
(Formaly Hindustan Gas & Industries Limited)
UNQUOTEDMutual Fund Units
UTI (Unit Scheme 1995) 100 � 50000 0.510.510.510.510.51Master Index Fund of UTI 10 � 1000000 0.980.980.980.980.98
Schedules
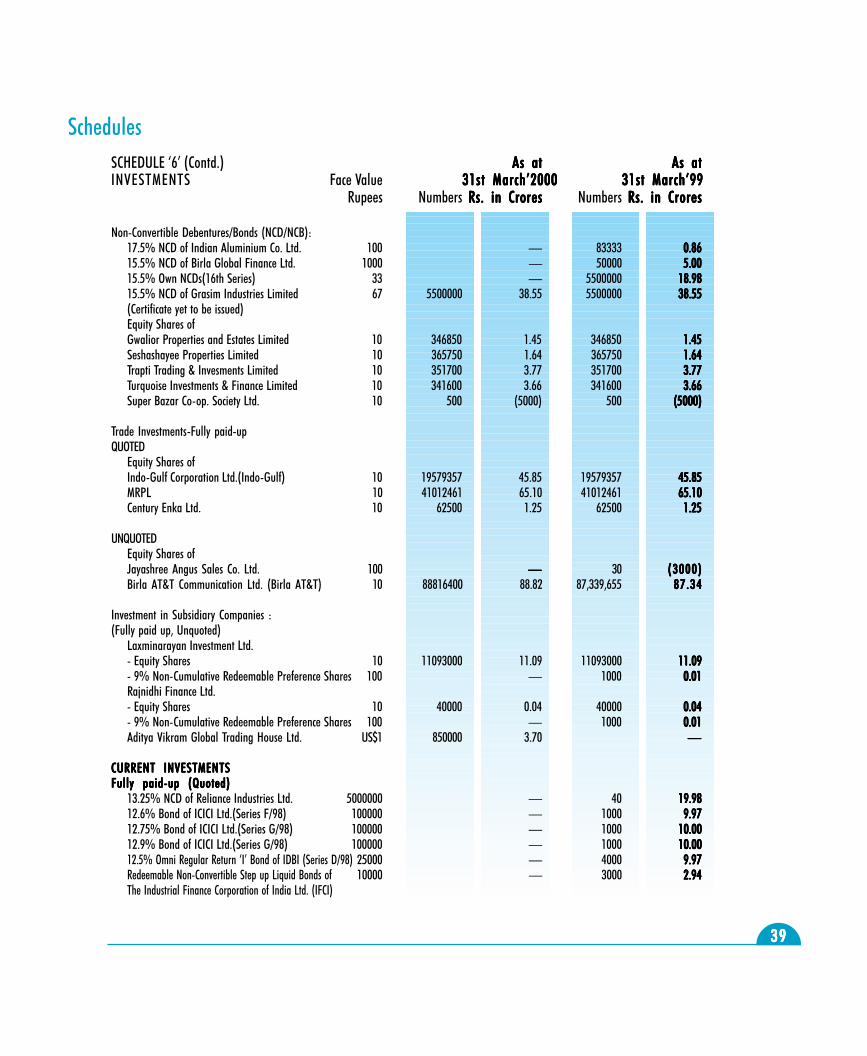
3939393939
SCHEDULE �6� (Contd.) As atAs atAs atAs atAs at As atAs atAs atAs atAs atINVESTMENTS Face Value 31st March�200031st March�200031st March�200031st March�200031st March�2000 31st March�9931st March�9931st March�9931st March�9931st March�99
Rupees Numbers Rs. in CroresRs. in CroresRs. in CroresRs. in CroresRs. in Crores Numbers Rs. in CroresRs. in CroresRs. in CroresRs. in CroresRs. in Crores
Non-Convertible Debentures/Bonds (NCD/NCB):17.5% NCD of Indian Aluminium Co. Ltd. 100 � 83333 0.860.860.860.860.8615.5% NCD of Birla Global Finance Ltd. 1000 � 50000 5.005.005.005.005.0015.5% Own NCDs(16th Series) 33 � 5500000 18.9818.9818.9818.9818.9815.5% NCD of Grasim Industries Limited 67 5500000 38.55 5500000 38.5538.5538.5538.5538.55(Certificate yet to be issued)Equity Shares ofGwalior Properties and Estates Limited 10 346850 1.45 346850 1.451.451.451.451.45Seshashayee Properties Limited 10 365750 1.64 365750 1.641.641.641.641.64Trapti Trading & Invesments Limited 10 351700 3.77 351700 3.773.773.773.773.77Turquoise Investments & Finance Limited 10 341600 3.66 341600 3.663.663.663.663.66Super Bazar Co-op. Society Ltd. 10 500 (5000) 500 (5000)(5000)(5000)(5000)(5000)
Trade Investments-Fully paid-upQUOTED
Equity Shares ofIndo-Gulf Corporation Ltd.(Indo-Gulf) 10 19579357 45.85 19579357 45.8545.8545.8545.8545.85MRPL 10 41012461 65.10 41012461 65.1065.1065.1065.1065.10Century Enka Ltd. 10 62500 1.25 62500 1.251.251.251.251.25
UNQUOTEDEquity Shares ofJayashree Angus Sales Co. Ltd. 100 ����� 30 (3000)(3000)(3000)(3000)(3000)Birla AT&T Communication Ltd. (Birla AT&T) 10 88816400 88.82 87,339,655 87 .3487 .3487 .3487 .3487 .34
Investment in Subsidiary Companies :(Fully paid up, Unquoted)
Laxminarayan Investment Ltd.- Equity Shares 10 11093000 11.09 11093000 11.0911.0911.0911.0911.09- 9% Non-Cumulative Redeemable Preference Shares 100 � 1000 0.010.010.010.010.01Rajnidhi Finance Ltd.- Equity Shares 10 40000 0.04 40000 0.040.040.040.040.04- 9% Non-Cumulative Redeemable Preference Shares 100 � 1000 0.010.010.010.010.01Aditya Vikram Global Trading House Ltd. US$1 850000 3.70 �����
CURRENT INVESTMENTSCURRENT INVESTMENTSCURRENT INVESTMENTSCURRENT INVESTMENTSCURRENT INVESTMENTSFully paid-up (Quoted)Fully paid-up (Quoted)Fully paid-up (Quoted)Fully paid-up (Quoted)Fully paid-up (Quoted)
13.25% NCD of Reliance Industries Ltd. 5000000 � 40 19.9819.9819.9819.9819.9812.6% Bond of ICICI Ltd.(Series F/98) 100000 � 1000 9.979.979.979.979.9712.75% Bond of ICICI Ltd.(Series G/98) 100000 � 1000 10.0010.0010.0010.0010.0012.9% Bond of ICICI Ltd.(Series G/98) 100000 � 1000 10.0010.0010.0010.0010.0012.5% Omni Regular Return �I� Bond of IDBI (Series D/98) 25000 � 4000 9.979.979.979.979.97Redeemable Non-Convertible Step up Liquid Bonds of 10000 � 3000 2.942.942.942.942.94The Industrial Finance Corporation of India Ltd. (IFCI)
Schedules
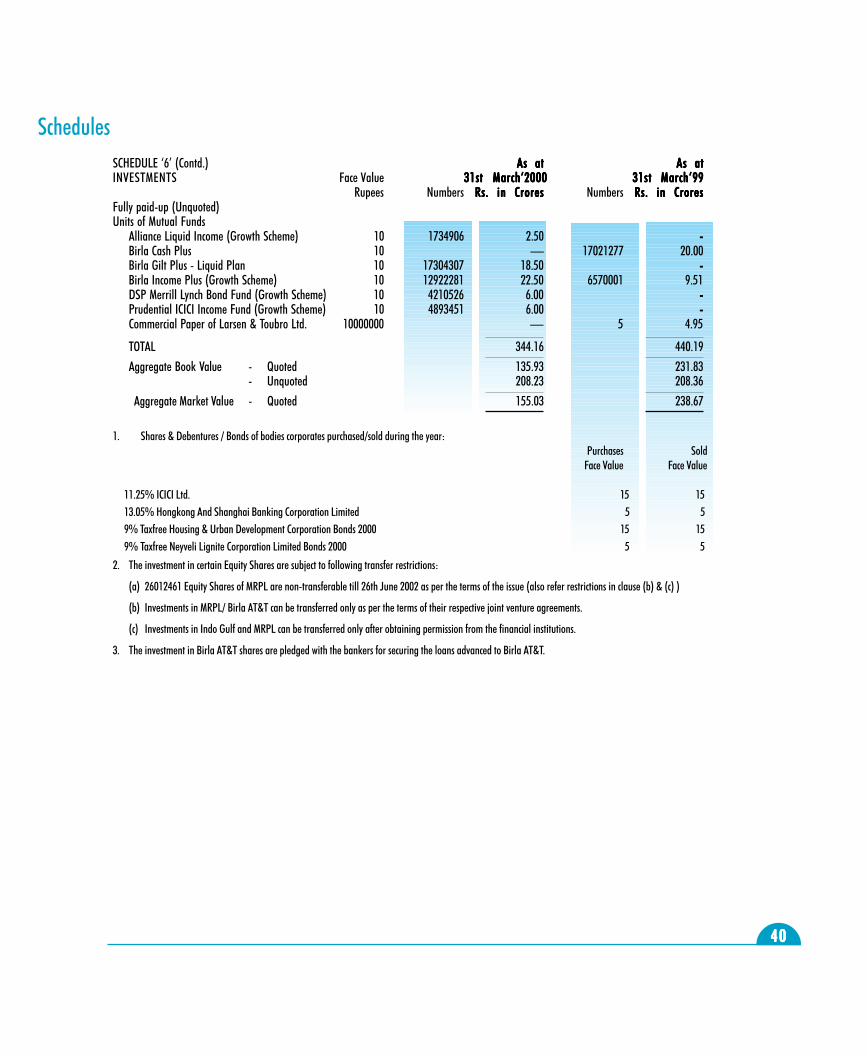
4040404040
SCHEDULE �6� (Contd.) As atAs atAs atAs atAs at As atAs atAs atAs atAs atINVESTMENTS Face Value 31st March�200031st March�200031st March�200031st March�200031st March�2000 31st March�9931st March�9931st March�9931st March�9931st March�99
Rupees Numbers Rs. in CroresRs. in CroresRs. in CroresRs. in CroresRs. in Crores Numbers Rs. in CroresRs. in CroresRs. in CroresRs. in CroresRs. in CroresFully paid-up (Unquoted)Units of Mutual Funds
Alliance Liquid Income (Growth Scheme) 10 1734906 2.50 -----Birla Cash Plus 10 � 17021277 20.00Birla Gilt Plus - Liquid Plan 10 17304307 18.50 -----Birla Income Plus (Growth Scheme) 10 12922281 22.50 6570001 9.51DSP Merrill Lynch Bond Fund (Growth Scheme) 10 4210526 6.00 -----Prudential ICICI Income Fund (Growth Scheme) 10 4893451 6.00 -----Commercial Paper of Larsen & Toubro Ltd. 10000000 � 5 4.95
TOTAL 344.16 440.19
Aggregate Book Value - Quoted 135.93 231.83- Unquoted 208.23 208.36
Aggregate Market Value - Quoted 155.03 238.67
1. Shares & Debentures / Bonds of bodies corporates purchased/sold during the year: Purchases SoldFace Value Face Value
11.25% ICICI Ltd. 15 1513.05% Hongkong And Shanghai Banking Corporation Limited 5 59% Taxfree Housing & Urban Development Corporation Bonds 2000 15 159% Taxfree Neyveli Lignite Corporation Limited Bonds 2000 5 5
2. The investment in certain Equity Shares are subject to following transfer restrictions:
(a) 26012461 Equity Shares of MRPL are non-transferable till 26th June 2002 as per the terms of the issue (also refer restrictions in clause (b) & (c) )
(b) Investments in MRPL/ Birla AT&T can be transferred only as per the terms of their respective joint venture agreements.
(c) Investments in Indo Gulf and MRPL can be transferred only after obtaining permission from the financial institutions.
3. The investment in Birla AT&T shares are pledged with the bankers for securing the loans advanced to Birla AT&T.
Schedules
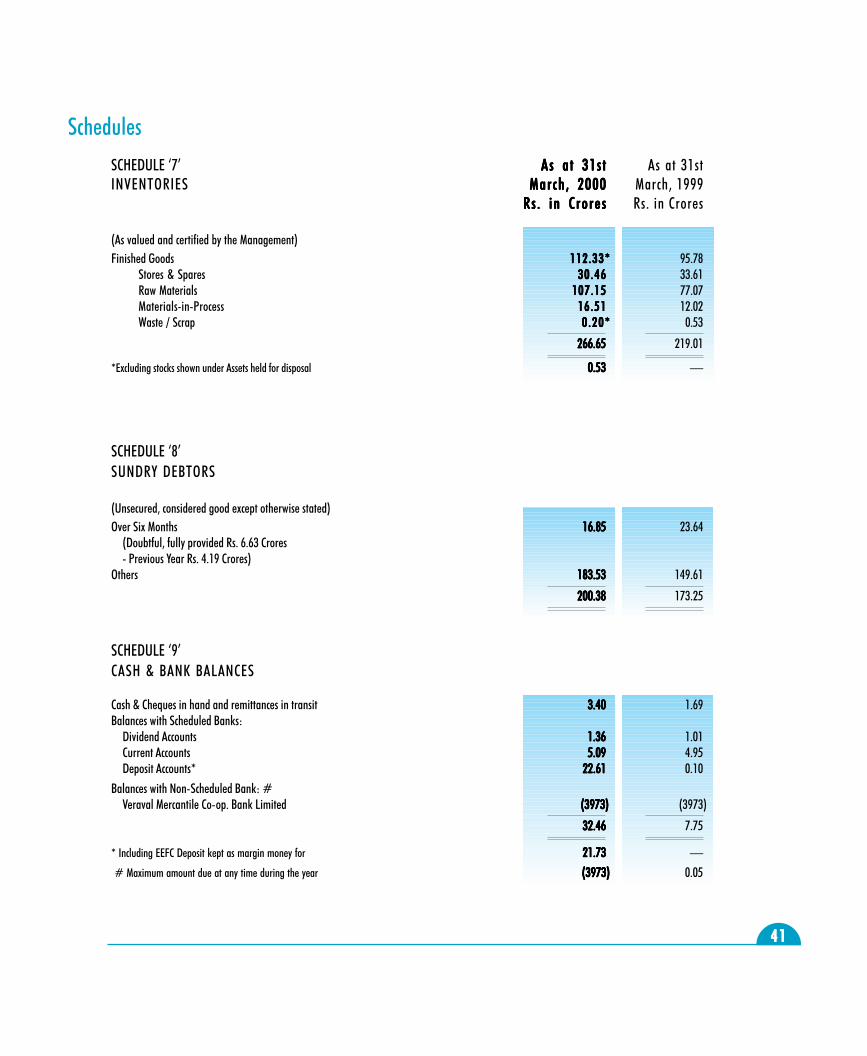
4141414141
SchedulesSCHEDULE �7� As a t 31s tAs a t 31s tAs a t 31s tAs a t 31s tAs a t 31s t As at 31stINVENTORIES Mar ch , 2000 Mar ch , 2000 Mar ch , 2000 Mar ch , 2000 Mar ch , 2000 March, 1999
Rs . i n C ro re sRs . i n C ro re sRs . i n C ro re sRs . i n C ro re sRs . i n C ro re s Rs. in Crores
(As valued and certified by the Management)Finished Goods 112.33*112.33*112.33*112.33*112.33* 95.78
Stores & Spares 30 .4630 .4630 .4630 .4630 .46 33.61Raw Materials 107.15107.15107.15107.15107.15 77.07Materials-in-Process 16 .5116 .5116 .5116 .5116 .51 12.02Waste / Scrap 0 .20*0 .20*0 .20*0 .20*0 .20* 0.53
266.65266.65266.65266.65266.65 219.01
*Excluding stocks shown under Assets held for disposal 0.530.530.530.530.53 �
SCHEDULE �8�SUNDRY DEBTORS
(Unsecured, considered good except otherwise stated)Over Six Months 16.8516.8516.8516.8516.85 23.64
(Doubtful, fully provided Rs. 6.63 Crores- Previous Year Rs. 4.19 Crores)
Others 183.53183.53183.53183.53183.53 149.61
200.38200.38200.38200.38200.38 173.25
SCHEDULE �9�CASH & BANK BALANCES
Cash & Cheques in hand and remittances in transit 3.403.403.403.403.40 1.69Balances with Scheduled Banks:
Dividend Accounts 1.361.361.361.361.36 1.01Current Accounts 5.095.095.095.095.09 4.95Deposit Accounts* 22.6122.6122.6122.6122.61 0.10
Balances with Non-Scheduled Bank: #Veraval Mercantile Co-op. Bank Limited (3973)(3973)(3973)(3973)(3973) (3973)
32.4632.4632.4632.4632.46 7.75
* Including EEFC Deposit kept as margin money for 21.7321.7321.7321.7321.73 �
# Maximum amount due at any time during the year (3973)(3973)(3973)(3973)(3973) 0.05
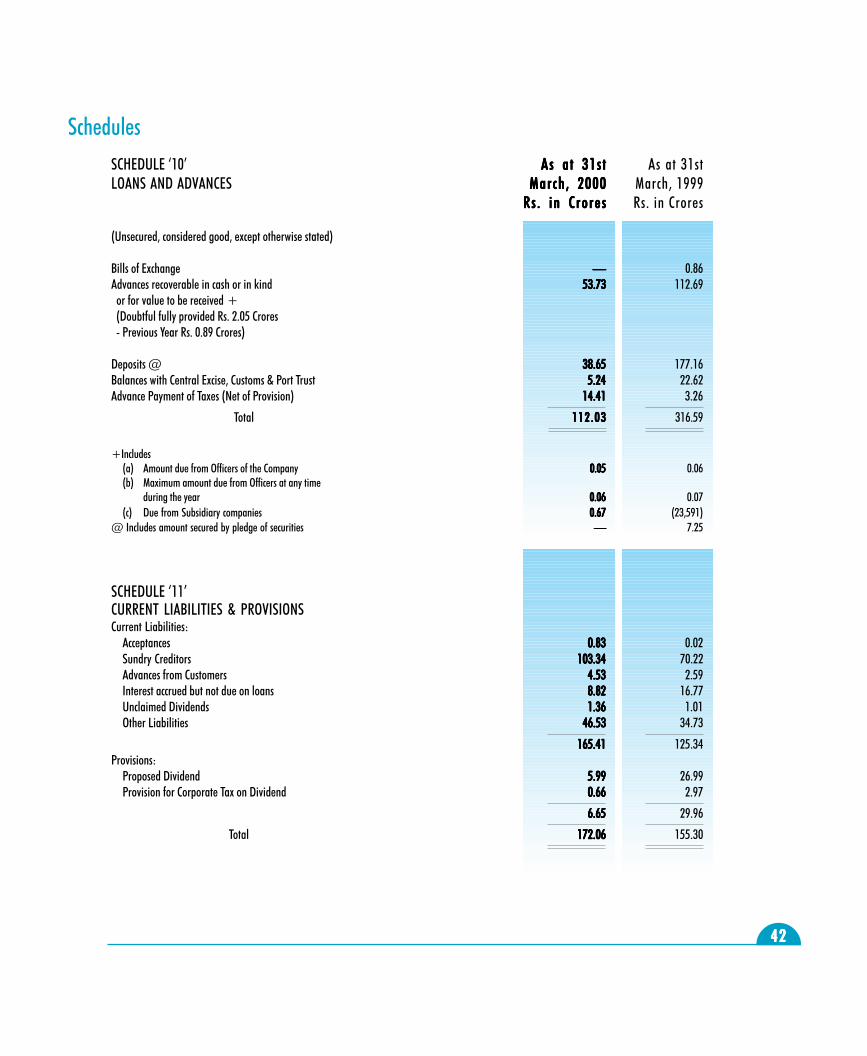
4242424242
SCHEDULE �10� As a t 31s tAs a t 31s tAs a t 31s tAs a t 31s tAs a t 31s t As at 31stLOANS AND ADVANCES Mar ch , 2000 Mar ch , 2000 Mar ch , 2000 Mar ch , 2000 Mar ch , 2000 March, 1999
Rs . i n C ro re sRs . i n C ro re sRs . i n C ro re sRs . i n C ro re sRs . i n C ro re s Rs. in Crores
(Unsecured, considered good, except otherwise stated)
Bills of Exchange ����� 0.86Advances recoverable in cash or in kind 53.7353.7353.7353.7353.73 112.69 or for value to be received + (Doubtful fully provided Rs. 2.05 Crores - Previous Year Rs. 0.89 Crores)
Deposits @ 38.6538.6538.6538.6538.65 177.16Balances with Central Excise, Customs & Port Trust 5.245.245.245.245.24 22.62Advance Payment of Taxes (Net of Provision) 14.4114.4114.4114.4114.41 3.26
Total 112.03112.03112.03112.03112.03 316.59
+Includes(a) Amount due from Officers of the Company 0.05 0.05 0.05 0.05 0.05 0.06(b) Maximum amount due from Officers at any time
during the year 0.060.060.060.060.06 0.07(c) Due from Subsidiary companies 0.670.670.670.670.67 (23,591)
@ Includes amount secured by pledge of securities ����� 7.25
SCHEDULE �11�CURRENT LIABILITIES & PROVISIONSCurrent Liabilities:
Acceptances 0.830.830.830.830.83 0.02Sundry Creditors 103.34103.34103.34103.34103.34 70.22Advances from Customers 4.534.534.534.534.53 2.59Interest accrued but not due on loans 8.828.828.828.828.82 16.77Unclaimed Dividends 1.361.361.361.361.36 1.01Other Liabilities 46.5346.5346.5346.5346.53 34.73
165.41165.41165.41165.41165.41 125.34Provisions:
Proposed Dividend 5.995.995.995.995.99 26.99Provision for Corporate Tax on Dividend 0.660.660.660.660.66 2.97
6.656.656.656.656.65 29.96
Total 172.06172.06172.06172.06172.06 155.30
Schedules
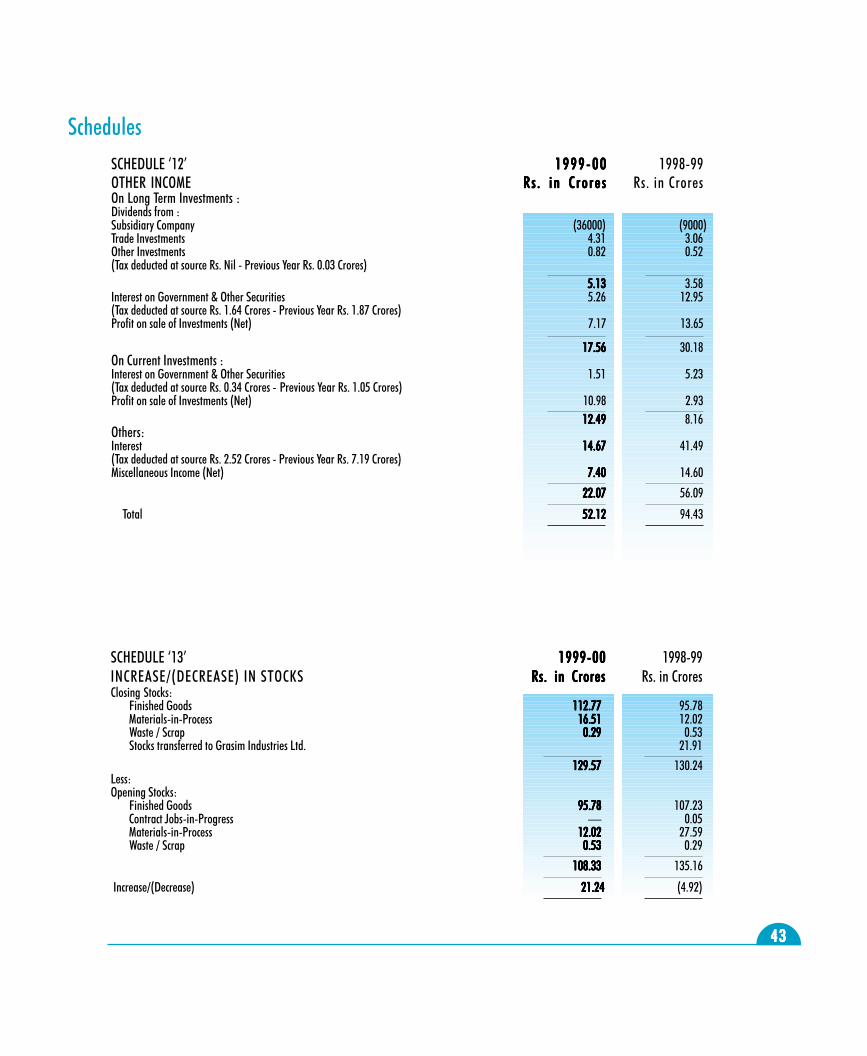
4343434343
SCHEDULE �12� 1 9 9 9 - 0 01 9 9 9 - 0 01 9 9 9 - 0 01 9 9 9 - 0 01 9 9 9 - 0 0 1998-99OTHER INCOME Rs . i n C ro re sRs . i n C ro re sRs . i n C ro re sRs . i n C ro re sRs . i n C ro re s Rs. in CroresOn Long Term Investments :Dividends from :Subsidiary Company (36000) (9000)Trade Investments 4.31 3.06Other Investments 0.82 0.52(Tax deducted at source Rs. Nil - Previous Year Rs. 0.03 Crores)
5.135.135.135.135.13 3.58Interest on Government & Other Securities 5.26 12.95(Tax deducted at source Rs. 1.64 Crores - Previous Year Rs. 1.87 Crores)Profit on sale of Investments (Net) 7.17 13.65
17.5617.5617.5617.5617.56 30.18On Current Investments :Interest on Government & Other Securities 1.51 5.23(Tax deducted at source Rs. 0.34 Crores - Previous Year Rs. 1.05 Crores)Profit on sale of Investments (Net) 10.98 2.93
12.4912.4912.4912.4912.49 8.16Others:Interest 14.6714.6714.6714.6714.67 41.49(Tax deducted at source Rs. 2.52 Crores - Previous Year Rs. 7.19 Crores)Miscellaneous Income (Net) 7.407.407.407.407.40 14.60
22.0722.0722.0722.0722.07 56.09
Total 52.1252.1252.1252.1252.12 94.43
Schedules
SCHEDULE �13� 1999-001999-001999-001999-001999-00 1998-99INCREASE/(DECREASE) IN STOCKS Rs. in CroresRs. in CroresRs. in CroresRs. in CroresRs. in Crores Rs. in CroresClosing Stocks:
Finished Goods 112.77112.77112.77112.77112.77 95.78 Materials-in-Process 16.5116.5116.5116.5116.51 12.02 Waste / Scrap 0.290.290.290.290.29 0.53 Stocks transferred to Grasim Industries Ltd. 21.91
129.57129.57129.57129.57129.57 130.24Less:Opening Stocks:
Finished Goods 95.7895.7895.7895.7895.78 107.23 Contract Jobs-in-Progress � 0.05 Materials-in-Process 12.0212.0212.0212.0212.02 27.59 Waste / Scrap 0.530.530.530.530.53 0.29
108.33108.33108.33108.33108.33 135.16
Increase/(Decrease) 21.2421.2421.2421.2421.24 (4.92)
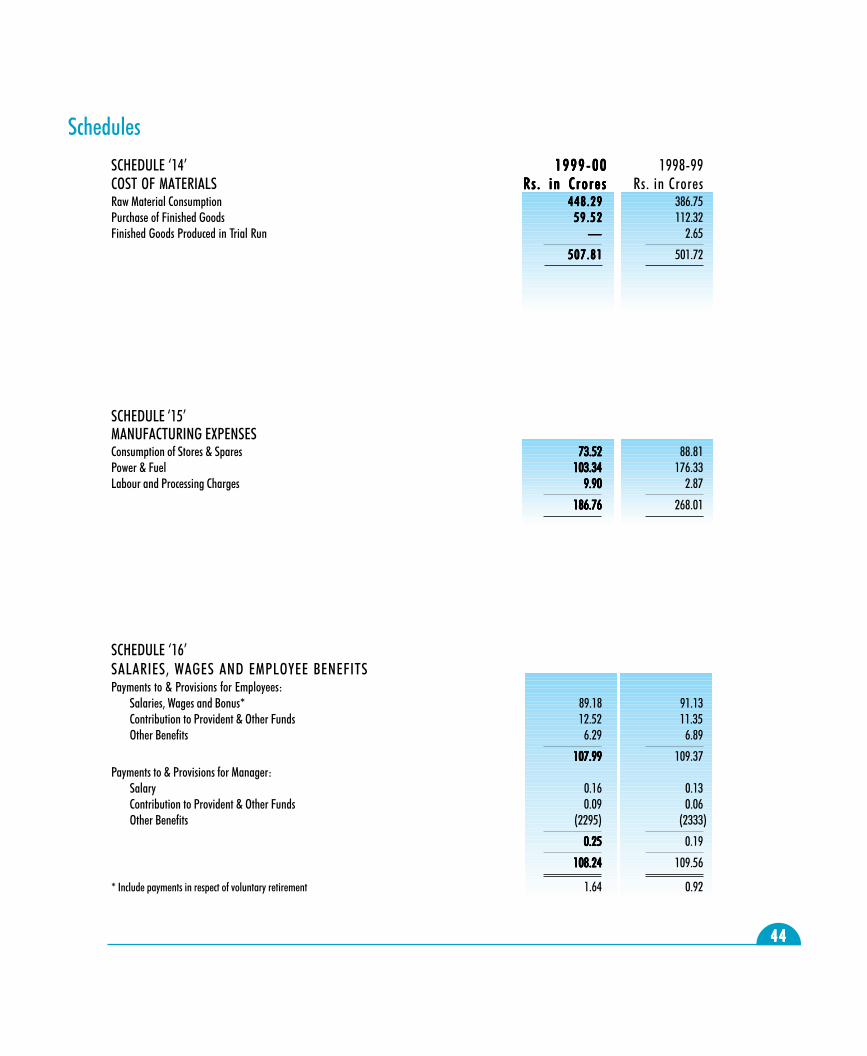
4444444444
SCHEDULE �16�SALARIES, WAGES AND EMPLOYEE BENEFITSPayments to & Provisions for Employees:
Salaries, Wages and Bonus* 89.18 91.13 Contribution to Provident & Other Funds 12.52 11.35 Other Benefits 6.29 6.89
107.99107.99107.99107.99107.99 109.37Payments to & Provisions for Manager:
Salary 0.16 0.13 Contribution to Provident & Other Funds 0.09 0.06 Other Benefits (2295) (2333)
0.250.250.250.250.25 0.19
108.24108.24108.24108.24108.24 109.56
* Include payments in respect of voluntary retirement 1.64 0.92
SCHEDULE �14� 1 9 9 9 - 0 01 9 9 9 - 0 01 9 9 9 - 0 01 9 9 9 - 0 01 9 9 9 - 0 0 1998-99COST OF MATERIALS Rs . i n C ro re sRs . i n C ro re sRs . i n C ro re sRs . i n C ro re sRs . i n C ro re s Rs. in CroresRaw Material Consumption 448.29448.29448.29448.29448.29 386.75Purchase of Finished Goods 59 .5259 .5259 .5259 .5259 .52 112.32Finished Goods Produced in Trial Run ����� 2.65
507.81507.81507.81507.81507.81 501.72
SCHEDULE �15�MANUFACTURING EXPENSESConsumption of Stores & Spares 73.5273.5273.5273.5273.52 88.81Power & Fuel 103.34103.34103.34103.34103.34 176.33Labour and Processing Charges 9.909.909.909.909.90 2.87
186.76186.76186.76186.76186.76 268.01
Schedules
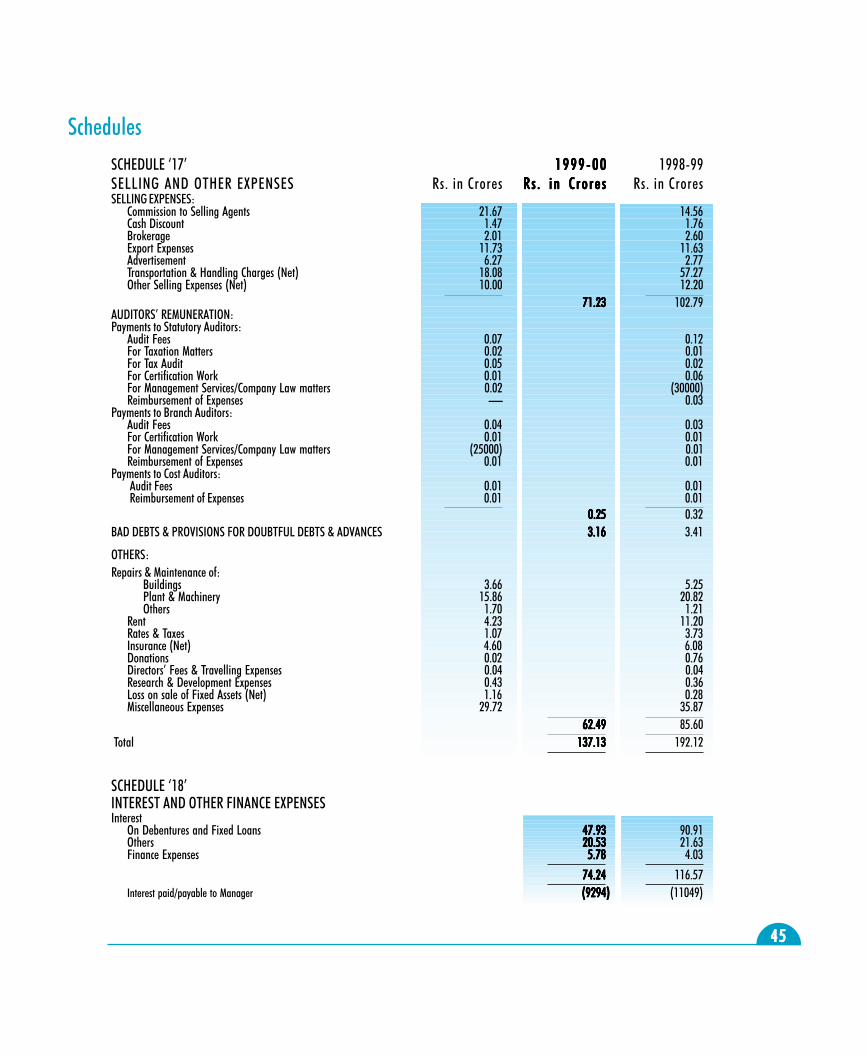
4545454545
SCHEDULE �17� 1 9 9 9 - 0 01 9 9 9 - 0 01 9 9 9 - 0 01 9 9 9 - 0 01 9 9 9 - 0 0 1998-99SELLING AND OTHER EXPENSES Rs. in Crores Rs . i n C ro re sRs . i n C ro re sRs . i n C ro re sRs . i n C ro re sRs . i n C ro re s Rs. in CroresSELLING EXPENSES:
Commission to Selling Agents 21.67 14.56Cash Discount 1.47 1.76Brokerage 2.01 2.60Export Expenses 11.73 11.63Advertisement 6.27 2.77Transportation & Handling Charges (Net) 18.08 57.27Other Selling Expenses (Net) 10.00 12.20
71.2371.2371.2371.2371.23 102.79AUDITORS� REMUNERATION:Payments to Statutory Auditors:
Audit Fees 0.07 0.12For Taxation Matters 0.02 0.01For Tax Audit 0.05 0.02For Certification Work 0.01 0.06For Management Services/Company Law matters 0.02 (30000)Reimbursement of Expenses ����� 0.03
Payments to Branch Auditors:Audit Fees 0.04 0.03For Certification Work 0.01 0.01For Management Services/Company Law matters (25000) 0.01Reimbursement of Expenses 0.01 0.01
Payments to Cost Auditors: Audit Fees 0.01 0.01 Reimbursement of Expenses 0.01 0.01
0.25 0.25 0.25 0.25 0.25 0.32BAD DEBTS & PROVISIONS FOR DOUBTFUL DEBTS & ADVANCES 3.163.163.163.163.16 3.41
OTHERS:Repairs & Maintenance of:
Buildings 3.66 5.25Plant & Machinery 15.86 20.82Others 1.70 1.21
Rent 4.23 11.20Rates & Taxes 1.07 3.73Insurance (Net) 4.60 6.08Donations 0.02 0.76Directors� Fees & Travelling Expenses 0.04 0.04Research & Development Expenses 0.43 0.36Loss on sale of Fixed Assets (Net) 1.16 0.28Miscellaneous Expenses 29.72 35.87
62.4962.4962.4962.4962.49 85.60 Total 137.13137.13137.13137.13137.13 192.12
SCHEDULE �18�INTEREST AND OTHER FINANCE EXPENSESInterest
On Debentures and Fixed Loans 47.9347.9347.9347.9347.93 90.91Others 20.5320.5320.5320.5320.53 21.63Finance Expenses 5.785.785.785.785.78 4.03
74.2474.2474.2474.2474.24 116.57Interest paid/payable to Manager (9294)(9294)(9294)(9294)(9294) (11049)
Schedules
4646464646
SCHEDULE �19�SIGNIFICANT ACCOUNTING POLICIES ANDNOTES ON BALANCE SHEET AND PROFIT AND LOSS ACCOUNTA. SIGNIFICANT ACCOUNTING POLICIES
� ACCOUNTING CONVENTIONThe financial statements are prepared under the historical cost convention (except for certain fixed assets which have been revalued),on an accrual basis and in accordance with the applicable accounting standards.
� FIXED ASSETSFixed assets are stated at cost adjusted by revaluation in case of certain land and buildings.
� DEPRECIATION/AMORTISATIONDepreciation on Fixed Assets (including revalued assets) is provided on Straight Line Method at the rates and in the manner specifiedin Schedule XIV to the Companies Act, 1956. �Continuous process plants� have been classified on technical assessment and depreciationprovided accordingly.Depreciation on the Fixed Assets added/disposed off/discarded during the year has been provided on pro-rata basis with reference tothe month of addition /disposal/discarding.Depreciation on the amounts capitalised during the year on account of foreign exchange fluctuation is provided prospectively overresidual life of the assets.Intangible and certain other assets are amortised as under :Goodwill - Not amortisedTrademarks / Brands - 15 yearsCapital Expenditure on assets not owned - 5 yearsLeasehold Land - Over the period of the lease
� TRANSLATION OF FOREIGN CURRENCY ITEMSTransactions in foreign currency are recorded at the rate of exchange in force at the date of transactions.Foreign currency assets and liabilities other than for financing fixed assets are stated at the rate of exchange prevailing at the yearend and resultant gains/losses are recognised in the Profit and Loss Account. Premium in respect of forward foreign exchangecontracts is recognised over the life of the contracts.Foreign currency loans for financing fixed assets are stated at the contracted/prevailing rate of exchange at the year end and theresultant gains / losses are adjusted to the cost of assets.
� INVESTMENTSLong Term Investments are stated at cost after deducting provision, if any, made for permanent diminution in the value.Current Investments are stated at lower of cost and market/ fair value.
� INVENTORIESInventories are valued at the lower of the cost and estimated net realisable value.Cost of inventories is computed on a weighted average / FIFO basis.Finished goods and work-in-progress include costs of conversion and other costs incurred in bringing the inventories to their presentlocation and condition.Proceeds in respect of sale of raw materials / stores are credited to the respective heads.
� GRATUITY/LEAVE ENCASHMENTProvision / Contribution to gratuity fund and provision for leave encashment are made on the basis of actuarial valuation.
� RESEARCH AND DEVELOPMENT EXPENDITURERevenue expenditure is charged to the Profit and Loss Account and Capital expenditure is added to the cost of Fixed Assets in theyear in which it is incurred.
� GOVERNMENT GRANTSRevenue grants are recognised in the Profit and Loss Account. Capital grants relating to specific fixed assets are reduced from thegross value of the respective fixed assets.Other capital grants are credited to capital reserve.
� MISCELLANEOUS EXPENDITUREMarketing/Technical know-how expenses are defered and are written-off over a period of five year.
Schedules
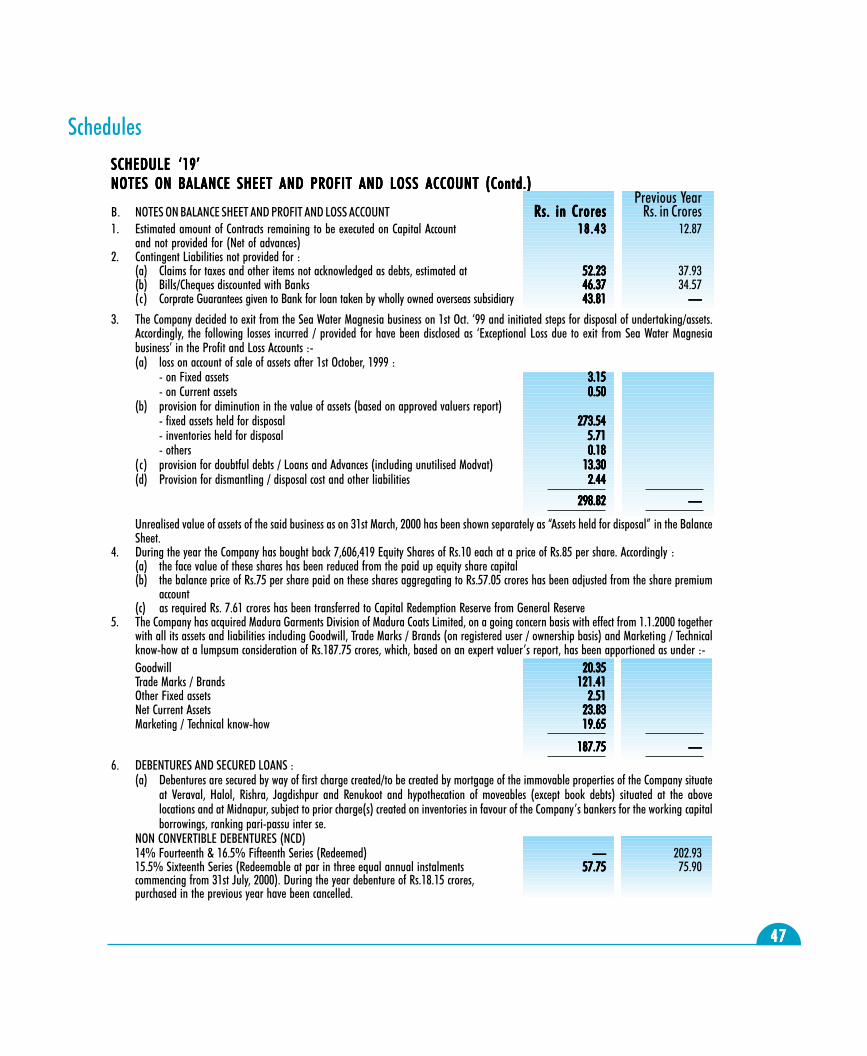
4747474747
SCHEDULE �19�SCHEDULE �19�SCHEDULE �19�SCHEDULE �19�SCHEDULE �19�NOTES ON BALANCE SHEET AND PROFIT AND LOSS ACCOUNT (Contd.)NOTES ON BALANCE SHEET AND PROFIT AND LOSS ACCOUNT (Contd.)NOTES ON BALANCE SHEET AND PROFIT AND LOSS ACCOUNT (Contd.)NOTES ON BALANCE SHEET AND PROFIT AND LOSS ACCOUNT (Contd.)NOTES ON BALANCE SHEET AND PROFIT AND LOSS ACCOUNT (Contd.)
Schedules
Previous YearB. NOTES ON BALANCE SHEET AND PROFIT AND LOSS ACCOUNT Rs. in CroresRs. in CroresRs. in CroresRs. in CroresRs. in Crores Rs. in Crores1. Estimated amount of Contracts remaining to be executed on Capital Account 18 .4318 .4318 .4318 .4318 .43 12.87
and not provided for (Net of advances)2. Contingent Liabilities not provided for :
(a) Claims for taxes and other items not acknowledged as debts, estimated at 52.2352.2352.2352.2352.23 37.93(b) Bills/Cheques discounted with Banks 46.3746.3746.3746.3746.37 34.57(c) Corprate Guarantees given to Bank for loan taken by wholly owned overseas subsidiary 43.8143.8143.8143.8143.81 �����
3. The Company decided to exit from the Sea Water Magnesia business on 1st Oct. �99 and initiated steps for disposal of undertaking/assets.Accordingly, the following losses incurred / provided for have been disclosed as �Exceptional Loss due to exit from Sea Water Magnesiabusiness� in the Profit and Loss Accounts :-(a) loss on account of sale of assets after 1st October, 1999 :
- on Fixed assets 3.15 3.15 3.15 3.15 3.15- on Current assets 0.50 0.50 0.50 0.50 0.50
(b) provision for diminution in the value of assets (based on approved valuers report)- fixed assets held for disposal 273.54 273.54 273.54 273.54 273.54- inventories held for disposal 5.715.715.715.715.71- others 0.18 0.18 0.18 0.18 0.18
(c) provision for doubtful debts / Loans and Advances (including unutilised Modvat) 13.30 13.30 13.30 13.30 13.30(d) Provision for dismantling / disposal cost and other liabilities 2.44 2.44 2.44 2.44 2.44
298.82 298.82 298.82 298.82 298.82 �����
Unrealised value of assets of the said business as on 31st March, 2000 has been shown separately as �Assets held for disposal� in the BalanceSheet.
4. During the year the Company has bought back 7,606,419 Equity Shares of Rs.10 each at a price of Rs.85 per share. Accordingly :(a) the face value of these shares has been reduced from the paid up equity share capital(b) the balance price of Rs.75 per share paid on these shares aggregating to Rs.57.05 crores has been adjusted from the share premium
account(c) as required Rs. 7.61 crores has been transferred to Capital Redemption Reserve from General Reserve
5. The Company has acquired Madura Garments Division of Madura Coats Limited, on a going concern basis with effect from 1.1.2000 togetherwith all its assets and liabilities including Goodwill, Trade Marks / Brands (on registered user / ownership basis) and Marketing / Technicalknow-how at a lumpsum consideration of Rs.187.75 crores, which, based on an expert valuer�s report, has been apportioned as under :-Goodwill 20.3520.3520.3520.3520.35Trade Marks / Brands 121.41121.41121.41121.41121.41Other Fixed assets 2.512.512.512.512.51Net Current Assets 23.8323.8323.8323.8323.83Marketing / Technical know-how 19.6519.6519.6519.6519.65
187.75187.75187.75187.75187.75 �����6. DEBENTURES AND SECURED LOANS :
(a) Debentures are secured by way of first charge created/to be created by mortgage of the immovable properties of the Company situateat Veraval, Halol, Rishra, Jagdishpur and Renukoot and hypothecation of moveables (except book debts) situated at the abovelocations and at Midnapur, subject to prior charge(s) created on inventories in favour of the Company�s bankers for the working capitalborrowings, ranking pari-passu inter se.
NON CONVERTIBLE DEBENTURES (NCD)14% Fourteenth & 16.5% Fifteenth Series (Redeemed) ����� 202.9315.5% Sixteenth Series (Redeemable at par in three equal annual instalments 57.7557.7557.7557.7557.75 75.90commencing from 31st July, 2000). During the year debenture of Rs.18.15 crores,purchased in the previous year have been cancelled.
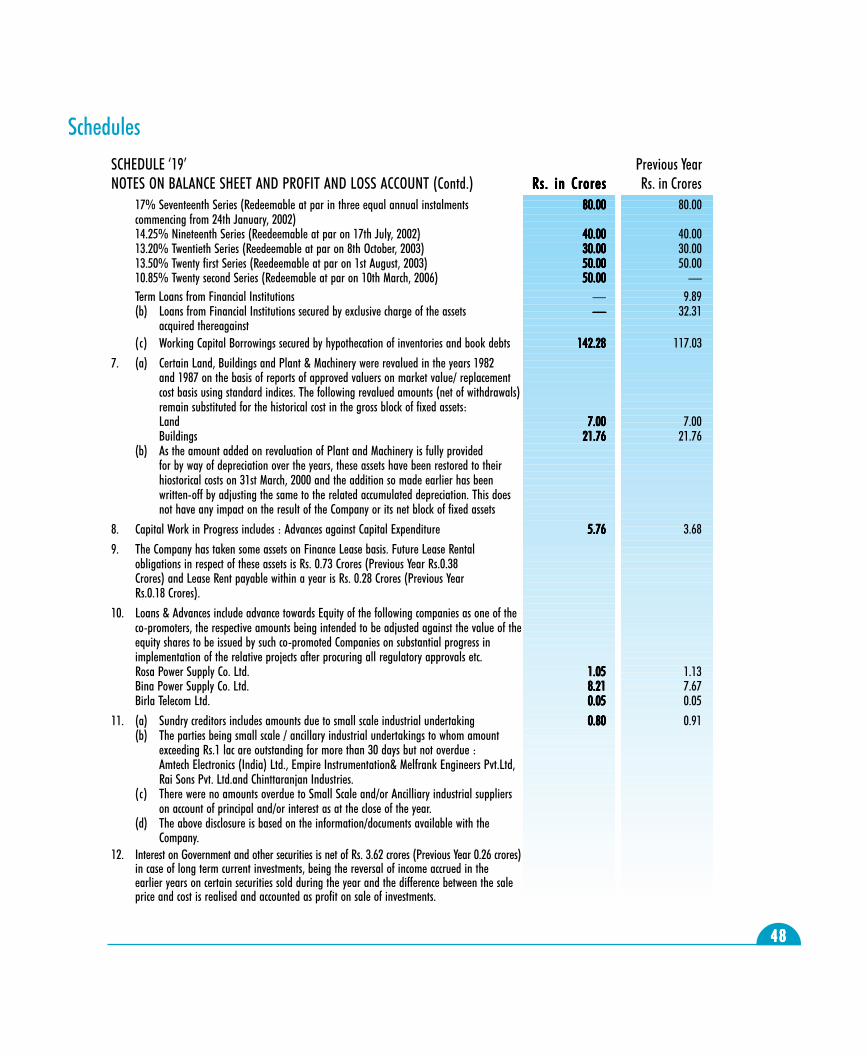
4848484848
SCHEDULE �19� Previous YearNOTES ON BALANCE SHEET AND PROFIT AND LOSS ACCOUNT (Contd.) Rs. in CroresRs. in CroresRs. in CroresRs. in CroresRs. in Crores Rs. in Crores
17% Seventeenth Series (Redeemable at par in three equal annual instalments 80.0080.0080.0080.0080.00 80.00commencing from 24th January, 2002)14.25% Nineteenth Series (Reedeemable at par on 17th July, 2002) 40.0040.0040.0040.0040.00 40.0013.20% Twentieth Series (Reedeemable at par on 8th October, 2003) 30.0030.0030.0030.0030.00 30.0013.50% Twenty first Series (Reedeemable at par on 1st August, 2003) 50.0050.0050.0050.0050.00 50.0010.85% Twenty second Series (Redeemable at par on 10th March, 2006) 50.0050.0050.0050.0050.00 �Term Loans from Financial Institutions � 9.89(b) Loans from Financial Institutions secured by exclusive charge of the assets � � � � � 32.31
acquired thereagainst(c) Working Capital Borrowings secured by hypothecation of inventories and book debts 142.28142.28142.28142.28142.28 117.03
7. (a) Certain Land, Buildings and Plant & Machinery were revalued in the years 1982and 1987 on the basis of reports of approved valuers on market value/ replacementcost basis using standard indices. The following revalued amounts (net of withdrawals)remain substituted for the historical cost in the gross block of fixed assets:Land 7.007.007.007.007.00 7.00Buildings 21.7621.7621.7621.7621.76 21.76
(b) As the amount added on revaluation of Plant and Machinery is fully providedfor by way of depreciation over the years, these assets have been restored to theirhiostorical costs on 31st March, 2000 and the addition so made earlier has beenwritten-off by adjusting the same to the related accumulated depreciation. This doesnot have any impact on the result of the Company or its net block of fixed assets
8. Capital Work in Progress includes : Advances against Capital Expenditure 5.765.765.765.765.76 3.68
9. The Company has taken some assets on Finance Lease basis. Future Lease Rentalobligations in respect of these assets is Rs. 0.73 Crores (Previous Year Rs.0.38Crores) and Lease Rent payable within a year is Rs. 0.28 Crores (Previous YearRs.0.18 Crores).
10. Loans & Advances include advance towards Equity of the following companies as one of theco-promoters, the respective amounts being intended to be adjusted against the value of theequity shares to be issued by such co-promoted Companies on substantial progress inimplementation of the relative projects after procuring all regulatory approvals etc.Rosa Power Supply Co. Ltd. 1.051.051.051.051.05 1.13Bina Power Supply Co. Ltd. 8.218.218.218.218.21 7.67Birla Telecom Ltd. 0.050.050.050.050.05 0.05
11. (a) Sundry creditors includes amounts due to small scale industrial undertaking 0.800.800.800.800.80 0.91(b) The parties being small scale / ancillary industrial undertakings to whom amount
exceeding Rs.1 lac are outstanding for more than 30 days but not overdue :Amtech Electronics (India) Ltd., Empire Instrumentation& Melfrank Engineers Pvt.Ltd,Rai Sons Pvt. Ltd.and Chinttaranjan Industries.
(c) There were no amounts overdue to Small Scale and/or Ancilliary industrial supplierson account of principal and/or interest as at the close of the year.
(d) The above disclosure is based on the information/documents available with theCompany.
12. Interest on Government and other securities is net of Rs. 3.62 crores (Previous Year 0.26 crores)in case of long term current investments, being the reversal of income accrued in theearlier years on certain securities sold during the year and the difference between the saleprice and cost is realised and accounted as profit on sale of investments.
Schedules
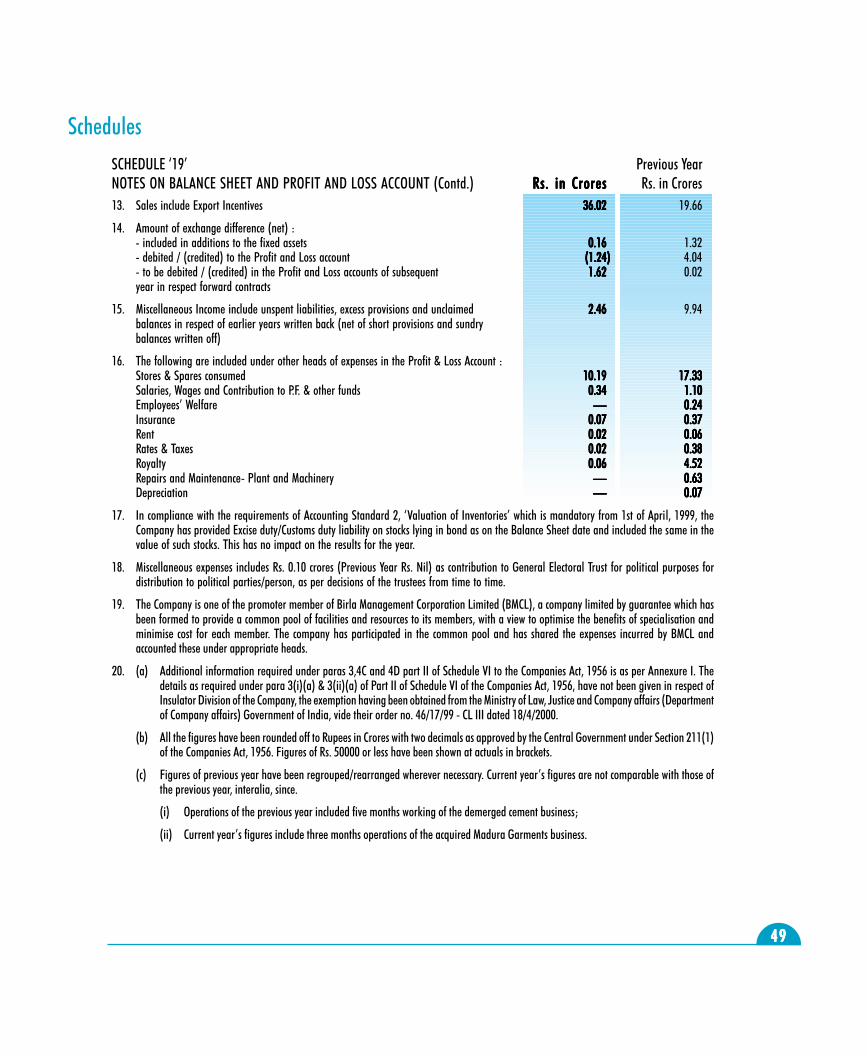
4949494949
SCHEDULE �19� Previous YearNOTES ON BALANCE SHEET AND PROFIT AND LOSS ACCOUNT (Contd.) Rs. in CroresRs. in CroresRs. in CroresRs. in CroresRs. in Crores Rs. in Crores
Schedules
13. Sales include Export Incentives 36.0236.0236.0236.0236.02 19.66
14. Amount of exchange difference (net) :- included in additions to the fixed assets 0.160.160.160.160.16 1.32- debited / (credited) to the Profit and Loss account (1.24)(1.24)(1.24)(1.24)(1.24) 4.04- to be debited / (credited) in the Profit and Loss accounts of subsequent 1.621.621.621.621.62 0.02year in respect forward contracts
15. Miscellaneous Income include unspent liabilities, excess provisions and unclaimed 2.462.462.462.462.46 9.94balances in respect of earlier years written back (net of short provisions and sundrybalances written off)
16. The following are included under other heads of expenses in the Profit & Loss Account :Stores & Spares consumed 10.1910.1910.1910.1910.19 17.3317.3317.3317.3317.33Salaries, Wages and Contribution to P.F. & other funds 0.340.340.340.340.34 1.101.101.101.101.10Employees� Welfare � � � � � 0.240.240.240.240.24Insurance 0.070.070.070.070.07 0.370.370.370.370.37Rent 0.020.020.020.020.02 0.060.060.060.060.06Rates & Taxes 0.020.020.020.020.02 0.380.380.380.380.38Royalty 0.060.060.060.060.06 4.524.524.524.524.52Repairs and Maintenance- Plant and Machinery ����� 0.630.630.630.630.63Depreciation � � � � � 0.070.070.070.070.07
17. In compliance with the requirements of Accounting Standard 2, �Valuation of Inventories� which is mandatory from 1st of April, 1999, theCompany has provided Excise duty/Customs duty liability on stocks lying in bond as on the Balance Sheet date and included the same in thevalue of such stocks. This has no impact on the results for the year.
18. Miscellaneous expenses includes Rs. 0.10 crores (Previous Year Rs. Nil) as contribution to General Electoral Trust for political purposes fordistribution to political parties/person, as per decisions of the trustees from time to time.
19. The Company is one of the promoter member of Birla Management Corporation Limited (BMCL), a company limited by guarantee which hasbeen formed to provide a common pool of facilities and resources to its members, with a view to optimise the benefits of specialisation andminimise cost for each member. The company has participated in the common pool and has shared the expenses incurred by BMCL andaccounted these under appropriate heads.
20. (a) Additional information required under paras 3,4C and 4D part II of Schedule VI to the Companies Act, 1956 is as per Annexure I. Thedetails as required under para 3(i)(a) & 3(ii)(a) of Part II of Schedule VI of the Companies Act, 1956, have not been given in respect ofInsulator Division of the Company, the exemption having been obtained from the Ministry of Law, Justice and Company affairs (Departmentof Company affairs) Government of India, vide their order no. 46/17/99 - CL III dated 18/4/2000.
(b) All the figures have been rounded off to Rupees in Crores with two decimals as approved by the Central Government under Section 211(1)of the Companies Act, 1956. Figures of Rs. 50000 or less have been shown at actuals in brackets.
(c) Figures of previous year have been regrouped/rearranged wherever necessary. Current year�s figures are not comparable with those ofthe previous year, interalia, since.
(i) Operations of the previous year included five months working of the demerged cement business;
(ii) Current year�s figures include three months operations of the acquired Madura Garments business.
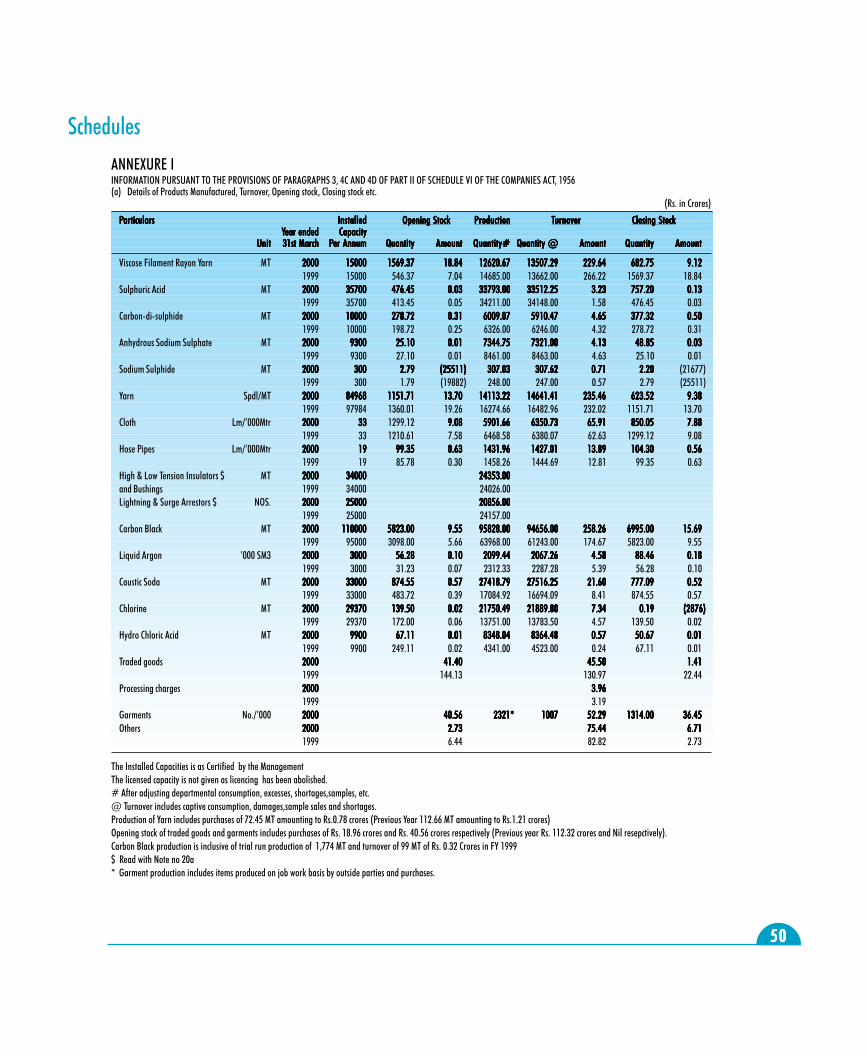
5050505050
SchedulesANNEXURE IINFORMATION PURSUANT TO THE PROVISIONS OF PARAGRAPHS 3, 4C AND 4D OF PART II OF SCHEDULE VI OF THE COMPANIES ACT, 1956(a) Details of Products Manufactured, Turnover, Opening stock, Closing stock etc.
(Rs. in Crores)
PPPPParticularsarticularsarticularsarticularsarticulars InstalledInstalledInstalledInstalledInstalled Opening StockOpening StockOpening StockOpening StockOpening Stock PPPPProductionroductionroductionroductionroduction TTTTTurnoverurnoverurnoverurnoverurnover Closing StockClosing StockClosing StockClosing StockClosing StockYYYYYear endedear endedear endedear endedear ended CapacityCapacityCapacityCapacityCapacity
UnitUnitUnitUnitUnit 31st March31st March31st March31st March31st March PPPPPer Annumer Annumer Annumer Annumer Annum QuantityQuantityQuantityQuantityQuantity AmountAmountAmountAmountAmount Quantity#Quantity#Quantity#Quantity#Quantity# Quantity @Quantity @Quantity @Quantity @Quantity @ AmountAmountAmountAmountAmount QuantityQuantityQuantityQuantityQuantity AmountAmountAmountAmountAmount
Viscose Filament Rayon Yarn MT 20002000200020002000 1500015000150001500015000 1569.371569.371569.371569.371569.37 18.8418.8418.8418.8418.84 12620.6712620.6712620.6712620.6712620.67 13507.2913507.2913507.2913507.2913507.29 229.64229.64229.64229.64229.64 682.75682.75682.75682.75682.75 9.129.129.129.129.121999 15000 546.37 7.04 14685.00 13662.00 266.22 1569.37 18.84
Sulphuric Acid MT 20002000200020002000 3570035700357003570035700 476.45476.45476.45476.45476.45 0.030.030.030.030.03 33793.0033793.0033793.0033793.0033793.00 33512.2533512.2533512.2533512.2533512.25 3.233.233.233.233.23 757.20757.20757.20757.20757.20 0.130.130.130.130.131999 35700 413.45 0.05 34211.00 34148.00 1.58 476.45 0.03
Carbon-di-sulphide MT 20002000200020002000 1000010000100001000010000 278.72278.72278.72278.72278.72 0.310.310.310.310.31 6009.076009.076009.076009.076009.07 5910.475910.475910.475910.475910.47 4.654.654.654.654.65 377.32377.32377.32377.32377.32 0.500.500.500.500.501999 10000 198.72 0.25 6326.00 6246.00 4.32 278.72 0.31
Anhydrous Sodium Sulphate MT 20002000200020002000 93009300930093009300 25.1025.1025.1025.1025.10 0.010.010.010.010.01 7344.757344.757344.757344.757344.75 7321.007321.007321.007321.007321.00 4.134.134.134.134.13 48.8548.8548.8548.8548.85 0.030.030.030.030.031999 9300 27.10 0.01 8461.00 8463.00 4.63 25.10 0.01
Sodium Sulphide MT 20002000200020002000 300300300300300 2.792.792.792.792.79 (25511)(25511)(25511)(25511)(25511) 307.03307.03307.03307.03307.03 307.62307.62307.62307.62307.62 0.710.710.710.710.71 2.202.202.202.202.20 (21677)1999 300 1.79 (19882) 248.00 247.00 0.57 2.79 (25511)
Yarn Spdl/MT 20002000200020002000 8496884968849688496884968 1151.711151.711151.711151.711151.71 13.7013.7013.7013.7013.70 14113.2214113.2214113.2214113.2214113.22 14641.4114641.4114641.4114641.4114641.41 235.46235.46235.46235.46235.46 623.52623.52623.52623.52623.52 9.389.389.389.389.381999 97984 1360.01 19.26 16274.66 16482.96 232.02 1151.71 13.70
Cloth Lm/�000Mtr 20002000200020002000 3333333333 1299.12 9.089.089.089.089.08 5901.665901.665901.665901.665901.66 6350.736350.736350.736350.736350.73 65.9165.9165.9165.9165.91 850.05850.05850.05850.05850.05 7.887.887.887.887.881999 33 1210.61 7.58 6468.58 6380.07 62.63 1299.12 9.08
Hose Pipes Lm/�000Mtr 20002000200020002000 1919191919 99.3599.3599.3599.3599.35 0.630.630.630.630.63 1431.961431.961431.961431.961431.96 1427.011427.011427.011427.011427.01 13.8913.8913.8913.8913.89 104.30104.30104.30104.30104.30 0.560.560.560.560.561999 19 85.78 0.30 1458.26 1444.69 12.81 99.35 0.63
High & Low Tension Insulators $ MT 20002000200020002000 3400034000340003400034000 24353.0024353.0024353.0024353.0024353.00and Bushings 1999 34000 24026.00Lightning & Surge Arrestors $ NOS. 20002000200020002000 2500025000250002500025000 20856.0020856.0020856.0020856.0020856.00
1999 25000 24157.00Carbon Black MT 20002000200020002000 110000110000110000110000110000 5823.005823.005823.005823.005823.00 9.559.559.559.559.55 95828.0095828.0095828.0095828.0095828.00 94656.0094656.0094656.0094656.0094656.00 258.26258.26258.26258.26258.26 6995.006995.006995.006995.006995.00 15.6915.6915.6915.6915.69
1999 95000 3098.00 5.66 63968.00 61243.00 174.67 5823.00 9.55Liquid Argon �000 SM3 20002000200020002000 30003000300030003000 56.2856.2856.2856.2856.28 0.100.100.100.100.10 2099.442099.442099.442099.442099.44 2067.262067.262067.262067.262067.26 4.584.584.584.584.58 88.4688.4688.4688.4688.46 0.180.180.180.180.18
1999 3000 31.23 0.07 2312.33 2287.28 5.39 56.28 0.10Caustic Soda MT 20002000200020002000 3300033000330003300033000 874.55874.55874.55874.55874.55 0.570.570.570.570.57 27418.7927418.7927418.7927418.7927418.79 27516.2527516.2527516.2527516.2527516.25 21.6021.6021.6021.6021.60 777.09777.09777.09777.09777.09 0.520.520.520.520.52
1999 33000 483.72 0.39 17084.92 16694.09 8.41 874.55 0.57Chlorine MT 20002000200020002000 2937029370293702937029370 139.50139.50139.50139.50139.50 0.020.020.020.020.02 21750.4921750.4921750.4921750.4921750.49 21889.8021889.8021889.8021889.8021889.80 7.347.347.347.347.34 0.190.190.190.190.19 (2876)(2876)(2876)(2876)(2876)
1999 29370 172.00 0.06 13751.00 13783.50 4.57 139.50 0.02Hydro Chloric Acid MT 20002000200020002000 99009900990099009900 67.1167.1167.1167.1167.11 0.010.010.010.010.01 8348.048348.048348.048348.048348.04 8364.488364.488364.488364.488364.48 0.570.570.570.570.57 50.6750.6750.6750.6750.67 0.010.010.010.010.01
1999 9900 249.11 0.02 4341.00 4523.00 0.24 67.11 0.01Traded goods 20002000200020002000 41.4041.4041.4041.4041.40 45.5045.5045.5045.5045.50 1.411.411.411.411.41
1999 144.13 130.97 22.44Processing charges 20002000200020002000 3.963.963.963.963.96
1999 3.19Garments No./�000 20002000200020002000 40.5640.5640.5640.5640.56 2321*2321*2321*2321*2321* 10071007100710071007 52.2952.2952.2952.2952.29 1314.001314.001314.001314.001314.00 36.4536.4536.4536.4536.45Others 20002000200020002000 2.732.732.732.732.73 75.4475.4475.4475.4475.44 6.716.716.716.716.71
1999 6.44 82.82 2.73
The Installed Capacities is as Certified by the ManagementThe licensed capacity is not given as licencing has been abolished.# After adjusting departmental consumption, excesses, shortages,samples, etc.@ Turnover includes captive consumption, damages,sample sales and shortages.Production of Yarn includes purchases of 72.45 MT amounting to Rs.0.78 crores (Previous Year 112.66 MT amounting to Rs.1.21 crores)Opening stock of traded goods and garments includes purchases of Rs. 18.96 crores and Rs. 40.56 crores respectively (Previous year Rs. 112.32 crores and Nil resepctively).Carbon Black production is inclusive of trial run production of 1,774 MT and turnover of 99 MT of Rs. 0.32 Crores in FY 1999$ Read with Note no 20a* Garment production includes items produced on job work basis by outside parties and purchases.
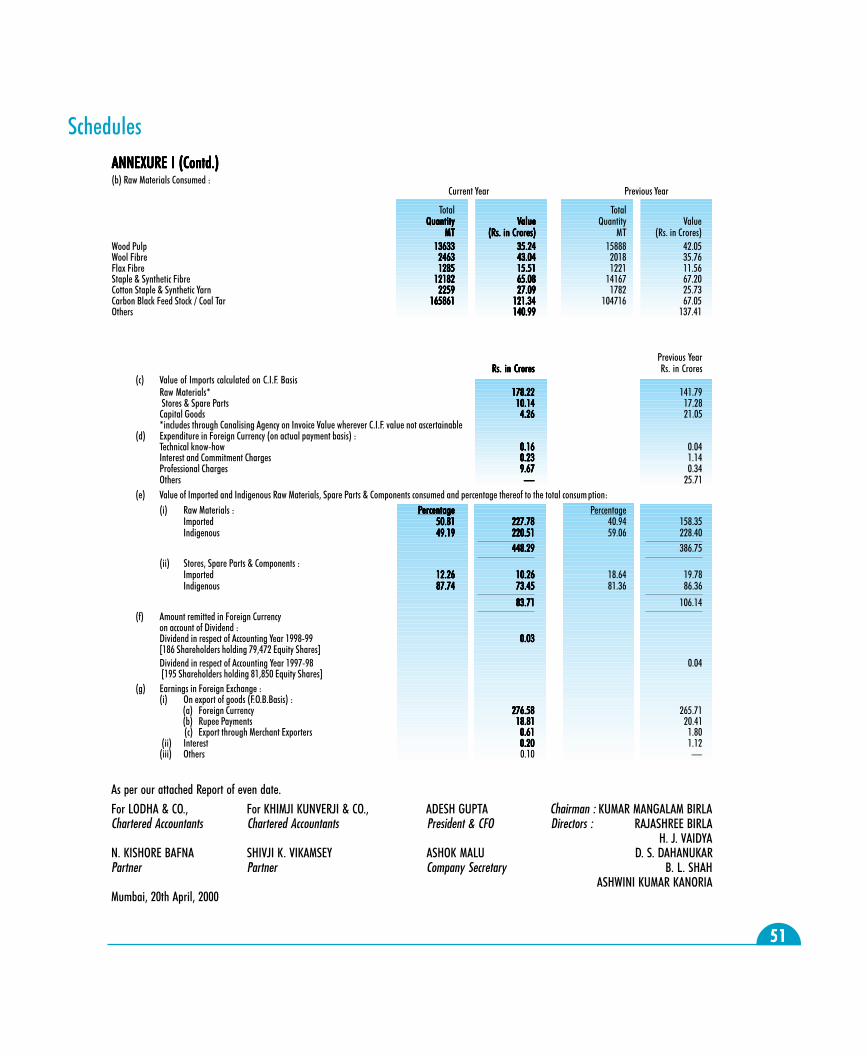
5151515151
ANNEXURE I (Contd.)ANNEXURE I (Contd.)ANNEXURE I (Contd.)ANNEXURE I (Contd.)ANNEXURE I (Contd.)(b) Raw Materials Consumed :
Current Year Previous Year
Total TotalQuantityQuantityQuantityQuantityQuantity VVVVValuealuealuealuealue Quantity Value
MT MT MT MT MT (Rs. in Crores)(Rs. in Crores)(Rs. in Crores)(Rs. in Crores)(Rs. in Crores) MT (Rs. in Crores)Wood Pulp 1363313633136331363313633 35.2435.2435.2435.2435.24 15888 42.05Wool Fibre 24632463246324632463 43.0443.0443.0443.0443.04 2018 35.76Flax Fibre 12851285128512851285 15.5115.5115.5115.5115.51 1221 11.56Staple & Synthetic Fibre 1218212182121821218212182 65.0865.0865.0865.0865.08 14167 67.20Cotton Staple & Synthetic Yarn 22592259225922592259 27.0927.0927.0927.0927.09 1782 25.73Carbon Black Feed Stock / Coal Tar 165861165861165861165861165861 121.34121.34121.34121.34121.34 104716 67.05Others 140.99140.99140.99140.99140.99 137.41
Previous YearRs. in CroresRs. in CroresRs. in CroresRs. in CroresRs. in Crores Rs. in Crores
(c) Value of Imports calculated on C.I.F. BasisRaw Materials* 178.22178.22178.22178.22178.22 141.79 Stores & Spare Parts 10.1410.1410.1410.1410.14 17.28Capital Goods 4.264.264.264.264.26 21.05*includes through Canalising Agency on Invoice Value wherever C.I.F. value not ascertainable
(d) Expenditure in Foreign Currency (on actual payment basis) :Technical know-how 0.160.160.160.160.16 0.04Interest and Commitment Charges 0.230.230.230.230.23 1.14Professional Charges 9.679.679.679.679.67 0.34Others ����� 25.71
(e) Value of Imported and Indigenous Raw Materials, Spare Parts & Components consumed and percentage thereof to the total consum ption:(i) Raw Materials : PPPPPercentageercentageercentageercentageercentage Percentage
Imported 50.8150.8150.8150.8150.81 227.78227.78227.78227.78227.78 40.94 158.35Indigenous 49.1949.1949.1949.1949.19 220.51220.51220.51220.51220.51 59.06 228.40
448.29448.29448.29448.29448.29 386.75(ii) Stores, Spare Parts & Components :
Imported 12.2612.2612.2612.2612.26 10.2610.2610.2610.2610.26 18.64 19.78Indigenous 87.7487.7487.7487.7487.74 73.4573.4573.4573.4573.45 81.36 86.36
83.7183.7183.7183.7183.71 106.14(f) Amount remitted in Foreign Currency
on account of Dividend :Dividend in respect of Accounting Year 1998-99 0.030.030.030.030.03[186 Shareholders holding 79,472 Equity Shares]Dividend in respect of Accounting Year 1997-98 0.04 [195 Shareholders holding 81,850 Equity Shares]
(g) Earnings in Foreign Exchange :(i) On export of goods (F.O.B.Basis) :
(a) Foreign Currency 276.58276.58276.58276.58276.58 265.71(b) Rupee Payments 18.8118.8118.8118.8118.81 20.41(c) Export through Merchant Exporters 0.610.610.610.610.61 1.80
(ii) Interest 0.200.200.200.200.20 1.12(iii) Others 0.10 �
Schedules
As per our attached Report of even date.For LODHA & CO., For KHIMJI KUNVERJI & CO., ADESH GUPTA Chairman : KUMAR MANGALAM BIRLAChartered Accountants Chartered Accountants President & CFO Directors : RAJASHREE BIRLA
H. J. VAIDYAN. KISHORE BAFNA SHIVJI K. VIKAMSEY ASHOK MALU D. S. DAHANUKARPartner Partner Company Secretary B. L. SHAH
ASHWINI KUMAR KANORIAMumbai, 20th April, 2000
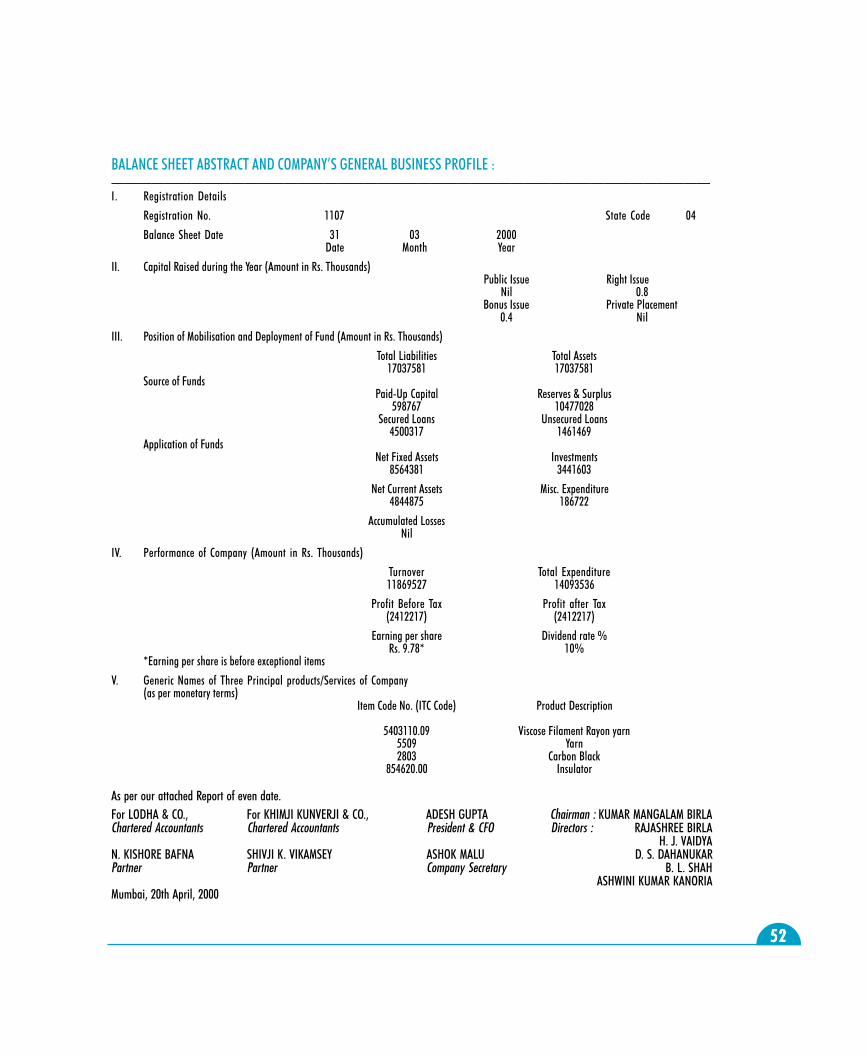
5252525252
BALANCE SHEET ABSTRACT AND COMPANY�S GENERAL BUSINESS PROFILE :���������������������������������������������I. Registration Details
Registration No. 1107 State Code 04
Balance Sheet Date 31 03 2000Date Month Year
II. Capital Raised during the Year (Amount in Rs. Thousands)Public Issue Right Issue
Nil 0.8Bonus Issue Private Placement
0.4 Nil
III. Position of Mobilisation and Deployment of Fund (Amount in Rs. Thousands)
Total Liabilities Total Assets17037581 17037581
Source of FundsPaid-Up Capital Reserves & Surplus
598767 10477028Secured Loans Unsecured Loans
4500317 1461469Application of Funds
Net Fixed Assets Investments8564381 3441603
Net Current Assets Misc. Expenditure4844875 186722
Accumulated LossesNil
IV. Performance of Company (Amount in Rs. Thousands)
Turnover Total Expenditure11869527 14093536
Profit Before Tax Profit after Tax(2412217) (2412217)
Earning per share Dividend rate %Rs. 9.78* 10%
*Earning per share is before exceptional items
V. Generic Names of Three Principal products/Services of Company(as per monetary terms)
Item Code No. (ITC Code) Product Description
5403110.09 Viscose Filament Rayon yarn5509 Yarn2803 Carbon Black
854620.00 Insulator
As per our attached Report of even date.For LODHA & CO., For KHIMJI KUNVERJI & CO., ADESH GUPTA Chairman : KUMAR MANGALAM BIRLAChartered Accountants Chartered Accountants President & CFO Directors : RAJASHREE BIRLA
H. J. VAIDYAN. KISHORE BAFNA SHIVJI K. VIKAMSEY ASHOK MALU D. S. DAHANUKARPartner Partner Company Secretary B. L. SHAH
ASHWINI KUMAR KANORIAMumbai, 20th April, 2000
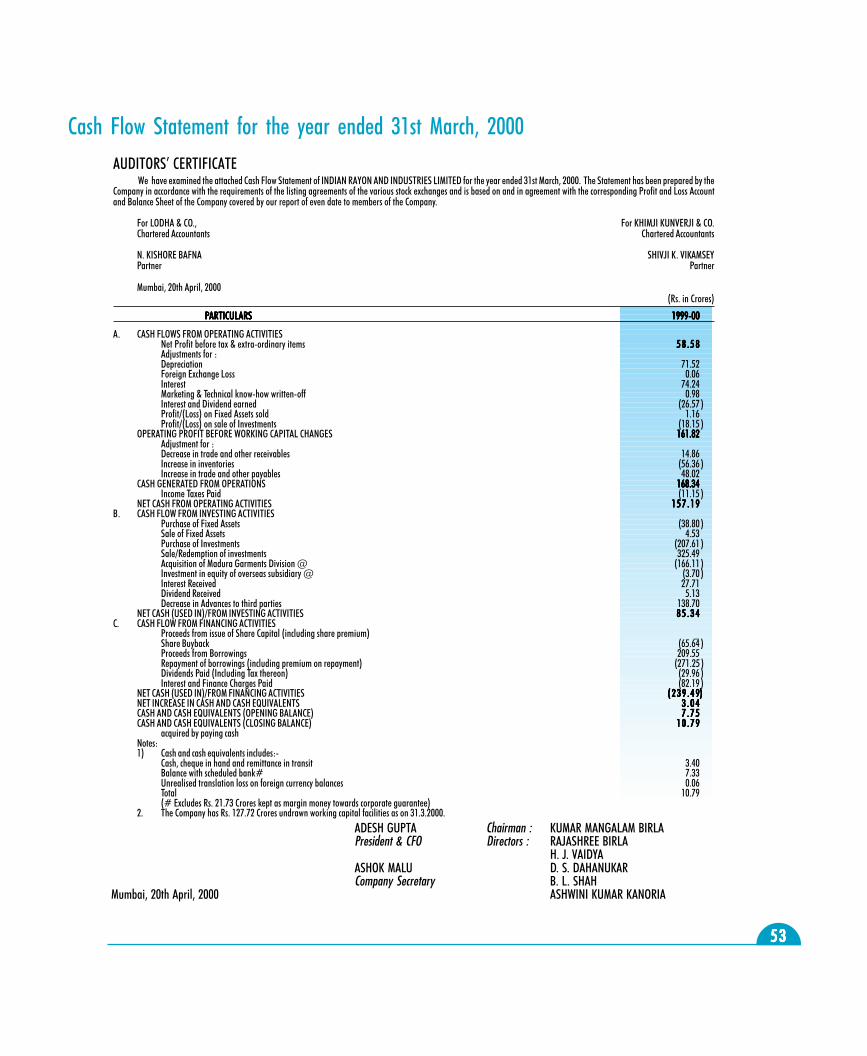
5353535353
AUDITORS� CERTIFICATEWe have examined the attached Cash Flow Statement of INDIAN RAYON AND INDUSTRIES LIMITED for the year ended 31st March, 2000. The Statement has been prepared by the
Company in accordance with the requirements of the listing agreements of the various stock exchanges and is based on and in agreement with the corresponding Profit and Loss Accountand Balance Sheet of the Company covered by our report of even date to members of the Company.
For LODHA & CO., For KHIMJI KUNVERJI & CO.Chartered Accountants Chartered Accountants
N. KISHORE BAFNA SHIVJI K. VIKAMSEYPartner Partner
Mumbai, 20th April, 2000(Rs. in Crores)
PPPPPARTICULARSARTICULARSARTICULARSARTICULARSARTICULARS 1999-001999-001999-001999-001999-00
A. CASH FLOWS FROM OPERATING ACTIVITIESNet Profit before tax & extra-ordinary items 5 8 . 5 85 8 . 5 85 8 . 5 85 8 . 5 85 8 . 5 8Adjustments for :Depreciation 71.52Foreign Exchange Loss 0.06Interest 74.24Marketing & Technical know-how written-off 0.98Interest and Dividend earned (26.57 )Profit/(Loss) on Fixed Assets sold 1.16Profit/(Loss) on sale of Investments (18.15 )
OPERATING PROFIT BEFORE WORKING CAPITAL CHANGES 161.82161.82161.82161.82161.82Adjustment for :Decrease in trade and other receivables 14.86Increase in inventories (56.36 )Increase in trade and other payables 48.02
CASH GENERATED FROM OPERATIONS 168.34168.34168.34168.34168.34Income Taxes Paid (11.15 )
NET CASH FROM OPERATING ACTIVITIES 1 5 7 . 1 91 5 7 . 1 91 5 7 . 1 91 5 7 . 1 91 5 7 . 1 9B. CASH FLOW FROM INVESTING ACTIVITIES
Purchase of Fixed Assets (38.80 )Sale of Fixed Assets 4.53Purchase of Investments (207.61 )Sale/Redemption of investments 325.49Acquisition of Madura Garments Division @ (166.11 )Investment in equity of overseas subsidiary @ (3.70 )Interest Received 27.71Dividend Received 5.13Decrease in Advances to third parties 138.70
NET CASH (USED IN)/FROM INVESTING ACTIVITIES 8 5 . 3 48 5 . 3 48 5 . 3 48 5 . 3 48 5 . 3 4C. CASH FLOW FROM FINANCING ACTIVITIES
Proceeds from issue of Share Capital (including share premium) _Share Buyback (65.64 )Proceeds from Borrowings 209.55Repayment of borrowings (including premium on repayment) (271.25 )Dividends Paid (Including Tax thereon) (29.96 )Interest and Finance Charges Paid (82.19 )
NET CASH (USED IN)/FROM FINANCING ACTIVITIES ( 2 3 9 . 4 9( 2 3 9 . 4 9( 2 3 9 . 4 9( 2 3 9 . 4 9( 2 3 9 . 4 9)))))NET INCREASE IN CASH AND CASH EQUIVALENTS 3 . 0 43 . 0 43 . 0 43 . 0 43 . 0 4CASH AND CASH EQUIVALENTS (OPENING BALANCE) 7 . 7 57 . 7 57 . 7 57 . 7 57 . 7 5CASH AND CASH EQUIVALENTS (CLOSING BALANCE) 1 0 . 7 91 0 . 7 91 0 . 7 91 0 . 7 91 0 . 7 9
acquired by paying cashNotes:1) Cash and cash equivalents includes:-
Cash, cheque in hand and remittance in transit 3.40Balance with scheduled bank# 7.33Unrealised translation loss on foreign currency balances 0.06Total 10.79(# Excludes Rs. 21.73 Crores kept as margin money towards corporate guarantee)
2. The Company has Rs. 127.72 Crores undrawn working capital facilities as on 31.3.2000.
ADESH GUPTA Chairman : KUMAR MANGALAM BIRLAPresident & CFO Directors : RAJASHREE BIRLA
H. J. VAIDYAASHOK MALU D. S. DAHANUKARCompany Secretary B. L. SHAH
Mumbai, 20th April, 2000 ASHWINI KUMAR KANORIA
Cash Flow Statement for the year ended 31st March, 2000
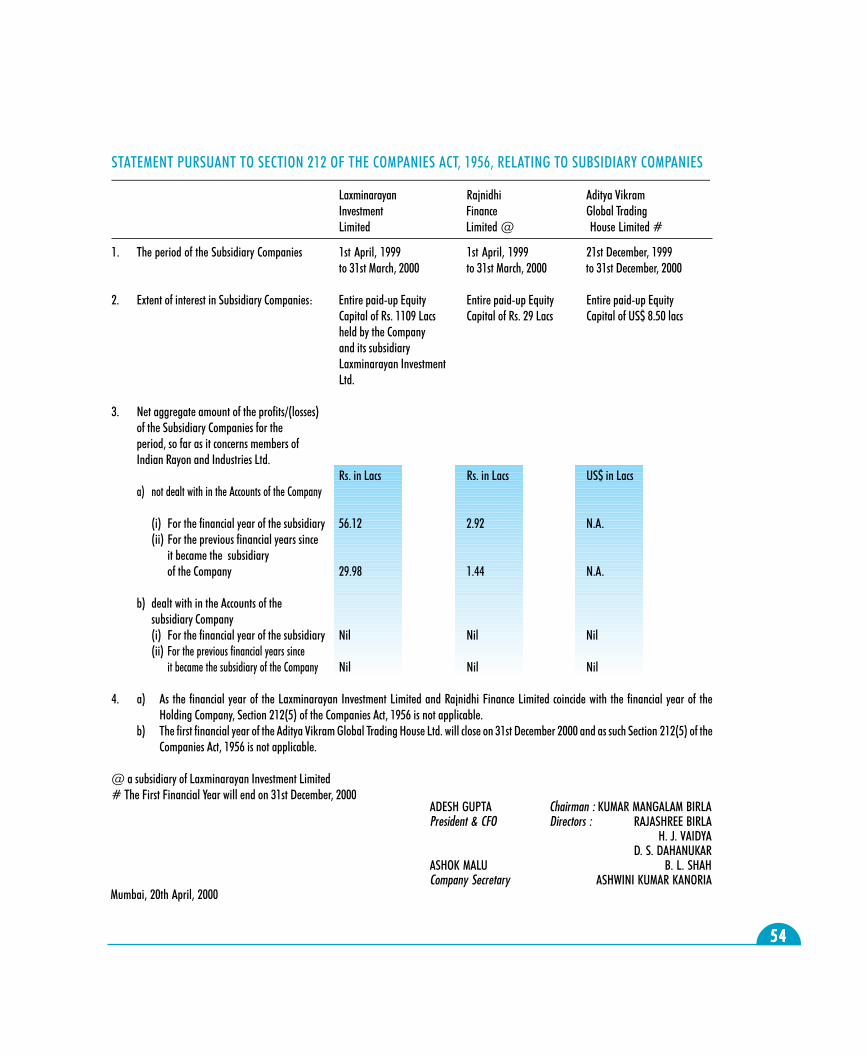
5454545454
STATEMENT PURSUANT TO SECTION 212 OF THE COMPANIES ACT, 1956, RELATING TO SUBSIDIARY COMPANIES���������������������������������������������
Laxminarayan Rajnidhi Aditya VikramInvestment Finance Global TradingLimited Limited @ House Limited #
1. The period of the Subsidiary Companies 1st April, 1999 1st April, 1999 21st December, 1999to 31st March, 2000 to 31st March, 2000 to 31st December, 2000
2. Extent of interest in Subsidiary Companies: Entire paid-up Equity Entire paid-up Equity Entire paid-up EquityCapital of Rs. 1109 Lacs Capital of Rs. 29 Lacs Capital of US$ 8.50 lacsheld by the Companyand its subsidiaryLaxminarayan InvestmentLtd.
3. Net aggregate amount of the profits/(losses)of the Subsidiary Companies for theperiod, so far as it concerns members ofIndian Rayon and Industries Ltd.
Rs. in Lacs Rs. in Lacs US$ in Lacsa) not dealt with in the Accounts of the Company
(i) For the financial year of the subsidiary 56.12 2.92 N.A.(ii) For the previous financial years since
it became the subsidiaryof the Company 29.98 1.44 N.A.
b) dealt with in the Accounts of thesubsidiary Company(i) For the financial year of the subsidiary Nil Nil Nil(ii) For the previous financial years since
it became the subsidiary of the Company Nil Nil Nil
4. a) As the financial year of the Laxminarayan Investment Limited and Rajnidhi Finance Limited coincide with the financial year of theHolding Company, Section 212(5) of the Companies Act, 1956 is not applicable.
b) The first financial year of the Aditya Vikram Global Trading House Ltd. will close on 31st December 2000 and as such Section 212(5) of theCompanies Act, 1956 is not applicable.
@ a subsidiary of Laxminarayan Investment Limited# The First Financial Year will end on 31st December, 2000
ADESH GUPTA Chairman : KUMAR MANGALAM BIRLAPresident & CFO Directors : RAJASHREE BIRLA
H. J. VAIDYAD. S. DAHANUKAR
ASHOK MALU B. L. SHAHCompany Secretary ASHWINI KUMAR KANORIA
Mumbai, 20th April, 2000
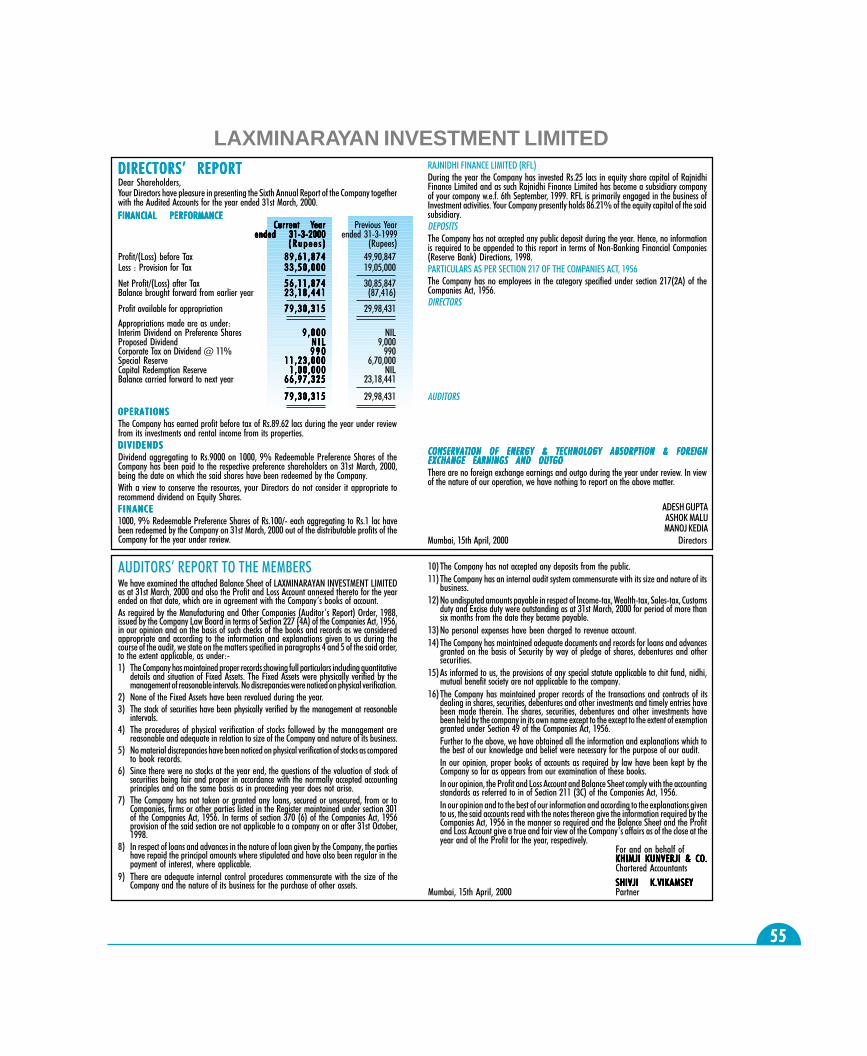
5555555555
LAXMINARAYAN INVESTMENT LIMITED
AUDITORS� REPORT TO THE MEMBERSWe have examined the attached Balance Sheet of LAXMINARAYAN INVESTMENT LIMITEDas at 31st March, 2000 and also the Profit and Loss Account annexed thereto for the yearended on that date, which are in agreement with the Company�s books of account.As required by the Manufacturing and Other Companies (Auditor�s Report) Order, 1988,issued by the Company Law Board in terms of Section 227 (4A) of the Companies Act, 1956,in our opinion and on the basis of such checks of the books and records as we consideredappropriate and according to the information and explanations given to us during thecourse of the audit, we state on the matters specified in paragraphs 4 and 5 of the said order,to the extent applicable, as under:-1) The Company has maintained proper records showing full particulars including quantitative
details and situation of Fixed Assets. The Fixed Assets were physically verified by themanagement of reasonable intervals. No discrepancies were noticed on physical verification.
2) None of the Fixed Assets have been revalued during the year.3) The stock of securities have been physically verified by the management at reasonable
intervals.4) The procedures of physical verification of stocks followed by the management are
reasonable and adequate in relation to size of the Company and nature of its business.5) No material discrepancies have been noticed on physical verification of stocks as compared
to book records.6) Since there were no stocks at the year end, the questions of the valuation of stock of
securities being fair and proper in accordance with the normally accepted accountingprinciples and on the same basis as in proceeding year does not arise.
7) The Company has not taken or granted any loans, secured or unsecured, from or toCompanies, firms or other parties listed in the Register maintained under section 301of the Companies Act, 1956. In terms of section 370 (6) of the Companies Act, 1956provision of the said section are not applicable to a company on or after 31st October,1998.
8) In respect of loans and advances in the nature of loan given by the Company, the partieshave repaid the principal amounts where stipulated and have also been regular in thepayment of interest, where applicable.
9) There are adequate internal control procedures commensurate with the size of theCompany and the nature of its business for the purchase of other assets.
10)The Company has not accepted any deposits from the public.11)The Company has an internal audit system commensurate with its size and nature of its
business.12)No undisputed amounts payable in respect of Income-tax, Wealth-tax, Sales-tax, Customs
duty and Excise duty were outstanding as at 31st March, 2000 for period of more thansix months from the date they became payable.
13)No personal expenses have been charged to revenue account.14)The Company has maintained adequate documents and records for loans and advances
granted on the basis of Security by way of pledge of shares, debentures and othersecurities.
15)As informed to us, the provisions of any special statute applicable to chit fund, nidhi,mutual benefit society are not applicable to the company.
16)The Company has maintained proper records of the transactions and contracts of itsdealing in shares, securities, debentures and other investments and timely entries havebeen made therein. The shares, securities, debentures and other investments havebeen held by the company in its own name except to the except to the extent of exemptiongranted under Section 49 of the Companies Act, 1956.Further to the above, we have obtained all the information and explanations which tothe best of our knowledge and belief were necessary for the purpose of our audit.In our opinion, proper books of accounts as required by law have been kept by theCompany so far as appears from our examination of these books.In our opinion, the Profit and Loss Account and Balance Sheet comply with the accountingstandards as referred to in of Section 211 (3C) of the Companies Act, 1956.In our opinion and to the best of our information and according to the explanations givento us, the said accounts read with the notes thereon give the information required by theCompanies Act, 1956 in the manner so required and the Balance Sheet and the Profitand Loss Account give a true and fair view of the Company�s affairs as of the close at theyear and of the Profit for the year, respectively.
For and on behalf ofKHIMJI KUNVERJI & CO.KHIMJI KUNVERJI & CO.KHIMJI KUNVERJI & CO.KHIMJI KUNVERJI & CO.KHIMJI KUNVERJI & CO.Chartered AccountantsSHIVJI K.VIKAMSEYSHIVJI K.VIKAMSEYSHIVJI K.VIKAMSEYSHIVJI K.VIKAMSEYSHIVJI K.VIKAMSEY
Mumbai, 15th April, 2000 Partner
DIRECTORS� REPORTDIRECTORS� REPORTDIRECTORS� REPORTDIRECTORS� REPORTDIRECTORS� REPORTDear Shareholders,Your Directors have pleasure in presenting the Sixth Annual Report of the Company togetherwith the Audited Accounts for the year ended 31st March, 2000.FINANCIAL PERFORMANCEFINANCIAL PERFORMANCEFINANCIAL PERFORMANCEFINANCIAL PERFORMANCEFINANCIAL PERFORMANCE
Current YCurrent YCurrent YCurrent YCurrent Yearearearearear Previous Yearended 31-3-2000ended 31-3-2000ended 31-3-2000ended 31-3-2000ended 31-3-2000 ended 31-3-1999
( R u p e e s )( R u p e e s )( R u p e e s )( R u p e e s )( R u p e e s ) (Rupees)Profit/(Loss) before Tax 8 9 , 6 1 , 8 7 48 9 , 6 1 , 8 7 48 9 , 6 1 , 8 7 48 9 , 6 1 , 8 7 48 9 , 6 1 , 8 7 4 49,90,847Less : Provision for Tax 3 3 , 5 0 , 0 0 03 3 , 5 0 , 0 0 03 3 , 5 0 , 0 0 03 3 , 5 0 , 0 0 03 3 , 5 0 , 0 0 0 19,05,000
Net Profit/(Loss) after Tax 5 6 , 1 1 , 8 7 45 6 , 1 1 , 8 7 45 6 , 1 1 , 8 7 45 6 , 1 1 , 8 7 45 6 , 1 1 , 8 7 4 30,85,847Balance brought forward from earlier year 2 3 , 1 8 , 4 4 12 3 , 1 8 , 4 4 12 3 , 1 8 , 4 4 12 3 , 1 8 , 4 4 12 3 , 1 8 , 4 4 1 (87,416)
Profit available for appropriation 7 9 , 3 0 , 3 1 57 9 , 3 0 , 3 1 57 9 , 3 0 , 3 1 57 9 , 3 0 , 3 1 57 9 , 3 0 , 3 1 5 29,98,431Appropriations made are as under:Interim Dividend on Preference Shares 9 , 0 0 09 , 0 0 09 , 0 0 09 , 0 0 09 , 0 0 0 NILProposed Dividend N I LN I LN I LN I LN I L 9,000Corporate Tax on Dividend @ 11% 9 9 09 9 09 9 09 9 09 9 0 990Special Reserve 1 1 , 2 3 , 0 0 01 1 , 2 3 , 0 0 01 1 , 2 3 , 0 0 01 1 , 2 3 , 0 0 01 1 , 2 3 , 0 0 0 6,70,000Capital Redemption Reserve 1 , 0 0 , 0 0 01 , 0 0 , 0 0 01 , 0 0 , 0 0 01 , 0 0 , 0 0 01 , 0 0 , 0 0 0 NILBalance carried forward to next year 6 6 , 9 7 , 3 2 56 6 , 9 7 , 3 2 56 6 , 9 7 , 3 2 56 6 , 9 7 , 3 2 56 6 , 9 7 , 3 2 5 23,18,441
7 9 , 3 0 , 3 1 57 9 , 3 0 , 3 1 57 9 , 3 0 , 3 1 57 9 , 3 0 , 3 1 57 9 , 3 0 , 3 1 5 29,98,431
OPERATIONSOPERATIONSOPERATIONSOPERATIONSOPERATIONSThe Company has earned profit before tax of Rs.89.62 lacs during the year under reviewfrom its investments and rental income from its properties.DIVIDENDSDIVIDENDSDIVIDENDSDIVIDENDSDIVIDENDSDividend aggregating to Rs.9000 on 1000, 9% Redeemable Preference Shares of theCompany has been paid to the respective preference shareholders on 31st March, 2000,being the date on which the said shares have been redeemed by the Company.With a view to conserve the resources, your Directors do not consider it appropriate torecommend dividend on Equity Shares.F INANCEFINANCEFINANCEFINANCEFINANCE1000, 9% Redeemable Preference Shares of Rs.100/- each aggregating to Rs.1 lac havebeen redeemed by the Company on 31st March, 2000 out of the distributable profits of theCompany for the year under review.
RAJNIDHI FINANCE LIMITED (RFL)During the year the Company has invested Rs.25 lacs in equity share capital of RajnidhiFinance Limited and as such Rajnidhi Finance Limited has become a subsidiary companyof your company w.e.f. 6th September, 1999. RFL is primarily engaged in the business ofInvestment activities. Your Company presently holds 86.21% of the equity capital of the saidsubsidiary.DEPOSITSThe Company has not accepted any public deposit during the year. Hence, no informationis required to be appended to this report in terms of Non-Banking Financial Companies(Reserve Bank) Directions, 1998.PARTICULARS AS PER SECTION 217 OF THE COMPANIES ACT, 1956The Company has no employees in the category specified under section 217(2A) of theCompanies Act, 1956.DIRECTORSShri D. D. Rathi and Shri B.L.Ajmera have resigned as Directors of the Company with effectfrom 16th July, 1999. The Board placed on record its appreciation for the valuable servicesrendered by both Shri D.D.Rathi and Shri B.L.Ajmera during their tenure as Directors of theCompany.Shri Adesh Gupta and Shri Manoj Kedia were appointed as Directors to fill up casual vacancycaused by resignation of abovementioned Directors respectively.Shri C.P. Mathur and Shri Adesh Gupta retire by rotation and being eligible, offer themselvesfor reappointment.AUDITORSThe observations made in the Auditors� Report are self-explanatory and therefore, do notcall for any further comments under Section 217(3) of the Companies Act, 1956.The members are requested to appoint Auditors for the current year and fix their remunera-tion.CONSERVATION OF ENERGY & TECHNOLOGY ABSORPTION & FOREIGNCONSERVATION OF ENERGY & TECHNOLOGY ABSORPTION & FOREIGNCONSERVATION OF ENERGY & TECHNOLOGY ABSORPTION & FOREIGNCONSERVATION OF ENERGY & TECHNOLOGY ABSORPTION & FOREIGNCONSERVATION OF ENERGY & TECHNOLOGY ABSORPTION & FOREIGNEXCHANGE EARNINGS AND OUTGOEXCHANGE EARNINGS AND OUTGOEXCHANGE EARNINGS AND OUTGOEXCHANGE EARNINGS AND OUTGOEXCHANGE EARNINGS AND OUTGOThere are no foreign exchange earnings and outgo during the year under review. In viewof the nature of our operation, we have nothing to report on the above matter.
Mumbai, 15th April, 2000 Directors
ADESH GUPTAASHOK MALUMANOJ KEDIA
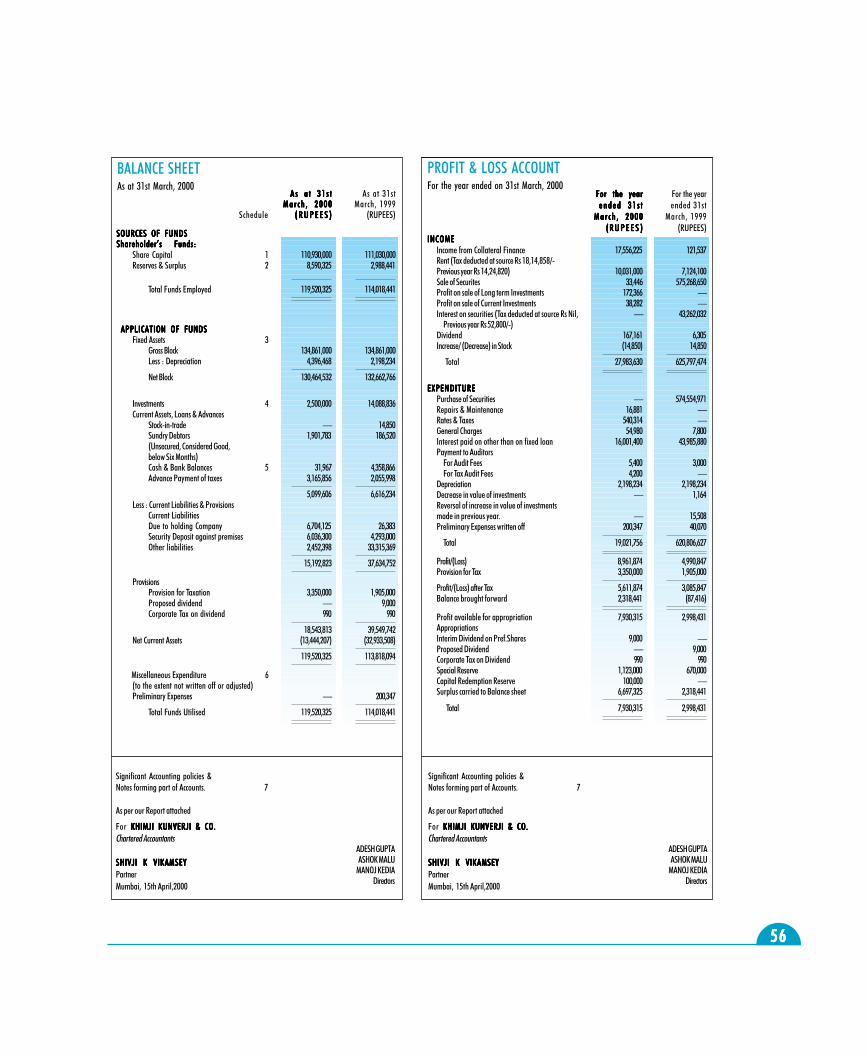
5656565656
A s a t 3 1 s t A s a t 3 1 s t A s a t 3 1 s t A s a t 3 1 s t A s a t 3 1 s t As at 31st M a r c h , 2 0 0 0 M a r c h , 2 0 0 0 M a r c h , 2 0 0 0 M a r c h , 2 0 0 0 M a r c h , 2 0 0 0 March, 1999
Schedule ( R U P E E S )( R U P E E S )( R U P E E S )( R U P E E S )( R U P E E S ) (RUPEES)
SOURCES OF FUNDSSOURCES OF FUNDSSOURCES OF FUNDSSOURCES OF FUNDSSOURCES OF FUNDSShareholder�s Funds:Shareholder�s Funds:Shareholder�s Funds:Shareholder�s Funds:Shareholder�s Funds:
Share Capital 1 110,930,000 111,030,000Reserves & Surplus 2 8,590,325 2,988,441
Total Funds Employed 119,520,325 114,018,441
APPLICATION OF FUNDSAPPLICATION OF FUNDSAPPLICATION OF FUNDSAPPLICATION OF FUNDSAPPLICATION OF FUNDSFixed Assets 3
Gross Block 134,861,000 134,861,000Less : Depreciation 4,396,468 2,198,234
Net Block 130,464,532 132,662,766
Investments 4 2,500,000 14,088,836Current Assets, Loans & Advances
Stock-in-trade � 14,850Sundry Debtors 1,901,783 186,520(Unsecured, Considered Good,below Six Months)Cash & Bank Balances 5 31,967 4,358,866Advance Payment of taxes 3,165,856 2,055,998
5,099,606 6,616,234Less : Current Liabilities & Provisions
Current LiabilitiesDue to holding Company 6,704,125 26,383Security Deposit against premises 6,036,300 4,293,000Other liabilities 2,452,398 33,315,369
15,192,823 37,634,752
ProvisionsProvision for Taxation 3,350,000 1,905,000Proposed dividend � 9,000Corporate Tax on dividend 990 990
18,543,813 39,549,742Net Current Assets (13,444,207) (32,933,508)
119,520,325 113,818,094
Miscellaneous Expenditure 6(to the extent not written off or adjusted)Preliminary Expenses � 200,347
Total Funds Utilised 119,520,325 114,018,441
BALANCE SHEETAs at 31st March, 2000
For the yearFor the yearFor the yearFor the yearFor the year For the year e n d e d 3 1 s t e n d e d 3 1 s t e n d e d 3 1 s t e n d e d 3 1 s t e n d e d 3 1 s t ended 31st
M a r c h , 2 0 0 0 M a r c h , 2 0 0 0 M a r c h , 2 0 0 0 M a r c h , 2 0 0 0 M a r c h , 2 0 0 0 March, 1999((((( R U P E E SR U P E E SR U P E E SR U P E E SR U P E E S ))))) (RUPEES)
INCOMEINCOMEINCOMEINCOMEINCOMEIncome from Collateral Finance 17,556,225 121,537Rent (Tax deducted at source Rs 18,14,858/-Previous year Rs 14,24,820) 10,031,000 7,124,100Sale of Securites 33,446 575,268,650Profit on sale of Long term Investments 172,366 �Profit on sale of Current Investments 38,282 �Interest on securities (Tax deducted at source Rs Nil, � 43,262,032
Previous year Rs 52,800/-)Dividend 167,161 6,305Increase/ (Decrease) in Stock (14,850) 14,850
Total 27,983,630 625,797,474
EXPENDITUREEXPENDITUREEXPENDITUREEXPENDITUREEXPENDITUREPurchase of Securities � 574,554,971Repairs & Maintenance 16,881 �Rates & Taxes 540,314 �General Charges 54,980 7,800Interest paid on other than on fixed loan 16,001,400 43,985,880Payment to Auditors
For Audit Fees 5,400 3,000For Tax Audit Fees 4,200 �
Depreciation 2,198,234 2,198,234Decrease in value of investments � 1,164Reversal of increase in value of investmentsmade in previous year. � 15,508Preliminary Expenses written off 200,347 40,070
Total 19,021,756 620,806,627
Profit/(Loss) 8,961,874 4,990,847Provision for Tax 3,350,000 1,905,000
Profit/(Loss) after Tax 5,611,874 3,085,847Balance brought forward 2,318,441 (87,416)
Profit available for appropriation 7,930,315 2,998,431AppropriationsInterim Dividend on Pref.Shares 9,000 �Proposed Dividend � 9,000Corporate Tax on Dividend 990 990Special Reserve 1,123,000 670,000Capital Redemption Reserve 100,000 �Surplus carried to Balance sheet 6,697,325 2,318,441
Total 7,930,315 2,998,431
PROFIT & LOSS ACCOUNTFor the year ended on 31st March, 2000
Significant Accounting policies &Notes forming part of Accounts. 7
As per our Report attached
For KHIMJI KUNVERJI & CO. KHIMJI KUNVERJI & CO. KHIMJI KUNVERJI & CO. KHIMJI KUNVERJI & CO. KHIMJI KUNVERJI & CO.Chartered Accountants
SHIVJI K VIKAMSEYSHIVJI K VIKAMSEYSHIVJI K VIKAMSEYSHIVJI K VIKAMSEYSHIVJI K VIKAMSEYPartnerMumbai, 15th April,2000
ADESH GUPTAASHOK MALU
MANOJ KEDIADirectors
ADESH GUPTAASHOK MALU
MANOJ KEDIADirectors
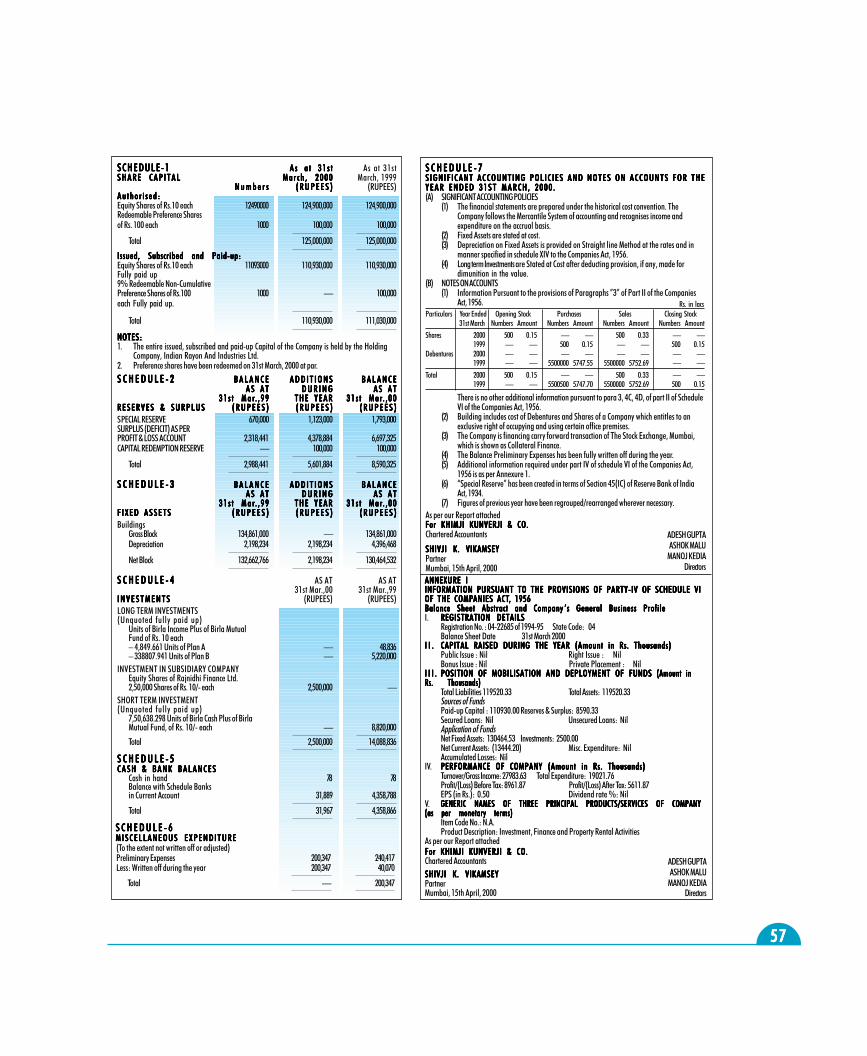
5757575757
S C H E D U L E - 1S C H E D U L E - 1S C H E D U L E - 1S C H E D U L E - 1S C H E D U L E - 1 A s a t 3 1 s tA s a t 3 1 s tA s a t 3 1 s tA s a t 3 1 s tA s a t 3 1 s t As at 31stS H A R E C A P I T A LS H A R E C A P I T A LS H A R E C A P I T A LS H A R E C A P I T A LS H A R E C A P I T A L M a r c h , 2 0 0 0M a r c h , 2 0 0 0M a r c h , 2 0 0 0M a r c h , 2 0 0 0M a r c h , 2 0 0 0 March, 1999
N u m b e r sN u m b e r sN u m b e r sN u m b e r sN u m b e r s ( R U P E E S )( R U P E E S )( R U P E E S )( R U P E E S )( R U P E E S ) (RUPEES)A u t h o r i s e d :A u t h o r i s e d :A u t h o r i s e d :A u t h o r i s e d :A u t h o r i s e d :Equity Shares of Rs.10 each 12490000 124,900,000 124,900,000Redeemable Preference Sharesof Rs. 100 each 1000 100,000 100,000
Total 125,000,000 125,000,000
Issued, Subscribed and Paid-up:Issued, Subscribed and Paid-up:Issued, Subscribed and Paid-up:Issued, Subscribed and Paid-up:Issued, Subscribed and Paid-up:Equity Shares of Rs.10 each 11093000 110,930,000 110,930,000Fully paid up9% Redeemable Non-CumulativePreference Shares of Rs.100 1000 � 100,000each Fully paid up.
Total 110,930,000 111,030,000
NOTES:NOTES:NOTES:NOTES:NOTES:1. The entire issued, subscribed and paid-up Capital of the Company is held by the Holding
Company, Indian Rayon And Industries Ltd.2. Preference shares have been redeemed on 31st March, 2000 at par.
S C H E D U L E - 2S C H E D U L E - 2S C H E D U L E - 2S C H E D U L E - 2S C H E D U L E - 2 B A L A N C EB A L A N C EB A L A N C EB A L A N C EB A L A N C E A D D I T I O N SA D D I T I O N SA D D I T I O N SA D D I T I O N SA D D I T I O N S B A L A N C EB A L A N C EB A L A N C EB A L A N C EB A L A N C EA S A TA S A TA S A TA S A TA S A T D U R I N GD U R I N GD U R I N GD U R I N GD U R I N G A S A TA S A TA S A TA S A TA S A T
3 1 s t M a r3 1 s t M a r3 1 s t M a r3 1 s t M a r3 1 s t M a r. , 9 9. , 9 9. , 9 9. , 9 9. , 9 9 T H E Y E A RT H E Y E A RT H E Y E A RT H E Y E A RT H E Y E A R 3 1 s t M a r3 1 s t M a r3 1 s t M a r3 1 s t M a r3 1 s t M a r. , 0 0. , 0 0. , 0 0. , 0 0. , 0 0R E S E R V E S & S U R P L U SR E S E R V E S & S U R P L U SR E S E R V E S & S U R P L U SR E S E R V E S & S U R P L U SR E S E R V E S & S U R P L U S ( R U P E E S )( R U P E E S )( R U P E E S )( R U P E E S )( R U P E E S ) ( R U P E E S )( R U P E E S )( R U P E E S )( R U P E E S )( R U P E E S ) ( R U P E E S )( R U P E E S )( R U P E E S )( R U P E E S )( R U P E E S )SPECIAL RESERVE 670,000 1,123,000 1,793,000SURPLUS (DEFICIT) AS PERPROFIT & LOSS ACCOUNT 2,318,441 4,378,884 6,697,325CAPITAL REDEMPTION RESERVE � 100,000 100,000
Total 2,988,441 5,601,884 8,590,325
S C H E D U L E - 3S C H E D U L E - 3S C H E D U L E - 3S C H E D U L E - 3S C H E D U L E - 3 B A L A N C EB A L A N C EB A L A N C EB A L A N C EB A L A N C E A D D I T I O N SA D D I T I O N SA D D I T I O N SA D D I T I O N SA D D I T I O N S B A L A N C EB A L A N C EB A L A N C EB A L A N C EB A L A N C EA S A TA S A TA S A TA S A TA S A T D U R I N GD U R I N GD U R I N GD U R I N GD U R I N G A S A TA S A TA S A TA S A TA S A T
3 1 s t M a r3 1 s t M a r3 1 s t M a r3 1 s t M a r3 1 s t M a r. , 9 9. , 9 9. , 9 9. , 9 9. , 9 9 T H E Y E A RT H E Y E A RT H E Y E A RT H E Y E A RT H E Y E A R 3 1 s t M a r3 1 s t M a r3 1 s t M a r3 1 s t M a r3 1 s t M a r. , 0 0. , 0 0. , 0 0. , 0 0. , 0 0F I X E D A S S E T SF I X E D A S S E T SF I X E D A S S E T SF I X E D A S S E T SF I X E D A S S E T S ( R U P E E S )( R U P E E S )( R U P E E S )( R U P E E S )( R U P E E S ) ( R U P E E S )( R U P E E S )( R U P E E S )( R U P E E S )( R U P E E S ) ( R U P E E S )( R U P E E S )( R U P E E S )( R U P E E S )( R U P E E S )Buildings
Gross Block 134,861,000 � 134,861,000Depreciation 2,198,234 2,198,234 4,396,468
Net Block 132,662,766 2,198,234 130,464,532
S C H E D U L E - 4S C H E D U L E - 4S C H E D U L E - 4S C H E D U L E - 4S C H E D U L E - 4 AS AT AS AT31st Mar.,00 31st Mar.,99
I N V E S T M E N T SI N V E S T M E N T SI N V E S T M E N T SI N V E S T M E N T SI N V E S T M E N T S (RUPEES) (RUPEES)LONG TERM INVESTMENTS(Unquoted fully paid up)
Units of Birla Income Plus of Birla MutualFund of Rs. 10 each� 4,849.661 Units of Plan A � 48,836� 338807.941 Units of Plan B � 5,220,000
INVESTMENT IN SUBSIDIARY COMPANYEquity Shares of Rajnidhi Finance Ltd.2,50,000 Shares of Rs. 10/- each 2,500,000 �
SHORT TERM INVESTMENT(Unquoted fully paid up)
7,50,638.298 Units of Birla Cash Plus of BirlaMutual Fund, of Rs. 10/- each � 8,820,000
Total 2,500,000 14,088,836
S C H E D U L E - 5S C H E D U L E - 5S C H E D U L E - 5S C H E D U L E - 5S C H E D U L E - 5C A S H & B A N K B A L A N C E SC A S H & B A N K B A L A N C E SC A S H & B A N K B A L A N C E SC A S H & B A N K B A L A N C E SC A S H & B A N K B A L A N C E S
Cash in hand 78 78Balance with Schedule Banksin Current Account 31,889 4,358,788
Total 31,967 4,358,866
S C H E D U L E - 7S C H E D U L E - 7S C H E D U L E - 7S C H E D U L E - 7S C H E D U L E - 7S IGNIF ICANT ACCOUNTING POLIC IES AND NOTES ON ACCOUNTS FOR THES IGNIF ICANT ACCOUNTING POLIC IES AND NOTES ON ACCOUNTS FOR THES IGNIF ICANT ACCOUNTING POLIC IES AND NOTES ON ACCOUNTS FOR THES IGNIF ICANT ACCOUNTING POLIC IES AND NOTES ON ACCOUNTS FOR THES IGNIF ICANT ACCOUNTING POLIC IES AND NOTES ON ACCOUNTS FOR THEY E A R E N D E D 3 1 S T M A R C H , 2 0 0 0 .Y E A R E N D E D 3 1 S T M A R C H , 2 0 0 0 .Y E A R E N D E D 3 1 S T M A R C H , 2 0 0 0 .Y E A R E N D E D 3 1 S T M A R C H , 2 0 0 0 .Y E A R E N D E D 3 1 S T M A R C H , 2 0 0 0 .(A) SIGNIFICANT ACCOUNTING POLICIES
(1) The financial statements are prepared under the historical cost convention. TheCompany follows the Mercantile System of accounting and recognises income andexpenditure on the accrual basis.
(2) Fixed Assets are stated at cost.(3) Depreciation on Fixed Assets is provided on Straight line Method at the rates and in
manner specified in schedule XIV to the Companies Act, 1956.(4) Long term Investments are Stated at Cost after deducting provision, if any, made for
dimunition in the value.(B) NOTES ON ACCOUNTS
(1) Information Pursuant to the provisions of Paragraphs �3� of Part II of the CompaniesAct, 1956.
Particulars Year Ended Opening Stock Purchases Sales Closing Stock31st March Numbers Amount Numbers Amount Numbers Amount Numbers Amount
Shares 2000 500 0.15 � � 500 0.33 � �1999 � � 500 0.15 � � 500 0.15
Debentures 2000 � � � � � � � �1999 � � 5500000 5747.55 5500000 5752.69 � �
Total 2000 500 0.15 � � 500 0.33 � �1999 � � 5500500 5747.70 5500000 5752.69 500 0.15
There is no other additional information pursuant to para 3, 4C, 4D, of part II of ScheduleVI of the Companies Act, 1956.
(2) Building includes cost of Debentures and Shares of a Company which entitles to anexclusive right of occupying and using certain office premises.
(3) The Company is financing carry forward transaction of The Stock Exchange, Mumbai,which is shown as Collateral Finance.
(4) The Balance Preliminary Expenses has been fully written off during the year.(5) Additional information required under part IV of schedule VI of the Companies Act,
1956 is as per Annexure 1.(6) �Special Reserve� has been created in terms of Section 45(IC) of Reserve Bank of India
Act, 1934.(7) Figures of previous year have been regrouped/rearranged wherever necessary.
As per our Report attachedFor KHIMJI KUNVERJI & CO.For KHIMJI KUNVERJI & CO.For KHIMJI KUNVERJI & CO.For KHIMJI KUNVERJI & CO.For KHIMJI KUNVERJI & CO.Chartered Accountants
SHIVJI K. VIKAMSEYSHIVJI K. VIKAMSEYSHIVJI K. VIKAMSEYSHIVJI K. VIKAMSEYSHIVJI K. VIKAMSEYPartnerMumbai, 15th April, 2000ANNEXURE IANNEXURE IANNEXURE IANNEXURE IANNEXURE IINFORMATION PURSUANT TO THE PROVISIONS OF PARTY-IV OF SCHEDULE VIINFORMATION PURSUANT TO THE PROVISIONS OF PARTY-IV OF SCHEDULE VIINFORMATION PURSUANT TO THE PROVISIONS OF PARTY-IV OF SCHEDULE VIINFORMATION PURSUANT TO THE PROVISIONS OF PARTY-IV OF SCHEDULE VIINFORMATION PURSUANT TO THE PROVISIONS OF PARTY-IV OF SCHEDULE VIOF THE COMPOF THE COMPOF THE COMPOF THE COMPOF THE COMPANIES ACTANIES ACTANIES ACTANIES ACTANIES ACT, 1956, 1956, 1956, 1956, 1956Balance Sheet Abstract and CompanyBalance Sheet Abstract and CompanyBalance Sheet Abstract and CompanyBalance Sheet Abstract and CompanyBalance Sheet Abstract and Company �s General Business P�s General Business P�s General Business P�s General Business P�s General Business ProfilerofilerofilerofilerofileI. REGISTRATION DETAILSREGISTRATION DETAILSREGISTRATION DETAILSREGISTRATION DETAILSREGISTRATION DETAILS
Registration No. : 04-22685 of 1994-95 State Code: 04Balance Sheet Date 31st March 2000
I I .I I .I I .I I .I I . CAPITAL RAISED DURING THE YEAR CAPITAL RAISED DURING THE YEAR CAPITAL RAISED DURING THE YEAR CAPITAL RAISED DURING THE YEAR CAPITAL RAISED DURING THE YEAR (Amount in Rs. Thousands)(Amount in Rs. Thousands)(Amount in Rs. Thousands)(Amount in Rs. Thousands)(Amount in Rs. Thousands)Public Issue : Nil Right Issue : NilBonus Issue : Nil Private Placement : Nil
I I I .I I I .I I I .I I I .I I I . POSITION OF MOBILISATION AND DEPLOYMENT OF FUNDSPOSITION OF MOBILISATION AND DEPLOYMENT OF FUNDSPOSITION OF MOBILISATION AND DEPLOYMENT OF FUNDSPOSITION OF MOBILISATION AND DEPLOYMENT OF FUNDSPOSITION OF MOBILISATION AND DEPLOYMENT OF FUNDS (Amount in(Amount in(Amount in(Amount in(Amount inRs. Thousands)Rs. Thousands)Rs. Thousands)Rs. Thousands)Rs. Thousands)
Total Liabilities 119520.33 Total Assets: 119520.33Sources of FundsPaid-up Capital : 110930.00 Reserves & Surplus: 8590.33Secured Loans: Nil Unsecured Loans: NilApplication of FundsNet Fixed Assets: 130464.53 Investments: 2500.00Net Current Assets: (13444.20) Misc. Expenditure: NilAccumulated Losses: Nil
IV. PERFORMANCE OF COMPANYPERFORMANCE OF COMPANYPERFORMANCE OF COMPANYPERFORMANCE OF COMPANYPERFORMANCE OF COMPANY (Amount in Rs. Thousands) (Amount in Rs. Thousands) (Amount in Rs. Thousands) (Amount in Rs. Thousands) (Amount in Rs. Thousands)Turnover/Gross Income: 27983.63 Total Expenditure: 19021.76Profit/(Loss) Before Tax: 8961.87 Profit/(Loss) After Tax: 5611.87EPS (in Rs.): 0.50 Dividend rate %: Nil
V. GENERIC NAMES OF THREE PRINCIPAL PRODUCTS/SERVICES OF COMPANYGENERIC NAMES OF THREE PRINCIPAL PRODUCTS/SERVICES OF COMPANYGENERIC NAMES OF THREE PRINCIPAL PRODUCTS/SERVICES OF COMPANYGENERIC NAMES OF THREE PRINCIPAL PRODUCTS/SERVICES OF COMPANYGENERIC NAMES OF THREE PRINCIPAL PRODUCTS/SERVICES OF COMPANY(as per monetary terms)(as per monetary terms)(as per monetary terms)(as per monetary terms)(as per monetary terms)
Item Code No.: N.A.Product Description: Investment, Finance and Property Rental Activities
As per our Report attachedFor KHIMJI KUNVERJI & CO.For KHIMJI KUNVERJI & CO.For KHIMJI KUNVERJI & CO.For KHIMJI KUNVERJI & CO.For KHIMJI KUNVERJI & CO.Chartered AccountantsSHIVJI K. VIKAMSEYSHIVJI K. VIKAMSEYSHIVJI K. VIKAMSEYSHIVJI K. VIKAMSEYSHIVJI K. VIKAMSEYPartnerMumbai, 15th April, 2000
ADESH GUPTAASHOK MALU
MANOJ KEDIADirectors
ADESH GUPTAASHOK MALU
MANOJ KEDIADirectors
S C H E D U L E - 6S C H E D U L E - 6S C H E D U L E - 6S C H E D U L E - 6S C H E D U L E - 6M I S C E L L A N E O U S E X P E N D I T U R EM I S C E L L A N E O U S E X P E N D I T U R EM I S C E L L A N E O U S E X P E N D I T U R EM I S C E L L A N E O U S E X P E N D I T U R EM I S C E L L A N E O U S E X P E N D I T U R E(To the extent not written off or adjusted)Preliminary Expenses 200,347 240,417Less: Written off during the year 200,347 40,070
Total � 200,347
Rs. in lacs
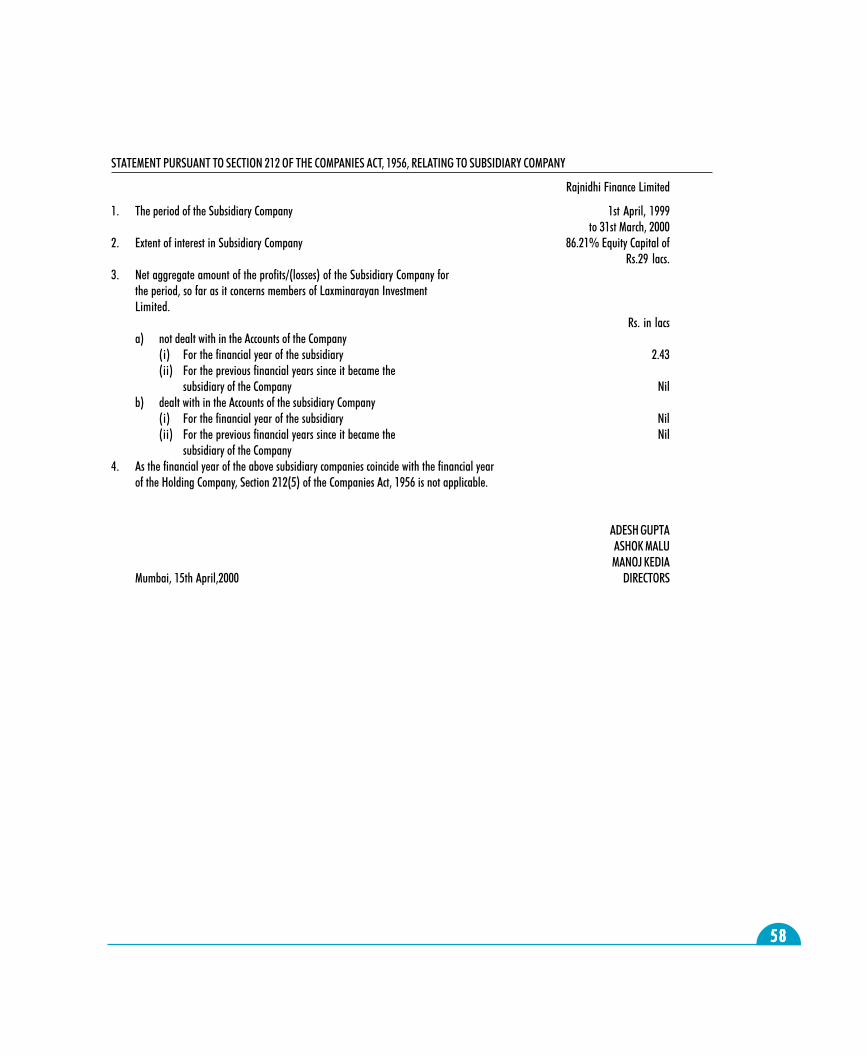
5858585858
STATEMENT PURSUANT TO SECTION 212 OF THE COMPANIES ACT, 1956, RELATING TO SUBSIDIARY COMPANY
Rajnidhi Finance Limited
1. The period of the Subsidiary Company 1st April, 1999to 31st March, 2000
2. Extent of interest in Subsidiary Company 86.21% Equity Capital ofRs.29 lacs.
3. Net aggregate amount of the profits/(losses) of the Subsidiary Company forthe period, so far as it concerns members of Laxminarayan InvestmentLimited.
Rs. in lacsa) not dealt with in the Accounts of the Company
(i) For the financial year of the subsidiary 2.43(ii) For the previous financial years since it became the
subsidiary of the Company Nilb) dealt with in the Accounts of the subsidiary Company
(i) For the financial year of the subsidiary Nil(ii) For the previous financial years since it became the Nil
subsidiary of the Company4. As the financial year of the above subsidiary companies coincide with the financial year
of the Holding Company, Section 212(5) of the Companies Act, 1956 is not applicable.
ADESH GUPTAASHOK MALUMANOJ KEDIA
Mumbai, 15th April,2000 DIRECTORS
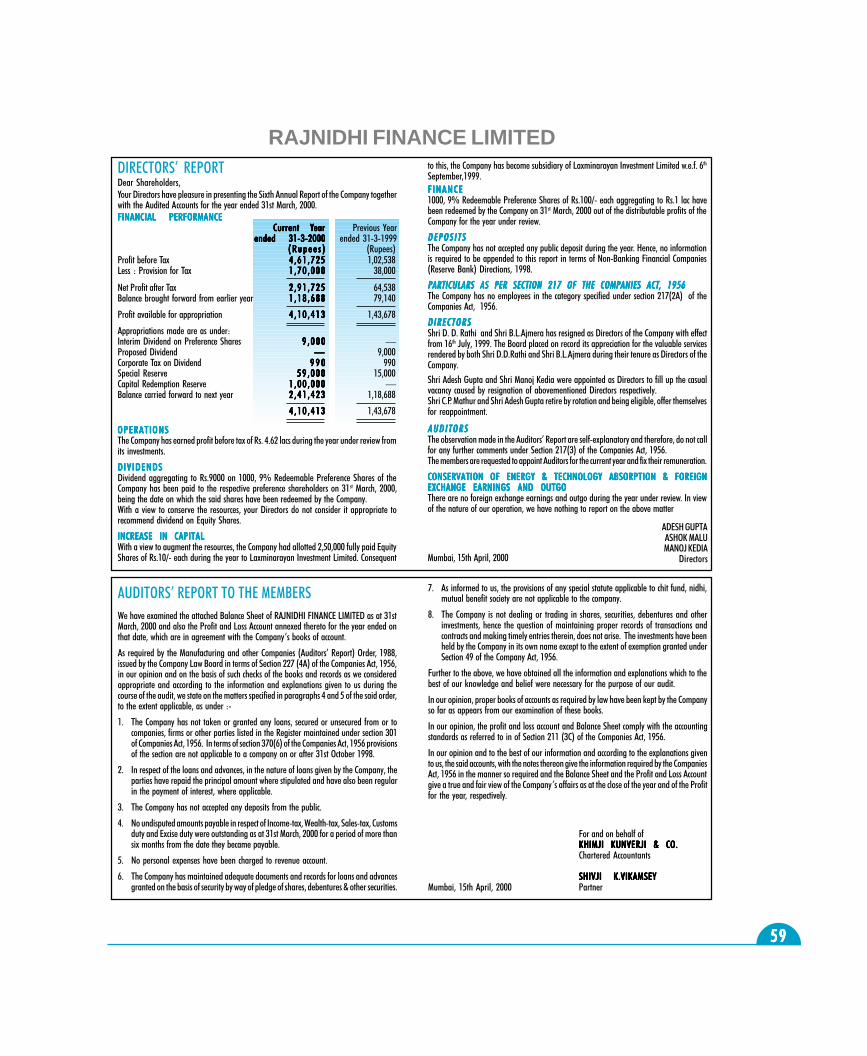
5959595959
RAJNIDHI FINANCE LIMITED
AUDITORS� REPORT TO THE MEMBERSWe have examined the attached Balance Sheet of RAJNIDHI FINANCE LIMITED as at 31stMarch, 2000 and also the Profit and Loss Account annexed thereto for the year ended onthat date, which are in agreement with the Company�s books of account.
As required by the Manufacturing and other Companies (Auditors� Report) Order, 1988,issued by the Company Law Board in terms of Section 227 (4A) of the Companies Act, 1956,in our opinion and on the basis of such checks of the books and records as we consideredappropriate and according to the information and explanations given to us during thecourse of the audit, we state on the matters specified in paragraphs 4 and 5 of the said order,to the extent applicable, as under :-
1. The Company has not taken or granted any loans, secured or unsecured from or tocompanies, firms or other parties listed in the Register maintained under section 301of Companies Act, 1956. In terms of section 370(6) of the Companies Act, 1956 provisionsof the section are not applicable to a company on or after 31st October 1998.
2. In respect of the loans and advances, in the nature of loans given by the Company, theparties have repaid the principal amount where stipulated and have also been regularin the payment of interest, where applicable.
3. The Company has not accepted any deposits from the public.
4. No undisputed amounts payable in respect of Income-tax, Wealth-tax, Sales-tax, Customsduty and Excise duty were outstanding as at 31st March, 2000 for a period of more thansix months from the date they became payable.
5. No personal expenses have been charged to revenue account.
6. The Company has maintained adequate documents and records for loans and advancesgranted on the basis of security by way of pledge of shares, debentures & other securities.
7. As informed to us, the provisions of any special statute applicable to chit fund, nidhi,mutual benefit society are not applicable to the company.
8. The Company is not dealing or trading in shares, securities, debentures and otherinvestments, hence the question of maintaining proper records of transactions andcontracts and making timely entries therein, does not arise. The investments have beenheld by the Company in its own name except to the extent of exemption granted underSection 49 of the Company Act, 1956.
Further to the above, we have obtained all the information and explanations which to thebest of our knowledge and belief were necessary for the purpose of our audit.
In our opinion, proper books of accounts as required by law have been kept by the Companyso far as appears from our examination of these books.
In our opinion, the profit and loss account and Balance Sheet comply with the accountingstandards as referred to in of Section 211 (3C) of the Companies Act, 1956.
In our opinion and to the best of our information and according to the explanations givento us, the said accounts, with the notes thereon give the information required by the CompaniesAct, 1956 in the manner so required and the Balance Sheet and the Profit and Loss Accountgive a true and fair view of the Company�s affairs as at the close of the year and of the Profitfor the year, respectively.
For and on behalf ofKHIMJI KUNVERJI & CO.KHIMJI KUNVERJI & CO.KHIMJI KUNVERJI & CO.KHIMJI KUNVERJI & CO.KHIMJI KUNVERJI & CO.Chartered Accountants
SHIVJI K.VIKAMSEYSHIVJI K.VIKAMSEYSHIVJI K.VIKAMSEYSHIVJI K.VIKAMSEYSHIVJI K.VIKAMSEYMumbai, 15th April, 2000 Partner
DIRECTORS� REPORTDear Shareholders,Your Directors have pleasure in presenting the Sixth Annual Report of the Company togetherwith the Audited Accounts for the year ended 31st March, 2000.FINANCIAL PERFORMANCEFINANCIAL PERFORMANCEFINANCIAL PERFORMANCEFINANCIAL PERFORMANCEFINANCIAL PERFORMANCE
Current YCurrent YCurrent YCurrent YCurrent Yeeeeeararararar Previous Yearended 31-3-2000ended 31-3-2000ended 31-3-2000ended 31-3-2000ended 31-3-2000 ended 31-3-1999
( R u p e e s( R u p e e s( R u p e e s( R u p e e s( R u p e e s ))))) (Rupees)Profit before Tax 4 , 6 1 , 7 2 54 , 6 1 , 7 2 54 , 6 1 , 7 2 54 , 6 1 , 7 2 54 , 6 1 , 7 2 5 1,02,538Less : Provision for Tax 1 , 7 0 , 0 0 01 , 7 0 , 0 0 01 , 7 0 , 0 0 01 , 7 0 , 0 0 01 , 7 0 , 0 0 0 38,000
Net Profit after Tax 2 , 9 1 , 7 2 52 , 9 1 , 7 2 52 , 9 1 , 7 2 52 , 9 1 , 7 2 52 , 9 1 , 7 2 5 64,538Balance brought forward from earlier year 1 , 1 8 , 6 8 81 , 1 8 , 6 8 81 , 1 8 , 6 8 81 , 1 8 , 6 8 81 , 1 8 , 6 8 8 79,140
Profit available for appropriation 4 , 1 0 , 4 1 34 , 1 0 , 4 1 34 , 1 0 , 4 1 34 , 1 0 , 4 1 34 , 1 0 , 4 1 3 1,43,678
Appropriations made are as under:Interim Dividend on Preference Shares 9 , 0 0 09 , 0 0 09 , 0 0 09 , 0 0 09 , 0 0 0 �Proposed Dividend ����� 9,000Corporate Tax on Dividend 9 9 09 9 09 9 09 9 09 9 0 990Special Reserve 5 9 , 0 0 05 9 , 0 0 05 9 , 0 0 05 9 , 0 0 05 9 , 0 0 0 15,000Capital Redemption Reserve 1 , 0 0 , 0 0 01 , 0 0 , 0 0 01 , 0 0 , 0 0 01 , 0 0 , 0 0 01 , 0 0 , 0 0 0 �Balance carried forward to next year 2 , 4 1 , 4 2 32 , 4 1 , 4 2 32 , 4 1 , 4 2 32 , 4 1 , 4 2 32 , 4 1 , 4 2 3 1,18,688
4 , 1 0 , 4 1 34 , 1 0 , 4 1 34 , 1 0 , 4 1 34 , 1 0 , 4 1 34 , 1 0 , 4 1 3 1,43,678
OPERATIOOPERATIOOPERATIOOPERATIOOPERATIO NSNSNSNSNSThe Company has earned profit before tax of Rs. 4.62 lacs during the year under review fromits investments.
DIVIDENDSDIVIDENDSDIVIDENDSDIVIDENDSDIVIDENDSDividend aggregating to Rs.9000 on 1000, 9% Redeemable Preference Shares of theCompany has been paid to the respective preference shareholders on 31st March, 2000,being the date on which the said shares have been redeemed by the Company.With a view to conserve the resources, your Directors do not consider it appropriate torecommend dividend on Equity Shares.
INCREASE IN CAPITALINCREASE IN CAPITALINCREASE IN CAPITALINCREASE IN CAPITALINCREASE IN CAPITALWith a view to augment the resources, the Company had allotted 2,50,000 fully paid EquityShares of Rs.10/- each during the year to Laxminarayan Investment Limited. Consequent
to this, the Company has become subsidiary of Laxminarayan Investment Limited w.e.f. 6th
September,1999.F INANCEFINANCEFINANCEFINANCEFINANCE1000, 9% Redeemable Preference Shares of Rs.100/- each aggregating to Rs.1 lac havebeen redeemed by the Company on 31st March, 2000 out of the distributable profits of theCompany for the year under review.
DEPOS I TSDEPOS I TSDEPOS I TSDEPOS I TSDEPOS I TSThe Company has not accepted any public deposit during the year. Hence, no informationis required to be appended to this report in terms of Non-Banking Financial Companies(Reserve Bank) Directions, 1998.
PARTICULARS AS PER SECTION 217 OF THE COMPANIES ACT, 1956PARTICULARS AS PER SECTION 217 OF THE COMPANIES ACT, 1956PARTICULARS AS PER SECTION 217 OF THE COMPANIES ACT, 1956PARTICULARS AS PER SECTION 217 OF THE COMPANIES ACT, 1956PARTICULARS AS PER SECTION 217 OF THE COMPANIES ACT, 1956The Company has no employees in the category specified under section 217(2A) of theCompanies Act, 1956.
DIRECTORSDIRECTORSDIRECTORSDIRECTORSDIRECTORSShri D. D. Rathi and Shri B.L.Ajmera has resigned as Directors of the Company with effectfrom 16th July, 1999. The Board placed on record its appreciation for the valuable servicesrendered by both Shri D.D.Rathi and Shri B.L.Ajmera during their tenure as Directors of theCompany.Shri Adesh Gupta and Shri Manoj Kedia were appointed as Directors to fill up the casualvacancy caused by resignation of abovementioned Directors respectively.Shri C.P. Mathur and Shri Adesh Gupta retire by rotation and being eligible, offer themselvesfor reappointment.
AUDITORSAUDITORSAUDITORSAUDITORSAUDITORSThe observation made in the Auditors� Report are self-explanatory and therefore, do not callfor any further comments under Section 217(3) of the Companies Act, 1956.The members are requested to appoint Auditors for the current year and fix their remuneration.
CONSERVATION OF ENERGY & TECHNOLOGY ABSORPTION & FOREIGNCONSERVATION OF ENERGY & TECHNOLOGY ABSORPTION & FOREIGNCONSERVATION OF ENERGY & TECHNOLOGY ABSORPTION & FOREIGNCONSERVATION OF ENERGY & TECHNOLOGY ABSORPTION & FOREIGNCONSERVATION OF ENERGY & TECHNOLOGY ABSORPTION & FOREIGNEXCHANGE EARNINGS AND OUTGOEXCHANGE EARNINGS AND OUTGOEXCHANGE EARNINGS AND OUTGOEXCHANGE EARNINGS AND OUTGOEXCHANGE EARNINGS AND OUTGOThere are no foreign exchange earnings and outgo during the year under review. In viewof the nature of our operation, we have nothing to report on the above matter
Mumbai, 15th April, 2000
ADESH GUPTAASHOK MALUMANOJ KEDIA
Directors
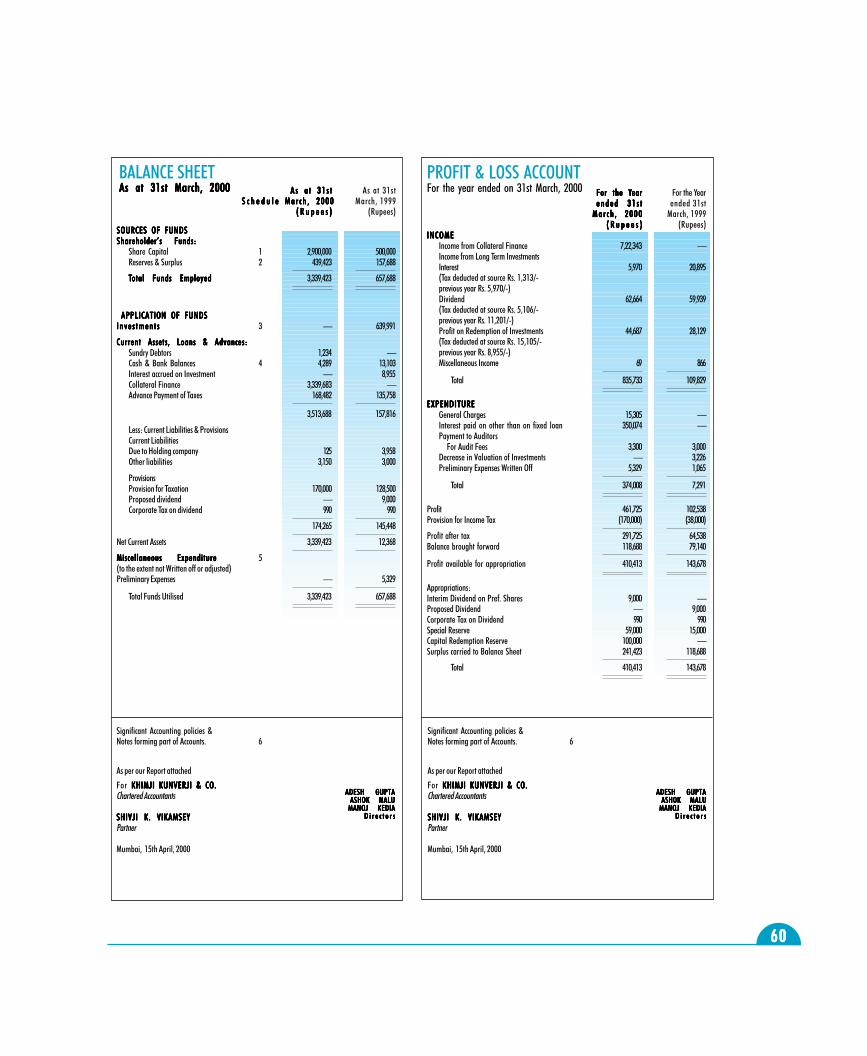
6060606060
A s a t 3 1 s t A s a t 3 1 s t A s a t 3 1 s t A s a t 3 1 s t A s a t 3 1 s t As at 31stS c h e d u l eS c h e d u l eS c h e d u l eS c h e d u l eS c h e d u l e M a r c h , 2 0 0 0 M a r c h , 2 0 0 0 M a r c h , 2 0 0 0 M a r c h , 2 0 0 0 M a r c h , 2 0 0 0 March, 1999
( R u p e e s )( R u p e e s )( R u p e e s )( R u p e e s )( R u p e e s ) (Rupees)
SOURCES OF FUNDSSOURCES OF FUNDSSOURCES OF FUNDSSOURCES OF FUNDSSOURCES OF FUNDSShareholder�s Funds:Shareholder�s Funds:Shareholder�s Funds:Shareholder�s Funds:Shareholder�s Funds:
Share Capital 1 2,900,000 500,000Reserves & Surplus 2 439,423 157,688
TTTTTotal Fotal Fotal Fotal Fotal Funds Employedunds Employedunds Employedunds Employedunds Employed 3,339,423 657,688
APPLICATION OF FUNDSAPPLICATION OF FUNDSAPPLICATION OF FUNDSAPPLICATION OF FUNDSAPPLICATION OF FUNDSInves tment sInves tment sInves tment sInves tment sInves tment s 3 � 639,991
Current Assets, Loans & Advances:Current Assets, Loans & Advances:Current Assets, Loans & Advances:Current Assets, Loans & Advances:Current Assets, Loans & Advances:Sundry Debtors 1,234 �Cash & Bank Balances 4 4,289 13,103Interest accrued on Investment � 8,955Collateral Finance 3,339,683 �Advance Payment of Taxes 168,482 135,758
3,513,688 157,816
Less: Current Liabilities & ProvisionsCurrent LiabilitiesDue to Holding company 125 3,958Other liabilities 3,150 3,000
ProvisionsProvision for Taxation 170,000 128,500Proposed dividend � 9,000Corporate Tax on dividend 990 990
174,265 145,448
Net Current Assets 3,339,423 12,368
Miscellaneous ExpenditureMiscellaneous ExpenditureMiscellaneous ExpenditureMiscellaneous ExpenditureMiscellaneous Expenditure 5(to the extent not Written off or adjusted)Preliminary Expenses � 5,329
Total Funds Utilised 3,339,423 657,688
BALANCE SHEETAs at 31st March, 2000As at 31st March, 2000As at 31st March, 2000As at 31st March, 2000As at 31st March, 2000 For the YFor the YFor the YFor the YFor the Yearearearearear For the Year
e n d e d 3 1 s te n d e d 3 1 s te n d e d 3 1 s te n d e d 3 1 s te n d e d 3 1 s t ended 31stM a r c h , 2 0 0 0M a r c h , 2 0 0 0M a r c h , 2 0 0 0M a r c h , 2 0 0 0M a r c h , 2 0 0 0 March, 1999
( R u p e e s )( R u p e e s )( R u p e e s )( R u p e e s )( R u p e e s ) (Rupees)INCOMEINCOMEINCOMEINCOMEINCOME
Income from Collateral Finance 7,22,343 �Income from Long Term InvestmentsInterest 5,970 20,895(Tax deducted at source Rs. 1,313/-previous year Rs. 5,970/-)Dividend 62,664 59,939(Tax deducted at source Rs. 5,106/-previous year Rs. 11,201/-)Profit on Redemption of Investments 44,687 28,129(Tax deducted at source Rs. 15,105/-previous year Rs. 8,955/-)Miscellaneous Income 69 866
Total 835,733 109,829
EXPENDITUREEXPENDITUREEXPENDITUREEXPENDITUREEXPENDITUREGeneral Charges 15,305 �Interest paid on other than on fixed loan 350,074 �Payment to Auditors
For Audit Fees 3,300 3,000Decrease in Valuation of Investments � 3,226Preliminary Expenses Written Off 5,329 1,065
Total 374,008 7,291
Profit 461,725 102,538Provision for Income Tax (170,000) (38,000)
Profit after tax 291,725 64,538Balance brought forward 118,688 79,140
Profit available for appropriation 410,413 143,678
Appropriations:Interim Dividend on Pref. Shares 9,000 �Proposed Dividend � 9,000Corporate Tax on Dividend 990 990Special Reserve 59,000 15,000Capital Redemption Reserve 100,000 �Surplus carried to Balance Sheet 241,423 118,688
Total 410,413 143,678
PROFIT & LOSS ACCOUNTFor the year ended on 31st March, 2000
Significant Accounting policies &Notes forming part of Accounts. 6
As per our Report attached
For KHIMJI KUNVERJI & CO. KHIMJI KUNVERJI & CO. KHIMJI KUNVERJI & CO. KHIMJI KUNVERJI & CO. KHIMJI KUNVERJI & CO.Chartered Accountants
SHIVJI K. VIKAMSEYSHIVJI K. VIKAMSEYSHIVJI K. VIKAMSEYSHIVJI K. VIKAMSEYSHIVJI K. VIKAMSEYPartner
Mumbai, 15th April, 2000
ADESH GUPTAADESH GUPTAADESH GUPTAADESH GUPTAADESH GUPTAASHOK MALUASHOK MALUASHOK MALUASHOK MALUASHOK MALU
MANOJ KEDIAMANOJ KEDIAMANOJ KEDIAMANOJ KEDIAMANOJ KEDIAD i r e c t o r sD i r e c t o r sD i r e c t o r sD i r e c t o r sD i r e c t o r s
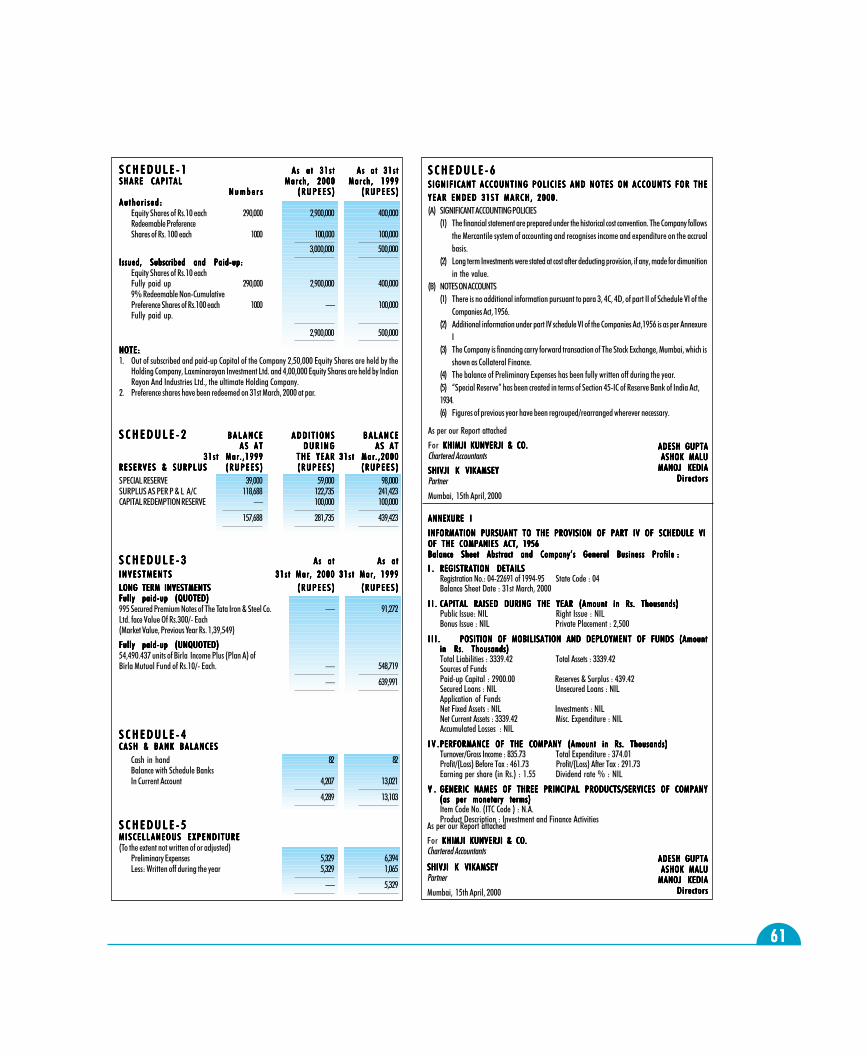
6161616161
S C H E D U L E - 3S C H E D U L E - 3S C H E D U L E - 3S C H E D U L E - 3S C H E D U L E - 3 A s a tA s a tA s a tA s a tA s a t A s a tA s a tA s a tA s a tA s a tI N V E S T M E N T SI N V E S T M E N T SI N V E S T M E N T SI N V E S T M E N T SI N V E S T M E N T S 3 1 s t M a r3 1 s t M a r3 1 s t M a r3 1 s t M a r3 1 s t M a r, 2 0 0 0, 2 0 0 0, 2 0 0 0, 2 0 0 0, 2 0 0 0 3 1 s t M a r3 1 s t M a r3 1 s t M a r3 1 s t M a r3 1 s t M a r, 1 9 9 9, 1 9 9 9, 1 9 9 9, 1 9 9 9, 1 9 9 9LONG TERM INVESTMENTSLONG TERM INVESTMENTSLONG TERM INVESTMENTSLONG TERM INVESTMENTSLONG TERM INVESTMENTS ( R U P E E S )( R U P E E S )( R U P E E S )( R U P E E S )( R U P E E S ) ( R U P E E S )( R U P E E S )( R U P E E S )( R U P E E S )( R U P E E S )Fully paid-up (QUOTED)Fully paid-up (QUOTED)Fully paid-up (QUOTED)Fully paid-up (QUOTED)Fully paid-up (QUOTED)995 Secured Premium Notes of The Tata Iron & Steel Co. � 91,272Ltd. face Value Of Rs.300/- Each(Market Value, Previous Year Rs. 1,39,549)
Fully paid-up (UNQUOTED)Fully paid-up (UNQUOTED)Fully paid-up (UNQUOTED)Fully paid-up (UNQUOTED)Fully paid-up (UNQUOTED)54,490.437 units of Birla Income Plus (Plan A) ofBirla Mutual Fund of Rs.10/- Each. � 548,719
� 639,991
S C H E D U L E - 4S C H E D U L E - 4S C H E D U L E - 4S C H E D U L E - 4S C H E D U L E - 4C A S H & B A N K B A L A N C E SC A S H & B A N K B A L A N C E SC A S H & B A N K B A L A N C E SC A S H & B A N K B A L A N C E SC A S H & B A N K B A L A N C E S
Cash in hand 82 82Balance with Schedule BanksIn Current Account 4,207 13,021
4,289 13,103
S C H E D U L E - 5S C H E D U L E - 5S C H E D U L E - 5S C H E D U L E - 5S C H E D U L E - 5M I S C E L L A N E O U S E X P E N D I T U R EM I S C E L L A N E O U S E X P E N D I T U R EM I S C E L L A N E O U S E X P E N D I T U R EM I S C E L L A N E O U S E X P E N D I T U R EM I S C E L L A N E O U S E X P E N D I T U R E(To the extent not written of or adjusted)
Preliminary Expenses 5,329 6,394Less: Written off during the year 5,329 1,065
� 5,329
S C H E D U L E - 6S C H E D U L E - 6S C H E D U L E - 6S C H E D U L E - 6S C H E D U L E - 6S IGNIF ICANT ACCOUNTING POLIC IES AND NOTES ON ACCOUNTS FOR THES IGNIF ICANT ACCOUNTING POLIC IES AND NOTES ON ACCOUNTS FOR THES IGNIF ICANT ACCOUNTING POLIC IES AND NOTES ON ACCOUNTS FOR THES IGNIF ICANT ACCOUNTING POLIC IES AND NOTES ON ACCOUNTS FOR THES IGNIF ICANT ACCOUNTING POLIC IES AND NOTES ON ACCOUNTS FOR THEY E A R E N D E D 3 1 S T M A R C H , 2 0 0 0 .Y E A R E N D E D 3 1 S T M A R C H , 2 0 0 0 .Y E A R E N D E D 3 1 S T M A R C H , 2 0 0 0 .Y E A R E N D E D 3 1 S T M A R C H , 2 0 0 0 .Y E A R E N D E D 3 1 S T M A R C H , 2 0 0 0 .(A) SIGNIFICANT ACCOUNTING POLICIES
(1) The financial statement are prepared under the historical cost convention. The Company followsthe Mercantile system of accounting and recognises income and expenditure on the accrualbasis.
(2) Long term Investments were stated at cost after deducting provision, if any, made for dimunitionin the value.
(B) NOTES ON ACCOUNTS(1) There is no additional information pursuant to para 3, 4C, 4D, of part II of Schedule VI of the
Companies Act, 1956.(2) Additional information under part IV schedule VI of the Companies Act,1956 is as per Annexure
I(3) The Company is financing carry forward transaction of The Stock Exchange, Mumbai, which is
shown as Collateral Finance.(4) The balance of Preliminary Expenses has been fully written off during the year.(5) �Special Reserve� has been created in terms of Section 45-IC of Reserve Bank of India Act,1934.(6) Figures of previous year have been regrouped/rearranged wherever necessary.
As per our Report attached
For KHIMJI KUNVERJI & CO. KHIMJI KUNVERJI & CO. KHIMJI KUNVERJI & CO. KHIMJI KUNVERJI & CO. KHIMJI KUNVERJI & CO.Chartered Accountants
SHIVJI K VIKAMSEYSHIVJI K VIKAMSEYSHIVJI K VIKAMSEYSHIVJI K VIKAMSEYSHIVJI K VIKAMSEYPartner
Mumbai, 15th April, 2000
ADESH GUPTAADESH GUPTAADESH GUPTAADESH GUPTAADESH GUPTAASHOK MALUASHOK MALUASHOK MALUASHOK MALUASHOK MALU
MANOJ KEDIAMANOJ KEDIAMANOJ KEDIAMANOJ KEDIAMANOJ KEDIADirectorsDirectorsDirectorsDirectorsDirectors
S C H E D U L E - 1S C H E D U L E - 1S C H E D U L E - 1S C H E D U L E - 1S C H E D U L E - 1 A s a t 3 1 s tA s a t 3 1 s tA s a t 3 1 s tA s a t 3 1 s tA s a t 3 1 s t A s a t 3 1 s t A s a t 3 1 s t A s a t 3 1 s t A s a t 3 1 s t A s a t 3 1 s tS H A R E C A P I T A LS H A R E C A P I T A LS H A R E C A P I T A LS H A R E C A P I T A LS H A R E C A P I T A L M a r c h , 2 0 0 0M a r c h , 2 0 0 0M a r c h , 2 0 0 0M a r c h , 2 0 0 0M a r c h , 2 0 0 0 M a r c h , 1 9 9 9M a r c h , 1 9 9 9M a r c h , 1 9 9 9M a r c h , 1 9 9 9M a r c h , 1 9 9 9
N u m b e r sN u m b e r sN u m b e r sN u m b e r sN u m b e r s ( R U P E E S )( R U P E E S )( R U P E E S )( R U P E E S )( R U P E E S ) ( R U P E E S )( R U P E E S )( R U P E E S )( R U P E E S )( R U P E E S )A u t h o r i s e d :A u t h o r i s e d :A u t h o r i s e d :A u t h o r i s e d :A u t h o r i s e d :
Equity Shares of Rs.10 each 290,000 2,900,000 400,000Redeemable PreferenceShares of Rs. 100 each 1000 100,000 100,000
3,000,000 500,000Issued, Subscribed and Paid-up:Issued, Subscribed and Paid-up:Issued, Subscribed and Paid-up:Issued, Subscribed and Paid-up:Issued, Subscribed and Paid-up:
Equity Shares of Rs.10 eachFully paid up 290,000 2,900,000 400,0009% Redeemable Non-CumulativePreference Shares of Rs.100 each 1000 � 100,000Fully paid up.
2,900,000 500,000
NOTE:NOTE:NOTE:NOTE:NOTE:1. Out of subscribed and paid-up Capital of the Company 2,50,000 Equity Shares are held by the
Holding Company, Laxminarayan Investment Ltd. and 4,00,000 Equity Shares are held by IndianRayon And Industries Ltd., the ultimate Holding Company.
2. Preference shares have been redeemed on 31st March, 2000 at par.
ANNEXURE IANNEXURE IANNEXURE IANNEXURE IANNEXURE I
INFORMATION PURSUANT TO THE PROVISION OF PART IV OF SCHEDULE VIINFORMATION PURSUANT TO THE PROVISION OF PART IV OF SCHEDULE VIINFORMATION PURSUANT TO THE PROVISION OF PART IV OF SCHEDULE VIINFORMATION PURSUANT TO THE PROVISION OF PART IV OF SCHEDULE VIINFORMATION PURSUANT TO THE PROVISION OF PART IV OF SCHEDULE VIOF THE COMPANIES ACT, 1956OF THE COMPANIES ACT, 1956OF THE COMPANIES ACT, 1956OF THE COMPANIES ACT, 1956OF THE COMPANIES ACT, 1956BBBBBalance Sheet Abstract and Company�s General Business Profilealance Sheet Abstract and Company�s General Business Profilealance Sheet Abstract and Company�s General Business Profilealance Sheet Abstract and Company�s General Business Profilealance Sheet Abstract and Company�s General Business Profile :::::
I .I .I .I .I . REGISTRATION DETAILSREGISTRATION DETAILSREGISTRATION DETAILSREGISTRATION DETAILSREGISTRATION DETAILSRegistration No.: 04-22691 of 1994-95 State Code : 04Balance Sheet Date : 31st March, 2000
I I .I I .I I .I I .I I . CAPITAL RAISED DURING THE YEAR CAPITAL RAISED DURING THE YEAR CAPITAL RAISED DURING THE YEAR CAPITAL RAISED DURING THE YEAR CAPITAL RAISED DURING THE YEAR (Amount in Rs. Thousands)(Amount in Rs. Thousands)(Amount in Rs. Thousands)(Amount in Rs. Thousands)(Amount in Rs. Thousands)Public Issue: NIL Right Issue : NILBonus Issue : NIL Private Placement : 2,500
I I I .I I I .I I I .I I I .I I I . POSITION OF MOBILISATION AND DEPLOYMENT OF FUNDS (AmountPOSITION OF MOBILISATION AND DEPLOYMENT OF FUNDS (AmountPOSITION OF MOBILISATION AND DEPLOYMENT OF FUNDS (AmountPOSITION OF MOBILISATION AND DEPLOYMENT OF FUNDS (AmountPOSITION OF MOBILISATION AND DEPLOYMENT OF FUNDS (Amountin Rs. Thousands)in Rs. Thousands)in Rs. Thousands)in Rs. Thousands)in Rs. Thousands)Total Liabilities : 3339.42 Total Assets : 3339.42Sources of FundsPaid-up Capital : 2900.00 Reserves & Surplus : 439.42Secured Loans : NIL Unsecured Loans : NILApplication of FundsNet Fixed Assets : NIL Investments : NILNet Current Assets : 3339.42 Misc. Expenditure : NILAccumulated Losses : NIL
I V .I V .I V .I V .I V . PERFORMANCE OF THE COMPANYPERFORMANCE OF THE COMPANYPERFORMANCE OF THE COMPANYPERFORMANCE OF THE COMPANYPERFORMANCE OF THE COMPANY (Amount in Rs. Thousands) (Amount in Rs. Thousands) (Amount in Rs. Thousands) (Amount in Rs. Thousands) (Amount in Rs. Thousands)Turnover/Gross Income : 835.73 Total Expenditure : 374.01Profit/(Loss) Before Tax : 461.73 Profit/(Loss) After Tax : 291.73Earning per share (in Rs.) : 1.55 Dividend rate % : NIL
V .V .V .V .V . GENERIC NAMES OF THREE PRINCIPAL PRODUCTS/SERVICES OF COMPANYGENERIC NAMES OF THREE PRINCIPAL PRODUCTS/SERVICES OF COMPANYGENERIC NAMES OF THREE PRINCIPAL PRODUCTS/SERVICES OF COMPANYGENERIC NAMES OF THREE PRINCIPAL PRODUCTS/SERVICES OF COMPANYGENERIC NAMES OF THREE PRINCIPAL PRODUCTS/SERVICES OF COMPANY(as per monetary terms)(as per monetary terms)(as per monetary terms)(as per monetary terms)(as per monetary terms)Item Code No. (ITC Code ) : N.A.Product Description : Investment and Finance Activities
ADESH GUPTAADESH GUPTAADESH GUPTAADESH GUPTAADESH GUPTAASHOK MALUASHOK MALUASHOK MALUASHOK MALUASHOK MALU
MANOJ KEDIAMANOJ KEDIAMANOJ KEDIAMANOJ KEDIAMANOJ KEDIADirectorsDirectorsDirectorsDirectorsDirectors
S C H E D U L E - 2S C H E D U L E - 2S C H E D U L E - 2S C H E D U L E - 2S C H E D U L E - 2 B A L A N C EB A L A N C EB A L A N C EB A L A N C EB A L A N C E A D D I T I O N SA D D I T I O N SA D D I T I O N SA D D I T I O N SA D D I T I O N S B A L A N C EB A L A N C EB A L A N C EB A L A N C EB A L A N C EA S A TA S A TA S A TA S A TA S A T D U R I N GD U R I N GD U R I N GD U R I N GD U R I N G A S A TA S A TA S A TA S A TA S A T
3 1 s t M a r3 1 s t M a r3 1 s t M a r3 1 s t M a r3 1 s t M a r. , 1 9 9 9. , 1 9 9 9. , 1 9 9 9. , 1 9 9 9. , 1 9 9 9 T H E Y E A RT H E Y E A RT H E Y E A RT H E Y E A RT H E Y E A R 3 1 s t M a r3 1 s t M a r3 1 s t M a r3 1 s t M a r3 1 s t M a r. , 2 0 0 0. , 2 0 0 0. , 2 0 0 0. , 2 0 0 0. , 2 0 0 0R E S E R V E S & S U R P L U SR E S E R V E S & S U R P L U SR E S E R V E S & S U R P L U SR E S E R V E S & S U R P L U SR E S E R V E S & S U R P L U S ( R U P E E S )( R U P E E S )( R U P E E S )( R U P E E S )( R U P E E S ) ( R U P E E S )( R U P E E S )( R U P E E S )( R U P E E S )( R U P E E S ) ( R U P E E S )( R U P E E S )( R U P E E S )( R U P E E S )( R U P E E S )SPECIAL RESERVE 39,000 59,000 98,000SURPLUS AS PER P & L A/C 118,688 122,735 241,423CAPITAL REDEMPTION RESERVE � 100,000 100,000
157,688 281,735 439,423
As per our Report attached
For KHIMJI KUNVERJI & CO. KHIMJI KUNVERJI & CO. KHIMJI KUNVERJI & CO. KHIMJI KUNVERJI & CO. KHIMJI KUNVERJI & CO.Chartered Accountants
SHIVJI K VIKAMSEYSHIVJI K VIKAMSEYSHIVJI K VIKAMSEYSHIVJI K VIKAMSEYSHIVJI K VIKAMSEYPartner
Mumbai, 15th April, 2000
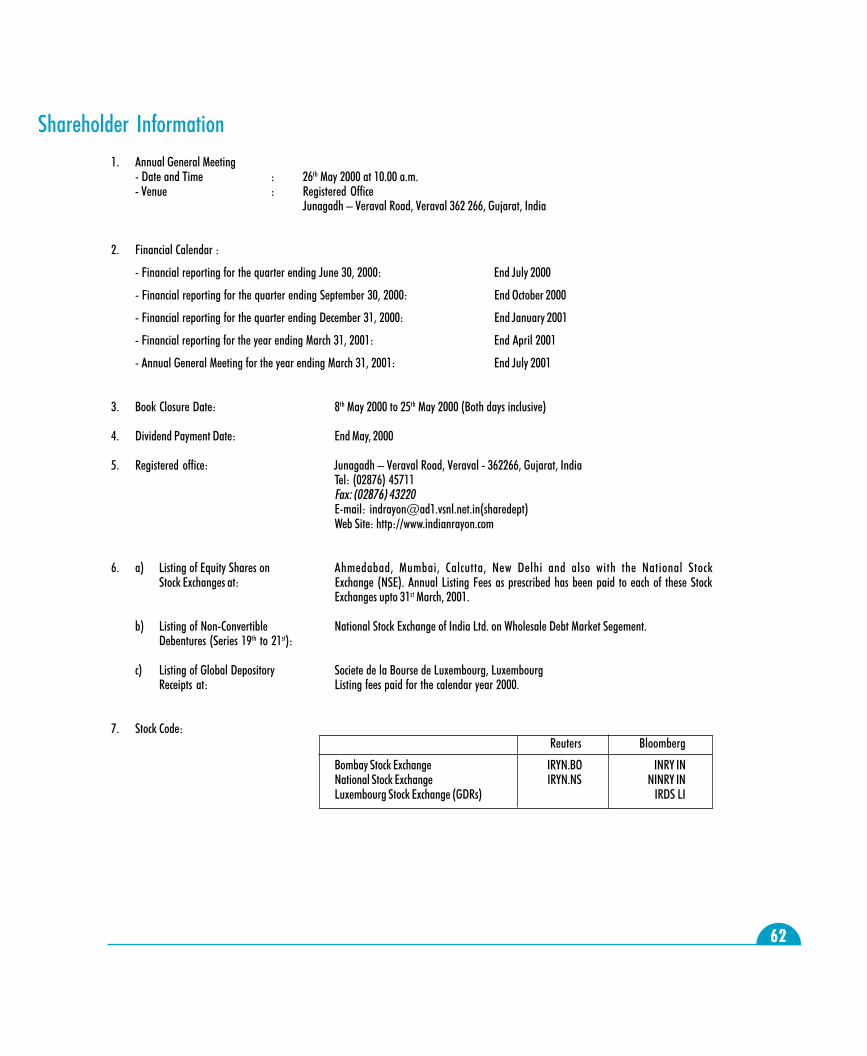
6262626262
1. Annual General Meeting- Date and Time : 26th May 2000 at 10.00 a.m.- Venue : Registered Office
Junagadh � Veraval Road, Veraval 362 266, Gujarat, India
2. Financial Calendar :
- Financial reporting for the quarter ending June 30, 2000: End July 2000
- Financial reporting for the quarter ending September 30, 2000: End October 2000
- Financial reporting for the quarter ending December 31, 2000: End January 2001
- Financial reporting for the year ending March 31, 2001: End April 2001
- Annual General Meeting for the year ending March 31, 2001: End July 2001
3. Book Closure Date: 8th May 2000 to 25th May 2000 (Both days inclusive)
4. Dividend Payment Date: End May, 2000
5. Registered office: Junagadh � Veraval Road, Veraval - 362266, Gujarat, IndiaTel: (02876) 45711Fax: (02876) 43220E-mail: [email protected](sharedept)Web Site: http://www.indianrayon.com
6. a) Listing of Equity Shares on Ahmedabad, Mumbai, Calcutta, New Delhi and also with the National StockStock Exchanges at: Exchange (NSE). Annual Listing Fees as prescribed has been paid to each of these Stock
Exchanges upto 31st March, 2001.
b) Listing of Non-Convertible National Stock Exchange of India Ltd. on Wholesale Debt Market Segement.Debentures (Series 19th to 21st):
c) Listing of Global Depository Societe de la Bourse de Luxembourg, LuxembourgReceipts at: Listing fees paid for the calendar year 2000.
7. Stock Code:Reuters Bloomberg
Bombay Stock Exchange IRYN.BO INRY INNational Stock Exchange IRYN.NS NINRY INLuxembourg Stock Exchange (GDRs) IRDS LI
Shareholder Information
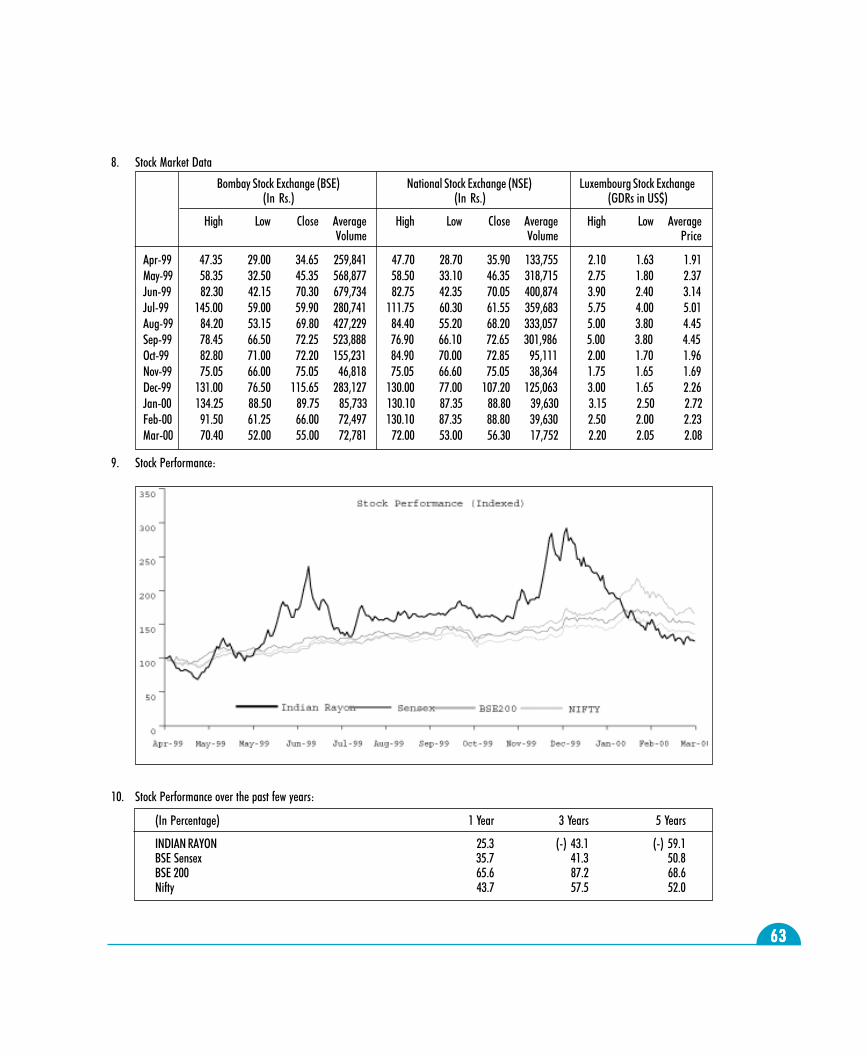
6363636363
8. Stock Market Data
Bombay Stock Exchange (BSE) National Stock Exchange (NSE) Luxembourg Stock Exchange(In Rs.) (In Rs.) (GDRs in US$)
High Low Close Average High Low Close Average High Low AverageVolume Volume Price
Apr-99 47.35 29.00 34.65 259,841 47.70 28.70 35.90 133,755 2.10 1.63 1.91May-99 58.35 32.50 45.35 568,877 58.50 33.10 46.35 318,715 2.75 1.80 2.37Jun-99 82.30 42.15 70.30 679,734 82.75 42.35 70.05 400,874 3.90 2.40 3.14Jul-99 145.00 59.00 59.90 280,741 111.75 60.30 61.55 359,683 5.75 4.00 5.01Aug-99 84.20 53.15 69.80 427,229 84.40 55.20 68.20 333,057 5.00 3.80 4.45Sep-99 78.45 66.50 72.25 523,888 76.90 66.10 72.65 301,986 5.00 3.80 4.45Oct-99 82.80 71.00 72.20 155,231 84.90 70.00 72.85 95,111 2.00 1.70 1.96Nov-99 75.05 66.00 75.05 46,818 75.05 66.60 75.05 38,364 1.75 1.65 1.69Dec-99 131.00 76.50 115.65 283,127 130.00 77.00 107.20 125,063 3.00 1.65 2.26Jan-00 134.25 88.50 89.75 85,733 130.10 87.35 88.80 39,630 3.15 2.50 2.72Feb-00 91.50 61.25 66.00 72,497 130.10 87.35 88.80 39,630 2.50 2.00 2.23Mar-00 70.40 52.00 55.00 72,781 72.00 53.00 56.30 17,752 2.20 2.05 2.08
9. Stock Performance:
10. Stock Performance over the past few years:
(In Percentage) 1 Year 3 Years 5 Years
INDIAN RAYON 25.3 (-) 43.1 (-) 59.1BSE Sensex 35.7 41.3 50.8BSE 200 65.6 87.2 68.6Nifty 43.7 57.5 52.0
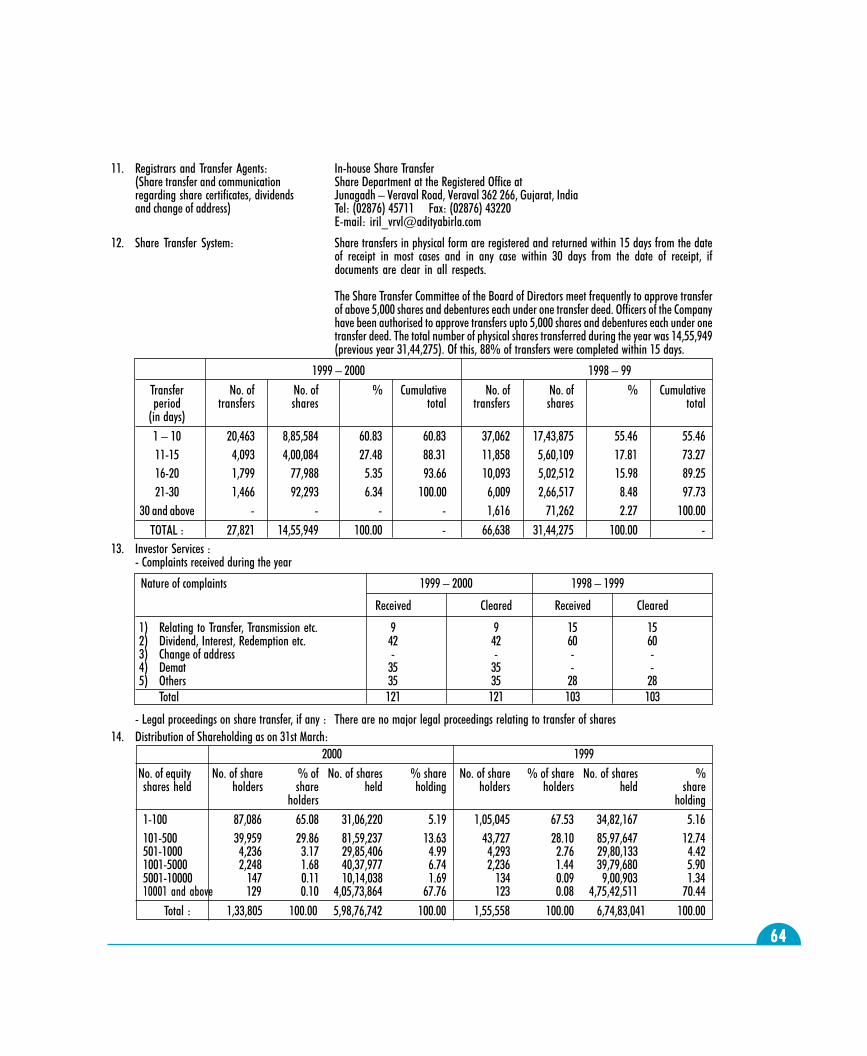
6464646464
11. Registrars and Transfer Agents: In-house Share Transfer(Share transfer and communication Share Department at the Registered Office atregarding share certificates, dividends Junagadh � Veraval Road, Veraval 362 266, Gujarat, Indiaand change of address) Tel: (02876) 45711 Fax: (02876) 43220
E-mail: [email protected]
12. Share Transfer System: Share transfers in physical form are registered and returned within 15 days from the dateof receipt in most cases and in any case within 30 days from the date of receipt, ifdocuments are clear in all respects.
The Share Transfer Committee of the Board of Directors meet frequently to approve transferof above 5,000 shares and debentures each under one transfer deed. Officers of the Companyhave been authorised to approve transfers upto 5,000 shares and debentures each under onetransfer deed. The total number of physical shares transferred during the year was 14,55,949(previous year 31,44,275). Of this, 88% of transfers were completed within 15 days.
1999 � 2000 1998 � 99Transfer No. of No. of % Cumulative No. of No. of % Cumulativeperiod transfers shares total transfers shares total
(in days)1 � 10 20,463 8,85,584 60.83 60.83 37,062 17,43,875 55.46 55.4611-15 4,093 4,00,084 27.48 88.31 11,858 5,60,109 17.81 73.2716-20 1,799 77,988 5.35 93.66 10,093 5,02,512 15.98 89.2521-30 1,466 92,293 6.34 100.00 6,009 2,66,517 8.48 97.73
30 and above - - - - 1,616 71,262 2.27 100.00TOTAL : 27,821 14,55,949 100.00 - 66,638 31,44,275 100.00 -
13. Investor Services :- Complaints received during the year
Nature of complaints 1999 � 2000 1998 � 1999
Received Cleared Received Cleared
1) Relating to Transfer, Transmission etc. 9 9 15 152) Dividend, Interest, Redemption etc. 42 42 60 603) Change of address - - - -4) Demat 35 35 - -5) Others 35 35 28 28
Total 121 121 103 103
- Legal proceedings on share transfer, if any : There are no major legal proceedings relating to transfer of shares14. Distribution of Shareholding as on 31st March:
2000 1999No. of equity No. of share % of No. of shares % share No. of share % of share No. of shares %shares held holders share held holding holders holders held share
holders holding1-100 87,086 65.08 31,06,220 5.19 1,05,045 67.53 34,82,167 5.16101-500 39,959 29.86 81,59,237 13.63 43,727 28.10 85,97,647 12.74501-1000 4,236 3.17 29,85,406 4.99 4,293 2.76 29,80,133 4.421001-5000 2,248 1.68 40,37,977 6.74 2,236 1.44 39,79,680 5.905001-10000 147 0.11 10,14,038 1.69 134 0.09 9,00,903 1.3410001 and above 129 0.10 4,05,73,864 67.76 123 0.08 4,75,42,511 70.44
Total : 1,33,805 100.00 5,98,76,742 100.00 1,55,558 100.00 6,74,83,041 100.00
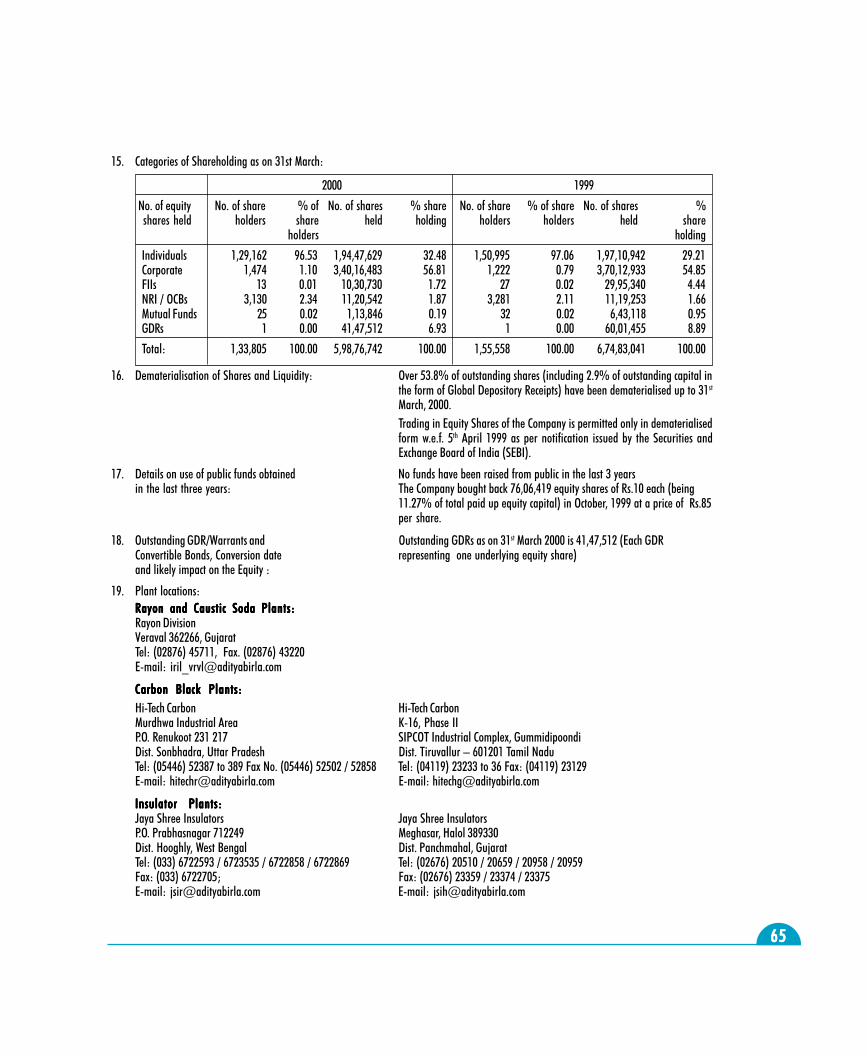
6565656565
15. Categories of Shareholding as on 31st March:
2000 1999
No. of equity No. of share % of No. of shares % share No. of share % of share No. of shares %shares held holders share held holding holders holders held share
holders holding
Individuals 1,29,162 96.53 1,94,47,629 32.48 1,50,995 97.06 1,97,10,942 29.21Corporate 1,474 1.10 3,40,16,483 56.81 1,222 0.79 3,70,12,933 54.85FIIs 13 0.01 10,30,730 1.72 27 0.02 29,95,340 4.44NRI / OCBs 3,130 2.34 11,20,542 1.87 3,281 2.11 11,19,253 1.66Mutual Funds 25 0.02 1,13,846 0.19 32 0.02 6,43,118 0.95GDRs 1 0.00 41,47,512 6.93 1 0.00 60,01,455 8.89
Total: 1,33,805 100.00 5,98,76,742 100.00 1,55,558 100.00 6,74,83,041 100.00
16. Dematerialisation of Shares and Liquidity: Over 53.8% of outstanding shares (including 2.9% of outstanding capital inthe form of Global Depository Receipts) have been dematerialised up to 31st
March, 2000.Trading in Equity Shares of the Company is permitted only in dematerialisedform w.e.f. 5th April 1999 as per notification issued by the Securities andExchange Board of India (SEBI).
17. Details on use of public funds obtained No funds have been raised from public in the last 3 yearsin the last three years: The Company bought back 76,06,419 equity shares of Rs.10 each (being
11.27% of total paid up equity capital) in October, 1999 at a price of Rs.85per share.
18. Outstanding GDR/Warrants and Outstanding GDRs as on 31st March 2000 is 41,47,512 (Each GDRConvertible Bonds, Conversion date representing one underlying equity share)and likely impact on the Equity :
19. Plant locations:Rayon and Caustic Soda Plants:Rayon and Caustic Soda Plants:Rayon and Caustic Soda Plants:Rayon and Caustic Soda Plants:Rayon and Caustic Soda Plants:Rayon DivisionVeraval 362266, GujaratTel: (02876) 45711, Fax. (02876) 43220E-mail: [email protected]
Carbon Black Plants:Carbon Black Plants:Carbon Black Plants:Carbon Black Plants:Carbon Black Plants:Hi-Tech Carbon Hi-Tech CarbonMurdhwa Industrial Area K-16, Phase IIP.O. Renukoot 231 217 SIPCOT Industrial Complex, GummidipoondiDist. Sonbhadra, Uttar Pradesh Dist. Tiruvallur � 601201 Tamil NaduTel: (05446) 52387 to 389 Fax No. (05446) 52502 / 52858 Tel: (04119) 23233 to 36 Fax: (04119) 23129E-mail: [email protected] E-mail: [email protected]
Insulator Plants:Insulator Plants:Insulator Plants:Insulator Plants:Insulator Plants:Jaya Shree Insulators Jaya Shree InsulatorsP.O. Prabhasnagar 712249 Meghasar, Halol 389330Dist. Hooghly, West Bengal Dist. Panchmahal, GujaratTel: (033) 6722593 / 6723535 / 6722858 / 6722869 Tel: (02676) 20510 / 20659 / 20958 / 20959Fax: (033) 6722705; Fax: (02676) 23359 / 23374 / 23375E-mail: [email protected] E-mail: [email protected]
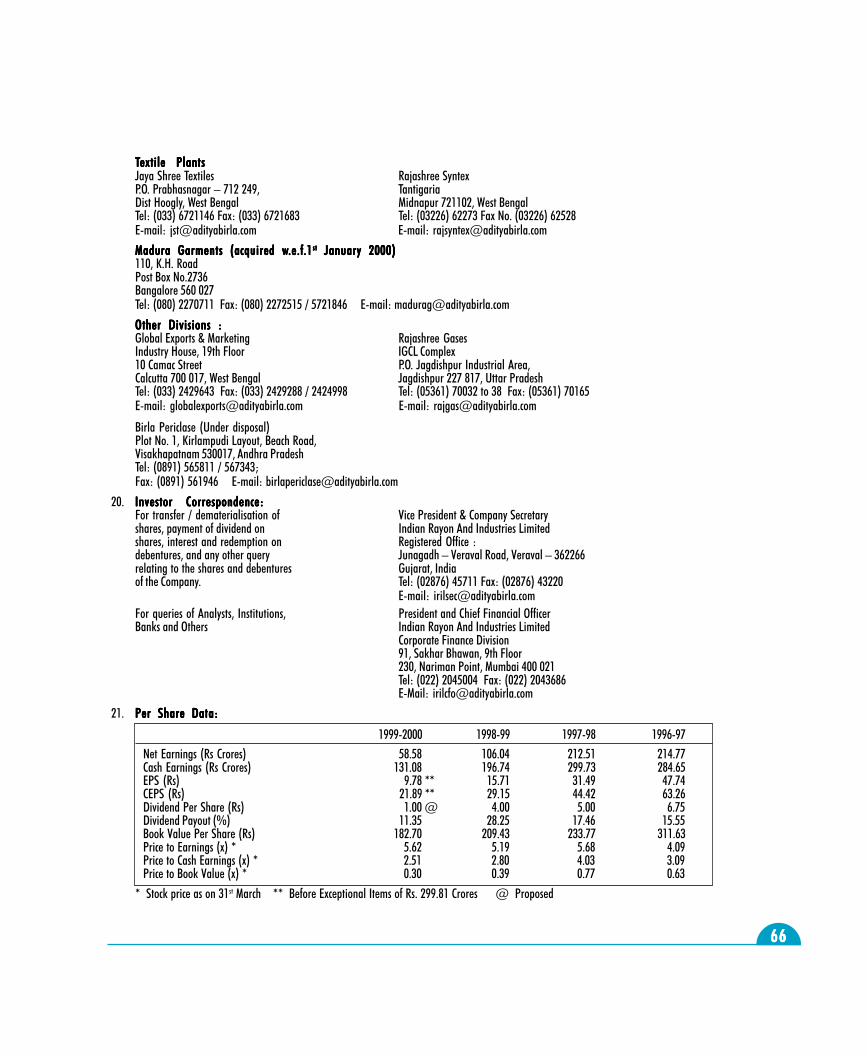
6666666666
TTTTTextile Plantsextile Plantsextile Plantsextile Plantsextile PlantsJaya Shree Textiles Rajashree SyntexP.O. Prabhasnagar � 712 249, TantigariaDist Hoogly, West Bengal Midnapur 721102, West BengalTel: (033) 6721146 Fax: (033) 6721683 Tel: (03226) 62273 Fax No. (03226) 62528E-mail: [email protected] E-mail: [email protected]
Madura Garments (acquired wMadura Garments (acquired wMadura Garments (acquired wMadura Garments (acquired wMadura Garments (acquired w.e.f.e.f.e.f.e.f.e.f.1.1.1.1.1 s ts ts ts ts t January 2000) January 2000) January 2000) January 2000) January 2000)110, K.H. RoadPost Box No.2736Bangalore 560 027Tel: (080) 2270711 Fax: (080) 2272515 / 5721846 E-mail: [email protected]
Other Divisions :Other Divisions :Other Divisions :Other Divisions :Other Divisions :Global Exports & Marketing Rajashree GasesIndustry House, 19th Floor IGCL Complex10 Camac Street P.O. Jagdishpur Industrial Area,Calcutta 700 017, West Bengal Jagdishpur 227 817, Uttar PradeshTel: (033) 2429643 Fax: (033) 2429288 / 2424998 Tel: (05361) 70032 to 38 Fax: (05361) 70165E-mail: [email protected] E-mail: [email protected]
Birla Periclase (Under disposal)Plot No. 1, Kirlampudi Layout, Beach Road,Visakhapatnam 530017, Andhra PradeshTel: (0891) 565811 / 567343;Fax: (0891) 561946 E-mail: [email protected]
20. Investor Correspondence:Investor Correspondence:Investor Correspondence:Investor Correspondence:Investor Correspondence:For transfer / dematerialisation of Vice President & Company Secretaryshares, payment of dividend on Indian Rayon And Industries Limitedshares, interest and redemption on Registered Office :debentures, and any other query Junagadh � Veraval Road, Veraval � 362266relating to the shares and debentures Gujarat, Indiaof the Company. Tel: (02876) 45711 Fax: (02876) 43220
E-mail: [email protected] queries of Analysts, Institutions, President and Chief Financial OfficerBanks and Others Indian Rayon And Industries Limited
Corporate Finance Division91, Sakhar Bhawan, 9th Floor230, Nariman Point, Mumbai 400 021Tel: (022) 2045004 Fax: (022) 2043686E-Mail: [email protected]
21. Per Share Data:Per Share Data:Per Share Data:Per Share Data:Per Share Data:
1999-2000 1998-99 1997-98 1996-97Net Earnings (Rs Crores) 58.58 106.04 212.51 214.77Cash Earnings (Rs Crores) 131.08 196.74 299.73 284.65EPS (Rs) 9.78 ** 15.71 31.49 47.74CEPS (Rs) 21.89 ** 29.15 44.42 63.26Dividend Per Share (Rs) 1.00 @ 4.00 5.00 6.75Dividend Payout (%) 11.35 28.25 17.46 15.55Book Value Per Share (Rs) 182.70 209.43 233.77 311.63Price to Earnings (x) * 5.62 5.19 5.68 4.09Price to Cash Earnings (x) * 2.51 2.80 4.03 3.09Price to Book Value (x) * 0.30 0.39 0.77 0.63
* Stock price as on 31st March ** Before Exceptional Items of Rs. 299.81 Crores @ Proposed