lanthanide-doped nanoparticles as the active optical
TRANSCRIPT

LANTHANIDE-DOPED NANOPARTICLES AS THE ACTIVE OPTICAL MEDIUM IN
POLYMER-BASED DEVICES
PROEFSCHRIFT
ter verkrijging van
de graad van doctor aan de Universiteit Twente,
op gezag van rector magnificus,
prof.dr.F. A. van Vught,
volgens besluit van het College voor Promoties
in het openbaar te verdedigen
op vrijdag 6 februari 2004 om 16.45 uur
door
Jan Willem Stouwdam
geboren op 29 december 1974
te Ijsselmuiden

ii
Dit proefschrift is goedgekeurd door:
Promotor Prof.dr.ir.D. N. Reinhoudt
Assistent-promotor Prof.dr.ir.F. C. J. M. van Veggel


iv
Dit onderzoek is financieel gesteund door het gebied Chemische Wetenschappen van de
Nederlandse Organisatie voor Wetenschappelijk Onderzoek
ISBN 90-365-2011-8
v
Table of contents
CHAPTER 1......................................................................................... 1
General introduction ..........................................................................................................1
1.1 References................................................................................................................3
CHAPTER 2......................................................................................... 5
Luminescence of lanthanide ions.......................................................................................5
2.1 General introduction ................................................................................................6
2.2 Luminescence of trivalent lanthanide ions ..............................................................7
2.3 Quenching processes..............................................................................................10
2.3.1 Multi-phonon emission ...................................................................................10
2.3.2 Energy transfer between lanthanide ions ........................................................11
2.3.3 Cross-relaxation ..............................................................................................11
2.3.4 Up-conversion.................................................................................................12
2.4 Lanthanide luminescence in inorganic materials...................................................13
2.5 Lanthanide luminescence in organic materials ......................................................14
2.6 Nanoparticles .........................................................................................................16
2.6.1 Synthesis of nanoparticles in organic solution ...............................................16
2.6.2 Synthesis of semiconductor nanoparticles......................................................17
2.6.3 Synthesis of metal nanoparticles.....................................................................19
2.6.4 Lanthanide-doped nanoparticles .....................................................................19
2.6.5 Lanthanide ions in semiconductor nanoparticles............................................23
2.6.6 Synthesis of mono-disperse nanoparticles......................................................24
2.7 Optical amplifiers ..................................................................................................25
2.7.1 1550 nm fiber amplifiers.................................................................................27
2.7.2 1300 nm fiber amplifiers.................................................................................27
2.7.3 Other wavelength amplifiers...........................................................................28
2.8 Polymer-based optical amplifiers ..........................................................................29
2.9 Electroluminescence ..............................................................................................31
2.10 Outlook ................................................................................................................33
2.11 References............................................................................................................33
CHAPTER 3....................................................................................... 41
Synthesis of lanthanide(III)-doped nanoparticles ............................................................41
vi
3.1 Introduction ........................................................................................................... 42
3.2 Results and discussion........................................................................................... 42
3.2.1 Luminescence of Eu3+-doped nanoparticles ................................................... 47
3.2.2 Strongly visible-emitting ions Tb3+, Dy3+, and Sm3+ ..................................... 52
3.2.3 Weakly visible-emitting ions Pr3+, Tm3+, and Ho3+ ....................................... 54
3.2.4 Determination of the quantum yield............................................................... 56
3.2.5 Near-infrared emitting ions ............................................................................ 57
3.3 Conclusions ........................................................................................................... 65
3.4 Experimental section ............................................................................................. 65
3.5 References and notes ............................................................................................. 68
CHAPTER 4........................................................................................71
Surface effects on the luminescence of lanthanide(III)-doped nanoparticles.................. 71
4.1 Introduction ........................................................................................................... 72
4.2 Results and discussion........................................................................................... 73
4.2.1 Quenching by solvents ................................................................................... 73
4.2.2 Influence of the refractive index..................................................................... 74
4.2.3 Concentration quenching................................................................................ 75
4.2.4 Modeling of the luminescence lifetime .......................................................... 76
4.2.5 Nanoparticles with different sizes .................................................................. 82
4.3 Conclusions ........................................................................................................... 88
4.4 Experimental section ............................................................................................. 88
4.5 References and notes ............................................................................................. 88
Appendix 4.A .................................................................................................................. 90
4.A.1 Modeling the luminescence decay..................................................................... 90
4.1 References and notes ............................................................................................. 92
CHAPTER 5........................................................................................93
Surface modification of lanthanide(III)-doped nanoparticles ......................................... 93
5.1 Introduction ........................................................................................................... 94
5.2 Results and discussion........................................................................................... 95
5.2.1 Surface modification of LaF3 and LaPO4 nanoparticles................................. 95
5.2.2 Synthesis of core-shell nanoparticles of LaF3 .............................................. 100
5.3 Conclusions ......................................................................................................... 106
5.4 Experimental section ........................................................................................... 106
vii
5.5 References and notes ...........................................................................................108
CHAPTER 6..................................................................................... 111
Synthesis of lanthanide(III)-doped semiconductor nanoparticles .................................111
6.1 Introduction..........................................................................................................112
6.2 Results and discussion .........................................................................................113
6.2.1 Characterization of Eu3+-doped nanoparticles ..............................................113
6.2.2 Quenching in lanthanide-doped TiO2 nanoparticles.....................................117
6.2.3 Lanthanide ions emitting in the Near-Infrared .............................................119
6.2.4 A LED with TiO2:Eu nanoparticles ..............................................................120
6.3 Conclusions..........................................................................................................121
6.4 Experimental section............................................................................................122
6.5 References and notes ...........................................................................................123
CHAPTER 7..................................................................................... 125
Polymer waveguide amplifiers doped with LaF3:Nd nanoparticles. .............................125
7.1 Introduction..........................................................................................................126
7.2 Results and discussion .........................................................................................129
7.2.1 PMMA waveguides ......................................................................................129
7.2.2 SU-8 waveguides ..........................................................................................132
7.2.3 Modeling of the amplification ......................................................................137
7.3 Outlook: Optimization of the device structure ....................................................138
7.4 Conclusions..........................................................................................................141
7.5 Experimental section............................................................................................141
7.6 References and notes ...........................................................................................142
Appendix 7.A.................................................................................................................144
7.1 Modeling of the Nd3+ optical amplification.........................................................144
7.2 References............................................................................................................147
Summary........................................................................................................................149
Samenvatting .................................................................................................................153
Dankwoord.....................................................................................................................157
Curriculum Vitae ...........................................................................................................159

1
CCCHHHAAAPPPTTTEEERRR 111 General introduction
In the current age of information technology the demand for fast transport of a large
amount of data over long distances is constantly growing. The use of glass fibers for optical
telecommunication has been a very important step in increasing the bandwidth and speed of data
transport and these glass fibers have almost completely replaced conventional electric data
transport in copper cables. Glass fibers could only be used to their full potential after the
introduction of optical amplifiers to compensate for the small optical losses that occur in these
fibers.1 Optical amplifiers allow for the direct amplification of optical signals, without the
conversion to electrical signals. The active luminescent material in optical amplifiers is often one
of the lanthanide ions, because they have the appropriate optical transitions. The major
advantages of the lanthanide ions are the long luminescence lifetime and the high quantum
efficiency that can be achieved at the major telecommunication wavelengths of 1300 and 1530
nm. The Er3+-doped fiber amplifier (EDFA) is the most commonly used amplifier, because the
optical transition of the Er3+ ion at 1530 nm coincides with the minimum loss window of optical
glass fibers. To cover the complete low-loss window, other lanthanide ions also attract a lot of
attention, like Pr3+ and Nd3+ for amplification around 1300 nm and Tm3+ for amplification
around 1450 nm.2,3 A large number of optical components are needed for the manipulation of
optical signals, but combining these components with glass fiber technology is very expensive.
The use of planar waveguide technology would have significant advantages in reducing the cost
2
of integrated systems with the use of lithographic techniques.4 Polymers are interesting materials
for the use in planar waveguides, because of the low fabrication cost of devices and the
flexibility these polymers offer in their processing.5 Also needed in these integrated waveguide
structures are optical amplifiers, for the compensation of optical losses that occur during the
manipulation of the data signals and of the intrinsic losses of the device. Polymer-based optical
amplifiers have to be developed, but the use of lanthanide ions as the luminescent material in
these polymer-based amplifiers has some drawbacks. The luminescence of lanthanide ions,
especially the ions emitting at the wavelengths that are of interest for telecommunication, is
quenched significantly in organic materials, due to the high vibrational energies of the chemical
bonds in the polymer. In order to increase the luminescence of the lanthanide ions in polymer-
based materials, the ion has to be shielded from the polymer environment and one way to do this
is by the synthesis of organic complexes, in which an organic ligand is coordinated to the
lanthanide ion.6 Reducing the amount of organic bonds in close proximity to the lanthanide ion
has improved the luminescence slightly, but still quenching is the dominant process.7
Therefore, the goal of this thesis is to improve the luminescence properties of lanthanide
ions in an organic solution or polymer, by doping them in the core of inorganic nanoparticles.
These nanoparticles are soluble in organic solvents, but at the same time they can provide an
environment around the lanthanide ion that reduces quenching. Generally, lanthanide ions have
good optical properties in inorganic matrices, like glasses and crystals, and long luminescence
lifetimes and high quantum yields are observed in these materials. Doping of the lanthanide ions
in the core of nanoparticles would give the lanthanide ion the luminescence properties found in
inorganic materials, but at the same time the nanoparticles could be processed as an organic
compound.
An overview of the luminescence of lanthanide ions will be given in chapter 2. The
luminescence of different ions in a variety of hosts will be discussed and it will focus on the
doping of lanthanide ions in nanoparticles. The synthesis and properties of different
nanoparticles will be discussed in detail.
The synthesis and optical characterization of nanoparticles doped with lanthanide ions are
discussed in chapter 3, as a way to improve the luminescence of lanthanide ions in an organic
solution. The nanoparticles have organic ligands coordinated to the surface that provide stability
of the nanoparticles and give the nanoparticles solubility in organic solvents. The small size of
the nanoparticles minimizes scattering and optically clear solutions can be made. Nanoparticles
doped with a range of lanthanide ions were prepared giving rise to different luminescence
3
spectra. The difference in luminescence spectra will be discussed in terms of the different crystal
symmetries of the nanoparticles that were prepared.
In chapter 4, the influence of the environment on the luminescence properties of the
lanthanide ions doped in the nanoparticles will be discussed. Due to the small size of the
nanoparticles the surface has a major influence on the luminescence of the lanthanide ions and a
model will be described that deals with the influence of surface quenching. Differently sized
nanoparticles are synthesized and it is shown that the optical properties of the lanthanide ions are
strongly size dependent.
The modification of the surface of the nanoparticles is discussed in chapter 5. The surface
of the nanoparticles is not only important for the optical properties of the lanthanide ions, but it
also determines the solubility of the nanoparticles. Control over the surface properties is an
important tool for the use of these materials in polymer-based technology and several methods to
change the surface bound ligands are discussed. The growth of an inorganic shell around the
nanoparticles is described as a simple way to improve the luminescence properties of the doped
lanthanide ions.
Chapter 6, describes the synthesis of semiconductor nanoparticles doped with lanthanide
ions. The low absorption coefficients and the narrow absorption lines of the lanthanide ions
make direct excitation of the lanthanide ions inefficient. Semiconductor materials can have broad
absorption bands with high absorption coefficients at wavelengths ranging from the UV to the
near-infrared (NIR) and energy transfer from the semiconductor host material to the lanthanide
ion could provide alternative excitation pathways. Semiconductor nanoparticles can be excited in
polymer light-emitting diodes (LEDs) and the doping of lanthanide ions in the nanoparticles
could generate lanthanide luminescence directly from electricity.
Optical amplification in a polymer waveguide is reported for the first time at an important
telecommunication wavelength of 1320 nm. The fabrication of planar polymer-based optical
amplifiers is described in chapter 7, using Nd3+-doped nanoparticles synthesized as described in
this thesis. It is shown that these nanoparticles are promising materials for polymer amplifiers.
Modeling of the amplification results shows that the gain of these polymer-based optical
amplifiers might be close to the gain that was obtained in Nd3+-doped glass fiber amplifiers.
1.1 References 1 Polman, A. Phys. B 2001, 300, 78.
4
2 Digonnet, M. J. F. Rare earth doped fiber laser and amplifiers; Dekker: New York, 1993. 3 Soga, K.; Wang, W.; Riman, R. E.; Brown, J. B.; Mikeska, K. R. J. Appl. Phys. 2003, 93, 2946. 4 Miya, T. IEEE J. Sel. Top. Quantum Electron. 2000, 6, 38. 5 (a) Chen, R. T. Opt. Laser Technol. 1993, 25, 347; (b) Schacklette, L. W.; Blomquist, R.; Deng, J.
M.; Ferm, P. M.; Maxfield, M.; Mato, J.; Zou, H. Adv. Funct. Mater. 2003, 13, 453; (c) Zhou, M.
Opt. Eng. 2002, 1, 1631. 6 Parker, D.; Gareth Williams, J. A. J. Chem. Soc., Dalton Trans. 1996, 18, 3613. 7 (a) Hebbink, G. A.; Reinhoudt, D. N.; van Veggel, F. C. J. M. Eur. J. Org. Chem. 2001, 21, 4101;
(b) Hasegawa, Y.; Ohkubo, T.; Sogabe, K.; Kawamura, Y.; Wada, Y.; Makashima, N.; Yanagida,
S. Angew. Chem. Int. Ed. 2000, 39, 357.
5
CCCHHHAAAPPPTTTEEERRR 222 Luminescence of lanthanide ions
The luminescence of lanthanide ions has a large technological importance in a
variety of materials like phosphor lamps, displays, lasers, and optical amplifiers.
Usually, the best hosts for these lanthanide ions are inorganic materials like crystals
and glasses, because lanthanide ions generally show high quantum yields in these
hosts. However, the use of organic materials could have significant advantages over
these inorganic materials in terms of the processability and costs. In this chapter,
some of the characteristics of the lanthanide ions will be described and how these
ions are already being used in organic environment. Furthermore, an overwiew is
given on optical amplifiers with lanthanide ions, since this will be a focus in the
remainder of this thesis.
6
2.1 General introduction
Most of the lanthanide ions were discovered in the early 19th and some in the 20th century,1
but since this fairly recent discovery the technological importance of the ions has been growing
rapidly. Although they are also called rare earth ions, they are not as rare as this name would
suggest. The ions are abundant in the earths crust, but they do not have the tendency to form
concentrated ore deposits.2 A wide variety of minerals, which can be found on a few places in
the world, do contain rare earth elements at relatively high concentration, in different
compositions.3 The lighter ions have a higher abundance in these ores and consequently have
lower prices. The ions have a wide variety of technological importance in for instance permanent
magnets, catalysis, batteries, and optics.4 The optical properties of lanthanide ions became
important when techniques were developed to separate the different lanthanide ions to high
purity. Cathode ray tubes of computers and color televisions use europium as the red phosphor5
and in fiber optic telecommunication, erbium ions are used in laser amplifiers to enhance optical
signals.6 It is especially this laser action of lanthanide ions that is the subject of this thesis.
The ions are extremely stable under laser action, because the optical transitions involve
electronic transitions within the ion itself. No chemical bonds are involved so degradation does
not occur. The long luminescence lifetime of the lanthanide ions makes laser action relatively
easy to achieve with cheap pump sources.7 The luminescence of the ions is widely studied in
inorganic hosts, like crystals or glasses.8 These host materials are often fabricated at high
temperatures and with sometimes high-cost materials. For optical glass fiber technology, the
high costs of integration of the optical components can even exceed the fabrication costs of the
components itself. This has clear disadvantages especially in short range telecommunication,
where the optical signals have to be processed in a large number of optical components.
Integration of these components on a single chip could reduce the costs significantly. Polymers
are attracting interest for integrated optical systems and research is going on to investigate the
use of lanthanide luminescence in polymer materials.9 Polymers have the advantage that they can
be processed at low temperatures and with standard techniques it is relatively easy to make
different structures. This would make it possible to integrate a wide variety of optical
components like splitters, couplers, multiplexers, and amplifiers lowering the cost of optical
systems. Polymer-based optical amplifiers have to be developed for the compensation of optical
losses that occur in the integrated systems. Lanthanide ions could be used as the luminescent
material in these amplifiers, but then the ions have to be incorporated in the polymer matrix. The
7
solubility of the ions in organic materials is low and one way to circumvent this problem is by
the synthesis of lanthanide complexes, which are soluble in organic materials. A disadvantage of
the use of these complexes is that the good optical properties these lanthanide ions have in
inorganic materials are largely reduced in the organic complexes.10 The high vibrational energies
of the chemical bonds in organic complexes are efficient quenchers of lanthanide luminescence.
In order to use lanthanide ions in a polymer matrix, they have to be shielded from the organic
environment in order to have good luminescence properties.
2.2 Luminescence of trivalent lanthanide ions
The lanthanides are the elements following lanthanum in the periodic table. In this range of
elements the 4f shell is successively filled. These 4f electrons are shielded from the environment
by the filled 5s and 5p shells. Since the valence electrons are the same for all the ions, they all
show very similar reactivity and coordination behavior.4
This thesis will focus on the luminescence of the trivalent lanthanide ions, but a few ions in
the series also show luminescence in the divalent state (Eu2+, Sm2+).11 Since luminescence of the
trivalent lanthanide ions arises from transitions within the 4f shell and because this shell is
shielded by filled 5s and 5p shells, the absorption and emissions of the ions are only slightly
affected by the environment. The transitions within the 4f state are parity forbidden, but due to
mixing with allowed transitions, like the 4f-5d transitions, they do occur. As a result of the
forbidden character, absorption coefficients are low and luminescence lifetimes are long, ranging
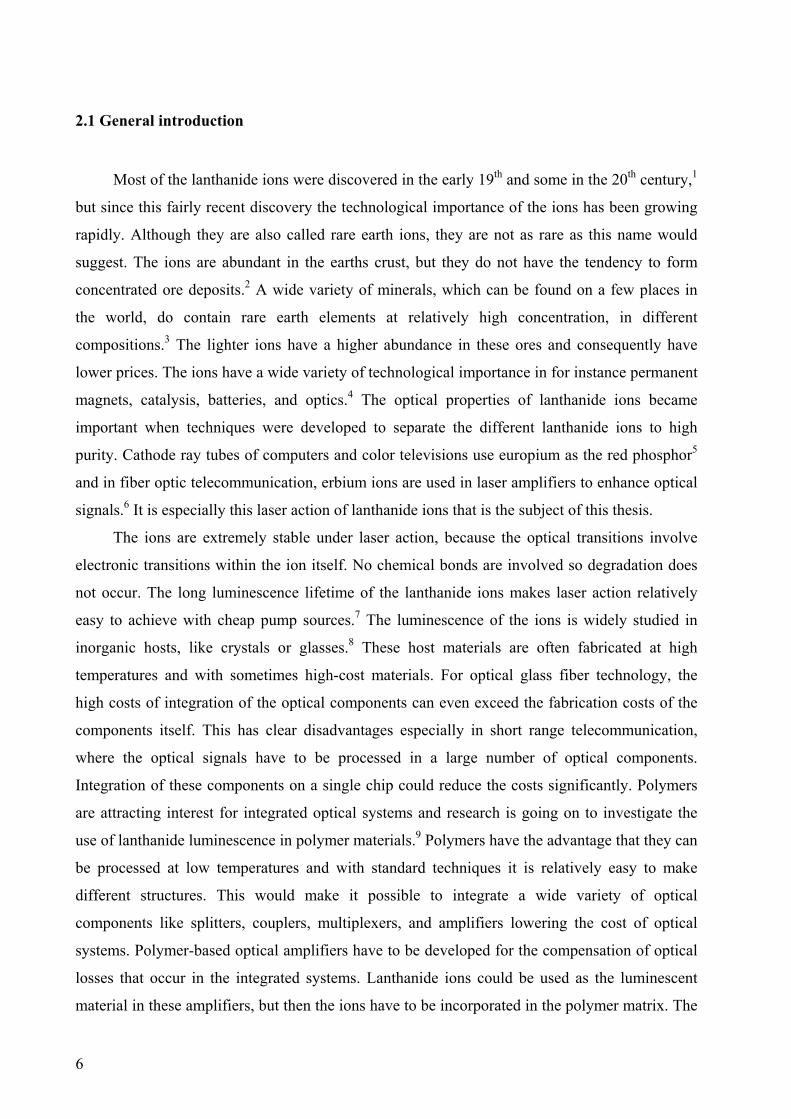
from microseconds up to several milliseconds. Figure 2.1 shows the energy levels of the 4f
configurations. Three lanthanide ions are not shown in this figure and of these ions; La3+ and
Lu3+ have a completely empty and a completely filled 4f shell, respectively, and therefore have
no optical transitions and Ce3+ has one electron and one 4f level just above the ground state. Ce3+
has the lowest oxidation potential of the lanthanide ions making the allowed 4f-5d transitions
possible in the UV. Y3+ is usually also treated as a lanthanide ion, because of similar reactivity
and coordination behavior. This ion also has no optical transitions, but luminescent lanthanide
ions are often incorporated in host materials with Y3+ ions. The energy levels are denoted as (2S+1)ГJ (Russel-Saunders notation), where S is the spin multiplicity, Г the orbital angular
momentum, and J the total angular momentum. Due to the effective shielding of the 4f electrons,
the crystal field has almost no effect on the energy of the levels. For this reason this energy level
diagram can be used for lanthanide ions in all sorts of host materials. In principle this could lead
to very similar emission and absorption spectra for the same lanthanide ion in a range of
8
different hosts, but symmetry and quenching will have an effect on the emission properties as
discussed further in this chapter.
Pr3+ Nd3+ Sm3+ Eu3+ Gd3+ Tb3+ Dy3+Ho3+ Er3+ Tm3+ Yb3+
32500
30000
25000
20000
15000
10000
5000
0
∆E(cm )-1
3H4
3H6
3H5
3F2
3F3
3F4
1G4
1D2
3P0
3P1
1I6
3P2
4I9/2
4I11/2
4I13/2
4I15/2
4F3/2
4H9/2
4S3/2
4F9/2
2H11/2
4G5/2
4G7/2
4G9/2
2 2D/ P3/2
4G11/2
2P1/2
2D5/2
2 2P/ D3/2
4D3/2
4D1/2
4H9/2
4H7/24D3/26P7/26P3/24L13/26 4P/ P5/24G9/24F5/24I13/24I11/24M15/24G7/24F3/24G5/2
6F11/2
6F9/26F7/26F5/26F3/26F1/26H13/2
6H11/2
6H9/2
6H7/26H5/2 7F0
7F1
7F3
7F4
7F5
7F6
5D0
5D1
5D2
5D3
5L6
5G2
5G6
5D4
6P5/26P7/2
8S 7F6
7F5
7F4
7F3
7F2
7F1
7F0
5D4
5G6
5L10
5G5
5L9
5L86P7/26P5/24K17/24I13/2
4G11/2
4I15/24F9/2
6F3/26F5/2
6F7/26H5/2
6 6H / F7/2 9/2
6 6H / F9/2 11/2
6H11/2
6H13/2
6H15/2
5I8
5I7
5I6
5I5
4I4
5F5
5S2
5F3
5F2
3K6
5G
5 3G/ G5
5G4
3K7
3H6
5G2
3L9
3K6
2G7/24G9/24G11/2
4G9/2
4F3/24F5/2
4F7/2
2H11/24S3/2
4F9/2
4I9/2
4I11/2
4I13/2
4I15/2
3H6
3H4
3H5
3F4
3F3
3F2
1G4
1D2
2F5/2
2F7/2
Figure 2.1: Energy level diagrams of the lanthanide ions.12
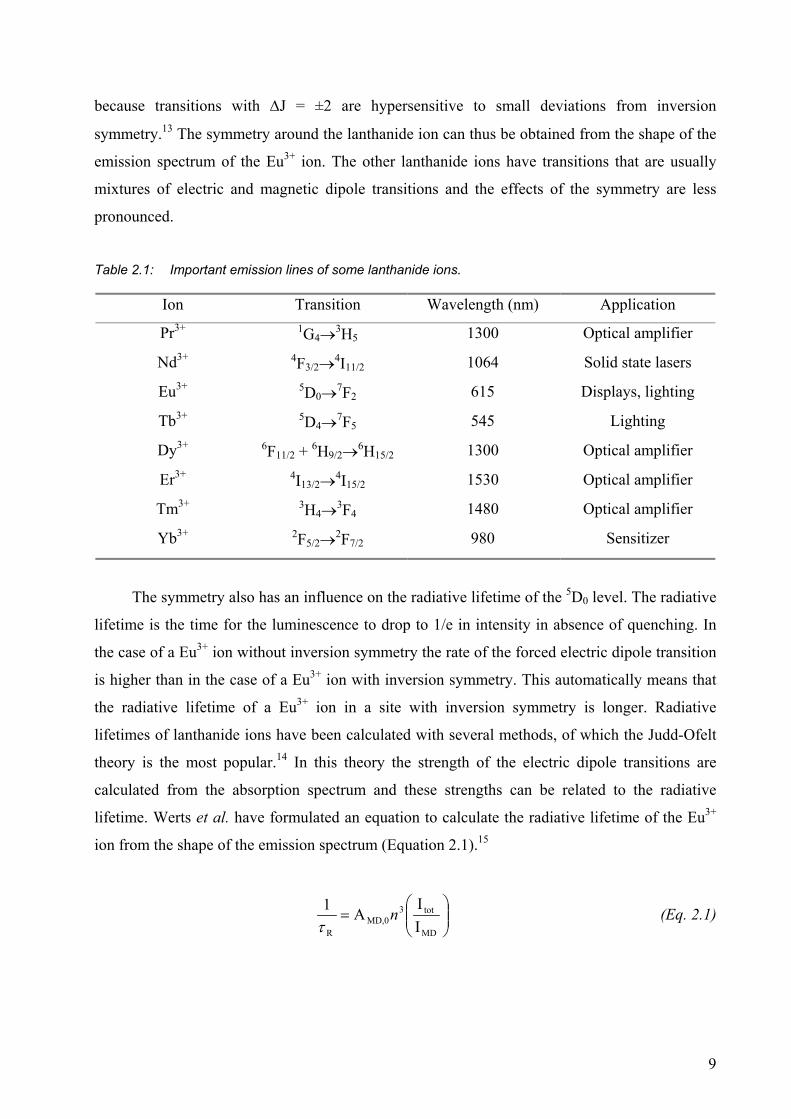
Table 2.1 gives some important emissions of lanthanide ions and their technological
interest. The selection rules for the different transitions are influenced by the symmetry of the
environment. The nature of the transitions varies from pure magnetic dipole transitions to pure
electric dipole transitions and mixtures of the two. The emission spectrum of the Eu3+ ion is
strongly influenced by the symmetry of the surroundings. The main emissions of this ion occur
from the 5D0 to the 7FJ (J = 0-6) levels. The 5D0→7F1 transition is a pure magnetic dipole
transition, which is practically independent of the symmetry of the surroundings and the strength
can be calculated theoretically. The transitions to the 7F0, 3, 5 levels are forbidden both in
magnetic and electric dipole schemes and are usually very weak in the emission spectrum. The
remaining transitions to the 7F2, 4, 6 levels are pure electric dipole transitions and they are strongly
dependent on the symmetry of the environment. In a crystal site with inversion symmetry the
electric dipole transitions are strictly forbidden and the 5D0→7F1 transition is usually the
dominant emission line. In a site without inversion symmetry the strength of the electric dipole
transitions is higher. The 5D0→7F2 transition is usually the strongest emission line in this case,
9
because transitions with ∆J = ±2 are hypersensitive to small deviations from inversion
symmetry.13 The symmetry around the lanthanide ion can thus be obtained from the shape of the
emission spectrum of the Eu3+ ion. The other lanthanide ions have transitions that are usually
mixtures of electric and magnetic dipole transitions and the effects of the symmetry are less
pronounced.
Table 2.1: Important emission lines of some lanthanide ions.
Ion Transition Wavelength (nm) Application
Pr3+ 1G4→3H5 1300 Optical amplifier
Nd3+ 4F3/2→4I11/2 1064 Solid state lasers
Eu3+ 5D0→7F2 615 Displays, lighting
Tb3+ 5D4→7F5 545 Lighting
Dy3+ 6F11/2 + 6H9/2→6H15/2 1300 Optical amplifier
Er3+ 4I13/2→4I15/2 1530 Optical amplifier
Tm3+ 3H4→3F4 1480 Optical amplifier
Yb3+ 2F5/2→2F7/2 980 Sensitizer
The symmetry also has an influence on the radiative lifetime of the 5D0 level. The radiative
lifetime is the time for the luminescence to drop to 1/e in intensity in absence of quenching. In
the case of a Eu3+ ion without inversion symmetry the rate of the forced electric dipole transition
is higher than in the case of a Eu3+ ion with inversion symmetry. This automatically means that
the radiative lifetime of a Eu3+ ion in a site with inversion symmetry is longer. Radiative
lifetimes of lanthanide ions have been calculated with several methods, of which the Judd-Ofelt
theory is the most popular.14 In this theory the strength of the electric dipole transitions are
calculated from the absorption spectrum and these strengths can be related to the radiative
lifetime. Werts et al. have formulated an equation to calculate the radiative lifetime of the Eu3+
ion from the shape of the emission spectrum (Equation 2.1).15
=
MD
tot3MD,0
R II
A1 nτ
(Eq. 2.1)
10
In this equation, the strength of the magnetic dipole transition (IMD) is compared to the
intensity of the total spectrum (Itot). AMD,0 is the spontaneous emission probability of the 5D0→7F1 transition in vacuo and n3 is a correction for the refractive index. AMD,0 could be
calculated and was found to be 14.65 s-1.
2.3 Quenching processes
2.3.1 Multi-phonon emission
Non-radiative processes can also play an important role. The energy of the excited state
can be taken up by the surroundings in the form of vibrational energy, often referred to as
phonon emission. The effectiveness of this process depends on the availability of high-energy
vibrations in the surroundings and the energy difference between the energy levels of the
lanthanide ion. The fundamental vibrations of the chemical bonds in the surroundings and the
energy of the vibration are determined by the reduced mass of a bond. Especially bonds with
hydrogen have a small reduced-mass and therefore high vibrational energies. These bonds are
therefore able to take up large amounts of energy and effectively quench lanthanide ions with
large separations between the energy levels. The visible emitting ions Eu3+ and Tb3+ have large
gaps between the emissive 5D0 and 5D4 level of 12,000 and 15,000 cm-1, respectively, but still
these ions and especially Eu3+ are quenched substantially when the ions are dissolved in water
(vibrational energy: υmax 3500 cm-1). The quenching efficiency is strongly dependent on the
number of vibrational quanta that are needed to bridge the gap between the lowest emitting level
and the highest non-emitting level of the lanthanide ion. The intensity of the vibronic transition
is dependent on the square overlap integral (Franck-Condon factor) of the initial and final
vibrational states and this overlap decreases rapidly as the number of vibrational quanta
increases.16 This is summarized in the theory of the energy gap law.17 The observation of
luminescence of a lanthanide ion in solvents with high vibrational energies (water) is dependent
on the energy difference between the lowest radiative level and the highest non-radiative level.
For example, Tb3+ in water shows reasonable luminescence but Eu3+ luminescence is almost
completely quenched. The Eu3+ ion is quenched by energy transfer to the 4th overtone of the OH
bonds, while the Tb3+ ion is quenched by energy transfer to the 5th overtone of the OH bond.
Another important factor governing the efficiency of quenching is the distance between the
lanthanide ion and the quencher group. Quenching occurs through a dipole-dipole interaction in
a Förster-type mechanism.18 In this Förster mechanism the interaction between the lanthanide ion
(donor) and the quenching site (acceptor) only occurs when the energy levels of the donor and
11
acceptor are resonant. The donor and acceptor do not have to have overlap of their wave
functions, but the process is strongly distance dependent. For dipole-dipole interactions the rate
of quenching has a distance dependence of r-6.10
2.3.2 Energy transfer between lanthanide ions
Another factor in the quenching of lanthanide ions is the interaction between the lanthanide
ions, of the same or different type. Two different lanthanide ions can transfer energy when they
have similar separations between the energy levels. The small mismatch in energy can be
compensated for by the emission or uptake of a phonon. Energy transfer of one lanthanide ion
can be used to enhance luminescence of the other lanthanide ion. For example the lanthanide
couple Yb3+-Er3+, where the Yb3+ ion is excited at 980 nm and then transfers its energy to the
Er3+ ion. The advantage of co-doping with Yb3+ is that the Yb3+ ions have a much higher
absorption cross-section at 980 nm.19 The optical gain of an amplifier co-doped with both these
ions can be increased compared to an amplifier with only Er3+ ions.20 Another example is the
Tm3+-Ho3+ couple, where Tm3+ is used as the sensitizer and Ho3+ as the emitter around 2 µm.
The Tm3+ ion has an absorption peak around 790 nm, a wavelength where a lot of cheap
semiconductor pump lasers are available. Pumping at this wavelength leads to an excited Tm3+
ion in the 3H4 level, which self-quenches to the 3F4 level producing two Tm3+ ions excited in the 3F4 level. Energy transfer from the 3F4 level of Tm3+ to the 5I7 level of Ho3+ could theoretically
lead to two excited Ho3+ ions per absorbed photon.21 The same energy transfer process could
also be used to enhance laser action of Tm3+ around 1480 nm.22 Pumping of the Tm3+ ion into
the 3H4 level can lead to Tm3+ emission at 1480 nm by radiative decay to the 3F4 level. If this 3F4
level is relatively long lived, which is the case in some host materials, it is difficult to create a
population inversion between the 3H4 and 3F4 level. Co-doping with Ho3+ leads to a fast
depopulation of the 3F4 level making population inversion possible.
2.3.3 Cross-relaxation
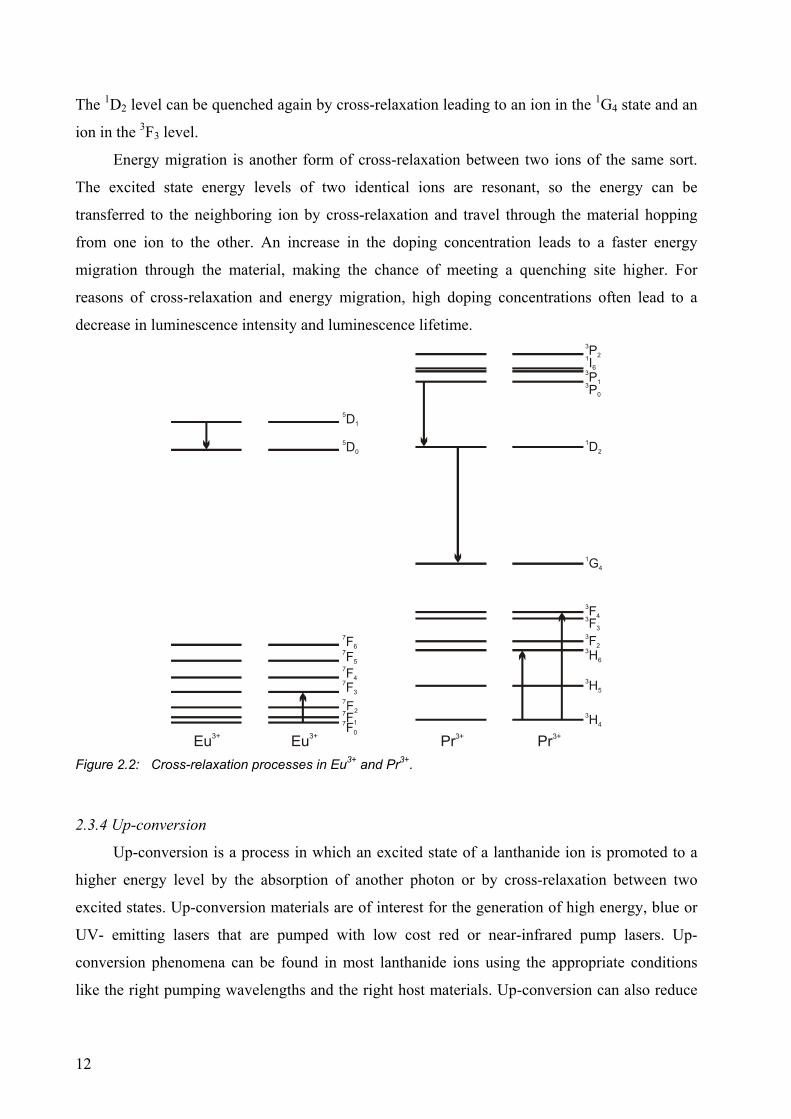
In a cross-relaxation process two ions that are closely together interact and exchange
energy. Examples of these processes are given in Figure 2.2 for Eu3+ and Pr3+. A Eu3+ ion in the 5D1 excited state can transfer its energy to a neighboring Eu3+ ion promoting it to the 7F3 level.
This leads to one ion in the 5D0 excited state and one in the 7F3 level. In the case of Pr3+, the 3P0
level can be quenched by cross-relaxation leading to an ion in the 3H6 and an ion in the 1D2 level.
12
The 1D2 level can be quenched again by cross-relaxation leading to an ion in the 1G4 state and an
ion in the 3F3 level.
Energy migration is another form of cross-relaxation between two ions of the same sort.
The excited state energy levels of two identical ions are resonant, so the energy can be
transferred to the neighboring ion by cross-relaxation and travel through the material hopping
from one ion to the other. An increase in the doping concentration leads to a faster energy
migration through the material, making the chance of meeting a quenching site higher. For
reasons of cross-relaxation and energy migration, high doping concentrations often lead to a
decrease in luminescence intensity and luminescence lifetime.
Eu3+
7F0
7F1
7F3
7F4
7F5
7F6
5D0
5D1
Eu3+ Pr3+
3H4
3H6
3H5
3F2
3F3
3F4
1G4
1D2
3P0
3P1
1I6
3P2
Pr3+ Figure 2.2: Cross-relaxation processes in Eu3+ and Pr3+.
2.3.4 Up-conversion
Up-conversion is a process in which an excited state of a lanthanide ion is promoted to a
higher energy level by the absorption of another photon or by cross-relaxation between two
excited states. Up-conversion materials are of interest for the generation of high energy, blue or
UV- emitting lasers that are pumped with low cost red or near-infrared pump lasers. Up-
conversion phenomena can be found in most lanthanide ions using the appropriate conditions
like the right pumping wavelengths and the right host materials. Up-conversion can also reduce
13
the efficiency of lasers and amplifiers, when the desired excited state is depleted by cross-
relaxation or excited state absorption. Up-conversion by cross-relaxation can be the gain limiting
factor in Er3+-doped amplifiers with a high concentration of Er3+ ions.23 This up-conversion
process can clearly be seen by the green light emitted from the amplifier under NIR light
pumping. For this reason the concentration of Er3+ ions in an amplifier has to be low, resulting in
very long amplifiers to achieve sufficient gain.
2.4 Lanthanide luminescence in inorganic materials
The luminescence in inorganic materials is generally characterized by high quantum yields
and therefore long luminescence lifetimes. There are, however, circumstances where the
quantum yields of these inorganic materials are lowered. For the visible emitting ions high
quantum yields can be reached in almost all inorganic materials as long as the purity is good and
water can be excluded form the material. Recently, interest for long wavelength lasers in the
near- and mid-infrared has focused the attention on lanthanide ions that emit between 1.5-5 µm.
These lasers could have applications as surgical instruments, and as eye safe lasers. Ions that are
of interest for emission in this region are Ho3+ at 2 µm24 and 2.9 µm,25 and Er3+ at 2.7 µm26 and
3.5 µm.27 For emission at these wavelengths, the separation between the energy levels becomes
so small that the vibrational energies of the inorganic materials can also quench the
luminescence. In order to observe efficient lanthanide luminescence at these wavelengths,
materials with low phonon energies have to be used. A summary of some widely used inorganic
materials with their phonon energies is given in Table 2.2. Silica glass fibers are mostly used for
optical telecommunication, but this material has relatively high phonon energies. This means that
some of the optical transitions of lanthanide ions are quenched by multi-phonon relaxation.
When quenching occurs other glasses are used, like fluoride and chalcogenide glasses. The
materials used for lanthanide luminescence can be divided in two main groups, glasses and
crystals. Crystals are especially important for solid state lasers, for example Nd:YAG crystals for
a solid state laser operating at 1064 nm.28 Crystals were also important for the determination of
the luminescence properties of lanthanide ions. In crystals, the Ln3+ ions can exist in a single
well-defined crystal site. In this way the emission and absorption spectra of the lanthanide ions
can be related to the symmetry of the crystal site and important information can be obtained
about the energy of the levels.
14
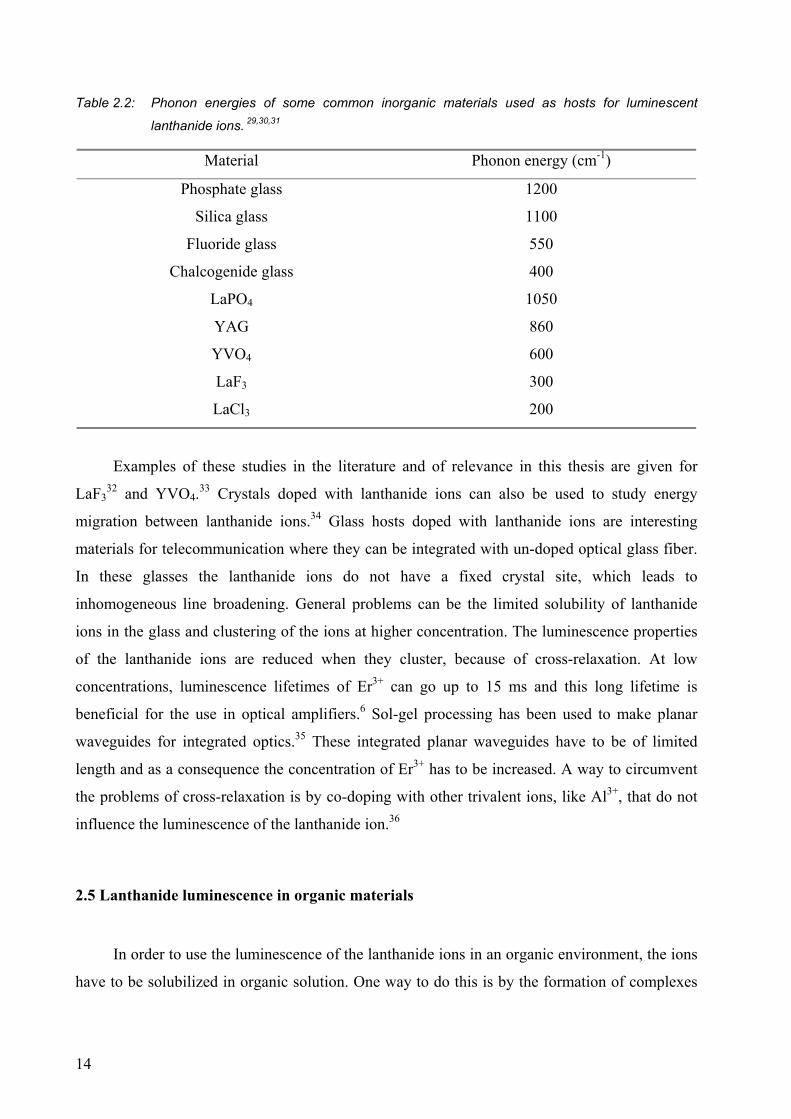
Table 2.2: Phonon energies of some common inorganic materials used as hosts for luminescent
lanthanide ions. 29,30,31
Material Phonon energy (cm-1)
Phosphate glass 1200
Silica glass 1100
Fluoride glass 550
Chalcogenide glass 400
LaPO4 1050
YAG 860
YVO4 600
LaF3 300
LaCl3 200
Examples of these studies in the literature and of relevance in this thesis are given for
LaF332 and YVO4.33 Crystals doped with lanthanide ions can also be used to study energy
migration between lanthanide ions.34 Glass hosts doped with lanthanide ions are interesting
materials for telecommunication where they can be integrated with un-doped optical glass fiber.
In these glasses the lanthanide ions do not have a fixed crystal site, which leads to
inhomogeneous line broadening. General problems can be the limited solubility of lanthanide
ions in the glass and clustering of the ions at higher concentration. The luminescence properties
of the lanthanide ions are reduced when they cluster, because of cross-relaxation. At low
concentrations, luminescence lifetimes of Er3+ can go up to 15 ms and this long lifetime is
beneficial for the use in optical amplifiers.6 Sol-gel processing has been used to make planar
waveguides for integrated optics.35 These integrated planar waveguides have to be of limited
length and as a consequence the concentration of Er3+ has to be increased. A way to circumvent
the problems of cross-relaxation is by co-doping with other trivalent ions, like Al3+, that do not
influence the luminescence of the lanthanide ion.36
2.5 Lanthanide luminescence in organic materials
In order to use the luminescence of the lanthanide ions in an organic environment, the ions
have to be solubilized in organic solution. One way to do this is by the formation of complexes
15
with organic ligands. Charged ligands can compensate for the charge of the lanthanide ions and
the organic groups on the ligand give the complex solubility in organic solvents and polymers.37
A general problem of the use of lanthanide complexes is that the organic groups are close
to the lanthanide ion. This close proximity of organic groups leads to efficient quenching of the
excited lanthanide ions, especially for the NIR-emitting ions. In our group, lanthanide complexes
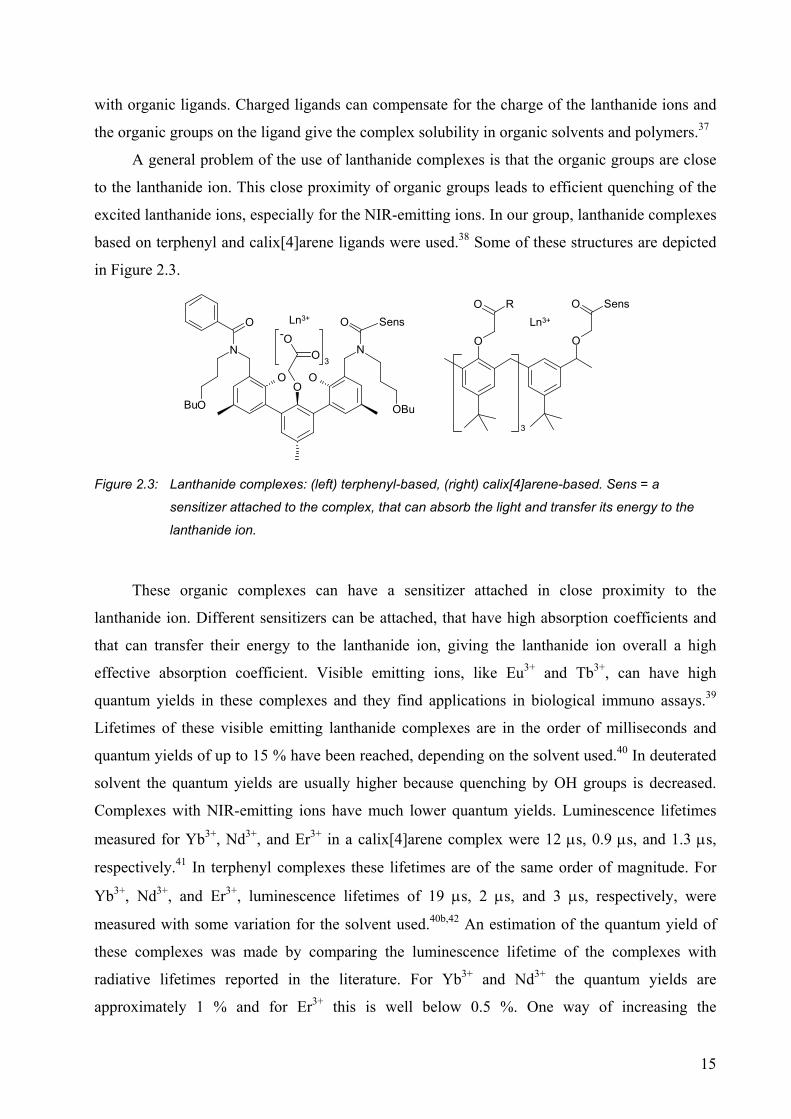
based on terphenyl and calix[4]arene ligands were used.38 Some of these structures are depicted
in Figure 2.3.
3
O
RO
O
O Sens
OO O
N N
O
O O SensO
O 3
OBu
-
Bu
Ln3+ Ln3+
Figure 2.3: Lanthanide complexes: (left) terphenyl-based, (right) calix[4]arene-based. Sens = a
sensitizer attached to the complex, that can absorb the light and transfer its energy to the
lanthanide ion.
These organic complexes can have a sensitizer attached in close proximity to the
lanthanide ion. Different sensitizers can be attached, that have high absorption coefficients and
that can transfer their energy to the lanthanide ion, giving the lanthanide ion overall a high
effective absorption coefficient. Visible emitting ions, like Eu3+ and Tb3+, can have high
quantum yields in these complexes and they find applications in biological immuno assays.39
Lifetimes of these visible emitting lanthanide complexes are in the order of milliseconds and
quantum yields of up to 15 % have been reached, depending on the solvent used.40 In deuterated
solvent the quantum yields are usually higher because quenching by OH groups is decreased.
Complexes with NIR-emitting ions have much lower quantum yields. Luminescence lifetimes
measured for Yb3+, Nd3+, and Er3+ in a calix[4]arene complex were 12 µs, 0.9 µs, and 1.3 µs,
respectively.41 In terphenyl complexes these lifetimes are of the same order of magnitude. For
Yb3+, Nd3+, and Er3+, luminescence lifetimes of 19 µs, 2 µs, and 3 µs, respectively, were
measured with some variation for the solvent used.40b,42 An estimation of the quantum yield of
these complexes was made by comparing the luminescence lifetime of the complexes with
radiative lifetimes reported in the literature. For Yb3+ and Nd3+ the quantum yields are
approximately 1 % and for Er3+ this is well below 0.5 %. One way of increasing the

16
luminescence lifetime of the NIR-emitting ions in organic complexes is by decreasing the
vibrational energies of the organic bonds that are in close proximity to the lanthanide ions by
deuteration,43 or fluorination44 of the ligand. Deuteration of the terphenyl ligand gave a 2-3 fold
increase in the luminescence lifetime of the three NIR-emitting ions.45 Other groups have also
used deuteration and fluorination of the organic ligands in order to increase the luminescence
lifetime of the lanthanide ions.10,46 The lifetimes of important ions like Nd3+ and Er3+ are still
only several microseconds and for other ions like Pr3+, Ho3+ and Tm3+ it is very difficult to
observe NIR luminescence in organic systems.
In order to reduce quenching of the lanthanide ion by the organic groups, the distance
between the excited lanthanide ion and the organic environment has to be increased. A possible
way to do this is by doping the lanthanide ion in the core of an inorganic nanoparticle that is
stabilized by organic ligands. In these nanoparticles the lanthanide ion is in an environment that
could give all the advantages of lanthanide luminescence in an inorganic environment, but with
the solubility in organic solvent, because of the adsorbed organic monolayer.
2.6 Nanoparticles
2.6.1 Synthesis of nanoparticles in organic solution
Colloidal gold was prepared for the first time by M. Faraday in 1857 and the properties of
this nanosized material have been studied since then.47 Aqueous solutions containing silver and
gold nanoparticles have been used to coat various substrates with thin films of metals. Control
over the size and the size distribution of the nanoparticles have been important subjects in
nanoparticle research. Control over the size of the nanoparticles is important, because the
properties of the nanoparticles are strongly dependent on the size. Most nanoparticle solutions
are prepared in aqueous phases and stabilization of the nanoparticles is usually achieved by
surface charges on the nanoparticles that keep them separated from each other. In this way,
aggregation of the particles into insoluble large aggregates is prevented. A good method to
synthesize relatively mono-disperse gold nanoparticles in water has been described using citrate
as a reducing agent and as a stabilizer.48 The synthesis of nanoparticles that are soluble in
organic solvents became an important subject of research after the synthesis of CdSe
nanoparticles by Bawendi et al.49 and the synthesis of gold nanoparticles by Brust et al.50 These
nanoparticles are stabilized by organic ligands that have a coordinating group that binds to the
nanoparticle surface and bulky organic tails that separate the particles. A schematic picture of
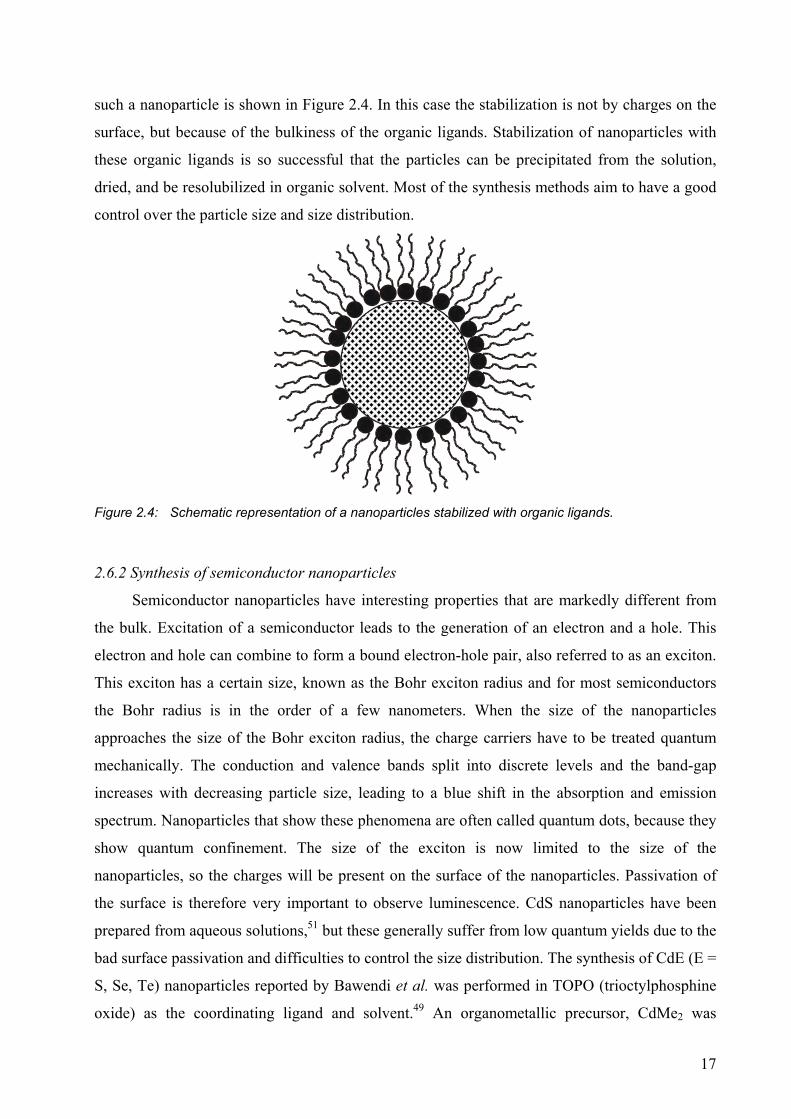
17
such a nanoparticle is shown in Figure 2.4. In this case the stabilization is not by charges on the
surface, but because of the bulkiness of the organic ligands. Stabilization of nanoparticles with
these organic ligands is so successful that the particles can be precipitated from the solution,
dried, and be resolubilized in organic solvent. Most of the synthesis methods aim to have a good
control over the particle size and size distribution.
Figure 2.4: Schematic representation of a nanoparticles stabilized with organic ligands.
2.6.2 Synthesis of semiconductor nanoparticles
Semiconductor nanoparticles have interesting properties that are markedly different from
the bulk. Excitation of a semiconductor leads to the generation of an electron and a hole. This
electron and hole can combine to form a bound electron-hole pair, also referred to as an exciton.
This exciton has a certain size, known as the Bohr exciton radius and for most semiconductors
the Bohr radius is in the order of a few nanometers. When the size of the nanoparticles
approaches the size of the Bohr exciton radius, the charge carriers have to be treated quantum
mechanically. The conduction and valence bands split into discrete levels and the band-gap
increases with decreasing particle size, leading to a blue shift in the absorption and emission
spectrum. Nanoparticles that show these phenomena are often called quantum dots, because they
show quantum confinement. The size of the exciton is now limited to the size of the
nanoparticles, so the charges will be present on the surface of the nanoparticles. Passivation of
the surface is therefore very important to observe luminescence. CdS nanoparticles have been
prepared from aqueous solutions,51 but these generally suffer from low quantum yields due to the
bad surface passivation and difficulties to control the size distribution. The synthesis of CdE (E =
S, Se, Te) nanoparticles reported by Bawendi et al. was performed in TOPO (trioctylphosphine
oxide) as the coordinating ligand and solvent.49 An organometallic precursor, CdMe2 was
18
injected into a hot solution of TOPO together with a chalcogenide source in the form of TOP(E)
or bis(trimethylsilyl)E (E = S, Se, Te). Decomposition of these precursors leads to the growth of
nanoparticles. The reaction temperature and the reaction time determine the size of the
nanoparticles. This procedure yields nanoparticles that can be isolated, dried, and re-dispersed in
organic solvents and with a relatively high luminescence quantum yield. Improvements in the
reactants and coordinating solvents followed later. The highly toxic and air sensitive CdMe2
could be replaced by CdO without changing the optical properties of the nanoparticles.52 The
introduction of other coordinating ligands like stearic acid and hexadecyl amine together with
TOPO resulted in even better control over the nanoparticles growth and size distribution.53 With
the addition of hexylphosphonic acid not only control over the size of the nanoparticles, but
shape control could also be obtained.54 The stronger binding of this ligand to the particles surface
gave rod-like nanoparticles when the concentration was as low as 5 %. The phosphonic acid
ligand slows down the reaction rate and as a result the concentration of reactive monomer is high
which leads to a preferential growth of one of the crystal surfaces and using this ligand even
arrows, teardrop, and branched-tetrapod structures could be prepared.55 Semiconductor
nanoparticles of different materials have been synthesized and with their different bandgaps and
sizes the emissions can be tuned from the blue till the NIR. Some of these materials are
summarized in Table 2.3.
Table 2.3: Semiconductor nanoparticles with emissions at different wavelengths.
Semiconductor Wavelength region (nm) Reference
ZnSe 370-420 56
CdS 400-450 52a
CdSe 450-650 53b
CdTe 520-700 57
HgTe 800-1700 58
PbS 1000-1600 59
PbSe 1200-2000 60
With these semiconductor nanoparticles the telecommunication window can also be
completely covered, but these particles have a drawback in comparison with lanthanide ions and
that is the short luminescence lifetime. The lifetime of these particles ranges from several
nanoseconds up to 1 µs, making it more difficult to create a population inversion. Despite this
19
drawback, optical gain of CdSe nanoparticles has been reported for a close packed crystal.61 The
termination of the surface is very important to obtain nanoparticles with high quantum yields. A
large fraction of the atoms is located at the surface and these atoms are not all fully coordinated.
The exciton is located at the surface most of the time due to the reduced size of the nanoparticles
and thus quenching at the surface generally plays an important role. The use of strongly
coordinating groups to the surface of the nanoparticles can decrease the non-radiative effects and
high quantum yields can be obtained under certain circumstances. The quantum yield of the
nanoparticles could be improved significantly when the surface is coated with an inorganic shell.
These core-shell particles consist of a core of small band-gap semiconductor surrounded by a
shell of larger band-gap semiconductor.62 In these core-shell nanoparticles, the hole is confined
to the core of the particles while the electron can travel over the whole particle. Because of the
absence of the hole at the particles surface the quantum yields could be increased up to 80 %.
Examples of these core-shell particles are CdSe/ZnSe,63 CdSe/ZnS,64 HgTe/CdS65, and
InP/ZnS66, but many more examples can be given.
2.6.3 Synthesis of metal nanoparticles
Gold nanoparticles synthesized by Brust et al. were made in a two phase system. To a
solution of HAuCl4 in water, a toluene solution of the phase-transfer agent tetraoctylammonium
bromide and a thiol as the ligand, was added.50 The gold ions transfer to the organic phase where
they are reduced by the addition of sodium borohydride in the aqueous phase, leading to the
formation of gold nanoparticles. The size of the particles can be controlled to some extent by the
ratio of thiol ligand to gold ions, but the size distribution of the particles is generally large.
Improvements in the synthesis method have lead nanoparticles with a narrower size distribution.
The synthesis of other metal nanoparticles, like Ag, Pd, and Pt nanoparticles has been described,
using similar methods.67 A special class of metal nanoparticles that gained considerable interest
are magnetic nanoparticles. Nanoparticles with a sufficiently narrow size distribution
spontaneously form 2D superlattices that could have applications in magnetic data storage.
Several procedures have been described to produce mono-disperse nanoparticles of Co68 and
FePt.69 These usually involve high boiling point solvents together with a coordinating ligand,
like oleic acid.
2.6.4 Lanthanide-doped nanoparticles
Several procedures have been described for the synthesis of lanthanide-doped
nanoparticles and novel properties of the luminescence of lanthanide ions in these nanoscale
20
materials have been reported. Most lanthanide-doped nanoparticles are made via high
temperature procedures leading to small crystallites without any surface capping. Particles of
Y2O3:Eu70 and Y2SiO5:Eu71 have been prepared at temperatures of 1000 °C and more. These
nanoparticles are not soluble in organic solvents, because they lack the solubilizing surface
groups, but due to an enlarged surface area and small domain of the crystal itself, different
properties compared to the bulk materials are observed. First of all, the emission lines in
nanocrystalline materials show extra inhomogeneous broadening.72 Not all crystal sites are the
same, especially due to the enormous increase in surface sites compared to bulk sites. The
increase in surface area was found to be an advantage for Y2O3:Eu nanoparticles excited with
cathode rays.73 The synthesized nanocrystalline materials have a much better surface termination
than the powdered bulk material leading to higher luminescence efficiency. A blue shift in the
peak emission wavelength when decreasing the particle size was also reported for Y2O3
nanoparticles doped with Eu3+.70b Y2O2S nanoparticles doped with Er3+ showed a population of
the energy levels that was only observed in nanocrystalline materials and not in the bulk.74 Laser
excitation of the Er3+ ions in nanocrystals at a temperature below 7 K, leads to a saturation of the
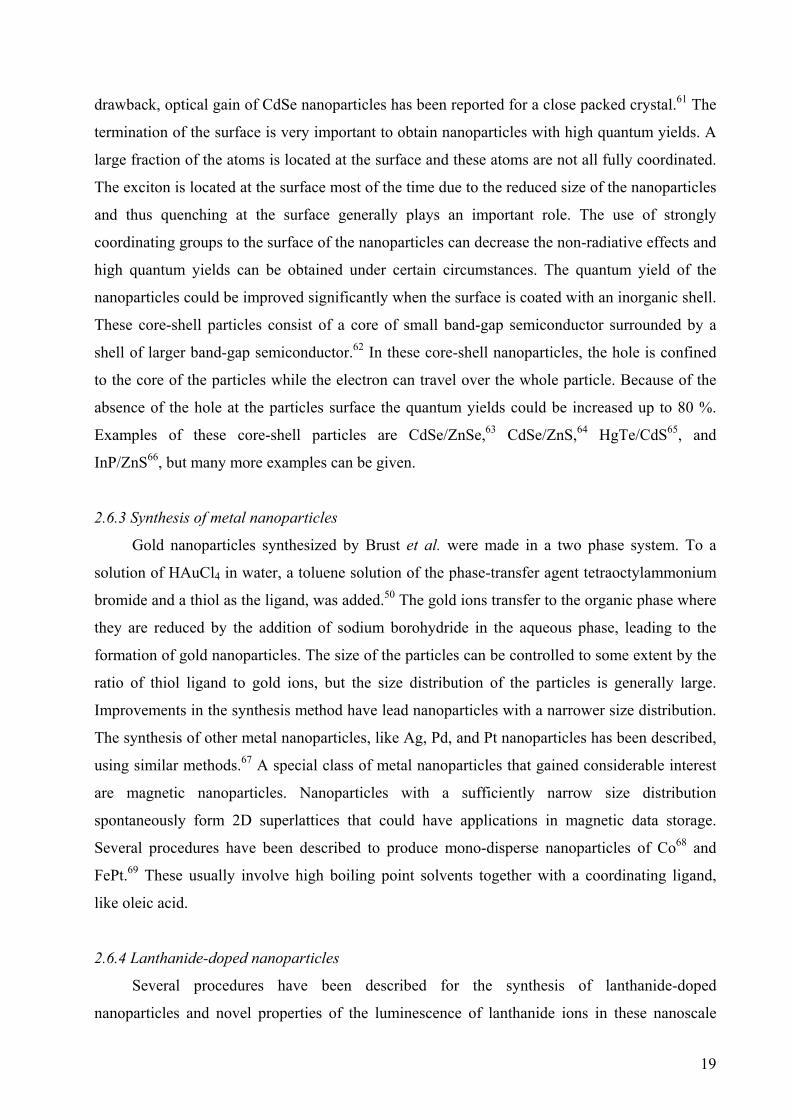
levels just above the ground state. Figure 2.5 shows a schematic and simplified excitation
spectrum of Er3+ emission in bulk and nanocrystalline Y2O2S at 2.6 K.
02345
210
410
20333
123
456
78
a
Bulk
Nano
20333203102028820123
E (cm )-1
Exc
itat
ion
inte
nsit
y
Figure 2.5: Schematic excitation spectrum of Y2O2S:Er nanoparticles and bulk Y2O2S:Er at 7 K.
The excitation spectrum of the bulk material only shows a single line at 20,333 cm-1 from
the absorption of the lowest level of the ground state to level a of the excited state. In the
nanocrystals absorptions from level 2, 3, 4, and 5 were also observed in the excitation spectrum
of the Er3+ emission. At low temperatures, the levels just above the ground state become
21
populated, because after excitation the ion does not fully decay to the ground state. The
explanation that was given for this behavior is the absence of the very small phonon energies in
nanocrystals because of the “ending” character of the crystal domain. The vibrational modes in a
nanocrystal become discrete and are no longer band-like as in bulk materials. In bulk materials
the higher levels of the ground state decay very rapidly to the lowest level even at low
temperatures. A similar effect was found for Eu2O3 nanoparticles.75 A lot of energy transfer
processes rely on the matching of the energy levels by the uptake or emission of low energy
phonons. The absence of low energy phonons can have a significant effect on efficiency of
energy transfer processes in nanoparticles.76
The symmetry of the lanthanide site can also be changed in nanocrystalline materials.77
Decreasing the size of YBO3:Eu nanoparticles lead to an increase of the 5D0→7F2 emission peak
compared to the other emission lines indicating that the symmetry around the Eu3+ ion is
lowered. A similar effect was found for 14 nm sized YVO4:Eu particles.78 These nanoparticles
were excited using a narrow laser line and the excitation wavelength was slowly scanned over an
absorption peak. Different Eu3+ sites with different site symmetries and corresponding different
luminescence lifetimes were found. The sites with decreased site symmetry were attributed to
surface sites, so the lower lifetimes are found at the nanoparticle surface. Lanthanide-doped
nanoparticles also offer the possibility to change the environment around the lanthanide ion,
while keeping the lanthanide ion in the same crystal site. This proved to be valuable in the
determination of the influence of the refractive index on the luminescence lifetime. The
influence of the refractive index on the luminescence lifetime of Eu3+ organic complexes was
studied by varying the solvent in which the complex was dissolved.79 In these complexes special
care has to be taken that the coordination of the lanthanide is not changed when changing the
solvent. In nanoparticles, the ions are doped inside the crystal and local coordination of the ion is
not changed when varying the solvent. Y2O3:Eu particles showed a correlation between the
refractive index and the luminescence lifetime of the Eu3+ ion, when the particles were dispersed
in different environments.80
Lanthanide-doped nanoparticles that are soluble in solvents that form optically clear
solutions have also been reported. YVO4:Eu nanoparticles were synthesized by a precipitation
from aqueous solution using different stabilizing groups, like sodium hexametaphosphate,81
citrate82, or by adjusting the pH.83 These particles are soluble in water and show strong Eu3+
luminescence. Due to the sensitivity of the Eu3+ ion on the symmetry of the environment it can
clearly be seen from the emission spectrum that the ion is doped in the same site as in the bulk

22
material. The Eu3+ ion is in an Y3+ crystal site giving the Eu3+ ion D2d symmetry. YVO4:Eu is a
well-known phosphor that was used in cathode ray tubes before it was replaced by the more
efficient Y2O2S:Eu phosphor. YVO4:Eu particles can be excited in the UV where the VO4 groups
have a charge transfer band, caused by a ligand to metal charge transfer in the V-O bond. The
VO4 groups can transfer their excitation energy to the Eu3+ ions leading to 4f line emission of the
lanthanide ion. The energy transfer processes in these nanoparticles have been studied by
temperature-dependent spectroscopy and luminescence lifetime studies.84 It was concluded that
energy transfer to Eu3+ occurs only from VO4 groups adjacent to the Eu3+ center and that
quenching of the excited VO4 groups at the surface of the particles is the main reason for the low
quantum yield of 15 %. The quantum yield was later improved by the transfer of the
nanoparticles in D2O and by the growth of a silicate shell around the nanoparticles.85 Quenching
of these nanoparticles could be studied by varying the concentration of Eu3+ in the nanoparticles.
The best quantum yields were observed when the concentration of Eu3+ was 5 %, but when
surface quenching was an important process the highest quantum yields were observed at a
higher Eu3+ content. Silicate coated nanoparticles with the highest quantum yield had a Eu3+
concentration of around 5 %, close to the value for bulk YVO4:Eu, indicating that surface
quenching is strongly reduced in these nanoparticles.
Haase et al. synthesized nanoparticles of LaPO4 doped with Eu3+ or with the combination
Ce3+ and Tb3+ in coordinating organic solvents86,87 and via a hydrothermal procedure.88 The
nanoparticles synthesized in the coordinating solvent tris(ethylhexyl)phosphate are soluble in
polar organic solvents like DMF and DMSO. After the addition of some tetraalkylammonium
hydroxide they are also soluble in methanol. From the emission spectrum of Eu3+-doped particles
it could be concluded that the Eu3+ ion is inside the particle, because of the similarity with the
bulk spectrum. The Eu3+ ions can be excited in the UV (260 nm) via a charge-transfer band
originating from the Eu-O bond. In the Ce3+ and Tb3+ particles the Ce3+ ions acts as a sensitizer
for the Tb3+ emission, because Ce3+ has an allowed 4f-5d transition in the UV (at ≈ 274 nm).
This allowed transition has a high absorption coefficient and the quantum yield of particles
doped with this ion could be determined. The emission spectrum of the particles consists of Ce3+
emission in the UV, and Tb3+ emission in the green. The quantum yield was up to 42 % for only
the Tb3+ emission and 61 % if also the Ce3+ emission was taken into account. This value is
among the highest quantum yields for organically capped nanoparticles. The luminescence
decays of Eu3+- and Tb3+-doped nanoparticles were not mono-exponential and a model to fit the
luminescence decay was described. This model takes into account quenching from randomly
distributed quenchers inside the nanoparticles. The luminescence lifetimes for both ions are
23
several milliseconds. Recently, the luminescence of Er3+-doped LuPO4 co-doped with Yb3+ was
reported.89 Energy transfer from Yb3+ to the Er3+ ion was demonstrated and in another
publication energy transfer from Yb3+ was used to obtain up-conversion luminescence of Er3+
and Tm3+ in a nanoparticle solution, which demonstrates the good shielding of the lanthanide
ions in these nanoparticles.90
Synthesis of these YVO4 and LaPO4 nanoparticles solutions were performed at relatively
low temperatures compared to the synthesis of the bulk powders, but the particles are still highly
crystalline and show similar spectroscopic properties as the bulk materials.91
2.6.5 Lanthanide ions in semiconductor nanoparticles
The shielding of lanthanide ions could be achieved by doping them in the core of nanoparticles
and as a result the luminescence properties of the ions in an organic environment could be
improved. Semiconductor nanoparticles have the advantage of high molar absorption coefficients
and the possibility to excite them with charge carriers generated by electricity. Doping of
lanthanide ions in semiconductor nanoparticles could have enormous advantages over the doping
in nanoparticles of isolator host materials. Energy transfer from the semiconductor host to the
lanthanide ion would have the advantage of a broad excitation band for photo-excitation and
offer the possibility of electroluminescence of the lanthanide ion. At the same time the
lanthanide ion is shielded from the organic environment. Energy transfer from semiconductor
nanoparticles to lanthanide ions has been reported in a large number of publications. The best-
known example is the energy transfer of silicon nanoparticles to Er3+ ions doped in silicon-
enriched SiO2 waveguides.92 Energy transfer of other semiconductor nanoparticles to other
lanthanide ions is also described, like from CdS to Eu3+ and SnO2 to Eu3+.93,94 These examples
are all in solid state glasses or sol-gel derived samples. Reports about the doping of lanthanide
ions in nanoparticles passivated by organic ligands have also appeared. The doping of Tb3+ ions
in ZnS nanoparticles was described in several papers.95 Okamoto et al. reported luminescence
studies on CdS doped with Eu3+,96 and ZnS doped with Eu3+ was reported by Qu et al.97 The
results of these studies have been under discussion lately when Bol et al. tried to reproduce the
results.98 They conclude that the lanthanide ions are not incorporated in the nanoparticles, but
probably adsorbed at the surface. The excitation spectra of their reaction products are dominated
by the 4f absorption bands of the lanthanide ions as proof that no energy transfer takes place
from the semiconductor host to the lanthanide ion.
24
2.6.6 Synthesis of mono-disperse nanoparticles
It is important to control the size and size distribution of the nanoparticles during the
synthesis. The properties of nanoparticles strongly depend on the size and therefore mono-
disperse nanoparticle solutions are necessary to study the size-dependent properties. Mono-
disperse nanoparticle solutions are also necessary to control the organization on substrates or in
3D space.99 Control of the size and size distribution of nanoparticles during the synthesis can be
obtained by confinement in tight cavities, like zeolites, dendrimers, or reversed micelles. In
reversed micelles the size of the water pools can be controlled, and with the size of the water
pools the size of the nanoparticles.100 In coordinating solvents the size distribution of
semiconductor nanoparticles is kept low by fast injection of the precursors. A rapid injection of
the precursor leads to the formation of a high concentration of monomer and to a fast growth of
nanoparticles with a small size distribution. When the reaction proceeds, the monomer
concentration becomes lower due to the reaction and an increase in size distribution is observed.
Narrow size distributions can be obtained by maintaining a high monomer concentration as was
stated in the theory “focusing of the size distribution”.101 Another mechanism for lowering the
size distribution is by Ostwaldt ripening. In this mechanism the larger particles grow by
consuming the smaller particles, because the smaller particles have a larger surface area making
them less stable.102 This theory was demonstrated with the synthesis of mono-disperse gold
nanoparticles by heating preformed gold nanoparticles in a surfactant mixture.103 The heating
lead to a narrowing of the size distribution and an increase of the size from 2 to 5 nm. This is
apparently the most stable size under these conditions, because starting with larger nanoparticles
also results in nanoparticles with a size of 5 nm and a relatively narrow size distribution.104 The
desired size distribution is not in all cases obtained directly after the synthesis and the most
popular method to decrease the size distribution of a nanoparticle solution is by size-selective
precipitation. In this procedure, the nanoparticles are in a solution and a non-solvent is slowly
added to the solution until a precipitate starts to form. This precipitate should consist of the
largest particles, because these have the largest surface area and are the first to destabilize in
solution. This method is time consuming, because it often has to be repeated several times and
the yield of the desired size is very low.
25
2.7 Optical amplifiers
Optical amplifiers consist of a waveguide in which optical signals can be amplified without
the conversion to an electrical signal.105 These amplifiers are of technological importance,
because of the fast amplification and because they allow for the simultaneous amplification of
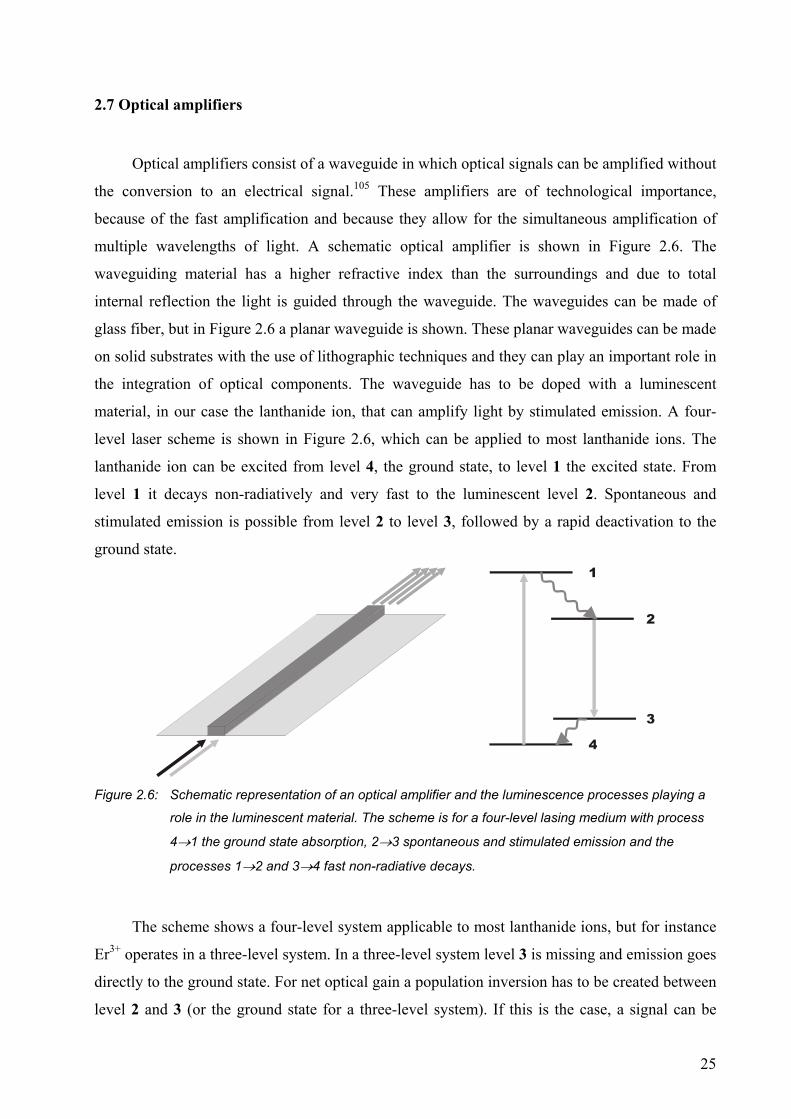
multiple wavelengths of light. A schematic optical amplifier is shown in Figure 2.6. The
waveguiding material has a higher refractive index than the surroundings and due to total
internal reflection the light is guided through the waveguide. The waveguides can be made of
glass fiber, but in Figure 2.6 a planar waveguide is shown. These planar waveguides can be made
on solid substrates with the use of lithographic techniques and they can play an important role in
the integration of optical components. The waveguide has to be doped with a luminescent
material, in our case the lanthanide ion, that can amplify light by stimulated emission. A four-
level laser scheme is shown in Figure 2.6, which can be applied to most lanthanide ions. The
lanthanide ion can be excited from level 4, the ground state, to level 1 the excited state. From
level 1 it decays non-radiatively and very fast to the luminescent level 2. Spontaneous and
stimulated emission is possible from level 2 to level 3, followed by a rapid deactivation to the
ground state. 1
2
3
4
Figure 2.6: Schematic representation of an optical amplifier and the luminescence processes playing a
role in the luminescent material. The scheme is for a four-level lasing medium with process
4→1 the ground state absorption, 2→3 spontaneous and stimulated emission and the
processes 1→2 and 3→4 fast non-radiative decays.
The scheme shows a four-level system applicable to most lanthanide ions, but for instance
Er3+ operates in a three-level system. In a three-level system level 3 is missing and emission goes
directly to the ground state. For net optical gain a population inversion has to be created between
level 2 and 3 (or the ground state for a three-level system). If this is the case, a signal can be
26
amplified by stimulated emission resulting in more photons with the same frequency, the same
phase, and the same direction. A long living level 2 (long luminescence lifetime) is beneficial to
reduce the pumping power, because with a long luminescence lifetime it takes less pump power
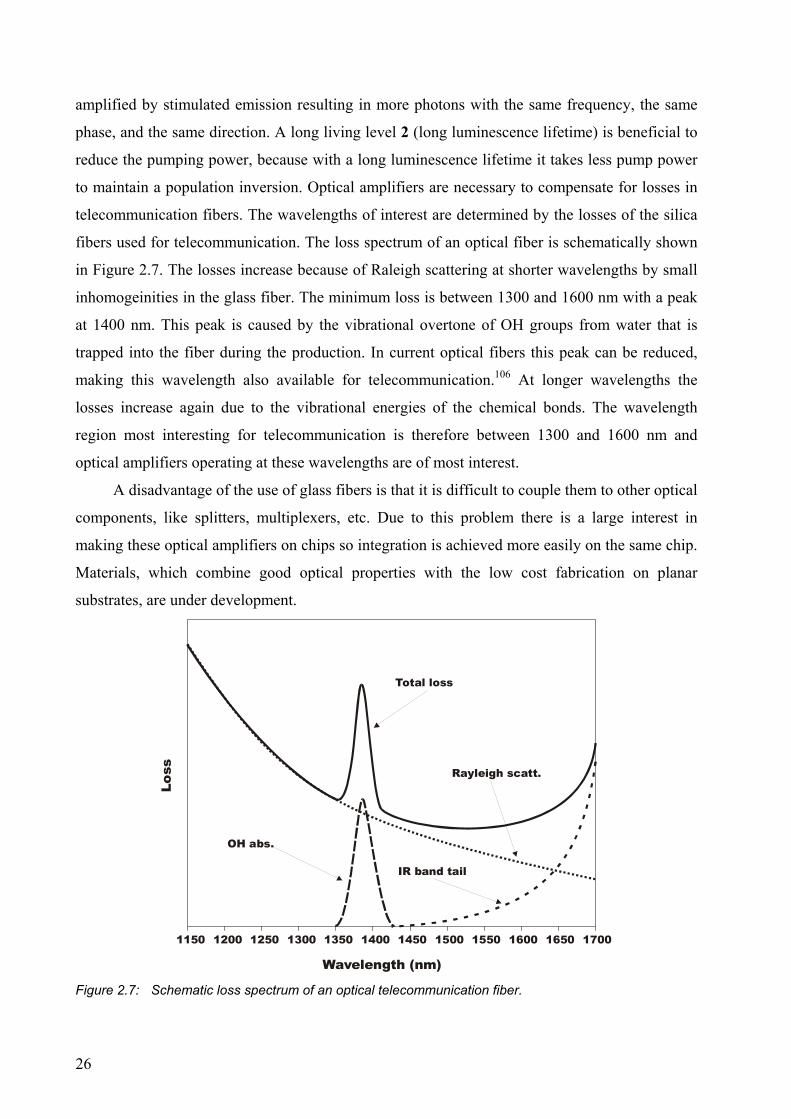
to maintain a population inversion. Optical amplifiers are necessary to compensate for losses in
telecommunication fibers. The wavelengths of interest are determined by the losses of the silica
fibers used for telecommunication. The loss spectrum of an optical fiber is schematically shown
in Figure 2.7. The losses increase because of Raleigh scattering at shorter wavelengths by small
inhomogeinities in the glass fiber. The minimum loss is between 1300 and 1600 nm with a peak
at 1400 nm. This peak is caused by the vibrational overtone of OH groups from water that is
trapped into the fiber during the production. In current optical fibers this peak can be reduced,
making this wavelength also available for telecommunication.106 At longer wavelengths the
losses increase again due to the vibrational energies of the chemical bonds. The wavelength
region most interesting for telecommunication is therefore between 1300 and 1600 nm and
optical amplifiers operating at these wavelengths are of most interest.
A disadvantage of the use of glass fibers is that it is difficult to couple them to other optical
components, like splitters, multiplexers, etc. Due to this problem there is a large interest in
making these optical amplifiers on chips so integration is achieved more easily on the same chip.
Materials, which combine good optical properties with the low cost fabrication on planar
substrates, are under development.
145014001300125012001150 1500 1550 1600 1650 17001350
Wavelength (nm)
Loss
OH abs.
IR band tail
Rayleigh scatt.
Total loss
Figure 2.7: Schematic loss spectrum of an optical telecommunication fiber.
27
2.7.1 1550 nm fiber amplifiers.
The success of long-range optical telecommunication can, for a large part, be ascribed to
the development of the erbium-doped fiber amplifier (EDFA). These fiber amplifiers operate in
the low loss window around 1550 nm due to the 4I13/2→4I15/2 transition of Er3+. In silica fiber a
large gain of 30-50 dB (1,000-100,000 times signal increase) can be obtained over a 80 nm wide
bandwidth. The amplification wavelengths and bandwidth can be varied slightly by changing the
glass material in which the Er3+ ions are doped. The concentration of Er3+ ions has to be low in
order to prevent cross-relaxation of the Er3+ ions, which would lead to lower efficiency of the
amplifier. Due to the low Er3+ concentration, the amplifier has to be very long (several meters) to
obtain sufficient gain. The Er3+ ion operates in a three-level system and as a result the
transmission wavelength is also an absorption wavelength. For this reason population inversion
has to be complete over the entire length of the amplifier or else signal loss by absorption would
take place.
2.7.2 1300 nm fiber amplifiers.
A lot of optical fibers installed are single mode fibers at 1300 nm, because at 1300 nm
silica fibers have their dispersion minimum. Dispersion leads to a spreading of the optical signal
because the velocity of light is dependent on the wavelength. As a result the best wavelength to
emit signals through a silica fiber would be 1300 nm. The demand for optical amplifiers at this
wavelength is obvious and among the lanthanide ions, Nd3+, Pr3+, and Dy3+ have transitions at
these wavelengths.
The Nd3+ ion was the first lanthanide ion reported, that exhibits optical gain around 1300
nm.107 Nd3+ was an interesting ion at that time, because a lot was known about the luminescence
and the ion generally shows high quantum efficiencies in various hosts. In the same year optical
gain was demonstrated in a ZBLAN (ZrF4-BaF2-LaF3-AlF3-NaF) fiber doped with 1000 ppm
Nd3+.108 A maximum gain of 32 % at 1354 nm was obtained with a pump power of 688 mW at
514 nm. The wavelength of maximum gain was red-shifted compared to the luminescence
maximum, which is caused by excited state absorption. The energy level diagram of Nd3+ is
shown in Figure 2.8. This energy level diagram shows the pumping of Nd3+ at 795 nm to the 4F5/2 level, followed by a rapid decay to the emissive 4F3/2 level. From this level emissions to the 4I9/2 level around 880 nm, to the 4I11/2 level around 1060 nm, and to the 4I13/2 level around 1330
nm are possible. The emissions to the first two levels are generally stronger than emission to the
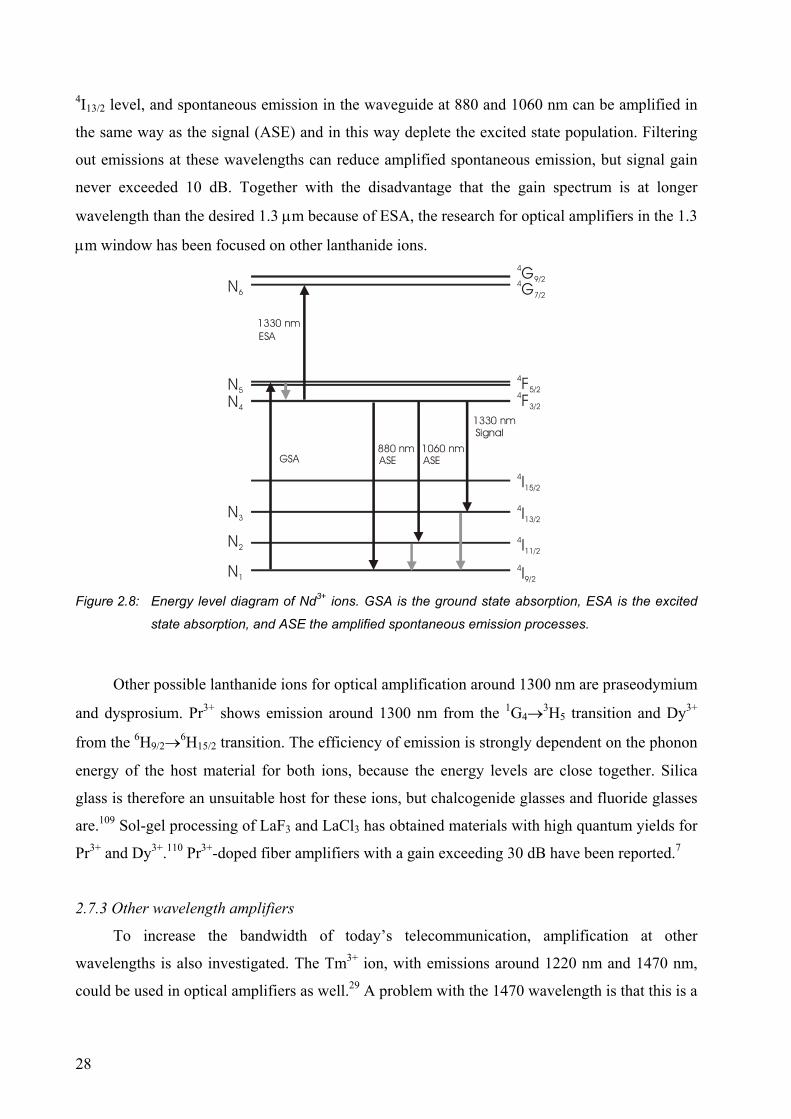
28
4I13/2 level, and spontaneous emission in the waveguide at 880 and 1060 nm can be amplified in
the same way as the signal (ASE) and in this way deplete the excited state population. Filtering
out emissions at these wavelengths can reduce amplified spontaneous emission, but signal gain
never exceeded 10 dB. Together with the disadvantage that the gain spectrum is at longer
wavelength than the desired 1.3 µm because of ESA, the research for optical amplifiers in the 1.3
µm window has been focused on other lanthanide ions.
4I9/2
4I11/2
4I13/2
4I15/2
4F3/2
4F5/2
4G7/2
4G9/2
880 nm 1060 nm
1330 nm
ASE ASE
Signal
ESA1330 nm
N1
N2
N3
N4
N5
N6
GSA
Figure 2.8: Energy level diagram of Nd3+ ions. GSA is the ground state absorption, ESA is the excited
state absorption, and ASE the amplified spontaneous emission processes.
Other possible lanthanide ions for optical amplification around 1300 nm are praseodymium
and dysprosium. Pr3+ shows emission around 1300 nm from the 1G4→3H5 transition and Dy3+
from the 6H9/2→6H15/2 transition. The efficiency of emission is strongly dependent on the phonon
energy of the host material for both ions, because the energy levels are close together. Silica
glass is therefore an unsuitable host for these ions, but chalcogenide glasses and fluoride glasses
are.109 Sol-gel processing of LaF3 and LaCl3 has obtained materials with high quantum yields for
Pr3+ and Dy3+.110 Pr3+-doped fiber amplifiers with a gain exceeding 30 dB have been reported.7
2.7.3 Other wavelength amplifiers
To increase the bandwidth of today’s telecommunication, amplification at other
wavelengths is also investigated. The Tm3+ ion, with emissions around 1220 nm and 1470 nm,
could be used in optical amplifiers as well.29 A problem with the 1470 wavelength is that this is a
29
four-level system of which the lifetime of the upper level is shorter than the lifetime of the lower
level, making it difficult to obtain population inversion. Ways to circumvent this problem is by
up-conversion pumping,111 or the use of Ho3+ co-doping.22 An energy transfer process of Tm3+ to
Ho3+ can decrease the luminescence lifetime of the lower laser level, making it possible to create
population inversion.
2.8 Polymer-based optical amplifiers
Polymers for telecommunication have been prepared with good optical properties needed
at the required wavelengths between 1300 and 1600 nm. Two important factors contributing to
optical losses can be identified; absorption and scattering. The most important factors for the
absorption losses are the overtones of the vibrations of organic bonds in polymers. They can give
rise to absorptions in the telecommunication windows, leading to high losses. Especially CH and
OH bonds commonly found in organic materials have strong absorptions between 1100 and 1700
nm. Some wavelengths of important vibrational overtones are given Table 2.4.112 The strength of
the absorptions decreases about an order of magnitude between each harmonic order. Bonds with
the smallest reduced mass, like CH bonds, have the highest vibrational energies and the third
overtone absorption is around 1200 nm. Polymers with CF bonds only show overtone orders of
5-7 in the telecommunication region and therefore have very low absorptions at these
wavelengths. Partial or complete fluorination of the polymers has often been applied to decrease
the absorption losses.
Scattering losses are another factor contributing to the loss of polymers. Scattering can
occur from differently sized objects and experimental data can be fitted with an empirical law
(Equation 2.2)
αscatter = A + B/λ2 + D/λ4 (Eq. 2.2)
in which A is the contribution of large particles (> λ), B the contribution from
inhomogeneities on the order of λ in size ( Mie scattering), and D the contribution from small
inhomogeneities (< λ, Rayleigh scattering). For the small inhomogeneities, the losses due to
scattering are strongly wavelength dependent, so exclusion of the larger particles from the
polymer by filtering the polymer solutions can strongly reduce scattering at the long
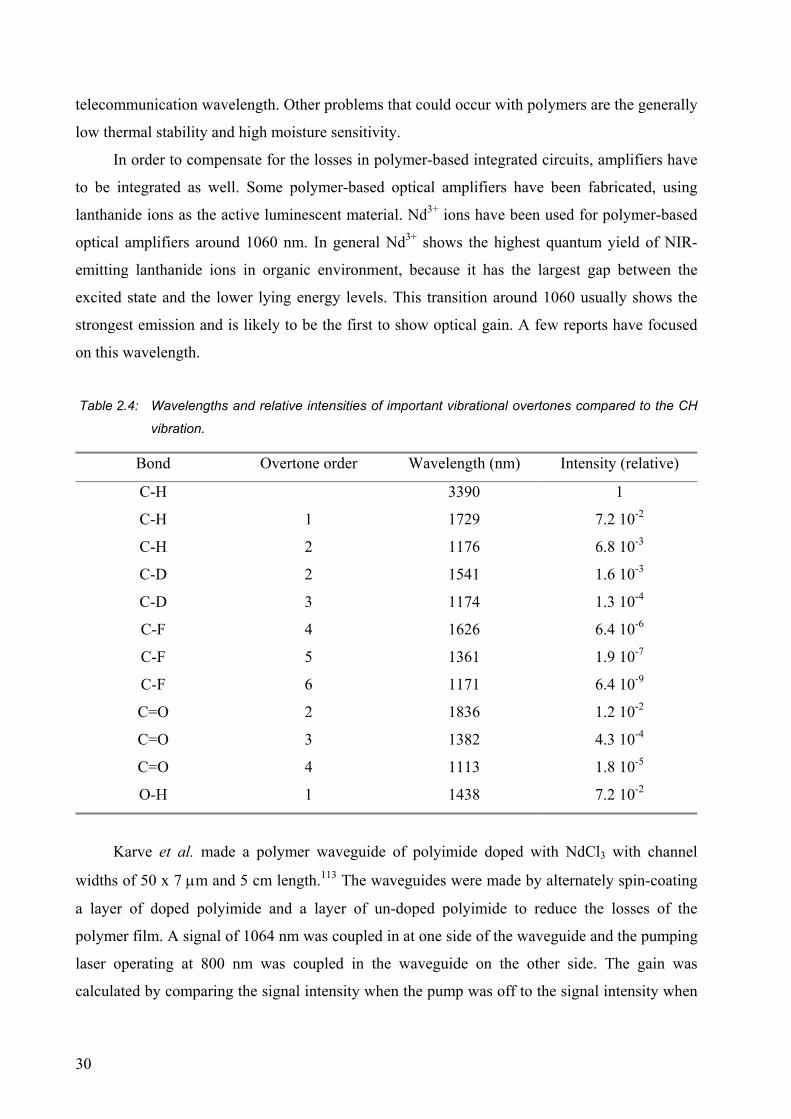
30
telecommunication wavelength. Other problems that could occur with polymers are the generally
low thermal stability and high moisture sensitivity.
In order to compensate for the losses in polymer-based integrated circuits, amplifiers have
to be integrated as well. Some polymer-based optical amplifiers have been fabricated, using
lanthanide ions as the active luminescent material. Nd3+ ions have been used for polymer-based
optical amplifiers around 1060 nm. In general Nd3+ shows the highest quantum yield of NIR-
emitting lanthanide ions in organic environment, because it has the largest gap between the
excited state and the lower lying energy levels. This transition around 1060 usually shows the
strongest emission and is likely to be the first to show optical gain. A few reports have focused
on this wavelength.
Table 2.4: Wavelengths and relative intensities of important vibrational overtones compared to the CH
vibration.
Bond Overtone order Wavelength (nm) Intensity (relative)
C-H 3390 1
C-H 1 1729 7.2 10-2
C-H 2 1176 6.8 10-3
C-D 2 1541 1.6 10-3
C-D 3 1174 1.3 10-4
C-F 4 1626 6.4 10-6
C-F 5 1361 1.9 10-7
C-F 6 1171 6.4 10-9
C=O 2 1836 1.2 10-2
C=O 3 1382 4.3 10-4
C=O 4 1113 1.8 10-5
O-H 1 1438 7.2 10-2
Karve et al. made a polymer waveguide of polyimide doped with NdCl3 with channel
widths of 50 x 7 µm and 5 cm length.113 The waveguides were made by alternately spin-coating
a layer of doped polyimide and a layer of un-doped polyimide to reduce the losses of the
polymer film. A signal of 1064 nm was coupled in at one side of the waveguide and the pumping
laser operating at 800 nm was coupled in the waveguide on the other side. The gain was
calculated by comparing the signal intensity when the pump was off to the signal intensity when
31
the pump was on. With a pump power of 110 mW and a signal power of 90 mW a signal gain of
8 dB was found. An et al. reported optical gain of a photolime gel waveguide doped with NdCl3
and chlorophenol red.114 The pump and signal lasers were coupled into the waveguide using a
prism coupling setup. With a pump power of 50 mW at 796 nm, a maximum gain of 3.8 dB at
1064 nm was obtained. Different polymers of fluorinated polyimides,115 doped with Nd3+
complexes were reported, but no optical gain was reported for these materials. A calculation of
the gain of a polymer-based amplifier with a visible emitting Sm3+ complex was reported by
Koeppen et al.116 For a fiber with a diameter of 1.5 µm, an optical gain of over 20 dB was
calculated at a wavelength of 644 nm. To date, no polymer-based optical amplifiers have been
reported that show gain at the important telecommunication wavelengths.
The use of large colloids in polymer-based amplifiers has been considered. SiO2 colloids
with sizes of 240 and 360 nm have been doped with Er3+ ions by ion implantation.117 These
colloids show a long luminescence lifetime of 17 ms for the Er3+ luminescence and a quantum
yield of 80 % was estimated. Spin-coating of a layer of PMMA over the colloids resulted in a
large reduction of the optical losses, but more careful matching of the refractive index of the
polymer and the SiO2 colloids is necessary for waveguide fabrication. Large Cr3+-doped particles
were also incorporated in a polymer matrix.118 These particles were in the order of 1 µm and the
refractive index of the polymer was closely matched to the index of the particles. Although the
losses of the film were substantial, optical gain at 1.23 µm could be measured. A signal increase
by a factor of 2 was observed at a pump power of 7 W from a Nd:YAG laser operating at 1064
nm.
Recently, amplification of an organic dye at 1.3 µm was reported, by doping the dye in a
sol-gel matrix.119 The emission intensity did not show a linear relationship with the pump power
and an apparent gain of 11 cm-1 was estimated by amplified spontaneous emission measurements
using a one-dimensional amplifier model. Narrowing of the emission band could not be
observed, which was attributed to the small gain.
2.9 Electroluminescence
Electroluminescence is the generation of light directly from electricity by applying a
voltage over a thin layer of luminescent material. Holes are injected at the anode, electrons at the
cathode and due to the applied electric field the holes and electrons travel through the layer. The
holes and electrons can combine to a bound electron-hole pair (exciton) and form an excited
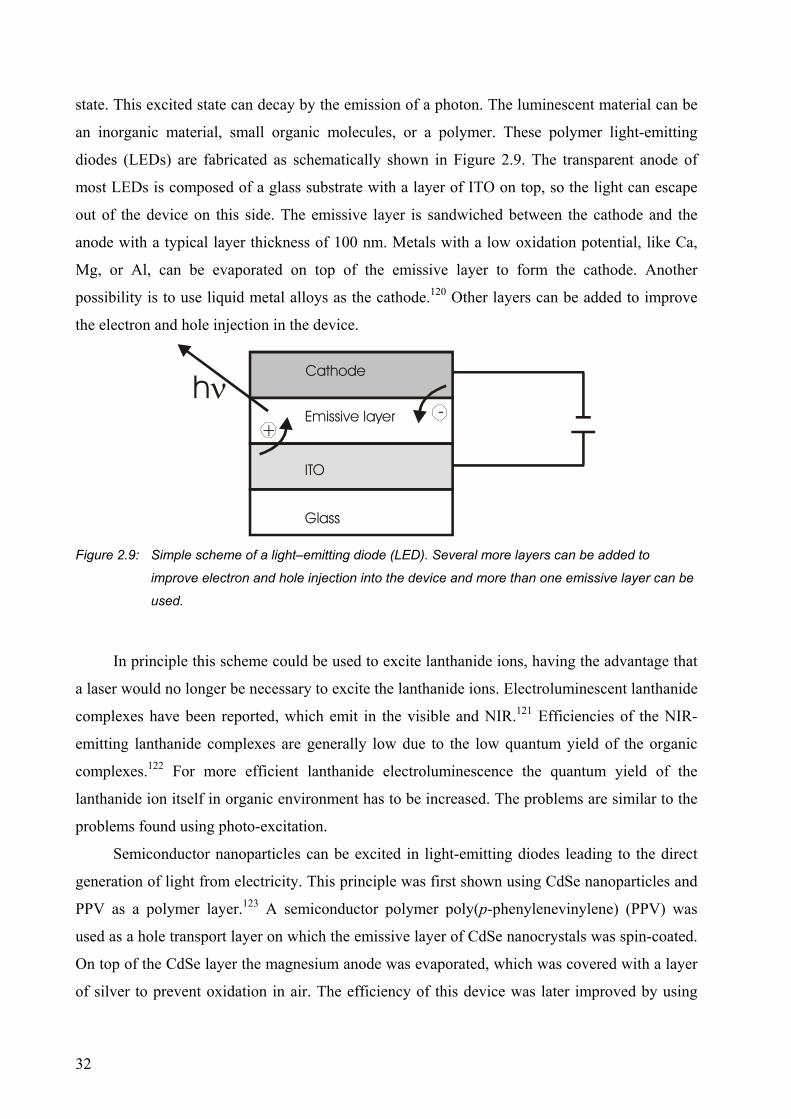
32
state. This excited state can decay by the emission of a photon. The luminescent material can be
an inorganic material, small organic molecules, or a polymer. These polymer light-emitting
diodes (LEDs) are fabricated as schematically shown in Figure 2.9. The transparent anode of
most LEDs is composed of a glass substrate with a layer of ITO on top, so the light can escape
out of the device on this side. The emissive layer is sandwiched between the cathode and the
anode with a typical layer thickness of 100 nm. Metals with a low oxidation potential, like Ca,
Mg, or Al, can be evaporated on top of the emissive layer to form the cathode. Another
possibility is to use liquid metal alloys as the cathode.120 Other layers can be added to improve
the electron and hole injection in the device.
Glass
ITO
Cathode
Emissive layer+
-hν
Figure 2.9: Simple scheme of a light–emitting diode (LED). Several more layers can be added to
improve electron and hole injection into the device and more than one emissive layer can be
used.
In principle this scheme could be used to excite lanthanide ions, having the advantage that
a laser would no longer be necessary to excite the lanthanide ions. Electroluminescent lanthanide
complexes have been reported, which emit in the visible and NIR.121 Efficiencies of the NIR-
emitting lanthanide complexes are generally low due to the low quantum yield of the organic
complexes.122 For more efficient lanthanide electroluminescence the quantum yield of the
lanthanide ion itself in organic environment has to be increased. The problems are similar to the
problems found using photo-excitation.
Semiconductor nanoparticles can be excited in light-emitting diodes leading to the direct
generation of light from electricity. This principle was first shown using CdSe nanoparticles and
PPV as a polymer layer.123 A semiconductor polymer poly(p-phenylenevinylene) (PPV) was
used as a hole transport layer on which the emissive layer of CdSe nanocrystals was spin-coated.
On top of the CdSe layer the magnesium anode was evaporated, which was covered with a layer
of silver to prevent oxidation in air. The efficiency of this device was later improved by using
33
core-shell nanoparticles of CdSe covered with a layer of CdS.124 More examples of visible
emitting semiconductor nanoparticles of ZnS and CdS in polymer substrates were reported.125
Similar electroluminescent devices, that emit in the NIR, using nanoparticles of InAs126 and
PbS59 were also reported.
2.10 Outlook
In this chapter an overview was given on the luminescence of lanthanide ions with a focus
on the use of these ions in optical amplifiers. Lanthanide-doped fiber amplifiers have become a
very important technology that has been developed in a relatively short period of time, of about
20 years. The major drawbacks of the glass fibers used, is the relatively expensive fabrication
technology and the difficulties to integrate different optical components. The research on
integrated planar polymer waveguide technology is growing. In order to make planar polymer
waveguides successful, optical amplifiers have to be developed to compensate for losses in the
waveguides and lanthanide ions seem to be the first choice since these luminescent materials are
so important in glass technology. However, the luminescence of lanthanide ions in organic
materials is not efficient due to the high-energy vibrations of the organic bonds surrounding the
lanthanide ion. In this thesis the doping of lanthanide ions into nanoparticles is described as a
way to improve the luminescence efficiency of the ions and to show that these materials can be
used to make a polymer-based optical amplifier operating at a telecommunication wavelength.
Haase et al. reported the efficient luminescence of LaPO4 nanoparticles doped with visible
emitting ions and in this thesis the properties of these nanoparticles doped with near-infrared
emitting ions have been investigated. The near-infrared emitting ions generally show more
efficient luminescence in materials with lower phonon energies than LaPO4 and therefore the
synthesis of nanoparticles with other host materials has also been investigated.
2.11 References 1 CRC Handbook of Chemistry and Physics 64th ed. ed. Weast, R. C., 1983-1984, Baco Raton,
Florida, USA. 2 Jones, A. P.; Wall, F. Rare earth minerals: chemistry, origin, and ore deposites; Chapman and
Hall: London, 1996.
34
3 Look at www.molycorp.com the largest manifacturer of lanthanide ions in the western world. 4 Cotton, S. Lanthanides and Actinides; Macmillan Education: Basingstoke, 1991. 5 Feldmann, C.; Jüstel, T.; Ronda, C. R.; Schmidt, P. J. Adv. Funct. Mater. 2003, 13, 511. 6 Becker, P. C.; Olsson, N. A.; Simpson, J. R. Erbium doped amplifiers: fundamentals and
technology; Academic Press: San Diego, 1999. 7 Digonnet, M. J. F. Rare earth doped fiber laser and amplifiers; Dekker: New York, 1993. 8 Blasse, G.; Grabmaier, B. C. Luminescent materials; Springer: Berlin, 1994. 9 (a) Slooff, L. H.; van Blaaderen, A.; Polman, A.; Hebbink, G. A.; Klink, S. I.; van Veggel, F. C. J.
M.; Reinhoudt, D. N.; Hofstraat, J. W. Appl. Phys. Rev. 2002, 91, 3955; (b) Kuriki, K.; Nishihara,
S.; Nishizawa, Y; Tagaya, A.; Koike, Y. J. Opt. Soc. Am. B 2002, 19, 1844; (c) Chen, R. T. Opt.
Laser Technol. 1993, 25, 347. 10 Ermolaev, V. L.; Sveshnikova, E. B. Russ. Chem. Rev. 1994, 63, 905. 11 Dorenbos, P J. Lumin. 2003, 104, 239. 12 Carnall, W. T.; Goodman, G. L.; Rajnak, K.; Rana, R. S. J. Chem. Phys. 1989, 90, 3443. 13 Kirby, A. F.; Richardson, F. S. J. Phys. Chem. 1983, 87, 2544. 14 (a) Judd, B. R. Phys. Rev. 1962, 127, 750; (b) Ofelt, G. S. J. Chem. Phys. 1962, 37, 511. 15 Werts, M. H. V.; Jukes, R. T. F.; Verhoeven, J. W. Phys. Chem. Chem. Phys. 2002, 4, 1542. 16 Gilbert, A.; Baggot, J. Essentials of molecular photochemistry; Blakwell Scientific Publications:
London, 1991. 17 Stein, G.; Würzburg, E. J. Chem. Phys. 1975, 62, 208. 18 Förster, T. Discuss. Faraday Soc. 1959, 27, 7. 19 Strohhöfer, C.; Polman, A. Opt. Mater. 2003, 21, 705. 20 (a) Strohhöfer, C.; Polman, A. J. Appl. Phys. 2001, 90, 4314; (b) Townsend, J. E.; Barnes, W. L.;
Jedrzejevski, K. P. Electron. Lett. 1991, 27, 1958. 21 (a) Walsh, B. M.; Barnes, N. P.; Di Bartolo, B. J. Lumin. 1997, 75, 89; (b) Walsh, B. M.; Barnes,
N. P.; Di Bartolo, B. J. Lumin. 2000, 90, 39. 22 Song, J. H.; Heo, J.; Park, S. H. J. Appl. Phys. 2003, 93, 9441. 23 Kik, P. G.; Polman, A. J. Appl. Phys. 2003, 93, 5008. 24 Brierly, M. C.; France, P. W.; Millar, C. A. Electron. Lett. 1988, 24, 539. 25 Wetenkamp, L. Electron. Lett. 1990, 26, 883. 26 Yanagita, H.; Masuda, I.; Yamashita, T.; Toratani, H. Electron. Lett. 1990, 26, 1836. 27 Többen, H. Electron. Lett. 1992, 28, 1361. 28 Reisfeld, R.; Jorgensen, C. K. Lasers and excited states of rare earths; Springer: Berlin, 1977. 29 Soga, K.; Wang, W.; Riman, R. E.; Brown, J. B.; Mikeska, K. R. J. Appl. Phys. 2003, 93, 2946.
35
30 Hewak, D. W.; Deol, R. S.; Wang, J.; Wylangowski, G.; Medeiros, J. A.; Samson, B. N.; Laming,
R. I.; Brocklesby, W. S.; Payne, D. N.; Jha, A.; Poulain, M.; Otero, S.; Surinach, S.; Baro, M. D.
Electron. Lett. 1993, 29, 237. 31 Taylor, E. R.; Ng, L. N.; Sessions, N. P.; Buerger, H. J. Appl. Phys. Lett. 2002, 92, 112. 32 Carnall, W. T.; Goodman, G. L.; Rajnak, K.; Rana, R. S. J. Chem. Phys. 1989, 90, 3443. 33 Brecher, C.; Samelson, H.; Lempicki, A.; Riley, R.; Peters, T. Phys. Rev. 1967, 155, 178. 34 Blasse, G Prog. Solid St. Chem. 1988, 18, 79 and references therein. 35 Huang, W.; Syms, R. R. A.; Yeatman, E. M.; Ahmad, M. M.; Clapp, T. V.; Ojha, S. M. IEEE
Photon. Tech. Lett. 2002, 14, 959. 36 (a) Arai, K.; Namikawa, H.; Kumata, K.; Honda, T.; Ishii, Y.; Handa, T. J. Appl. Phys. 1986, 59,
3430; (b) Zhou, Y.; Lam, Y. L.; Wang, S. S.; Liu, H. L.; Kam, C. H.; Chan, Y. C. Appl. Phys. Lett.
1997, 71, 587; (c) Ryu, C. K.; Choi, H.; Kim, K. Appl. Phys. Lett. 1995, 66, 2496. 37 Parker, D.; Gareth Williams, J. A. J. Chem. Soc., Dalton Trans. 1996, 18, 3613. 38 Hebbink, G. A.; Klink, S. I.; Oude Alink, P. G. B.; van Veggel, F. C. J. M. Inorg. Chim. Acta.
2001, 317, 114. 39 Hemmilä, I. K. Applications of Fluorescence in Immunoessays; Wiley and Sons: New York, 1991. 40 (a) Klink, S. I.; Grave, L. ; Reinhoudt, D. N.; van Veggel, F. C. J. M.; Werts, M. H. V.; Geurts, F.
A. J.; Hofstraat, J. W. J. Phys. Chem. A 2000, 104, 5457; (b) Klink, S. I.; Hebbink, G. A.; Grave,
L.; Peters, F. G. A.; van Veggel, F. C. J. M.; Reinhoudt, D. N.; Hofstraat, J. W. Eur. J. Org. Chem.
2000, 10, 1923. 41 Hofstraat, J. W.; Oude Wolbers, M. P.; van Veggel, F. C. J. M.; Reinhoudt, D. N.; Werts, M. H. V.;
Verhoeven, J. W. J. Fluoresc. 1998, 8, 301. 42 (a) Klink, S. I.; Keizer, H.; Hofstraat, H. W.; van Veggel, F. C. J. M. Synth. Met. 2002, 127, 213;
(b) Klink, S. I.; Oude Alink, P. O.; Grave, L.; Peters, F. G. A.; Hofstraat, J. W.; Geurts, F.; van
Veggel, F. C. J. M. J. Chem. Soc., Perkin Trans. 2 2001, 3, 363. 43 Browne, W. R.; Vos, J. G. Coord. Chem. Rev. 2001, 219-221, 761. 44 Yanagida, S.; Hasegawa, Y.; Murakoshi, K.; Wada, Y.; Nakashima, N.; Yamanaka, T. Coord.
Chem. Rev. 1998, 171, 461. 45 Hebbink, G. A.; Reinhoudt, D. N.; van Veggel, F. C. J. M. Eur. J. Org. Chem. 2001, 21, 4101. 46 Hasegawa, Y.; Ohkubo, T.; Sogabe, K.; Kawamura, Y.; Wada, Y.; Makashima, N.; Yanagida, S.
Angew. Chem. Int. Ed. 2000, 39, 357. 47 Faraday, M. Philos. Trans. R. Soc. 1857, 147, 145. 48 Turkevich, J.; Garton, G.; Stevenson, P. C. J. Colloid Sci. 1954, 9, 26. 49 Murray, C. B.; Norris, D. J.; Bawendi, M. G. J. Am. Chem. Soc. 1993, 115, 8706.
36
50 Brust, M.; Walker, M.; Bethell, D.; Schiffrin, D. J.; Whyman, R. J. Chem. Soc., Chem. Commun.
1994, 7, 801. 51 (a) Weller, H. Adv. Mater. 1993, 5, 88; (b) Weller, H. Angew. Chem. Int. Ed. Engl. 1993, 32, 41;
(c)Henglein, A. Chem. Rev. 1989, 89, 1861. 52 (a) Peng, Z. A.; Peng, X. J. Am. Chem. Soc. 2001, 123, 183; (b) Peng, Z. A.; Peng, X. J. Am. Chem.
Soc. 2002, 124, 3343. 53 (a) Qu, L.; Peng, X. J. Am. Chem. Soc. 2002, 124, 2049; (b) Peng, Z. A.; Peng, X. J. Am. Chem
Soc. 2001, 123, 1389; (b) Qu, L.; Peng, Z. A.; Peng, X. Nano Lett. 2001, 1, 333. 54 (a) Peng, X.; Manna, L.; Yang, W.; Wickham, J.; Scher, E.; Kadavanich, A.; Alivisatos, A. P.
Nature, 2000, 404, 59; (b) Peng, Z. A.; Peng, X. J. Am. Chem. Soc. 2001, 123, 1389. 55 Manna, L.; Scher, E. C.; Alivisatos, A. P. J. Am. Chem. Soc. 2000, 122, 12700. 56 Cumberland, S. L.; Hanif, K. M.; Javier, A.; Khitrov, G. A.; Strouse, G. F.; Woessner, S. M.; Yun,
C. S. Chem. Mater. 2002, 14, 1576. 57 Talapin, D. V.; Haubold, S.; Rogach, A. L.; Kornowski, A.; Haase, M.; Weller, H. J. Phys. Chem.
B 2001, 105, 2260. 58 Harrison, M. T.; Kershaw, S. V.; Burt, M. G.; Rogach, A. L.; Kornowski, A.; Eychmuller, A.;
Weller, H. Pure Appl. Chem. 2000, 72, 295. 59 Bakueva, L.; Musikhin, S.; Hines, M. A.; Chang, T. W. F.; Tzolov, M.; Scholes, G. D.; Sargent, E.
H. Appl. Phys. Lett. 2003, 82, 2895. 60 Wehrenberg, B. L.; Wang, C.; Guyot-Sionnest, P. J. Phys. Chem. B 2002, 106, 10634. 61 (a) Klimov, V.I.; Mikhailovsky, A. A.; Xu, S.; Malko, A. V.; Hollingworth, J. A.; Leatherdale, C.
A.; Eisler, H. J.; Bawendi, M. G. Science 2000, 290, 314; (b) Htoon, H.; Hollingworth, J. A.;
Malko, A. V.; Dickerson, R.; Klimov, V. I. Appl. Phys. Lett. 2003, 82, 4776. 62 Peng, X.; Schlamp, M. C.; Kadavanich, A. V.; Alivisatos, A. P. J. Am. Chem. Soc. 1997, 119,
7019. 63 (a) Danek, M.; Jensen, K. F.; Murray, C. B.; Bawendi, M. G. Chem. Mater. 1996, 8, 173; (b)
Hoener, C. F.; Allan, K. A.; Bard, A. J.; Campion, A.; Fox, M. A.; Mallouk, T. E.; Webber, S. E.;
White, J. M. J. Phys. Chem. 1992, 96, 3812. 64 Dabbousi, B. O.; Rodriguez-Viejo, J.; Mikulec, F. V.; Heine, J. R.; Mattoussi, H.; Ober, R.; Jensen,
K. F.; Bawendi, M. G. J. Phys. Chem. B 1997, 101, 9463. 65 Harrison, M. T.; Kershaw, S. V.; Rogach, A. L.; Kornowski, A.; Eychmüller, A.; Weller, H. Adv.
Mater. 2000, 12, 123. 66 Borchert, H.; Haubold, S.; Haase, M.; Weller, H.; McGinley, C.; Riedler, M.; Möller, T. Nano Lett.
2002, 2, 151.
37
67 (a) Korgel, B. A.; Fitzmaurice, D. Adv. Mater. 1998, 10, 661; (b) Thomas, P. J.; Kulkarni, G. U.;
Rao, C. N. R. J. Phys. Chem. B 2000, 104, 8138; (c) Martin, J. E.; Wilcoxon, J. P.; Odinek, J.;
Provencio, P. J. Phys. Chem. B 2002, 106, 971. 68 (a) Petit, C.; Taleb, A.; Pileni, M. P. J. Phys. Chem. B 1999, 103, 1805; (b) Puntes, V. F.; Krishnan,
K. M.; Alivisatos, A. P. Science 2001, 291, 2115; (c) Sun, S.; Murray, C. B. J. Appl. Phys. 1999,
85, 4325. 69 Sun, S.; Murray, C. B.; Weller, D.; Folks, L.; Moser, A. Science 2000, 287, 1989. 70 (a) Ye, T.; Guiwen, Z.; Weiping, Z.; Shangda, X. Mater. Res. Bull. 1997, 32, 501; (b) Li, Q.; Gao,
L.; Yan, D. Nanostruct. Mater. 1997, 8, 825; (c) Bihari, B.; Eilers, H.; Tissue, B. M. J. Lumin.
1997, 75, 1. 71 Yin, M.; Zhang, W.; Xia, S.; Krupa, J. C. J. Lumin. 1996, 68, 335. 72 (a) Williams, D. K.; Bihari, B.; Tissue, B. M.; McHale, J. M. J. Phys. Chem. B 1998, 102, 916; (b)
Eilers, H.; Tissue, B. M. Chem. Phys. Lett. 1996, 251, 74. 73 Wakefield, G.; Holland, E.; Dobson, P. J.; Hutchison, J. L. Adv. Mater. 2001, 13, 1557. 74 Liu, G. K.; Zhuang, H. Z.; Chen, X. Y. Nano Lett. 2002, 2, 535. 75 (a) Yang, H. S.; Hong, K. S.; Feofilov, S. P.; Tissue, B. M.; Meltzer, R. S.; Dennis, W. M. J.
Lumin. 1999, 83-84, 139; (b) Tissue, B. M. Chem. Mater. 1998, 10, 2837. 76 Chen, X. Y.; Zhuang, H. Z.; Liu, G. K.; Li, S.; Niedbala, R. S. J. Appl. Phys. 2003, 94, 5559. 77 (a) Wei, Z.; Sun, L.; Liao, C.; Yan, C.; Huang, S. Appl. Phys. Lett. 2002, 80, 1447; (b) Wei, Z.;
Sun, L.; Liao, C.; Jiang, X.; Yan, C. J. Mater. Chem. 2002, 12, 3665; (c) Wei, Z.; Sun, L.; Liao, C.;
Jiang, X.; Yan, C. J. Appl. Phys. 2003, 93, 9783. 78 Yan, C. H.; Sun, L. D.; Liao, C. S.; Zhang, Y. X.; Lu, Y. Q.; Huang, S. H.; Lü, S. Z. Appl. Phys.
Lett. 2003, 82, 3511. 79 (a) Schuurmans, F. J. P.; Lagendijk, A. J. Appl.Phys. 2000, 113, 8; (b) Schuurmans, F. J. P.; de
Lang, D. T. N.; Wegdam, G. H.; Sprik, R.; Lagendijk, A. Phys. Rev. Lett. 1998, 80, 5077. 80 (a) Meltzer, R. S.; Feofilov, S. P.; Tissue, B.; Yuan, H. B. Phys. Rev. B 1999, 60, 14012; (b)
Meltzer, R. S.; Yen, W. M.; Zheng, H.; Feofilov, S. P.; Dejneka, M. J.; Tissue, B.; Yuan, H. B. J.
Lumin. 2001, 94-95, 217. 81 Huignard, A.; Gacoin, T.; Boilot, J. P. Chem. Mater. 2000, 12, 1090. 82 Huignard, A.; Buisette, V.; Laurent, G.; Gacoin, T.; Boilot, J. P. Chem. Mater. 2002, 14, 2264. 83 Riwotzki, K.; Haase, M. J. Phys. Chem. B 1998, 102, 10129. 84 Riwotzki, K.; Haase, M. J. Phys. Chem. B 2001, 105, 12709. 85 Huignard, A.; Buisette, V.; Franville, A. C.; Gacoin, T.; Boilot, J. P. J. Phys. Chem. B 2003, 107,
6754. 86 Riwotzki, K.; Meyssamy, H.; Kornowski, A.; Haase, M. J. Phys. Chem. B 2000, 104, 2824.
38
87 Riwotzki, K.; Meyssamy, H.; Schnablegger, H.; Kornowski, A.; Haase, M. Angew. Chem. Int. Ed.
2001, 40, 573. 88 Meyssamy, H.; Riwotzki, K.; Kornowski, A.; Naused, S.; Haase, M. Adv. Mater. 1999, 11, 840. 89 Lehmann, O.; Meyssamy, H.; Kömpe, K.; Schnablegger, H.; Haase, M. J. Phys. Chem. B 2003,
107, 7449. 90 Heer, S.; Lehmann, O.; Haase, M.; Güel, H. U. Angew. Chem. Int. Ed. 2003, 42, 3179. 91 Haase, M.; Riwotzki, K.; Meyssamy, H.; Kornowski, A. J. Alloy. Compd. 2000, 303-304, 191. 92 (a) Fujii, M; Yoshida, M.; Kanzawa, Y.; Hayashi, S.; Yamamoto, K. Appl. Phys. Lett. 1997, 71,
1198; (b) Kik, P. G.; Polman, A. Mat. Sci Eng. B 2001, 81, 3; (c) Han, H. S.; Seo, S. Y.; Shin, J. H.
Appl. Phys. Lett. 2001, 79, 4568. 93 (a) Selvan, S. T.; Hayakawa, T.; Nogami, M.; Möller, M. J. Non-Cryst. Solids 2001, 291, 137; (b)
Hayakawa, T.; Selvan, S. T.; Nogami, M. J. Sol-Gel Sci. Techn. 2000, 19, 779. 94 Nogami, M.; Enomoto, T.; Hayakawa, T. J. Lumin. 2002, 97, 147. 95 (a) Bhargava, R. N. J. Lumin. 1996, 70, 85; (b) Goldburt, E. T.; Bhargava, R. N. J. SID. 1996, 4,
365; (c) Kane, R. S.; Cohen, R. E.; Silbey, R. Chem. Mater. 1999, 11, 90; (d) Ihara, M.; Igarashi,
T.; Kusonoki, T.; Ohno, K. J. Eletrochem. Soc. 2000, 147, 2355. 96 Okamoto, S.; Kobayashi, M.; Kanemitsu, Y.; Kushida, T. Phys. Stat. Sol. B 2002, 229, 481. 97 Qu, S. C.; Zhou, W. H.; Liu, F. Q.; Chen, N. F.; Wang, Z. G.; Pan, H. Y.; Yu, D. P. Appl. Phys.
Lett. 2002, 80, 3605. 98 Bol, A. A.; van Beek, R.; Meijerink, A. Chem. Mater. 2002, 14, 1121. 99 Maenosono, S.; Okubo, T.; Yamaguchi, Y. J. Nanoparticle Res. 2003, 5, 5. 100 Pileni, M. P. J. Phys. Chem. 1993, 97, 6961. 101 Peng, X.; Wickham, J.; Alivisatos, A. P. J. Am. Chem. Soc. 1998, 120, 5343. 102 Stella, A.; Cheyssac, P.; Kofman, R. Science and technology of thin films, Ed. Matacotta, F. C.;
Ottaviani, G. World scientific, Singapore, Vol. 57, 1996, p57. 103 (a) Maye, M. M.; Zheng, W. X.; Leibowitz, F. L.; Ly, N. K.; Zhong, C. J. Langmuir 2000, 16, 490;
(b) Zhong, C. J.; Zheng, W. X.; Leibowitz, F. L.; Eichelberger, H. H. J. Chem. Soc., Chem.
Commun. 1999, 13, 1211; (c) Maye, M. M.; Zhong, C. J. J. Mater. Chem. 2000, 10, 1895. 104 Lin, X. M.; Sorensen, C. M.; Klabunde, K. J. J. Nanoparticles Res. 2000, 2, 157. 105 Sudo, S. Optical fiber amplifiers: Materials, Devices and Applications; Artec House, Inc: Boston,
1997. 106 For example the AllwaveTM optical fiber by Lucent Technologies. 107 Miniscalco, W. J.; Andrews, L. J.; Thompson, B. A. Electron. Lett. 1988, 24, 28. 108 Brierley, M. C.; Millar, C. A. Electron. Lett. 1988, 24, 438.
39
109 (a) Samson, B. N.; Medeiros Neto, J. A.; Laming, R. I.; Hewak, D. W. Electron. Lett. 1994, 30,
1617; (b) Wei, K.; Machewirth, D. P.; Wenzel, J.; Snitzer, E.; Sigel, G. H. Opt. Lett. 1994, 19, 904. 110 Ballato, J.; Riman, R. E.; Snitzer, E. Opt. Lett. 1997, 22, 691. 111 Komukai, T.; Yamamoto, T.; Sugawa, T.; Miyajima, Y. IEEE J. Quant. Electron. 1995, 31, 1880. 112 Ma, H.; Jen, A. K. Y.; Dalton, L. R. Adv. Mater. 2002, 14, 1339. 113 Karve, G.; Bihari, B.; Chen, R. T. Appl. Phys. Lett. 2000, 77, 1253. 114 An, D.; Yue, Z.; Chen, R. T. Appl. Phys. Lett. 1998, 72, 2806. 115 Lin, S.; Feuerstein, J.; Mickelson, A. R. J. Appl. Phys. 1996, 79, 2868. 116 Koeppen, C.; Yamada, S.; Jiang, G.; Garito, A. F.; Dalton, L. R. J. Opt. Soc. Am. B 1997, 14, 155. 117 Slooff, L. H.; de Dood, M. J. A.; van Blaaderen, A.; Polman, A. Appl. Phys. Lett. 2000, 76, 3682. 118 Barber, D. B.; Pollock, C. R.; Beecroft, L. L.; Ober, C. K. Opt. Lett. 1997, 22, 1247. 119 Casalboni, M.; de Matteis, F.; Merlo, V.; Proposito, P; Russo, R.; Schutzmann, S. Appl. Phys. Lett.
2003, 83, 416. 120 Gao, F. G.; Bard, A. J. J. Am. Chem. Soc. 2000, 122, 7426. 121 (a) Slooff, L. H.; Polman, A.; Cacialli, F.; Friend, R. H.; Hebbink, G. A.; van Veggel, F. C. J. M.;
Reinhoudt, D. N. Appl. Phys. Lett. 2001, 78, 2122; (b) Kido, J.; Okamoto, Y. Chem. Rev. 2002,
102, 2357; (c) Kang, T. S.; Harrison, B. S.; Bouguettaya, M.; Foley, T. J.; Boncella, J. M.;
Schanze, K. S.; Reynolds, J. R. Adv. Funct. Mater. 2003, 13, 205. 122 Kang, T. S.; Harrison, B. S.; Foley, T. J.; Knefely, A. S.; Boncella, J. M.; Reynolds, J. R.; Schanze,
K. S. Adv. Mater. 2003, 15, 1093. 123 Colvin, V. L.; Schlamp, M. C.; Alivisatos, A. P. Nature, 1994, 370, 354. 124 Schlamp, M. C.; Peng, X.; Alivisatos, A. P. J. Appl. Phys. 1997, 82, 5837. 125 (a) Yang, Y.; Xue, S.; Liu, S.; Huang, J.; Shen, J. Appl. Phys. Lett. 1996, 69, 377; (b) Dabbousi, B.
O.; Bawendi, M. G.; Onitsuka, O.; Rubner, M. F. Appl. Phys. Lett. 1995, 66, 1316; (c) Gao, M.;
Richter, B.; Kirstein, S.; Möhwald, H. J. Phys. Chem. B 1998, 102, 4096. 126 Tessler, N.; Medvedev, V.; Kazes, M.; Kan, S.; Banin, U. Science 2002, 295, 1506.

41
CCCHHHAAAPPPTTTEEERRR 333 Synthesis of lanthanide(III)-doped nanoparticles*
This chapter describes the synthesis of lanthanide(III)-doped nanoparticles. In these
nanoparticles the lanthanide ion is shielded from the surrounding organic
environment to improve the luminescence properties. Visible and near-infrared
(NIR)-emitting lanthanide ions have been doped in nanoparticles of LaPO4:Ln,
LaF3:Ln and LaVO4:Ln. The Eu3+ ion was used as a probe for the doping site of the
lanthanide ion, because the luminescence of this ion is sensitive to the symmetry of
the local environment. Other lanthanide ions emitting in the visible and NIR could
also be doped in these nanoparticles. Generally, the luminescence of the ions is
comparable to that of the bulk materials. For the first time, Ho3+ is reported to show
luminescence in an organic solution, in the visible and in the NIR, indicating the
good shielding of the lanthanide ion. The lifetimes of the Eu3+ and NIR-emitting ions
indicate a high quantum yield, compared to the same ions in organic complexes.
* The major part of the work in this chapter was published: Stouwdam, J. W.; van Veggel, F. C. J. M. Nano Lett.
2002, 2, 733; Hebbink, G. A.; Stouwdam, J. W.; Reinhoudt, D. N.; van Veggel, F. C. J. M. Adv. Mater. 2002, 14,
1147; Stouwdam, J. W.; Hebbink, G. A.; Huskens, J.; van Veggel, F. C. J. M. Chem. Mater. 2003, 15, 4604.
42
3.1 Introduction
The luminescence of lanthanide ions has found important commercial applications in
displays,1 optical amplifiers,2 and lasers,3 as described in chapter 2. There is a growing interest to
use this luminescence in polymer-based materials, because of the easy processing of polymers
and ease of integrating different optical components. The luminescence of these lanthanide ions
arises from transitions within the 4f electron shell. These transitions are parity forbidden, leading
to low absorption cross-sections and long luminescence lifetimes. However, this long-lived
excited state can be quenched very efficiently in the presence of the high-energy vibrations of
organic solvents, polymers, or ligands, thus hampering the application in polymer-based devices.
Therefore, to use lanthanide luminescence in an organic environment it is important to shield the
lanthanide ion from the organic surroundings. Shielding of the lanthanide ion4 can be achieved
by doping it in the inorganic part of nanoparticles, that should still be soluble in organic solvents.
Good solubility is generally achieved by having organic groups on the outside of the
nanoparticles. Most nanoparticles doped with lanthanide ions are made in high temperature
procedures leading to nanoparticles without organic groups on the surface and, therefore, they
have no solubility in solvents.5
Only very few examples of these lanthanide-doped nanoparticles that have a good
solubility in organic solvents have been reported.6,7 Haase and co-workers have synthesized
nanoparticles of LaPO4 doped with the visible emitting ions Eu3+ and Tb3+, but the near-infrared
(NIR) emitting ions have received little attention. Lanthanide ions emitting at wavelengths
between 1300 and 1600 nm are of interest for optical telecommunication, because at these
wavelengths the silica-based optical fibers have their maximum transparency.8 Nanoparticles
with dimensions of a few nanometers are small enough to minimize scattering in polymer films.9
The largest contribution to scattering in polymer films originates from particles with a size
comparable to the wavelength of light, or bigger (Mie scattering). Nanoparticles have a size
much smaller than the wavelength of light and when clustering of the nanoparticles in a polymer
film is prevented, scattering should be minimal.
3.2 Results and discussion
Characterization. Nanoparticles of LaPO4 were prepared using a literature procedure
from the hydrated LnCl3 salts and phosphoric acid.6 The growth of the nanoparticles is controlled
by the coordinating solvent tris(ethylhexyl)phosphate and protonated trioctylamine. During the
reaction some of the solvent is hydrolyzed and the resulting bis(ethylhexyl)phoshate coordinates
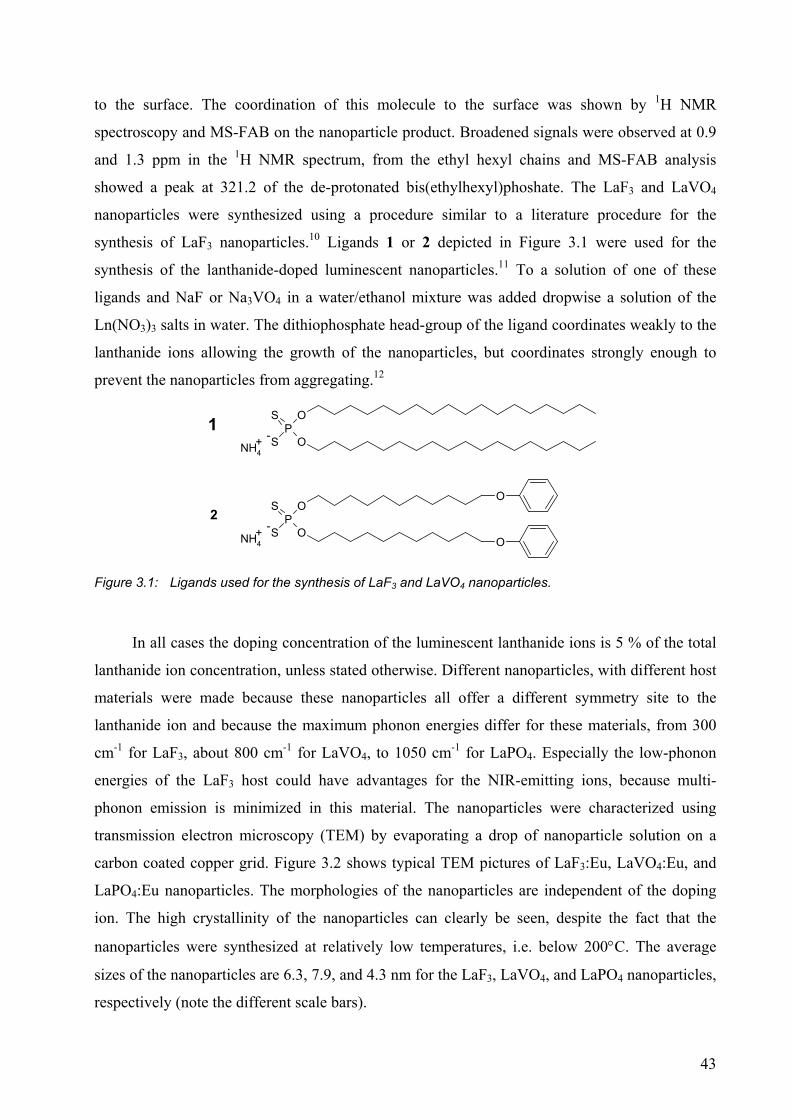
43
to the surface. The coordination of this molecule to the surface was shown by 1H NMR
spectroscopy and MS-FAB on the nanoparticle product. Broadened signals were observed at 0.9
and 1.3 ppm in the 1H NMR spectrum, from the ethyl hexyl chains and MS-FAB analysis
showed a peak at 321.2 of the de-protonated bis(ethylhexyl)phoshate. The LaF3 and LaVO4
nanoparticles were synthesized using a procedure similar to a literature procedure for the
synthesis of LaF3 nanoparticles.10 Ligands 1 or 2 depicted in Figure 3.1 were used for the
synthesis of the lanthanide-doped luminescent nanoparticles.11 To a solution of one of these
ligands and NaF or Na3VO4 in a water/ethanol mixture was added dropwise a solution of the
Ln(NO3)3 salts in water. The dithiophosphate head-group of the ligand coordinates weakly to the
lanthanide ions allowing the growth of the nanoparticles, but coordinates strongly enough to
prevent the nanoparticles from aggregating.12
PS
S
O
O
O
ONH4+ -
PS
S
O
ONH4+ -
1
2
Figure 3.1: Ligands used for the synthesis of LaF3 and LaVO4 nanoparticles.
In all cases the doping concentration of the luminescent lanthanide ions is 5 % of the total
lanthanide ion concentration, unless stated otherwise. Different nanoparticles, with different host
materials were made because these nanoparticles all offer a different symmetry site to the
lanthanide ion and because the maximum phonon energies differ for these materials, from 300
cm-1 for LaF3, about 800 cm-1 for LaVO4, to 1050 cm-1 for LaPO4. Especially the low-phonon
energies of the LaF3 host could have advantages for the NIR-emitting ions, because multi-
phonon emission is minimized in this material. The nanoparticles were characterized using
transmission electron microscopy (TEM) by evaporating a drop of nanoparticle solution on a
carbon coated copper grid. Figure 3.2 shows typical TEM pictures of LaF3:Eu, LaVO4:Eu, and
LaPO4:Eu nanoparticles. The morphologies of the nanoparticles are independent of the doping
ion. The high crystallinity of the nanoparticles can clearly be seen, despite the fact that the
nanoparticles were synthesized at relatively low temperatures, i.e. below 200°C. The average
sizes of the nanoparticles are 6.3, 7.9, and 4.3 nm for the LaF3, LaVO4, and LaPO4 nanoparticles,
respectively (note the different scale bars).
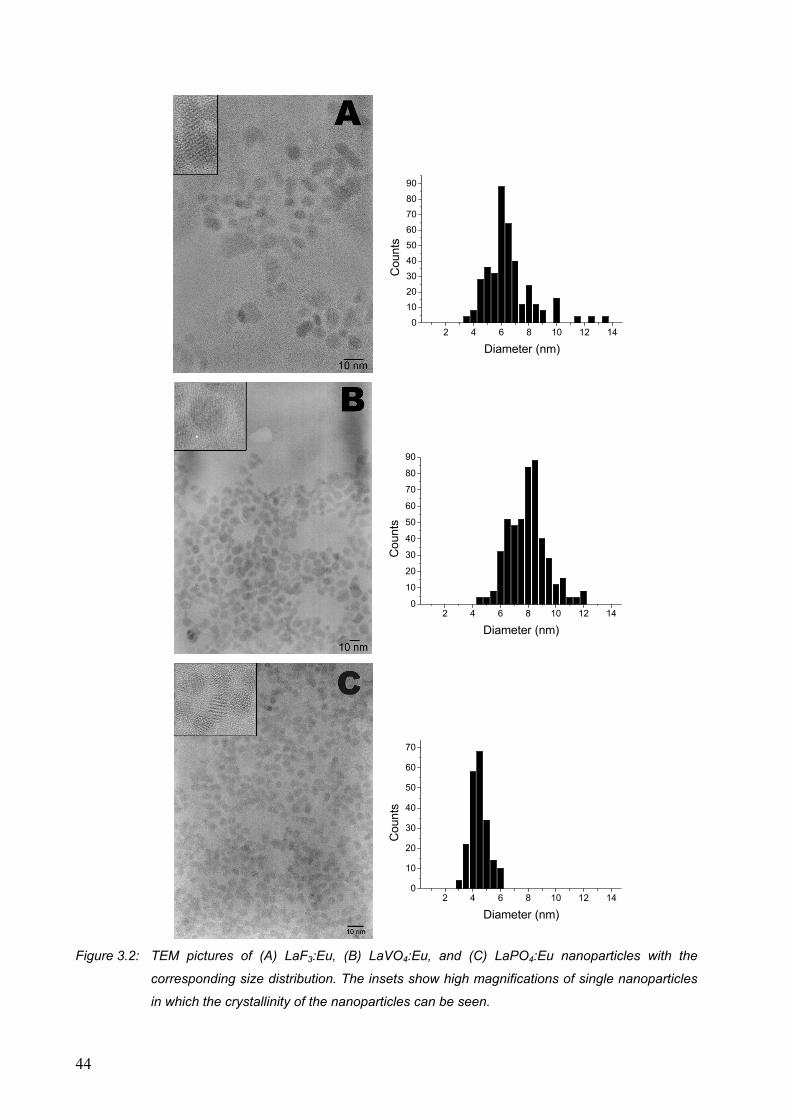
44
2 4 6 8 10 12 140
1020304050607080
90
Cou
nts
Diameter (nm)
2 4 6 8 10 12 140
10
20
30
40
50
60
70
80
90
Cou
nts
Diameter (nm)
2 4 6 8 10 12 140
10
20
30
40
50
60
70
Cou
nts
Diameter (nm)
Figure 3.2: TEM pictures of (A) LaF3:Eu, (B) LaVO4:Eu, and (C) LaPO4:Eu nanoparticles with the
corresponding size distribution. The insets show high magnifications of single nanoparticles
in which the crystallinity of the nanoparticles can be seen.
45
The size distribution (standard deviation) of the LaF3 nanoparticles is 28 %, much larger
than for the other two. The size distributions of the LaVO4 and LaPO4 nanoparticles are 17 %
and 15 %, respectively. Moreover, the LaF3 nanoparticles are less spherical in shape with aspect
ratios between 1 and 3. The spherical and elongated nanoparticles both consist of one crystal
domain, so the elongated nanoparticles are not formed by aggregation of multiple nanoparticles.
In the size distribution histograms the sizes of the elongated nanoparticles were determined by
averaging of the long and short axis. The sizes of the nanoparticles are sufficiently small to
prevent scattering when the nanoparticles are incorporated in a polymer matrix.13 An estimation
of the number of luminescent ions in the nanoparticles can be made taking into account the
density of the host material and the average size of the nanoparticles. Assuming spherical
nanoparticles, and using a density of LaF3 of 5.94 g/cm3,14 the number of La3+ atoms in the LaF3
nanoparticles is about 2400. At a doping concentration of 5 % the number of luminescent ions is
approximately 120 per LaF3 nanoparticle. For the smaller LaPO4 nanoparticles the number of
luminescent ions will be slightly less and for the bigger LaVO4 nanoparticles it will be slightly
more. The elemental composition of the nanoparticles was determined using X-ray fluorescence
(XRF) and combustion elemental analysis. The results are summarized in Table 3.1. In the
nanoparticles the same ratio of lanthanide ions as applied in the synthesis was found, reflecting
the similar reactivity of the lanthanide ions.
Table 3.1: Elemental composition of lanthanide-doped nanoparticles (weight %)
Particle Laa Lna Pa Va Cb Hb Sb Nb
LaF3:Eu ligand 1 30.96 1.61 2.64 - 35.96 6.63 6.18 -
LaF3:Eu ligand 2 n. d. c n. d. c n. d. c - 15.23 2.29 3.82 0.14
LaVO4:Eu ligand 1 18.46 1.17 4.48 9.24 44.62 7.88 6.70 -
LaF3:Nd 24.76 1.23 3.48 - 42.49 7.76 5.76 -
LaF3:Er 24.20 1.35 3.48 - 43.59 7.62 6.48 -
LaF3:Ho 35.41 1.94 2.94 - 33.07 7.76 5.72 -
LaPO4:Nd 41.97 2.42 12.19 - 6.33 2.16 - 1.01
LaPO4:Er 41.80 2.36 12.56 - 5.57 2.63 - 1.20
LaPO4:Pr 41.97 2.35 12.52 - 6.30 2.17 - 1.01
a) measured with XRF
b) measured with combustion elemental analysis.
c) n. d. is not determined
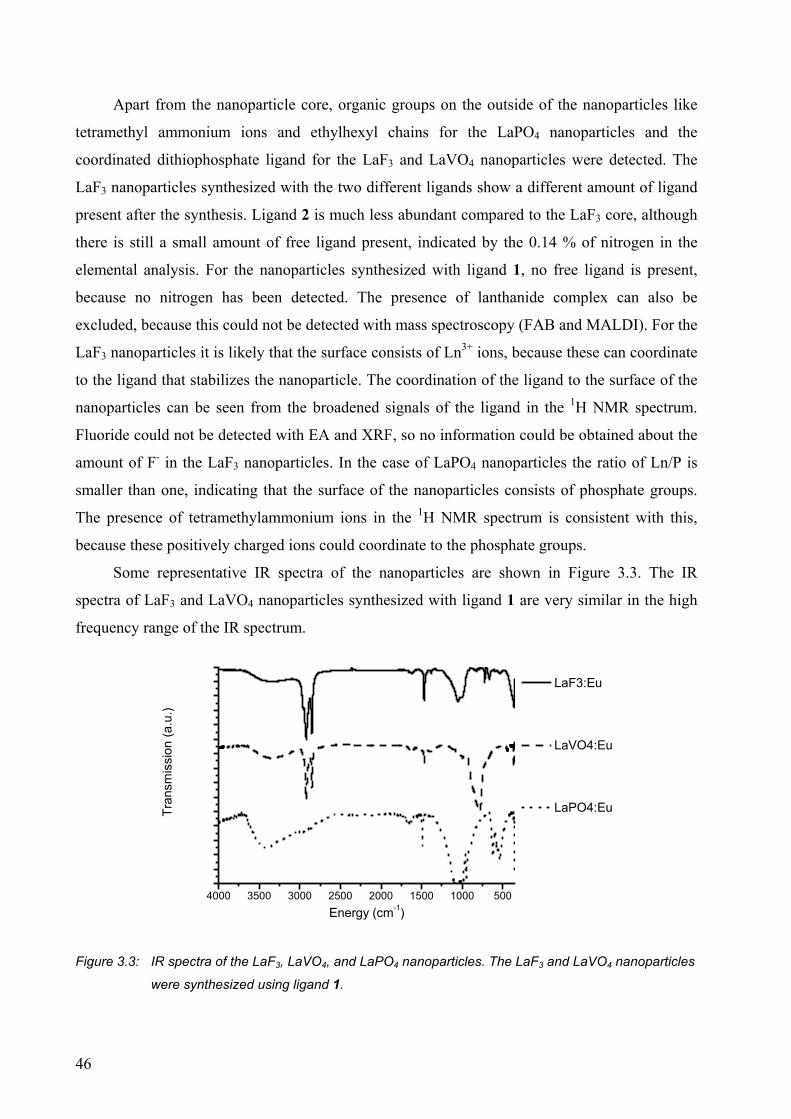
46
Apart from the nanoparticle core, organic groups on the outside of the nanoparticles like
tetramethyl ammonium ions and ethylhexyl chains for the LaPO4 nanoparticles and the
coordinated dithiophosphate ligand for the LaF3 and LaVO4 nanoparticles were detected. The
LaF3 nanoparticles synthesized with the two different ligands show a different amount of ligand
present after the synthesis. Ligand 2 is much less abundant compared to the LaF3 core, although
there is still a small amount of free ligand present, indicated by the 0.14 % of nitrogen in the
elemental analysis. For the nanoparticles synthesized with ligand 1, no free ligand is present,
because no nitrogen has been detected. The presence of lanthanide complex can also be
excluded, because this could not be detected with mass spectroscopy (FAB and MALDI). For the
LaF3 nanoparticles it is likely that the surface consists of Ln3+ ions, because these can coordinate
to the ligand that stabilizes the nanoparticle. The coordination of the ligand to the surface of the
nanoparticles can be seen from the broadened signals of the ligand in the 1H NMR spectrum.
Fluoride could not be detected with EA and XRF, so no information could be obtained about the
amount of F- in the LaF3 nanoparticles. In the case of LaPO4 nanoparticles the ratio of Ln/P is
smaller than one, indicating that the surface of the nanoparticles consists of phosphate groups.
The presence of tetramethylammonium ions in the 1H NMR spectrum is consistent with this,
because these positively charged ions could coordinate to the phosphate groups.
Some representative IR spectra of the nanoparticles are shown in Figure 3.3. The IR
spectra of LaF3 and LaVO4 nanoparticles synthesized with ligand 1 are very similar in the high
frequency range of the IR spectrum.
4000 3500 3000 2500 2000 1500 1000 500
LaF3:Eu
LaVO4:Eu
LaPO4:EuTran
smis
sion
(a.u
.)
Energy (cm-1)
Figure 3.3: IR spectra of the LaF3, LaVO4, and LaPO4 nanoparticles. The LaF3 and LaVO4 nanoparticles
were synthesized using ligand 1.
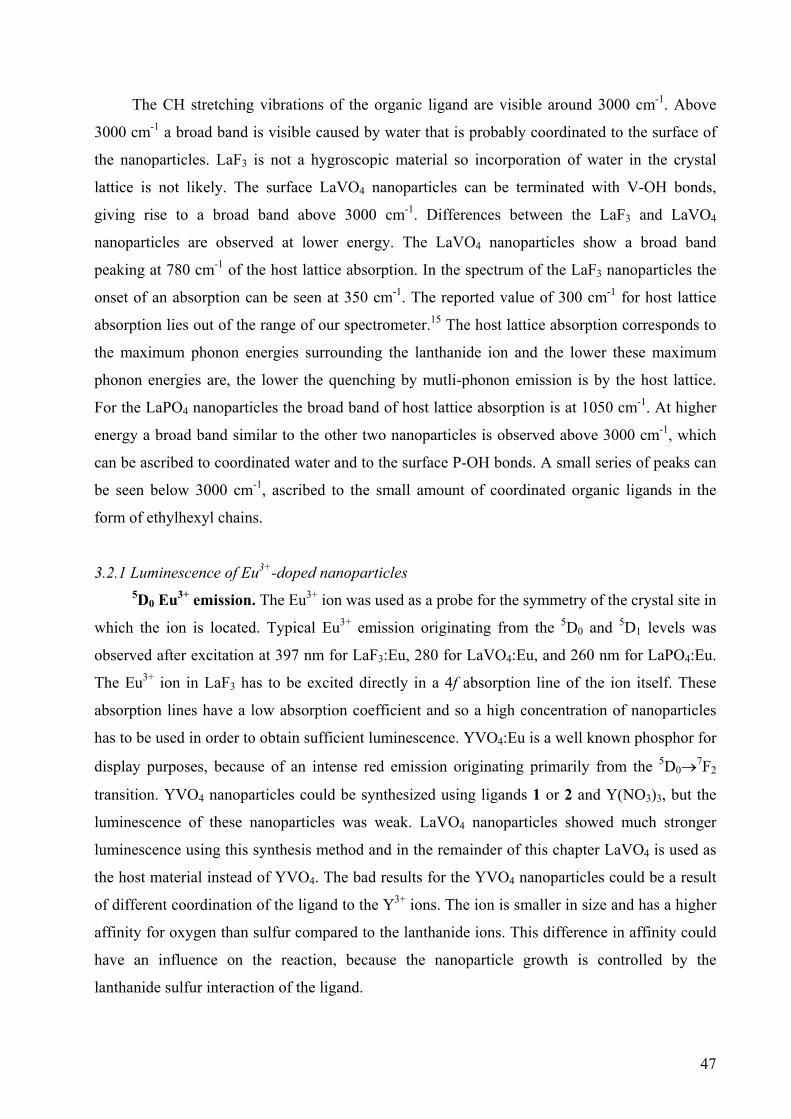
47
The CH stretching vibrations of the organic ligand are visible around 3000 cm-1. Above
3000 cm-1 a broad band is visible caused by water that is probably coordinated to the surface of
the nanoparticles. LaF3 is not a hygroscopic material so incorporation of water in the crystal
lattice is not likely. The surface LaVO4 nanoparticles can be terminated with V-OH bonds,
giving rise to a broad band above 3000 cm-1. Differences between the LaF3 and LaVO4
nanoparticles are observed at lower energy. The LaVO4 nanoparticles show a broad band
peaking at 780 cm-1 of the host lattice absorption. In the spectrum of the LaF3 nanoparticles the
onset of an absorption can be seen at 350 cm-1. The reported value of 300 cm-1 for host lattice
absorption lies out of the range of our spectrometer.15 The host lattice absorption corresponds to
the maximum phonon energies surrounding the lanthanide ion and the lower these maximum
phonon energies are, the lower the quenching by mutli-phonon emission is by the host lattice.
For the LaPO4 nanoparticles the broad band of host lattice absorption is at 1050 cm-1. At higher
energy a broad band similar to the other two nanoparticles is observed above 3000 cm-1, which
can be ascribed to coordinated water and to the surface P-OH bonds. A small series of peaks can
be seen below 3000 cm-1, ascribed to the small amount of coordinated organic ligands in the
form of ethylhexyl chains.
3.2.1 Luminescence of Eu3+-doped nanoparticles 5D0 Eu3+ emission. The Eu3+ ion was used as a probe for the symmetry of the crystal site in
which the ion is located. Typical Eu3+ emission originating from the 5D0 and 5D1 levels was
observed after excitation at 397 nm for LaF3:Eu, 280 for LaVO4:Eu, and 260 nm for LaPO4:Eu.
The Eu3+ ion in LaF3 has to be excited directly in a 4f absorption line of the ion itself. These
absorption lines have a low absorption coefficient and so a high concentration of nanoparticles
has to be used in order to obtain sufficient luminescence. YVO4:Eu is a well known phosphor for
display purposes, because of an intense red emission originating primarily from the 5D0→7F2
transition. YVO4 nanoparticles could be synthesized using ligands 1 or 2 and Y(NO3)3, but the
luminescence of these nanoparticles was weak. LaVO4 nanoparticles showed much stronger
luminescence using this synthesis method and in the remainder of this chapter LaVO4 is used as
the host material instead of YVO4. The bad results for the YVO4 nanoparticles could be a result
of different coordination of the ligand to the Y3+ ions. The ion is smaller in size and has a higher
affinity for oxygen than sulfur compared to the lanthanide ions. This difference in affinity could
have an influence on the reaction, because the nanoparticle growth is controlled by the
lanthanide sulfur interaction of the ligand.
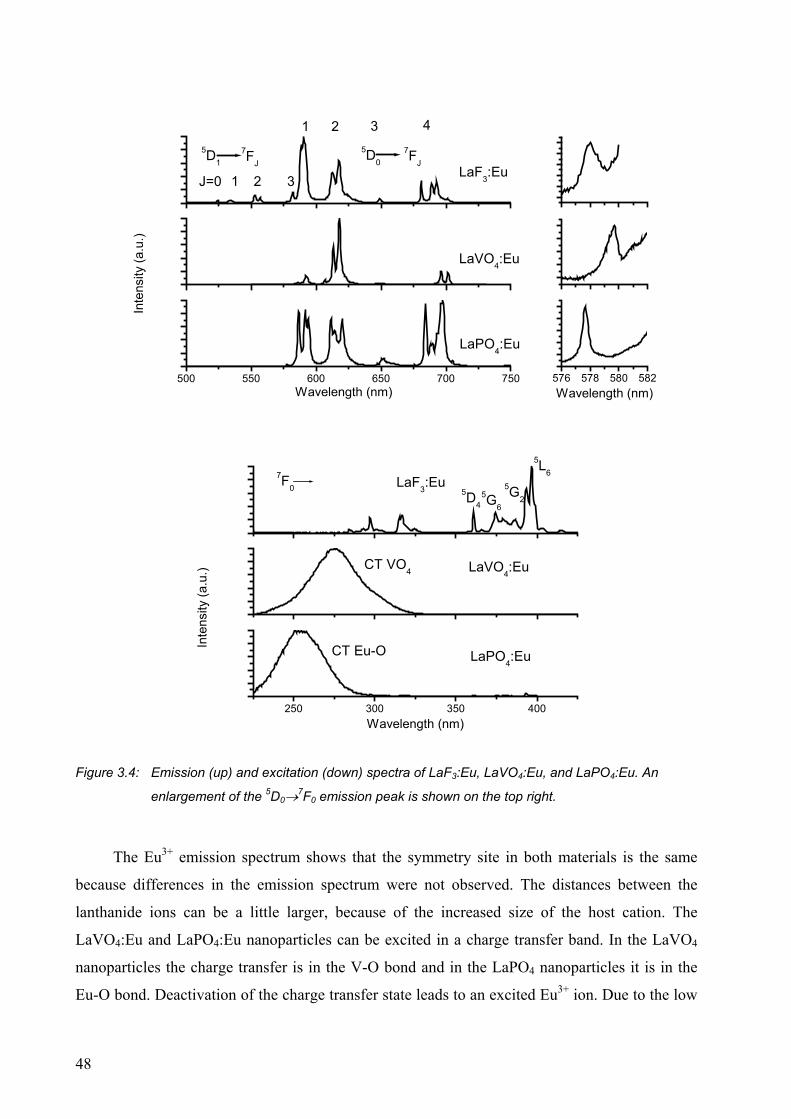
48
500 550 600 650 700 750
Inte
nsity
(a.u
.)
Wavelength (nm)
LaPO4:Eu
LaVO4:Eu
LaF3:Eu
7FJ5D0
4
3
2
1
1 3
2J=0
7FJ5D1
576 578 580 582Wavelength (nm)
250 300 350 400
LaPO4:Eu
Inte
nsity
(a.u
.)
Wavelength (nm)
LaVO4:Eu
CT Eu-O
CT VO4
LaF3:Eu 5G25G6
5D4
5L67F0
Figure 3.4: Emission (up) and excitation (down) spectra of LaF3:Eu, LaVO4:Eu, and LaPO4:Eu. An
enlargement of the 5D0→7F0 emission peak is shown on the top right.
The Eu3+ emission spectrum shows that the symmetry site in both materials is the same
because differences in the emission spectrum were not observed. The distances between the
lanthanide ions can be a little larger, because of the increased size of the host cation. The
LaVO4:Eu and LaPO4:Eu nanoparticles can be excited in a charge transfer band. In the LaVO4
nanoparticles the charge transfer is in the V-O bond and in the LaPO4 nanoparticles it is in the
Eu-O bond. Deactivation of the charge transfer state leads to an excited Eu3+ ion. Due to the low
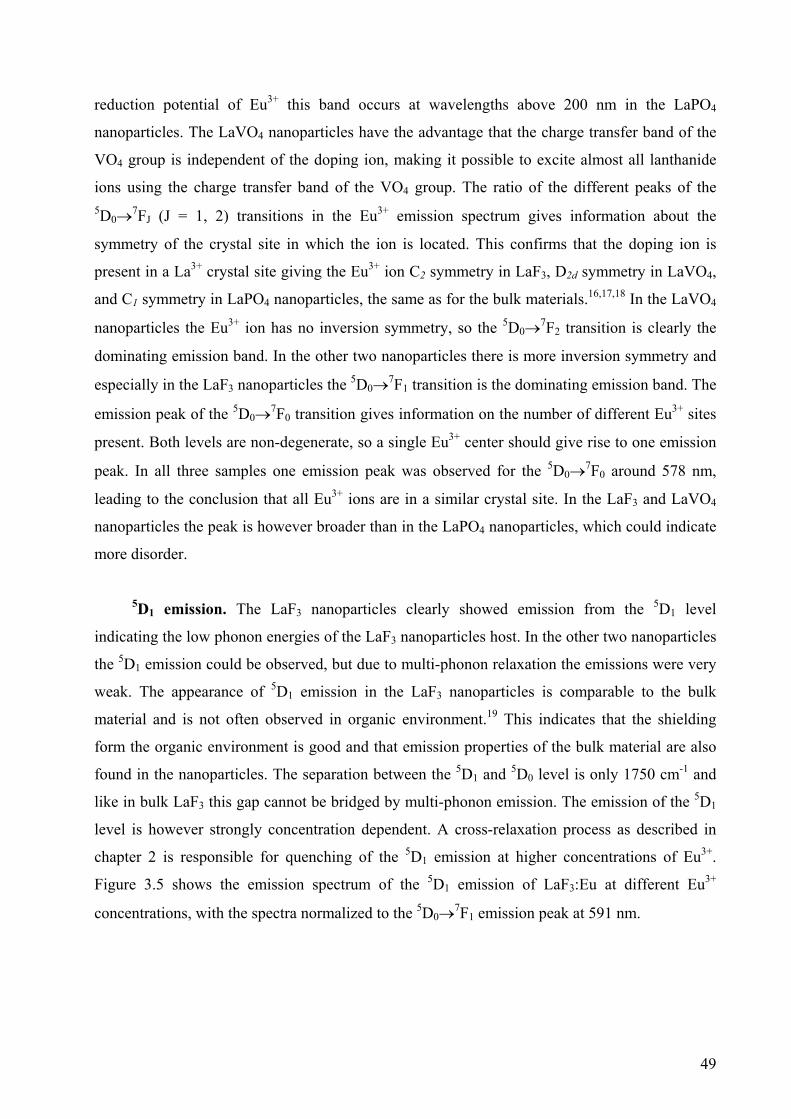
49
reduction potential of Eu3+ this band occurs at wavelengths above 200 nm in the LaPO4
nanoparticles. The LaVO4 nanoparticles have the advantage that the charge transfer band of the
VO4 group is independent of the doping ion, making it possible to excite almost all lanthanide
ions using the charge transfer band of the VO4 group. The ratio of the different peaks of the 5D0→7FJ (J = 1, 2) transitions in the Eu3+ emission spectrum gives information about the
symmetry of the crystal site in which the ion is located. This confirms that the doping ion is
present in a La3+ crystal site giving the Eu3+ ion C2 symmetry in LaF3, D2d symmetry in LaVO4,
and C1 symmetry in LaPO4 nanoparticles, the same as for the bulk materials.16,17,18 In the LaVO4
nanoparticles the Eu3+ ion has no inversion symmetry, so the 5D0→7F2 transition is clearly the
dominating emission band. In the other two nanoparticles there is more inversion symmetry and
especially in the LaF3 nanoparticles the 5D0→7F1 transition is the dominating emission band. The
emission peak of the 5D0→7F0 transition gives information on the number of different Eu3+ sites
present. Both levels are non-degenerate, so a single Eu3+ center should give rise to one emission
peak. In all three samples one emission peak was observed for the 5D0→7F0 around 578 nm,
leading to the conclusion that all Eu3+ ions are in a similar crystal site. In the LaF3 and LaVO4
nanoparticles the peak is however broader than in the LaPO4 nanoparticles, which could indicate
more disorder.
5D1 emission. The LaF3 nanoparticles clearly showed emission from the 5D1 level
indicating the low phonon energies of the LaF3 nanoparticles host. In the other two nanoparticles
the 5D1 emission could be observed, but due to multi-phonon relaxation the emissions were very
weak. The appearance of 5D1 emission in the LaF3 nanoparticles is comparable to the bulk
material and is not often observed in organic environment.19 This indicates that the shielding
form the organic environment is good and that emission properties of the bulk material are also
found in the nanoparticles. The separation between the 5D1 and 5D0 level is only 1750 cm-1 and
like in bulk LaF3 this gap cannot be bridged by multi-phonon emission. The emission of the 5D1
level is however strongly concentration dependent. A cross-relaxation process as described in
chapter 2 is responsible for quenching of the 5D1 emission at higher concentrations of Eu3+.
Figure 3.5 shows the emission spectrum of the 5D1 emission of LaF3:Eu at different Eu3+
concentrations, with the spectra normalized to the 5D0→7F1 emission peak at 591 nm.
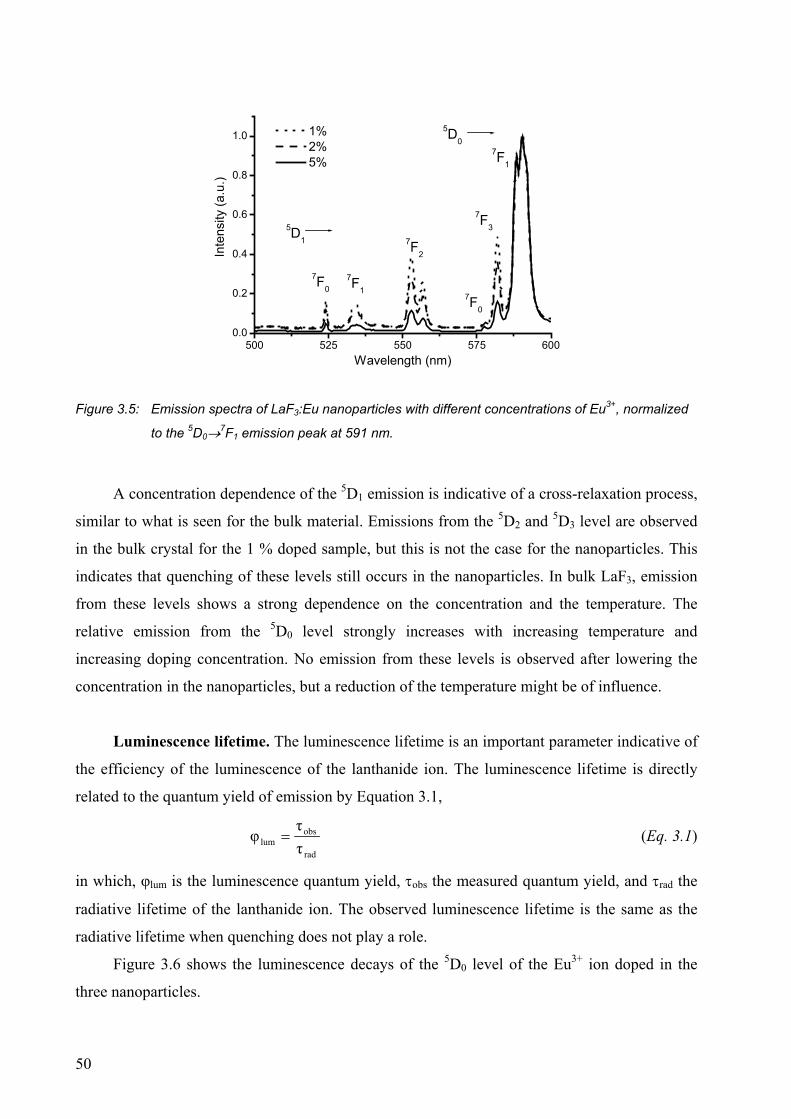
50
500 525 550 575 6000.0
0.2
0.4
0.6
0.8
1.07F1
5D1
5D0
7F0
7F3
7F2
7F1
7F0
1% 2% 5%
Inte
nsity
(a.u
.)
Wavelength (nm)
Figure 3.5: Emission spectra of LaF3:Eu nanoparticles with different concentrations of Eu3+, normalized
to the 5D0→7F1 emission peak at 591 nm.
A concentration dependence of the 5D1 emission is indicative of a cross-relaxation process,
similar to what is seen for the bulk material. Emissions from the 5D2 and 5D3 level are observed
in the bulk crystal for the 1 % doped sample, but this is not the case for the nanoparticles. This
indicates that quenching of these levels still occurs in the nanoparticles. In bulk LaF3, emission
from these levels shows a strong dependence on the concentration and the temperature. The
relative emission from the 5D0 level strongly increases with increasing temperature and
increasing doping concentration. No emission from these levels is observed after lowering the
concentration in the nanoparticles, but a reduction of the temperature might be of influence.
Luminescence lifetime. The luminescence lifetime is an important parameter indicative of
the efficiency of the luminescence of the lanthanide ion. The luminescence lifetime is directly
related to the quantum yield of emission by Equation 3.1,
rad
obslum τ
τφ = (Eq. 3.1)
in which, φlum is the luminescence quantum yield, τobs the measured quantum yield, and τrad the
radiative lifetime of the lanthanide ion. The observed luminescence lifetime is the same as the
radiative lifetime when quenching does not play a role.
Figure 3.6 shows the luminescence decays of the 5D0 level of the Eu3+ ion doped in the
three nanoparticles.
51
0 5 10 15 20 25 30 35 40
0.01
0.1
1 LaF3:Eu LaVO4:Eu LaPO4:Eu
Inte
nsity
(a.u
.)
Time (ms)
Figure 3.6: Luminescence decays of the Eu3+ 5D0 level in the three nanoparticles (λem. 591 nm for LaF3
and 613 nm for LaVO4 and LaPO4).
The decays of all three nanoparticles are not mono-exponential, because the decay does not
form a straight line in the log plot. A multi-exponential decay is caused by a difference in
quenching for different Eu3+ ions or a difference in radiative lifetime of the Eu3+ ions caused by
different symmetry sites. The influence of the nanoparticles surface, which always has a large
impact on nanoparticle properties, is probably the main cause for the existence of a non-mono-
exponential decay. In the next chapter a model will be described to fit the luminescence decay of
the lanthanide ions in these nanoparticles by taking into account surface effects. Another
possibility is to fit the decays using a multi-exponential decay. Although there is no physical
reason to do this,20 it does return average values of the main components of the luminescence
decay that can be compared to the lifetimes obtained for bulk materials and lifetimes obtained
from organic complexes. When comparing the lifetimes, the influence of the refractive index and
the symmetry of the Eu3+ site on the radiative lifetime of the Eu3+ ion have to be taken into
account. The comparison with lifetimes obtained for organic complexes is a good measure for
the shielding of the lanthanide ion from the organic environment. The luminescence lifetimes
were fitted using a bi-exponential decay. LaF3:Eu nanoparticles in dichloromethane have a
lifetime of 7.7 ms responsible for 74 % of the luminescence and 2.9 ms responsible for 26 % of
the luminescence. For LaVO4:Eu, the lifetimes are 0.67 ms (59 %) and 0.19 ms (41 %) in
dichloromethane and for LaPO4:Eu nanoparticles in methanol, the lifetimes are 7.1 ms (56 %)
and 3.9 ms (44 %). The luminescence lifetime of the Eu3+ ion in LaVO4 is clearly much shorter
52
than in the other matrices. In the LaVO4 nanoparticles the Eu3+ the ion is in a crystal site that has
no inversion symmetry as was concluded from the emission spectrum. As a result the radiative
lifetime of the Eu3+ ion in this matrix is much shorter than in the other two matrices. The
radiative lifetime of the Eu3+ ion is strongly dependent on the symmetry of the crystal site and
Werts et al. have proposed an equation from which the radiative lifetime of the Eu3+ ion can be
calculated from the shape of emission spectrum (Equation 2.1).21 Using Equation 2.1, radiative
lifetimes for LaF3:Eu, LaVO4:Eu, and LaPO4:Eu of 6.3, 0.8, and 4.8 ms, respectively, were
calculated. The long components of the measured lifetimes were even longer than the calculated
radiative lifetimes for LaF3 and LaPO4 nanoparticles, leading to calculated quantum yields above
100 %. These impossible calculated quantum yields could be a result of the influence of the
refractive index of the solvent on the measured luminescence lifetime. In the calculation, the
refractive indices of 1.59, 1.99, and 1.53 of the host materials were used, but due to the close
proximity of the solvent to the lanthanide ion, the refractive index of the solvent cannot be
ignored. A relation between the luminescence lifetime of Y2O3:Eu nanoparticles and the
refractive index of the surrounding medium was reported before.22 The obtained lifetimes are
also longer than the lifetimes measured for bulk materials19,23,24 These measured lifetimes were
6.7 ms, 0.35 ms, and 3.2 ms for LaF3, YVO4, and LaPO4, respectively. Comparison with the
lifetimes of the bulk materials indicates a high quantum yield for the nanoparticles and therefore
a good shielding of the lanthanide ion from the organic environment.
3.2.2 Strongly visible-emitting ions Tb3+, Dy3+, and Sm3+
Other lanthanide ions that generally show strong emission in the visible are Tb3+, Dy3+, and
Sm3+. The emission and excitation spectra of nanoparticles doped with these ions are shown in
Figure 3.7. Emission spectra recorded for LaVO4 nanoparticles are all taken by excitation in the
VO4 charge transfer band at a low nanoparticle concentration. The excitation spectra all show the
broad vanadate absorption band and due to the low concentration the absorption peaks of the
lanthanide ions were not observed.
The Tb3+ ion does not show emission in the LaVO4 nanoparticles. The excitation occurs
through the charge transfer band of the VO4 groups, but due to the low oxidation potential of
Tb3+, the ion can be oxidized to Tb4+, which does not show emission.25 In the emission spectra
very little differences can be observed between the other two nanoparticles of LaF3 and LaPO4.
Four emission peaks are observed of the 5D4→7FJ (J = 3 - 6) transitions after excitation at 380
nm. The positions of the major peaks are the same, because of the good shielding of the 4f
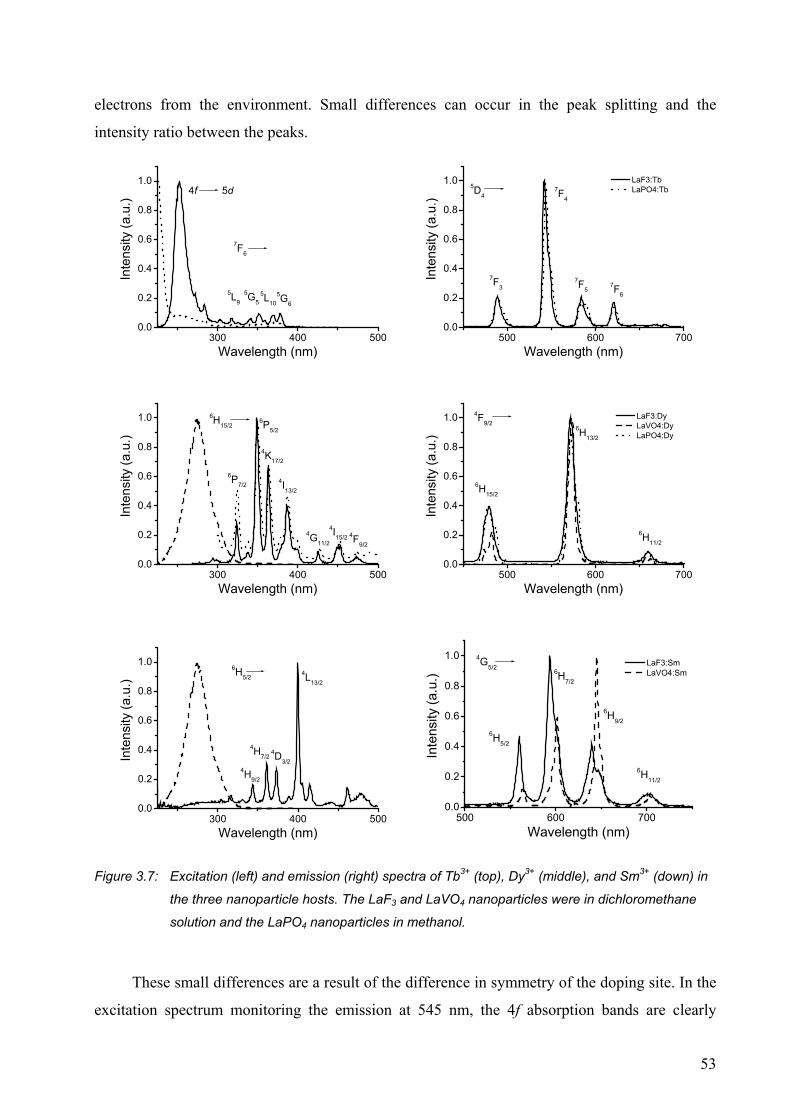
53
electrons from the environment. Small differences can occur in the peak splitting and the
intensity ratio between the peaks.
300 400 5000.0
0.2
0.4
0.6
0.8
1.0
5L10
5L95G5
5d4f
7F6
5G6
Inte
nsity
(a.u
.)
Wavelength (nm)
500 600 7000.0
0.2
0.4
0.6
0.8
1.0 LaF3:Tb LaPO4:Tb
7F6
7F5
7F4
7F3
5D4
Inte
nsity
(a.u
.)
Wavelength (nm)
300 400 5000.0
0.2
0.4
0.6
0.8
1.0 6H15/2
6P7/2
6P5/2
4K17/2
4I13/2
4G11/2
4I15/2 4F9/2
Inte
nsity
(a.u
.)
Wavelength (nm)
500 600 7000.0
0.2
0.4
0.6
0.8
1.0 LaF3:Dy LaVO4:Dy LaPO4:Dy
6H15/2
6H13/2
6H11/2
4F9/2In
tens
ity (a
.u.)
Wavelength (nm)
300 400 5000.0
0.2
0.4
0.6
0.8
1.0
4D3/2
4H7/2
4H9/2
6H5/24L13/2
Inte
nsity
(a.u
.)
Wavelength (nm)
500 600 7000.0
0.2
0.4
0.6
0.8
1.0 LaF3:Sm LaVO4:Sm
6H11/2
6H9/2
6H7/2
6H5/2
4G5/2
Inte
nsity
(a.u
.)
Wavelength (nm)
Figure 3.7: Excitation (left) and emission (right) spectra of Tb3+ (top), Dy3+ (middle), and Sm3+ (down) in
the three nanoparticle hosts. The LaF3 and LaVO4 nanoparticles were in dichloromethane
solution and the LaPO4 nanoparticles in methanol.
These small differences are a result of the difference in symmetry of the doping site. In the
excitation spectrum monitoring the emission at 545 nm, the 4f absorption bands are clearly
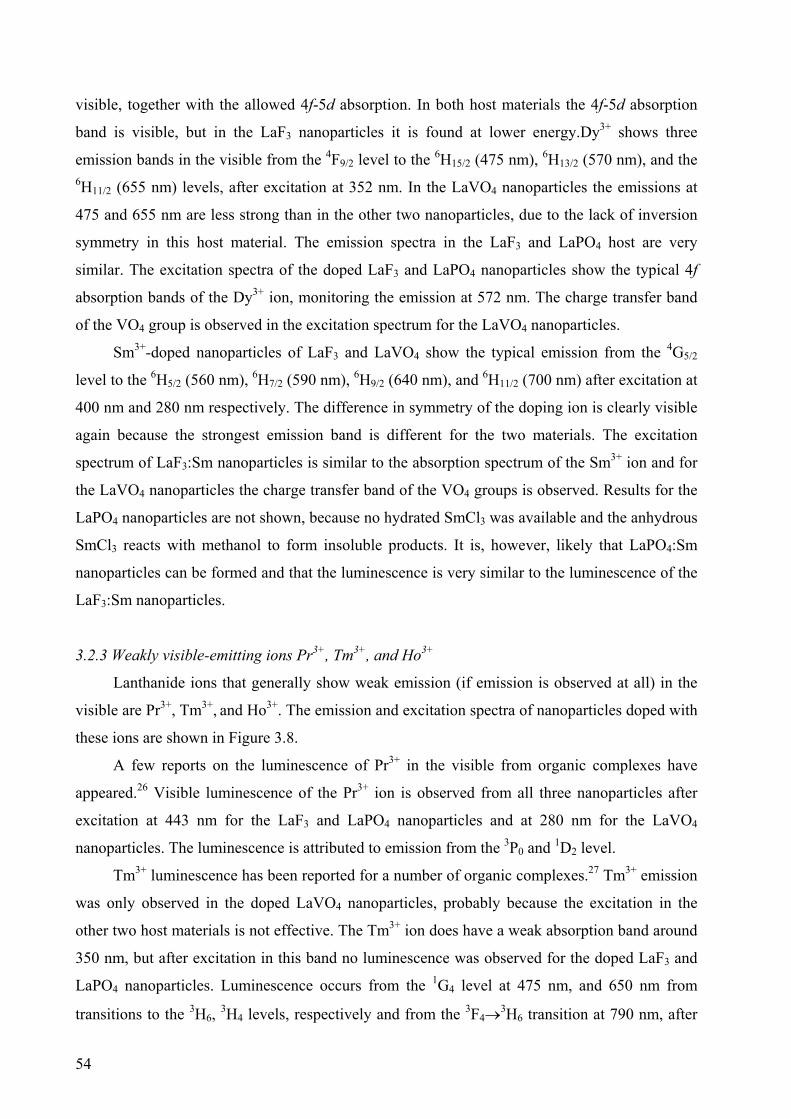
54
visible, together with the allowed 4f-5d absorption. In both host materials the 4f-5d absorption
band is visible, but in the LaF3 nanoparticles it is found at lower energy.Dy3+ shows three
emission bands in the visible from the 4F9/2 level to the 6H15/2 (475 nm), 6H13/2 (570 nm), and the 6H11/2 (655 nm) levels, after excitation at 352 nm. In the LaVO4 nanoparticles the emissions at
475 and 655 nm are less strong than in the other two nanoparticles, due to the lack of inversion
symmetry in this host material. The emission spectra in the LaF3 and LaPO4 host are very
similar. The excitation spectra of the doped LaF3 and LaPO4 nanoparticles show the typical 4f
absorption bands of the Dy3+ ion, monitoring the emission at 572 nm. The charge transfer band
of the VO4 group is observed in the excitation spectrum for the LaVO4 nanoparticles.
Sm3+-doped nanoparticles of LaF3 and LaVO4 show the typical emission from the 4G5/2
level to the 6H5/2 (560 nm), 6H7/2 (590 nm), 6H9/2 (640 nm), and 6H11/2 (700 nm) after excitation at
400 nm and 280 nm respectively. The difference in symmetry of the doping ion is clearly visible
again because the strongest emission band is different for the two materials. The excitation
spectrum of LaF3:Sm nanoparticles is similar to the absorption spectrum of the Sm3+ ion and for
the LaVO4 nanoparticles the charge transfer band of the VO4 groups is observed. Results for the
LaPO4 nanoparticles are not shown, because no hydrated SmCl3 was available and the anhydrous
SmCl3 reacts with methanol to form insoluble products. It is, however, likely that LaPO4:Sm
nanoparticles can be formed and that the luminescence is very similar to the luminescence of the
LaF3:Sm nanoparticles.
3.2.3 Weakly visible-emitting ions Pr3+, Tm3+, and Ho3+
Lanthanide ions that generally show weak emission (if emission is observed at all) in the
visible are Pr3+, Tm3+, and Ho3+. The emission and excitation spectra of nanoparticles doped with
these ions are shown in Figure 3.8.
A few reports on the luminescence of Pr3+ in the visible from organic complexes have
appeared.26 Visible luminescence of the Pr3+ ion is observed from all three nanoparticles after
excitation at 443 nm for the LaF3 and LaPO4 nanoparticles and at 280 nm for the LaVO4
nanoparticles. The luminescence is attributed to emission from the 3P0 and 1D2 level.
Tm3+ luminescence has been reported for a number of organic complexes.27 Tm3+ emission
was only observed in the doped LaVO4 nanoparticles, probably because the excitation in the
other two host materials is not effective. The Tm3+ ion does have a weak absorption band around
350 nm, but after excitation in this band no luminescence was observed for the doped LaF3 and
LaPO4 nanoparticles. Luminescence occurs from the 1G4 level at 475 nm, and 650 nm from
transitions to the 3H6, 3H4 levels, respectively and from the 3F4→3H6 transition at 790 nm, after
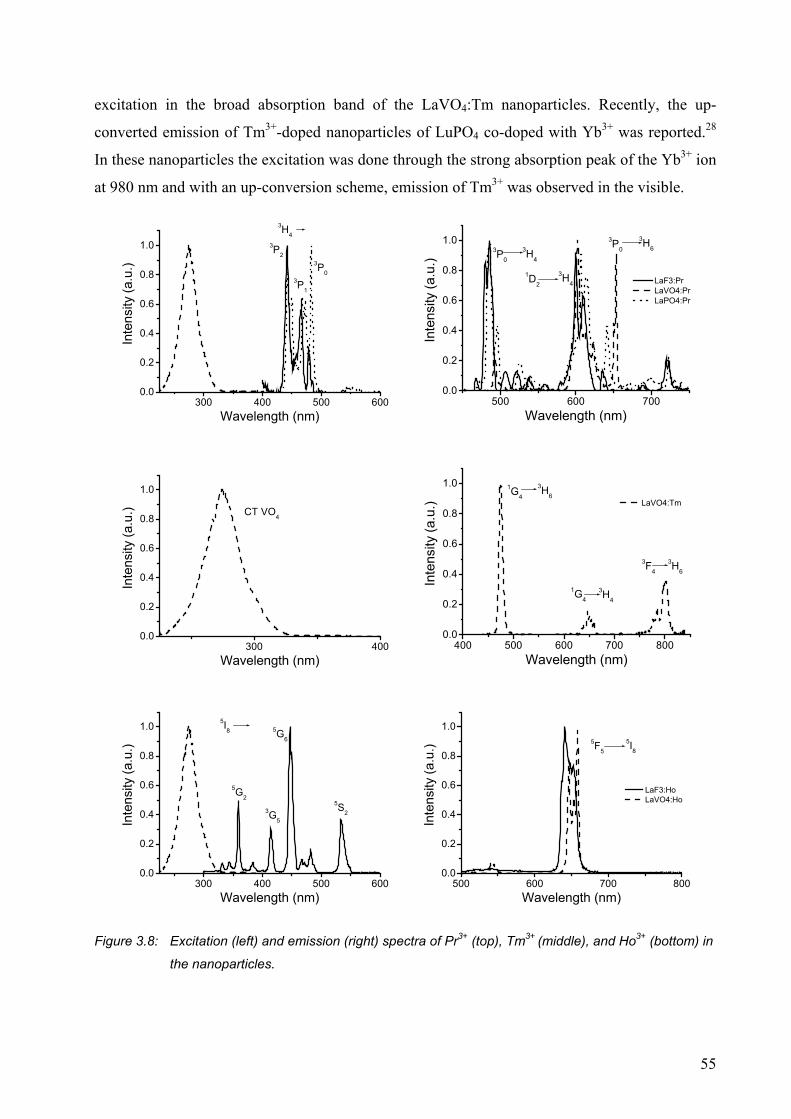
55
excitation in the broad absorption band of the LaVO4:Tm nanoparticles. Recently, the up-
converted emission of Tm3+-doped nanoparticles of LuPO4 co-doped with Yb3+ was reported.28
In these nanoparticles the excitation was done through the strong absorption peak of the Yb3+ ion
at 980 nm and with an up-conversion scheme, emission of Tm3+ was observed in the visible.
300 400 500 6000.0
0.2
0.4
0.6
0.8
1.0
3P1
3P0
3P2
3H4
Inte
nsity
(a.u
.)
Wavelength (nm)500 600 700
0.0
0.2
0.4
0.6
0.8
1.0
LaF3:Pr LaVO4:Pr LaPO4:Pr
3H41D2
3H63P03H4
3P0
Inte
nsity
(a.u
.)Wavelength (nm)
300 4000.0
0.2
0.4
0.6
0.8
1.0
CT VO4
Inte
nsity
(a.u
.)
Wavelength (nm)400 500 600 700 800
0.0
0.2
0.4
0.6
0.8
1.0
LaVO4:Tm
3H41G4
3H63F4
3H61G4
Inte
nsity
(a.u
.)
Wavelength (nm)
300 400 500 6000.0
0.2
0.4
0.6
0.8
1.0
5G2
3G5
5S2
5G6
5I8
Inte
nsity
(a.u
.)
Wavelength (nm)500 600 700 800
0.0
0.2
0.4
0.6
0.8
1.0
LaF3:Ho LaVO4:Ho
5I85F5
Inte
nsity
(a.u
.)
Wavelength (nm)
Figure 3.8: Excitation (left) and emission (right) spectra of Pr3+ (top), Tm3+ (middle), and Ho3+ (bottom) in
the nanoparticles.
56
This result shows that with an effective excitation it is probably also possible to observe
luminescence from the LaF3 and LaPO4 nanoparticles doped with Tm3+. Ho3+ luminescence has
not been reported in organic environment. In glasses emission can be observed from different
levels and in the visible the emission of the 5S2→5I8 transition usually dominates.29 Ho3+
luminescence was observed from the 5F5→5I8 transition at 640 nm in our nanoparticles of LaF3
and LaVO4. Only very weak emission from the 5S2 level was observed. The gap between the 5S2
level and the 5F5 level is only 3000 cm-1, which is resonant with the vibrational energy of a CH
bond. The presence of CH bonds at the outside of the nanoparticles might lead to an effective
non-radiative decay of the 5S2 level to the 5F5 level leading to a dominating luminescence of the 5F5 level. The effective shielding of the luminescent lanthanide ion is, however, demonstrated,
because for the first time Ho3+ luminescence is reported in organic media.
3.2.4 Determination of the quantum yield
Quantum yields of luminescent materials in solution are generally determined by
comparing the emission intensity of the solution with the emission intensity of a dye with a
known quantum yield. For these quantum yield determinations the absorption of the solution has
to be known precisely to correct for the amount of photons absorbed. Due to the low absorption
coefficients of the 4f bands of the lanthanide ions a precise measurement of the absorption is
virtually impossible. The absorption can be measured accurately when the excitation can be done
indirectly using a sensitizer with a high absorption coefficient. The Ce3+, Tb3+ lanthanide couple
offers the possibility to determine a quantum yield of the nanoparticles. Ce3+ has a strong
absorption band in the UV of an allowed 4f-5d transition and the Ce3+ ion can transfer its energy
efficiently to the Tb3+ ion leading to emission in the green. La0.4PO4:Ce0.45,Tb0.15 is a well known
phosphor, that is being applied in fluorescent lamps.30 From solutions of LaPO4:Ce,Tb and
LaF3:Ce,Tb nanoparticles, with the same lanthanide ion distribution, it is possible to determine
the quantum yield by comparing the emission intensity with the emission intensity of quinine
bisulfate in 1M H2SO4. The measured quantum yields were 12 % and 25 % for the LaPO4 and
LaF3 nanoparticles respectively, including the emission of Ce3+. The value found for the LaPO4
nanoparticles is lower than the value found by Haase et al.7 This can for a part be explained
because we used a different dye for comparison. Haase et al. used Rhodamine 6G in ethanol for
comparison, but this dye is not well suited for excitation in the UV, because it has a very low
absorption coefficient in the UV.31 The quantum yield of the LaF3:Ce,Tb can be increased by the
addition of a few drops of D2O to the dichloromethane solution. The quantum yield increased to
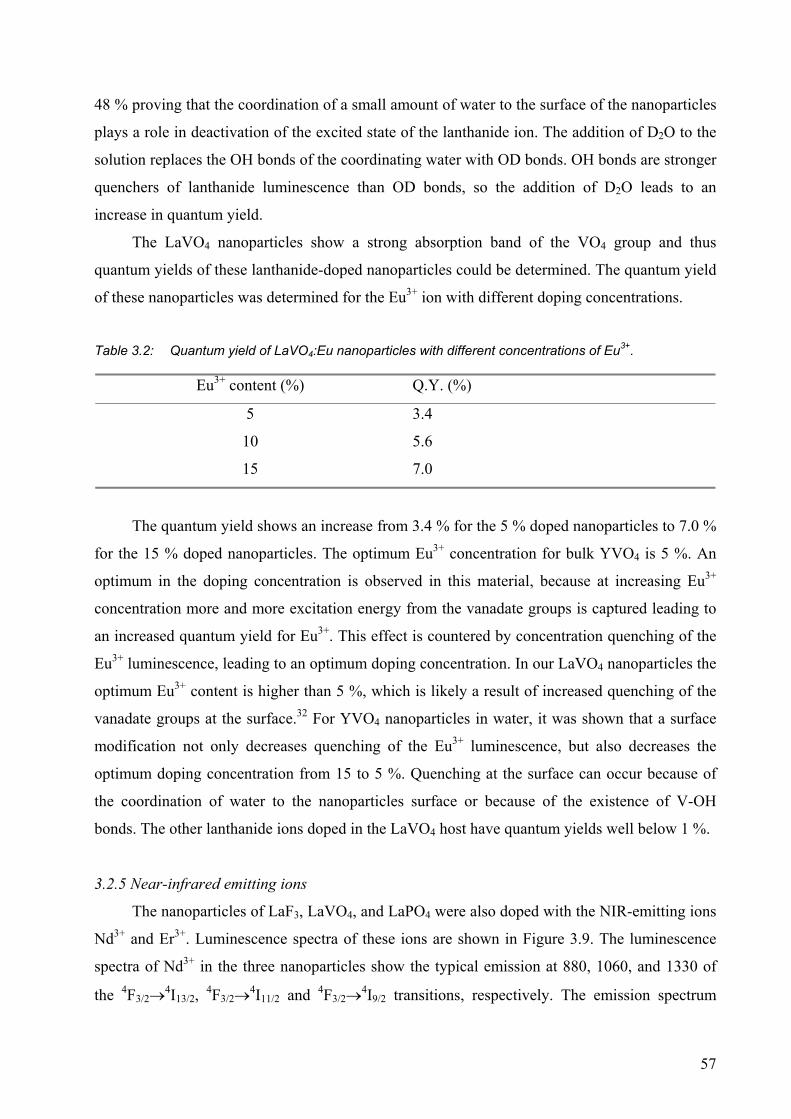
57
48 % proving that the coordination of a small amount of water to the surface of the nanoparticles
plays a role in deactivation of the excited state of the lanthanide ion. The addition of D2O to the
solution replaces the OH bonds of the coordinating water with OD bonds. OH bonds are stronger
quenchers of lanthanide luminescence than OD bonds, so the addition of D2O leads to an
increase in quantum yield.
The LaVO4 nanoparticles show a strong absorption band of the VO4 group and thus
quantum yields of these lanthanide-doped nanoparticles could be determined. The quantum yield
of these nanoparticles was determined for the Eu3+ ion with different doping concentrations.
Table 3.2: Quantum yield of LaVO4:Eu nanoparticles with different concentrations of Eu3+.
Eu3+ content (%) Q.Y. (%)
5 3.4
10 5.6
15 7.0
The quantum yield shows an increase from 3.4 % for the 5 % doped nanoparticles to 7.0 %
for the 15 % doped nanoparticles. The optimum Eu3+ concentration for bulk YVO4 is 5 %. An
optimum in the doping concentration is observed in this material, because at increasing Eu3+
concentration more and more excitation energy from the vanadate groups is captured leading to
an increased quantum yield for Eu3+. This effect is countered by concentration quenching of the
Eu3+ luminescence, leading to an optimum doping concentration. In our LaVO4 nanoparticles the
optimum Eu3+ content is higher than 5 %, which is likely a result of increased quenching of the
vanadate groups at the surface.32 For YVO4 nanoparticles in water, it was shown that a surface
modification not only decreases quenching of the Eu3+ luminescence, but also decreases the
optimum doping concentration from 15 to 5 %. Quenching at the surface can occur because of
the coordination of water to the nanoparticles surface or because of the existence of V-OH
bonds. The other lanthanide ions doped in the LaVO4 host have quantum yields well below 1 %.
3.2.5 Near-infrared emitting ions
The nanoparticles of LaF3, LaVO4, and LaPO4 were also doped with the NIR-emitting ions
Nd3+ and Er3+. Luminescence spectra of these ions are shown in Figure 3.9. The luminescence
spectra of Nd3+ in the three nanoparticles show the typical emission at 880, 1060, and 1330 of
the 4F3/2→4I13/2, 4F3/2→4I11/2 and 4F3/2→4I9/2 transitions, respectively. The emission spectrum
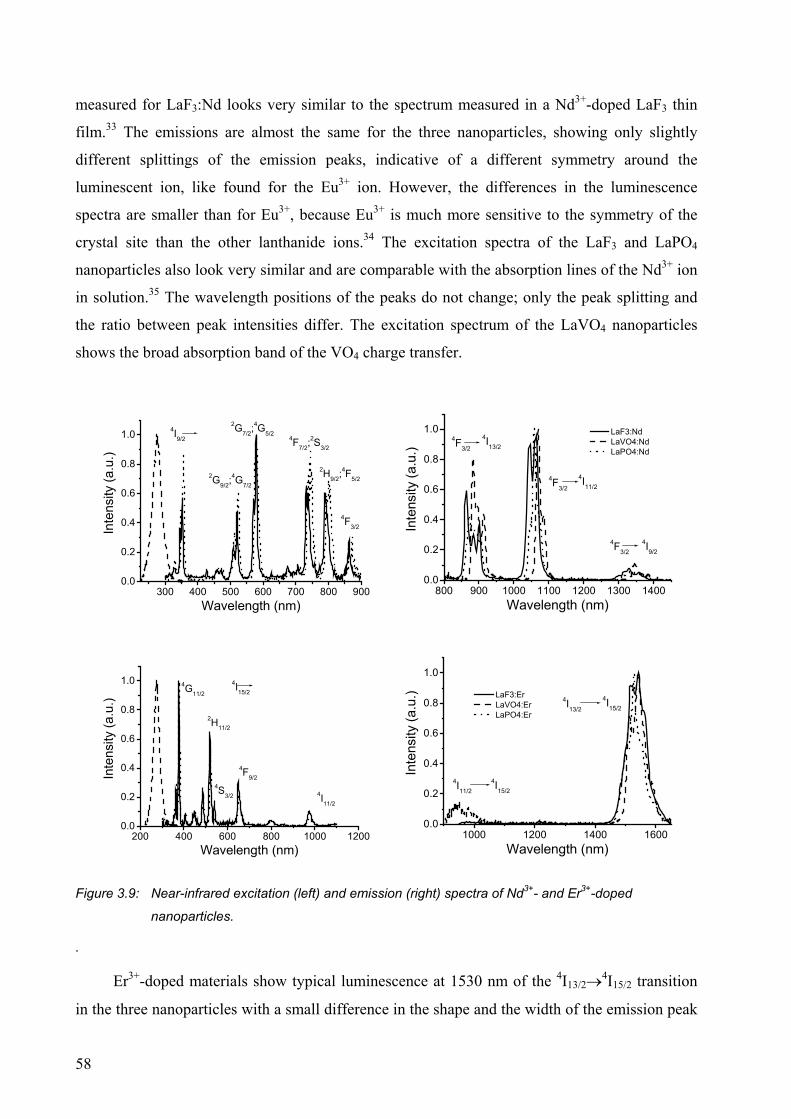
58
measured for LaF3:Nd looks very similar to the spectrum measured in a Nd3+-doped LaF3 thin
film.33 The emissions are almost the same for the three nanoparticles, showing only slightly
different splittings of the emission peaks, indicative of a different symmetry around the
luminescent ion, like found for the Eu3+ ion. However, the differences in the luminescence
spectra are smaller than for Eu3+, because Eu3+ is much more sensitive to the symmetry of the
crystal site than the other lanthanide ions.34 The excitation spectra of the LaF3 and LaPO4
nanoparticles also look very similar and are comparable with the absorption lines of the Nd3+ ion
in solution.35 The wavelength positions of the peaks do not change; only the peak splitting and
the ratio between peak intensities differ. The excitation spectrum of the LaVO4 nanoparticles
shows the broad absorption band of the VO4 charge transfer.
300 400 500 600 700 800 9000.0
0.2
0.4
0.6
0.8
1.0
2G9/2;4G7/2
2G7/2;4G5/2
4F7/2;2S3/2
2H9/2;4F5/2
4F3/2
4I9/2
Inte
nsity
(a.u
.)
Wavelength (nm)800 900 1000 1100 1200 1300 1400
0.0
0.2
0.4
0.6
0.8
1.0
4I9/2
4I11/2
4I13/24F3/2
4F3/2
4F3/2
LaF3:Nd LaVO4:Nd LaPO4:Nd
Inte
nsity
(a.u
.)
Wavelength (nm)
200 400 600 800 1000 12000.0
0.2
0.4
0.6
0.8
1.0 4G11/2
2H11/2
4S3/2
4F9/2
4I11/2
4I15/2
Inte
nsity
(a.u
.)
Wavelength (nm)1000 1200 1400 1600
0.0
0.2
0.4
0.6
0.8
1.0
LaF3:Er LaVO4:Er LaPO4:Er
4I11/24I15/2
4I15/24I13/2
Inte
nsity
(a.u
.)
Wavelength (nm)
Figure 3.9: Near-infrared excitation (left) and emission (right) spectra of Nd3+- and Er3+-doped
nanoparticles.
.
Er3+-doped materials show typical luminescence at 1530 nm of the 4I13/2→4I15/2 transition
in the three nanoparticles with a small difference in the shape and the width of the emission peak
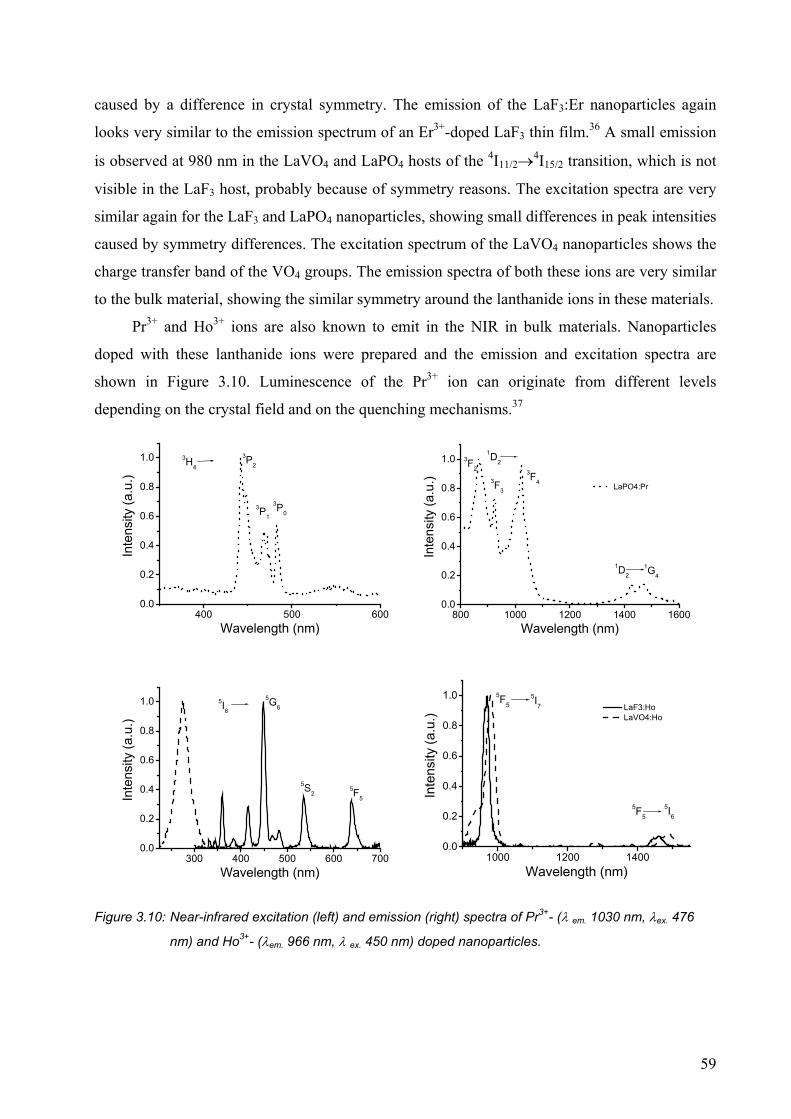
59
caused by a difference in crystal symmetry. The emission of the LaF3:Er nanoparticles again
looks very similar to the emission spectrum of an Er3+-doped LaF3 thin film.36 A small emission
is observed at 980 nm in the LaVO4 and LaPO4 hosts of the 4I11/2→4I15/2 transition, which is not
visible in the LaF3 host, probably because of symmetry reasons. The excitation spectra are very
similar again for the LaF3 and LaPO4 nanoparticles, showing small differences in peak intensities
caused by symmetry differences. The excitation spectrum of the LaVO4 nanoparticles shows the
charge transfer band of the VO4 groups. The emission spectra of both these ions are very similar
to the bulk material, showing the similar symmetry around the lanthanide ions in these materials.
Pr3+ and Ho3+ ions are also known to emit in the NIR in bulk materials. Nanoparticles
doped with these lanthanide ions were prepared and the emission and excitation spectra are
shown in Figure 3.10. Luminescence of the Pr3+ ion can originate from different levels
depending on the crystal field and on the quenching mechanisms.37
400 500 6000.0
0.2
0.4
0.6
0.8
1.0
3P03P1
3P23H4
Inte
nsity
(a.u
.)
Wavelength (nm)800 1000 1200 1400 1600
0.0
0.2
0.4
0.6
0.8
1.0
LaPO4:Pr3F3
3F4
3F2
1D2
1G41D2
Inte
nsity
(a.u
.)
Wavelength (nm)
300 400 500 600 7000.0
0.2
0.4
0.6
0.8
1.0 5G6
5S25F5
5I8
Inte
nsity
(a.u
.)
Wavelength (nm)1000 1200 1400
0.0
0.2
0.4
0.6
0.8
1.0 LaF3:Ho LaVO4:Ho
5I65F5
5I7
5F5
Inte
nsity
(a.u
.)
Wavelength (nm)
Figure 3.10: Near-infrared excitation (left) and emission (right) spectra of Pr3+- (λ em. 1030 nm, λex. 476
nm) and Ho3+- (λem. 966 nm, λ ex. 450 nm) doped nanoparticles.
60
Luminescence originating from the 1D2 level was observed in LaPO4:Pr nanoparticles by
excitation with the 476 nm line of an Ar+ laser. The absence of emission from the 1G4→3H5
transition at 1300 nm indicates that non-radiative processes dominate for this level, similar to the
electroluminescence that was observed of an organic complex.38 When the LaF3:Pr nanoparticles
were excited using the same laser line, no emission was observed, although it is known that the
Pr3+ ion can emit very efficiently in this host matrix.39 It is possible that Pr3+ does not absorb at
this wavelength in the LaF3 host or that the Pr3+ ion is very sensitive to the small amount of
water present at the surface of the LaF3. Under excitation with an Xe arc lamp at 443 nm, the
emission of LaPO4:Pr could also be detected, but only weak emission was observed for LaF3:Pr
nanoparticles.
Emission of the Ho3+ ion could be detected in the LaF3:Ho and LaVO4:Ho nanoparticles at
960 and 1460 nm from the 5F5→5I7 and 5F5→5I6 transitions. The emission of the LaVO4:Ho
nanoparticles was substantially weaker than for the LaF3:Ho nanoparticles, which could be a
result of the higher phonon energies of the host material. The LaPO4:Ho nanoparticles did not
show any luminescence at all, probably due to the high phonon energies. Ho3+ emission was also
not detected in bulk YPO4 indicating that the high-energy phonons of the lattice prevent
emission in this host material.40 NIR emission of Ho3+ in an organic environment has not been
reported till now and for Pr3+ the reports are limited, proving the good shielding against the
organic groups when they are doped in the nanoparticles. The spectral window between 1300-
1600 nm, which is of interest to telecommunication purposes, can be covered completely with
the emissions of these NIR-emitting lanthanide ions.
Yb3+ co-doping. The Yb3+ ion is often used as a sensitizer for Er3+ emission, because of a
higher absorption coefficient and an efficient energy transfer to the Er3+ ion. The Yb3+ ion has
only one excited state 4f level and it can be excited over a broad range from 940-1000 nm with a
peak at 980 nm. The LaVO4 nanoparticles offer the possibility for excitation in the UV because
of the charge transfer band of the VO4 group, but also the LaPO4 nanoparticles offer the
possibility to excite the Yb3+ ion in the UV. The Yb3+ ion has a low reduction potential similar to
the Eu3+ ion and in the LaPO4 nanoparticles this gives rise to a charge transfer band peaking at
250 nm. The emission and excitation spectra of LaPO4:Yb nanoparticles in methanol-d4 are
shown in Figure 3.11.
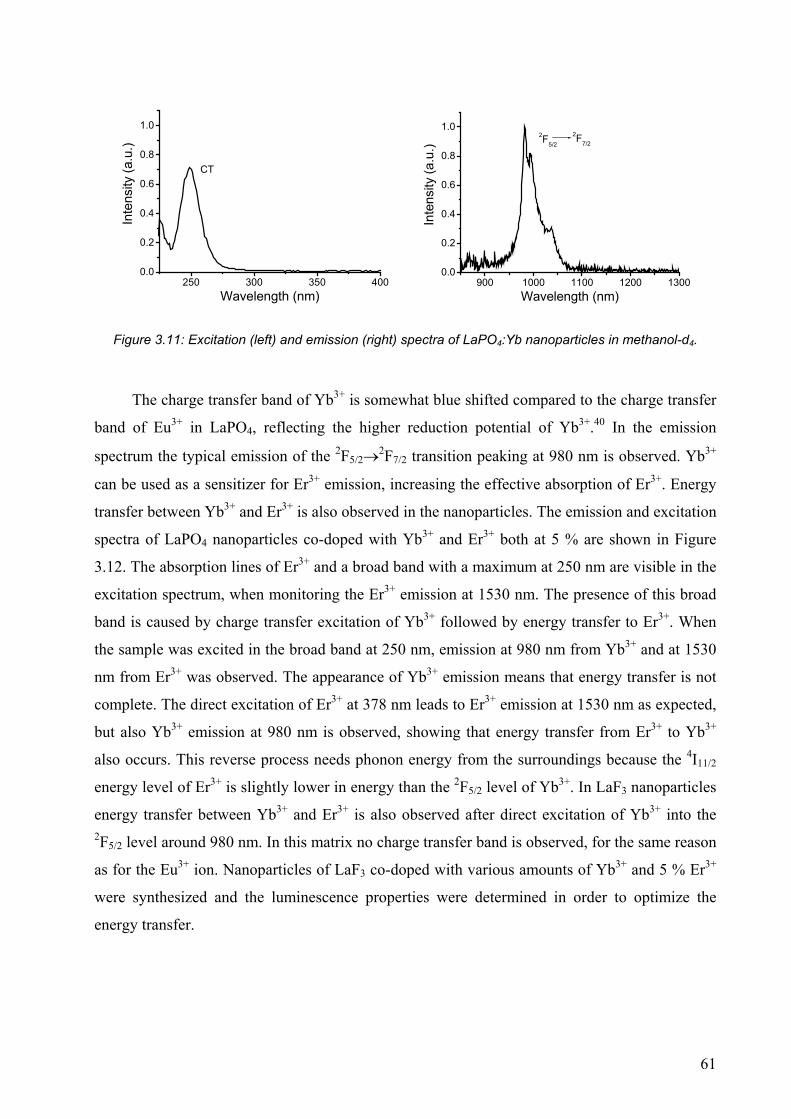
61
250 300 350 4000.0
0.2
0.4
0.6
0.8
1.0
CT
Inte
nsity
(a.u
.)
Wavelength (nm)900 1000 1100 1200 1300
0.0
0.2
0.4
0.6
0.8
1.02F7/2
2F5/2
Inte
nsity
(a.u
.)
Wavelength (nm)
Figure 3.11: Excitation (left) and emission (right) spectra of LaPO4:Yb nanoparticles in methanol-d4.
The charge transfer band of Yb3+ is somewhat blue shifted compared to the charge transfer
band of Eu3+ in LaPO4, reflecting the higher reduction potential of Yb3+.40 In the emission
spectrum the typical emission of the 2F5/2→2F7/2 transition peaking at 980 nm is observed. Yb3+
can be used as a sensitizer for Er3+ emission, increasing the effective absorption of Er3+. Energy
transfer between Yb3+ and Er3+ is also observed in the nanoparticles. The emission and excitation
spectra of LaPO4 nanoparticles co-doped with Yb3+ and Er3+ both at 5 % are shown in Figure
3.12. The absorption lines of Er3+ and a broad band with a maximum at 250 nm are visible in the
excitation spectrum, when monitoring the Er3+ emission at 1530 nm. The presence of this broad
band is caused by charge transfer excitation of Yb3+ followed by energy transfer to Er3+. When
the sample was excited in the broad band at 250 nm, emission at 980 nm from Yb3+ and at 1530
nm from Er3+ was observed. The appearance of Yb3+ emission means that energy transfer is not
complete. The direct excitation of Er3+ at 378 nm leads to Er3+ emission at 1530 nm as expected,
but also Yb3+ emission at 980 nm is observed, showing that energy transfer from Er3+ to Yb3+
also occurs. This reverse process needs phonon energy from the surroundings because the 4I11/2
energy level of Er3+ is slightly lower in energy than the 2F5/2 level of Yb3+. In LaF3 nanoparticles
energy transfer between Yb3+ and Er3+ is also observed after direct excitation of Yb3+ into the 2F5/2 level around 980 nm. In this matrix no charge transfer band is observed, for the same reason
as for the Eu3+ ion. Nanoparticles of LaF3 co-doped with various amounts of Yb3+ and 5 % Er3+
were synthesized and the luminescence properties were determined in order to optimize the
energy transfer.
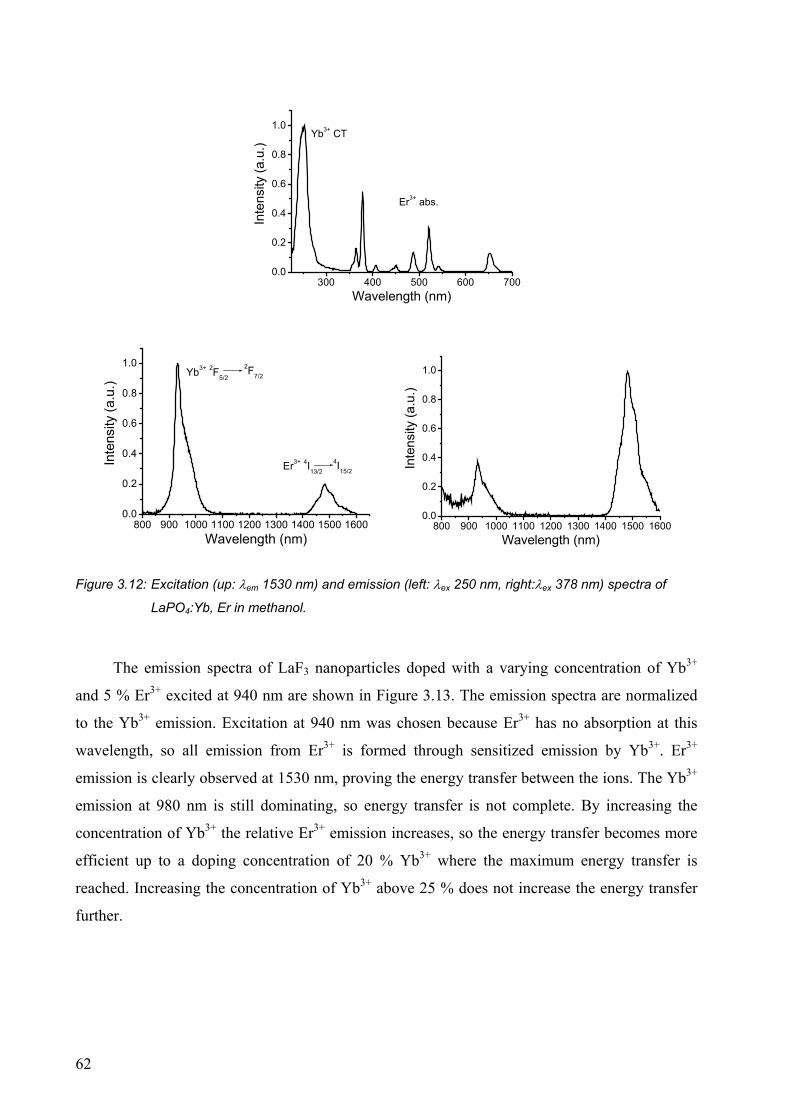
62
300 400 500 600 7000.0
0.2
0.4
0.6
0.8
1.0Yb3+ CT
Er3+ abs.
Inte
nsity
(a.u
.)
Wavelength (nm)
800 900 1000 1100 1200 1300 1400 1500 16000.0
0.2
0.4
0.6
0.8
1.0
4I15/2Er3+ 4I13/2
2F7/2Yb3+ 2F5/2
Inte
nsity
(a.u
.)
Wavelength (nm)800 900 1000 1100 1200 1300 1400 1500 1600
0.0
0.2
0.4
0.6
0.8
1.0
Inte
nsity
(a.u
.)
Wavelength (nm)
Figure 3.12: Excitation (up: λem 1530 nm) and emission (left: λex 250 nm, right:λex 378 nm) spectra of
LaPO4:Yb, Er in methanol.
The emission spectra of LaF3 nanoparticles doped with a varying concentration of Yb3+
and 5 % Er3+ excited at 940 nm are shown in Figure 3.13. The emission spectra are normalized
to the Yb3+ emission. Excitation at 940 nm was chosen because Er3+ has no absorption at this
wavelength, so all emission from Er3+ is formed through sensitized emission by Yb3+. Er3+
emission is clearly observed at 1530 nm, proving the energy transfer between the ions. The Yb3+
emission at 980 nm is still dominating, so energy transfer is not complete. By increasing the
concentration of Yb3+ the relative Er3+ emission increases, so the energy transfer becomes more
efficient up to a doping concentration of 20 % Yb3+ where the maximum energy transfer is
reached. Increasing the concentration of Yb3+ above 25 % does not increase the energy transfer
further.
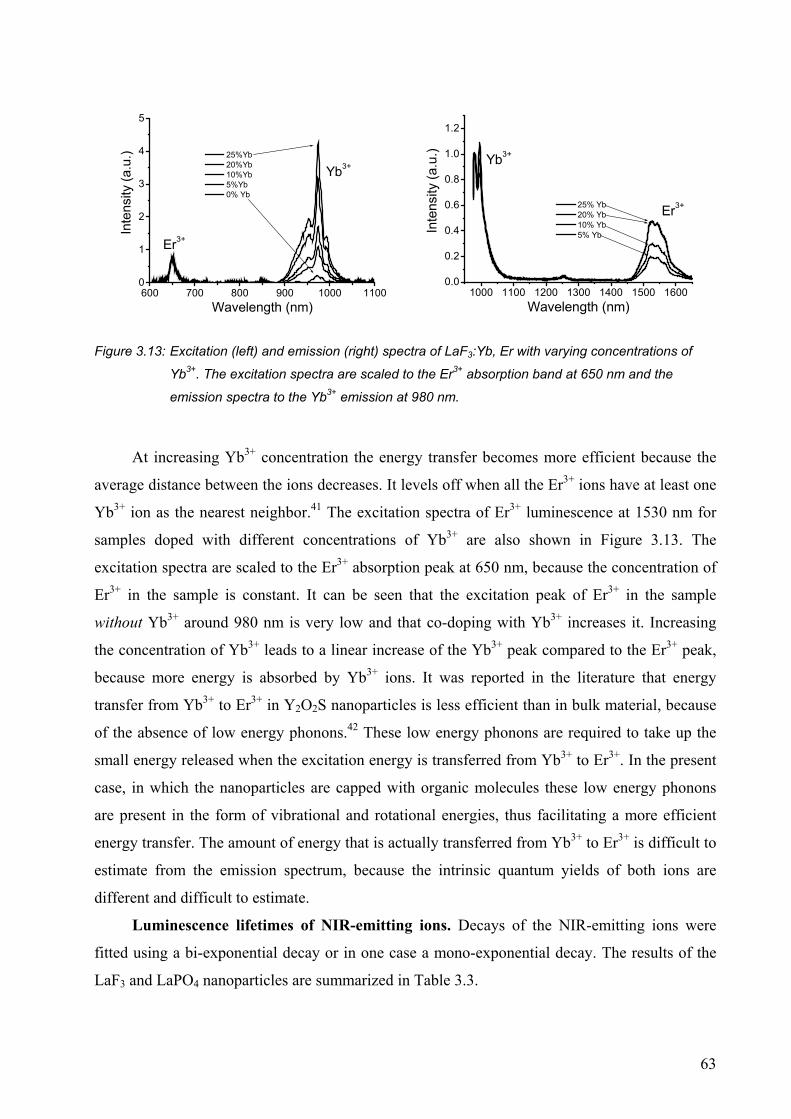
63
600 700 800 900 1000 11000
1
2
3
4
5
Er3+
Yb3+ 25%Yb 20%Yb 10%Yb 5%Yb 0% Yb
Inte
nsity
(a.u
.)
Wavelength (nm)
1000 1100 1200 1300 1400 1500 16000.0
0.2
0.4
0.6
0.8
1.0
1.2
Er3+
Yb3+
25% Yb 20% Yb 10% Yb 5% YbIn
tens
ity (a
.u.)
Wavelength (nm)
Figure 3.13: Excitation (left) and emission (right) spectra of LaF3:Yb, Er with varying concentrations of
Yb3+. The excitation spectra are scaled to the Er3+ absorption band at 650 nm and the
emission spectra to the Yb3+ emission at 980 nm.
At increasing Yb3+ concentration the energy transfer becomes more efficient because the
average distance between the ions decreases. It levels off when all the Er3+ ions have at least one
Yb3+ ion as the nearest neighbor.41 The excitation spectra of Er3+ luminescence at 1530 nm for
samples doped with different concentrations of Yb3+ are also shown in Figure 3.13. The
excitation spectra are scaled to the Er3+ absorption peak at 650 nm, because the concentration of
Er3+ in the sample is constant. It can be seen that the excitation peak of Er3+ in the sample
without Yb3+ around 980 nm is very low and that co-doping with Yb3+ increases it. Increasing
the concentration of Yb3+ leads to a linear increase of the Yb3+ peak compared to the Er3+ peak,
because more energy is absorbed by Yb3+ ions. It was reported in the literature that energy
transfer from Yb3+ to Er3+ in Y2O2S nanoparticles is less efficient than in bulk material, because
of the absence of low energy phonons.42 These low energy phonons are required to take up the
small energy released when the excitation energy is transferred from Yb3+ to Er3+. In the present
case, in which the nanoparticles are capped with organic molecules these low energy phonons
are present in the form of vibrational and rotational energies, thus facilitating a more efficient
energy transfer. The amount of energy that is actually transferred from Yb3+ to Er3+ is difficult to
estimate from the emission spectrum, because the intrinsic quantum yields of both ions are
different and difficult to estimate.
Luminescence lifetimes of NIR-emitting ions. Decays of the NIR-emitting ions were
fitted using a bi-exponential decay or in one case a mono-exponential decay. The results of the
LaF3 and LaPO4 nanoparticles are summarized in Table 3.3.
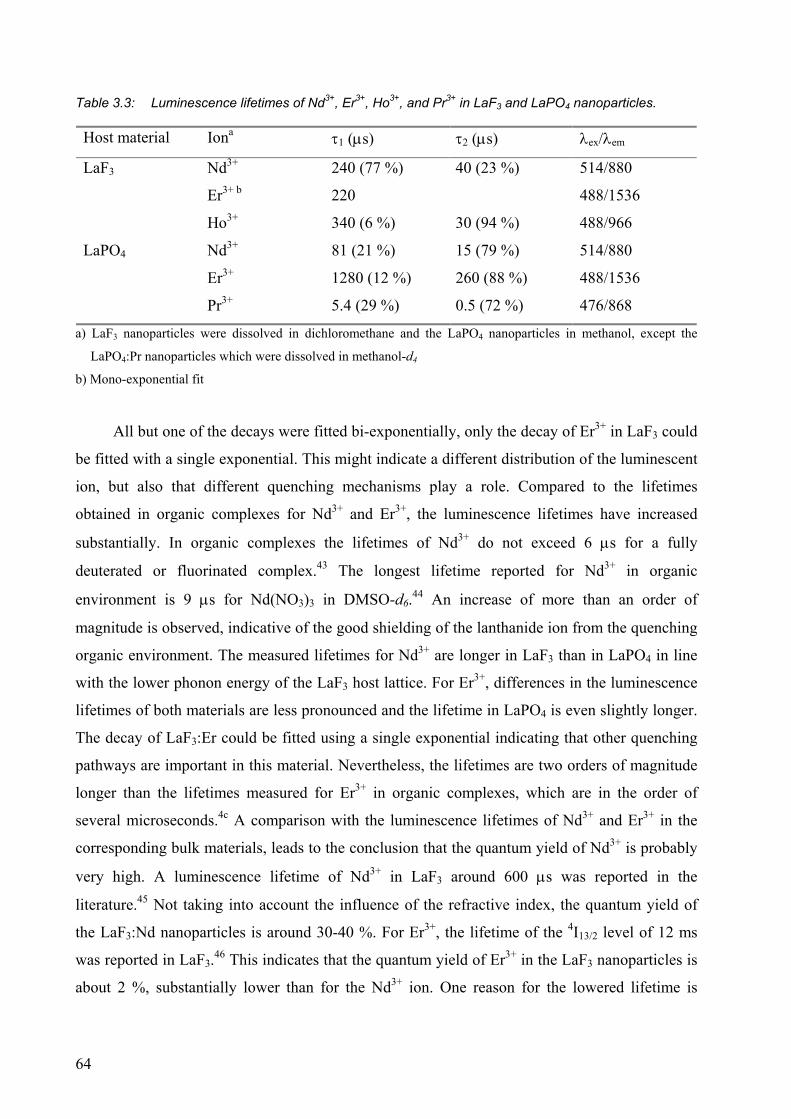
64
Table 3.3: Luminescence lifetimes of Nd3+, Er3+, Ho3+, and Pr3+ in LaF3 and LaPO4 nanoparticles.
Host material Iona τ1 (µs) τ2 (µs) λex/λem
LaF3 Nd3+ 240 (77 %) 40 (23 %) 514/880
Er3+ b 220 488/1536
Ho3+ 340 (6 %) 30 (94 %) 488/966
LaPO4 Nd3+ 81 (21 %) 15 (79 %) 514/880
Er3+ 1280 (12 %) 260 (88 %) 488/1536
Pr3+ 5.4 (29 %) 0.5 (72 %) 476/868
a) LaF3 nanoparticles were dissolved in dichloromethane and the LaPO4 nanoparticles in methanol, except the
LaPO4:Pr nanoparticles which were dissolved in methanol-d4
b) Mono-exponential fit
All but one of the decays were fitted bi-exponentially, only the decay of Er3+ in LaF3 could
be fitted with a single exponential. This might indicate a different distribution of the luminescent
ion, but also that different quenching mechanisms play a role. Compared to the lifetimes
obtained in organic complexes for Nd3+ and Er3+, the luminescence lifetimes have increased
substantially. In organic complexes the lifetimes of Nd3+ do not exceed 6 µs for a fully
deuterated or fluorinated complex.43 The longest lifetime reported for Nd3+ in organic
environment is 9 µs for Nd(NO3)3 in DMSO-d6.44 An increase of more than an order of
magnitude is observed, indicative of the good shielding of the lanthanide ion from the quenching
organic environment. The measured lifetimes for Nd3+ are longer in LaF3 than in LaPO4 in line
with the lower phonon energy of the LaF3 host lattice. For Er3+, differences in the luminescence
lifetimes of both materials are less pronounced and the lifetime in LaPO4 is even slightly longer.
The decay of LaF3:Er could be fitted using a single exponential indicating that other quenching
pathways are important in this material. Nevertheless, the lifetimes are two orders of magnitude
longer than the lifetimes measured for Er3+ in organic complexes, which are in the order of
several microseconds.4c A comparison with the luminescence lifetimes of Nd3+ and Er3+ in the
corresponding bulk materials, leads to the conclusion that the quantum yield of Nd3+ is probably
very high. A luminescence lifetime of Nd3+ in LaF3 around 600 µs was reported in the
literature.45 Not taking into account the influence of the refractive index, the quantum yield of
the LaF3:Nd nanoparticles is around 30-40 %. For Er3+, the lifetime of the 4I13/2 level of 12 ms
was reported in LaF3.46 This indicates that the quantum yield of Er3+ in the LaF3 nanoparticles is
about 2 %, substantially lower than for the Nd3+ ion. One reason for the lowered lifetime is
65
probably concentration quenching, because the Er3+ luminescence lifetime is strongly
concentration dependent, so a decrease of the Er3+ concentration should lead to a substantial
increase in the luminescence lifetime.
For the other two ions no data on the luminescence lifetime in organic media are available,
so no comparison can be made. For bulk LaF3:Ho a luminescence lifetime of the 5F5 level of 300
µs was reported.47 This would indicate a quantum yield for the LaF3:Ho nanoparticles of around
10 %. For LaPO4 doped with Pr3+ no data could be found. Most research efforts of Pr3+-doped
materials focus on the 1G4→3H5 transition of Pr3+ around 1300 nm. This transition requires a
material with a low phonon energy, so LaPO4 is not of interest. However, in our case, Pr3+ shows
luminescence in a high phonon lattice around 1450 nm, which could also be of interest to
telecommunication purposes.
3.3 Conclusions
Nanoparticles of LaF3, LaVO4, and LaPO4 doped with lanthanide ions show luminescence
properties that are very similar to the corresponding bulk materials. Quenching of the lanthanide
ions in these nanoparticles is strongly reduced compared to the same ions in organic complexes.
The luminescence decay of the ions is not mono-exponential, so not all ions in the nanoparticles
have the same probability of decay.
3.4 Experimental section
General
TEM images were collected on a Philips CM 30 Twin FTEM, operating at 300 kV. Samples were
prepared by evaporating a drop of a diluted nanoparticle dispersion, in methanol in the case of LaPO4 and
dichloromethane in the case of LaF3 and LaVO4 nanoparticles, on a carbon coated 200 mesh copper grid.
Size distributions were determined by measuring the sizes of at least 100 nanoparticles from different
places on the grid. Melting points were determined with a Reichert melting point apparatus and are
uncorrected. Mass spectra were recorded on a Finnigan MAT 90 spectrometer using m-NBA (nitrobenzyl
alcohol) as a matrix or on a Perkin Elmer/Perspective biosystems Voyager-DE-RP MALDI-TOF mass
spectrometer. IR spectra were recorded with a Perkin Elmer Spectrum BX FT-IR System using KBr
pellets as matrix. 1H NMR spectra were recorded with a Varian-300 spectrometer using CDCl3 as the
solvent unless stated otherwise, using residual CHCl3 (δ = 7.26 ppm) as the internal standard. X-ray
fluorescence was carried out on a Philips PW 1489 spectrometer using LaF3, Li3PO4, Eu2O3, Nd2O3,
66
Er2O3, Pr6O11, and Ho2O3 as the standards. Elemental analyses were performed on a Carlo Erba EA 1106
apparatus. The lanthanide salts were purchased from Aldrich or Acros in the highest purity available (at
least 99.9 %). Octadecanol (99 %), Sodium fluoride (99 %), and tris(ethylhexyl)phosphate (98 %) were
purchased from Fluka, phosphorous pentasulfide (99 %) from Aldrich and trioctylamine (98 %) from
Acros. All chemicals were used as received without further purification. CH2Cl2 and hexane were distilled
from CaCl2, ethyl acetate was distilled from K2CO3.
Compound 1
19 g (0.07 mol) Octadecanol and 4.44 g (0.02 mol) P2S5 were heated at 75°C for 3 hours. The suspension
was cooled to room temperature followed by the addition of 50 ml of dichloromethane. To remove
inorganic salts the solution was filtered followed by evaporation of the solvent. The remaining residue
was taken up in 50 ml of hexane and ammonia was bubbled through the solution. The precipitate was
separated by filtration, washed with hexane, and dried; yield 13.3 g, 60 %, m.p. 103-106 °C. 1H NMR
(DMSO-d6): δ 7.2-6.9 (broad, 4H), 3.7 (dt, J = 8.1, 6.6 Hz, 4H), 1.5-1.4 (m, 4H), 1.35-1.1 (m, 60H), 0.84
(t, J = 6.2 Hz, 6H); MS (MALDI-TOF) m/z = 634.0 [(M-NH4+)-, calcd. for C36H74O2PS2: 633.5]; Anal
calcd. for C36H78NO2PS2: C, 66.31, H, 12.06, N, 2.15, S, 9.83. Found C, 66.50, H, 12.24, N, 2.27, S, 9.56.
Compound 2
20 g (0.079 mol) Bromoundecanol, 9.6 g (0.1 mol) phenol, and 4.5 g (0.1mol) K2CO3 were refluxed in
100 ml acetonitril overnight under an argon atmosphere. The reaction mixture was cooled to room
temperature and 300 ml of ethylacetate was added. The organic phase was washed three times with 1 N
NaOH and dried over MgSO4. The solvent was evaporated and the residue dried.
19.58 g (0.074 mol) of the alcohol obtained in the first step and 4.7 g (0.021 mol) P2S5 were heated at 75
°C for 3 hours. The suspension was cooled to room temperature followed by the addition of 50 ml of
dichloromethane. To remove inorganic salts the solution was filtered and the solvent evaporated. The
remaining residue was taken up in 50 ml of hexane and ammonia was bubbled through the solution. The
precipitate was separated by filtration, washed with hexane, and dried; yield 19.8 g, 78 % m.p. 80-82 °C. 1H NMR (Acetone d6): δ 7.8-7.5 (broad, 4H), 7.3 (m, 4H), 6.9 (m, 6H), 4.0 (t, J = 6.6 Hz, 4 H), 3.9 (dt, J
= 8.1, 6.6 Hz, 4H), 1.8 (m, 4H), 1.6 (m, 32H); MS (FAB) m/z = 621.1 [(M-NH4+)-, calcd. for
C34H54O4PS2: 621.3]; Anal calcd. for C34H58NO4PS2: C, 63.81, H, 9.14, N, 2.19, S, 10.02. Found C, 63.87,
H, 9.04, N, 2.23, S, 10.07.
LaPO4 nanoparticles
1 Mmol of the hydrated LnCl3 (Ln = La3+, Eu3+, Nd3+, Er3+ or Pr3+) was first dissolved in 10 ml of
methanol followed by the addition of 6 ml of tris(ethylhexyl)phosphate and evaporation of the methanol
under vacuum. The solution was heated to 70°C under vacuum to remove water and methanol. A solution
67
of 1 mmol orthophosphoric acid and 3 mmol trioctylamine in 3 ml of tris(ethylhexyl)phosphate was
added and the reaction mixture was heated at 200°C under argon. After 40 hours the solution was cooled
to room temperature and methanol was added to precipitate the nanoparticles. The nanoparticles were
separated by centrifugation and washed two times with methanol. The nanoparticles were soluble in
methanol by the addition of tetramethylammonium hydroxide. The nanoparticles can be precipitated by
the addition of ethyl acetate and separated by centrifugation.
LaF3 nanoparticles
The LaF3 nanoparticles were prepared by heating a solution of 0.95 mmol of compound 1 (618 mg) or
compound 2 (608 mg) and 126 mg (1 mmol) NaF in 35 ml ethanol/water at 75°C. A solution of
La(NO3)3.6H2O and Eu(NO3)3
.6H2O (1.33 mmol total) in 2 ml of water was added dropwise and the
solution was stirred at 75°C for 2 hours and then cooled to room temperature. The precipitate was
separated by centrifugation and was washed subsequently with water and ethanol. The nanoparticles were
further purified by dispersing in dichloromethane and precipitation by the addition of ethanol. After
separation by centrifugation the nanoparticles were dried in vacuum over P2O5 for two days. After drying
the nanoparticles, they are soluble in apolar solvents like chloroform, dichloromethane, and toluene.
LaVO4 nanoparticles
These nanoparticles were synthesized as the LaF3 nanoparticles but instead of NaF, Na3VO4 was used.
Photophysical measurements
Photoluminescence measurements in the visible were done with an Edinburgh Instruments FS/FL
instrument with a 450 W Xe arc lamp for steady state measurements and for the time-resolved
measurements a micro-flashlamp as the excitation source. The excitation light was fed to a
monochromator (single grating, 1800 lines/mm) and focused on a square quartz cuvet (1x1 cm)
containing the nanoparticle solution. The emitted visible light was fed to a second monochromator (1800
lines/mm grating) and collected on a red sensitive Peltier element cooled Hamamatsu R955 PMT. The
emission spectra were corrected for the detector response and the excitation spectra were corrected for the
lamp intensity. The NIR spectrum of Ho3+ was measured with the same instrument using a liquid nitrogen
cooled Ge detector and a monochromator equipped with a 600 lines/mm grating. The other NIR spectra
were measured by exciting the samples with a CW Ar+ ion laser operating at 488 nm (Er3+), 476 nm
(Pr3+), and 514 nm (Nd3+). The continuous light was modulated with an acousto-optic modulator and
focused on the sample in 1x1 cm quartz cuvettes. The signal was focused with a 20 cm lens on a
monochromator and detected at the monochromator exit with a liquid nitrogen cooled Ge detector
(Northcoast) or a PMT (AgOCS) for the spectral region between 700-1000 nm. The signal of the detector
was fed to a lock-in amplifier. The spectra of the near-infrared emitting ions were measured with a
resolution of 6 nm and of the visible emitting ions with a resolution of 0.9 nm. The concentration of the
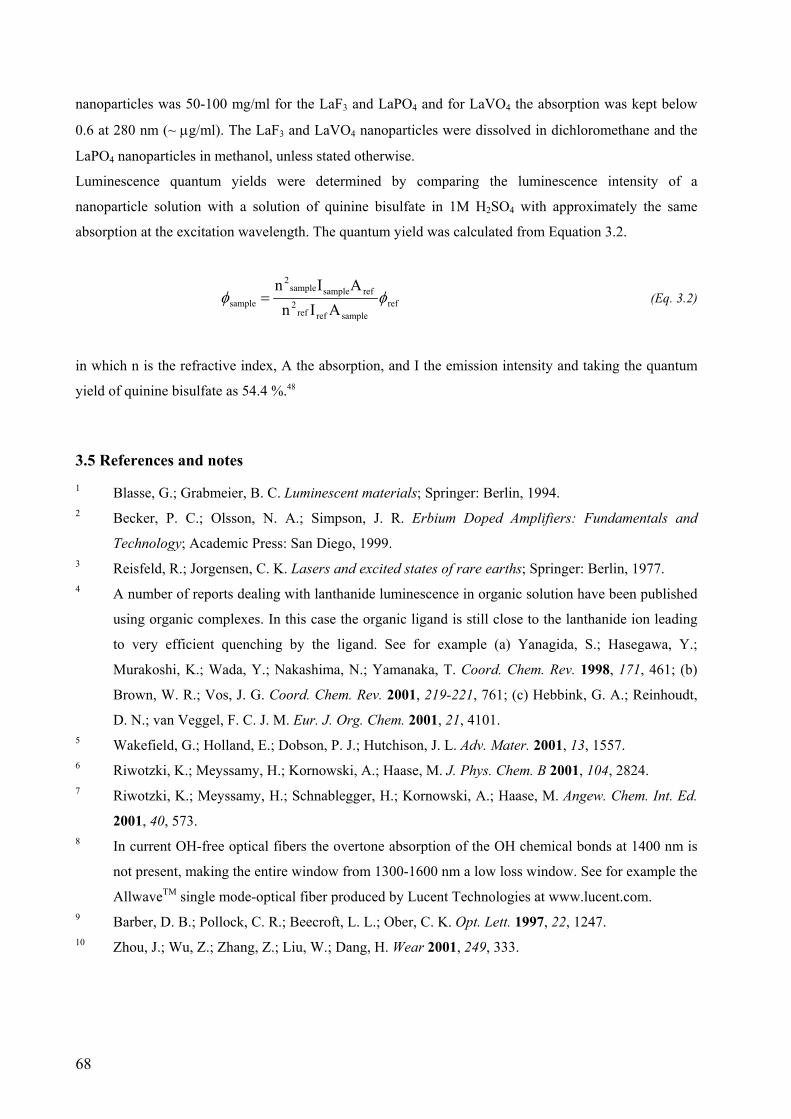
68
nanoparticles was 50-100 mg/ml for the LaF3 and LaPO4 and for LaVO4 the absorption was kept below
0.6 at 280 nm (~ µg/ml). The LaF3 and LaVO4 nanoparticles were dissolved in dichloromethane and the
LaPO4 nanoparticles in methanol, unless stated otherwise.
Luminescence quantum yields were determined by comparing the luminescence intensity of a
nanoparticle solution with a solution of quinine bisulfate in 1M H2SO4 with approximately the same
absorption at the excitation wavelength. The quantum yield was calculated from Equation 3.2.
refsamplerefref
2refsamplesample
2
sample AInAIn
φφ = (Eq. 3.2)
in which n is the refractive index, A the absorption, and I the emission intensity and taking the quantum
yield of quinine bisulfate as 54.4 %.48
3.5 References and notes 1 Blasse, G.; Grabmeier, B. C. Luminescent materials; Springer: Berlin, 1994. 2 Becker, P. C.; Olsson, N. A.; Simpson, J. R. Erbium Doped Amplifiers: Fundamentals and
Technology; Academic Press: San Diego, 1999. 3 Reisfeld, R.; Jorgensen, C. K. Lasers and excited states of rare earths; Springer: Berlin, 1977. 4 A number of reports dealing with lanthanide luminescence in organic solution have been published
using organic complexes. In this case the organic ligand is still close to the lanthanide ion leading
to very efficient quenching by the ligand. See for example (a) Yanagida, S.; Hasegawa, Y.;
Murakoshi, K.; Wada, Y.; Nakashima, N.; Yamanaka, T. Coord. Chem. Rev. 1998, 171, 461; (b)
Brown, W. R.; Vos, J. G. Coord. Chem. Rev. 2001, 219-221, 761; (c) Hebbink, G. A.; Reinhoudt,
D. N.; van Veggel, F. C. J. M. Eur. J. Org. Chem. 2001, 21, 4101. 5 Wakefield, G.; Holland, E.; Dobson, P. J.; Hutchison, J. L. Adv. Mater. 2001, 13, 1557. 6 Riwotzki, K.; Meyssamy, H.; Kornowski, A.; Haase, M. J. Phys. Chem. B 2001, 104, 2824. 7 Riwotzki, K.; Meyssamy, H.; Schnablegger, H.; Kornowski, A.; Haase, M. Angew. Chem. Int. Ed.
2001, 40, 573. 8 In current OH-free optical fibers the overtone absorption of the OH chemical bonds at 1400 nm is
not present, making the entire window from 1300-1600 nm a low loss window. See for example the
AllwaveTM single mode-optical fiber produced by Lucent Technologies at www.lucent.com. 9 Barber, D. B.; Pollock, C. R.; Beecroft, L. L.; Ober, C. K. Opt. Lett. 1997, 22, 1247. 10 Zhou, J.; Wu, Z.; Zhang, Z.; Liu, W.; Dang, H. Wear 2001, 249, 333.
69
11 The ligand was changed from pyridinium di-n-tetradecylthiophosphate to ligands 1 or 2, because
nanoparticles stabilized with these ligands show higher solubility after drying. 12 When the stronger coordinating dialkyl phosphate ligand was used no nanoparticles were formed,
but only the complex of the lanthanide ion with the ligand, as could be seen from the luminescence
spectrum and the luminescence lifetime. The coordination of this ligand is apparently too strong to
allow nanoparticle growth. 13 Scattering is dependent on the nanoparticle size and the difference in refractive index between the
nanoparticles and the polymer. For a nanoparticle size of 10 nm, large differences in refractive
index can be used and still scattering will be negligible. 14 Payne, S. A.; Chase, L. L.; Smith, L. K.; Kway, W. L.; Krupke, W. F. IEEE J. Quant. Electron.
1992, 28, 2619. 15 Weber, M. J. Phys. Rev. B 1967, 10, 2837. 16 Carnall, W. T.; Goodman, G. L.; Rajnak, K.; Rana, R. S. J. Chem. Phys. 1989, 90, 3443. 17 Riwotzky, K.; Haase, M. J. Phys. Chem. B 1998, 102, 10129. 18 Ropp, R. C. J. Electrochem. Soc. 1968, 115, 841. 19 Crosswhite, H. M.; Moos, H. W. Optical properties of ions in crystals; Interscience Publishers:
New York, 1967, p 467. 20 Fitting the luminescence decay using two exponentials assumes that there are two different sets of
Eu3+ ions present in the sample. Assuming a random distribution of the ions over the nanoparticles
there is a gradual change in lifetime going from the surface to the core of the nanoparticle. 21 Werts, M. H. V.; Jukes, R. T. F.; Verhoeven, J. W. Phys. Chem. Chem. Phys. 2002, 4, 1542. 22 Tissue, B. M. Chem. Mater. 1998, 10, 2837. 23 Hsu, C.; Powell, R. C. J. Lumin. 1975, 10, 273. 24 Dexpert-Ghys, J.; Mauricot, R.; Faucher, M. D. J. Lumin. 1996, 69, 203. 25 Blasse, G. Prog. Solid St. Chem. 1988, 18, 79. 26 (a) Oude Wolbers, M. P.; van Veggel, F. C. J. M.; Snellink Ruël, B. H. M.; Hofstraat, J. W.;
Geurts, F. A. J.; Reinhoudt, D. N. J. Chem. Soc., Perkin Trans. 2 1998, 10, 2141; (b) Voloshin, A.
I.; Shavaleev, N. M.; Kazakov, V. P. J. Lumin. 2001, 93, 199; (c) Macalik, L.; Hanuza, J.;
Hermanowicz, K.; Oganowski, W.; Ban-Oganowski, H. J. Alloy. Comp. 2000, 300-301, 383. 27 (a) Sharma, P. K.; van Doorn, A. R.; Staring, A. G. J. J. Lumin. 1994, 62, 219; (b) Serra, O. A.;
Nassar, E. J.; Calefi, P. S.; Rosa, I. L. V. J. Alloy. Comp. 1998, 277, 838; (c) Hong, Z. R.; Li, W.
L.; Zhao, D. X.; Liang, C. J.; Liu, X. Y.; Peng, J. B.; Zhao, D. Synth. Met. 1999, 104, 165. 28 Heer, S.; Lehmann, O.; Haase, M.; Güdel, H. U. Angew. Chem. Int. Ed. 2003, 42, 3179.
70
29 (a) Reddy, B. R.; Nash-Stevenson, S.; Venkateswarlu, P. J. Opt. Soc. Am. B 1994, 11, 923; (b)
Malinowski, M.; Frukacz, Z.; Szuflińska, M.; Wnuk, A.; Kaczkan, M. J. Alloy. Comp. 2000, 300-
301, 389. 30 Maestro, P.; Huguenin, D. J. Alloy. Comp. 1995, 225, 520. 31 Demas, J. N.; Crosby, G. A. J. Phys. Chem. 1971, 75, 991. 32 Huignard, A.; Buisette, V.; Franville, A. C.; Gacoin, T.; Boilot, J. P. J. Phys. Chem. B 2003, 107,
6754. 33 Bhutta, T.; Chardon, A. M.; Shepherd, D. P.; Daran, C.; Serrano, C.; Munoz-Yague, A. IEEE J.
Quant. Elec. 2001, 37, 1469. 34 Kirby, A. F.; Richardson, F. S. J. Phys. Chem. 1983, 87, 2544. 35 Heller, A. J. Am. Chem. Soc. 1967, 89, 167. 36 Buchal, C.; Siegrist, T.; Jacobson, D. C.; Poate, J. M. Appl. Phys. Lett. 1996, 68, 438. 37 Nishida, Y.; Yamada, M.; Kanamori, T.; Kobayashi, K.; Temmyo, J.; Sudo, S.; Ohishi, Y. IEEE J.
Quantum Elec. 1998, 34, 1332. 38 Hong, Z.; Liang, C.; Li, R.; Zang, F.; Fan, D.; Li, W.; Hung, L. S.; Lee, S. T. Appl. Phys. Lett.
2001, 79, 13. 39 Hegarty, J.; Huber, D. L.; Yen, W. M. Phys. Rev. B 1982, 25, 5638. 40 Nakazawa, E.; J. Lum. 2002, 100, 89. 41 Manssmann, M Z. Kristall. 1965, 122, 375. 42 Liu, G. K.; Zhuang, H. Z.; Chen, X. Y. Nano Lett. 2002, 2, 535. 43 Yanagida, S.; Hasegawa, Y.; Murakoshi, K.; Wada, Y.; Nakashima, N.; Yamanka, T. Coord.
Chem. Rev. 1998, 171, 461. 44 Beeby, A.; Faulkner, S. Chem. Phys. Lett. 1997, 266, 116. 45 Lahoz, F.; Daran, E.; Zhang, X.; Muñoz-Yagüe, A.; Cases, R.; Alcalá, R. J. Appl. Phys. 1999, 86,
3699. 46 Buchal, C.; Siegrist, T.; Jacobson, D. C.; Poate, J. M. Appl. Phys. Lett. 1996, 68, 438. 47 Zhang, X.; Liu, X.; Jouart, J. P.; Mary, G. J. Lumin. 1998, 78, 289. 48 Eaton, D. F. Pure Appl. Chem. 1988, 60, 1107.
71
CCCHHHAAAPPPTTTEEERRR 444 Surface effects on the luminescence of lanthanide(III)-doped nanoparticles*
Nanoparticles consist for a large part of surface atoms. Luminescence of lanthanide-
doped nanoparticles is therefore always influenced by the way the surface is
terminated. In this chapter, the influence of the surroundings on the luminescence
lifetime of lanthanide ions doped in nanoparticles is investigated. The influences of
the quenching strength of the solvent and the refractive index of the solvent on the
luminescence lifetime were studied. Concentration quenching was investigated by
changing the doping concentration of the luminescent ion. The high-energy
vibrations of molecules outside the nanoparticles are the most important quenchers
and a model is proposed to fit the non-mono-exponential luminescence decay taking
into account quenching from the surface.
* The major part of the work in this chapter was published: Stouwdam, J. W.; van Veggel, F. C. J. M. Nano Lett.
2002, 2, 733; Hebbink, G. A.; Stouwdam, J. W.; Reinhoudt, D. N.; van Veggel, F. C. J. M. Adv. Mater. 2002, 14,
1147; Stouwdam, J. W.; Hebbink, G. A.; Huskens, J.; van Veggel, F. C. J. M. Chem. Mater. 2003, 15, 4604.
72
4.1 Introduction
The spectra of lanthanide or transition metal ion doped nanoparticles usually do not differ
much from the spectra of the same bulk material.1 In a bulk crystals, the sites that are close to the
surface do not contribute significantly to the overall properties of the material. However, in
nanocrystals, the surface sites cannot be neglected, because they provide a major contribution to
the total. The ratio of surface site, to bulk site, in the nanoparticles is strongly dependent on the
size of the nanoparticles. The coordination of water and other organic molecules to the surface of
the nanoparticles can lead to quenching of the excited state of the lanthanide ion by the high-
energy vibrations of the bonds. Krebs et al. found that the main source of quenching of Yb3+-
doped in γ-Al2O3 nanoparticles was the coordination of water to the surface of the nanoparticles.2
The surface quenching leads to a non-mono-exponential decay of the luminescence of the Yb3+
ion. Deviations from exponential decay were found more often for example in YVO4:Eu
nanoparticles. Different symmetry sites were found by site-selective excitation.3 Eu3+ ions in
different symmetry sites have different radiative lifetimes leading to a multi-exponential decay
of the Eu3+ luminescence. The refractive index surrounding the nanoparticles can have a
significant effect as well on the luminescence lifetime of Eu3+ ions doped in Y2O3 nanoparticles.4
The measured luminescence lifetime can differ by a factor of three when the nanoparticles are
dispersed in carbon disulfide or in air, with the longest lifetime for a medium with the lowest
refractive index. The influence of the refractive index on the spontaneous emission rate has also
been studied for a Eu3+ complex in solution.5 The coordination of the ligand around the Eu3+ ion
can change when the complex is dissolved in different solvents, leading to a significant effect on
the radiative lifetime of the Eu3+ ion.6 These differences in coordination overshadow the
influence of the refractive index. The coordination around the Eu3+ ion in nanoparticles is fixed,
making them ideal for the study of the refractive index on the radiative lifetimes of the doping
ions.
The Tb3+ luminescence of CePO4:Tb nanoparticles synthesized by Haase et al. did not
show a mono-exponential decay. A model, taking into account randomly distributed quenchers,
was used to fit the decay.7 This model has been used for bulk crystals when randomly distributed
quenchers were incorporated in the crystal lattice. A strong solvent effect was also reported in
the case of these nanoparticles, indicating that quenching from outside the nanoparticles plays an
important role. Quenchers outside the nanoparticles are not randomly distributed, but are at the
surface and in the solvent surrounding the nanoparticles, so this model cannot be used to
describe a multi-exponential decay, when surface quenching is important.
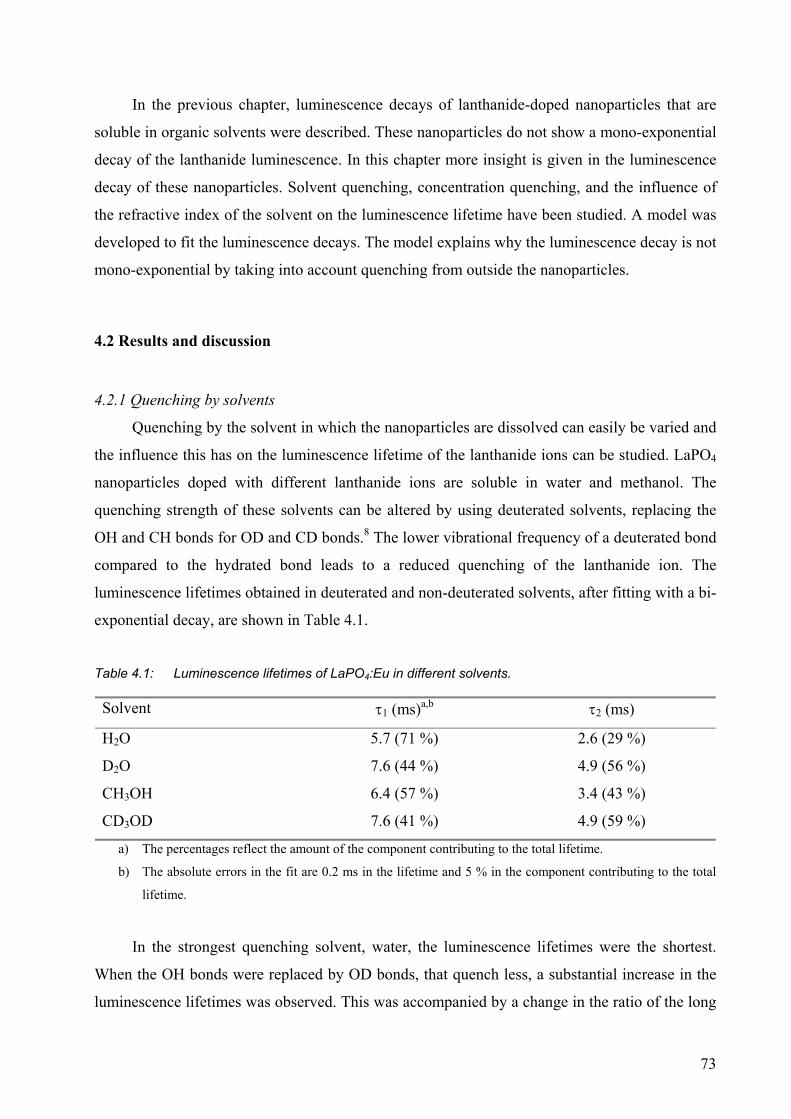
73
In the previous chapter, luminescence decays of lanthanide-doped nanoparticles that are
soluble in organic solvents were described. These nanoparticles do not show a mono-exponential
decay of the lanthanide luminescence. In this chapter more insight is given in the luminescence
decay of these nanoparticles. Solvent quenching, concentration quenching, and the influence of
the refractive index of the solvent on the luminescence lifetime have been studied. A model was
developed to fit the luminescence decays. The model explains why the luminescence decay is not
mono-exponential by taking into account quenching from outside the nanoparticles.
4.2 Results and discussion
4.2.1 Quenching by solvents
Quenching by the solvent in which the nanoparticles are dissolved can easily be varied and
the influence this has on the luminescence lifetime of the lanthanide ions can be studied. LaPO4
nanoparticles doped with different lanthanide ions are soluble in water and methanol. The
quenching strength of these solvents can be altered by using deuterated solvents, replacing the
OH and CH bonds for OD and CD bonds.8 The lower vibrational frequency of a deuterated bond
compared to the hydrated bond leads to a reduced quenching of the lanthanide ion. The
luminescence lifetimes obtained in deuterated and non-deuterated solvents, after fitting with a bi-
exponential decay, are shown in Table 4.1.
Table 4.1: Luminescence lifetimes of LaPO4:Eu in different solvents.
Solvent τ1 (ms)a,b τ2 (ms)
H2O 5.7 (71 %) 2.6 (29 %)
D2O 7.6 (44 %) 4.9 (56 %)
CH3OH 6.4 (57 %) 3.4 (43 %)
CD3OD 7.6 (41 %) 4.9 (59 %)
a) The percentages reflect the amount of the component contributing to the total lifetime.
b) The absolute errors in the fit are 0.2 ms in the lifetime and 5 % in the component contributing to the total
lifetime.
In the strongest quenching solvent, water, the luminescence lifetimes were the shortest.
When the OH bonds were replaced by OD bonds, that quench less, a substantial increase in the
luminescence lifetimes was observed. This was accompanied by a change in the ratio of the long
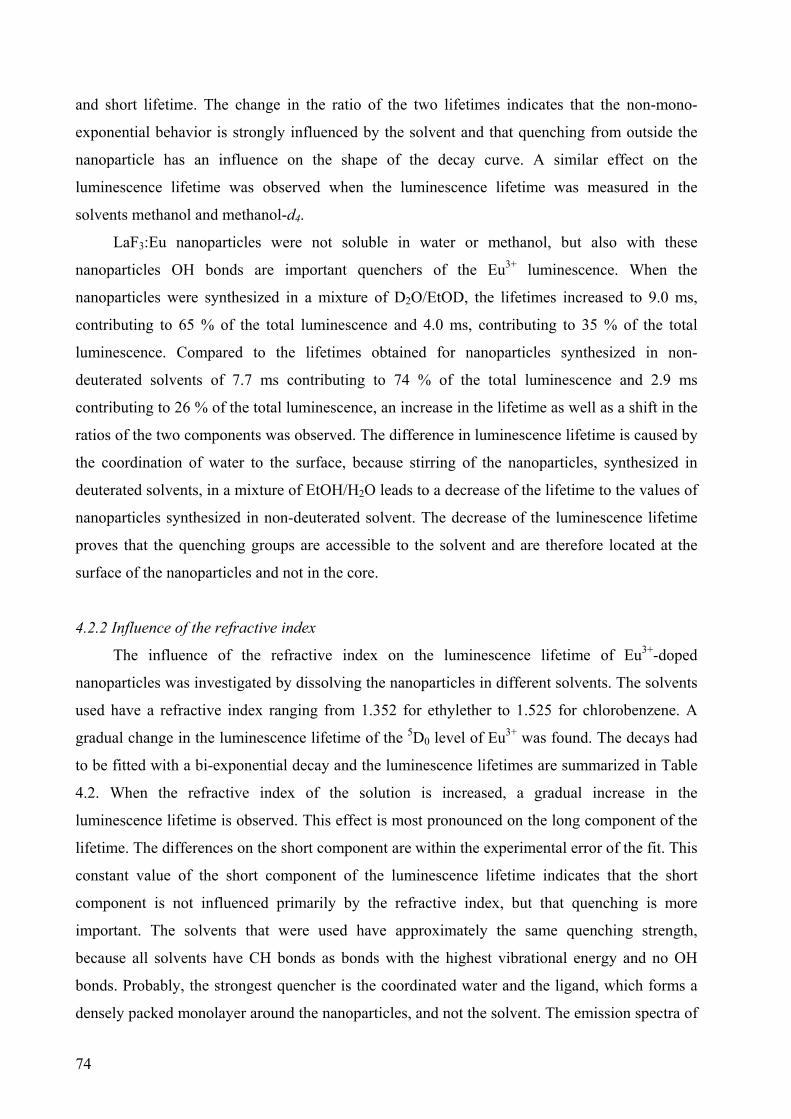
74
and short lifetime. The change in the ratio of the two lifetimes indicates that the non-mono-
exponential behavior is strongly influenced by the solvent and that quenching from outside the
nanoparticle has an influence on the shape of the decay curve. A similar effect on the
luminescence lifetime was observed when the luminescence lifetime was measured in the
solvents methanol and methanol-d4.
LaF3:Eu nanoparticles were not soluble in water or methanol, but also with these
nanoparticles OH bonds are important quenchers of the Eu3+ luminescence. When the
nanoparticles were synthesized in a mixture of D2O/EtOD, the lifetimes increased to 9.0 ms,
contributing to 65 % of the total luminescence and 4.0 ms, contributing to 35 % of the total
luminescence. Compared to the lifetimes obtained for nanoparticles synthesized in non-
deuterated solvents of 7.7 ms contributing to 74 % of the total luminescence and 2.9 ms
contributing to 26 % of the total luminescence, an increase in the lifetime as well as a shift in the
ratios of the two components was observed. The difference in luminescence lifetime is caused by
the coordination of water to the surface, because stirring of the nanoparticles, synthesized in
deuterated solvents, in a mixture of EtOH/H2O leads to a decrease of the lifetime to the values of
nanoparticles synthesized in non-deuterated solvent. The decrease of the luminescence lifetime
proves that the quenching groups are accessible to the solvent and are therefore located at the
surface of the nanoparticles and not in the core.
4.2.2 Influence of the refractive index
The influence of the refractive index on the luminescence lifetime of Eu3+-doped
nanoparticles was investigated by dissolving the nanoparticles in different solvents. The solvents
used have a refractive index ranging from 1.352 for ethylether to 1.525 for chlorobenzene. A
gradual change in the luminescence lifetime of the 5D0 level of Eu3+ was found. The decays had
to be fitted with a bi-exponential decay and the luminescence lifetimes are summarized in Table
4.2. When the refractive index of the solution is increased, a gradual increase in the
luminescence lifetime is observed. This effect is most pronounced on the long component of the
lifetime. The differences on the short component are within the experimental error of the fit. This
constant value of the short component of the luminescence lifetime indicates that the short
component is not influenced primarily by the refractive index, but that quenching is more
important. The solvents that were used have approximately the same quenching strength,
because all solvents have CH bonds as bonds with the highest vibrational energy and no OH
bonds. Probably, the strongest quencher is the coordinated water and the ligand, which forms a
densely packed monolayer around the nanoparticles, and not the solvent. The emission spectra of
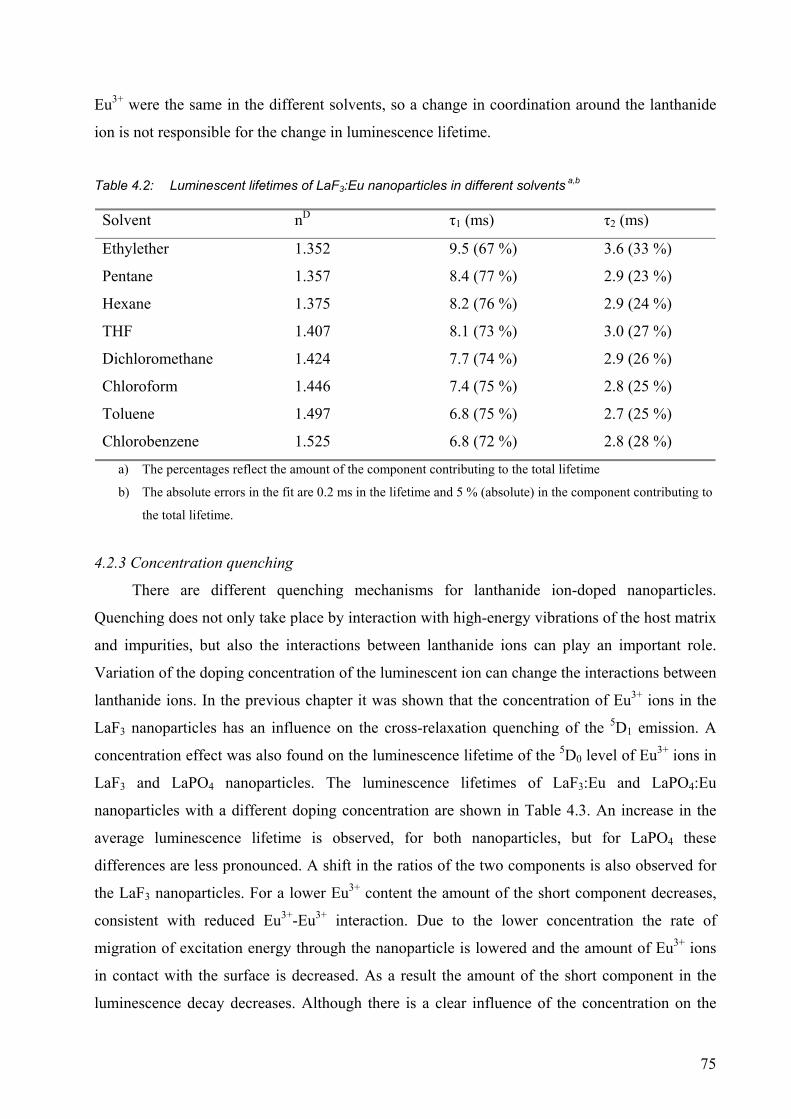
75
Eu3+ were the same in the different solvents, so a change in coordination around the lanthanide
ion is not responsible for the change in luminescence lifetime.
Table 4.2: Luminescent lifetimes of LaF3:Eu nanoparticles in different solvents a,b
Solvent nD τ1 (ms) τ2 (ms)
Ethylether 1.352 9.5 (67 %) 3.6 (33 %)
Pentane 1.357 8.4 (77 %) 2.9 (23 %)
Hexane 1.375 8.2 (76 %) 2.9 (24 %)
THF 1.407 8.1 (73 %) 3.0 (27 %)
Dichloromethane 1.424 7.7 (74 %) 2.9 (26 %)
Chloroform 1.446 7.4 (75 %) 2.8 (25 %)
Toluene 1.497 6.8 (75 %) 2.7 (25 %)
Chlorobenzene 1.525 6.8 (72 %) 2.8 (28 %)
a) The percentages reflect the amount of the component contributing to the total lifetime
b) The absolute errors in the fit are 0.2 ms in the lifetime and 5 % (absolute) in the component contributing to
the total lifetime.
4.2.3 Concentration quenching
There are different quenching mechanisms for lanthanide ion-doped nanoparticles.
Quenching does not only take place by interaction with high-energy vibrations of the host matrix
and impurities, but also the interactions between lanthanide ions can play an important role.
Variation of the doping concentration of the luminescent ion can change the interactions between
lanthanide ions. In the previous chapter it was shown that the concentration of Eu3+ ions in the
LaF3 nanoparticles has an influence on the cross-relaxation quenching of the 5D1 emission. A
concentration effect was also found on the luminescence lifetime of the 5D0 level of Eu3+ ions in
LaF3 and LaPO4 nanoparticles. The luminescence lifetimes of LaF3:Eu and LaPO4:Eu
nanoparticles with a different doping concentration are shown in Table 4.3. An increase in the
average luminescence lifetime is observed, for both nanoparticles, but for LaPO4 these
differences are less pronounced. A shift in the ratios of the two components is also observed for
the LaF3 nanoparticles. For a lower Eu3+ content the amount of the short component decreases,
consistent with reduced Eu3+-Eu3+ interaction. Due to the lower concentration the rate of
migration of excitation energy through the nanoparticle is lowered and the amount of Eu3+ ions
in contact with the surface is decreased. As a result the amount of the short component in the
luminescence decay decreases. Although there is a clear influence of the concentration on the
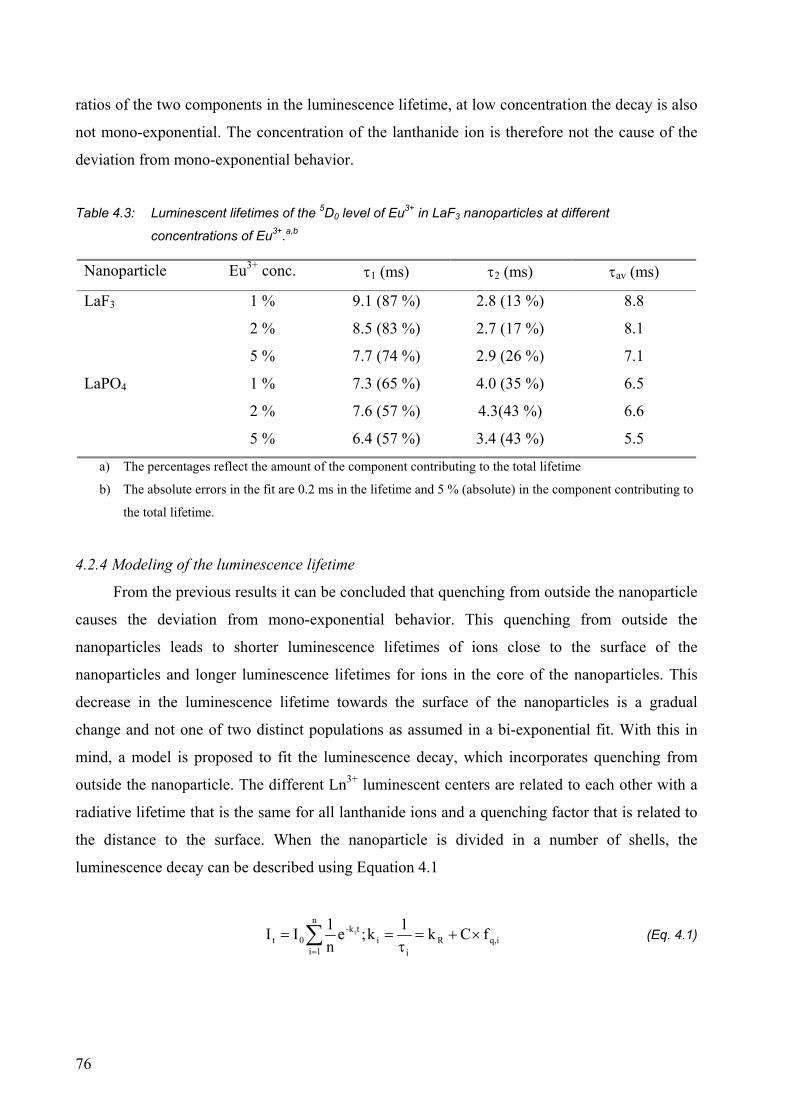
76
ratios of the two components in the luminescence lifetime, at low concentration the decay is also
not mono-exponential. The concentration of the lanthanide ion is therefore not the cause of the
deviation from mono-exponential behavior.
Table 4.3: Luminescent lifetimes of the 5D0 level of Eu3+ in LaF3 nanoparticles at different
concentrations of Eu3+.a,b
Nanoparticle Eu3+ conc. τ1 (ms) τ2 (ms) τav (ms)
LaF3 1 % 9.1 (87 %) 2.8 (13 %) 8.8
2 % 8.5 (83 %) 2.7 (17 %) 8.1
5 % 7.7 (74 %) 2.9 (26 %) 7.1
LaPO4 1 % 7.3 (65 %) 4.0 (35 %) 6.5
2 % 7.6 (57 %) 4.3(43 %) 6.6
5 % 6.4 (57 %) 3.4 (43 %) 5.5
a) The percentages reflect the amount of the component contributing to the total lifetime
b) The absolute errors in the fit are 0.2 ms in the lifetime and 5 % (absolute) in the component contributing to
the total lifetime.
4.2.4 Modeling of the luminescence lifetime
From the previous results it can be concluded that quenching from outside the nanoparticle
causes the deviation from mono-exponential behavior. This quenching from outside the
nanoparticles leads to shorter luminescence lifetimes of ions close to the surface of the
nanoparticles and longer luminescence lifetimes for ions in the core of the nanoparticles. This
decrease in the luminescence lifetime towards the surface of the nanoparticles is a gradual
change and not one of two distinct populations as assumed in a bi-exponential fit. With this in
mind, a model is proposed to fit the luminescence decay, which incorporates quenching from
outside the nanoparticle. The different Ln3+ luminescent centers are related to each other with a
radiative lifetime that is the same for all lanthanide ions and a quenching factor that is related to
the distance to the surface. When the nanoparticle is divided in a number of shells, the
luminescence decay can be described using Equation 4.1
∑=
×+=τ
==n
1iq,iR
ii
tk-0t fCk1k;e
n1II i (Eq. 4.1)
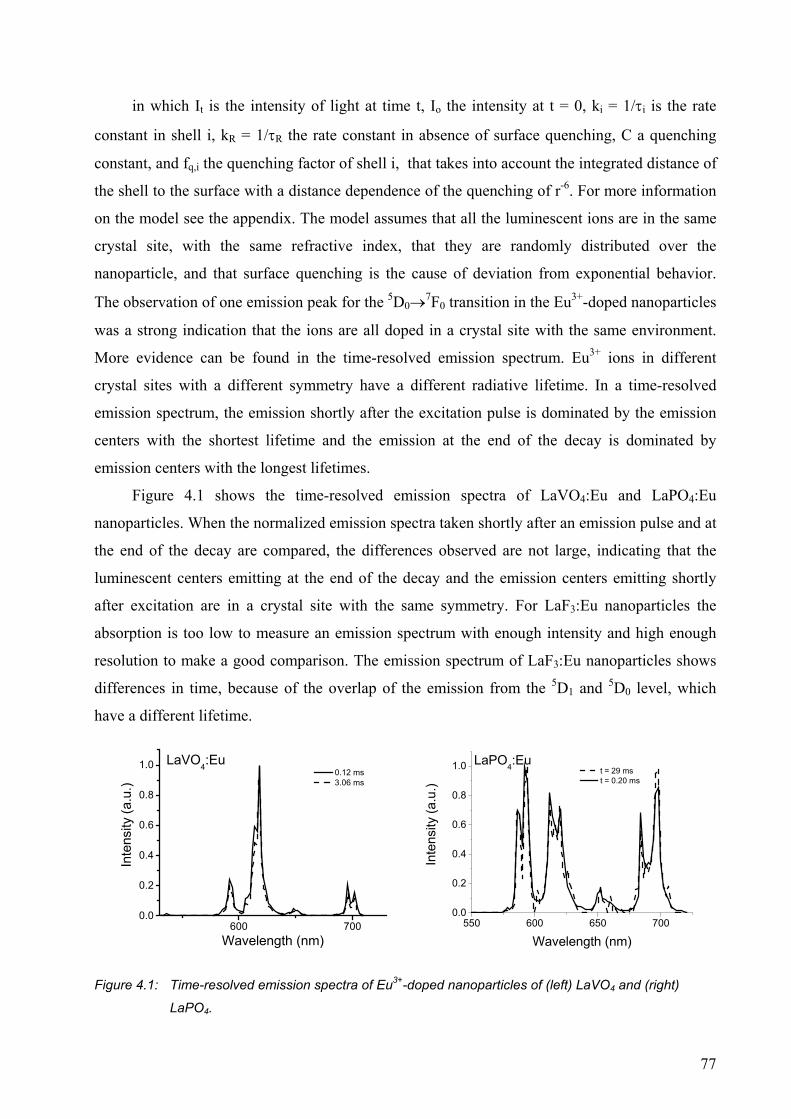
77
in which It is the intensity of light at time t, Io the intensity at t = 0, ki = 1/τi is the rate
constant in shell i, kR = 1/τR the rate constant in absence of surface quenching, C a quenching
constant, and fq,i the quenching factor of shell i, that takes into account the integrated distance of
the shell to the surface with a distance dependence of the quenching of r-6. For more information
on the model see the appendix. The model assumes that all the luminescent ions are in the same
crystal site, with the same refractive index, that they are randomly distributed over the
nanoparticle, and that surface quenching is the cause of deviation from exponential behavior.
The observation of one emission peak for the 5D0→7F0 transition in the Eu3+-doped nanoparticles
was a strong indication that the ions are all doped in a crystal site with the same environment.
More evidence can be found in the time-resolved emission spectrum. Eu3+ ions in different
crystal sites with a different symmetry have a different radiative lifetime. In a time-resolved
emission spectrum, the emission shortly after the excitation pulse is dominated by the emission
centers with the shortest lifetime and the emission at the end of the decay is dominated by
emission centers with the longest lifetimes.
Figure 4.1 shows the time-resolved emission spectra of LaVO4:Eu and LaPO4:Eu
nanoparticles. When the normalized emission spectra taken shortly after an emission pulse and at
the end of the decay are compared, the differences observed are not large, indicating that the
luminescent centers emitting at the end of the decay and the emission centers emitting shortly
after excitation are in a crystal site with the same symmetry. For LaF3:Eu nanoparticles the
absorption is too low to measure an emission spectrum with enough intensity and high enough
resolution to make a good comparison. The emission spectrum of LaF3:Eu nanoparticles shows
differences in time, because of the overlap of the emission from the 5D1 and 5D0 level, which
have a different lifetime.
600 7000.0
0.2
0.4
0.6
0.8
1.0 LaVO4:Eu 0.12 ms 3.06 ms
Inte
nsity
(a.u
.)
Wavelength (nm)
550 600 650 7000.0
0.2
0.4
0.6
0.8
1.0 LaPO4:Eu
Inte
nsity
(a.u
.)
Wavelength (nm)
t = 29 ms t = 0.20 ms
Figure 4.1: Time-resolved emission spectra of Eu3+-doped nanoparticles of (left) LaVO4 and (right)
LaPO4.
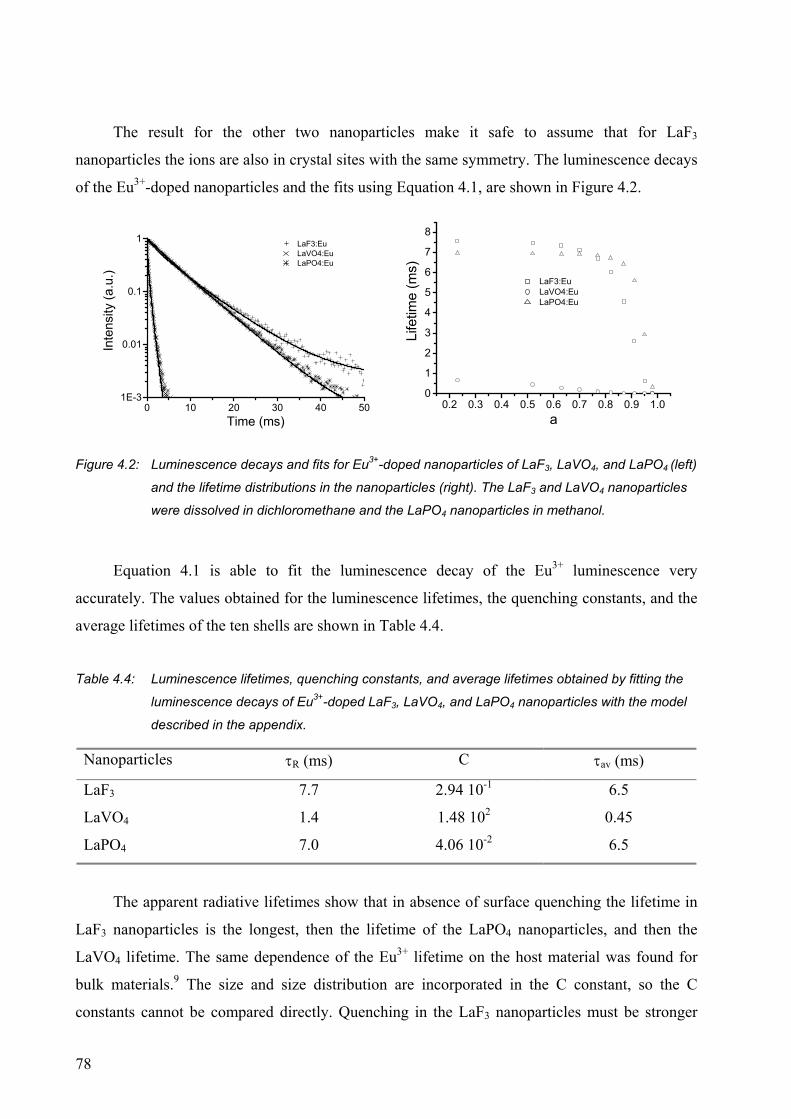
78
The result for the other two nanoparticles make it safe to assume that for LaF3
nanoparticles the ions are also in crystal sites with the same symmetry. The luminescence decays
of the Eu3+-doped nanoparticles and the fits using Equation 4.1, are shown in Figure 4.2.
0 10 20 30 40 501E-3
0.01
0.1
1 LaF3:Eu LaVO4:Eu LaPO4:Eu
Inte
nsity
(a.u
.)
Time (ms)0.2 0.3 0.4 0.5 0.6 0.7 0.8 0.9 1.0
0
1
2
3
4
5
6
7
8
LaF3:Eu LaVO4:Eu LaPO4:Eu
Life
time
(ms)
a
Figure 4.2: Luminescence decays and fits for Eu3+-doped nanoparticles of LaF3, LaVO4, and LaPO4 (left)
and the lifetime distributions in the nanoparticles (right). The LaF3 and LaVO4 nanoparticles
were dissolved in dichloromethane and the LaPO4 nanoparticles in methanol.
Equation 4.1 is able to fit the luminescence decay of the Eu3+ luminescence very
accurately. The values obtained for the luminescence lifetimes, the quenching constants, and the
average lifetimes of the ten shells are shown in Table 4.4.
Table 4.4: Luminescence lifetimes, quenching constants, and average lifetimes obtained by fitting the
luminescence decays of Eu3+-doped LaF3, LaVO4, and LaPO4 nanoparticles with the model
described in the appendix.
Nanoparticles τR (ms) C τav (ms)
LaF3 7.7 2.94 10-1 6.5
LaVO4 1.4 1.48 102 0.45
LaPO4 7.0 4.06 10-2 6.5
The apparent radiative lifetimes show that in absence of surface quenching the lifetime in
LaF3 nanoparticles is the longest, then the lifetime of the LaPO4 nanoparticles, and then the
LaVO4 lifetime. The same dependence of the Eu3+ lifetime on the host material was found for
bulk materials.9 The size and size distribution are incorporated in the C constant, so the C
constants cannot be compared directly. Quenching in the LaF3 nanoparticles must be stronger
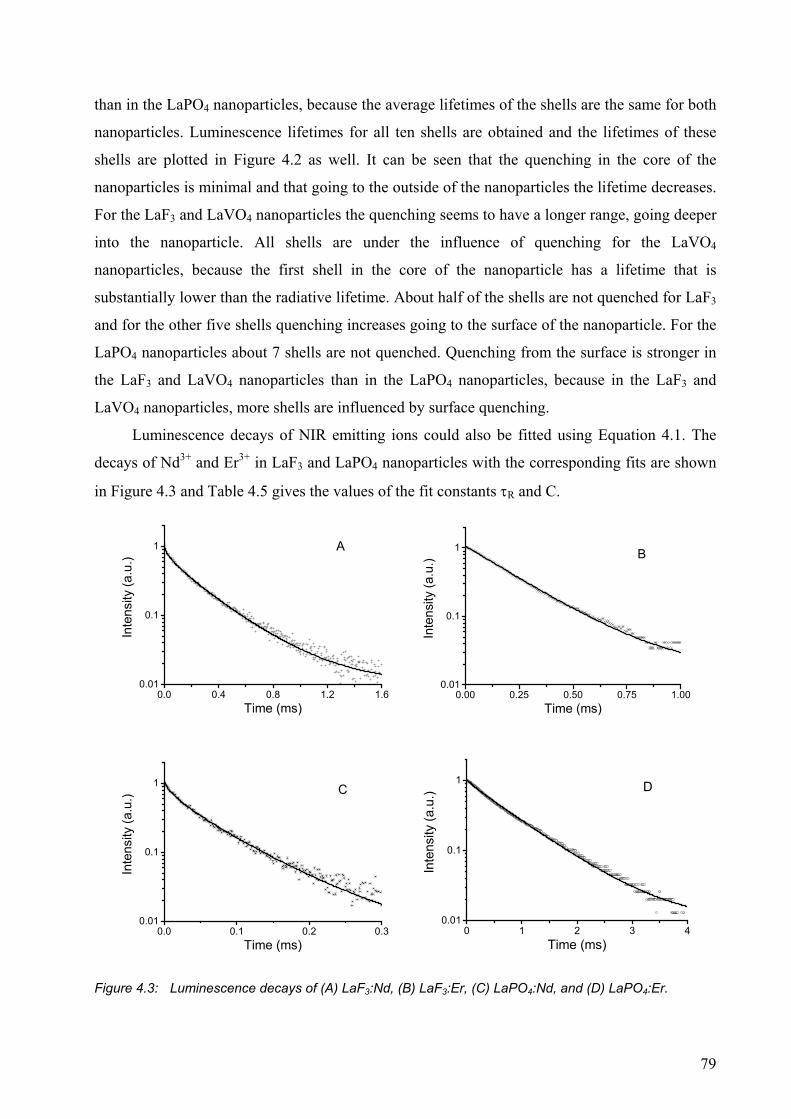
79
than in the LaPO4 nanoparticles, because the average lifetimes of the shells are the same for both
nanoparticles. Luminescence lifetimes for all ten shells are obtained and the lifetimes of these
shells are plotted in Figure 4.2 as well. It can be seen that the quenching in the core of the
nanoparticles is minimal and that going to the outside of the nanoparticles the lifetime decreases.
For the LaF3 and LaVO4 nanoparticles the quenching seems to have a longer range, going deeper
into the nanoparticle. All shells are under the influence of quenching for the LaVO4
nanoparticles, because the first shell in the core of the nanoparticle has a lifetime that is
substantially lower than the radiative lifetime. About half of the shells are not quenched for LaF3
and for the other five shells quenching increases going to the surface of the nanoparticle. For the
LaPO4 nanoparticles about 7 shells are not quenched. Quenching from the surface is stronger in
the LaF3 and LaVO4 nanoparticles than in the LaPO4 nanoparticles, because in the LaF3 and
LaVO4 nanoparticles, more shells are influenced by surface quenching.
Luminescence decays of NIR emitting ions could also be fitted using Equation 4.1. The
decays of Nd3+ and Er3+ in LaF3 and LaPO4 nanoparticles with the corresponding fits are shown
in Figure 4.3 and Table 4.5 gives the values of the fit constants τR and C.
0.0 0.4 0.8 1.2 1.60.01
0.1
1 A
Inte
nsity
(a.u
.)
Time (ms)0.00 0.25 0.50 0.75 1.00
0.01
0.1
1 B
Inte
nsity
(a.u
.)
Time (ms)
0.0 0.1 0.2 0.30.01
0.1
1 C
Inte
nsity
(a.u
.)
Time (ms)0 1 2 3 4
0.01
0.1
1 D
Inte
nsity
(a.u
.)
Time (ms)
Figure 4.3: Luminescence decays of (A) LaF3:Nd, (B) LaF3:Er, (C) LaPO4:Nd, and (D) LaPO4:Er.
80
The average luminescence lifetimes for Er3+ and Nd3+ show the same trend as when the
decay was fitted using a bi-exponential decay. An increase by a factor 10-1000 in the
luminescence lifetime is observed compared to the lifetimes of organic complexes, containing
Nd3+ or Er3+. For Nd3+ the values of the average lifetime and τR are higher for LaF3 than for
LaPO4 reflecting the difference in the phonon energies of the matrices. This is the other way
around for Er3+, the value of τR and the average lifetime are lower for the LaF3:Er nanoparticles
compared to the LaPO4:Er nanoparticles.
Table 4.5: Luminescence lifetimes of the NIR-emitting ions in the two different nanoparticles.a
Nanoparticle Solvent τR (µs) C(s-1) τav (µs)
LaPO4:Nd CD3OD 90 107 68
LaF3:Nd CH2Cl2 347 23.5 265
LaPO4:Er CD3OD 315 4.66 304
LaF3:Er CH2Cl2 236 3.29 226
LaPO4:Pr CD3OD 4.0 57.3 3.7
LaF3:Ho CH2Cl2 35 27 31
a) All doping concentrations were 5 %. The errors in τR are ≈ 3 % and in C ≈ 10 % determined from duplicate
measurements.
Not only the quenching is stronger, but also the lower τR indicates that there are more
quenching possibilities for Er3+ inside the nanoparticles. Quenching by cross-relaxation, or
concentration quenching could be more important in the LaF3 nanoparticles, compared to the
LaPO4 nanoparticles as a result of different average distances between the luminescent ions. The
average lifetimes of Pr3+ and Ho3+ are in the µs range reflecting the shorter radiative lifetimes of
these ions. A lifetime of 70 µs for the 1D2 level was reported for Pr3+ in a phosphate host 10 and
for Ho3+ in LaF3, a lifetime of the 5F5 level of 780 µs was calculated.11
Using Equation 4.1, different factors influencing the luminescence lifetimes of these
nanoparticles were investigated. Er3+ usually shows a large dependence on the doping
concentration and when the nanoparticles are doped with different concentrations of Er3+ this is
indeed reflected in the values of τR and C (Table 4.6). A decrease in Er3+ concentration should
not change the quenching constant C because the Er3+ ions are still in the same crystal site and at
the same average distance to the surface. τR should increase with a decreasing doping
concentration because quenching processes like cross-relaxation and up-conversion become less
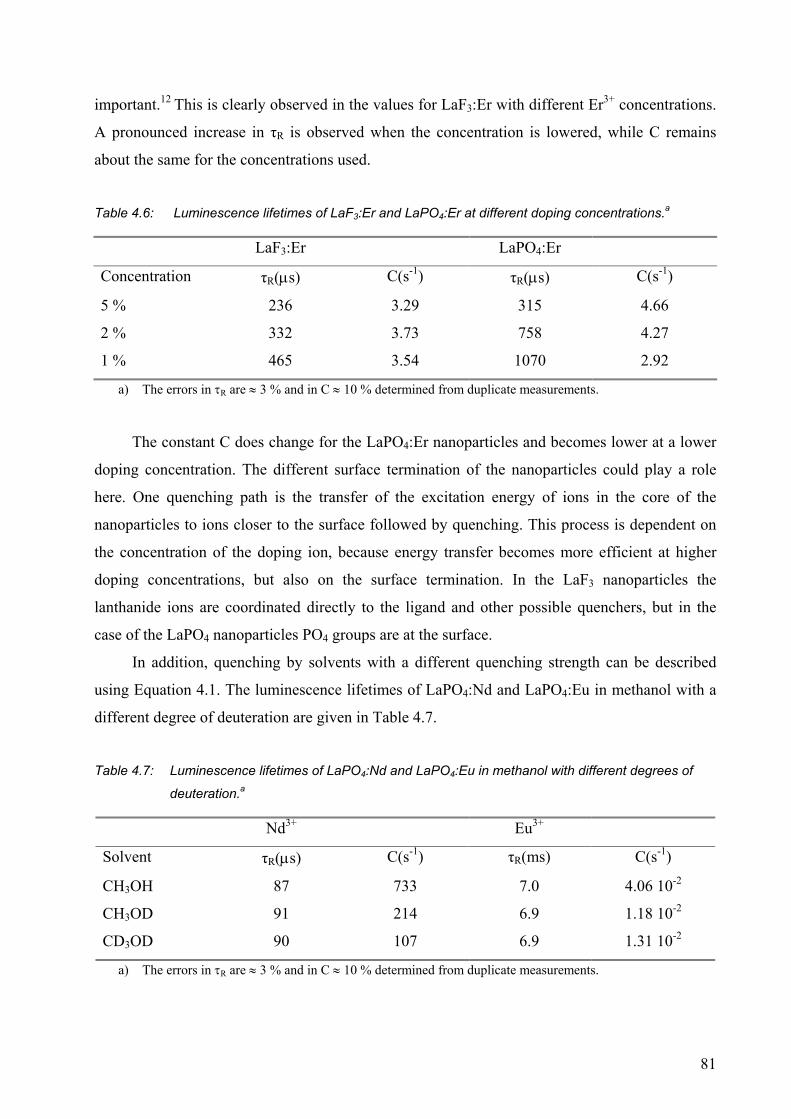
81
important.12 This is clearly observed in the values for LaF3:Er with different Er3+ concentrations.
A pronounced increase in τR is observed when the concentration is lowered, while C remains
about the same for the concentrations used.
Table 4.6: Luminescence lifetimes of LaF3:Er and LaPO4:Er at different doping concentrations.a
LaF3:Er LaPO4:Er
Concentration τR(µs) C(s-1) τR(µs) C(s-1)
5 % 236 3.29 315 4.66
2 % 332 3.73 758 4.27
1 % 465 3.54 1070 2.92
a) The errors in τR are ≈ 3 % and in C ≈ 10 % determined from duplicate measurements.
The constant C does change for the LaPO4:Er nanoparticles and becomes lower at a lower
doping concentration. The different surface termination of the nanoparticles could play a role
here. One quenching path is the transfer of the excitation energy of ions in the core of the
nanoparticles to ions closer to the surface followed by quenching. This process is dependent on
the concentration of the doping ion, because energy transfer becomes more efficient at higher
doping concentrations, but also on the surface termination. In the LaF3 nanoparticles the
lanthanide ions are coordinated directly to the ligand and other possible quenchers, but in the
case of the LaPO4 nanoparticles PO4 groups are at the surface.
In addition, quenching by solvents with a different quenching strength can be described
using Equation 4.1. The luminescence lifetimes of LaPO4:Nd and LaPO4:Eu in methanol with a
different degree of deuteration are given in Table 4.7.
Table 4.7: Luminescence lifetimes of LaPO4:Nd and LaPO4:Eu in methanol with different degrees of
deuteration.a
Nd3+ Eu3+
Solvent τR(µs) C(s-1) τR(ms) C(s-1)
CH3OH 87 733 7.0 4.06 10-2
CH3OD 91 214 6.9 1.18 10-2
CD3OD 90 107 6.9 1.31 10-2
a) The errors in τR are ≈ 3 % and in C ≈ 10 % determined from duplicate measurements.
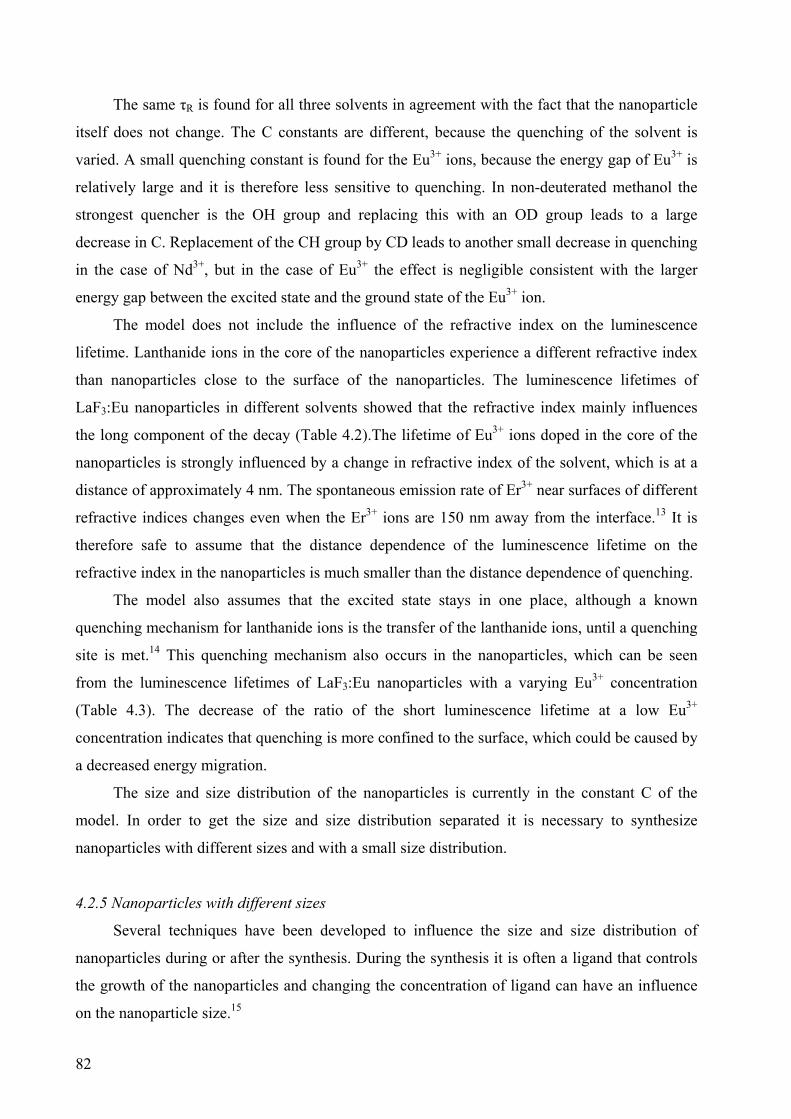
82
The same τR is found for all three solvents in agreement with the fact that the nanoparticle
itself does not change. The C constants are different, because the quenching of the solvent is
varied. A small quenching constant is found for the Eu3+ ions, because the energy gap of Eu3+ is
relatively large and it is therefore less sensitive to quenching. In non-deuterated methanol the
strongest quencher is the OH group and replacing this with an OD group leads to a large
decrease in C. Replacement of the CH group by CD leads to another small decrease in quenching
in the case of Nd3+, but in the case of Eu3+ the effect is negligible consistent with the larger
energy gap between the excited state and the ground state of the Eu3+ ion.
The model does not include the influence of the refractive index on the luminescence
lifetime. Lanthanide ions in the core of the nanoparticles experience a different refractive index
than nanoparticles close to the surface of the nanoparticles. The luminescence lifetimes of
LaF3:Eu nanoparticles in different solvents showed that the refractive index mainly influences
the long component of the decay (Table 4.2).The lifetime of Eu3+ ions doped in the core of the
nanoparticles is strongly influenced by a change in refractive index of the solvent, which is at a
distance of approximately 4 nm. The spontaneous emission rate of Er3+ near surfaces of different
refractive indices changes even when the Er3+ ions are 150 nm away from the interface.13 It is
therefore safe to assume that the distance dependence of the luminescence lifetime on the
refractive index in the nanoparticles is much smaller than the distance dependence of quenching.
The model also assumes that the excited state stays in one place, although a known
quenching mechanism for lanthanide ions is the transfer of the lanthanide ions, until a quenching
site is met.14 This quenching mechanism also occurs in the nanoparticles, which can be seen
from the luminescence lifetimes of LaF3:Eu nanoparticles with a varying Eu3+ concentration
(Table 4.3). The decrease of the ratio of the short luminescence lifetime at a low Eu3+
concentration indicates that quenching is more confined to the surface, which could be caused by
a decreased energy migration.
The size and size distribution of the nanoparticles is currently in the constant C of the
model. In order to get the size and size distribution separated it is necessary to synthesize
nanoparticles with different sizes and with a small size distribution.
4.2.5 Nanoparticles with different sizes
Several techniques have been developed to influence the size and size distribution of
nanoparticles during or after the synthesis. During the synthesis it is often a ligand that controls
the growth of the nanoparticles and changing the concentration of ligand can have an influence
on the nanoparticle size.15
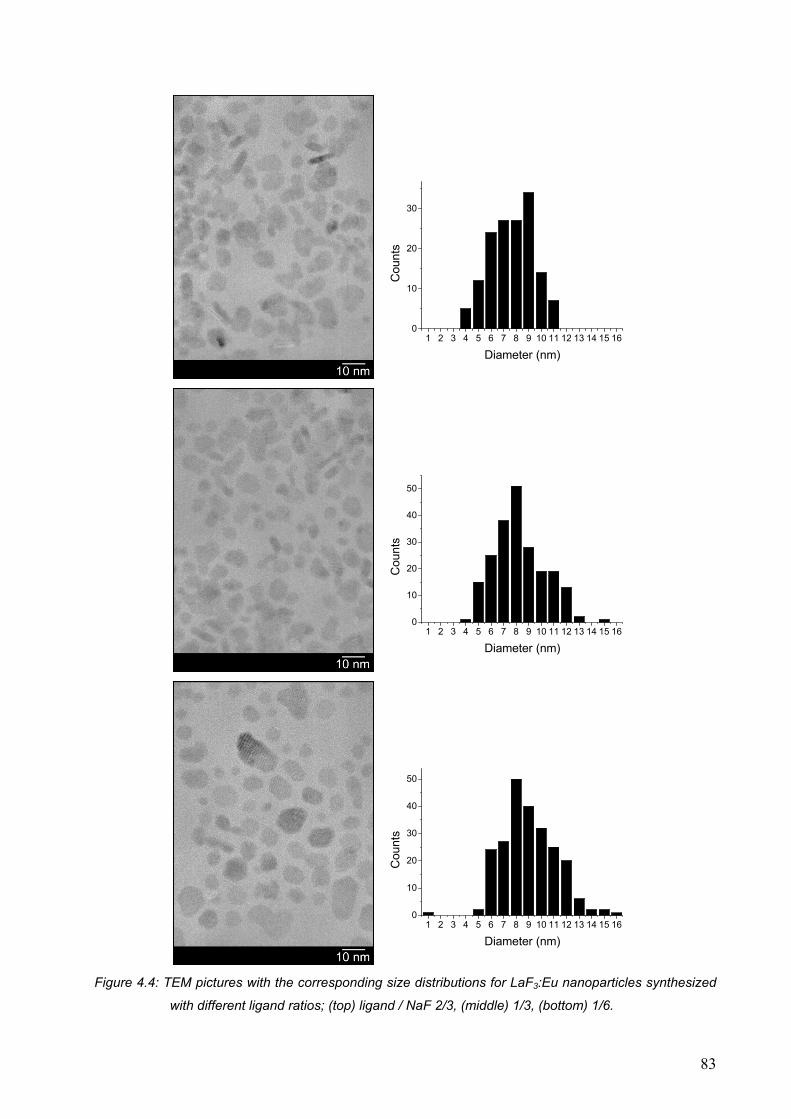
83
1 2 3 4 5 6 7 8 9 10 11 12 13 14 15 160
10
20
30
Cou
nts
Diameter (nm)
1 2 3 4 5 6 7 8 9 10 11 12 13 14 15 160
10
20
30
40
50
Cou
nts
Diameter (nm)
1 2 3 4 5 6 7 8 9 10 11 12 13 14 15 160
10
20
30
40
50
Cou
nts
Diameter (nm)
Figure 4.4: TEM pictures with the corresponding size distributions for LaF3:Eu nanoparticles synthesized
with different ligand ratios; (top) ligand / NaF 2/3, (middle) 1/3, (bottom) 1/6.
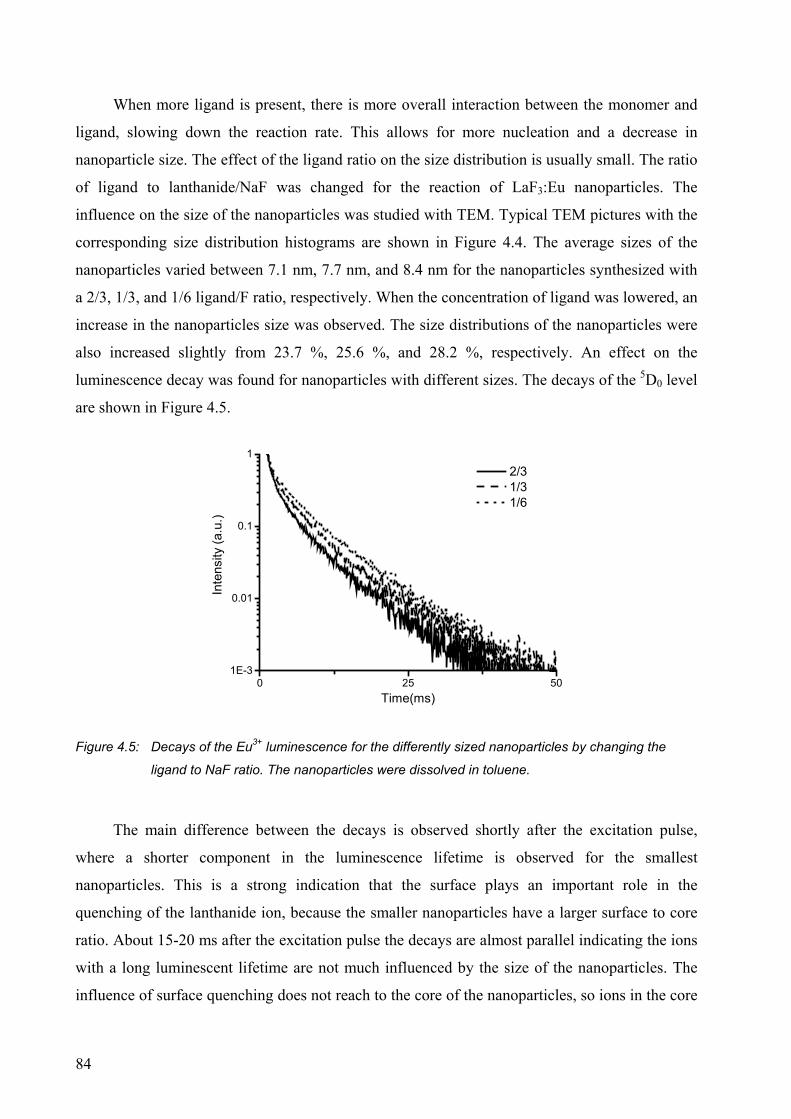
84
When more ligand is present, there is more overall interaction between the monomer and
ligand, slowing down the reaction rate. This allows for more nucleation and a decrease in
nanoparticle size. The effect of the ligand ratio on the size distribution is usually small. The ratio
of ligand to lanthanide/NaF was changed for the reaction of LaF3:Eu nanoparticles. The
influence on the size of the nanoparticles was studied with TEM. Typical TEM pictures with the
corresponding size distribution histograms are shown in Figure 4.4. The average sizes of the
nanoparticles varied between 7.1 nm, 7.7 nm, and 8.4 nm for the nanoparticles synthesized with
a 2/3, 1/3, and 1/6 ligand/F ratio, respectively. When the concentration of ligand was lowered, an
increase in the nanoparticles size was observed. The size distributions of the nanoparticles were
also increased slightly from 23.7 %, 25.6 %, and 28.2 %, respectively. An effect on the
luminescence decay was found for nanoparticles with different sizes. The decays of the 5D0 level
are shown in Figure 4.5.
0 25 501E-3
0.01
0.1
1
2/3 1/3 1/6
Inte
nsity
(a.u
.)
Time(ms)
Figure 4.5: Decays of the Eu3+ luminescence for the differently sized nanoparticles by changing the
ligand to NaF ratio. The nanoparticles were dissolved in toluene.
The main difference between the decays is observed shortly after the excitation pulse,
where a shorter component in the luminescence lifetime is observed for the smallest
nanoparticles. This is a strong indication that the surface plays an important role in the
quenching of the lanthanide ion, because the smaller nanoparticles have a larger surface to core
ratio. About 15-20 ms after the excitation pulse the decays are almost parallel indicating the ions
with a long luminescent lifetime are not much influenced by the size of the nanoparticles. The
influence of surface quenching does not reach to the core of the nanoparticles, so ions in the core
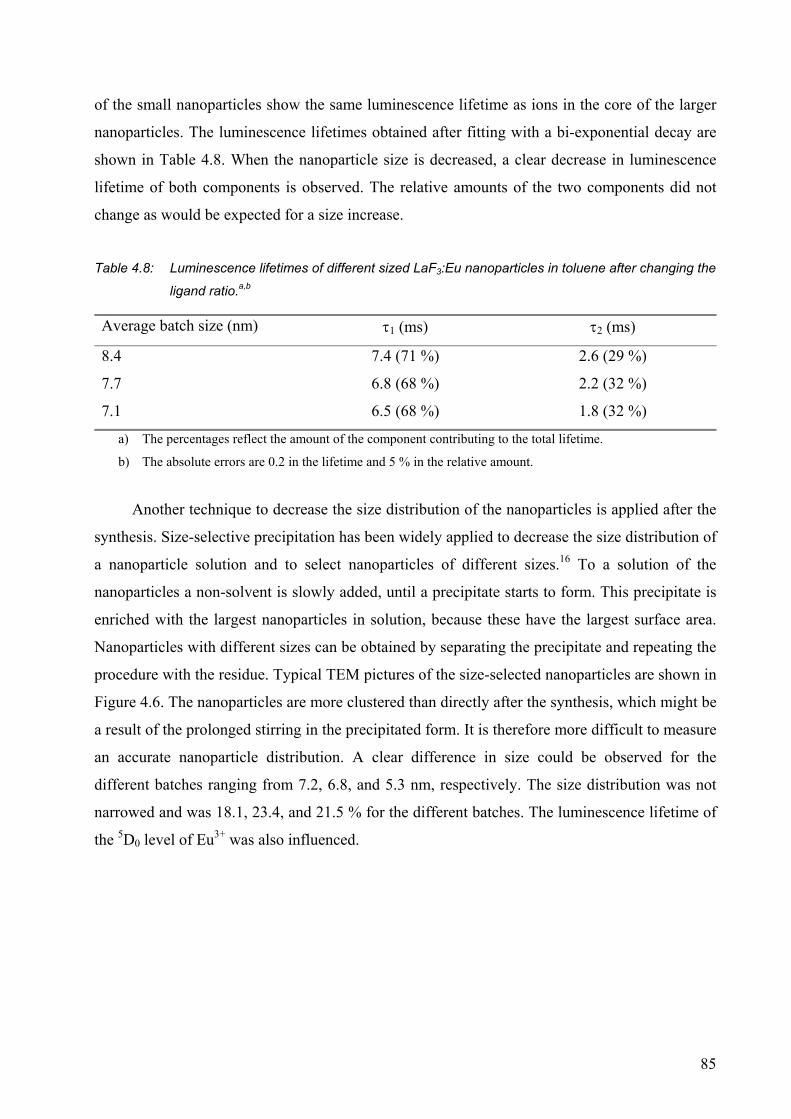
85
of the small nanoparticles show the same luminescence lifetime as ions in the core of the larger
nanoparticles. The luminescence lifetimes obtained after fitting with a bi-exponential decay are
shown in Table 4.8. When the nanoparticle size is decreased, a clear decrease in luminescence
lifetime of both components is observed. The relative amounts of the two components did not
change as would be expected for a size increase.
Table 4.8: Luminescence lifetimes of different sized LaF3:Eu nanoparticles in toluene after changing the
ligand ratio.a,b
Average batch size (nm) τ1 (ms) τ2 (ms)
8.4 7.4 (71 %) 2.6 (29 %)
7.7 6.8 (68 %) 2.2 (32 %)
7.1 6.5 (68 %) 1.8 (32 %)
a) The percentages reflect the amount of the component contributing to the total lifetime.
b) The absolute errors are 0.2 in the lifetime and 5 % in the relative amount.
Another technique to decrease the size distribution of the nanoparticles is applied after the
synthesis. Size-selective precipitation has been widely applied to decrease the size distribution of
a nanoparticle solution and to select nanoparticles of different sizes.16 To a solution of the
nanoparticles a non-solvent is slowly added, until a precipitate starts to form. This precipitate is
enriched with the largest nanoparticles in solution, because these have the largest surface area.
Nanoparticles with different sizes can be obtained by separating the precipitate and repeating the
procedure with the residue. Typical TEM pictures of the size-selected nanoparticles are shown in
Figure 4.6. The nanoparticles are more clustered than directly after the synthesis, which might be
a result of the prolonged stirring in the precipitated form. It is therefore more difficult to measure
an accurate nanoparticle distribution. A clear difference in size could be observed for the
different batches ranging from 7.2, 6.8, and 5.3 nm, respectively. The size distribution was not
narrowed and was 18.1, 23.4, and 21.5 % for the different batches. The luminescence lifetime of
the 5D0 level of Eu3+ was also influenced.
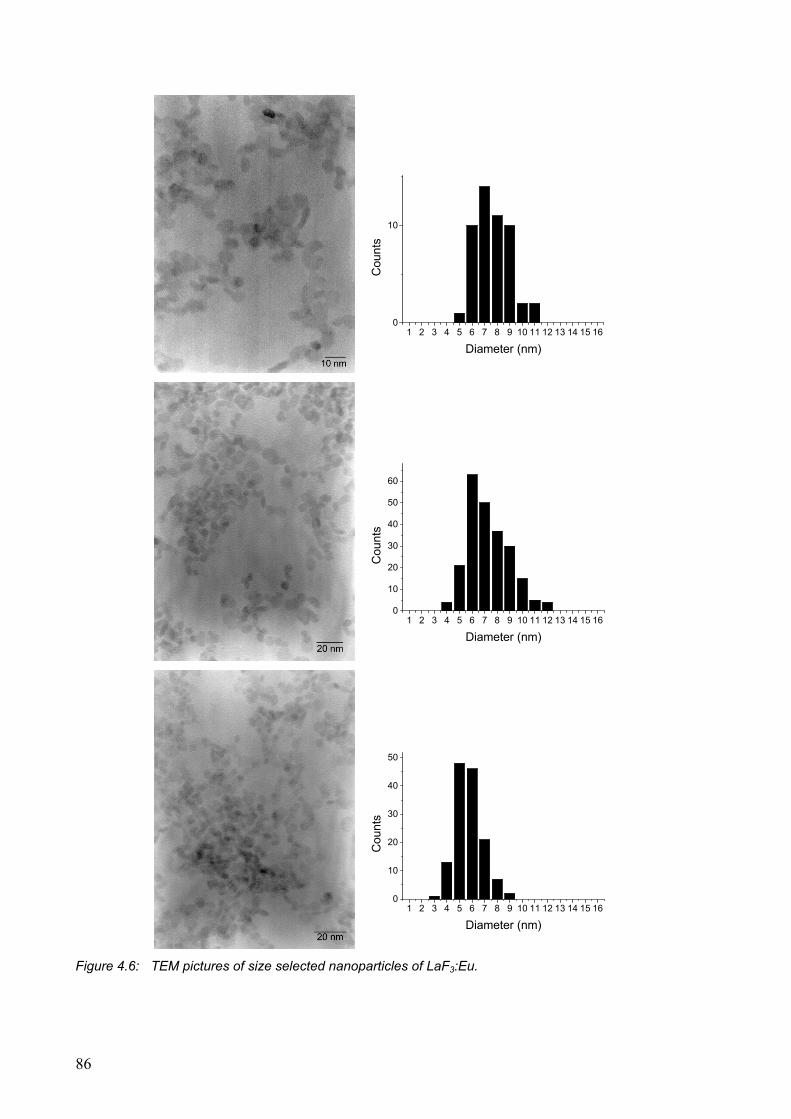
86
1 2 3 4 5 6 7 8 9 10 11 12 13 14 15 160
10
Cou
nts
Diameter (nm)
1 2 3 4 5 6 7 8 9 10 11 12 13 14 15 160
10
20
30
40
50
60
Cou
nts
Diameter (nm)
1 2 3 4 5 6 7 8 9 10 11 12 13 14 15 160
10
20
30
40
50
Cou
nts
Diameter (nm)
Figure 4.6: TEM pictures of size selected nanoparticles of LaF3:Eu.
87
The luminescence decays are shown in Figure 4.7. The differences in the luminescence
decay are less pronounced than in Figure 4.5 for nanoparticles synthesized with different
concentrations of ligand. The inset of Figure 4.7 shows an enlargement of the decay between 22
and 24 ms. This shows that the decay of the smallest nanoparticles is indeed below the decay of
the larger nanoparticles. The values obtained after fitting with a bi-exponential decay also show
that the luminescence lifetime is the longest for the nanoparticles with the largest size as
summarized in Table 4.9. From the fit a relevant difference in the luminescence lifetimes was
obtained.
0 25 501E-3
0.01
0.1
1
20 21 22
Batch 1 size 7.2 nm Batch 3 size 6.8 nm Batch 6 size 5.3 nm
Inte
nsity
(a.u
.)
Time (ms)
Figure 4.7: Normalized luminescence decays of size-selected nanoparticles of LaF3:Eu in
dichloromethane. The inset shows an enlargement of the decays at a time interval between
20 and 22 ms.
Table 4.9: Luminescence lifetimes of differently sized LaF3:Eu nanoparticles after size selective
precipitation.a,b
Batch size (nm) τ1 (ms) τ2 (ms)
7.2 7.6 (63 %) 2.9 (37 %)
6.8 7.3 (68 %) 2.6 (32 %)
5.3 7.1 (67 %) 2.5 (33 %)
a) The percentages reflect the amount of the component contributing to the total lifetime.
b) The absolute errors are 0.2 in the lifetime and 5 % in the relative amount.
88
4.3 Conclusions
The shape of the luminescence decay of lanthanide ions doped in the nanoparticles is
strongly dependent on the surroundings of the nanoparticles. The quenching strength of the
solvent has a large influence on the shape of the decay curve, leading to the conclusion that the
deviation from mono-exponential behavior is caused by surface quenching. The luminescence
decays can be fitted with a model that takes into account quenching from outside the
nanoparticles.
4.4 Experimental section
Nanoparticle synthesis. The nanoparticles were synthesized as described in chapter 3. For the
nanoparticles with a different concentration of lanthanide ions, the total amount of lanthanide salts was
constant. For the LaF3:Eu nanoparticles with the different ligand ratios, the amount of NaF, lanthanide
salts and solvent were kept constant and only the concentration of ligand was varied.
Size selective precipitation. Methanol was added dropwise to a solution of LaF3:Eu in toluene
(1g/50 ml). The solution became cloudy after the addition of about 45 ml of methanol. This cloudy
solution was stirred overnight and the precipitate separated by centrifugation. A few drops of methanol
were added to the supernatant until the solution was cloudy again and this was stirred overnight again.
The procedure was repeated 7 times until no precipitate was formed anymore after addition of methanol.
Photophysical measurements were performed using the setup described in chapter 3.
4.5 References and notes 1 Meltzer, R. S.; Yen, W. M.; Zheng, H.; Feofilov, S. P.; Dejneka, M. J. Phys. Rev. B 2001, 64,
100201. 2 Krebs, J. K.; Feofilov, S. P.; Kaplyanskii, A. A.; Zakharchenya, R. I.; Happek, U. J. Lumin. 1999,
83-84, 209. 3 Yan, C. H.; Sun, L. D.; Liao, C. S.; Zhang, Y. X.; Lu, Y. Q.; Huang, S. H.; Lü, S. Z. Appl. Phys.
Lett. 2003, 82, 3511. 4 Meltzer, R S.; Yen, W. M.; Zheng, H.; Feofilov, S. P.; Dejneka, M. J.; Tissue, B.; Yuan, H. B. J.
Lumin. 2001, 94-95, 217. 5 Schuurmans, F. J. P.; de Lang, D. T. N.; Wegdam, G. H.; Sprik, R.; Lagendijk, A. Phys. Rev. Lett.
1998, 80, 5077. 6 Schuurmans, F. J. P.; Lagendijk, A. J. Chem. Phys. 2000, 113, 3310. 7 Riwotsky, K.; Meyssamy, H.; Kornowski, A.; Haase, M. J. Phys. Chem. B 2001, 104, 2824. 8 Browne, W. R.; Vos, J. G. Coord. Chem. Rev. 2001, 219-221, 761.
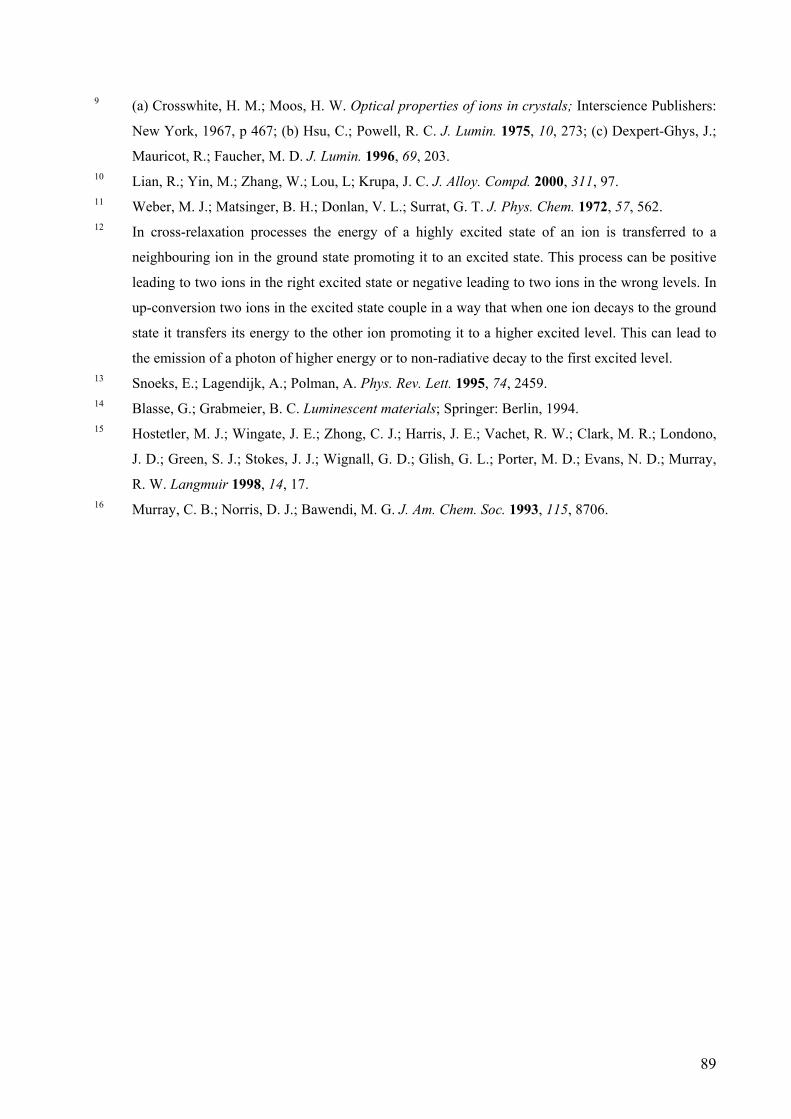
89
9 (a) Crosswhite, H. M.; Moos, H. W. Optical properties of ions in crystals; Interscience Publishers:
New York, 1967, p 467; (b) Hsu, C.; Powell, R. C. J. Lumin. 1975, 10, 273; (c) Dexpert-Ghys, J.;
Mauricot, R.; Faucher, M. D. J. Lumin. 1996, 69, 203. 10 Lian, R.; Yin, M.; Zhang, W.; Lou, L; Krupa, J. C. J. Alloy. Compd. 2000, 311, 97. 11 Weber, M. J.; Matsinger, B. H.; Donlan, V. L.; Surrat, G. T. J. Phys. Chem. 1972, 57, 562. 12 In cross-relaxation processes the energy of a highly excited state of an ion is transferred to a
neighbouring ion in the ground state promoting it to an excited state. This process can be positive
leading to two ions in the right excited state or negative leading to two ions in the wrong levels. In
up-conversion two ions in the excited state couple in a way that when one ion decays to the ground
state it transfers its energy to the other ion promoting it to a higher excited level. This can lead to
the emission of a photon of higher energy or to non-radiative decay to the first excited level. 13 Snoeks, E.; Lagendijk, A.; Polman, A. Phys. Rev. Lett. 1995, 74, 2459. 14 Blasse, G.; Grabmeier, B. C. Luminescent materials; Springer: Berlin, 1994. 15 Hostetler, M. J.; Wingate, J. E.; Zhong, C. J.; Harris, J. E.; Vachet, R. W.; Clark, M. R.; Londono,
J. D.; Green, S. J.; Stokes, J. J.; Wignall, G. D.; Glish, G. L.; Porter, M. D.; Evans, N. D.; Murray,
R. W. Langmuir 1998, 14, 17. 16 Murray, C. B.; Norris, D. J.; Bawendi, M. G. J. Am. Chem. Soc. 1993, 115, 8706.
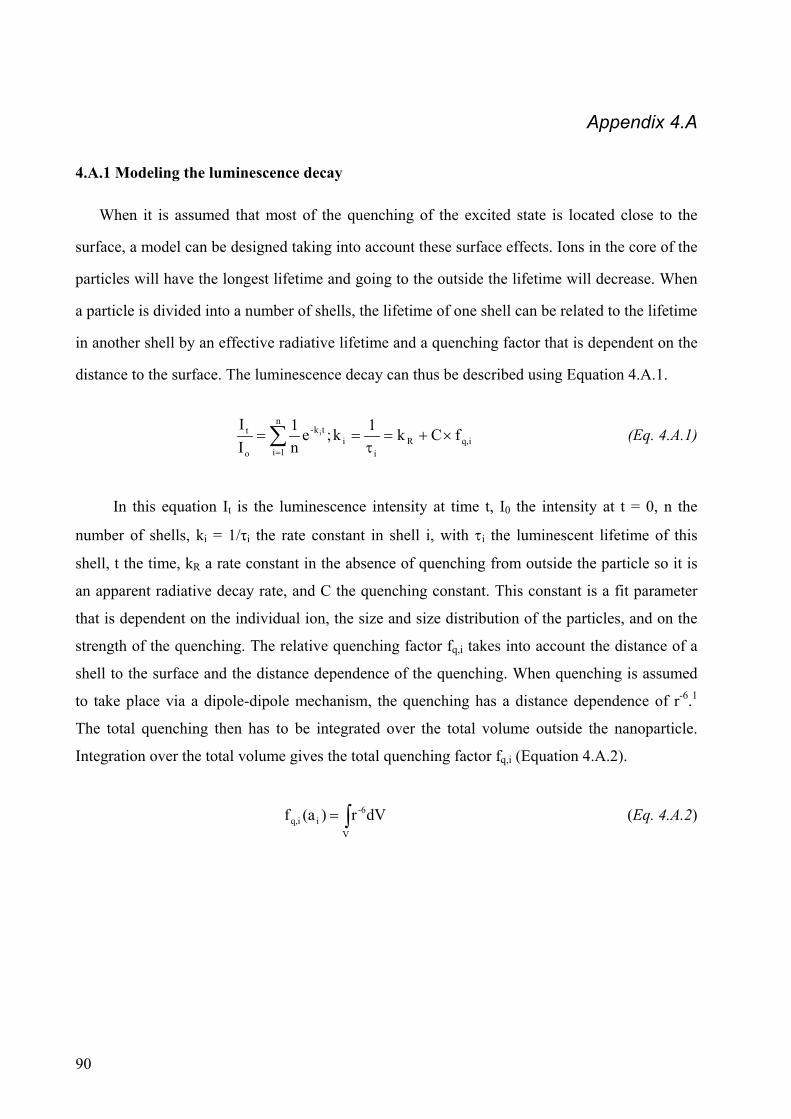
90
Appendix 4.A
4.A.1 Modeling the luminescence decay
When it is assumed that most of the quenching of the excited state is located close to the
surface, a model can be designed taking into account these surface effects. Ions in the core of the
particles will have the longest lifetime and going to the outside the lifetime will decrease. When
a particle is divided into a number of shells, the lifetime of one shell can be related to the lifetime
in another shell by an effective radiative lifetime and a quenching factor that is dependent on the
distance to the surface. The luminescence decay can thus be described using Equation 4.A.1.
∑=
×+=τ
==n
1iiq,R
ii
tk-
o
t fCk1k;en1
II
i (Eq. 4.A.1)
In this equation It is the luminescence intensity at time t, I0 the intensity at t = 0, n the
number of shells, ki = 1/τi the rate constant in shell i, with τi the luminescent lifetime of this
shell, t the time, kR a rate constant in the absence of quenching from outside the particle so it is
an apparent radiative decay rate, and C the quenching constant. This constant is a fit parameter
that is dependent on the individual ion, the size and size distribution of the particles, and on the
strength of the quenching. The relative quenching factor fq,i takes into account the distance of a
shell to the surface and the distance dependence of the quenching. When quenching is assumed
to take place via a dipole-dipole mechanism, the quenching has a distance dependence of r-6.1
The total quenching then has to be integrated over the total volume outside the nanoparticle.
Integration over the total volume gives the total quenching factor fq,i (Equation 4.A.2).
∫=V
-6iq,i dVr)(af (Eq. 4.A.2)
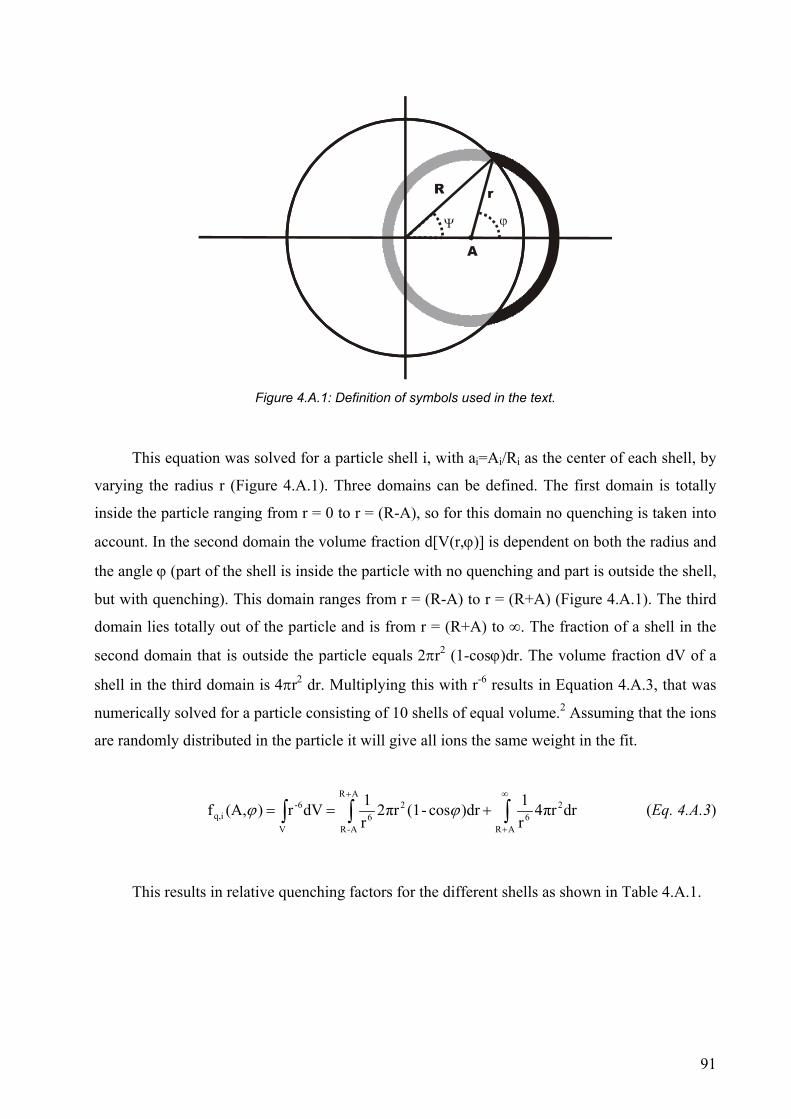
91
A
R r
Ψ ϕ
Figure 4.A.1: Definition of symbols used in the text.
This equation was solved for a particle shell i, with ai=Ai/Ri as the center of each shell, by
varying the radius r (Figure 4.A.1). Three domains can be defined. The first domain is totally
inside the particle ranging from r = 0 to r = (R-A), so for this domain no quenching is taken into
account. In the second domain the volume fraction d[V(r,ϕ)] is dependent on both the radius and
the angle ϕ (part of the shell is inside the particle with no quenching and part is outside the shell,
but with quenching). This domain ranges from r = (R-A) to r = (R+A) (Figure 4.A.1). The third
domain lies totally out of the particle and is from r = (R+A) to ∞. The fraction of a shell in the
second domain that is outside the particle equals 2πr2 (1-cosϕ)dr. The volume fraction dV of a
shell in the third domain is 4πr2 dr. Multiplying this with r-6 results in Equation 4.A.3, that was
numerically solved for a particle consisting of 10 shells of equal volume.2 Assuming that the ions
are randomly distributed in the particle it will give all ions the same weight in the fit.
∫ ∫ ∫+ ∞
+
+==V
AR
A-R AR
26
26
6-q,i drπr4
r1 )drcos-(1πr2
r1dVr)(A,f ϕϕ (Eq. 4.A.3)
This results in relative quenching factors for the different shells as shown in Table 4.A.1.
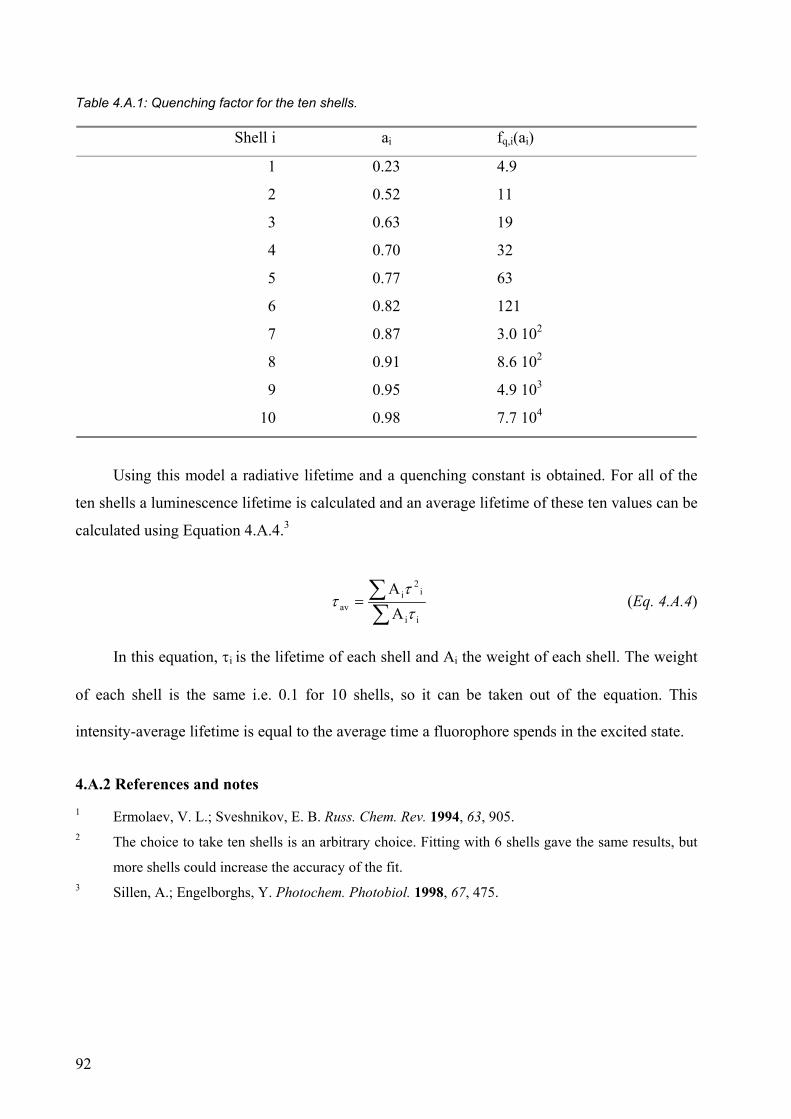
92
Table 4.A.1: Quenching factor for the ten shells.
Shell i ai fq,i(ai)
1 0.23 4.9
2 0.52 11
3 0.63 19
4 0.70 32
5 0.77 63
6 0.82 121
7 0.87 3.0 102
8 0.91 8.6 102
9 0.95 4.9 103
10 0.98 7.7 104
Using this model a radiative lifetime and a quenching constant is obtained. For all of the
ten shells a luminescence lifetime is calculated and an average lifetime of these ten values can be
calculated using Equation 4.A.4.3
∑∑=
ii
i2
iav A
Aττ
τ (Eq. 4.A.4)
In this equation, τi is the lifetime of each shell and Ai the weight of each shell. The weight
of each shell is the same i.e. 0.1 for 10 shells, so it can be taken out of the equation. This
intensity-average lifetime is equal to the average time a fluorophore spends in the excited state.
4.A.2 References and notes 1 Ermolaev, V. L.; Sveshnikov, E. B. Russ. Chem. Rev. 1994, 63, 905. 2 The choice to take ten shells is an arbitrary choice. Fitting with 6 shells gave the same results, but
more shells could increase the accuracy of the fit. 3 Sillen, A.; Engelborghs, Y. Photochem. Photobiol. 1998, 67, 475.

93
CCCHHHAAAPPPTTTEEERRR 555 Surface modification of lanthanide(III)-doped nanoparticles
Lanthanide-doped luminescent nanoparticles can be used as functional materials in
polymer-based optics. The solubility of the nanoparticles is determined by the
surface and the surface also has a major influence on the optical properties of the
lanthanide ions. Control over the solubility can be obtained by coordinating various
functionalized ligands to the surface of the nanoparticles. In this chapter the
exchange of ligands used in the synthesis of the nanoparticles is discussed together
with the reaction of functionalized ligands with the nanoparticle surface. The growth
of an inorganic shell around the nanoparticles is also discussed. With this inorganic
shell the luminescence properties of the lanthanide ions in the nanoparticles can be
improved significantly. This improvement is demonstrated by an increase in the
luminescence quantum yield and an increase in the luminescence lifetime of the
lanthanide ions.
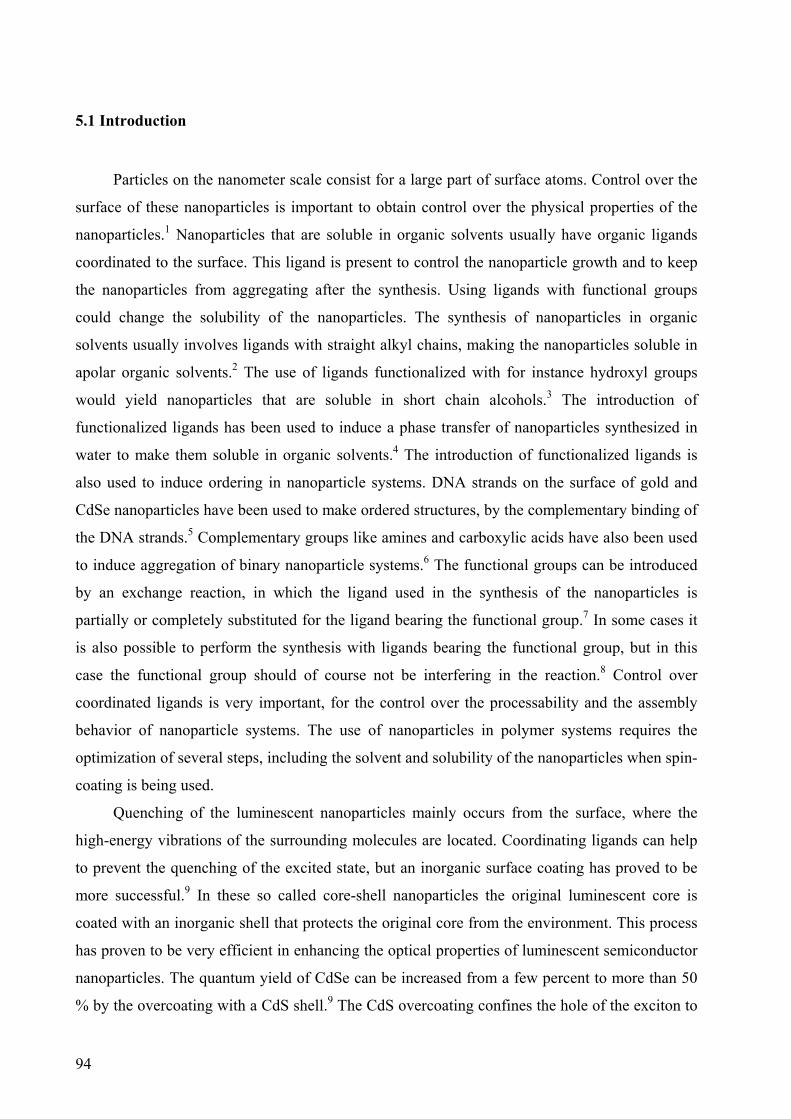
94
5.1 Introduction
Particles on the nanometer scale consist for a large part of surface atoms. Control over the
surface of these nanoparticles is important to obtain control over the physical properties of the
nanoparticles.1 Nanoparticles that are soluble in organic solvents usually have organic ligands
coordinated to the surface. This ligand is present to control the nanoparticle growth and to keep
the nanoparticles from aggregating after the synthesis. Using ligands with functional groups
could change the solubility of the nanoparticles. The synthesis of nanoparticles in organic
solvents usually involves ligands with straight alkyl chains, making the nanoparticles soluble in
apolar organic solvents.2 The use of ligands functionalized with for instance hydroxyl groups
would yield nanoparticles that are soluble in short chain alcohols.3 The introduction of
functionalized ligands has been used to induce a phase transfer of nanoparticles synthesized in
water to make them soluble in organic solvents.4 The introduction of functionalized ligands is
also used to induce ordering in nanoparticle systems. DNA strands on the surface of gold and
CdSe nanoparticles have been used to make ordered structures, by the complementary binding of
the DNA strands.5 Complementary groups like amines and carboxylic acids have also been used
to induce aggregation of binary nanoparticle systems.6 The functional groups can be introduced
by an exchange reaction, in which the ligand used in the synthesis of the nanoparticles is
partially or completely substituted for the ligand bearing the functional group.7 In some cases it
is also possible to perform the synthesis with ligands bearing the functional group, but in this
case the functional group should of course not be interfering in the reaction.8 Control over
coordinated ligands is very important, for the control over the processability and the assembly
behavior of nanoparticle systems. The use of nanoparticles in polymer systems requires the
optimization of several steps, including the solvent and solubility of the nanoparticles when spin-
coating is being used.
Quenching of the luminescent nanoparticles mainly occurs from the surface, where the
high-energy vibrations of the surrounding molecules are located. Coordinating ligands can help
to prevent the quenching of the excited state, but an inorganic surface coating has proved to be
more successful.9 In these so called core-shell nanoparticles the original luminescent core is
coated with an inorganic shell that protects the original core from the environment. This process
has proven to be very efficient in enhancing the optical properties of luminescent semiconductor
nanoparticles. The quantum yield of CdSe can be increased from a few percent to more than 50
% by the overcoating with a CdS shell.9 The CdS overcoating confines the hole of the exciton to
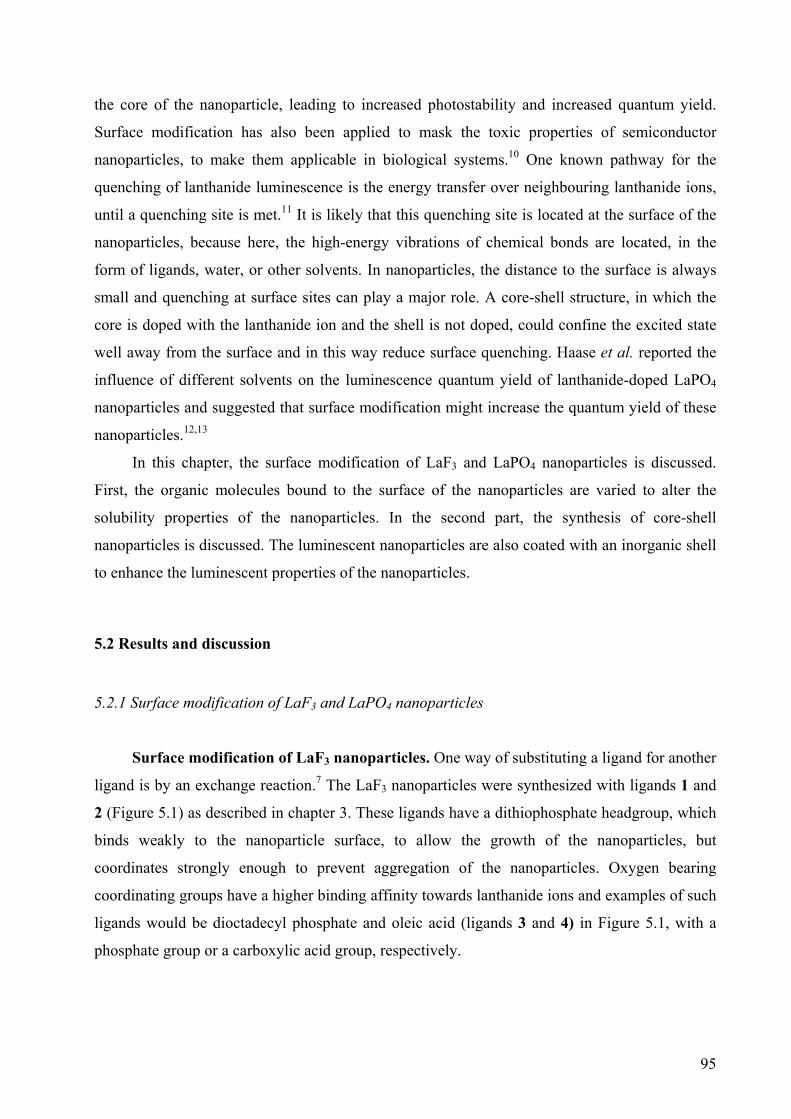
95
the core of the nanoparticle, leading to increased photostability and increased quantum yield.
Surface modification has also been applied to mask the toxic properties of semiconductor
nanoparticles, to make them applicable in biological systems.10 One known pathway for the
quenching of lanthanide luminescence is the energy transfer over neighbouring lanthanide ions,
until a quenching site is met.11 It is likely that this quenching site is located at the surface of the
nanoparticles, because here, the high-energy vibrations of chemical bonds are located, in the
form of ligands, water, or other solvents. In nanoparticles, the distance to the surface is always
small and quenching at surface sites can play a major role. A core-shell structure, in which the
core is doped with the lanthanide ion and the shell is not doped, could confine the excited state
well away from the surface and in this way reduce surface quenching. Haase et al. reported the
influence of different solvents on the luminescence quantum yield of lanthanide-doped LaPO4
nanoparticles and suggested that surface modification might increase the quantum yield of these
nanoparticles.12,13
In this chapter, the surface modification of LaF3 and LaPO4 nanoparticles is discussed.
First, the organic molecules bound to the surface of the nanoparticles are varied to alter the
solubility properties of the nanoparticles. In the second part, the synthesis of core-shell
nanoparticles is discussed. The luminescent nanoparticles are also coated with an inorganic shell
to enhance the luminescent properties of the nanoparticles.
5.2 Results and discussion
5.2.1 Surface modification of LaF3 and LaPO4 nanoparticles
Surface modification of LaF3 nanoparticles. One way of substituting a ligand for another
ligand is by an exchange reaction.7 The LaF3 nanoparticles were synthesized with ligands 1 and
2 (Figure 5.1) as described in chapter 3. These ligands have a dithiophosphate headgroup, which
binds weakly to the nanoparticle surface, to allow the growth of the nanoparticles, but
coordinates strongly enough to prevent aggregation of the nanoparticles. Oxygen bearing
coordinating groups have a higher binding affinity towards lanthanide ions and examples of such
ligands would be dioctadecyl phosphate and oleic acid (ligands 3 and 4) in Figure 5.1, with a
phosphate group or a carboxylic acid group, respectively.
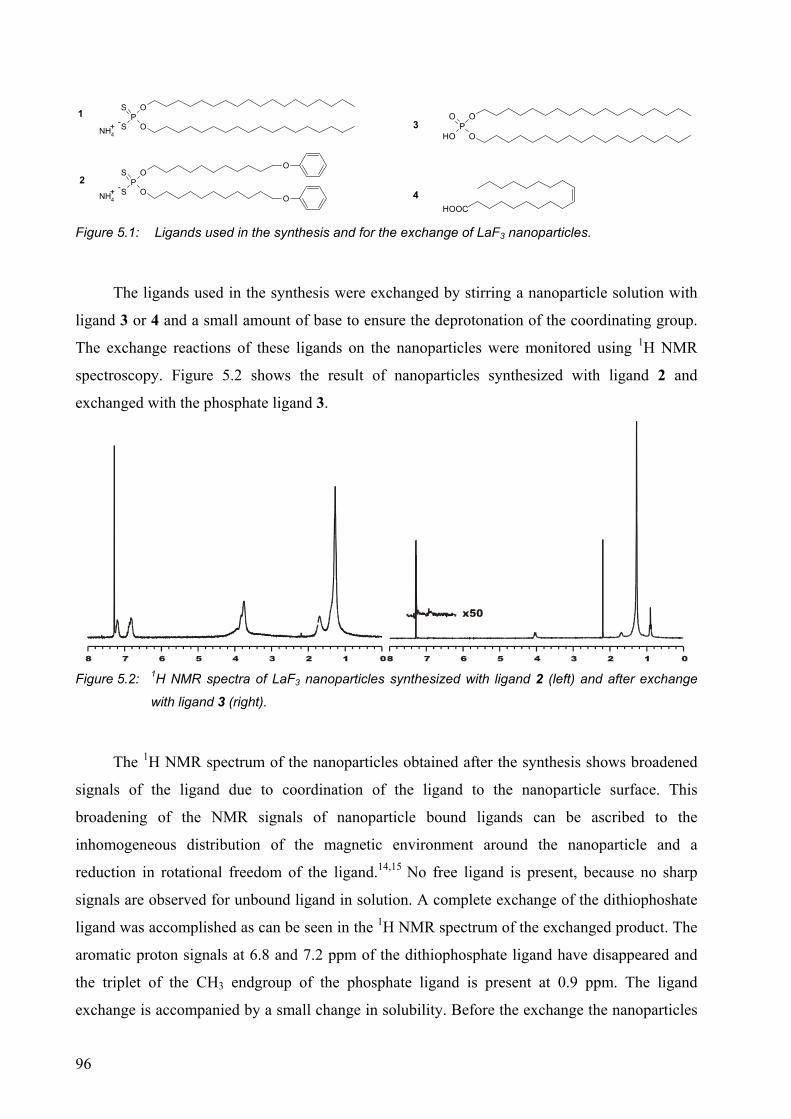
96
PS
S
O
O
O
ONH4+ -
PS
S
O
ONH4+ -
1
2
PO
OH
O
O
HOOC
3
4
Figure 5.1: Ligands used in the synthesis and for the exchange of LaF3 nanoparticles.
The ligands used in the synthesis were exchanged by stirring a nanoparticle solution with
ligand 3 or 4 and a small amount of base to ensure the deprotonation of the coordinating group.
The exchange reactions of these ligands on the nanoparticles were monitored using 1H NMR
spectroscopy. Figure 5.2 shows the result of nanoparticles synthesized with ligand 2 and
exchanged with the phosphate ligand 3.
x50
Figure 5.2: 1H NMR spectra of LaF3 nanoparticles synthesized with ligand 2 (left) and after exchange
with ligand 3 (right).
The 1H NMR spectrum of the nanoparticles obtained after the synthesis shows broadened
signals of the ligand due to coordination of the ligand to the nanoparticle surface. This
broadening of the NMR signals of nanoparticle bound ligands can be ascribed to the
inhomogeneous distribution of the magnetic environment around the nanoparticle and a
reduction in rotational freedom of the ligand.14,15 No free ligand is present, because no sharp
signals are observed for unbound ligand in solution. A complete exchange of the dithiophoshate
ligand was accomplished as can be seen in the 1H NMR spectrum of the exchanged product. The
aromatic proton signals at 6.8 and 7.2 ppm of the dithiophosphate ligand have disappeared and
the triplet of the CH3 endgroup of the phosphate ligand is present at 0.9 ppm. The ligand
exchange is accompanied by a small change in solubility. Before the exchange the nanoparticles
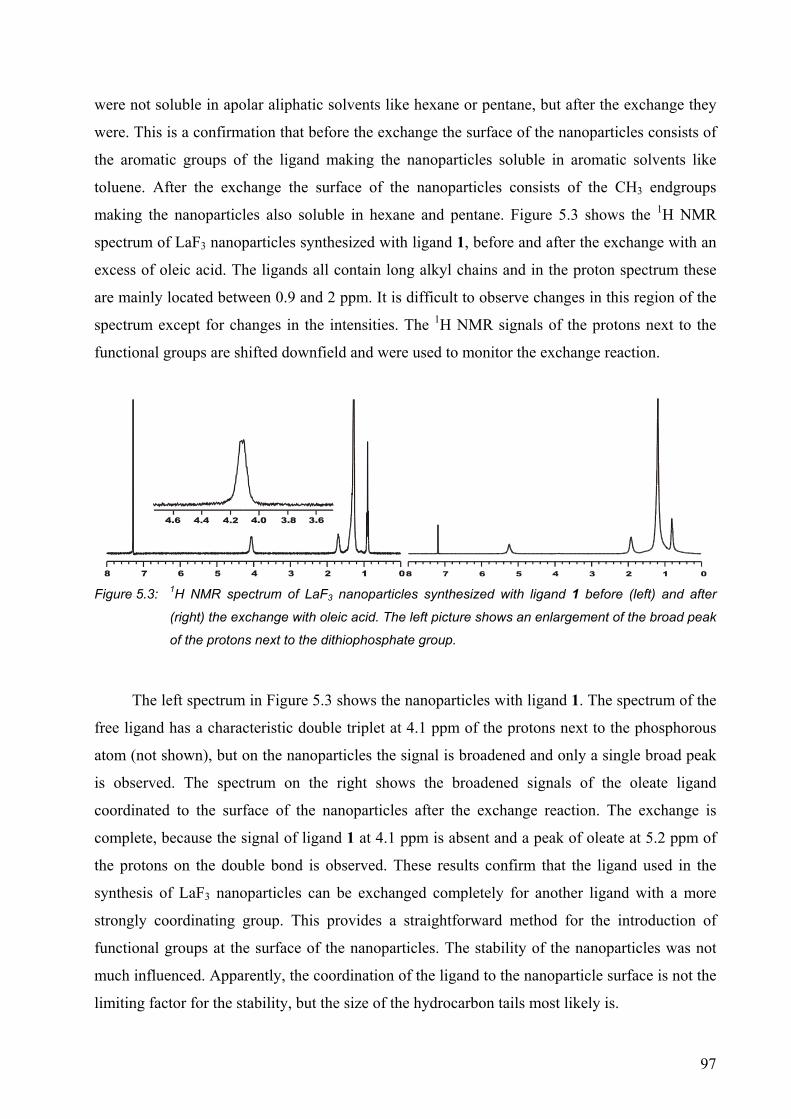
97
were not soluble in apolar aliphatic solvents like hexane or pentane, but after the exchange they
were. This is a confirmation that before the exchange the surface of the nanoparticles consists of
the aromatic groups of the ligand making the nanoparticles soluble in aromatic solvents like
toluene. After the exchange the surface of the nanoparticles consists of the CH3 endgroups
making the nanoparticles also soluble in hexane and pentane. Figure 5.3 shows the 1H NMR
spectrum of LaF3 nanoparticles synthesized with ligand 1, before and after the exchange with an
excess of oleic acid. The ligands all contain long alkyl chains and in the proton spectrum these
are mainly located between 0.9 and 2 ppm. It is difficult to observe changes in this region of the
spectrum except for changes in the intensities. The 1H NMR signals of the protons next to the
functional groups are shifted downfield and were used to monitor the exchange reaction.
Figure 5.3: 1H NMR spectrum of LaF3 nanoparticles synthesized with ligand 1 before (left) and after
(right) the exchange with oleic acid. The left picture shows an enlargement of the broad peak
of the protons next to the dithiophosphate group.
The left spectrum in Figure 5.3 shows the nanoparticles with ligand 1. The spectrum of the
free ligand has a characteristic double triplet at 4.1 ppm of the protons next to the phosphorous
atom (not shown), but on the nanoparticles the signal is broadened and only a single broad peak
is observed. The spectrum on the right shows the broadened signals of the oleate ligand
coordinated to the surface of the nanoparticles after the exchange reaction. The exchange is
complete, because the signal of ligand 1 at 4.1 ppm is absent and a peak of oleate at 5.2 ppm of
the protons on the double bond is observed. These results confirm that the ligand used in the
synthesis of LaF3 nanoparticles can be exchanged completely for another ligand with a more
strongly coordinating group. This provides a straightforward method for the introduction of
functional groups at the surface of the nanoparticles. The stability of the nanoparticles was not
much influenced. Apparently, the coordination of the ligand to the nanoparticle surface is not the
limiting factor for the stability, but the size of the hydrocarbon tails most likely is.
98
Another possibility to functionalize the surface of the LaF3 nanoparticles is to carry out the
synthesis with ligands that already have functional groups. This is probably the most
straightforward way to tune the solubility of the nanoparticles in different solvents. A synthesis
route to obtain functionalized dithio ligands is shown Scheme 5.1.
OH Br
OH
R
OH O R PS
S
O
O
O
O
R
RNH4+ -
+
i
ii
5 : R = COOMe
6 : R = Cl
2 : R= H
5a : R = COOMe
6a : R = Cl
2a : R= H
Scheme 5.1: Synthesis route for functional dithio-phosphate ligands: i: K2CO3, acetonitril, reflux, yield: 99
%; ii: P2S5, NH3, yield: 60 %.
The synthesis of these ligands is similar to the synthesis of ligand 2, using a functionalized
phenol instead of phenol. Every functionality that does not interfere in the second step of the
reaction can be used, making this a versatile method to functionalize the surface of the LaF3
nanoparticles. Nanoparticles synthesized with these ligands do show different solubilities.
Nanoparticles synthesized with ligand 2 are soluble in apolar solvents like, toluene,
dichloromethane, and chloroform. Nanoparticles synthesized with ligand 5 are soluble in
solvents containing ester and ketone groups like, ethylacetate, cyclopentanone, and γ-
butyrolactone. The last two solvents are commonly used for the spin-coating of polymer
solutions. The optical properties of the nanoparticles are independent of the functionalities of the
ligand, so the functionalities do not interfere in the formation of the inorganic core of the
nanoparticles. The same luminescence spectrum and luminescence lifetime were measured and
no change in the nanoparticle cores was observed with TEM.
Surface modification of LaPO4 nanoparticles. The surface of LaPO4 nanoparticles
consists of phosphate groups and some coordinated diphosphate ligands originating from the
decomposition of the solvent. The surface of the nanoparticles is covered with OH groups of the
phosphate groups, which provide the opportunity to bind molecules covalently to the surface.
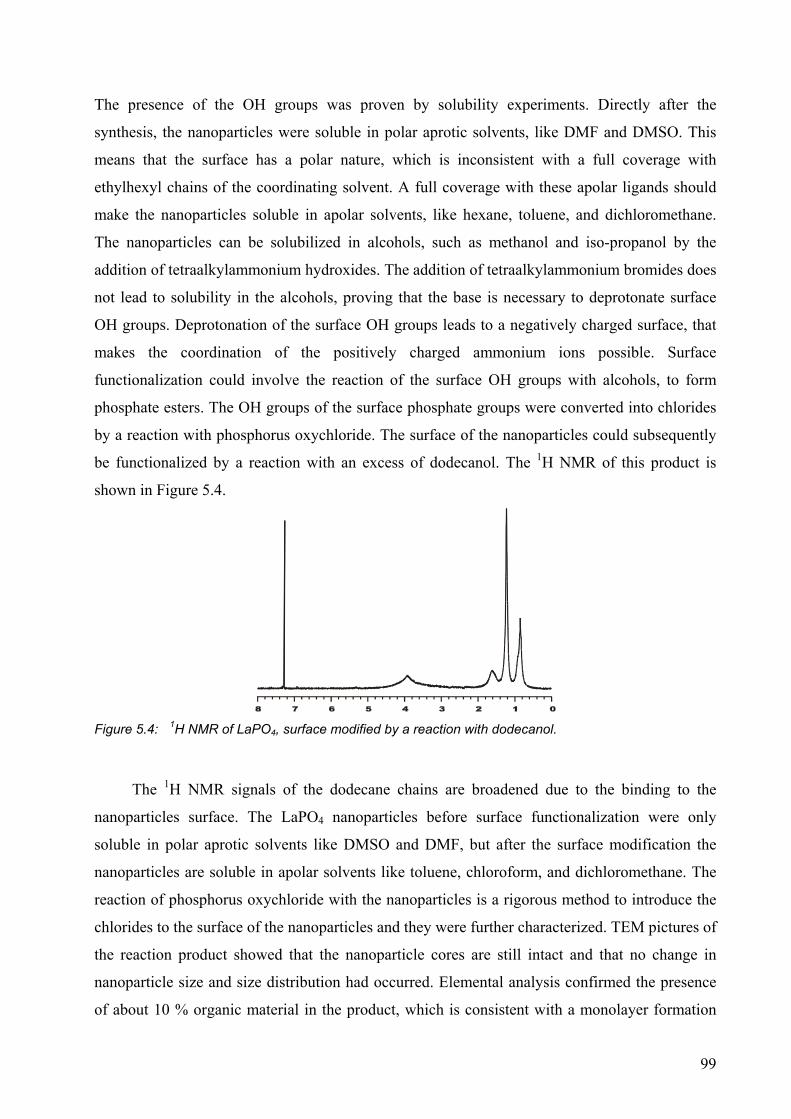
99
The presence of the OH groups was proven by solubility experiments. Directly after the
synthesis, the nanoparticles were soluble in polar aprotic solvents, like DMF and DMSO. This
means that the surface has a polar nature, which is inconsistent with a full coverage with
ethylhexyl chains of the coordinating solvent. A full coverage with these apolar ligands should
make the nanoparticles soluble in apolar solvents, like hexane, toluene, and dichloromethane.
The nanoparticles can be solubilized in alcohols, such as methanol and iso-propanol by the
addition of tetraalkylammonium hydroxides. The addition of tetraalkylammonium bromides does
not lead to solubility in the alcohols, proving that the base is necessary to deprotonate surface
OH groups. Deprotonation of the surface OH groups leads to a negatively charged surface, that
makes the coordination of the positively charged ammonium ions possible. Surface
functionalization could involve the reaction of the surface OH groups with alcohols, to form
phosphate esters. The OH groups of the surface phosphate groups were converted into chlorides
by a reaction with phosphorus oxychloride. The surface of the nanoparticles could subsequently
be functionalized by a reaction with an excess of dodecanol. The 1H NMR of this product is
shown in Figure 5.4.
Figure 5.4: 1H NMR of LaPO4, surface modified by a reaction with dodecanol.
The 1H NMR signals of the dodecane chains are broadened due to the binding to the
nanoparticles surface. The LaPO4 nanoparticles before surface functionalization were only
soluble in polar aprotic solvents like DMSO and DMF, but after the surface modification the
nanoparticles are soluble in apolar solvents like toluene, chloroform, and dichloromethane. The
reaction of phosphorus oxychloride with the nanoparticles is a rigorous method to introduce the
chlorides to the surface of the nanoparticles and they were further characterized. TEM pictures of
the reaction product showed that the nanoparticle cores are still intact and that no change in
nanoparticle size and size distribution had occurred. Elemental analysis confirmed the presence
of about 10 % organic material in the product, which is consistent with a monolayer formation
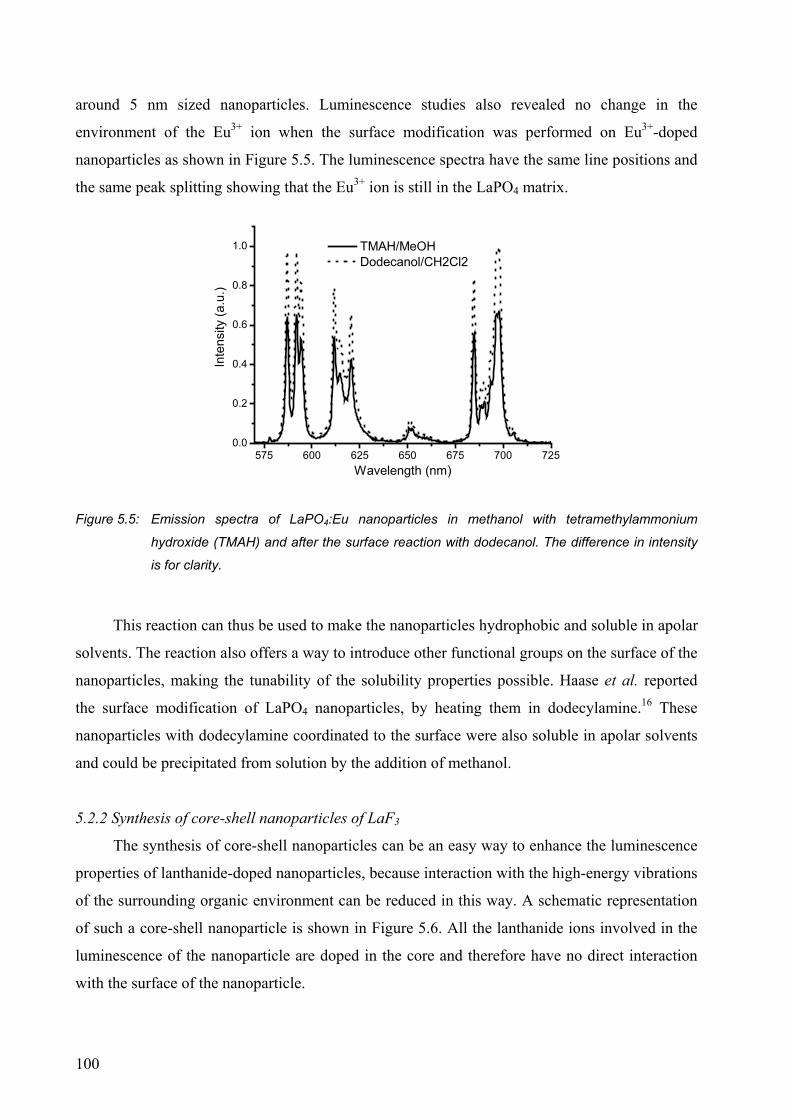
100
around 5 nm sized nanoparticles. Luminescence studies also revealed no change in the
environment of the Eu3+ ion when the surface modification was performed on Eu3+-doped
nanoparticles as shown in Figure 5.5. The luminescence spectra have the same line positions and
the same peak splitting showing that the Eu3+ ion is still in the LaPO4 matrix.
575 600 625 650 675 700 7250.0
0.2
0.4
0.6
0.8
1.0 TMAH/MeOH Dodecanol/CH2Cl2
Inte
nsity
(a.u
.)
Wavelength (nm)
Figure 5.5: Emission spectra of LaPO4:Eu nanoparticles in methanol with tetramethylammonium
hydroxide (TMAH) and after the surface reaction with dodecanol. The difference in intensity
is for clarity.
This reaction can thus be used to make the nanoparticles hydrophobic and soluble in apolar
solvents. The reaction also offers a way to introduce other functional groups on the surface of the
nanoparticles, making the tunability of the solubility properties possible. Haase et al. reported
the surface modification of LaPO4 nanoparticles, by heating them in dodecylamine.16 These
nanoparticles with dodecylamine coordinated to the surface were also soluble in apolar solvents
and could be precipitated from solution by the addition of methanol.
5.2.2 Synthesis of core-shell nanoparticles of LaF3
The synthesis of core-shell nanoparticles can be an easy way to enhance the luminescence
properties of lanthanide-doped nanoparticles, because interaction with the high-energy vibrations
of the surrounding organic environment can be reduced in this way. A schematic representation
of such a core-shell nanoparticle is shown in Figure 5.6. All the lanthanide ions involved in the
luminescence of the nanoparticle are doped in the core and therefore have no direct interaction
with the surface of the nanoparticle.
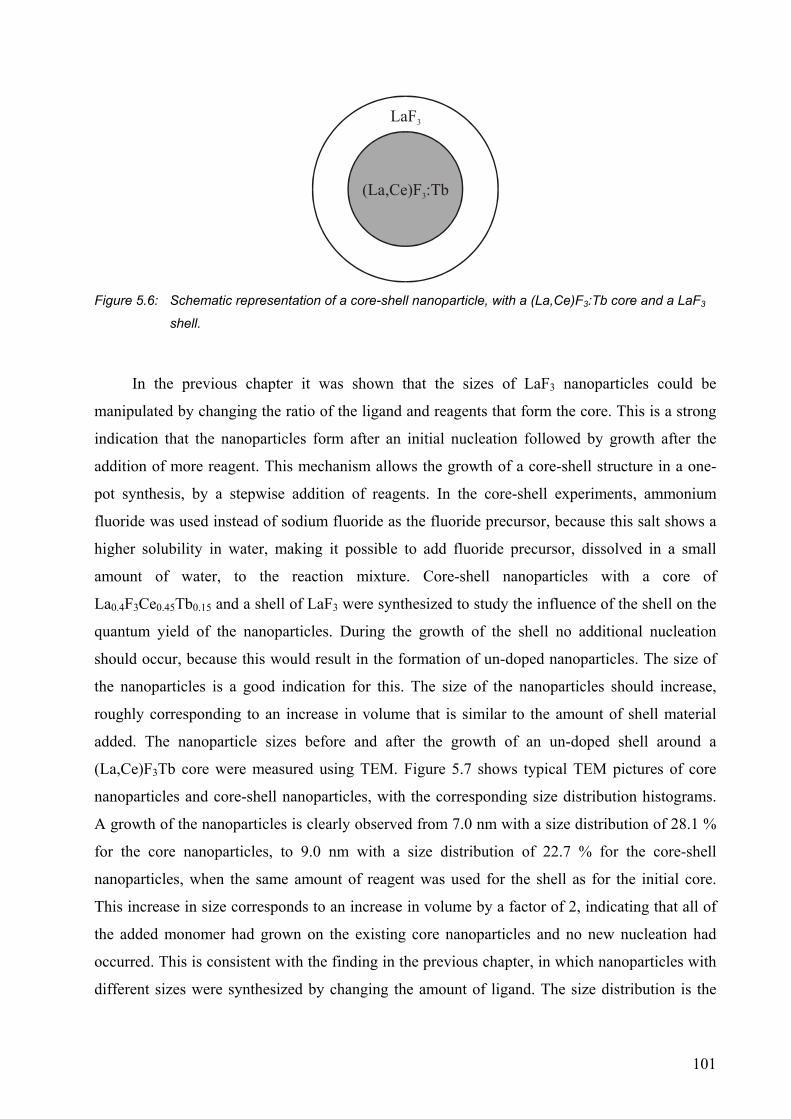
101
(La,Ce)F :Tb3
LaF3
Figure 5.6: Schematic representation of a core-shell nanoparticle, with a (La,Ce)F3:Tb core and a LaF3
shell.
In the previous chapter it was shown that the sizes of LaF3 nanoparticles could be
manipulated by changing the ratio of the ligand and reagents that form the core. This is a strong
indication that the nanoparticles form after an initial nucleation followed by growth after the
addition of more reagent. This mechanism allows the growth of a core-shell structure in a one-
pot synthesis, by a stepwise addition of reagents. In the core-shell experiments, ammonium
fluoride was used instead of sodium fluoride as the fluoride precursor, because this salt shows a
higher solubility in water, making it possible to add fluoride precursor, dissolved in a small
amount of water, to the reaction mixture. Core-shell nanoparticles with a core of
La0.4F3Ce0.45Tb0.15 and a shell of LaF3 were synthesized to study the influence of the shell on the
quantum yield of the nanoparticles. During the growth of the shell no additional nucleation
should occur, because this would result in the formation of un-doped nanoparticles. The size of
the nanoparticles is a good indication for this. The size of the nanoparticles should increase,
roughly corresponding to an increase in volume that is similar to the amount of shell material
added. The nanoparticle sizes before and after the growth of an un-doped shell around a
(La,Ce)F3Tb core were measured using TEM. Figure 5.7 shows typical TEM pictures of core
nanoparticles and core-shell nanoparticles, with the corresponding size distribution histograms.
A growth of the nanoparticles is clearly observed from 7.0 nm with a size distribution of 28.1 %
for the core nanoparticles, to 9.0 nm with a size distribution of 22.7 % for the core-shell
nanoparticles, when the same amount of reagent was used for the shell as for the initial core.
This increase in size corresponds to an increase in volume by a factor of 2, indicating that all of
the added monomer had grown on the existing core nanoparticles and no new nucleation had
occurred. This is consistent with the finding in the previous chapter, in which nanoparticles with
different sizes were synthesized by changing the amount of ligand. The size distribution is the
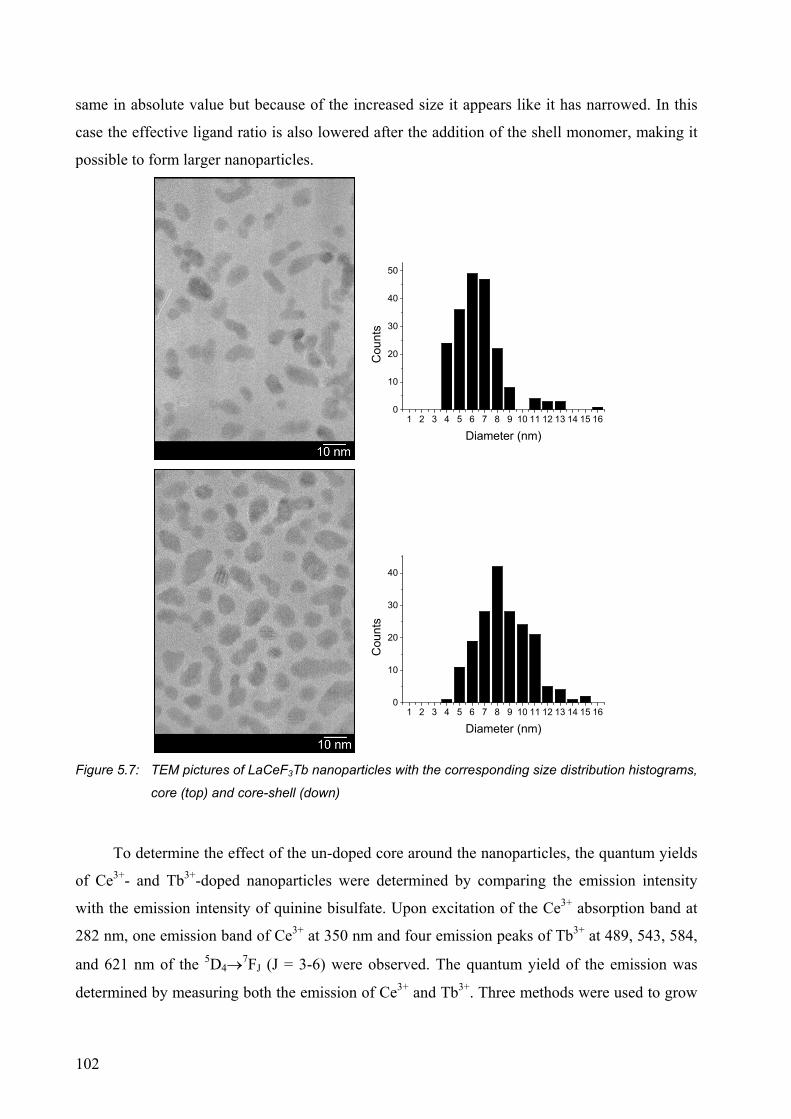
102
same in absolute value but because of the increased size it appears like it has narrowed. In this
case the effective ligand ratio is also lowered after the addition of the shell monomer, making it
possible to form larger nanoparticles.
1 2 3 4 5 6 7 8 9 10 11 12 13 14 15 160
10
20
30
40
50
Cou
nts
Diameter (nm)
1 2 3 4 5 6 7 8 9 10 11 12 13 14 15 160
10
20
30
40
Cou
nts
Diameter (nm)
Figure 5.7: TEM pictures of LaCeF3Tb nanoparticles with the corresponding size distribution histograms,
core (top) and core-shell (down)
To determine the effect of the un-doped core around the nanoparticles, the quantum yields
of Ce3+- and Tb3+-doped nanoparticles were determined by comparing the emission intensity
with the emission intensity of quinine bisulfate. Upon excitation of the Ce3+ absorption band at
282 nm, one emission band of Ce3+ at 350 nm and four emission peaks of Tb3+ at 489, 543, 584,
and 621 nm of the 5D4→7FJ (J = 3-6) were observed. The quantum yield of the emission was
determined by measuring both the emission of Ce3+ and Tb3+. Three methods were used to grow
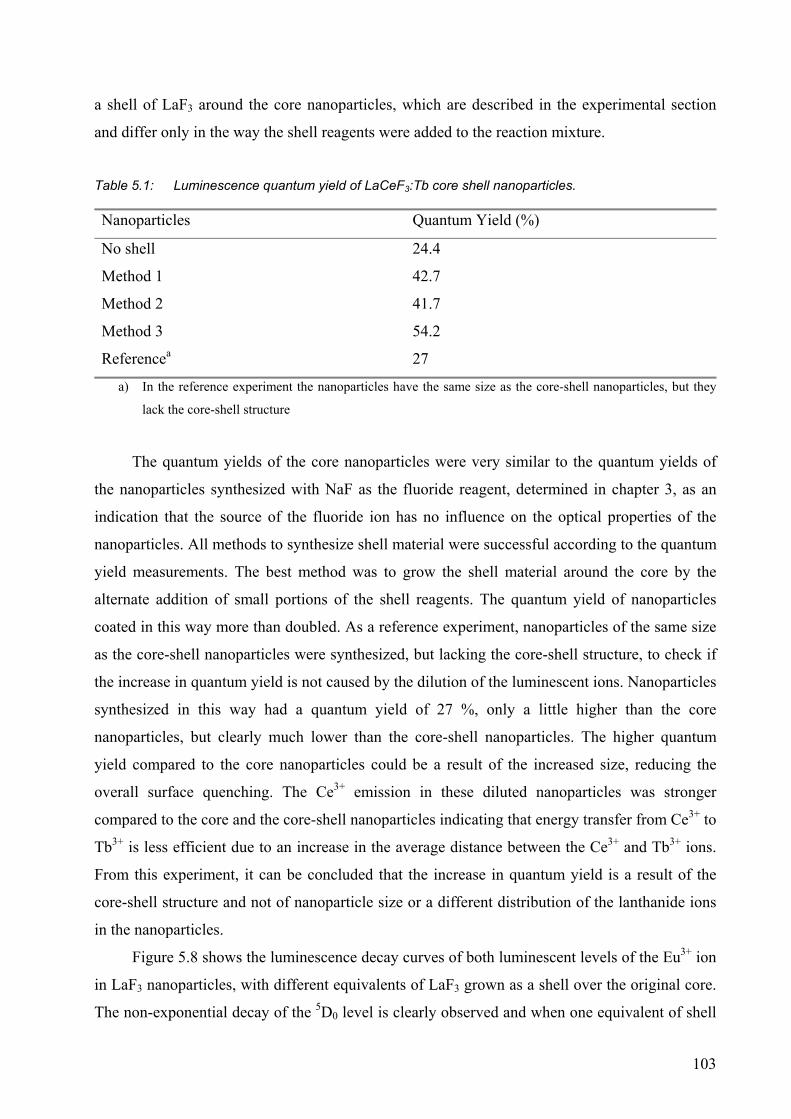
103
a shell of LaF3 around the core nanoparticles, which are described in the experimental section
and differ only in the way the shell reagents were added to the reaction mixture.
Table 5.1: Luminescence quantum yield of LaCeF3:Tb core shell nanoparticles.
Nanoparticles Quantum Yield (%)
No shell 24.4
Method 1 42.7
Method 2 41.7
Method 3 54.2
Referencea 27
a) In the reference experiment the nanoparticles have the same size as the core-shell nanoparticles, but they
lack the core-shell structure
The quantum yields of the core nanoparticles were very similar to the quantum yields of
the nanoparticles synthesized with NaF as the fluoride reagent, determined in chapter 3, as an
indication that the source of the fluoride ion has no influence on the optical properties of the
nanoparticles. All methods to synthesize shell material were successful according to the quantum
yield measurements. The best method was to grow the shell material around the core by the
alternate addition of small portions of the shell reagents. The quantum yield of nanoparticles
coated in this way more than doubled. As a reference experiment, nanoparticles of the same size
as the core-shell nanoparticles were synthesized, but lacking the core-shell structure, to check if
the increase in quantum yield is not caused by the dilution of the luminescent ions. Nanoparticles
synthesized in this way had a quantum yield of 27 %, only a little higher than the core
nanoparticles, but clearly much lower than the core-shell nanoparticles. The higher quantum
yield compared to the core nanoparticles could be a result of the increased size, reducing the
overall surface quenching. The Ce3+ emission in these diluted nanoparticles was stronger
compared to the core and the core-shell nanoparticles indicating that energy transfer from Ce3+ to
Tb3+ is less efficient due to an increase in the average distance between the Ce3+ and Tb3+ ions.
From this experiment, it can be concluded that the increase in quantum yield is a result of the
core-shell structure and not of nanoparticle size or a different distribution of the lanthanide ions
in the nanoparticles.
Figure 5.8 shows the luminescence decay curves of both luminescent levels of the Eu3+ ion
in LaF3 nanoparticles, with different equivalents of LaF3 grown as a shell over the original core.
The non-exponential decay of the 5D0 level is clearly observed and when one equivalent of shell
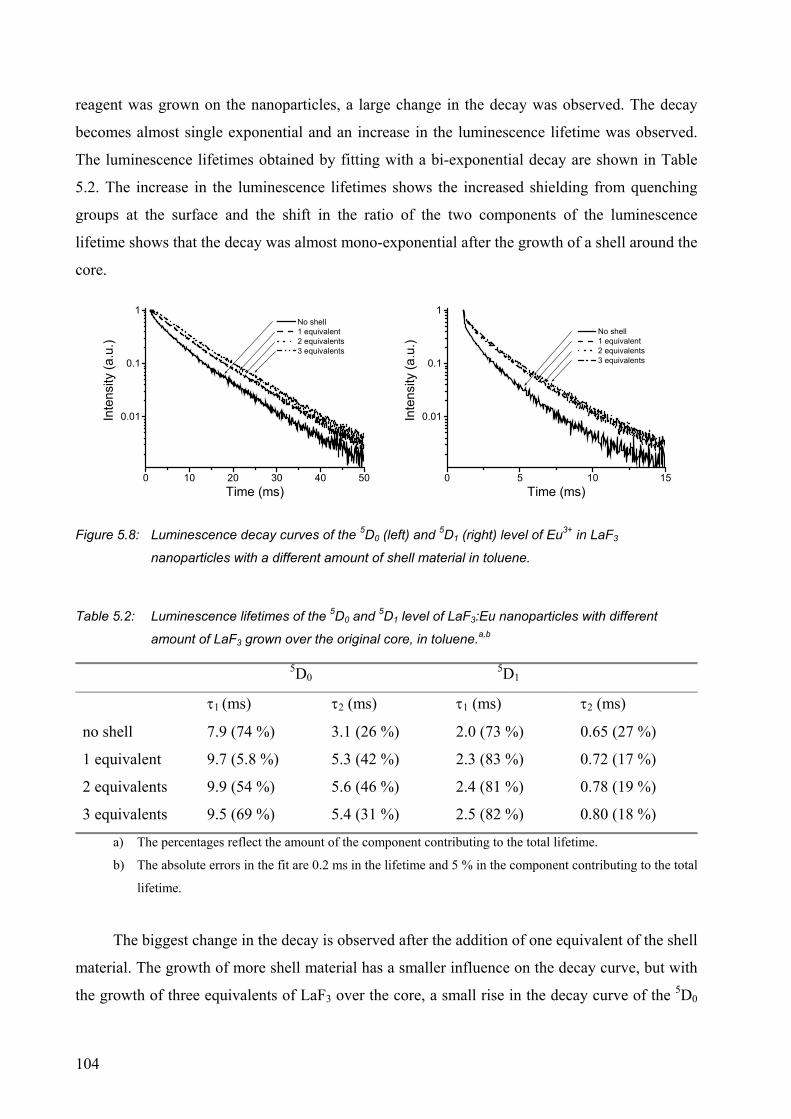
104
reagent was grown on the nanoparticles, a large change in the decay was observed. The decay
becomes almost single exponential and an increase in the luminescence lifetime was observed.
The luminescence lifetimes obtained by fitting with a bi-exponential decay are shown in Table
5.2. The increase in the luminescence lifetimes shows the increased shielding from quenching
groups at the surface and the shift in the ratio of the two components of the luminescence
lifetime shows that the decay was almost mono-exponential after the growth of a shell around the
core.
0 10 20 30 40 50
0.01
0.1
1 No shell 1 equivalent 2 equivalents 3 equivalents
Inte
nsity
(a.u
.)
Time (ms)0 5 10 15
0.01
0.1
1
No shell 1 equivalent 2 equivalents 3 equivalents
Inte
nsity
(a.u
.)
Time (ms)
Figure 5.8: Luminescence decay curves of the 5D0 (left) and 5D1 (right) level of Eu3+ in LaF3
nanoparticles with a different amount of shell material in toluene.
Table 5.2: Luminescence lifetimes of the 5D0 and 5D1 level of LaF3:Eu nanoparticles with different
amount of LaF3 grown over the original core, in toluene.a,b
5D0 5D1
τ1 (ms) τ2 (ms) τ1 (ms) τ2 (ms)
no shell 7.9 (74 %) 3.1 (26 %) 2.0 (73 %) 0.65 (27 %)
1 equivalent 9.7 (5.8 %) 5.3 (42 %) 2.3 (83 %) 0.72 (17 %)
2 equivalents 9.9 (54 %) 5.6 (46 %) 2.4 (81 %) 0.78 (19 %)
3 equivalents 9.5 (69 %) 5.4 (31 %) 2.5 (82 %) 0.80 (18 %)
a) The percentages reflect the amount of the component contributing to the total lifetime.
b) The absolute errors in the fit are 0.2 ms in the lifetime and 5 % in the component contributing to the total
lifetime.
The biggest change in the decay is observed after the addition of one equivalent of the shell
material. The growth of more shell material has a smaller influence on the decay curve, but with
the growth of three equivalents of LaF3 over the core, a small rise in the decay curve of the 5D0
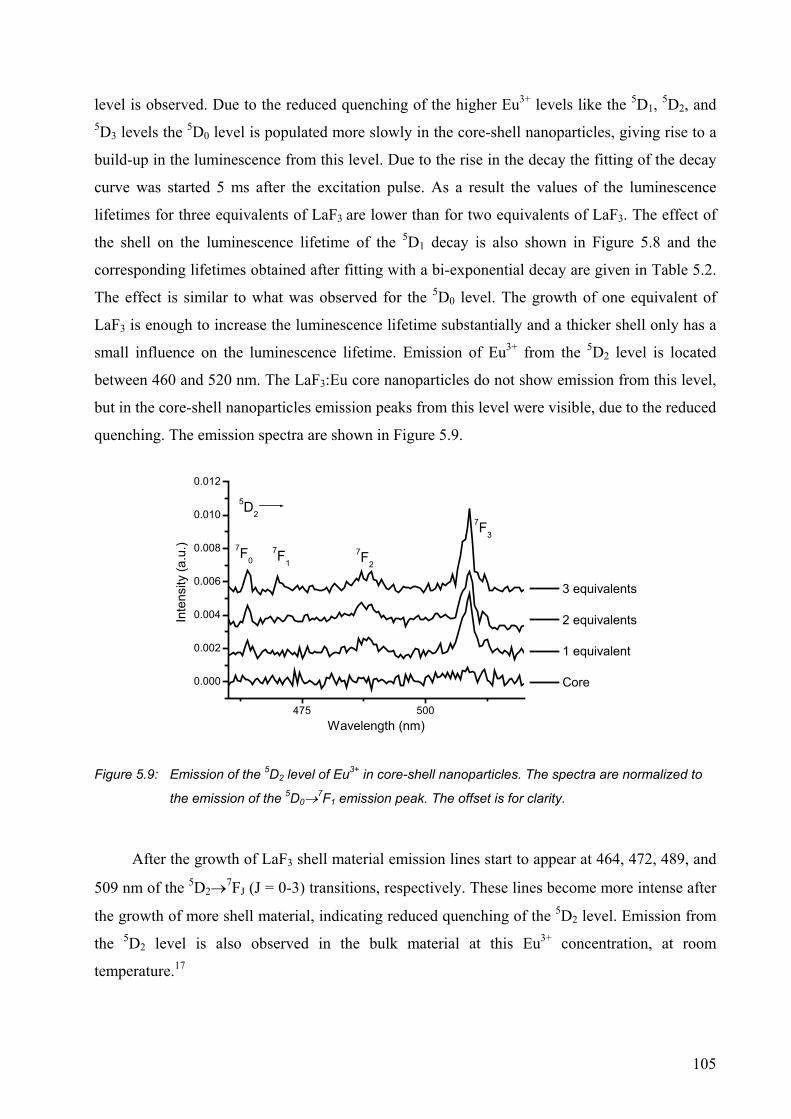
105
level is observed. Due to the reduced quenching of the higher Eu3+ levels like the 5D1, 5D2, and 5D3 levels the 5D0 level is populated more slowly in the core-shell nanoparticles, giving rise to a
build-up in the luminescence from this level. Due to the rise in the decay the fitting of the decay
curve was started 5 ms after the excitation pulse. As a result the values of the luminescence
lifetimes for three equivalents of LaF3 are lower than for two equivalents of LaF3. The effect of
the shell on the luminescence lifetime of the 5D1 decay is also shown in Figure 5.8 and the
corresponding lifetimes obtained after fitting with a bi-exponential decay are given in Table 5.2.
The effect is similar to what was observed for the 5D0 level. The growth of one equivalent of
LaF3 is enough to increase the luminescence lifetime substantially and a thicker shell only has a
small influence on the luminescence lifetime. Emission of Eu3+ from the 5D2 level is located
between 460 and 520 nm. The LaF3:Eu core nanoparticles do not show emission from this level,
but in the core-shell nanoparticles emission peaks from this level were visible, due to the reduced
quenching. The emission spectra are shown in Figure 5.9.
475 500
0.000
0.002
0.004
0.006
0.008
0.010
0.012
7F3
7F2
7F1
7F0
5D2
3 equivalents
2 equivalents
1 equivalent
Core
Inte
nsity
(a.u
.)
Wavelength (nm)
Figure 5.9: Emission of the 5D2 level of Eu3+ in core-shell nanoparticles. The spectra are normalized to
the emission of the 5D0→7F1 emission peak. The offset is for clarity.
After the growth of LaF3 shell material emission lines start to appear at 464, 472, 489, and
509 nm of the 5D2→7FJ (J = 0-3) transitions, respectively. These lines become more intense after
the growth of more shell material, indicating reduced quenching of the 5D2 level. Emission from
the 5D2 level is also observed in the bulk material at this Eu3+ concentration, at room
temperature.17
106
5.3 Conclusions
The solubility of LaF3 and LaPO4 nanoparticles can be varied by changing the ligands that
are coordinated to the surface of the nanoparticles. Surface quenching of lanthanide-doped
nanoparticles was reduced by the synthesis of core-shell nanoparticles. The synthesis of an un-
doped shell around the nanoparticles reduces the quenching of lanthanide ions that are doped in
the core of the nanoparticles.
5.4 Experimental section
Oleic acid and octadecanol were purchased from Fluka. Phosphorus oxychloride was purchased from
Acros. THF was freshly distilled from Na/benzophenon. 1H NMR measurements on nanoparticles were
performed on un-doped nanoparticles to exclude the influence of the paramagnetic nature of some of the
luminescent lanthanide ions.
Ligand 3. A solution of 5 g (18.5 mmol) of octadecanol in 20 ml of anhydrous THF was slowly dropped
into 1.42 g (9.2 mmol) of OPCl3 at –15 °C under Ar. The solution was slowly allowed to warm to room
temperature and stirred for two hours. After the addition of 1 ml of water, the solution was vigorously
stirred for 1 hour, followed by the addition of 100 ml of ethyl acetate. The organic phase was separated
and washed three times with 1 N HCl. The organic layer was dried over MgSO4 and evaporated to
dryness. The residue was dissolved in 20 ml of hexane and NH3 was bubbled to the solution. The
precipitate was filtered, washed with hexane, and dried. To substitute the ammonium counterion for a
proton, the product was taken up in ethyl acetate and washed three times with 1 N HCl. The organic layer
was dried over MgSO4 and evaporated to dryness. A white solid remained, yield 2.9 g, 53 %, m.p. 71-73
°C. 1H NMR (CDCl3): δ 4.1 (dt, J = 7.0, 6.6 Hz, 4H), 1.7 (m, 4H), 1.3 (m, 60 H), 0.9 (t, J = 6.6 Hz, 6H);
MS (FAB) m/z = 602.5 [(M+), calcd. for C36H75O4P: 603.0]; Anal calcd. for C36H75O4P: C, 71.71; H,
12.54. Found: C, 71.45; H, 12.80.
Compound 5a was synthesized by refluxing overnight a mixture of; 10 g (39.3 mmol) bromoundecanol,
7.78 g (51 mmol) of methyl-4-hydroxy benzoate, and 7.06 g (51 mmol) K2CO3 in 100 ml of acetonitril.
The mixture was cooled to room temperature and 300 ml of ethylacetate were added. This solution was
washed with 1 N NaOH three times and one time with water. The organic layer was dried over MgSO4,
filtered, and the organic solvent removed under vacuum. A white solid remained, that was recrystallized
from ethylacetate, yield 99 %, m. p. 69-71 °C. 1H NMR (CDCl3): δ 8.1 (d, J = 8.8 Hz, 2H), 6.9 (d, J = 8.8
Hz, 2H), 4.0 (t, J = 6.2 Hz, 2H), 3.9 (s, 3H), 3.6 (dt, J = 6.6, 4.4 Hz, 2H), 1.8 (m, 2H), 1.6-1.4(m, 16H);
107
MS (FAB ) m/z = 323.2 [(M+H)+, calcd. for C19H31O4: 323.2]; Anal calcd. for C19H30O4: C, 70.77; H,
9.38. Found: C, 70.88; H, 9.55.
Ligand 5 was synthesized by heating 9.72 g (30 mmol) of compound 5a with 1.91 g (8.6 mmol) of P2S5
at 80 °C for 3 hours. The workup of this reaction was the same as for ligand 2 in chapter 3. The product
was obtained as a white solid, in a yield of 73 %, m. p. 81-83 °C. 1H NMR (acetone-d6): δ 7.9 (d, J = 9.2
Hz, 4H), 7.0 (d, J = 9.2 Hz, 4H), 4.1 (t, J = 6.6 Hz, 4H), 3.9 (dt, J = 8.4, 6.6 Hz, 4H), 3.8 (s, 6H), 1.8 (m,
4H), 1.5-1.3 (m, 32H); MS (FAB) m/z = 737.5 [(M-NH4)-, calcd. for C38H58O8PS2: 737.0]; Anal calcd. for
C38H62O8PS2N: C, 60.37; H, 8.27; N, 1.85; S, 8.48. Found: C, 59.87; H, 8.72; N, 1.95; S, 8.37.
Compound 6a was synthesized by refluxing overnight; 7.06 g (51 mmol) of K2CO3, 6.6 g (51 mmol) of
4-chlorophenol, and 10 g (39.3 mmol) of bromoundecanol in 100 ml of acetonitril. The workup of the
reaction mixture was the same as for compound 5a. The product was obtained as a white solid after
recrystallization from hexane, in a yield of 98 %, m. p. 42-43 °C. 1H NMR (CDCl3): δ 7.3 (d, J = 9.2 Hz,
2H), 6.8 (d, J = 9.2 Hz, 2H), 3.9 (t, J = 6.6 Hz, 2H), 3.7 (dt, J = 6.6, 5.1 Hz, 2H), 1.8 (m, 2H), 1.6-1.3 (m,
16H); MS (FAB) m/z 298.3 [M+, calcd. for C17H27O2Cl: 298.2; Anal calcd. for C17H25O2Cl: C, 68.79; H,
8.49. Found: C, 68.54; H, 8.35.
Ligand 6 was synthesized by heating 9.7 g (32.5 mmol) of compound 6a and 2.06 g (9.3 mmol) of P2S5
at 80 °C for 3 hours. The workup of this reaction mixture was the same as for Ligand 5. The product was
a white solid obtained in 70 % yield, m. p. 57-60 °C. 1H NMR (CDCl3) δ 7.2 (d, J = 9.2 Hz, 4H), 6.8 (d, J
= 8.8 Hz, 4H), 4.0 (dt, J = 8.4, 6.9 Hz, 4H), 3.9 (t, J = 6.6 Hz, 4H), 1.8-1.7 (m, 8H), 1.4-1.3 (m, 28H); MS
(FAB) m/z = 689.2 [(M-NH4)-, calcd. for C34H52O4PS2Cl2: 689.2]; Anal calcd. for C34H56O4PS2NCl2: C,
57.61; H, 7.96; N, 1.98; S, 9.05. Found: C, 57.42; H, 8.05; N, 2.04; S, 9.20.
Exchange reaction on LaF3 nanoparticles. To a solution of 100 mg of LaF3 nanoparticles in 5 ml
dichloromethane was added 100 mg of ligand 3 or 4 and 100 µl of triethylamine. This solution was stirred
overnight and methanol was added to precipitate the nanoparticles. The precipitate was separated by
centrifugation and washed repeatedly with polar solvents like methanol, ethanol, or acetone, until no free
ligand was observed in the 1H NMR spectrum.
Surface modification of LaPO4 nanoparticles. The surface phosphate groups of the nanoparticles were
first reacted with phosphorus oxychloride by heating 100 mg of nanoparticles in 5 ml of OPCl3 for two
hours at 120 °C. After two hours the solution was cooled to room temperature and the OPCl3 was
evaporated under vacuum followed by the addition of 5 ml of toluene containing 1 ml of dodecanol. This
solution was refluxed for two hours and then cooled to room temperature. To remove excess dodecanol
108
the nanoparticles were precipitated by the addition of 20 ml of methanol and separated by centrifugation.
After washing a few times with methanol the nanoparticles were soluble in apolar solvent like toluene,
dichloromethane, and chloroform.
Core-shell nanoparticles. LaF3 core-shell nanoparticles were synthesized similar to the core
nanoparticles described in chapter 3. NaF was substituted by NH4F because of an increased solubility in
water. The core of the nanoparticles was synthesized by the dropwise addition of the lanthanide salts to
the NH4F and ligand 1 in 35 ml of a water/ethanol mixture at 75 °C. This mixture was stirred for 10 min
followed by the shell growth. To determine the best way of growing a shell around a core, several
methods were tested.
method 1. After the synthesis of the core nanoparticles 3 mmol of NH4F was added dropwise followed by
the drop-wise addition of 1.33 mmol of La(NO3)3.
method 2. The synthesis of the core nanoparticles was started with 6 mmol of NH4F and to this solution
was first added the lanthanide salts for the core, followed after 10 min by the addition of La(NO3)3 for the
shell.
method 3. After the synthesis of the core, 3 mmol of NH4F and 1.33 mmol of La(NO3)3 dissolved in 2 ml
water were added alternately in 10 portions.
After the addition of the shell material, the solution was stirred for 2 more hours at 75 °C, after which it
was cooled down to room temperature. The workup of the nanoparticle product was the same as described
in chapter 3.
5.5 References and notes 1 Spanhel, L.; Haase, M.; Weller, H.; Henglein, A. J. Am. Chem. Soc. 1987, 109, 5649. 2 (a) Murray, C. B.; Norris, D. J.; Bawendi, M. G. J. Am. Chem. Soc. 1993, 115, 8706; (b) Brust, M.;
Walker, M.; Bethell, D.; Schiffrin, D. J.; Whyman, R. J. Chem. Soc., Chem. Commun. 1994, 7, 801. 3 Brust, M.; Fink, J.; Bethell, D.; Schiffrin, D. J.; Kiely, C. J. Chem. Soc., Chem. Commun. 1995, 16,
1655. 4 Gaponik, N.; Talapin, D. V.; Rogach, A. L.; Eychmüller, A.; Weller, H. Nano Lett. 2002, 2, 803. 5 Mitchell, G. P.; Mirkin, C. A.; Letsinger, R. L. J. Am. Chem. Soc. 1999, 121, 8122. 6 Galow, T. H.; Boal, A. K.; Rotello, V. M. Adv. Mater. 2000, 12, 577. 7 Hostetler, M. J.; Templeton, A. C.; Murray, R. W. Langmuir 1999, 15, 3782. 8 Johson, S. R.; Evans, S. D.; Brydson, R. Langmuir 1998, 14, 6639. 9 Peng, X.; Schlamp, M. C.; Kadavanich, A. V.; Alivisatos, A. P. J. Am. Chem. Soc. 1997, 119,
7019.
109
10 (a) Gerion, D.; Pinaud, F.; Williams, S. C.; Parak, W. J.; Zanchet, D.; Weiss, S.; Alivisatos, A. P. J.
Phys. Chem. B 2001, 105, 8861; (b) Parak, W. J.; Gerion, D.; Zanchet, D.; Woerz, A. S.;
Pellegrino, T.; Micheel, C.; Williams, S. C.; Seitz, M.; Bruehl, R. E.; Bryant, Z.; Bustamente, C.;
Bertozzi, C. R.; Alivisatos, A. P. Chem. Mater. 2002, 14, 2113; (c) Schroedter, A.; Weller, H.;
Eritja, R.; Ford, W. E.; Wessels, J. M. Nano Lett. 2002, 2, 1363. 11 Blasse, G.; Grabmeier, B. C. Luminescent materials; Springer: Berlin, 1994. 12 Riwotzki, K.; Meyssamy, H.; Kornowski, A.; Haase, M. J. Phys. Chem. B 2000, 104, 2824. 13 Riwotzki, K.; Meyssamy, H.; Schnablegger, H.; Kornowski, A.; Haase, M. Angew. Chem. Int. Ed.
2001, 40, 573. 14 Kuno, M.; Lee, J. K.; Dabbousi, B. O.; Mikulec, F. V.; Bawendi, M. G. J. Chem. Phys. 1997, 106,
9869. 15 Sachleben, J. R.; Wooten, E. W.; Emsley, L.; Pines, A.; Colvin, V. L.; Alivisatos, A. P. Chem.
Phys. Lett. 1992, 198, 431. 16 Lehmann, O.; Meyssamy, H.; Kömpe, K.; Schnablegger, H.; Haase, M. J. Phys. Chem. B 2003,
107, 7449. 17 Weber, M. J. In Optical properties of ions in crystals; Crosswhite, H. M., Moose, H. W. Eds.;
Interscince: New York, 1967, p 467.

111
CCCHHHAAAPPPTTTEEERRR 666 Synthesis of lanthanide(III)-doped semiconductor nanoparticles
In the previous chapters the doping of lanthanide ions in nanoparticles was
described as a way to enhance the optical properties of the lanthanide ions in
organic media. The host materials of these nanoparticles prevent quenching of the
luminescence, but the contribution to an effective excitation of the lanthanide ions is
limited. In this chapter the synthesis of semiconductor nanoparticles doped with
lanthanide ions is described. Semiconductor materials can be excited by photo-
excitation or electro-excitation and have the possibility to transfer the excitation
energy to dopant ions. The doping of semiconductor nanoparticles with lanthanide
ions could provide alternative excitation routes of the lanthanide ions. This chapter
describes the successful doping of TiO2 nanoparticles that are soluble in organic
solvents with a variety of lanthanide ions, that emit in the visible and in the near-
infrared (NIR).
112
6.1 Introduction
The luminescence properties of lanthanide ions in organic media can be enhanced by
doping the lanthanide ions in inorganic nanoparticles that are soluble in organic solvents, as was
shown in the previous chapters. The host material is not active in the excitation of the lanthanide
ions in LaF3 nanoparticles and for the LaPO4 nanoparticles only through a charge transfer band
to Eu3+ or Yb3+. In the LaVO4 host, the ions can be excited by using the charge transfer band of
the VO4 group, giving rise to a high absorption band in the UV.1 Another possibility to involve
the host material in the excitation of lanthanide ions, is by the use of energy transfer from a
semiconductor host. Doping of lanthanide ions in semiconductor hosts can lead to efficient
photo- and electro-excitation of the lanthanide ion, which has been shown with bulk
semiconductors.2 Semiconductor nanoparticles of various materials, like CdS, CdSe, CdTe,
HgTe, PbSe etc., have been prepared.3 These nanoparticles have broad absorption bands ranging
from the UV till the NIR, offering the possibility for broadband photo-excitation.
Electroluminescence provides alternative ways for the excitation of semiconductor materials. In
a light-emitting diode (LED) the active material can be excited by charge carriers generated from
electricity, leading to luminescence generated directly from electricity. Several groups, including
our own, have investigated the possibility to excite lanthanide ions in polymer-based LEDs by
the use of lanthanide complexes.4 Quenching of the lanthanide luminescence, especially for the
NIR-emitting lanthanide ions, is a problem in these devices. The lifetime of the lanthanide ion
could be increased by doping in semiconductor nanoparticles and energy transfer from the
semiconductor host to the lanthanide ion could offer the possibility for electroluminescence.
Polymer light-emitting diodes (LEDs) doped with semiconductor nanoparticles, which emit in
the visible have been prepared by Colvin et al.5 and in the NIR by Tessler et al.6 Energy transfer
from semiconductor nanoparticles to lanthanide ions is possible and has been shown in glass
materials. Energy transfer from silicon nanocrystals to Er3+ ions is widely studied7 and energy
transfer from CdS to Eu3+ or SnO2 to Eu3+ is also reported.8,9 In these glasses, the lanthanide ion
does not have to be doped in the nanoparticle to have energy transfer.
A number of papers reported on the doping of lanthanide ions in semiconductor
nanoparticles of ZnS and CdS, that are soluble in organic solvents.10 In most of the papers direct
proof of the energy transfer of the semiconductor host to the lanthanide ion is not shown,
because the excitation spectra of the lanthanide ions are not published. Bol et al. tried to
reproduce the synthesis of these nanoparticles, but could not find evidence that the lanthanide ion
was doped in the nanoparticle and that energy transfer from the nanoparticle to the lanthanide ion
113
occurred.11 Raola and Strouse reported the doping of Eu3+ ions in CdSe nanoparticles, starting
with Eu2+ as the europium source, but luminescence studies to see if energy transfer from the
nanoparticle host to the lanthanide ion occurs were not performed.12 Difficulties in doping most
likely arise from the large difference in size between the host cation and the lanthanide ion, the
charge mismatch between the cations, and the low affinity of lanthanide ions towards sulfur and
selenium. The lanthanide ions do have a high affinity towards oxygen and in this chapter the
doping of lanthanide ions in TiO2 semiconductor nanoparticles is discussed. The effect of
lanthanide doping on the catalytic activity of TiO2 has been investigated, but no luminescence
studies were performed on these materials.13 The luminescence of the visible emitting ions Eu3+
and Tb3+ doped in TiO2 films has been reported by Conde-Gallardo et al.14,15 They observed
energy transfer from the TiO2 host to the lanthanide ions after photo-excitation, which means
that energy transfer from this semiconductor host to the lanthanide ions is possible. The
luminescence of Er3+-doped TiO2 waveguide materials and nanocrystals was also reported, but in
these cases the Er3+ ions were excited directly and not through the semiconductor host.16,17
Nanoparticles of TiO2 are widely studied for applications in solar cells and as
photocatalysts.18 A general synthesis route of TiO2 nanoparticles comprises the decomposition of
Ti(OPri)4 in water at a low pH.19 This leads to nanoparticles that are soluble in water, but other
synthesis procedures to make nanoparticles that are soluble in organic solvents are described by
for instance Wu et al. and Trentler et al.20
The procedure described by Parala et al. involves the thermal decomposition of
Ti(OPri)3(dmae) (dmae = Dimethylaminoethoxide) in TOPO (trioctylphosphine oxide) to form
nanoparticles coated with TOPO ligands.21 We modified this procedure by dissolving lanthanide
chloride salts in the TOPO, to obtain lanthanide-doped nanoparticles.
6.2 Results and discussion
6.2.1 Characterization of Eu3+-doped nanoparticles
The nanoparticles of TiO2:Eu were characterized by TEM, by evaporating a drop of a
nanoparticle solution on a carbon coated copper grid. A typical picture of nanoparticles obtained
by heating the reaction mixture for 30 min is shown in Figure 6.1. The picture shows small
particles with low contrast, due to the small size of the nanoparticles and the low atomic weight
of the Ti and O atoms. The nanoparticles are between 3-5 nm in size and in some nanoparticles
lattice fringes can be seen, indicating that these are crystalline. The inset shows an enlargement
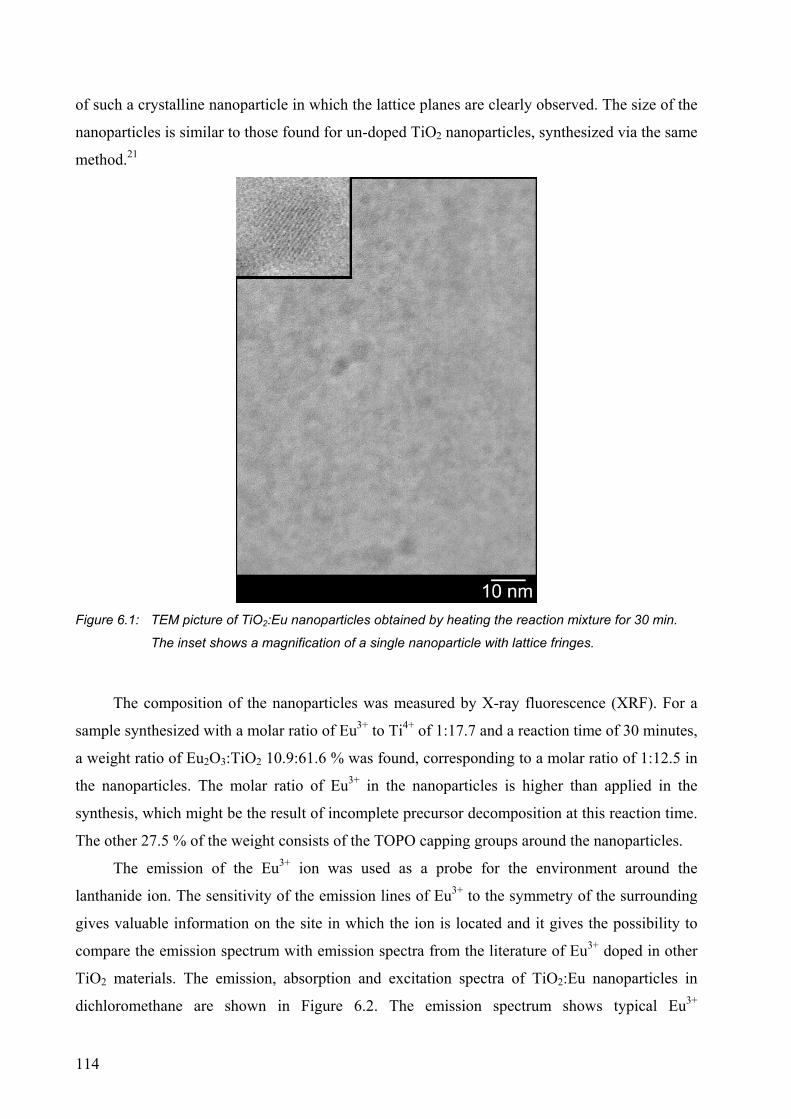
114
of such a crystalline nanoparticle in which the lattice planes are clearly observed. The size of the
nanoparticles is similar to those found for un-doped TiO2 nanoparticles, synthesized via the same
method.21
Figure 6.1: TEM picture of TiO2:Eu nanoparticles obtained by heating the reaction mixture for 30 min.
The inset shows a magnification of a single nanoparticle with lattice fringes.
The composition of the nanoparticles was measured by X-ray fluorescence (XRF). For a
sample synthesized with a molar ratio of Eu3+ to Ti4+ of 1:17.7 and a reaction time of 30 minutes,
a weight ratio of Eu2O3:TiO2 10.9:61.6 % was found, corresponding to a molar ratio of 1:12.5 in
the nanoparticles. The molar ratio of Eu3+ in the nanoparticles is higher than applied in the
synthesis, which might be the result of incomplete precursor decomposition at this reaction time.
The other 27.5 % of the weight consists of the TOPO capping groups around the nanoparticles.
The emission of the Eu3+ ion was used as a probe for the environment around the
lanthanide ion. The sensitivity of the emission lines of Eu3+ to the symmetry of the surrounding
gives valuable information on the site in which the ion is located and it gives the possibility to
compare the emission spectrum with emission spectra from the literature of Eu3+ doped in other
TiO2 materials. The emission, absorption and excitation spectra of TiO2:Eu nanoparticles in
dichloromethane are shown in Figure 6.2. The emission spectrum shows typical Eu3+
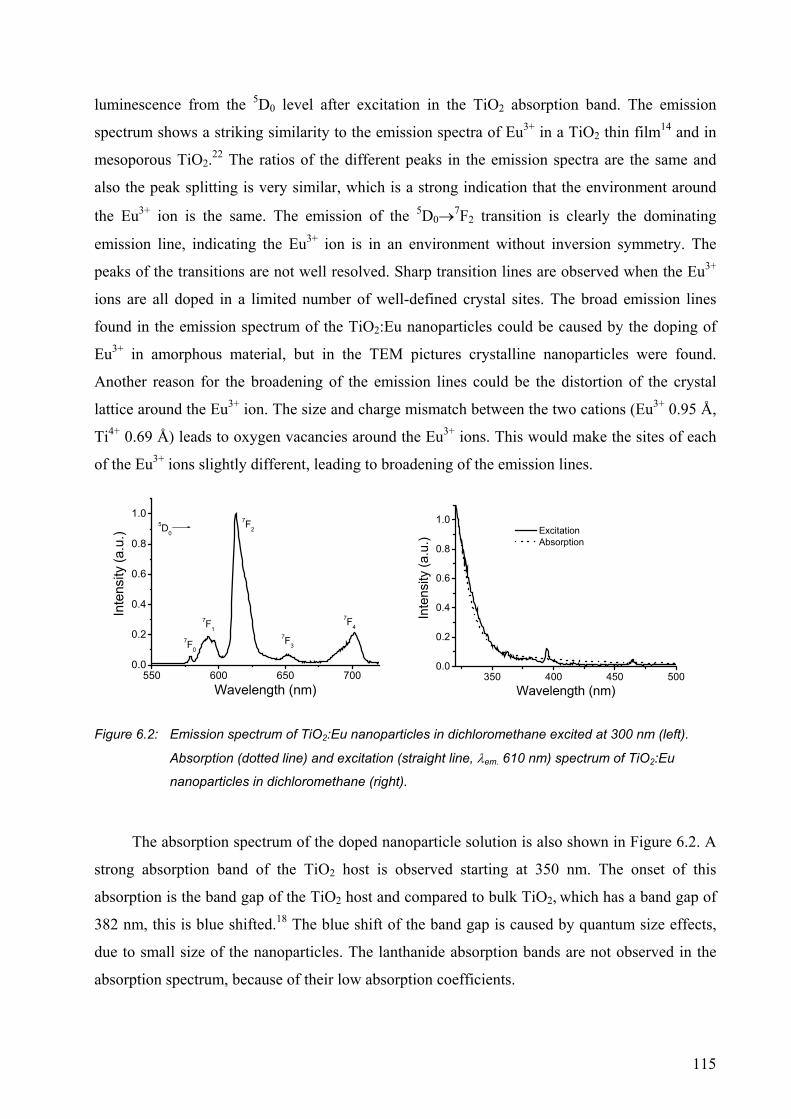
115
luminescence from the 5D0 level after excitation in the TiO2 absorption band. The emission
spectrum shows a striking similarity to the emission spectra of Eu3+ in a TiO2 thin film14 and in
mesoporous TiO2.22 The ratios of the different peaks in the emission spectra are the same and
also the peak splitting is very similar, which is a strong indication that the environment around
the Eu3+ ion is the same. The emission of the 5D0→7F2 transition is clearly the dominating
emission line, indicating the Eu3+ ion is in an environment without inversion symmetry. The
peaks of the transitions are not well resolved. Sharp transition lines are observed when the Eu3+
ions are all doped in a limited number of well-defined crystal sites. The broad emission lines
found in the emission spectrum of the TiO2:Eu nanoparticles could be caused by the doping of
Eu3+ in amorphous material, but in the TEM pictures crystalline nanoparticles were found.
Another reason for the broadening of the emission lines could be the distortion of the crystal
lattice around the Eu3+ ion. The size and charge mismatch between the two cations (Eu3+ 0.95 Å,
Ti4+ 0.69 Å) leads to oxygen vacancies around the Eu3+ ions. This would make the sites of each
of the Eu3+ ions slightly different, leading to broadening of the emission lines.
550 600 650 7000.0
0.2
0.4
0.6
0.8
1.05D0
7F0
7F2
7F3
7F47F1
Inte
nsity
(a.u
.)
Wavelength (nm)
350 400 450 5000.0
0.2
0.4
0.6
0.8
1.0 Excitation Absorption
Inte
nsity
(a.u
.)
Wavelength (nm)
Figure 6.2: Emission spectrum of TiO2:Eu nanoparticles in dichloromethane excited at 300 nm (left).
Absorption (dotted line) and excitation (straight line, λem. 610 nm) spectrum of TiO2:Eu
nanoparticles in dichloromethane (right).
The absorption spectrum of the doped nanoparticle solution is also shown in Figure 6.2. A
strong absorption band of the TiO2 host is observed starting at 350 nm. The onset of this
absorption is the band gap of the TiO2 host and compared to bulk TiO2, which has a band gap of
382 nm, this is blue shifted.18 The blue shift of the band gap is caused by quantum size effects,
due to small size of the nanoparticles. The lanthanide absorption bands are not observed in the
absorption spectrum, because of their low absorption coefficients.
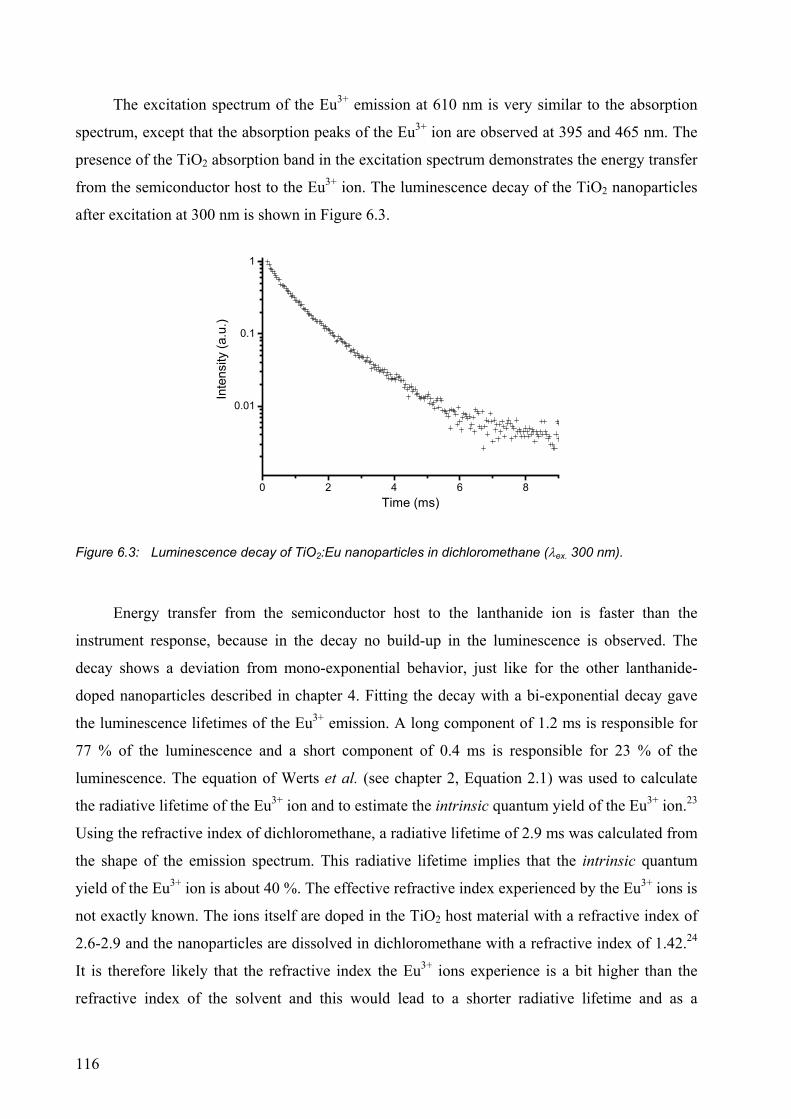
116
The excitation spectrum of the Eu3+ emission at 610 nm is very similar to the absorption
spectrum, except that the absorption peaks of the Eu3+ ion are observed at 395 and 465 nm. The
presence of the TiO2 absorption band in the excitation spectrum demonstrates the energy transfer
from the semiconductor host to the Eu3+ ion. The luminescence decay of the TiO2 nanoparticles
after excitation at 300 nm is shown in Figure 6.3.
0 2 4 6 8
0.01
0.1
1
Inte
nsity
(a.u
.)
Time (ms)
Figure 6.3: Luminescence decay of TiO2:Eu nanoparticles in dichloromethane (λex. 300 nm).
Energy transfer from the semiconductor host to the lanthanide ion is faster than the
instrument response, because in the decay no build-up in the luminescence is observed. The
decay shows a deviation from mono-exponential behavior, just like for the other lanthanide-
doped nanoparticles described in chapter 4. Fitting the decay with a bi-exponential decay gave
the luminescence lifetimes of the Eu3+ emission. A long component of 1.2 ms is responsible for
77 % of the luminescence and a short component of 0.4 ms is responsible for 23 % of the
luminescence. The equation of Werts et al. (see chapter 2, Equation 2.1) was used to calculate
the radiative lifetime of the Eu3+ ion and to estimate the intrinsic quantum yield of the Eu3+ ion.23
Using the refractive index of dichloromethane, a radiative lifetime of 2.9 ms was calculated from
the shape of the emission spectrum. This radiative lifetime implies that the intrinsic quantum
yield of the Eu3+ ion is about 40 %. The effective refractive index experienced by the Eu3+ ions is
not exactly known. The ions itself are doped in the TiO2 host material with a refractive index of
2.6-2.9 and the nanoparticles are dissolved in dichloromethane with a refractive index of 1.42.24
It is therefore likely that the refractive index the Eu3+ ions experience is a bit higher than the
refractive index of the solvent and this would lead to a shorter radiative lifetime and as a
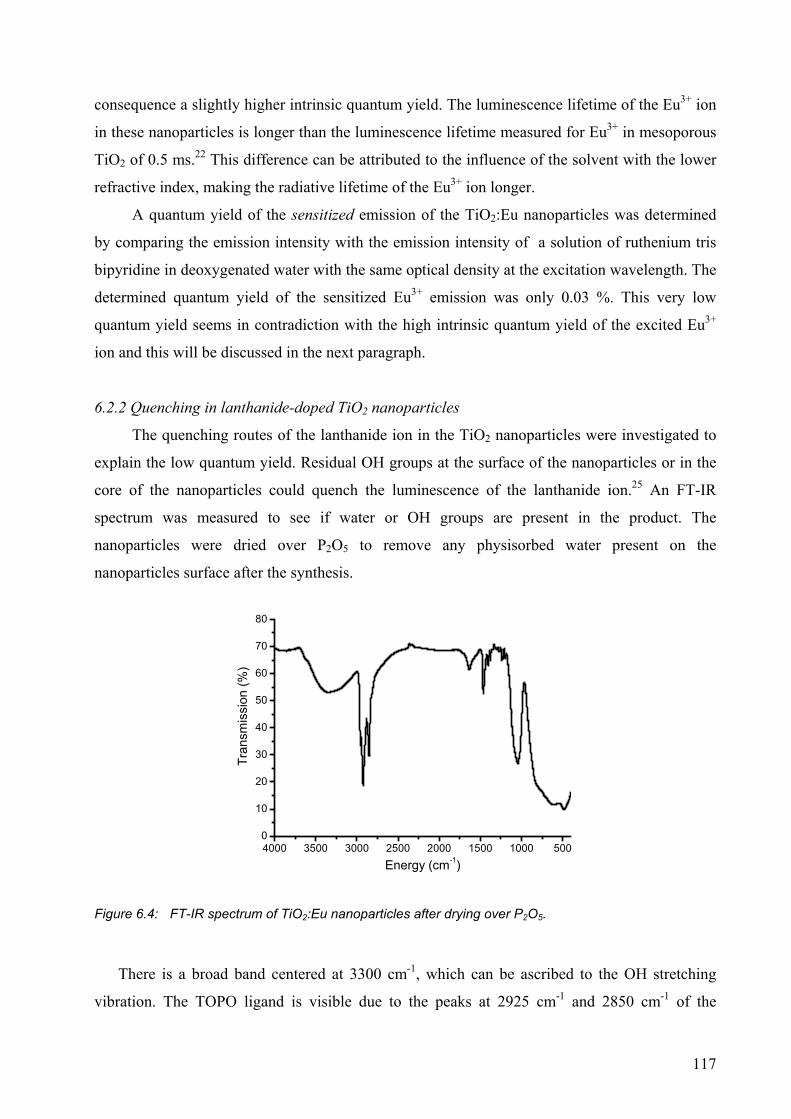
117
consequence a slightly higher intrinsic quantum yield. The luminescence lifetime of the Eu3+ ion
in these nanoparticles is longer than the luminescence lifetime measured for Eu3+ in mesoporous
TiO2 of 0.5 ms.22 This difference can be attributed to the influence of the solvent with the lower
refractive index, making the radiative lifetime of the Eu3+ ion longer.
A quantum yield of the sensitized emission of the TiO2:Eu nanoparticles was determined
by comparing the emission intensity with the emission intensity of a solution of ruthenium tris
bipyridine in deoxygenated water with the same optical density at the excitation wavelength. The
determined quantum yield of the sensitized Eu3+ emission was only 0.03 %. This very low
quantum yield seems in contradiction with the high intrinsic quantum yield of the excited Eu3+
ion and this will be discussed in the next paragraph.
6.2.2 Quenching in lanthanide-doped TiO2 nanoparticles
The quenching routes of the lanthanide ion in the TiO2 nanoparticles were investigated to
explain the low quantum yield. Residual OH groups at the surface of the nanoparticles or in the
core of the nanoparticles could quench the luminescence of the lanthanide ion.25 An FT-IR
spectrum was measured to see if water or OH groups are present in the product. The
nanoparticles were dried over P2O5 to remove any physisorbed water present on the
nanoparticles surface after the synthesis.
4000 3500 3000 2500 2000 1500 1000 5000
10
20
30
40
50
60
70
80
Tran
smis
sion
(%)
Energy (cm-1)
Figure 6.4: FT-IR spectrum of TiO2:Eu nanoparticles after drying over P2O5.
There is a broad band centered at 3300 cm-1, which can be ascribed to the OH stretching
vibration. The TOPO ligand is visible due to the peaks at 2925 cm-1 and 2850 cm-1 of the
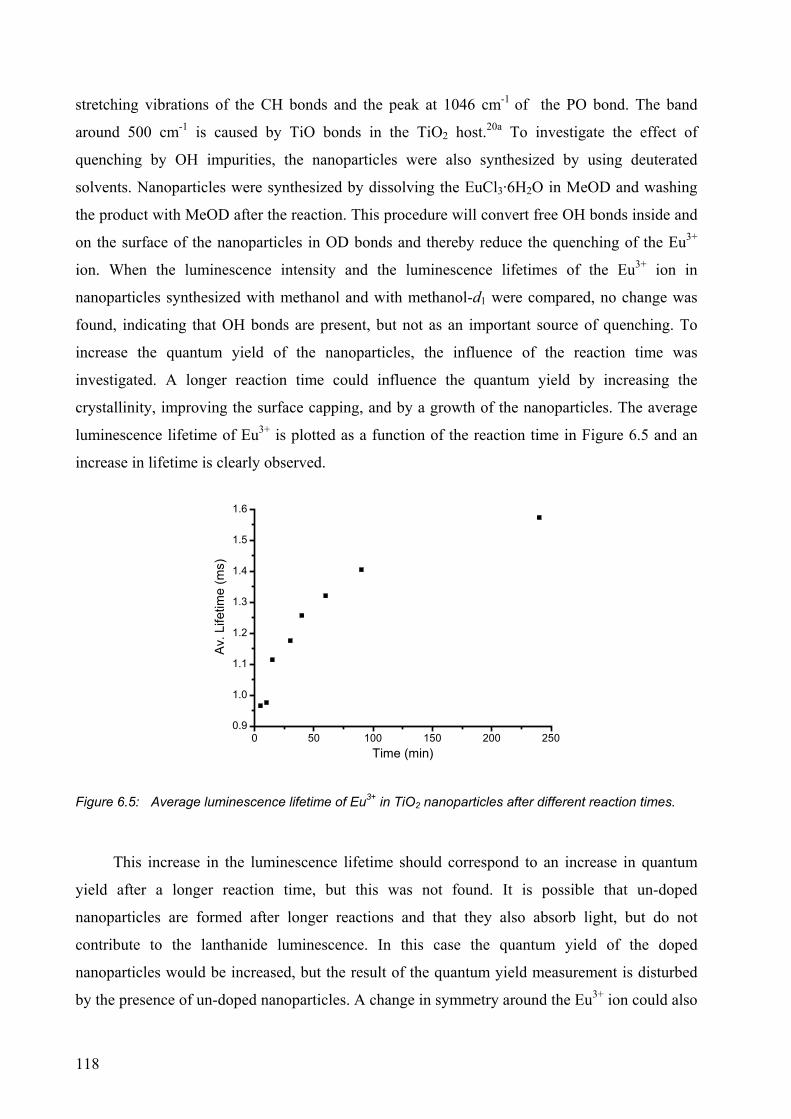
118
stretching vibrations of the CH bonds and the peak at 1046 cm-1 of the PO bond. The band
around 500 cm-1 is caused by TiO bonds in the TiO2 host.20a To investigate the effect of
quenching by OH impurities, the nanoparticles were also synthesized by using deuterated
solvents. Nanoparticles were synthesized by dissolving the EuCl3·6H2O in MeOD and washing
the product with MeOD after the reaction. This procedure will convert free OH bonds inside and
on the surface of the nanoparticles in OD bonds and thereby reduce the quenching of the Eu3+
ion. When the luminescence intensity and the luminescence lifetimes of the Eu3+ ion in
nanoparticles synthesized with methanol and with methanol-d1 were compared, no change was
found, indicating that OH bonds are present, but not as an important source of quenching. To
increase the quantum yield of the nanoparticles, the influence of the reaction time was
investigated. A longer reaction time could influence the quantum yield by increasing the
crystallinity, improving the surface capping, and by a growth of the nanoparticles. The average
luminescence lifetime of Eu3+ is plotted as a function of the reaction time in Figure 6.5 and an
increase in lifetime is clearly observed.
0 50 100 150 200 2500.9
1.0
1.1
1.2
1.3
1.4
1.5
1.6
Av.
Life
time
(ms)
Time (min)
Figure 6.5: Average luminescence lifetime of Eu3+ in TiO2 nanoparticles after different reaction times.
This increase in the luminescence lifetime should correspond to an increase in quantum
yield after a longer reaction time, but this was not found. It is possible that un-doped
nanoparticles are formed after longer reactions and that they also absorb light, but do not
contribute to the lanthanide luminescence. In this case the quantum yield of the doped
nanoparticles would be increased, but the result of the quantum yield measurement is disturbed
by the presence of un-doped nanoparticles. A change in symmetry around the Eu3+ ion could also
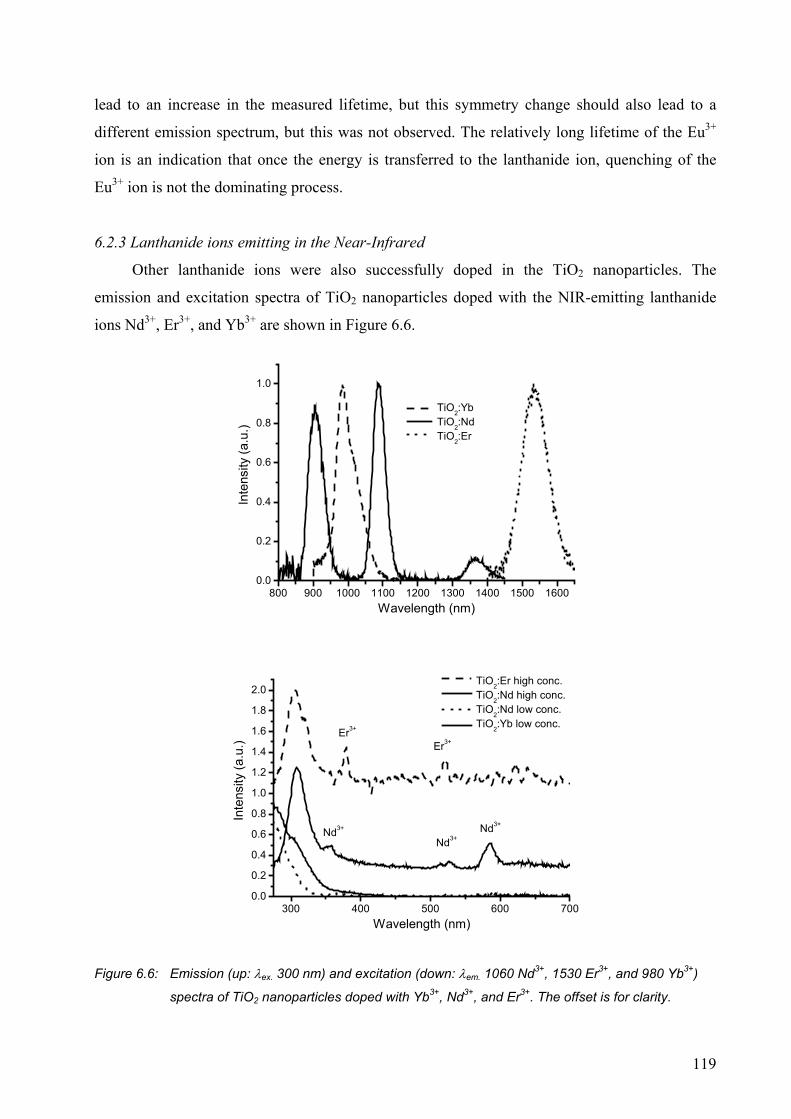
119
lead to an increase in the measured lifetime, but this symmetry change should also lead to a
different emission spectrum, but this was not observed. The relatively long lifetime of the Eu3+
ion is an indication that once the energy is transferred to the lanthanide ion, quenching of the
Eu3+ ion is not the dominating process.
6.2.3 Lanthanide ions emitting in the Near-Infrared
Other lanthanide ions were also successfully doped in the TiO2 nanoparticles. The
emission and excitation spectra of TiO2 nanoparticles doped with the NIR-emitting lanthanide
ions Nd3+, Er3+, and Yb3+ are shown in Figure 6.6.
800 900 1000 1100 1200 1300 1400 1500 16000.0
0.2
0.4
0.6
0.8
1.0
TiO2:YbTiO2:NdTiO2:Er
Inte
nsity
(a.u
.)
Wavelength (nm)
300 400 500 600 7000.0
0.2
0.4
0.6
0.8
1.0
1.2
1.4
1.6
1.8
2.0
Nd3+Nd3+
Nd3+
Er3+Er3+
TiO2:Er high conc.TiO2:Nd high conc.TiO2:Nd low conc.TiO2:Yb low conc.
Inte
nsity
(a.u
.)
Wavelength (nm)
Figure 6.6: Emission (up: λex. 300 nm) and excitation (down: λem. 1060 Nd3+, 1530 Er3+, and 980 Yb3+)
spectra of TiO2 nanoparticles doped with Yb3+, Nd3+, and Er3+. The offset is for clarity.
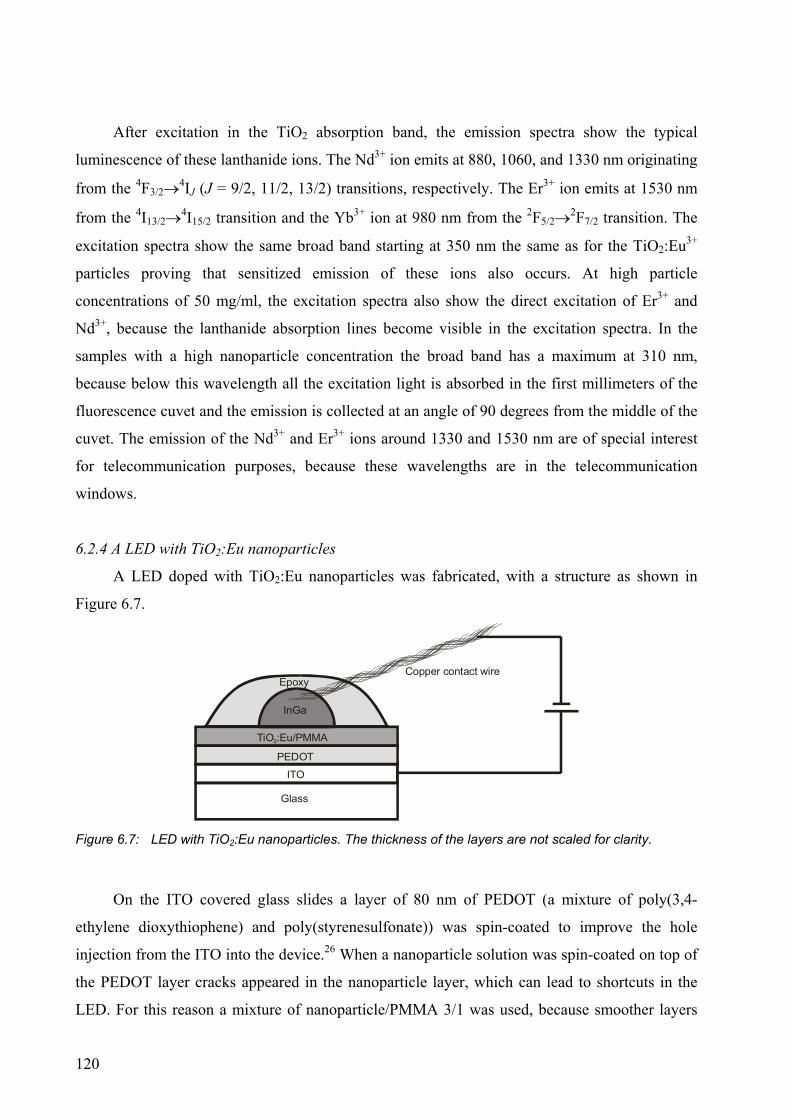
120
After excitation in the TiO2 absorption band, the emission spectra show the typical
luminescence of these lanthanide ions. The Nd3+ ion emits at 880, 1060, and 1330 nm originating
from the 4F3/2→4IJ (J = 9/2, 11/2, 13/2) transitions, respectively. The Er3+ ion emits at 1530 nm
from the 4I13/2→4I15/2 transition and the Yb3+ ion at 980 nm from the 2F5/2→2F7/2 transition. The
excitation spectra show the same broad band starting at 350 nm the same as for the TiO2:Eu3+
particles proving that sensitized emission of these ions also occurs. At high particle
concentrations of 50 mg/ml, the excitation spectra also show the direct excitation of Er3+ and
Nd3+, because the lanthanide absorption lines become visible in the excitation spectra. In the
samples with a high nanoparticle concentration the broad band has a maximum at 310 nm,
because below this wavelength all the excitation light is absorbed in the first millimeters of the
fluorescence cuvet and the emission is collected at an angle of 90 degrees from the middle of the
cuvet. The emission of the Nd3+ and Er3+ ions around 1330 and 1530 nm are of special interest
for telecommunication purposes, because these wavelengths are in the telecommunication
windows.
6.2.4 A LED with TiO2:Eu nanoparticles
A LED doped with TiO2:Eu nanoparticles was fabricated, with a structure as shown in
Figure 6.7.
InGa
TiO :Eu/PMMA2
PEDOT
ITO
Glass
EpoxyCopper contact wire
Figure 6.7: LED with TiO2:Eu nanoparticles. The thickness of the layers are not scaled for clarity.
On the ITO covered glass slides a layer of 80 nm of PEDOT (a mixture of poly(3,4-
ethylene dioxythiophene) and poly(styrenesulfonate)) was spin-coated to improve the hole
injection from the ITO into the device.26 When a nanoparticle solution was spin-coated on top of
the PEDOT layer cracks appeared in the nanoparticle layer, which can lead to shortcuts in the
LED. For this reason a mixture of nanoparticle/PMMA 3/1 was used, because smoother layers
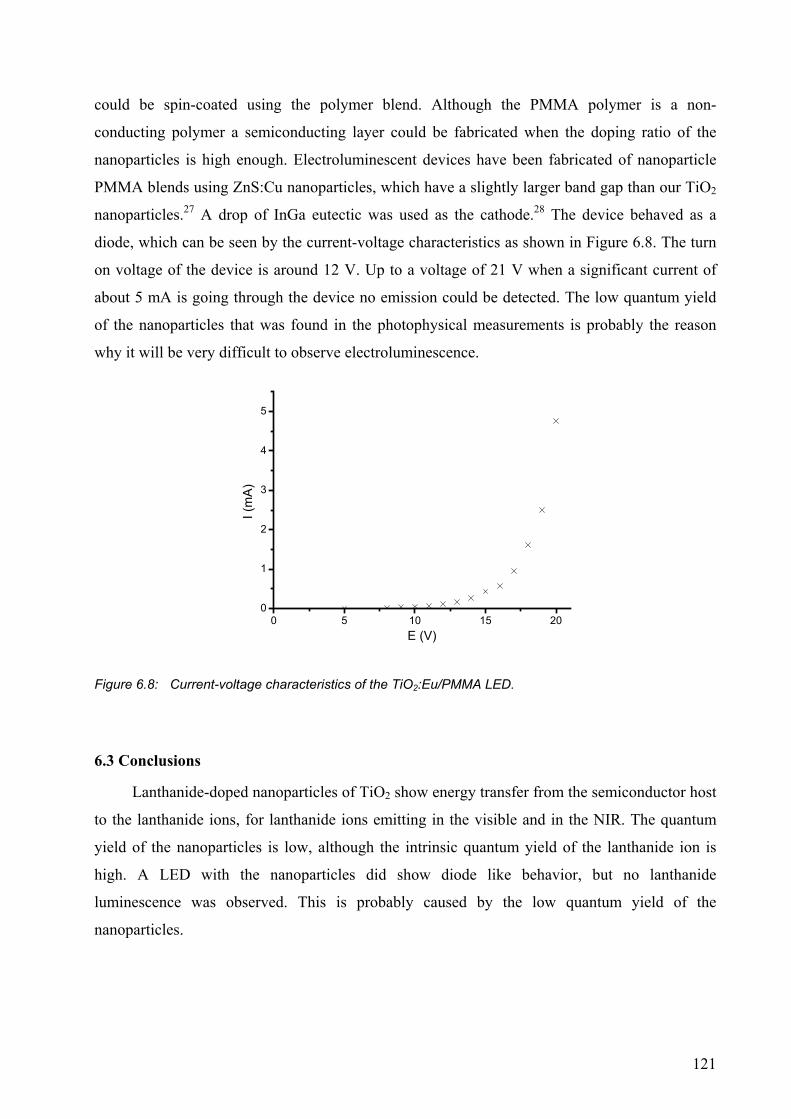
121
could be spin-coated using the polymer blend. Although the PMMA polymer is a non-
conducting polymer a semiconducting layer could be fabricated when the doping ratio of the
nanoparticles is high enough. Electroluminescent devices have been fabricated of nanoparticle
PMMA blends using ZnS:Cu nanoparticles, which have a slightly larger band gap than our TiO2
nanoparticles.27 A drop of InGa eutectic was used as the cathode.28 The device behaved as a
diode, which can be seen by the current-voltage characteristics as shown in Figure 6.8. The turn
on voltage of the device is around 12 V. Up to a voltage of 21 V when a significant current of
about 5 mA is going through the device no emission could be detected. The low quantum yield
of the nanoparticles that was found in the photophysical measurements is probably the reason
why it will be very difficult to observe electroluminescence.
0 5 10 15 200
1
2
3
4
5
I (m
A)
E (V)
Figure 6.8: Current-voltage characteristics of the TiO2:Eu/PMMA LED.
6.3 Conclusions
Lanthanide-doped nanoparticles of TiO2 show energy transfer from the semiconductor host
to the lanthanide ions, for lanthanide ions emitting in the visible and in the NIR. The quantum
yield of the nanoparticles is low, although the intrinsic quantum yield of the lanthanide ion is
high. A LED with the nanoparticles did show diode like behavior, but no lanthanide
luminescence was observed. This is probably caused by the low quantum yield of the
nanoparticles.
122
6.4 Experimental section
General. Photo-physical measurements were performed using the setup described in chapter 3. The
spectra of Eu3+ were measured at a resolution of 1.8 nm and the spectra in the near-infrared were
measured at a resolution of 16.2 nm for Er3+ and 8.1 nm for Nd3+ and Yb3+. The quantum yield of the
TiO2:Eu nanoparticles was determined by comparing the emission intensity with the emission intensity of
a solution of ruthenium tris bipyridine with the same optical density at the excitation wavelength (λex. 310
nm). The quantum yield of ruthenium trisbipyridine in deoxygenated water is 4.2 %. For the
electroluminescence measurements the same instrument as for the photo-physical measurements was
used.
Nanoparticle synthesis. Nanoparticles of lanthanide-doped TiO2 were prepared by adopting a literature
procedure.21 TiO2 nanoparticles were formed by the thermal decompositon of Ti(OPri)3(dmae) (dmae =
dimethylaminoethoxide) in hot trioctylphoshine oxide (TOPO). The titanium precursor was synthesized
using a literature procedure.29 Lanthanide-doped nanoparticles were prepared by dissolving 11 mg of
EuCl3 ⋅ 6H2O in 5 mL of methanol followed by the addition of 3.5 g of TOPO and evaporation of the
methanol and water in vacuo. The resulting solution was heated to 315 °C under a nitrogen atmosphere
and 200 µl of the titanium precursor was injected, followed by further heating at 300 °C for 10-240 min.
The reaction mixture was cooled to 60 °C and the nanoparticles were precipitated by the addition of
methanol. The product was separated by centrifugation and further purified by washing with methanol.
The resulting lanthanide-doped particles are dispersable in apolar solvents like toluene, dichloromethane,
and chloroform, to form optically clear solutions.
LED fabrication. A LED with TiO2:Eu nanoparticles was prepared on ITO covered glass plates. The
ITO layer was first cleaned by sonication in water and ethanol, followed by a treatment in an oxygen
plasma for 5 min. On top of the ITO a 80 nm thick layer of PEDOT (Aldrich) was spin-coated at 4000
rpm. The layer was dried over P2O5 in vacuum at 80 °C for 2 days. On top of this layer a 1 % solution of
TiO2/PMMA 3/1 in chloroform was spin-coated at 1500 rpm to form a 100 nm thick layer. This layer was
also dried over P2O5 in vacuum at 80 °C for 1 day. The devices were then transferred to a glove box with
a dry nitrogen atmosphere and on top of the layers a drop of InGa eutectic was placed. In the drop of InGa
eutectic a copper contact wire was placed and the device was protected from the atmosphere by a layer of
epoxy glue. The glue was cured at 80 °C for 2 hours.
123
6.5 References and notes 1 Blasse, G.; Grabmeier, B. C. Luminescent materials; Springer: Berlin, 1994. 2 Kenyon, A. J. Prog. Quant. Electron. 2002, 26, 225. 3 (a) Murray, C. B.; Norris, D. J.; Bawendi, M. G. J. Am. Chem. Soc. 1993, 115, 8706; (b) Harrison,
M. T.; Kershaw, S. V.; Burt, M. G.; Rogach, A. L.; Kornowski, A.; Eychmüller, A.; Weller, H.
Pure Appl. Chem. 2000, 72, 295; (c) Du, H.; Chen, C.; Krishnan, R.; Krauss, T. D.; Harbold, J. M.;
Wise, F. W.; Thomas, M. G.; Silcox, J. Nano Lett. 2002, 2, 1321. 4 (a) Kang, T. S.; Harrison, B. S.; Bouguettaya, M.; Foley, T. J.; Boncella, J. M.; Schanze, K. S.;
Reynolds, J. R. Adv. Funct. Mater. 2003, 13, 205; (b) Slooff, L. H.; Polman, A.; Cacialli, F.;
Friend, R. H.; Hebbink, G. A.; van Veggel, F. C. J. M.; Reinhoudt, D. N. Appl. Phys. Lett. 2001,
78, 2122. 5 Colvin, V. L.; Schlamp, M. C.; Alivisatos, A. P. Nature 1994, 370, 354. 6 Tessler, N.; Medvedev, V.; Kazes, M.; Kan, S.; Banin, U. Science 2002, 295, 1506. 7 (a) Kik, P. G.; Polman, A. Mat. Sci. Eng. B 2001, 81, 3; (b) Han, H. S.; Seo, S. Y.; Shin, J. H. Appl.
Phys. Lett. 2001, 79, 4568. 8 Selvan, S. T.; Hayakawa, T.; Nogami, M. J. Non-Cryst. Solids 2001, 291, 137. 9 Nogami, M.; Enomoto, T.; Hayakawa, T. J. Lumin. 2002, 97, 147. 10 (a) Bhargava, R. N. J. Lumin. 1996, 70, 85; (b) Kane, R. S.; Cohen, R. E.; Silbey, R. Chem. Mater.
1999, 11, 90; (c) Ihara, M.; Igarashi, T.; Kusunoki, Y.; Ohno, K. J. Electrochem. Soc. 2000, 147,
2355; (d) Okamoto, S.; Kobayashi, M.; Kanemitsu, Y.; Kushida, T. Phys. Stat. Sol. B 2002, 1, 481;
(e) Qu, S. C.; Zhou, W. H.; Liu, F. Q.; Chen, N. F.; Wang, Z. G.; Pan, H. Y.; Yu, D. P. Appl. Phys.
Lett. 2002, 80, 3605; (f) Schmidt, T.; Muller, G.; Spanhel, L. Chem. Mater. 1998, 10, 65. 11 Bol, A. A.; van Beek, R.; Meijerink, A. Chem. Mater. 2002, 14, 1121. 12 Raola, O. E.; Strouse, G. F. Nano Lett. 2002, 2, 1443. 13 (a) Wang, Y.; Cheng, H.; Zhang, L.; Hao, Y.; Ma, J.; Xu, B.; Li, W. J. Mol. Catal. A 2000, 151,
205; (b) Zhang, Y.; Zhang, H.; Xu, Y.; Wang, Y. J. Mater. Chem. 2003, 13, 2261. 14 Conde-Gallardo, A.; García-Rocha, M.; Hernández-Calderón, I.; Palomino-Merino, R. Appl. Phys.
Lett. 2001, 78, 3436. 15 Conde-Gallardo, A.; García-Rocha, M.; Hernández-Calderón, I.; Palomino-Merino, R. Mod. Phys.
Lett. B 2001, 15, 813. 16 (a) Bahtat, A.; Bouazaoui, M.; Bahtat, M.; Mugnier, J. Opt. Commun. 1994, 19, 1982; (b) Bahtat,
A.; Bouazaoui, M.; Bahtat, M.; Garapon, C.; Jacquier, B.; Mugnier, J. J. Non-Cryst. Sol. 1996, 202,
16. 17 Jeon, S.; Braun, P. V. Chem. Mater. 2003, 15, 1256. 18 Hoffmann, M. R.; Martin, S. T.; Choi, W.; Bahnemann, D. W. Chem. Rev. 1995, 95, 69.
124
19 Oskam, G.; Nellore, A.; Penn, R. L.; Searson, P. C. J. Phys. Chem. B 2003, 107, 1734. 20 (a) Wu, X; Wang, D.; Yang, S. J. Colloid Interf. Sci. 2000, 222, 37; (b) Trentler, T. J.; Denler, T.
E.; Bertone, J. F.; Agrawal, A.; Colvin, V. L. J. Am. Chem. Soc. 1999, 121, 1613. 21 Parala, H.; Devi, A.; Bhakta, R.; Fischer, R. A. J. Mater. Chem, 2002, 12, 1625. 22 Frindell, K. L.; Bartl, M. H.; Popitsch, A.; Stucky, G. D. Angew. Chem. Int. Ed. 2002, 41, 960. 23 Werts, M. H. V.; Jukes, R. T. F.; Verhoeven, J. W. Phys. Chem. Chem. Phys. 2002, 4, 1542. 24 CRC Handbook of Chemistry and Physics 64th ed., ed. Weast, R. C., 1983-1984, Baco Raton,
Florida, USA. 25 Haas, Y.; Stein, G. J. Phys. Chem. 1971, 75, 3668. 26 Brown, T. M.; Friend, R. H.; Millard, I. S.; Lacey, D. J.; Butler, T.; Burroughes, J. H.; Cacialli, F.
J. J. Appl. Phys. 2003, 93, 6159. 27 Que, W.; Zhou, Y.; Lam, Y. L.; Chan, Y. C.; Kam, C. H.; Liu, B.; Gan, L. M.; Chew, C. H.; Xu, G.
Q.; Chua, S. J.; Xu, S. J.; Mendis, F. V. C. Appl. Phys. Lett. 1998, 73, 2727. 28 Gao, F. G.; Bard, A. J. J. Am. Chem. Soc. 2000, 122, 7426. 29 Jones, A. C.; Leedham, T. J.; Wright, P. J.; Crosbie, M. J.; Fleeting, K. A.; Otway, D. J.; O’Brien,
P.; Pemble, M. E. J. Mater. Chem. 1998, 8, 1773.
125
CCCHHHAAAPPPTTTEEERRR 777 Polymer waveguide amplifiers doped with LaF3:Nd nanoparticles.
In this chapter the fabrication of polymer-based optical amplifiers operating at 1319
nm is described. The luminescent material in the polymer waveguides were the
LaF3:Nd nanoparticles synthesized as described in chapter 3. Two polymer
waveguide devices were fabricated. One device with LaF3:Nd-doped PMMA as the
waveguiding polymer was structured by reactive ion etching. The losses in this
waveguide are relatively high, probably due to the rough sidewalls caused by the
reactive ion etching process. These waveguides show an optical gain of 0.3 dB at
1319 nm on a 3 cm long device with a pump power of 12 mW at 578 nm. The other
polymer waveguide was made of nanoparticle-doped SU-8, a negative photoresist,
structured by photolithography. This device showed reduced losses, compared to the
PMMA waveguide, but due to the low pump power (5 mW at 795 nm) that could be
coupled in the waveguide the measured optical gain was limited to 0.1 dB. However,
modeling of the amplification results shows that an optimization of the waveguide
structure might lead to optical gain, that is close to the gain obtained in Nd3+-doped
fiber amplifiers.
126
7.1 Introduction
Erbium-doped fiber amplifiers (EDFA’s) operating at 1530 nm are commercially applied
all over the world in long distance telecommunication systems.1 These optical amplifiers have
been used for less than two decades and they are for a large part responsible for the success of
optical telecommunication.2 Optical amplifiers at other wavelengths are currently under
investigation, like the praseodymium-doped fiber amplifier for operation around 1300 nm and
the thulium-doped fiber amplifier for operation around 1450 nm.3,4 These wavelengths
correspond to the minimum loss window of silica fibers and they are of major interest for optical
telecommunication. These glass fiber-based amplifiers function very well for long-range
telecommunication, but in short range telecommunication the need for easy integration of a large
variety of optical components requires materials, which can be processed more easily and at a
lower cost. Polymers are materials with excellent processing properties and with generally low
costs.5 In order to use these polymers in optical systems it is necessary to develop polymer-based
optical amplifiers for the compensation of losses in the systems.6 The active material in these
polymer-based optical amplifiers can be lanthanide ions, but then the lanthanide ion has to be
shielded from the vibrational energies of the organic bonds surrounding it. In chapter 3, doping
of nanoparticles, which are soluble in organic solvents, was proposed as a way to increase the
luminescence lifetime of these ions and this strategy was proven to be successful. In this chapter,
the realization of polymer-based optical amplifiers doped with these nanoparticles will be
discussed. The success of these nanoparticles in polymer-based waveguides will be dependent on
the possibility to form homogeneous layers of the polymer nanoparticle composites. The
nanoparticles itself are small enough to minimize scattering, but when the nanoparticles
aggregate and form large domains, the scattering losses could increase substantially as discussed
in chapter 2. The solubility of the nanoparticles in the polymer solution and the polymer itself
will determine if aggregation takes place.
The polymer amplifier consists of a polymer waveguide, which is able to guide light by
total internal reflection, caused by the higher refractive index of the polymer channel compared
to the surrounding medium. Different waveguide designs can be fabricated, of which two are
shown in Figure 7.1.
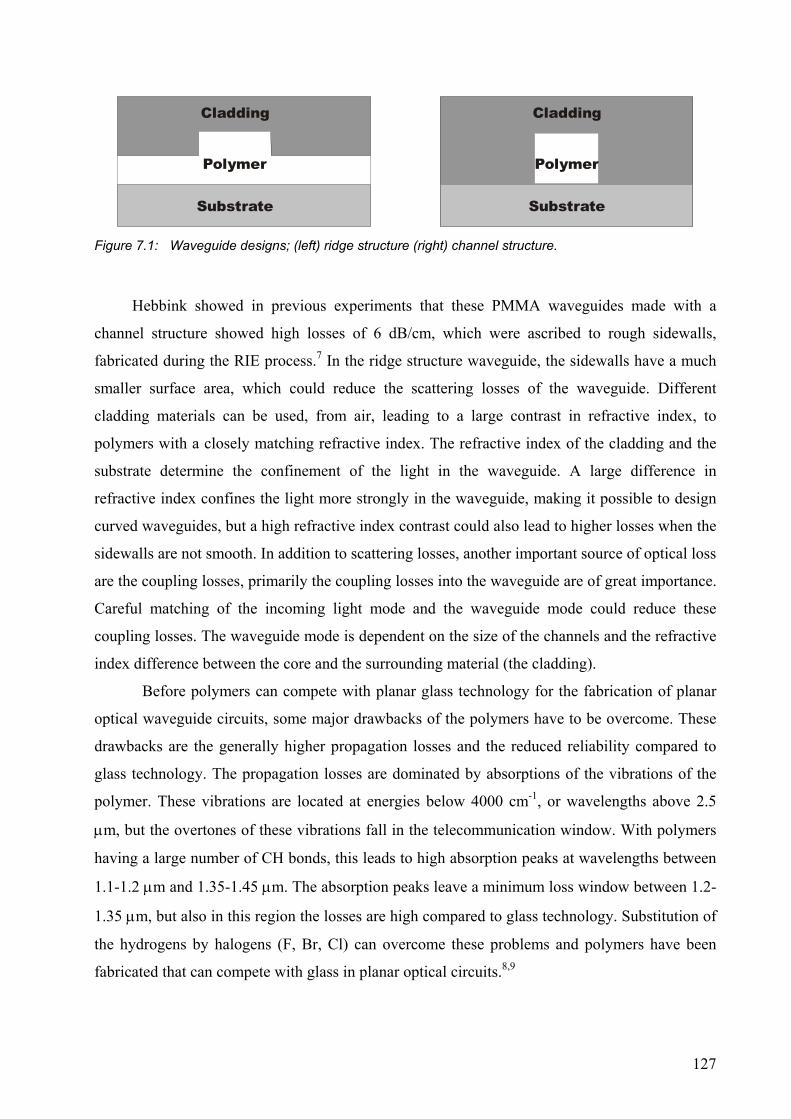
127
Substrate
Polymer
Cladding
Substrate
Polymer
Cladding
Figure 7.1: Waveguide designs; (left) ridge structure (right) channel structure.
Hebbink showed in previous experiments that these PMMA waveguides made with a
channel structure showed high losses of 6 dB/cm, which were ascribed to rough sidewalls,
fabricated during the RIE process.7 In the ridge structure waveguide, the sidewalls have a much
smaller surface area, which could reduce the scattering losses of the waveguide. Different
cladding materials can be used, from air, leading to a large contrast in refractive index, to
polymers with a closely matching refractive index. The refractive index of the cladding and the
substrate determine the confinement of the light in the waveguide. A large difference in
refractive index confines the light more strongly in the waveguide, making it possible to design
curved waveguides, but a high refractive index contrast could also lead to higher losses when the
sidewalls are not smooth. In addition to scattering losses, another important source of optical loss
are the coupling losses, primarily the coupling losses into the waveguide are of great importance.
Careful matching of the incoming light mode and the waveguide mode could reduce these
coupling losses. The waveguide mode is dependent on the size of the channels and the refractive
index difference between the core and the surrounding material (the cladding).
Before polymers can compete with planar glass technology for the fabrication of planar
optical waveguide circuits, some major drawbacks of the polymers have to be overcome. These
drawbacks are the generally higher propagation losses and the reduced reliability compared to
glass technology. The propagation losses are dominated by absorptions of the vibrations of the
polymer. These vibrations are located at energies below 4000 cm-1, or wavelengths above 2.5
µm, but the overtones of these vibrations fall in the telecommunication window. With polymers
having a large number of CH bonds, this leads to high absorption peaks at wavelengths between
1.1-1.2 µm and 1.35-1.45 µm. The absorption peaks leave a minimum loss window between 1.2-
1.35 µm, but also in this region the losses are high compared to glass technology. Substitution of
the hydrogens by halogens (F, Br, Cl) can overcome these problems and polymers have been
fabricated that can compete with glass in planar optical circuits.8,9
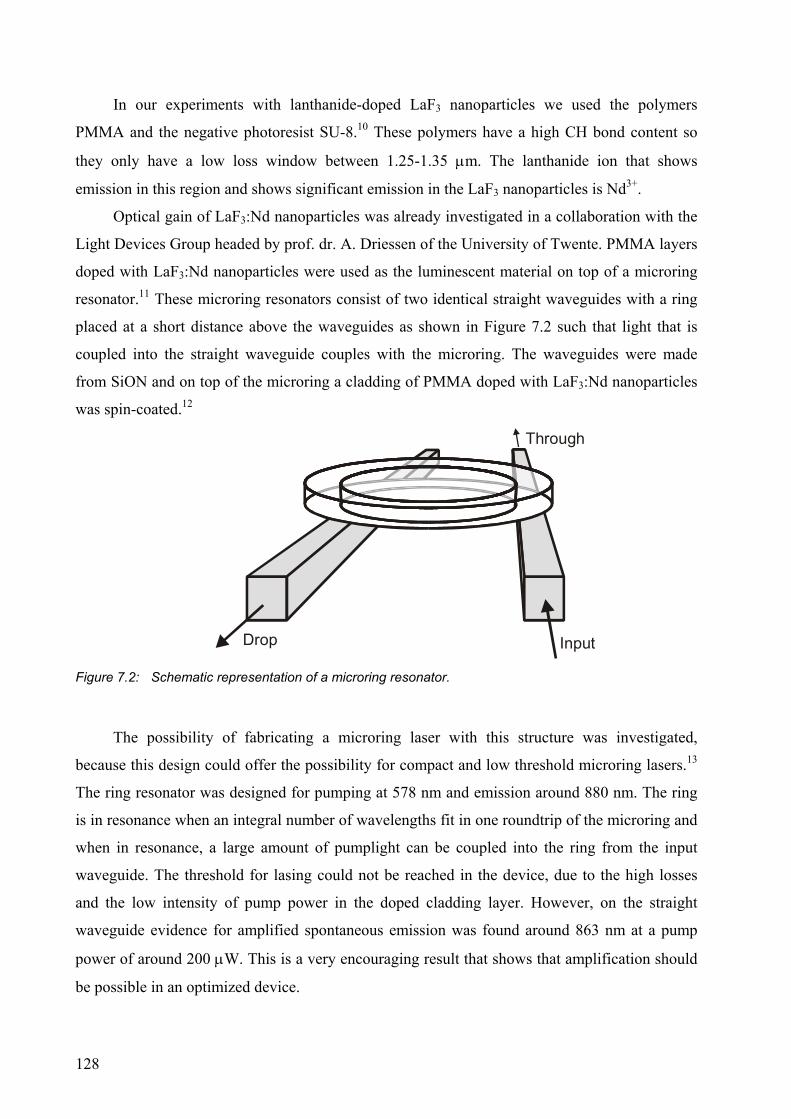
128
In our experiments with lanthanide-doped LaF3 nanoparticles we used the polymers
PMMA and the negative photoresist SU-8.10 These polymers have a high CH bond content so
they only have a low loss window between 1.25-1.35 µm. The lanthanide ion that shows
emission in this region and shows significant emission in the LaF3 nanoparticles is Nd3+.
Optical gain of LaF3:Nd nanoparticles was already investigated in a collaboration with the
Light Devices Group headed by prof. dr. A. Driessen of the University of Twente. PMMA layers
doped with LaF3:Nd nanoparticles were used as the luminescent material on top of a microring
resonator.11 These microring resonators consist of two identical straight waveguides with a ring
placed at a short distance above the waveguides as shown in Figure 7.2 such that light that is
coupled into the straight waveguide couples with the microring. The waveguides were made
from SiON and on top of the microring a cladding of PMMA doped with LaF3:Nd nanoparticles
was spin-coated.12
InputDrop
Through
Figure 7.2: Schematic representation of a microring resonator.
The possibility of fabricating a microring laser with this structure was investigated,
because this design could offer the possibility for compact and low threshold microring lasers.13
The ring resonator was designed for pumping at 578 nm and emission around 880 nm. The ring
is in resonance when an integral number of wavelengths fit in one roundtrip of the microring and
when in resonance, a large amount of pumplight can be coupled into the ring from the input
waveguide. The threshold for lasing could not be reached in the device, due to the high losses
and the low intensity of pump power in the doped cladding layer. However, on the straight
waveguide evidence for amplified spontaneous emission was found around 863 nm at a pump
power of around 200 µW. This is a very encouraging result that shows that amplification should
be possible in an optimized device.
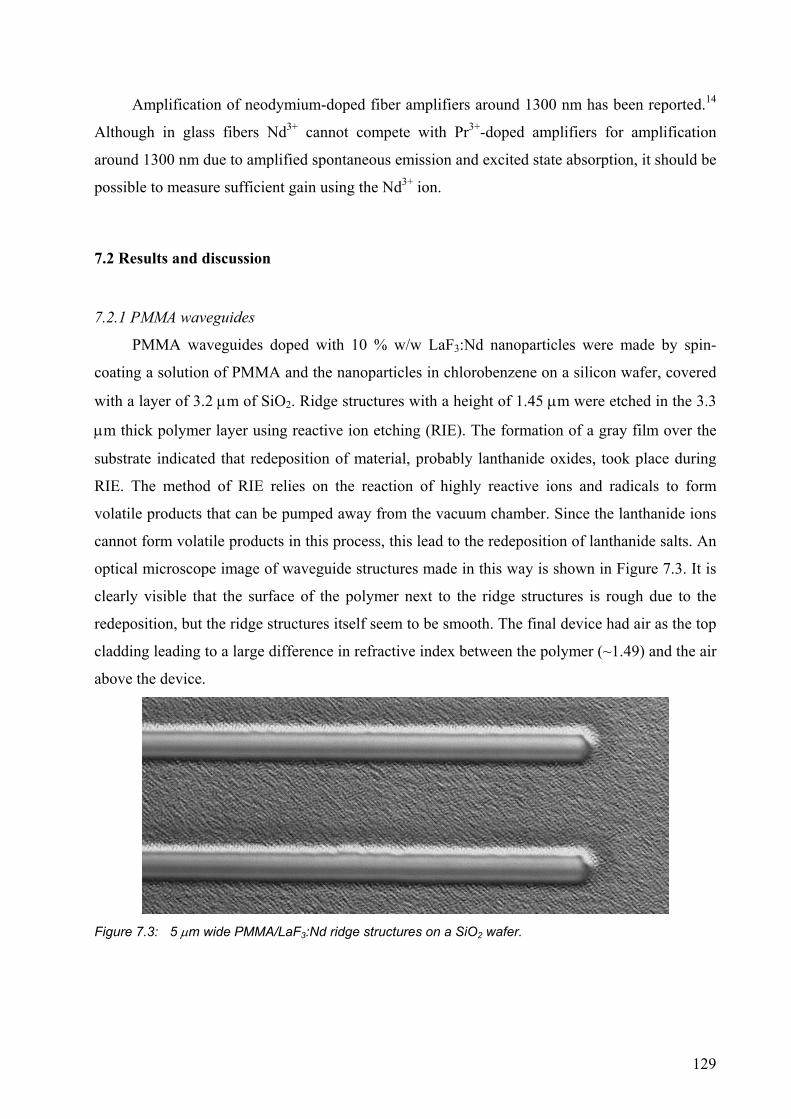
129
Amplification of neodymium-doped fiber amplifiers around 1300 nm has been reported.14
Although in glass fibers Nd3+ cannot compete with Pr3+-doped amplifiers for amplification
around 1300 nm due to amplified spontaneous emission and excited state absorption, it should be
possible to measure sufficient gain using the Nd3+ ion.
7.2 Results and discussion
7.2.1 PMMA waveguides
PMMA waveguides doped with 10 % w/w LaF3:Nd nanoparticles were made by spin-
coating a solution of PMMA and the nanoparticles in chlorobenzene on a silicon wafer, covered
with a layer of 3.2 µm of SiO2. Ridge structures with a height of 1.45 µm were etched in the 3.3
µm thick polymer layer using reactive ion etching (RIE). The formation of a gray film over the
substrate indicated that redeposition of material, probably lanthanide oxides, took place during
RIE. The method of RIE relies on the reaction of highly reactive ions and radicals to form
volatile products that can be pumped away from the vacuum chamber. Since the lanthanide ions
cannot form volatile products in this process, this lead to the redeposition of lanthanide salts. An
optical microscope image of waveguide structures made in this way is shown in Figure 7.3. It is
clearly visible that the surface of the polymer next to the ridge structures is rough due to the
redeposition, but the ridge structures itself seem to be smooth. The final device had air as the top
cladding leading to a large difference in refractive index between the polymer (~1.49) and the air
above the device.
Figure 7.3: 5 µm wide PMMA/LaF3:Nd ridge structures on a SiO2 wafer.
130
The endfaces of the polymer waveguide can be made by cleaving the wafer or by dicing
the wafer. Due to the weak adsorption of the polymer to the substrate, it was not possible to dice
the wafer without destroying the polymer layer and cleaving of the substrate was the only
possibility. Low loss endfaces could be made using the cleaving method, but the reproducibility
with this method was be low. The PMMA waveguide had a length of 3 cm and contained
waveguides with different width, from 10, 5, 4, 3, 2.5, 2 µm. The waveguides of 4 µm and less
did not transmit any light at 1300 nm. The 5 µm channel was single-mode at the signal
wavelength of 1319 nm and multi-mode at the pump wavelength of 578 nm, but the losses of this
waveguide were substantial (18 dB over 3 cm at the signal wavelength). An excitation
wavelength of 578 nm was chosen, because at this wavelength the Nd3+ ion has the strongest
absorption peak. The measurements were performed on the 10 µm wide channels, which were
multi-mode, both at the signal and pump wavelength. Standard 9/125 optical fibers (core
diameter of 9 µm) were used to couple the light into and out of the waveguide. The total chip
losses (propagation and coupling losses) at the pump wavelength were 12 dB on the 10 µm wide
channel and at the signal wavelength the losses were about 11 dB. The calculated coupling losses
for the signal beam were at least 6 dB, so on the 3 cm device the propagation losses were in the
order of 2 dB/cm. These propagation losses were lower compared to the previously prepared
PMMA waveguides,7 but the rough sidewalls of the device still cause substantial propagation
losses.
The continuous pump beam was butt-end coupled into the waveguide and the emission was
collected at the end of the waveguide. The collected emission spectrum is shown in Figure 7.4.
When the emission spectrum of the waveguide is compared with the emission spectrum of
LaF3:Nd nanoparticles in dichloromethane solution, we see that the emission peaks of the 4F3/2→4I11/2 and 4F3/2→4I9/2 transitions of Nd3+at 1060 and 1330 nm were observed in both
spectra. The emission peak at 880 nm of the 4F3/2→4I13/2 transition was not observed in the
waveguide emission spectrum, because an isolator was used to filter out the pump light and this
isolator also filtered out the 880 nm emission. The ratio between the intensities of the other two
emission peaks was also different, because the isolator filtered out part of the 1060 nm emission.
A sharp decrease in the 1330 nm peak was observed above 1340 nm, because of the overtone
absorption of the CH bonds in the waveguide. The amplification was measured on the
waveguides with a setup as shown in Figure 7.5. In order to measure amplification of the signal
beam, the pump and signal light have to be combined before going into the waveguide. The
131
pump and signal light were combined into a 9 µm core single mode fiber using a WDM and butt-
end coupled into the waveguide.
800 900 1000 1100 1200 1300 14000.0
0.2
0.4
0.6
0.8
1.0 waveguide solution
Inte
nsity
(a.u
.)
Wavelength (nm)
Figure 7.4: Emission spectrum of LaF3:Nd nanoparticles in solution and in the PMMA waveguide after
excitation at 578 nm.
1319 nm laser
pump laser
Detector
Osciloscope
Microscopeobjective
CombinerIsolator
Waveguides
Figure 7.5: Setup for the measurement of optical amplification on the waveguides.
132
The intensity of the 1319 nm signal laser was unstable, so the pump light was chopped in
order to measure the difference in signal intensity when the pump light was on and off. This
configuration is only possible when all of the pump light is filtered out before the detector,
because otherwise residual pump light will interfere with the amplified emission. The use of an
isolator was found sufficient to filter out all of the pump light. The pump beam was chopped at
80 Hz for the amplification measurements and combined with the signal light coupled into the
waveguide. The light coming out of the waveguide was collected using a multimode optical fiber
with a core diameter of 50 µm and fed to a detector. The detector signal was shown on an
oscilloscope. At a pump power of 12 mW coupled into the device and a signal power of about 1
µW, a signal amplification of 0.3 dB was measured. The gain showed a dependence on the pump
wavelength between 570 and 590 nm, with the maximum gain corresponding to the absorption
peak of the Nd3+ ion at 578 nm. This amplification is equal to a signal increase of 10 %, using
Equation 7.1 for calculation from mW to dB, Iin is the signal intensity without pump light and Iout
the signal intensity with pumplight, both in mW.
×=
in
out10
II
log10dB (Eq. 7.1)
This signal increase measured with the detector could also be a result of spontaneous
emission of the Nd3+ ions. This was studied by turning off the signal laser and measuring the
intensity differences using a chopped pump laser. The effect of the spontaneous emission on the
detector signal was approximately 1 % of the amplification signal, so the effect of spontaneous
emission could safely be ignored.
Considering the large coupling and propagation losses of the device, net gain will not be
possible in this waveguide. The coupling losses can be decreased using a device structure that
better fits the fiber light mode with the polymer waveguide mode and the propagation losses can
be lowered using other techniques to make the waveguide structures, instead of RIE. SU-8 was
used as another polymer that is structured more easily and shows good solubility properties with
the LaF3 nanoparticles.
7.2.2 SU-8 waveguides
Low loss waveguides of SU-8 have been fabricated by Borreman et al.15 The nanoparticle-
doped SU-8 waveguides were made by mixing a LaF3:Nd nanoparticle solution in γ-
butyrolactone with a commercially available SU-8 solution in γ-butyrolactone.10 SU-8 is a
negative photoresist that can be patterned by photolithography, thus without RIE. The structures
133
of the molecules in this photoresist solution are shown in Figure 7.6. The monomer consists of a
bisphenol A epoxy resin that can be polymerized by acid catalysis. A sulfonium ion acts as the
photoinitiator for the polymerization, which generates protons upon UV irradiation. The solvent
used for the photoresist composition is γ-butyrolactone, of which the structure is also shown in
Figure 7.6.
O
O
O
O
O
O
O
O
O
O
O
O
O
O
O
O
S +
O
O
SU-8 monomer Photoinitiator
Solvent
Figure 7.6: Composition of a SU-8 negative photoresist solution.
Due to the high refractive index (1.59) of the polymer, glass can be used as the substrate.
The polymer shows good adhesion to glass, making it possible to dice the endfaces. Due to the
strong cross-linking of the polymer it is also possible to apply a cladding over the device,
without destroying the waveguide structures.
SU-8 layers doped with 20 % w/w of the LaF3:Nd nanoparticles were spin-coated on 10
cm borosilicate wafers. The processing of the doped SU-8 was similar to the processing of the
un-doped photoresist and only a few modifications were necessary.10,15 First of all, the
temperatures at which the spin-coated layers were handled before the development had to be
lowered compared to the SU-8 without nanoparticle doping. Temperatures above 75 °C lead to
desorption of the ligand from the nanoparticle surface, which has a negative effect on the
solubility of the nanoparticles in organic solvents. When the doped layers were handled at
temperatures exceeding 75 °C, a thin layer of insoluble nanoparticles remained on the substrate
after development. For this reason the layers were heated at 65 °C for two hours after spin-
coating to remove the solvent. After the development the layers were hard-baked at the usual
temperature of 150 °C, because in the highly cross-linked polymer the nanoparticles will not
aggregate anymore. The doped SU-8 layers also needed a longer irradiation time compared to the
134
SU-8 layers without nanoparticle doping. For the layers without nanoparticles, the irradiation
time was 10 seconds, but for the doped layers an irradiation time of 300 seconds was necessary.
There can be several reasons for this increase in irradiation time. A possible reason seems the
slight desorption of ligand from the nanoparticle surface in the softbake step. This ligand could
act as a base during the crosslinking of the polymer, slowing down the reaction rate. Another
possibility is that the photoinitiator is not randomly distributed in the polymer film. The ligand
monolayer around the nanoparticles creates a hydrophobic film, which could cause an
inhomogeneous distribution of the photoinitiator.
The waveguides were finished by spin-coating a layer of HEMA-styrene on top of the
device as a cladding, followed by dicing the endfaces. Optical microscope pictures of the
waveguides with the cladding on top are shown in Figure 7.7. The left picture shows a top view
of some channels covered with the cladding. The picture shows straight and smooth channels.
The right picture shows a cross-sectional view of a 5 by 10 µm2 channel. It can be seen that the
top of the channel is a bit wider than the bottom of the channel, which can be caused by the un-
optimized irradiation conditions. During the irradiation the top of the polymer slab can heat up
by the long wavelength components in the UV light source. Due to the higher temperature in the
top layer the reaction rate was increased causing the top of the channel to be wider. After dicing
the endfaces, the total length of the waveguide was 5.2 cm.
Figure 7.7: Waveguides of SU-8 doped with 20 % of LaF3:Nd, (left) top view of waveguide channels,
(right) cross-sectional view of a diced 5 x 10 µm2 channel.
Optical pumping at 578 nm was not successful for the SU-8 device, because the polymer
was not stable under high pump fluxes of this wavelength. Yellowing of the polymer at the high
temperatures of the hard bake step is probably the cause of this instability. The yellowing of the
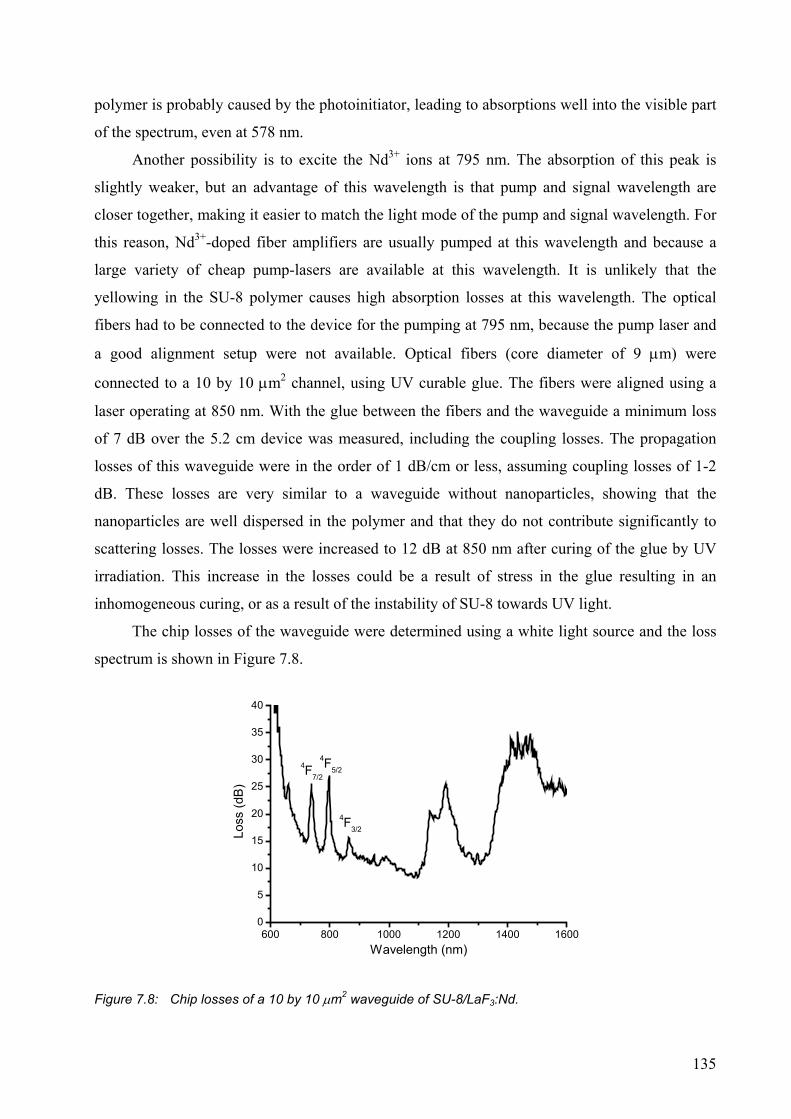
135
polymer is probably caused by the photoinitiator, leading to absorptions well into the visible part
of the spectrum, even at 578 nm.
Another possibility is to excite the Nd3+ ions at 795 nm. The absorption of this peak is
slightly weaker, but an advantage of this wavelength is that pump and signal wavelength are
closer together, making it easier to match the light mode of the pump and signal wavelength. For
this reason, Nd3+-doped fiber amplifiers are usually pumped at this wavelength and because a
large variety of cheap pump-lasers are available at this wavelength. It is unlikely that the
yellowing in the SU-8 polymer causes high absorption losses at this wavelength. The optical
fibers had to be connected to the device for the pumping at 795 nm, because the pump laser and
a good alignment setup were not available. Optical fibers (core diameter of 9 µm) were
connected to a 10 by 10 µm2 channel, using UV curable glue. The fibers were aligned using a
laser operating at 850 nm. With the glue between the fibers and the waveguide a minimum loss
of 7 dB over the 5.2 cm device was measured, including the coupling losses. The propagation
losses of this waveguide were in the order of 1 dB/cm or less, assuming coupling losses of 1-2
dB. These losses are very similar to a waveguide without nanoparticles, showing that the
nanoparticles are well dispersed in the polymer and that they do not contribute significantly to
scattering losses. The losses were increased to 12 dB at 850 nm after curing of the glue by UV
irradiation. This increase in the losses could be a result of stress in the glue resulting in an
inhomogeneous curing, or as a result of the instability of SU-8 towards UV light.
The chip losses of the waveguide were determined using a white light source and the loss
spectrum is shown in Figure 7.8.
600 800 1000 1200 1400 16000
5
10
15
20
25
30
35
40
4F3/2
4F5/24F7/2
Loss
(dB
)
Wavelength (nm)
Figure 7.8: Chip losses of a 10 by 10 µm2 waveguide of SU-8/LaF3:Nd.
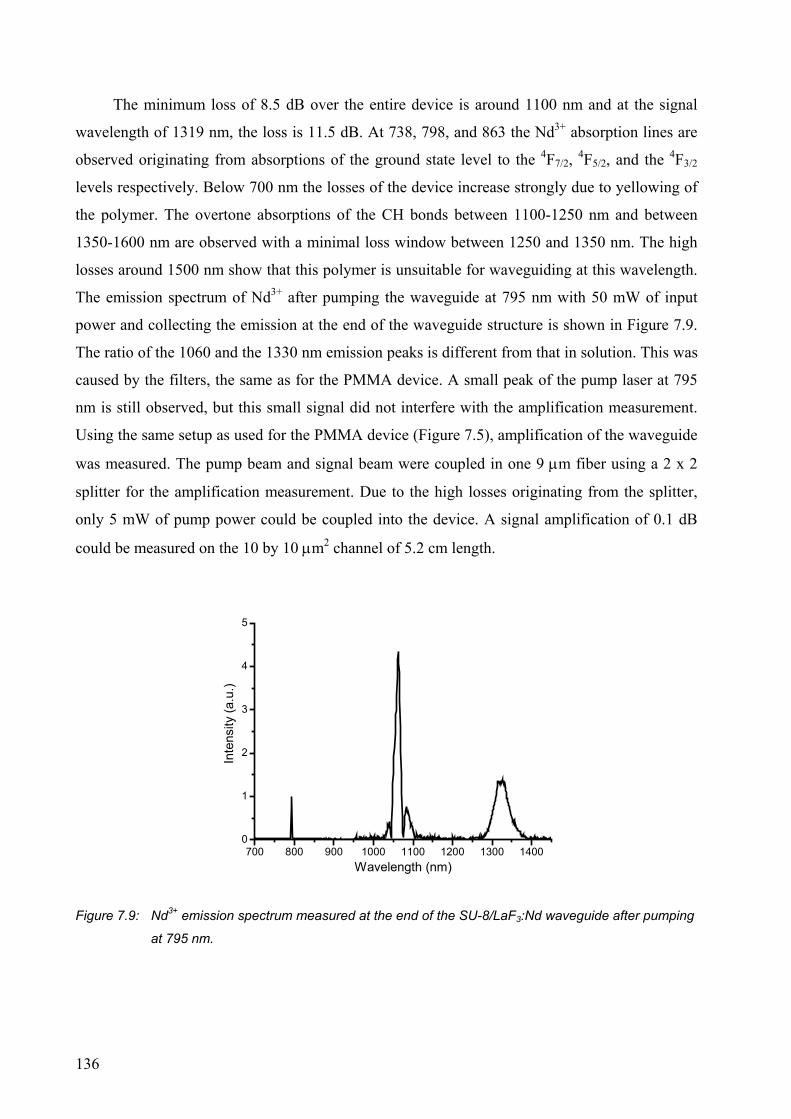
136
The minimum loss of 8.5 dB over the entire device is around 1100 nm and at the signal
wavelength of 1319 nm, the loss is 11.5 dB. At 738, 798, and 863 the Nd3+ absorption lines are
observed originating from absorptions of the ground state level to the 4F7/2, 4F5/2, and the 4F3/2
levels respectively. Below 700 nm the losses of the device increase strongly due to yellowing of
the polymer. The overtone absorptions of the CH bonds between 1100-1250 nm and between
1350-1600 nm are observed with a minimal loss window between 1250 and 1350 nm. The high
losses around 1500 nm show that this polymer is unsuitable for waveguiding at this wavelength.
The emission spectrum of Nd3+ after pumping the waveguide at 795 nm with 50 mW of input
power and collecting the emission at the end of the waveguide structure is shown in Figure 7.9.
The ratio of the 1060 and the 1330 nm emission peaks is different from that in solution. This was
caused by the filters, the same as for the PMMA device. A small peak of the pump laser at 795
nm is still observed, but this small signal did not interfere with the amplification measurement.
Using the same setup as used for the PMMA device (Figure 7.5), amplification of the waveguide
was measured. The pump beam and signal beam were coupled in one 9 µm fiber using a 2 x 2
splitter for the amplification measurement. Due to the high losses originating from the splitter,
only 5 mW of pump power could be coupled into the device. A signal amplification of 0.1 dB
could be measured on the 10 by 10 µm2 channel of 5.2 cm length.
700 800 900 1000 1100 1200 1300 14000
1
2
3
4
5
Inte
nsity
(a.u
.)
Wavelength (nm)
Figure 7.9: Nd3+ emission spectrum measured at the end of the SU-8/LaF3:Nd waveguide after pumping
at 795 nm.
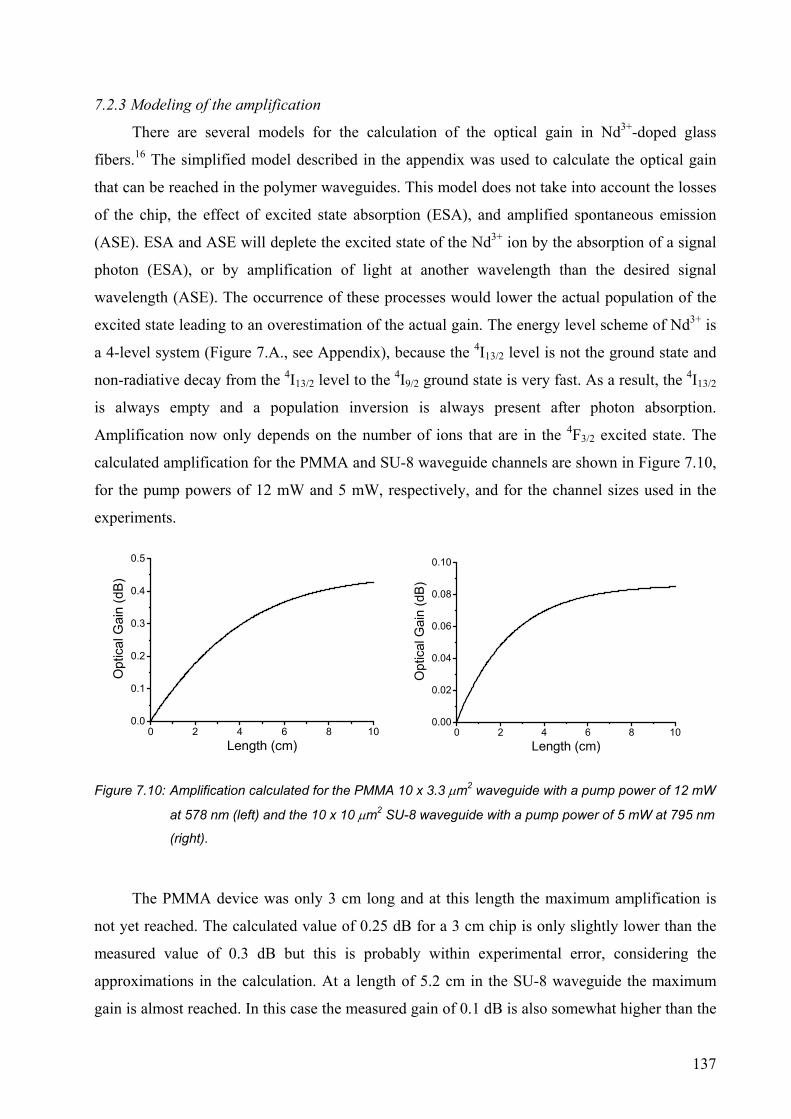
137
7.2.3 Modeling of the amplification
There are several models for the calculation of the optical gain in Nd3+-doped glass
fibers.16 The simplified model described in the appendix was used to calculate the optical gain
that can be reached in the polymer waveguides. This model does not take into account the losses
of the chip, the effect of excited state absorption (ESA), and amplified spontaneous emission
(ASE). ESA and ASE will deplete the excited state of the Nd3+ ion by the absorption of a signal
photon (ESA), or by amplification of light at another wavelength than the desired signal
wavelength (ASE). The occurrence of these processes would lower the actual population of the
excited state leading to an overestimation of the actual gain. The energy level scheme of Nd3+ is
a 4-level system (Figure 7.A., see Appendix), because the 4I13/2 level is not the ground state and
non-radiative decay from the 4I13/2 level to the 4I9/2 ground state is very fast. As a result, the 4I13/2
is always empty and a population inversion is always present after photon absorption.
Amplification now only depends on the number of ions that are in the 4F3/2 excited state. The
calculated amplification for the PMMA and SU-8 waveguide channels are shown in Figure 7.10,
for the pump powers of 12 mW and 5 mW, respectively, and for the channel sizes used in the
experiments.
0 2 4 6 8 100.0
0.1
0.2
0.3
0.4
0.5
Opt
ical
Gai
n (d
B)
Length (cm)0 2 4 6 8 10
0.00
0.02
0.04
0.06
0.08
0.10
Opt
ical
Gai
n (d
B)
Length (cm)
Figure 7.10: Amplification calculated for the PMMA 10 x 3.3 µm2 waveguide with a pump power of 12 mW
at 578 nm (left) and the 10 x 10 µm2 SU-8 waveguide with a pump power of 5 mW at 795 nm
(right).
The PMMA device was only 3 cm long and at this length the maximum amplification is
not yet reached. The calculated value of 0.25 dB for a 3 cm chip is only slightly lower than the
measured value of 0.3 dB but this is probably within experimental error, considering the
approximations in the calculation. At a length of 5.2 cm in the SU-8 waveguide the maximum
gain is almost reached. In this case the measured gain of 0.1 dB is also somewhat higher than the
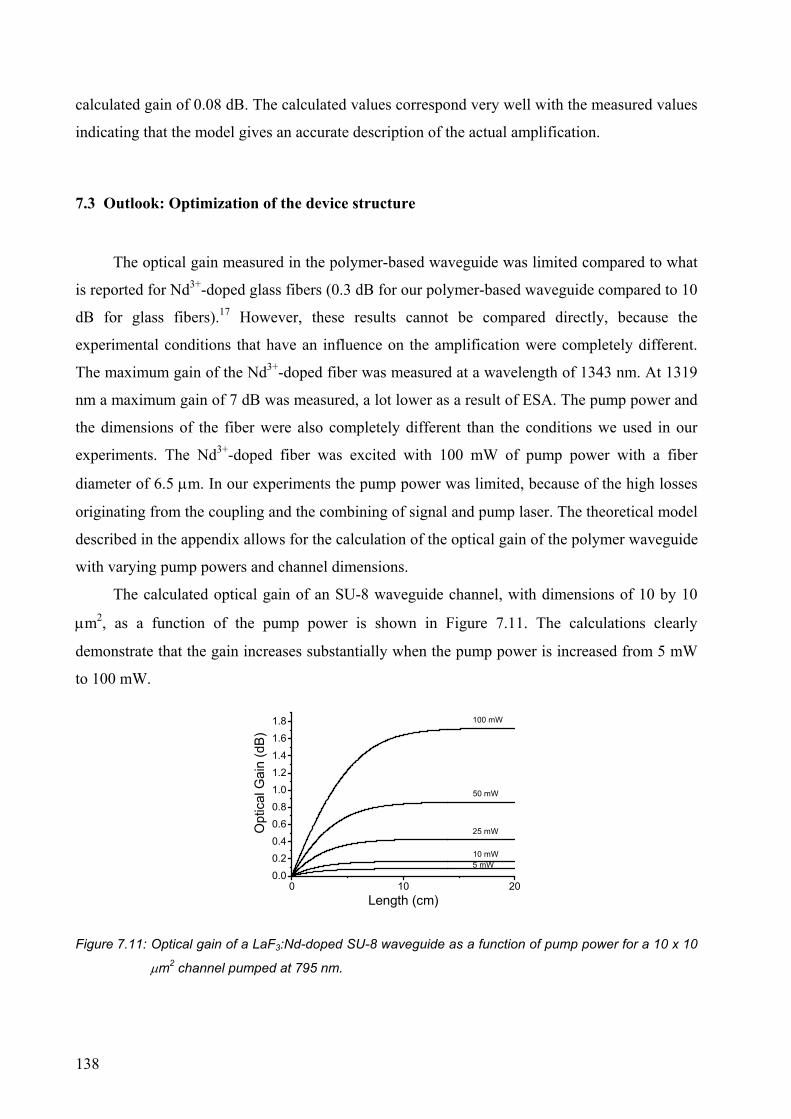
138
calculated gain of 0.08 dB. The calculated values correspond very well with the measured values
indicating that the model gives an accurate description of the actual amplification.
7.3 Outlook: Optimization of the device structure
The optical gain measured in the polymer-based waveguide was limited compared to what
is reported for Nd3+-doped glass fibers (0.3 dB for our polymer-based waveguide compared to 10
dB for glass fibers).17 However, these results cannot be compared directly, because the
experimental conditions that have an influence on the amplification were completely different.
The maximum gain of the Nd3+-doped fiber was measured at a wavelength of 1343 nm. At 1319
nm a maximum gain of 7 dB was measured, a lot lower as a result of ESA. The pump power and
the dimensions of the fiber were also completely different than the conditions we used in our
experiments. The Nd3+-doped fiber was excited with 100 mW of pump power with a fiber
diameter of 6.5 µm. In our experiments the pump power was limited, because of the high losses
originating from the coupling and the combining of signal and pump laser. The theoretical model
described in the appendix allows for the calculation of the optical gain of the polymer waveguide
with varying pump powers and channel dimensions.
The calculated optical gain of an SU-8 waveguide channel, with dimensions of 10 by 10
µm2, as a function of the pump power is shown in Figure 7.11. The calculations clearly
demonstrate that the gain increases substantially when the pump power is increased from 5 mW
to 100 mW.
0 10 200.0
0.20.4
0.60.81.01.21.4
1.6
1.8
5 mW
50 mW
25 mW
10 mW
100 mW
Opt
ical
Gai
n (d
B)
Length (cm)
Figure 7.11: Optical gain of a LaF3:Nd-doped SU-8 waveguide as a function of pump power for a 10 x 10
µm2 channel pumped at 795 nm.
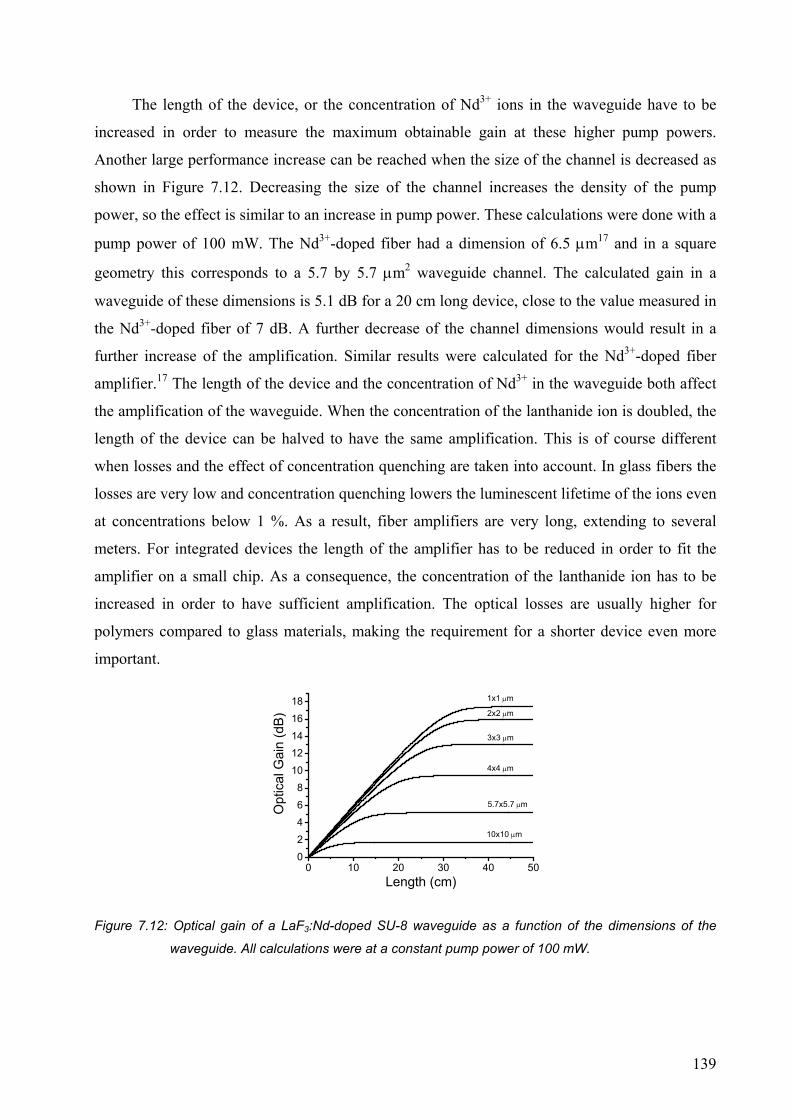
139
The length of the device, or the concentration of Nd3+ ions in the waveguide have to be
increased in order to measure the maximum obtainable gain at these higher pump powers.
Another large performance increase can be reached when the size of the channel is decreased as
shown in Figure 7.12. Decreasing the size of the channel increases the density of the pump
power, so the effect is similar to an increase in pump power. These calculations were done with a
pump power of 100 mW. The Nd3+-doped fiber had a dimension of 6.5 µm17 and in a square
geometry this corresponds to a 5.7 by 5.7 µm2 waveguide channel. The calculated gain in a
waveguide of these dimensions is 5.1 dB for a 20 cm long device, close to the value measured in
the Nd3+-doped fiber of 7 dB. A further decrease of the channel dimensions would result in a
further increase of the amplification. Similar results were calculated for the Nd3+-doped fiber
amplifier.17 The length of the device and the concentration of Nd3+ in the waveguide both affect
the amplification of the waveguide. When the concentration of the lanthanide ion is doubled, the
length of the device can be halved to have the same amplification. This is of course different
when losses and the effect of concentration quenching are taken into account. In glass fibers the
losses are very low and concentration quenching lowers the luminescent lifetime of the ions even
at concentrations below 1 %. As a result, fiber amplifiers are very long, extending to several
meters. For integrated devices the length of the amplifier has to be reduced in order to fit the
amplifier on a small chip. As a consequence, the concentration of the lanthanide ion has to be
increased in order to have sufficient amplification. The optical losses are usually higher for
polymers compared to glass materials, making the requirement for a shorter device even more
important.
0 10 20 30 40 500
24
6
810
1214
16
182x2 µm
10x10 µm
5.7x5.7 µm
4x4 µm
3x3 µm
1x1 µm
Opt
ical
Gai
n (d
B)
Length (cm)
Figure 7.12: Optical gain of a LaF3:Nd-doped SU-8 waveguide as a function of the dimensions of the
waveguide. All calculations were at a constant pump power of 100 mW.
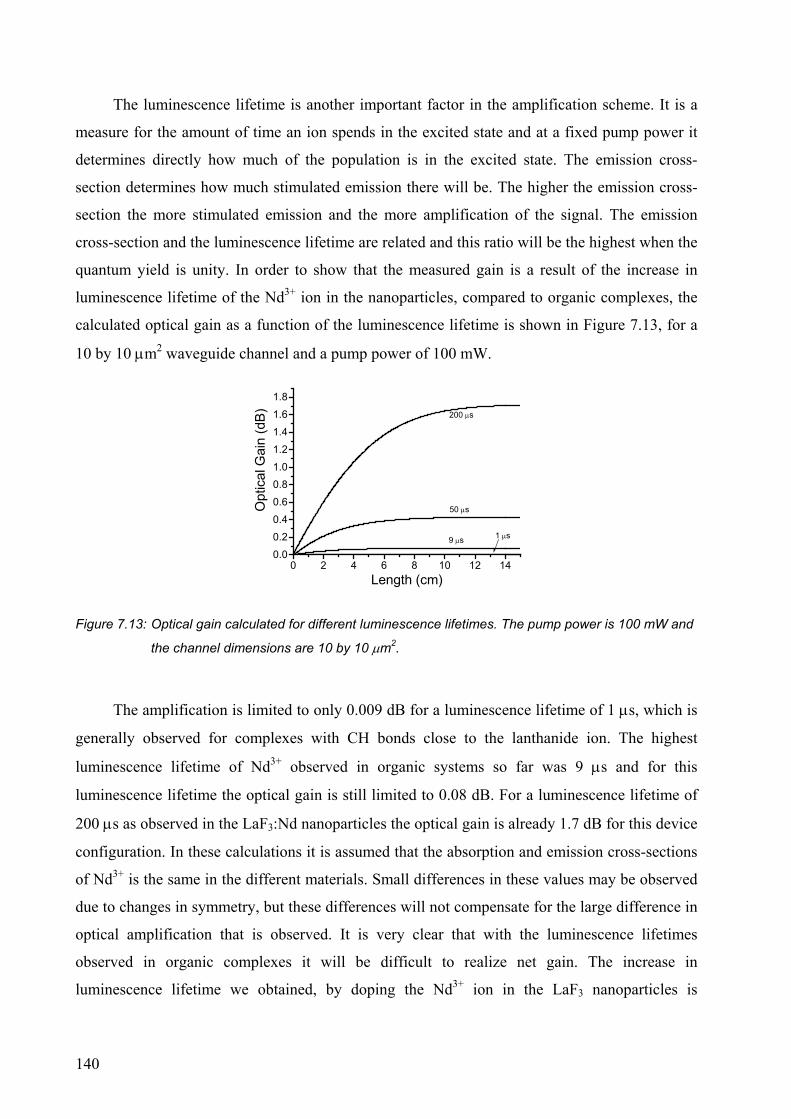
140
The luminescence lifetime is another important factor in the amplification scheme. It is a
measure for the amount of time an ion spends in the excited state and at a fixed pump power it
determines directly how much of the population is in the excited state. The emission cross-
section determines how much stimulated emission there will be. The higher the emission cross-
section the more stimulated emission and the more amplification of the signal. The emission
cross-section and the luminescence lifetime are related and this ratio will be the highest when the
quantum yield is unity. In order to show that the measured gain is a result of the increase in
luminescence lifetime of the Nd3+ ion in the nanoparticles, compared to organic complexes, the
calculated optical gain as a function of the luminescence lifetime is shown in Figure 7.13, for a
10 by 10 µm2 waveguide channel and a pump power of 100 mW.
0 2 4 6 8 10 12 140.0
0.2
0.4
0.6
0.8
1.0
1.2
1.4
1.6
1.8
1 µs9 µs
50 µs
200 µs
Opt
ical
Gai
n (d
B)
Length (cm)
Figure 7.13: Optical gain calculated for different luminescence lifetimes. The pump power is 100 mW and
the channel dimensions are 10 by 10 µm2.
The amplification is limited to only 0.009 dB for a luminescence lifetime of 1 µs, which is
generally observed for complexes with CH bonds close to the lanthanide ion. The highest
luminescence lifetime of Nd3+ observed in organic systems so far was 9 µs and for this
luminescence lifetime the optical gain is still limited to 0.08 dB. For a luminescence lifetime of
200 µs as observed in the LaF3:Nd nanoparticles the optical gain is already 1.7 dB for this device
configuration. In these calculations it is assumed that the absorption and emission cross-sections
of Nd3+ is the same in the different materials. Small differences in these values may be observed
due to changes in symmetry, but these differences will not compensate for the large difference in
optical amplification that is observed. It is very clear that with the luminescence lifetimes
observed in organic complexes it will be difficult to realize net gain. The increase in
luminescence lifetime we obtained, by doping the Nd3+ ion in the LaF3 nanoparticles is
141
responsible for the fact that we were able to measure optical gain. The doping of Nd3+ ions into
the LaF3 nanoparticles leads to optical properties that allow amplification close to what is
observed in Nd3+-doped glass fiber amplifiers.
Amplification with other ions should also be possible. The Er3+ ion, which is commonly
used in optical fiber amplifiers, also shows emission in the LaF3 nanoparticles, but for
amplification at 1530 nm other polymers have to be used to reduce the optical loss at the signal
wavelength. The organic ligand that is protecting the nanoparticles from aggregation also
contains a lot of CH bonds, but the total amount of ligand is low in the whole system and a proof
of principle should be possible for amplification by Er3+ ions as well with this ligand and a
halogenated polymer. The same holds for the other two lanthanide ions, Pr3+ and Ho3+, that show
emissions around 1450 nm.
7.4 Conclusions
Optical gain in a polymer-based waveguide doped with nanoparticles synthesized in this
thesis in the near-infrared was demonstrated. The pump power that could be coupled in the
waveguide was limited and therefore only a small signal gain was observed, but theoretical
calculations show that the optical gain could be close to what was observed in Nd3+-doped glass
fibers, when the same experimental conditions are used.
7.5 Experimental section
General. Spin-coating of the polymer solutions was performed under standard cleanroom conditions. The
thicknesses of the polymer layers were measured using a Dektak surface profiler. Arch, 907/17 was used
as the positive photoresist and spin-coated at a speed of 4000 rpm for 20 s and a prebake temperature of
95 °C. The photoresist was developed in standard OPD developer for 50 s. Reactive ion etching was
performed using a Elektrotech PF340 etcher. The endfaces of the SU-8 waveguide were made by dicing
the substrate using a Disco DAD-321 Dicing Saw.
LaF3:Nd nanoparticles. LaF3:Nd nanoparticles were synthesized as described in chapter 3. PMMA
layers were spin-coated from chlorobenzene and ligand 2 of chapter 3 was used to make LaF3:Nd
nanoparticles that are soluble in chlorobenzene. SU-8 is a commercial product with γ-butyrolactone as the
solvent. Nanoparticles synthesized with ligand 2 of chapter 4 are soluble in γ-butyrolactone, but for
mixing with the SU-8 solution, a mixture of ligand 2 and 5 in the ratio 1:2 was found to give the best
solubility properties. The nanoparticle-doped solution was made by dissolving the nanoparticles in γ-
142
butyrolactone and mixing this solution with commercially available SU-8 25 (solid content 63 %), to end
up with a solid content of 52 %.
Waveguide fabrication. The PMMA/ LaF3:Nd solution was spin-coated on a 3” silicon wafer covered
with 3.2 µm SiO2 (Plasma enhanced chemical vapor deposition; PECVD) on top. The solution consisted
of 900 mg PMMA and 100 mg of nanoparticles dissolved in 4 g of chlorobenzene. Spin-coating was
performed at 1250 rpm resulting in a layer thickness of 3.3 µm. After spin-coating the wafer was dried at
95 °C followed by spin-coating a 1.2 µm thick layer of positive photoresist on top. Patterns were made
with a mask having channels ranging in diameter from 2-10 µm, using a radiation time of 3.7 s. The
photoresist was developed in standard OPD developer for 50 sec. After creation of the pattern in the
photoresist the polymer was etched using reactive ion etching (RIE). RIE was done for 8 min at a power
of 20 W with a pressure of 10 mTorr and 20 sccm O2, keeping the wafer at a temperature of 10 °C.
Excess photoresist was removed by irradiation and development, leaving ridges with a height of 1.45 µm.
The doped SU-8 layers were spin-coated on 10 cm borosilicate wafers that were previously cleaned in
fuming nitric acid for 8 minutes. The solid content of the solution of 52 % included the nanoparticles and
the composition of the SU-8 solution in a 1:4 weight ratio. Spin-coating was done at 1250 rpm for 30
seconds with an acceleration of 100 rpm/sec. The layers were dried at 65 °C for two hours, followed by
exposure for 300 seconds through a mask containing the waveguide structures. The film was postbaked at
65 °C for 2 min followed by development in RER 600 developer for 2 minutes. The structures were
washed with isopropanol to remove excess developer and dried with a nitrogen stream. Flood exposure
was done for 5 minutes, followed by a hard bake for 2 hours at 150 °C. A cladding of HEMA-styrene was
spin-coated on top of the device at a spin speed of 750 rpm.
Photophysical measurements. Measurements on the waveguides were performed using an Ar+-pumped
dye laser as the pump laser at 578 nm and a Ti Sapphire laser was used for pumping at 795 nm. The
signal laser was a diode laser operating at 1319 nm. The laser light was coupled into a 9/125 µm single
mode fiber using a microscope objective and from the fiber into the waveguide. Alignment of the fibers
and chip were done using a butt-end coupling setup. Light coming from the waveguide was collected with
a single or multi-mode fiber and lead to a detector or a spectral analyzer for emission spectra.
7.6 References and notes 1 Becker, P. C.; Olsson, N. A.; Simpson, J. R. Erbium Doped Amplifiers: Fundamentals and
Technology; Academic Press: San Diego, 1999. 2 Polman, A. Phys. B 2001, 300, 78.
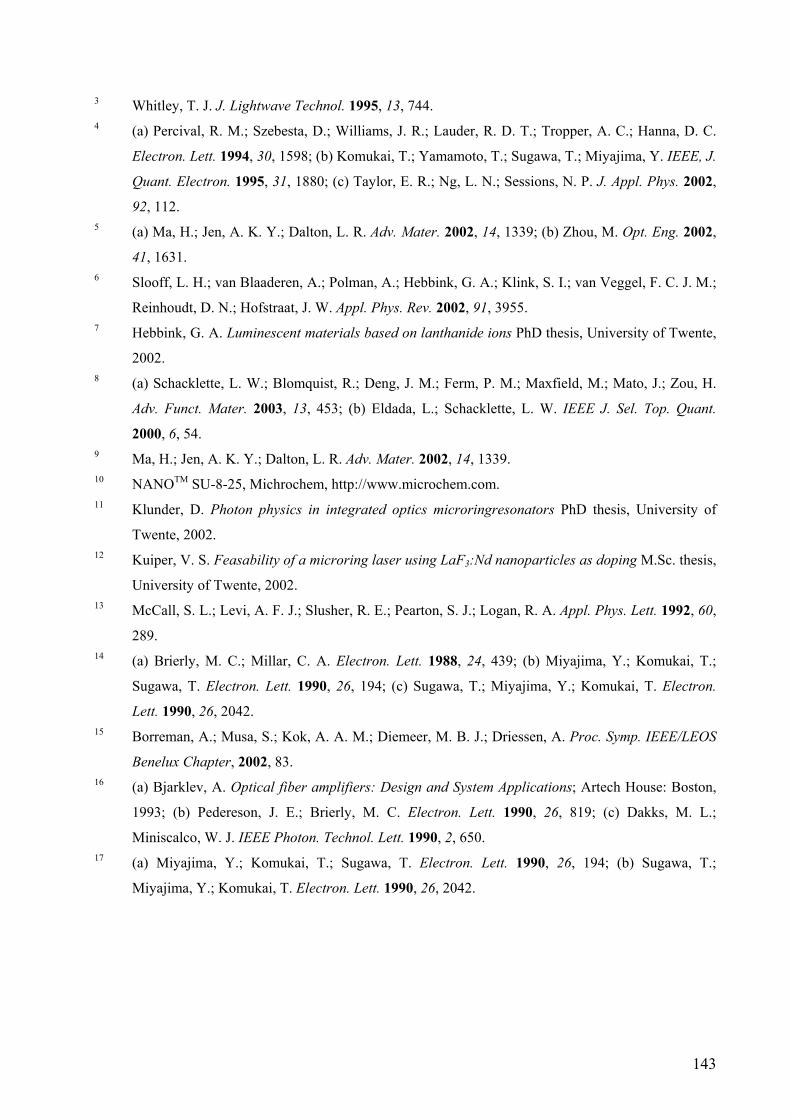
143
3 Whitley, T. J. J. Lightwave Technol. 1995, 13, 744. 4 (a) Percival, R. M.; Szebesta, D.; Williams, J. R.; Lauder, R. D. T.; Tropper, A. C.; Hanna, D. C.
Electron. Lett. 1994, 30, 1598; (b) Komukai, T.; Yamamoto, T.; Sugawa, T.; Miyajima, Y. IEEE, J.
Quant. Electron. 1995, 31, 1880; (c) Taylor, E. R.; Ng, L. N.; Sessions, N. P. J. Appl. Phys. 2002,
92, 112. 5 (a) Ma, H.; Jen, A. K. Y.; Dalton, L. R. Adv. Mater. 2002, 14, 1339; (b) Zhou, M. Opt. Eng. 2002,
41, 1631. 6 Slooff, L. H.; van Blaaderen, A.; Polman, A.; Hebbink, G. A.; Klink, S. I.; van Veggel, F. C. J. M.;
Reinhoudt, D. N.; Hofstraat, J. W. Appl. Phys. Rev. 2002, 91, 3955. 7 Hebbink, G. A. Luminescent materials based on lanthanide ions PhD thesis, University of Twente,
2002. 8 (a) Schacklette, L. W.; Blomquist, R.; Deng, J. M.; Ferm, P. M.; Maxfield, M.; Mato, J.; Zou, H.
Adv. Funct. Mater. 2003, 13, 453; (b) Eldada, L.; Schacklette, L. W. IEEE J. Sel. Top. Quant.
2000, 6, 54. 9 Ma, H.; Jen, A. K. Y.; Dalton, L. R. Adv. Mater. 2002, 14, 1339. 10 NANOTM SU-8-25, Michrochem, http://www.microchem.com. 11 Klunder, D. Photon physics in integrated optics microringresonators PhD thesis, University of
Twente, 2002. 12 Kuiper, V. S. Feasability of a microring laser using LaF3:Nd nanoparticles as doping M.Sc. thesis,
University of Twente, 2002. 13 McCall, S. L.; Levi, A. F. J.; Slusher, R. E.; Pearton, S. J.; Logan, R. A. Appl. Phys. Lett. 1992, 60,
289. 14 (a) Brierly, M. C.; Millar, C. A. Electron. Lett. 1988, 24, 439; (b) Miyajima, Y.; Komukai, T.;
Sugawa, T. Electron. Lett. 1990, 26, 194; (c) Sugawa, T.; Miyajima, Y.; Komukai, T. Electron.
Lett. 1990, 26, 2042. 15 Borreman, A.; Musa, S.; Kok, A. A. M.; Diemeer, M. B. J.; Driessen, A. Proc. Symp. IEEE/LEOS
Benelux Chapter, 2002, 83. 16 (a) Bjarklev, A. Optical fiber amplifiers: Design and System Applications; Artech House: Boston,
1993; (b) Pedereson, J. E.; Brierly, M. C. Electron. Lett. 1990, 26, 819; (c) Dakks, M. L.;
Miniscalco, W. J. IEEE Photon. Technol. Lett. 1990, 2, 650. 17 (a) Miyajima, Y.; Komukai, T.; Sugawa, T. Electron. Lett. 1990, 26, 194; (b) Sugawa, T.;
Miyajima, Y.; Komukai, T. Electron. Lett. 1990, 26, 2042.
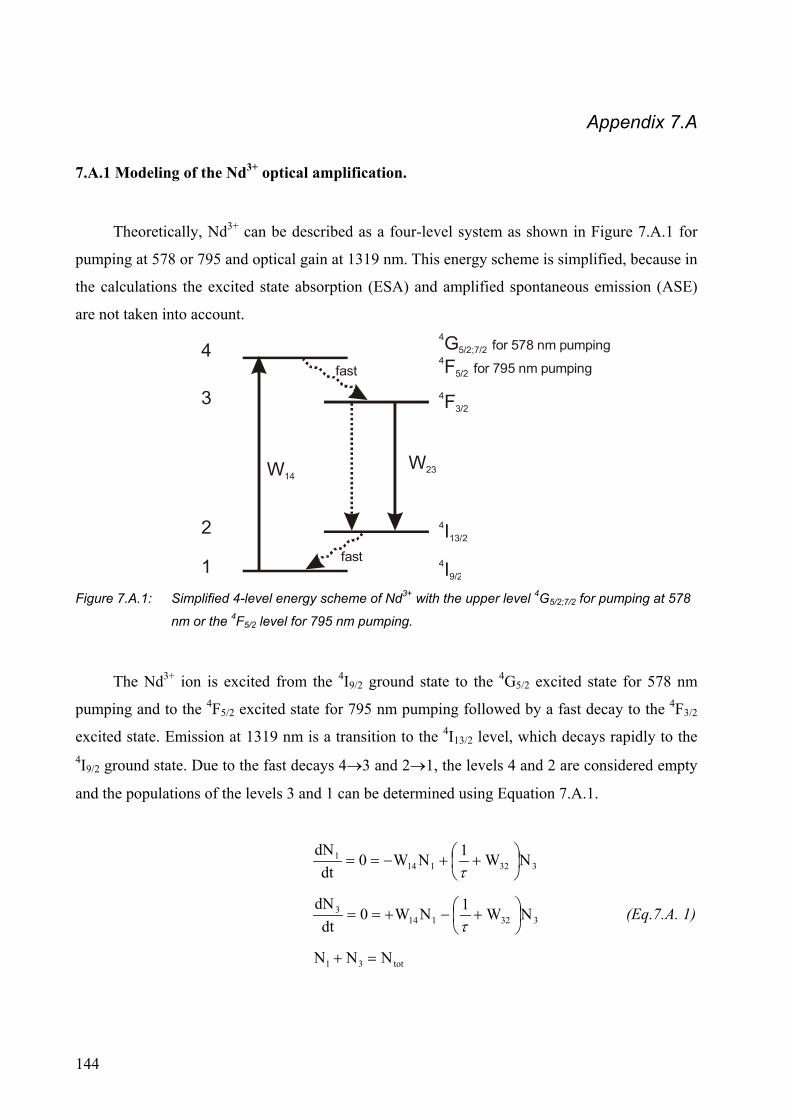
144
Appendix 7.A
7.A.1 Modeling of the Nd3+ optical amplification.
Theoretically, Nd3+ can be described as a four-level system as shown in Figure 7.A.1 for
pumping at 578 or 795 and optical gain at 1319 nm. This energy scheme is simplified, because in
the calculations the excited state absorption (ESA) and amplified spontaneous emission (ASE)
are not taken into account. 4
4G F
5/2;7/2
5/2
for 578 nm pumping
for 795 nm pumping
4F3/2
4I13/2
4I9/2
W14W23
4
3
2
1
fast
fast
Figure 7.A.1: Simplified 4-level energy scheme of Nd3+ with the upper level 4G5/2;7/2 for pumping at 578
nm or the 4F5/2 level for 795 nm pumping.
The Nd3+ ion is excited from the 4I9/2 ground state to the 4G5/2 excited state for 578 nm
pumping and to the 4F5/2 excited state for 795 nm pumping followed by a fast decay to the 4F3/2
excited state. Emission at 1319 nm is a transition to the 4I13/2 level, which decays rapidly to the 4I9/2 ground state. Due to the fast decays 4→3 and 2→1, the levels 4 and 2 are considered empty
and the populations of the levels 3 and 1 can be determined using Equation 7.A.1.
3321141 NW1NW0
dtdN
++−==τ
3321143 NW1NW0
dtdN
+−+==τ
(Eq.7.A. 1)
tot31 NNN =+

145
With N1 the population of level 1, N3 the population of level 3, Ntot the total population,
W14 the rate of absorption, W32 the rate of stimulated emission, and τ the luminescence lifetime.
In the steady state these equations are equal to zero, but because the sum of both populations is
equal to the total population, it is a determined set of equations and thus simplify to
tot1432
321 N
W1/W1/W
N
++
+=
ττ
tot1432
143 N
W1/WWN
++
=τ
(Eq. 7.A.2)
The absorption and emission rates W14 and W32 are calculated from the following
equations.
AhP
I ; IWp
pppa14 υ
σ ==
AhPI ; IW
s
ssse32 υ
σ == (Eq. 7.A.3)
Ip and Is are the photon densities of the pump and signal source and σa the absorption cross
section and σe the stimulated emission cross section. The photon densities are calculated from
the pump and signal power Pp and Ps, the light frequencies νp and νs, Planck’s constant h and the
cross section of the waveguide A. It would be better to use the exact overlap of the pump and
signal modes for the cross section, because the overlap of the pump and signal beams will be
smaller than the cross-section. The use of the cross-section of the waveguide in these calculation
leads to an overestimation of the actual gain.
The power of the signal and pump along the waveguide is given by:
dzNWdI 332s =
dzNWdI 114p = (Eq. 7.A.4)
These equations can be solved numerically using the values for the different parameters as
shown in Table 7.A.1. Different values for the PMMA and SU-8 device were used. The
absorption cross-section at 795 nm is about 0.6 of that at 578 nm and the emission cross-section
146
is taken the same for both polymers, although there will be a small influence of the refractive
index on the emission cross-section. The concentration of the nanoparticles in the SU-8
waveguides is twice as high as in the PMMA waveguide, resulting in a double Nd3+ ion
concentration. The dimensions of the SU-8 channel are also different. A luminescence lifetime of
200 µs was used for the Nd3+ ions. In chapter 3 the luminescence decay curve of the LaF3:Nd
nanoparticles was found to be bi-exponential with values for the luminescence lifetime of 240
(77 %) and 40 (23 %) µs were found. The average lifetime of these two is approximated to 200
µs.
Table 7.A.1: Parameters used in the optical gain calculation
Parameter Value 578 nm PMMA
waveguide
Value 795 nm SU-8
waveguide
Unit
Pp 12 5 mW
Ps 0.1 0.1 mW
σa 2.5 10-20 1.5 10-20 cm2
σe 5 10-21 5 10-21 cm2
λp 1319 1319 nm
λs 578 795 nm
τ 200 200 µs
Ntot 1.4 1019 2.8 1019 cm-3
Height 3.3 10 µm
Width 10 10 µm
The absorption cross-section at 795 nm was taken from the literature for Nd3+-doped in
LaF3.1 The absorpion cross-section at 578 nm was taken to be 1.7 times as high as the absorption
cross-section at 795 nm. The emission cross-section at 1319 nm was calculated from the
emission spectrum.2 The Nd3+ concentration corresponds to a nanoparticle concentration of 10
and 20 % for the PMMA and SU-8, respectively, taking into account 15 % by weight of organic
ligand around the nanoparticles.
147
7.A.2 References 1 Bhutta, T.; Chardon, A. M.; Shepherd, D. P.; Daran, E.; Serrano, C.; Yagüe, A. M. IEEE J. Quant.
Electron. 2001, 37, 1469. 2 Klunder, D. Photon physics in integrated optics microringresonators PhD thesis, University of
Twente, 2002.

149
Summary
The luminescence of lanthanide ions in organic environment is greatly reduced compared
to inorganic materials. This thesis describes the doping of the lanthanide ions in the core of
inorganic nanoparticles that are soluble in organic solvents as a way to shield the lanthanide ions
from the organic environment and thus to increase the luminescence properties.
The technological importance of lanthanide luminescence in optical amplifiers has been
outlined in chapter 1. The integration of optical components requires materials that can be
processed easily and at a low cost and polymers are materials that generally have these
properties. Optical amplifiers have to be developed for these polymer-based systems and the
luminescence of lanthanide ions in polymer environments has to be improved in order for these
ions to play a role.
In chapter 2 the luminescence of lanthanide ions in a variety of host materials is described.
It explains why lanthanide ions do not show efficient luminescence in organic materials, but are
efficient emitters in inorganic materials. The high-energy vibrations of the chemical bonds in
organic materials can take up the energy of an excited lanthanide ion very efficiently and thereby
quench the luminescence of the ions. In inorganic materials the vibrational energies are
substantially lower, making this process less efficient. Nanoparticles are materials with an
inorganic core that can be surrounded by organic ligands. These organic ligands can control the
growth of the nanoparticles during the synthesis and at the same time they can provide solubility
of the particles in organic solvents. Doping of lanthanide ions in the inorganic part of
nanoparticles would provide the lanthanide ion with an environment with low vibrational
energies, but the nanoparticles itself can be processed as organic materials.
The synthesis of these lanthanide-doped nanoparticles has been described in chapter 3.
Nanoparticles of LaF3, LaVO4, and LaPO4 that are soluble in organic solvents were successfully
doped with luminescent lanthanide ions. The visible emitting Eu3+ ion was used to characterize
the doping site of the lanthanide ion. The luminescence of the lanthanide ions indicates that the
ions are doped in the core of the nanoparticles and that the luminescence spectra are comparable
to the bulk materials. The shielding of the lanthanide ion from the organic environment is good,
because emissions of lanthanide ions are observed, that are usually quenched in organic
complexes. The luminescence decays of the ions are multi-exponential, so not all lanthanide ions
have the same probability of decay. The luminescence lifetimes indicate a high quantum yield
compared to organic complexes and bulk inorganic compounds. With the emissions of the NIR-
150
emitting nanoparticles doped with Nd3+, Er3+, Ho3+, and Pr3+ the entire telecommunications
window between 1300 and 1600 nm can be covered.
The luminescence decays of lanthanide ions doped in nanoparticles are not mono-
exponential. In chapter 4, several factors that are of influence on the decay time and the shape of
the decay curve have been identified. These factors include quenching by the solvent, the
refractive index of the solvent, and the concentration of the luminescent lanthanide ions. The
solvent is the most important source of quenching, causing the deviation from exponential
behavior. A model was developed for the fitting of the decay curves, taking into account both the
quenching from outside the nanoparticle and the distance of the luminescent ion to the surface of
the nanoparticle. The model gives a value for the luminescence lifetime without quenching from
outside the nanoparticles and a quenching constant determining the quenching strength of the
solvent or ligand. Using this model, concentration quenching and quenching from the solvent can
be described. In order to obtain more insight in the size-dependent luminescence properties,
nanoparticles with different sizes and with a narrow size distribution had to be prepared. The
sizes of the nanoparticles could be varied by changing the concentration of ligand used in the
synthesis or by size-selective precipitation. The luminescence lifetime of the lanthanide ions is
longer in the larger nanoparticles.
Chapter 5 describes methods to functionalize the surface of LaF3 and LaPO4 nanoparticles
with different ligands. Functionalization has an important influence on the solubility of the
nanoparticles, which is important for the processability of the system. The synthesis of core-shell
nanoparticles for LaF3 was successful, because the sizes of the nanoparticles are increased after
growing a shell of un-doped LaF3 around the original core. The luminescence properties of the
lanthanide ions in the core-shell nanoparticles have been improved compared to nanoparticles
without a core-shell structure, as follows from the increase in quantum yield of LaF3:Ce,Tb
nanoparticles and the increase in luminescence lifetime of the emissive levels of the Eu3+ ion.
The results show that it is possible to increase the distance between the quenchers coordinated to
the surface and the lanthanide ions by the growth of an inorganic shell around the luminescent
core.
In Chapter 6 the synthesis of lanthanide-doped semiconductor nanoparticles has been
described. Lanthanide-doped nanoparticles of TiO2 show energy transfer from the semiconductor
host to the lanthanide ions, for lanthanide ions emitting in the visible and in the NIR. The
quantum yield of the nanoparticles is low, although the intrinsic quantum yield of the lanthanide
ion is high. A LED with the nanoparticles does show diode like behavior, but no lanthanide
151
luminescence was observed, which is probably caused by the low quantum yield of the
nanoparticles.
Polymer waveguides doped with LaF3:Nd nanoparticles have been described in chapter 7.
The emission spectra of Nd3+ show that the nanoparticles are in the waveguides and the optical
losses of the waveguide indicate that the nanoparticles are not clustered and therefore have a
small contribution to scatter in the waveguide. For the PMMA waveguides an amplification of
0.3 dB at 1319 nm at a pump power of 12 mW was measured and for the SU-8 waveguides an
amplification of 0.1 dB at a pump power of only 5 mW was measured. Theoretical calculations
predict that increasing the confinement of the pump and signal beam and an increase in pump
power should lead to an amplification of 5.1 dB for a 5.7 by 5.7 µm2 channel, which is very
close to the amplification that is obtained in glass fiber amplifiers doped with Nd3+ under similar
experimental conditions. It has been shown theoretically that this amplification is due to the
increase in luminescence lifetime compared to organic complexes and that amplification with the
luminescence lifetimes of organic complexes is very limited. The use of these organically
soluble nanoparticles is therefore a major breakthrough over the use of lanthanide complexes as
the gain material in polymer hosts.

152
153
Samenvatting
De luminescentie van lanthanide-ionen in organische materialen is veel zwakker dan over
het algemeen in anorganische materialen wordt waargenomen. Dit wordt veroorzaakt door de
deactivering van het aangeslagen lanthanide-ion door hoog-energetische vibraties van de
chemische bindingen van organische moleculen. Dit proefschrift beschrijft het doteren van
lanthanide-ionen in de kern van anorganische nanodeeltjes als een manier om de lanthanide-
ionen af te schermen van de organische omgeving en op die manier de luminescentie-
eigenschappen van de ionen te verbeteren.
Het technologisch belang van lanthanide-ionen in optische versterkers staat beschreven in
hoofdstuk 1. Voor de integratie van optische componenten zijn materialen nodig die gemakkelijk
kunnen worden verwerkt en tegen lage kosten. Polymeren zijn materialen die deze
eigenschappen gewoonlijk bezitten. Optische versterkers zullen moeten worden ontwikkeld voor
polymeren om het mogelijk te maken deze geïntegreerde optische systemen van polymeren te
maken. De luminescente-eigenschappen van lanthanide-ionen in polymeren zullen moeten
worden verbeterd om deze ionen in polymere versterkers te kunnen gebruiken.
In hoofdstuk 2 is de luminescenctie van lanthanide-ionen in verschillende materialen
besproken. Er is uitgelegd waarom lanthanide-ionen geen efficiente luminescentie vertonen in
organische materialen, maar wel in anorganische materialen. De hoog-energetische vibraties van
de chemische bindingen in organische materialen kunnen de energie van een geëxciteerd
lanthanide-ion efficient opnemen en op die manier de luminescentie uitdoven. In anorganische
materialen zijn deze vibratie-energiën aanmerkelijk lager waardoor dit proces veel minder
efficient is. Nanodeeltjes zijn materialen met een anorganische kern die kunnen worden omringd
door organische liganden. Deze organische liganden kunnen de groei van de deeltjes reguleren
tijdens de synthese en op hetzelfde moment kunnen zij ervoor zorgen dat de deeltjes oplosbaar
worden in organische oplosmiddelen. Het doteren van lanthanide-ionen in de anorganische kern
van deze nanodeeltjes zorgt ervoor dat de lanthanide-ionen een omgeving hebben met lage
vibratie-energiën, maar tegelijkertijd kunnen de nanodeeltjes worden verwerkt als organische
materialen.
De synthese van deze lanthanide-gedoteerde nanodeeltjes staat beschreven in hoofdstuk 3.
Nanodeeltjes van LaF3, LaVO4 en LaPO4 die oplosbaar zijn in organische oplosmiddelen werden
succesvol gedoteerd met luminescente lanthanide-ionen. Het Eu3+ ion dat emitteerd in het
zichtbare deel van het spectrum werd gebruikt om de omgeving van het gedoteerde ion te
154
bestuderen. De luminescentie van dit ion leert ons dat het gedoteerde ion in de kern van het
nanodeeltje zit en dat de luminescentie spectra vergelijkbaar zijn met die van de bulk materialen.
Het afschermen van het lanthanide-ion is succesvol omdat emissies van lanthanide-ionen werden
geobserveerd die normaal gesproken worden uitgedoofd in organische complexen. De
levensduur van de luminescentie vertoond geen mono-exponentieel verval wat er op duidt dat
niet alle ionen dezelfde waarschijnlijkheid tot verval hebben. De luminescente levensduren laten
zien dat de lanthanide-ionen een hoge quantum opbrengst hebben in vergelijking met organische
complexen en bulk anorganische materialen. De emissies van de nabij-infrarood emitterende
Nd3+, Er3+, Ho3+ en Pr3+ gedoteerde nanodeeltjes kan het hele telecommunicatie-gebied
bestrijken.
Het verval van de luminescentie van lanthanide ionen gedoteerd in de nanodeeltjes is niet
mono-exponentieel. In hoofdstuk 4 zijn verschillende factoren onderzocht die een invloed
hebben op het verval van de lanthanide-ionen. Deze factoren zijn bijvoorbeeld deactivering door
het oplosmiddel, de invloed van de brekingsindex van het oplosmiddel en de concentratie van het
luminescerende lanthanide-ion in het nanodeeltje. Van al deze factoren bleek de deactivering
door het oplosmiddel de grootste invloed te hebben op het exponentiële verval van de
luminescentie. Er werd een model ontwikkeld waarmee de luminescentie-vervallen kunnen
worden gefit. Dit model houdt rekening met deactivering van het lanthanide-ion van buiten de
nanodeeltjes en met de afstand van het lanthanide-ion tot het oppervlak van het nanodeeltje. Het
model geeft een waarde voor de levensduur in afwezigheid van deactivering van buiten het
nanodeeltje en een deactiveringsconstante die de mate van deactivering van het lanthanide-ion
door organische groepen buiten het nanodeeltje weergeeft. Met dit model kunnen de deactivering
door het oplosmiddel en door de concentratie van lanthanide-ionen in het deeltje worden
beschreven. De afhankelijkheid van de luminescentie-eigenschappen van de deeltjesgrootte werd
bestudeerd door verschillende deeltjes groottes te synthetiseren. Er werd een duidelijke
afhankelijkhied van de luminescente levensduur van de deeltjes grootte gevonden met de langste
levensduur voor de grootste deeltjes.
In hoofdstuk 5 staan verschillende methoden beschreven om het oppervlak van de LaF3 en
LaPO4 nanodeeltjes te functionalizeren met verschillende liganden. Het oppervlak van de
nanodeeltjes bepaald de oplosbaarheid en controle over de oplosbaarheid is belangrijk voor de
verwerking van de nanodeeltjes. De synthese van kern-schil deeltjes is beschreven als een
manier om de interactie van lanthanide-ionen in het deeltje met deactiverende groepen buiten het
deeltje nog meer te verkleinen. De luminescente lanthanide-ionen werden alleen gedoteerd in de
kern en daaromheen werd een schil van niet gedoteerd anorganisch material gegroeid. Deze
155
methode was succesvol want de grootte van de deeltjes nam toe na het groeien van de schil rond
de kern en de luminescente eigenschappen van de lanthanide-ionen in de kern verbeteren. De
quantum opbrengst van LaF3Ce,Tb nanodeeltjes werd verhoogd en de levensduren van de
emitterende niveau’s van Eu3+ werden verlengd. Deze resultaten tonen aan dat de afstand tussen
het luminescerende lanthanide-ion en de deactiverende groepen die aan het oppervlak van de
deeltjes zijn gecoordineerd vergroot kan worden.
In hoofdstuk 6 staat de synthese van lanthanide-gedoteerde halfgeleidernanodeeltjes
beschreven. In TiO2 nanodeeltjes werd energie overdracht van het halfgeleider material naar het
lanthanide-ion geobserveerd voor lanthanide-ionen emitterend in het zichtbare en in het nabij-
infrarood. De quantum opbrengst van deze nanodeeltjes is laag, hoewel de intrinsieke quantum
opbrengst van het lanthanide-ion wel hoog is. Een licht-emitterende diode (LED) met deze
nanodeeltjes als luminescent material werd gemaakt en deze gedroeg zich als een diode als er
een voltage over werd gezet. Er werd echter geen lanthanide-luminescentie waargenomen,
waarschijnlijk door de lage quantum opbrengst van de nanodeeltjes.
Polymere golfgeleiders met LaF3:Nd nanodeeltjes staan beschreven in hoofdstuk 7. De
emissiespectra van de Nd3+ ionen laten zien dat de nanodeeltjes in de golfgeleider zitten en de
beperkte optische verliezen van de golfgeleider tonen aan dat de nanodeeltjes niet geclusterd zijn
en slechts een kleine bijdrage leveren aan lichtverstrooing in de golfgeleider. Met PMMA
golfgeleiders werd een versterking van 0.3 dB gemeten bij 1319 nm bij een pompvermogen van
12 mW en met SU-8 golfgeleiders werd een versterking van 0.1 dB gemeten bij een
pompvermogen van slechts 5 mW. Theoretische berekeningen tonen aan dat bij hogere
pompvermogens en kleinere golfgeleiders, een versterking van 5.1 dB in een 5.7 bij 5.7 µm2
golfgeleider mogelijk moet zijn. Dit is een bijna even grote versterking als gemeten voor een
glasvezel onder deze experimentele omstandigheden. Er werd bovendien aangetoond dat deze
versterking slechts mogelijk is gemaakt door de toename in de levensduur van het Nd3+ ion door
het in de nanodeeltjes te doteren. Het gebruik van deze nanodeeltjes geeft dus een belangrijk
voordeel boven het gebruik van organische complexen als versterkend medium in polymere
materialen.

156
157
Dankwoord
Voor je het weet zijn er al weer vier jaar voorbij en is het aio-schap al weer voorbij.
Zonder de hulp van anderen zou dit boekje er heel anders hebben uitgezien, dus wordt het nu tijd
om een aantal mensen voor hun bijdrage te bedanken.
David Reinhoudt wil ik bedanken omdat hij mij de mogelijkheid heeft gegeven te
promoveren in zijn groep. Hoewel het onderwerp niet jouw directe voorkeur had, heb je toch
altijd met veel interesse mijn werk gevolgd. De grote verscheidenheid aan apparatuur
beschikbaar in de groep en in het MESA+ instituut hebben het mogelijk gemaakt om een breed
onderwerp als dit toch uit te voeren.
Frank van Veggel wil ik bedanken omdat hij mij het vertrouwen heeft gegeven mij aan te
nemen op zijn project. Ik heb je begeleiding altijd als zeer prettig ervaren omdat ik een grote
mate van zelfstandigheid van je heb gekregen. Het was een verrassing toen je anderhalf jaar
geleden vertelde dat je naar Canada zou gaan, maar ook over lange afstand was je altijd
makkelijk bereikbaar.
Gerald Hebbink bedank ik voor de samenwerking die we hebben gehad in het begin van
het project. Hij heeft mij veel geleerd over lanthanide-luminescentie, waar ik mij oorspronkelijk
helemaal niet mee bezig zou gaan houden. Met jouw kennis van de lanthaniden hebben we
samen snel een begin kunnen maken met deze nanodeeltjes.
Voor het meten van de levensduren van de nabij-infrarood emitterende lanthanide-ionen
was de hulp van Albert Polman, Jeroen Kalkman en Michiel de Dood van het Amolf instituut in
Amsterdam heel belangrijk. Bedankt voor de gastvrijheid die jullie altijd getoond hebben.
Alfred Driessen van de LDG groep bedank ik voor het vertrouwen dat hij had in de
materialen die ik heb gemaakt, wat tot enkele samenwerkingen heeft geleid. Eerst was er de
samenwerking met Dion Klunder en Vincent Kuiper met de microringresonatoren. Dit was voor
mij een zeer nuttige ervaring omdat dit de eerste keer was dat we polymeerlagen hebben
gemaakt, gedoteerd met nanodeeltjes. Later heeft Albert Borreman heel veel geholpen met de
metingen aan mijn eigen golfgeleiders: onmeunig bedankt daarvoor. Deze mensen en anderen
van de LDG groep bedankt voor deze prettige tijd. Belangrijk bij deze metingen was ook de hulp
van Liviu Prodan van de laser physica groep met de 795 nm pomplaser die cruciaal bleek te zijn
voor de metingen aan de gedoteerde SU-8 polymere golfgeleiders.
Léon Woldering heeft een hoop cleanroomwerk gedaan dat ook voor mijn onderzoek zeer
belangrijk was. Deze kennis die jij in de cleanroom hebt opgebouwd, heeft mij in het begin heel
veel geholpen.
158
Mark Brouwer en Marcel de Bruine: bedankt voor het toeleveren van alles wat er in een
lab nodig is. Voor de analyse en karakterisering van mijn produkten wil ik Tieme Stevens
(massa), Hannie Visser (NMR), Annemarie Montanaro (EA), Louise Vrielink (XRF) en Rico
Keim en Mark Smithers (TEM) bedanken. Carla, Rita en Izabel ben ik dankbaar voor alle
administratieve ondersteuning.
Dan moet ik natuurlijk nog een heleboel mensen bedanken die in dezelfde periode hier
aanwezig waren als ik. Ik zal geen poging doen om ze allemaal bij naam te noemen, maar
iedereen die ik heb kunnen lastig vallen met vragen en iedereen die voor gezelligheid op het lab,
in de koffiekamer en tijdens volleybal en voetbalwedstrijden heeft gezorgd, bedank ik voor deze
mooie tijd! Zeker de mensen die altijd dicht bij me in de buurt hebben gestaan en moesten leven
met het valse gezing en gefluit van mijn kant.
Léon en Emiel zullen op de grote dag naast mij op het podium staan als mijn paranimfen
waarvoor ik ze alvast hartelijk wil bedanken.
Dan wil ik nog mijn familie bedanken voor de steun en de interesse in mijn onderzoek. In
het bijzonder wil ik Siebe bedanken voor het ontwerpen van de voorkant van mijn boekje.
Nathalie als laatste en belangrijkste persoon in mijn leven: bedankt voor de liefde en
morele steun tijdens deze vier jaar en dat je voor mijn werk in Tukkerland hebt willen wonen.
159
Curriculum Vitae
Wiljan Stouwdam werd geboren op 29 december 1974 in Ijsselmuiden. Na het VWO aan
het Emelwerda college in Emmeloord begon hij in 1993 aan de studie scheikunde aan de
Rijksuniversiteit Groningen. Het hoofdvakonderzoek werd gedaan in de groep van prof. dr. J. B.
F. N. Engberts. Hier werd gewerkt aan de synthese en de bestudering van de aggregatie vormen
van een lipide. Na het hoofdvakonderzoek heeft hij in 1999 een onderzoeksstage gedaan bij
Unilever Research bij de afdeling vloeibare wasmiddelen in Vlaardingen. Hier werd gewerkt aan
de binding van calcium aan de verschillende surfactants die in de wasmiddelen worden gebruikt.
In januari 2000 begon hij aan zijn promotie-onderzoek in de vakgroep Supramoleculaire
Chemie en Technology onder leiding van prof. dr. ir. D. N. Reinhoudt en dr. ir. F. C. J. M. van
Veggel aan de Universiteit Twente. Tijdens dit onderzoek werd gewerkt aan het verbeteren van
de optische eigenschappen van lanthanide-ionen in organische materialen voor gebruik in
polymere optische versterkers. De resultaten van dit onderzoek staan beschreven in dit
proefschrift. Hij zal na zijn promotie als post-doc gaan werken aan de universiteit van Victoria,
Canada, waar hij zal werken in de groep van prof. dr. ir. F. C. J. M. van Veggel aan optische
materialen voor fotonische kristallen.