marasmo kwa
TRANSCRIPT

8/9/2019 Marasmo Kwa
http://slidepdf.com/reader/full/marasmo-kwa 1/14
Prote in EnergyMalnutri t ion
Zubin Grover, MBBS, MD * , Looi C. Ee, MBBS, FRACP
The World Health Organization (WHO) defines malnutrition as ‘‘the cellular imbalance
between the supply of nutrients and energy and the body’s demand for them toensure growth, maintenance, and specific functions.’’ 1 Although malnutrition isa state of deficiency or excess of energy, protein, and other nutrients, this articledeals with undernutrition and specifically protein energy malnutrition (PEM). Childrenwith primary PEM generally are found in developing countries as a result of inade-quate food supply caused by socioeconomic, political, and occasionally environ-mental factors such as natural disasters. Among the four principal causes of mortality in young children worldwide, undernutrition has been ascribed to be thecause of death in 60.7% of children with diarrheal diseases, 52.3% of tho s e withpneumonia, 44.8% of measles cases, and 57.3% of children with malaria. 2 Morethan 50% of all the childhood deaths are attributable to undernutrition, with relativerisks of mortality being 8.4 for severe malnutrition, 4.6 for moderate malnutrition, and2.5 for mild malnutrition as estimated by analyses of 28 epidemiologic studies doneacross 53 countries. 3–5 Most of the deaths (> 80%) occur among those with mild ormoderate malnutrition (weight for age 60% to 80%). This is explained by the fact thatalthough the risk of death is greatest for those with severe malnutrition, theseextreme cases only make up a small fraction of total number of children withmalnutrition. 3,5
Malnutrition in the developed world is not rare, but its prevalence and importanceoften are underappreciated. Several studies using various measures of malnutritionhave reported a prevalence of between 6% and 51% of hospitalized children in devel-oped nations. 6–9 The genesis of secondary malnutrition in the developed world may beattributed to abnormal nutrient loss, increased energy expenditure, or decreased foodintake, frequently in the context of associated chronic diseases like cystic fibrosis,chronic renal failure, childhood malignancies, congenital heart disease, and neuro-muscular diseases.
Department of Gastroenterology, Royal Children’s Hospital, Herston Road, Brisbane,Queensland 4029, Australia* Corresponding author.E-mail address: [email protected] (Z. Grover).
KEYWORDS
Protein energy malnutrition Pediatrics
Pediatr Clin N Am 56 (2009) 1055–1068doi:10.1016/j.pcl.2009.07.001 pediatric.theclinics.com0031-3955/09/$ – see front matter ª 2009 Elsevier Inc. All rights reserved.

8/9/2019 Marasmo Kwa
http://slidepdf.com/reader/full/marasmo-kwa 2/14
EPIDEMIOLOGY
According to the United Nations Children’s Fund (UNICEF), PEM is an invisible emer-gency much like the tip of an iceberg, where its deadly consequences are hidden fromview. In 2005, 20% of children younger than 5 years in low-to-middle income countries
were estimated to be underweight (weight for age z-score < 2), while 32% (178million) children younger than 5 years in developing countries were estimated to bestunted (height for age z score < 2).10 The highest prevalence of stunting was incentral Africa and south-central Asia, although the largest numbers of children, 74million, live in southern Asia. 10 Worldwide, only 36 countries account for 90% of allstunted children when countries with stunting prevalence of at least 20% were consid-ered. 10 India alone has 34% of the world’s stunted children because of its large pop-ulation, although there is significant variation between its states. The global estimate of wasting (weight for height z score < 2) is 10%, with south-central Asia estimated tohave the highest prevalence and total number affected, 16% and 29 million respec-
tively. Sub-Saharan Africa has about 25% of the world’s underweight children youngerthan 5 years of age, with Congo, Ethiopia, and Nigeria being the nations affectedworst.
In 1990, the World Summit for Children announced key requirements for improvingchild health and nutrition. Subsequently, the United Nations incorporated this into itsfirst Millennium Goal in September 2000. A key target for MDG1 (Millennium Develop-ment Goal 1) is to halve the proportion of people who suffer from hunger between 1990and 2015. Unfortunately, despite progress in reducing the prevalence of undernutri-tion, the current rate of decline is not fast enough to reach this target for most of the world except for Latin America and the Caribbean, Pacific, and eastern Asia. In Africa, the number of underweight children was forecasted to increase because of political a nd s ocial instability and the acquired immunodeficiency syndrome (AIDS)epidemic. 11,12
MALNUTRITION IN THE DEVELOPED WORLD
Several reports from Germany, the United Kingdom, the United States, and France asrecently as the last decade reported the prevalence of acute malnutrition in hospital-ized pediatric patients to be between 6.1% and 24%. 6,7,9 In 2008, Pawellek andcolleagues, 7 using Waterlow’s criteria, reported 24.1% of patients in a tertiary pedi-
atric hospital in Germany to be malnourished (<90th percentile weight for height), of which 17.9% were mild, 4.4% moderate, and 1.7% severely malnourished. The prev-alence of malnutrition varied depending on their underlying medical conditions andranged from 40% in patients with neurologic diseases, to 34.5% in those with infec-tious disease, 33.3% in those with cystic fibrosis, 28.6% in those with cardiovasculardisease, 27.3% in oncology patients, and 23.6% in those with gastrointestinaldiseases. 7 Patients with multiple diagnoses were most likely to be malnourished(43.8%). The prevalence and degree of acute PEM in hospitalized pediatric patientsare similar to those observed by Hendricks and colleagues 9 almost a decade agousing the same criteria.
Secker and colleagues 8 used subjective global nutritional assessment in childrenadmitted for elective surgery in a tertiary referral pediatric hospital in Toronto andfound that 51% of children were malnourished (36% had moderate malnutrition,and 15% had severe malnutrition). Despite differences in methods of assessingmalnutrition, these studies clearly document a significant prevalence of malnutritioneven in the developed world, particularly in hospitalized pediatric patients. Theseresults may be skewed, because most of the reports have been from tertiary centers
Grover & Ee1056

8/9/2019 Marasmo Kwa
http://slidepdf.com/reader/full/marasmo-kwa 3/14
with relatively larger proportions of patients with chronic and severe disorders. A cross-sectional study on patients attending outpatient clinics in Brazil, however,reported an overall prevalence of underweight, stunting, and wasting as 14.3%,17.3%, and 4.4%, resp ec tively, with reference to National Center for Health Statistics(NCHS) growth curves. 13
One of the difficulties in being able to compare prevalence between studies andcenters is the lack of consensus on a uniform definition of malnutrition and its gradesof severity. A recent review highlighted the issues of lack of uniform screening tools,poor nutritional data collection, and early identification of those at risk of developingPEM. 6
DEFINITION
There remains muchvariation and controversy as to the best and most useful method of
assessing and defining malnutrition. In 1956, Gomez introduced a classification basedon weight below a specified percentage of median weight for age. 14 Seoane and Lath-am then proposed calculating weight for height and height for age as a means to distin-guish between wasting and stunting. 15 Wasting, where weight for height is reduced, isindicative of acute growth disturbance from malnutrition, whereas stunting, whereheight for age is reduced is more suggestive of chronic malnutrition with faltering of long-term growth. 16 In 1977, Waterlow recommended the use of z-scores and SDsbelow the median to define underweight, wasting, and stunting. 17,18 These definitionscontinue to be used widely with subsequent WHO modifications. WHO adopted theUS National Center for Health Statistics (NCHS) classification in 1983 as the interna-
tional reference for weight and height in children. It has since been used to classify chil-dren as underweight, wasted, or stunted based on z-scores. 19–21 The major issues withusing NCHS criteria as the population standard are the extrapolation from an ethnicallyhomogenous population, which likely does not represent developing world countries,inclusion of bottle-fed infants, and the assumption that all children of a given heightwill have the same average weight regardless of age. In 2006, a new population stan-dard was adopted by WHO based on an international multicenter study using exclu-sively breast-fed children of diverse ethnic backgrounds. 22 Subsequent studies havehighlighted that these new WHO growth reference curves will result in a highermeasured prevalence of malnutrition when compared with NCHS standards. 23,24
An alternative proposed approach to assessing malnutrition is to measure mid-upper arm circum ference (MUAC) as a proxy for weight, and head circumference asa proxy for height. 25 This may be useful when accurate measures of height and weightare unavailable, particularly in children younger than 3 years and also in small regionalcenters. The degree of malnutrition is calculated by dividing the MUAC by occipito-frontal head circumference. The use of MUAC and presence of edema have been re-ported to be better indicators than we ight for height (either NCHS or WHO) for casedefinition of severe acute malnutrition. 26 There is significant evidence indicating thatusing MUAC less than 110 mm as a definition for severe malnutrition may be thebest method to assess nutrition in terms of age independence, simplicity, accuracy,specificity, and sensitivity. Additionally, it is a good anthropometric predictor of mortality related to malnutrition. 26–31 Although the evidence favors use of MUAC forestimating malnutrition and for admission to therapeutic feeding programs, more infor-mation is needed on the use of MUAC as a discharge and follow-up tool.
More recently, a new definition of thinness has been proposed by Cole, 32 whoperformed meta-analyses on population studies from six high- and middle-incomecountries, with a total of 192,727 subjects, whose ages ranged from 0 to 25 years.
Protein Energy Malnutrition 1057

8/9/2019 Marasmo Kwa
http://slidepdf.com/reader/full/marasmo-kwa 4/14
He proposed using body mass index for age to grade thinness according to age asa method of assessing malnutrition. This methodology, however, has not been testedin population studies, and its validity in predicting morbidity is unknown.
A summary of the several different methods of assessing malnutrition is shown inTable 1 .
CLINICAL SYNDROMES
The two main clinical syndromes of the extreme forms of PEM are marasmus andkwashiorkor, although a mixed picture also is seen frequently. These are differentiatedon the basis of clinical findings, with the primary distinction between kwashiorkor andmarasmus being the presence edema in kwashiorkor.
MarasmusMarasmus, the more common syndrome, is characterized clinically by depletion of subcutaneous fat stores, muscle wasting, and absence of edema. It results from thebody’s physiologic adaptation to starvation in response to severe deprivation of calo-ries and all nutrients. It most commonly occurs in children younger than 5 yearsbecause of their increased caloric requirements and increased susceptibility to infec-tions. These children often appear emaciated, are weak and lethargic, and have asso-ciated bradycardia, hypotension, and hypothermia. Their skin is xerotic, wrinkled, andloose because of the loss of subcutaneous fat but is not characterized by any specificdermatosis. Muscle wasting often starts in the axilla and groin, then thigh andbuttocks, followed by chest and abdomen, and finally the facial muscles, which aremetabolically less active. The loss of buccal fat pads commonly gives the child anappearance of monkey-like or aged facies in severe cases ( Fig. 1 ). Severely affected
Table1Definitions of malnutrition
Classification Definition Grading
Gomez Weight below %median WFA
Mild (grade 1)Moderate (grade 2)Severe (grade 3)
75%–90% WFA60%–74% WFA<60% WFA
Waterlow z-scores (SD) belowmedian WFH
MildModerateSevere
80%–90% WFH70%–80% WFH<70% WFH
WHO (wasting) z-scores (SD) belowmedian WFH
ModerateSevere
3% z-score < 2z-score < 3
WHO (stunting) z-scores (SD) belowmedian HFA
ModerateSevere
3% z-score < 2z-score < 3
Kanawati MUAC divided byoccipitofrontal headcircumference
MildModerateSevere
<0.31<0.28<0.25
Cole z-scores of BMI for age Grade 1Grade 2Grade 3
BMI for age z-score < 1BMI for age z-score < 2BMI for age z-score < 3
Abbreviations: BMI, body mass index; HFA, height for age; MUAC, mid-upper arm circumference;NCHS, US National Center for Health Statistics; SD, standard deviation; WFA, weight for age; WFH,weight for height; WHO, World Health Organization.
Grover & Ee1058

8/9/2019 Marasmo Kwa
http://slidepdf.com/reader/full/marasmo-kwa 5/14
children are often apathetic but become irritable and difficult to console whenhandled.
Kwashiorkor
The term kwashiorkor, which first was introduced by Cicely D. Williams in 1935, 33 istaken from the Ga language of Ghana and means the sickness of the weaning. Kwash-iorkor tends to occur mainly in older infants and young children, and results from a dietwith inadequate protein but reasonably normal caloric intake, often exacerbated by
superimposed infection. A common scenario is when the older infant or toddler isdisplaced from breastfeeding by the birth of a younger sibling and has to wean rapidlybut is unable to increase protein intake adequately. The clinical picture is character-ized by almost normal weight for age, marked generalized edema, dermatoses, hypo-pigmented hair, distended abdomen, and hepatomegaly (see Fig. 2 ). The term sugarbaby also has been used to describe these children, as their typical diet is low inprotein but high in carbohydrate. Edema usually results from a combination of lowserum albumin, increased cortisol, and inability to activate antidiuretic hormone.Hair is usually dry, sparse, brittle, and depigmented, appearing reddish yellow. Withadequate protein intake, hair color is restored and may result in alternating bands of pale and normal-colored hair, also known as the flag sign, reflecting periods of poorand good nutrition. Cutaneous manifestations are characteristic and progress overdays from dry atrophic skin with confluent areas of hyperkeratosis and hyperpigmen-tation, which then splits when stretched, resulting in erosions and underlying paler,erythematous skin. These patchy areas of dark and pale skin give the impression of crazy paving or flaky paint, particularly over limbs and buttocks. Various skin changesin children with kwashiorkor include: shiny, varnished-looking skin (64%), dark
Fig. 1. Marasmus with wasting, loss of subcutaneous tissue, and old man’s facies. Courtesy of Tom D. Thacher, MD, Rochester, MN.
Protein Energy Malnutrition 1059

8/9/2019 Marasmo Kwa
http://slidepdf.com/reader/full/marasmo-kwa 6/14
erythematous pigmented macules (48%), xerotic crazy paving skin (2 8%), residualhypopigmentation (18%), and hyperpigmentation and erythema (11%). 34
Marasmic Kwashiorkor
A child with marasmic kwashiorkor presents with a mixed picture with features of bothmarasmus and kwashiorkor. Characteristically, these children have concurrent grosswasting and edema and frequently are stunted. They usually have mild hair and skinchanges and an enlarged palpable fatty liver.
PATHOPHYSIOLOGYAND ADAPTATION
Inadequate energy intake leads to various physiologic adaptations, including growthrestriction; loss of fat, muscle, and visceral mass; reduced basal metabolic rate,and reduced total energy expenditure. The biochemical changes in prolonged starva-tion involve complex metabolic, hormonal, and glucoregulatory mechanisms. Meta-bolic changes progress from the early phase, where there is rapid gluconeogenesiswith resultant loss of skeletal muscle caused by use of amino acids, pyruvate andlactate, to the later protein conservation phase, with fat mobilization leading tolipolysis and ketogenesis. Major electrolyte changes including sodium retention andintracellular potassium depletion can be explained by decreased activity of glyco-side-sensitive energy-dependent sodium pump to increased permeability of cellmembranes in kwashiorkor. 35
Some studies suggest that marasmus represents an adaptive response to starva-tion, while kwashiorkor is a maladaptive response. Aflatoxins have been proposedto have a role in the pathogenesis of kwashiorkor. 36 Reactive oxygen species also
Fig. 2. Kwashiorkor with edema and abdominal distension. Courtesy of Tom D. Thacher, MD,Rochester, MN.
Grover & Ee1060

8/9/2019 Marasmo Kwa
http://slidepdf.com/reader/full/marasmo-kwa 7/14
have been postulated to have a role in its pathogenesis. 37 This is supported by theobservation that supplementation with N-acetylcysteine, a free radical scavenger,leads to more rapid resolution of signs and symptoms and improved erythrocyte gluta-thione levels. 38
ALTERATIONS IN ORGAN SYSTEMSEndocrine System
The main hormones affected are the thyroid hormones, insulin, and growth hormone.Changes include reduced levels of tri-iodothyroxine (T 3 ), insulin, insulin-like growthfactor-1 (IGF-1), and raised levels of growth hormone and cortisol. Glucose levelsare often initially low, with depletion of glycogen stores. Patients frequently alsodevelop some degree of glucose intolerance of unclear etiology and are at risk of profound hypoglycemia during the renourishment phase.
Immune SystemCellular immunity is affected most because of atrophy of the thymus, lymph nodes,and tonsils. Changes include reduced CD4 but relatively preserved CD8-T lympho-cytes, loss of delayed hypersensitivity, impaired phagocytosis, and reduced secretoryimmunoglobulin A (IgA). These changes increase the susceptibility of malnourishedchildren to invasive infections.
Gastrointestinal System
Villous atrophy with resultant loss of disaccharidases, crypt hypoplasia, and altered
intestinal permeability results in malabsorption, but losses often rapidly recoveronce nutrition is improved. Bacterial overgrowth is common with reduced gastricacid secretion. Pancreatic atrophy is also common and results in fat malabsorption. Although fatty infiltration of the liver is common, synthetic function usually ispreserved. Protein synthesis, gluconeogenesis, and drug metabolism are decreased.
Cardiovascular System
Cardiac myofibrils are thinned with impaired contractility. Cardiac output is reducedproportionate to weight loss. Bradycardia and hypotension are also common in theseverely affected. Intravascular volume frequently is decreased. The combination of bradycardia, impaired cardiac contractility, and electrolyte imbalances predisposethese children to arrhythmias.
Respiratory
Reduced thoracic muscle mass, decreased metabolic rate, and electrolyte imbal-ances (hypokalemia and hypophosphatemia) may result in decreased minute ventila-tion, leading to impaired ventilatory response to hypoxia.
Neurologic
Specific neurodevelopmental sequelae attributable to just PEM are difficult to ascer-tain, as PEM frequently coexists with other nutritional deficiencies. Malnutrition hasbeen recognized to cause reductions in the numbers of neurons, synapses, dendriticarborizations, and myelinations, all of which result in decreased brain size. 39 The cere-bral cortex is thinned and brain growth slowed. Delays in global function, motor func-tion, and memory have been associated with PEM, with neonates and infants beingmost susceptible despite the plasticity of the infant’s brain. 39
Protein Energy Malnutrition 1061

8/9/2019 Marasmo Kwa
http://slidepdf.com/reader/full/marasmo-kwa 8/14
Hematological
Normochromic anemia is often present but can be exacerbated by other nutrient (ironand folate) deficiencies and infections such as malaria or other parasitic infections.Blood clotting usually is preserved.
CLINICAL FINDINGS
Malnutrition has the potential to affect all organ systems in the body. Initially, clinicalfindings include lack of adiposity and subcutaneous tissue, poor muscle bulk, irrita-bility, and edema. As malnutrition progresses, growth is delayed, leading to stunting,and other systems become involved, with changes in hair, skin, nails, mucousmembranes, and other organs. Micronutrient deficiencies, particularly deficienciesof vitamins and minerals, are common in malnourished patients, so many patientsalso will exhibit signs of these deficiencies. The most commonly reported micronu-trient deficiencies are of iron, zinc, iodine, and vitamin A. 40 Deficiencies of other micro-nutrients, however, including calcium, vitamin D, vitamin C, folic acid, thiamine, andriboflavin are increasingly being recognized. A summary of the clinical findings inPEM is shown in Table 2 .
LABORATORY INVESTIGATIONS
Laboratory investigations can be useful to identify deficiencies before clinical symp-toms develop, confirm deficiencies associated with specific disease states, and
monitor recovery from malnutrition. The most useful tests in assessing nutritional stateare hemoglobin and red cell indices, and serum albumin. Electrolytes, specificallypotassium, magnesium, and phosphate, should be monitored closely in the earlytreatment phase to avoid refeeding syndrome. WHO recommends performing thefollowing tests in malnourished children: blood glucose, hemoglobin and blood smear,electrolytes, serum albumin, urine microscopy and culture, stool microscopy andculture including for parasites, and human immunodeficiency virus testing. 41 Specifictesting should be directed by the history and physical examination.
Complete blood cell count measuring hemoglobin, red cell indices, and blood film ishelpful to demonstrate anemia, which is usually normochromic but can be microcytic
from iron deficiency. Blood film can identify malarial parasites, if appropriate. Addi-tional testing including iron studies, vitamin B 12 , and folic acid measurements arealso useful when assessing for deficiencies.
Biochemical testing is useful in determining hypoglycemia; electrolyte imbalances,particularly of sodium, potassium, phosphate, magnesium, and protein stores withserum albumin and prealbumin levels. Fat-soluble vitamin measurement may be indi-cated if there is evidence of malabsorption.
Culture and microscopy of urine and stool are important, as concurrent infectionsare common in malnourished children. If clinically indicated, blood cultures andlumbar puncture also may be necessary. Other additional tests such as QuantiFERONtesting for tuberculosis, celiac serology, sweat test, and thyroid function testing alsomay be warranted depending on history and physical examination.
Radiology and other imaging studies are often unnecessary but may be performed if clinically indicated. Skeletal radiographs maybe useful in assessing bone age and de-tecting early evidence of scurvy or rickets. Body composition testing, including airdisplacement plethysmography, bioimpedance analysis, dual energy x-ray absorpti-ometry (DEXA), and total body potassium are potentially helpful in identifying lean
Grover & Ee1062

8/9/2019 Marasmo Kwa
http://slidepdf.com/reader/full/marasmo-kwa 9/14
mass or lack of it in malnourished patients. These investigations, however, areexpensive, require highly specialized equipment, and are done in the research setting.
MANAGEMENT
WHO has developed guidelines for managing severe malnutrition. 41 These guidelines,with some adaptation to local conditions, have been demonstrated to reduce casefatality rates when administered in Bangladesh, Africa, and South America. 42–48 Infec-
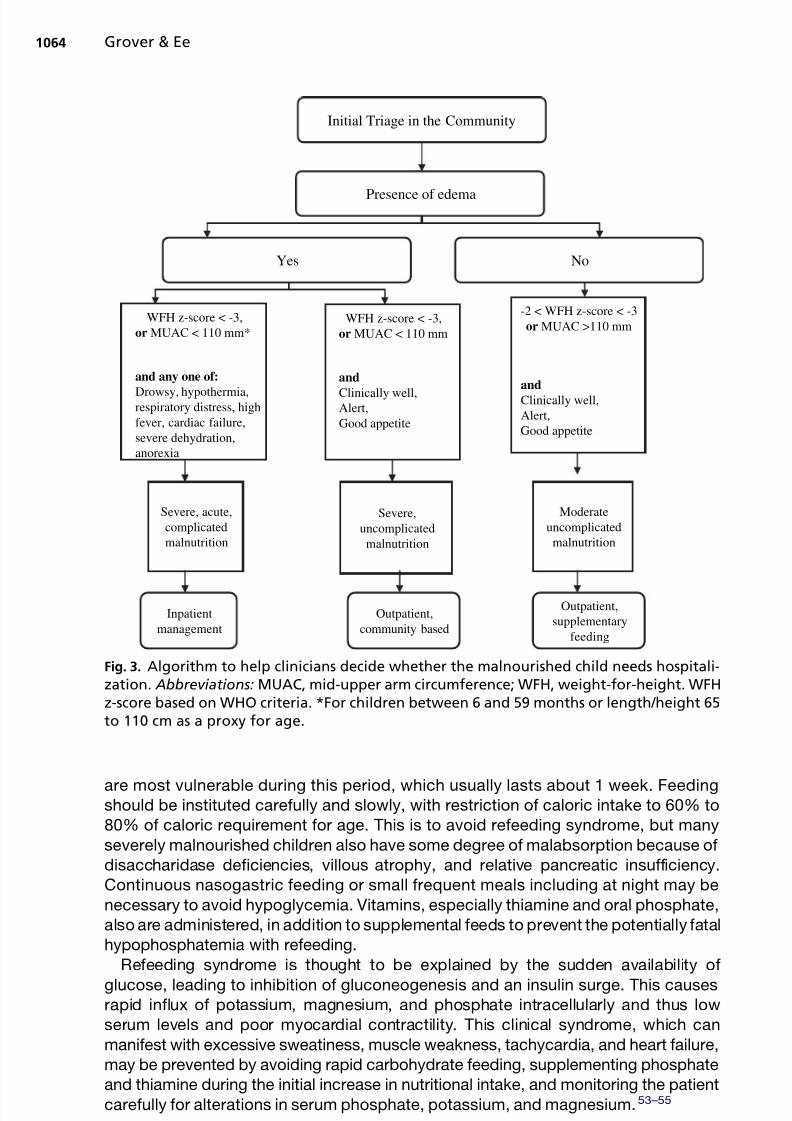
tion and sepsis continue to be the main causes of death in severe acute malnutrition,although other causes include dehydration, electrolyte imbalances, and heartfailure. 42,47,49 Death also can occur once treatment is instituted because of refeedingsyndrome with its associated electrolyte and metabolic changes. The decision as towhether to treat in the hospital or community depends on the patient’s clinical condi-tion and availability of resources. Controlled trials show that community- or home-based management for children with uncomplicated acut e severe malnutrition resultsin equivalent or superior outcomes to hospital care. 50,51 The authors have adoptedalgorithm suggested by Collins and colleagues to help clinicians decid e whether themalnourished child can be managed at home or in the hospital ( Fig. 3 ).52
WHO has formulated a three-phase management approach, where the patientinitially is resuscitated and stabilized (phase 1), before starting nutritional rehabilitation(phase 2), and eventual follow-up and recurrence prevention (phase 3).
Phase 1: Resuscitate and Stabilize
The main aim during this phase is to resuscitate, rehydrate, treat infections, preventsepsis, and monitor closely to avoid developing complications of treatment. Patients
Table 2Clinical signs of malnutrition
Site Signs
Face Moon face (kwashiorkor), simian facies (marasmus)
Eye Dry eyes, pale conjunctiva, Bitot’s spots (vitamin A), periorbital edemaMouth Angular stomatitis, cheilitis, glossitis, spongy bleeding gums (vitamin C),
parotid enlargementTeeth Enamel mottling, delayed eruptionHair Dull, sparse, brittle hair, hypopigmentation, flag sign (alternating bands
of light and normal color), broomstick eyelashes, alopecia.Skin Loose and wrinkled (marasmus), shiny and edematous (kwashiorkor), dry,
follicular hyperkeratosis, patchy hyper- and hypopigmentation (crazypaving or flaky paint dermatoses), erosions, poor wound healing
Nail Koilonychia, thin and soft nail plates, fissures or ridgesMusculature Muscle wasting particularly buttocks and thighs. Chvostek or Trousseau
signs (hypocalcemia)Skeletal Deformities usually a result of calcium, vitamin D or vitamin C deficienciesAbdomen Distended—hepatomegaly with fatty liver; ascites may be presentCardiovascular Bradycardia, hypotension, reduced cardiac output, small vessel
vasculopathyNeurologic Global developmental delay, loss of knee and ankle reflexes, impaired
memoryHematological Pallor, petechiae, bleeding diathesis
Behavior Lethargic, apathetic, irritable on handling
Protein Energy Malnutrition 1063
8/9/2019 Marasmo Kwa
http://slidepdf.com/reader/full/marasmo-kwa 10/14
are most vulnerable during this period, which usually lasts about 1 week. Feedingshould be instituted carefully and slowly, with restriction of caloric intake to 60% to80% of caloric requirement for age. This is to avoid refeeding syndrome, but manyseverely malnourished children also have some degree of malabsorption because of disaccharidase deficiencies, villous atrophy, and relative pancreatic insufficiency.Continuous nasogastric feeding or small frequent meals including at night may benecessary to avoid hypoglycemia. Vitamins, especially thiamine and oral phosphate,also are administered, in addition to supplemental feeds to prevent the potentially fatalhypophosphatemia with refeeding.
Refeeding syndrome is thought to be explained by the sudden availability of glucose, leading to inhibition of gluconeogenesis and an insulin surge. This causesrapid influx of potassium, magnesium, and phosphate intracellularly and thus lowserum levels and poor myocardial contractility. This clinical syndrome, which canmanifest with excessive sweatiness, muscle weakness, tachycardia, and heart failure,may be prevented by avoiding rapid carbohydrate feeding, supplementing phosphateand thiamine during the initial increase in nutritional intake, and monitoring the patientcarefully for alterations in serum phosphate, potassium, and magnesium. 53–55
Initial Triage in the Community
Presence of edema
Yes No
WFH z-score < -3,or MUAC < 110 mm*
and any one of:
Drowsy, hypothermia,respiratory distress, highfever, cardiac failure,severe dehydration,anorexia
WFH z-score < -3,or MUAC < 110 mm
and
Clinically well,Alert,Good appetite
-2 < WFH z-score < -3or MUAC >110 mm
andClinically well,Alert,Good appetite
Severe, acute,complicatedmalnutrition
Severe,uncomplicated
malnutrition
Moderateuncomplicated
malnutrition
Inpatientmanagement
Outpatient,community based
Outpatient,supplementary
feeding
Fig. 3. Algorithm to help clinicians decide whether the malnourished child needs hospitali-zation. Abbreviations: MUAC, mid-upper arm circumference; WFH, weight-for-height. WFHz-score based on WHO criteria. *For children between 6 and 59 months or length/height 65to 110 cm as a proxy for age.
Grover & Ee1064

8/9/2019 Marasmo Kwa
http://slidepdf.com/reader/full/marasmo-kwa 11/14
During this phase, patients also should be kept warm, as they are often hypothermicand may need restriction of physical activities because of decreased cardiac output. Antibiotics additionally may be necessary even in the absence of fever if infection issuspected.
Phase 2: Nutritional Rehabilitation
The rehabilitation phase starts once acute complications have been addressedadequately with gradual return of appetite, resolution of diarrhea and sepsis, andcorrection of electrolyte imbalances. The main goals of this phase are to increase die-tary caloric intake, treat occult infections, complete vaccination, improve familyinvolvement, and stimulate psychomotor activity. Weight loss is common initially inchildren with kwashiorkor as their edema resolves. Most children will need 120% to140% of their estimated caloric requirements to achieve desired weight gain andmaintain catch-up growth. This phase usually lasts between 2 to 6 weeks. WHO
recommends delaying iron therapy until rehabilitation occurs because of concernsabout increased infection risk, although a recent review does not support this prac-tice. 56,57 Elemental iron 2 to 6 mg/kg should be prescribed for 3 months.
Phase 3: Follow-up and Recurrence Prevention
Discharge planning and follow-up are recommended, as these patients have tendencyto relapse. Interventions that have been reported to be helpful in preventing undernu-trition in children include promoting breast-feeding, complementary and supplementalfeeding, zinc and vitamin A supplementation, universal salt iodization, and hand-
washing and other hygiene measures.58
Universal provision of iodized salt couldreduce stunting by 36% and mortality for children younger than 3 years by 25%. 58–60
REFERENCES
1. de Onis M, Monteiro C, Clugston G. The worldwide magnitude of protein energymalnutrition: an overview from the WHO global database on child growth. BullWorld Health Organ 1993;71(6):703–12.
2. Caulfield LE, de Onis M, Blo ¨ ssner M, et al. Undernutrition as an underlying causeof child deaths associated with diarrhea, pneumonia, malaria, and measles. Am J
Clin Nutr 2004;80:193–8.3. Pelletier DL, Frongillo EA Jr, Habicht JP. Epidemiologic evidence for a potentiating
effect of malnutrition on child mortality. Am J Public Health 1993;83(8):1130–3.4. Pelletier DL, Frongilllo EA Jr. Changes in child survival are strongly associated
with changes in malnutrition in developing countries. J Nutr 2003;133:107–19.5. Pelletier DL, Frongillo EA Jr, Habicht JP. The effects of malnutrition on child
mortality in developing countries. Bull World Health Organ 1995;73:443–8.6. Joosten KFM, Hulst JM. Prevalence of malnutrition in paediatric hospital patients.
Curr Opin Pediatr 2008;20:590–6.7. Pawellek I, Dokoupil K, Koletzko B. Prevalence of malnutrition in paediatric
hospital patients. Clin Nutr 2008;27:72–6.8. Secker DJ, Jeejeebhoy KN. Subjective global nutritional assessment for children.
Am J Clin Nutr 2007;85:1083–9.9. Hendricks KM, Duggan C, Gallagher L, et al. Malnutrition in hospitalized pediatric
patients. Current prevalence. Arch Pediatr Adolesc Med 1995;149:1118–22.10. Black RE, Allen LH, Bhutta ZA, et al. Maternal and child undernutrition: global and
regional exposures and health consequences. Lancet 2008;371:243–60.
Protein Energy Malnutrition 1065
8/9/2019 Marasmo Kwa
http://slidepdf.com/reader/full/marasmo-kwa 12/14
11. Department of Economic and Social Affairs. UN Population Division. World pop-ulation prospects: the sex and age distribution of the world population, the 2000revision. New York: United Nations; 2001.
12. de Onis M, Blo ¨ssner M, Borghi E, et al. Estimates of global prevalence of child-hood underweight in 1990 and 2015. JAMA 2004;291:2600–6.
13. Maia MM, Fausto MA, Vieira EL, et al. The prevalence of malnutrition and its riskfactors in children attending outpatient clinics in the city of Manaus, Amazonas,Brazil. Arch Latinoam Nutr 2008;58:234–40.
14. Gomez F, Ramos-Galvan R, Frenk S, et al. Mortality in second- and third-degreemalnutrition. J Trop Pediatr 1956;2:77–83.
15. Seoane N, Latham MC. Nutritional anthropometry in the identification of malnutri-tion in childhood. J Trop Pediatr Environ Child Health 1971;17:1271–4.
16. Bear MT, Harris AB. Pediatric nutrition assessment: identifying children at risk.J Am Diet Assoc 1997;97(10S2):107–15.
17. Waterlow JC. Classification and definition of protein calorie malnutrition. BMJ1972;3:566–9.
18. Waterlow JC, Buzina R, Keller W, et al. The presentation and use of height andweight data for comparing the nutritional status of groups of children under theage of 10years. Bull World Health Organ 1977;55:489–98.
19. Hamill PW, Drizd TA, Johnson CL, et al. NCHS growth curves for children birth–18years. Washington, DC: National Center for Health Statistics; 1977.
20. Lavoi-Pierre GJ, Keller W, Dixon H, et al. Measuring change in nutritional status.Guidelines for assessing the nutritional impact of supplementary feeding pro-grammes for vulnerable groups. Geneva (Switzerland): World Health Organiza-
tion; 1983.21. World Health Organization. Physical status: the use and interpretation of anthro-pometry. Geneva (Switzerland): World Health Organization; 1995.
22. WHO Multicentre Growth Reference Study Group. WHO child growth standardsbased on length/height, weight, and age. Acta Paediatr 2006;450:76–85.
23. Seal A, Kerac M. Operational implications of using 2006 World Health Organiza-tion growth standards in nutrition programmes: secondary data analysis. BMJ2007;334:733.
24. Prost MA, Jahn A, Floyd S, et al. Implication of new WHO growth standards onidentification of risk factors and estimated prevalence of malnutrition in rural Ma-
lawian infants. PLoS One 2008;3(7):e2684.25. Kanawati AA, McLaren DS. Assessment of marginal malnutrition. Nature 1970;
228:573–5.26. Myatt M, Khara T, Collins S. A review of methods to detect cases of severely
malnourished children in the community for their admission into community-based therapeutic care programs. Food Nutr Bull 2006;27:S7–23.
27. Briend A, Zimicki S. Validation of arm circumference as an indicator of risk ofdeath in one to four year old children. Nutr Res 1986;6:249–61.
28. Briend A, Dykewicz C, Graven K, et al. Usefulness of nutritional indices and clas-sifications in predicting death of malnourished children. Br Med J (Clin Res Ed)
1986;293:373–5.29. Briend A, Wojtyniak B, Rowland MGM. Arm circumference and other factors in
children at heightened risk of death in rural Bangladesh. Lancet 1987;26:725–7.
30. Chen LC, Chowdhury MK, Huffman SL. Anthropometric assessment of energyprotein malnutrition and subsequent risk of mortality among preschool children.Am J Clin Nutr 1980;33:1836–45.
Grover & Ee1066

8/9/2019 Marasmo Kwa
http://slidepdf.com/reader/full/marasmo-kwa 13/14
31. Alam N, Wojtyniak B, Rahaman MM. Anthropometric indicators and risk of death.Am J Clin Nutr 1989;49:884–8.
32. Cole TJ, Flegal KM, Nicholls D, et al. Body mass index cutoff to define thinness inchildren and adolescents: international survey. BMJ 2007;335:194–202.
33. Williams CD. Kwashiorkor: a nutritional disease of children associated witha maize diet. Lancet 1935;229:1151–2.
34. Lowy G, Meilman I. Kwashiorkor. Dermatological and clinical aspects. Analysis of100 cases. Med Cutan Ibero Lat Am 1975;3(3):181–9.
35. Patrick J, Golden M. Leukocyte electrolytes and sodium transport in proteinenergy malnutrition. Am J Clin Nutr 1977;30:1478–81.
36. Lamplugh SM, Hendrickse RG. Aflatoxins in the livers of children with kwashi-orkor. Ann Trop Paediatr 1982;2:101–4.
37. Golden MH, Ramdath D. Free radicals in the pathogenesis of kwashiorkor. ProcNutr Soc 1987;46:53–68.
38. Badaloo A, Reid M, Forrester T, et al. Cysteine supplementation improves theerythrocyte glutathione synthesis rate in children with severe edematous malnu-trition. Am J Clin Nutr 2002;76:646–52.
39. Georgieff MK. Nutrition and the developing brain: nutrient priorities and measure-ment. Am J Clin Nutr 2007;85:614S–20S.
40. Bhutta ZA. Micronutrient needs of malnourished children. Curr Opin Clin NutrMetab Care 2008;11:309–14.
41. World Health Organization. Management of severe malnutrition: a manual forphysicians and other senior health workers. Geneva (Switzerland): World HealthOrganization; 1999.
42. Ashworth A, Chopra M, McCoy D, et al. WHO guidelines for management ofsevere malnutrition in rural South African hospitals: effect on case fatality andthe influence of operational factors. Lancet 2004;363(9415):1110–5.
43. Ahmed T, Ali M, Ullah MM, et al. Mortality in severely malnourished children with diar-rhea and use of standard management protocol. Lancet 1999;353(9168):1919–22.
44. Deen JL, Funk M, Guevera VC, et al. Implementation of WHO guidelines onmanagement of severe malnutrition in hospitals in Africa. Bull World Health Organ2003;81:237–43.
45. Briend A. Management of severe malnutrition: efficacious or effective? J PediatrGastroenterol Nutr 2001;32:521–2.
46. Cavalcante AA, Pinheiro LM, Monte C, et al. Treatment of malnutrition in Brazil:simple solutions to a common problem. Trop Doct 1998;28:95–7.
47. Bernal C, Velasquez C, Alcaraz G, et al. Treatment of severe malnutrition in chil-dren: experience in implementing the World Health Organisation guidelines inTurbo, Columbia. J Pediatr Gastroenterol Nutr 2008;46:322–8.
48. Falbo AR, Alves JG, Filho MB, et al. Decline in hospital mortality rate after the useof the World Health Organization protocol for management of severe malnutrition.Trop Doct 2009;39:71–2.
49. Bachou H, Tumwine JK, Mwadime R, et al. Risk factors in hospital deaths inseverely malnourished children in Kampala, Uganda. BMC Pediatr 2006;6:7–16.
50. Ciliberto MA, Sandige H, Ndekha MJ, et al. A comparison of home-based therapywith ready-to-use therapeutic food with standard therapy in the treatment ofmalnourished Malawian children: a controlled clinical effectiveness trial. Am JClin Nutr 2005;81:864–70.
51. Linneman Z, Matilsky D, Ndekha M, et al. A large-scale operation study of home-based therapy with ready-to-use therapeutic food in childhood malnutrition inMalawi. Matern Child Nutr 2007;3:206–15.
Protein Energy Malnutrition 1067

8/9/2019 Marasmo Kwa
http://slidepdf.com/reader/full/marasmo-kwa 14/14
52. Collins S, Yates R. The need to update the classification of acute malnutrition.Lancet 2003;362(9379):249.
53. Crook MA, Hally V, Panteli JV. The importance of the refeeding syndrome.Nutrition 2001;17:632–7.
54. Stanga Z, Brunner A, Leuenberger M, et al. Nutrition in clinical practice—therefeeding syndrome: illustrative cases and guidelines for prevention andtreatment. Eur J Clin Nutr 2008;62:687–94.
55. Manary MJ, Hart CA, Whyte MP. Severe hypophosphatemia in children withkwashiorkor is associated with increased mortality. J Pediatr 1998;133:789–91.
56. Smith IF, Taiwo O, Golden MH. Plant protein rehabilitation diets and iron supple-mentation of protein energy malnourished child. Eur J Clin Nutr 1989;43:763–8.
57. Gera T, Sachdev HP. Effect of iron supplementation on incidence of infectiousillness in children: systemic review. BMJ 2002;325:1142–7.
58. Bhutta ZA, Ahmed T, Black RE, et al. What works? Interventions for maternal andchild undernutrition and survival. Lancet 2008;371:417–40.
59. Manary MJ, Sandige H. Management of acute moderate and severe childhoodmalnutrition. BMJ 2008;337:2180.
60. Collins S. Treating severe acute malnutrition seriously. Arch Dis Child 2007;92:453–61.
Grover & Ee1068