ministry of environment - british columbia · prepared by: jason mccoy ministry of environment...
TRANSCRIPT

EE
NN VV
II RR
OO NN
MM EE
NN TT
AA LL
UU AA
LL II
TT YY
MMiinniissttrryy ooff EEnnvviirroonnmmeennttLLOOWWEERR MMAAIINNLLAANNDD RREEGGIIOONN
Ambient PM10 Monitoring
Sechelt, B.C. 2004-2005 Update
Library and Archives Canada Cataloguing in Publication Data McCoy, Jason, 1975-
Ambient PM10 monitoring report : Sechelt, B.C., 2004-2005 update [electronic resource].
Available on the Internet. Includes bibliographical references: p. ISBN 0-7726-5649-5 1. Particles – Environmental aspects - British Columbia – Sechelt. 2. Air quality - British
Columbia – Sechelt. 3. Air – Pollution – British Columbia – Sechelt. 4. Environmental monitoring – British Columbia – Sechelt. I. British Columbia. Ministry of Environment. Lower Mainland Region. II. British Columbia. Environmental Quality Section. III. Title. IV. Title: Ambient particular matter monitoring report : Sechelt, B.C., 2004-2005 update.
TD883.148.C32B74 2006 363.739’220971131 2006-960203-4

Ambient PM10 Monitoring
Sechelt, B.C. 2004-2005 Update

PPrreeppaarreedd bbyy::
JJaassoonn MMccCCooyy
MMiinniissttrryy ooff EEnnvviirroonnmmeenntt EEnnvviirroonnmmeennttaall QQuuaalliittyy SSeeccttiioonn 22nndd FFlloooorr,, 1100447700 115522 SSttrreeeett
SSuurrrreeyy,, BB..CC.. VV33RR 00YY33
660044--558822--55220000
AApprriill 22000066
Preface
This report is one in a series of water, groundwater, and air quality reports that are being issued by the Lower Mainland Regional Office in fiscal year 2006/07. It is the intention of the regional office to publish air and water quality reports on our website (http://wlapwww.gov.bc.ca/sry/p2/eq/index.htm) in order to provide the information to industry and local government, other stakeholders and the public at large. By providing such information in a readily understood format, and on an ongoing basis, it is hoped that local environmental quality conditions can be better understood, and better decisions regarding air and water quality management can be made.
Acknowledgements
The Ministry of Environment would like to recognize the Vancouver Coastal Health Authority (Coast Garibaldi Area), Construction Aggregates Limited, the District of Sechelt, the Trail Bay Centre Mall, Mr. David Lamb and Mr. Lewis Legal for their assistance in operating the sampling program.
TABLE OF CONTENTS
1.0 INTRODUCTION...............................................................................................................................1
2.0 RESULTS AND DISCUSSION ..........................................................................................................1 2.1 COMPARISON WITH OTHER SAMPLING YEARS.......................................................................................3 2.2 COMPARISON WITH OTHER PM10 SAMPLING PROGRAMS........................................................................4
3.0 SUMMARY.........................................................................................................................................5
TABLES AND FIGURES
FIGURE 1.0 Results from 2004 PM10 sampling at Trail Bay Centre Mall, Sechelt, B.C. 02 FIGURE 2.0 Results from 2005 PM10 sampling at Trail Bay Centre Mall, Sechelt, B.C. 02 FIGURE 3.0 Comparison of 2000-2005 mean annual 24-hour PM10 concentrations at Trail Bay Mall 03 FIGURE 4.0 Comparison of 2000-2005 mean annual 24-hour PM10 concentrations at 6 different locations 04
APPENDICES APPENDIX A 2004 Sample Data APPENDIX B 2005 Sample Data APPENDIX C 2004 Figure 4.0 Data APPENDIX D 2005 Figure 4.0 Data
Ambient PM10 Monitoring Sechelt, B.C.
2004-2005 Update
Ministry of Environment Lower Mainland Region
Page 1 of 5
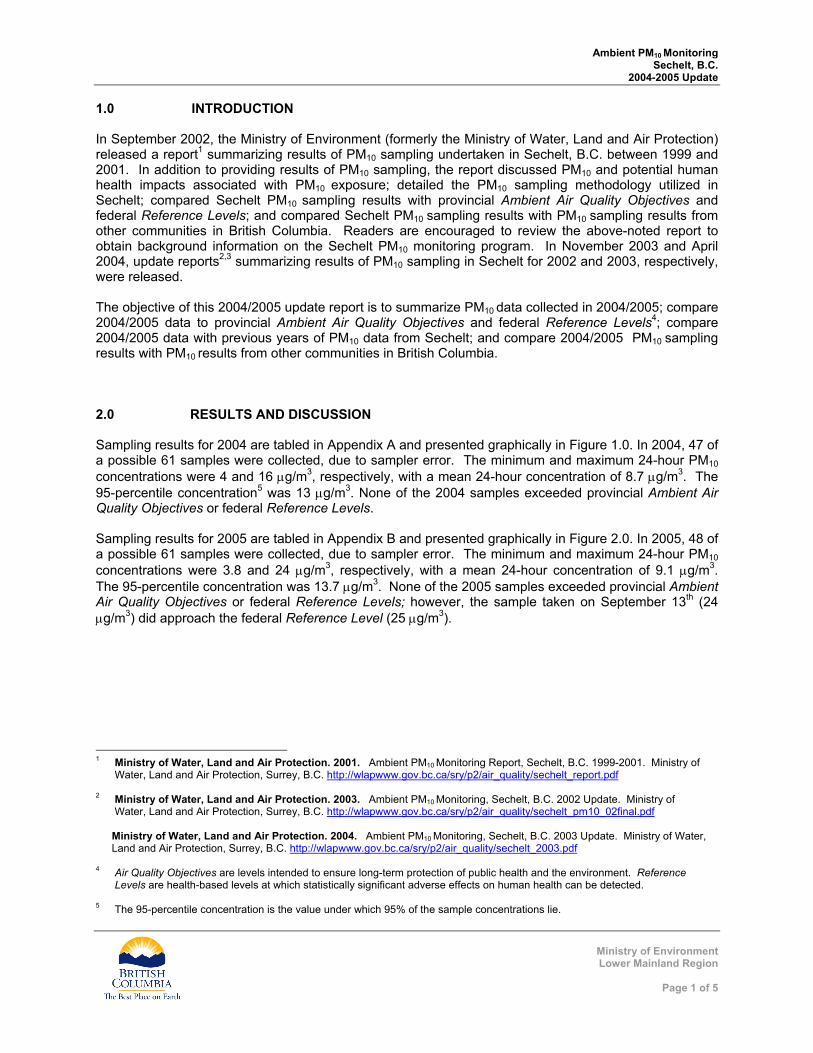
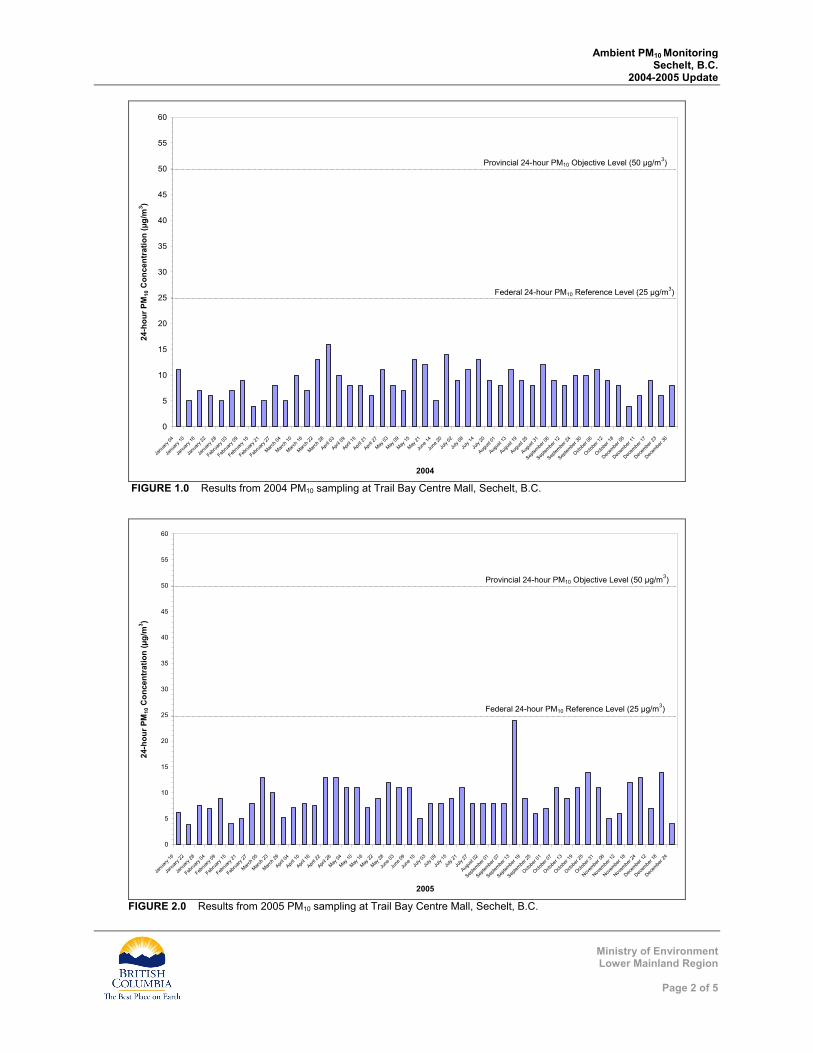
1.0 INTRODUCTION In September 2002, the Ministry of Environment (formerly the Ministry of Water, Land and Air Protection) released a report1 summarizing results of PM10 sampling undertaken in Sechelt, B.C. between 1999 and 2001. In addition to providing results of PM10 sampling, the report discussed PM10 and potential human health impacts associated with PM10 exposure; detailed the PM10 sampling methodology utilized in Sechelt; compared Sechelt PM10 sampling results with provincial Ambient Air Quality Objectives and federal Reference Levels; and compared Sechelt PM10 sampling results with PM10 sampling results from other communities in British Columbia. Readers are encouraged to review the above-noted report to obtain background information on the Sechelt PM10 monitoring program. In November 2003 and April 2004, update reports2,3 summarizing results of PM10 sampling in Sechelt for 2002 and 2003, respectively, were released. The objective of this 2004/2005 update report is to summarize PM10 data collected in 2004/2005; compare 2004/2005 data to provincial Ambient Air Quality Objectives and federal Reference Levels4; compare 2004/2005 data with previous years of PM10 data from Sechelt; and compare 2004/2005 PM10 sampling results with PM10 results from other communities in British Columbia. 2.0 RESULTS AND DISCUSSION Sampling results for 2004 are tabled in Appendix A and presented graphically in Figure 1.0. In 2004, 47 of a possible 61 samples were collected, due to sampler error. The minimum and maximum 24-hour PM10 concentrations were 4 and 16 μg/m3, respectively, with a mean 24-hour concentration of 8.7 μg/m3. The 95-percentile concentration5 was 13 μg/m3. None of the 2004 samples exceeded provincial Ambient Air Quality Objectives or federal Reference Levels. Sampling results for 2005 are tabled in Appendix B and presented graphically in Figure 2.0. In 2005, 48 of a possible 61 samples were collected, due to sampler error. The minimum and maximum 24-hour PM10 concentrations were 3.8 and 24 μg/m3, respectively, with a mean 24-hour concentration of 9.1 μg/m3. The 95-percentile concentration was 13.7 μg/m3. None of the 2005 samples exceeded provincial Ambient Air Quality Objectives or federal Reference Levels; however, the sample taken on September 13th (24 μg/m3) did approach the federal Reference Level (25 μg/m3).
1 Ministry of Water, Land and Air Protection. 2001. Ambient PM10 Monitoring Report, Sechelt, B.C. 1999-2001. Ministry of Water, Land and Air Protection, Surrey, B.C. http://wlapwww.gov.bc.ca/sry/p2/air_quality/sechelt_report.pdf 2 Ministry of Water, Land and Air Protection. 2003. Ambient PM10 Monitoring, Sechelt, B.C. 2002 Update. Ministry of Water, Land and Air Protection, Surrey, B.C. http://wlapwww.gov.bc.ca/sry/p2/air_quality/sechelt_pm10_02final.pdf
Ministry of Water, Land and Air Protection. 2004. Ambient PM10 Monitoring, Sechelt, B.C. 2003 Update. Ministry of Water, Land and Air Protection, Surrey, B.C. http://wlapwww.gov.bc.ca/sry/p2/air_quality/sechelt_2003.pdf
4 Air Quality Objectives are levels intended to ensure long-term protection of public health and the environment. Reference Levels are health-based levels at which statistically significant adverse effects on human health can be detected. 5 The 95-percentile concentration is the value under which 95% of the sample concentrations lie.
Ambient PM10 Monitoring Sechelt, B.C.
2004-2005 Update
Ministry of Environment Lower Mainland Region
Page 2 of 5
0
5
10
15
20
25
30
35
40
45
50
55
60
Janu
ary 04
Janu
ary 10
Janu
ary 16
Janu
ary 22
Janu
ary 28
Februa
ry 03
Februa
ry 09
Februa
ry 15
Februa
ry 21
Februa
ry 27
March 0
4
March 1
0
March 1
6
March 2
2
March 2
8
April 0
3
April 0
9
April 1
5
April 2
1
April 2
7
May 03
May 09
May 15
May 21
June
14
June
20
July
02
July
08
July
14
July
20
Augus
t 01
Augus
t 13
Augus
t 19
Augus
t 25
Augus
t 31
Septem
ber 0
6
Septem
ber 1
2
Septem
ber 2
4
Septem
ber 3
0
Octobe
r 06
Octobe
r 12
Octobe
r 18
Decem
ber 0
5
Decem
ber 1
1
Decem
ber 1
7
Decem
ber 2
3
Decem
ber 3
0
2004
24-h
our P
M10
Con
cent
ratio
n (µ
g/m
3 )
Federal 24-hour PM10 Reference Level (25 µg/m3)
Provincial 24-hour PM10 Objective Level (50 µg/m3)
FIGURE 1.0 Results from 2004 PM10 sampling at Trail Bay Centre Mall, Sechelt, B.C.
0
5
10
15
20
25
30
35
40
45
50
55
60
Janu
ary 16
Janu
ary 22
Janu
ary 28
Februa
ry 04
Februa
ry 09
Februa
ry 15
Februa
ry 21
Februa
ry 27
March 0
5
March 2
3
March 2
9
April 0
4
April 1
0
April 1
6
April 2
2
April 2
8
May 04
May 10
May 16
May 22
May 28
June
03
June
09
June
15
July
03
July
09
July
15
July
21
July
27
Augus
t 02
Septem
ber 0
1
Septem
ber 0
7
Septem
ber 1
3
Septem
ber 1
9
Septem
ber 2
5
Octobe
r 01
Octobe
r 07
Octobe
r 13
Octobe
r 19
Octobe
r 25
Octobe
r 31
Novem
ber 0
6
Novem
ber 1
2
Novem
ber 1
8
Novem
ber 2
4
Decem
ber 1
2
Decem
ber 1
8
Decem
ber 2
4
2005
24-h
our P
M10
Con
cent
ratio
n (µ
g/m
3 )
Federal 24-hour PM10 Reference Level (25 µg/m3)
Provincial 24-hour PM10 Objective Level (50 µg/m3)
FIGURE 2.0 Results from 2005 PM10 sampling at Trail Bay Centre Mall, Sechelt, B.C.
Ambient PM10 Monitoring Sechelt, B.C.
2004-2005 Update
Ministry of Environment Lower Mainland Region
Page 3 of 5
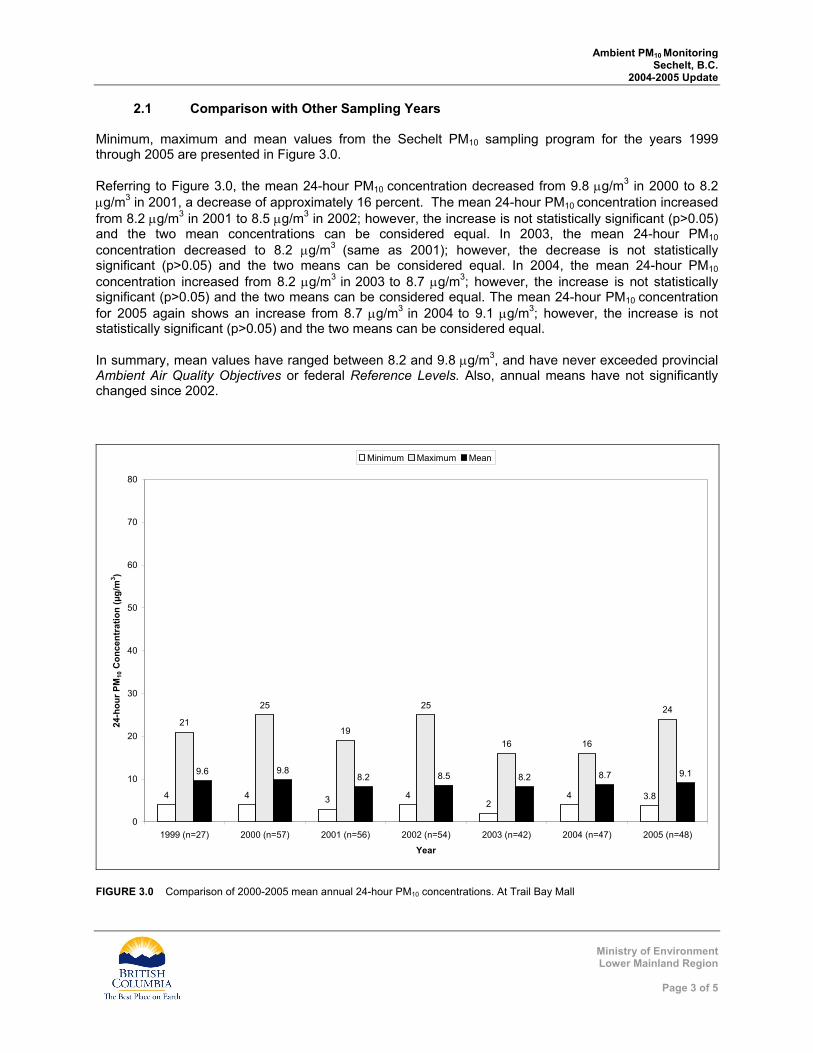
2.1 Comparison with Other Sampling Years Minimum, maximum and mean values from the Sechelt PM10 sampling program for the years 1999 through 2005 are presented in Figure 3.0. Referring to Figure 3.0, the mean 24-hour PM10 concentration decreased from 9.8 μg/m3 in 2000 to 8.2 μg/m3 in 2001, a decrease of approximately 16 percent. The mean 24-hour PM10 concentration increased from 8.2 μg/m3 in 2001 to 8.5 μg/m3 in 2002; however, the increase is not statistically significant (p>0.05) and the two mean concentrations can be considered equal. In 2003, the mean 24-hour PM10 concentration decreased to 8.2 μg/m3 (same as 2001); however, the decrease is not statistically significant (p>0.05) and the two means can be considered equal. In 2004, the mean 24-hour PM10 concentration increased from 8.2 μg/m3 in 2003 to 8.7 μg/m3; however, the increase is not statistically significant (p>0.05) and the two means can be considered equal. The mean 24-hour PM10 concentration for 2005 again shows an increase from 8.7 μg/m3 in 2004 to 9.1 μg/m3; however, the increase is not statistically significant (p>0.05) and the two means can be considered equal. In summary, mean values have ranged between 8.2 and 9.8 μg/m3, and have never exceeded provincial Ambient Air Quality Objectives or federal Reference Levels. Also, annual means have not significantly changed since 2002.
4 4 3 42
4 3.8
21
25
19
25
16 16
24
9.6 9.88.2 8.5 8.2 8.7 9.1
0
10
20
30
40
50
60
70
80
1999 (n=27) 2000 (n=57) 2001 (n=56) 2002 (n=54) 2003 (n=42) 2004 (n=47) 2005 (n=48)
Year
24-h
our P
M10
Con
cent
ratio
n (µ
g/m
3 )
Minimum Maximum Mean
FIGURE 3.0 Comparison of 2000-2005 mean annual 24-hour PM10 concentrations. At Trail Bay Mall
Ambient PM10 Monitoring Sechelt, B.C.
2004-2005 Update
Ministry of Environment Lower Mainland Region
Page 4 of 5
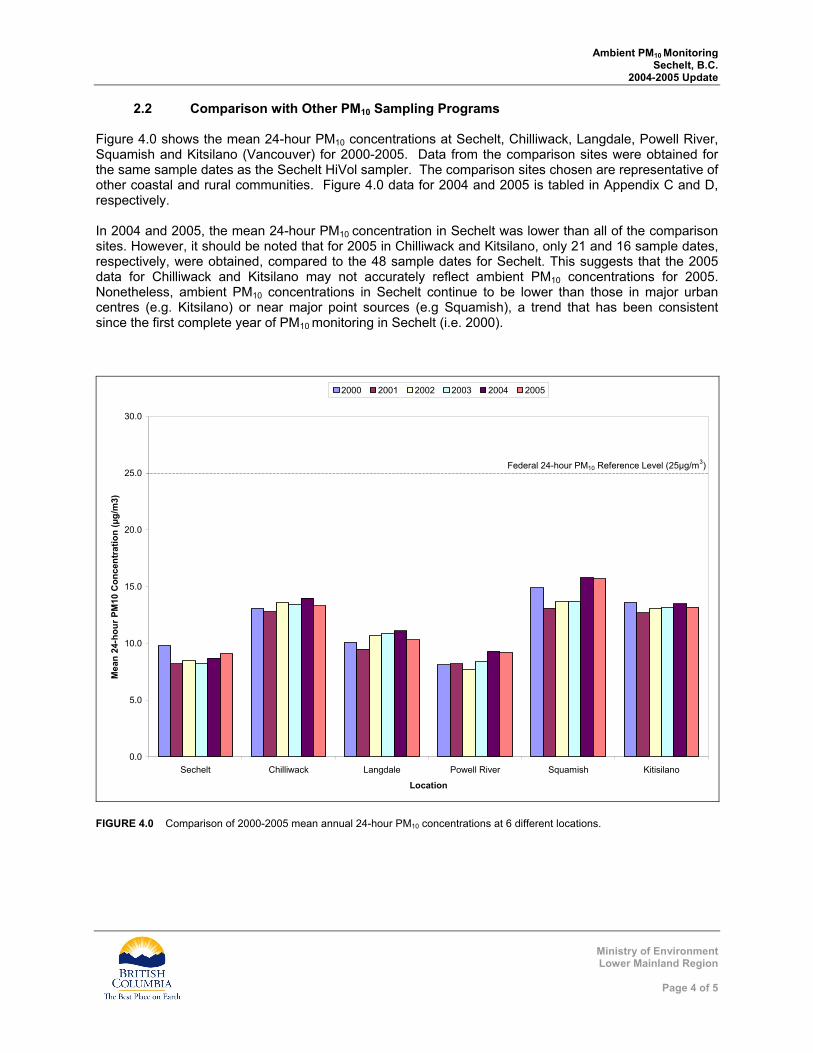
2.2 Comparison with Other PM10 Sampling Programs Figure 4.0 shows the mean 24-hour PM10 concentrations at Sechelt, Chilliwack, Langdale, Powell River, Squamish and Kitsilano (Vancouver) for 2000-2005. Data from the comparison sites were obtained for the same sample dates as the Sechelt HiVol sampler. The comparison sites chosen are representative of other coastal and rural communities. Figure 4.0 data for 2004 and 2005 is tabled in Appendix C and D, respectively. In 2004 and 2005, the mean 24-hour PM10 concentration in Sechelt was lower than all of the comparison sites. However, it should be noted that for 2005 in Chilliwack and Kitsilano, only 21 and 16 sample dates, respectively, were obtained, compared to the 48 sample dates for Sechelt. This suggests that the 2005 data for Chilliwack and Kitsilano may not accurately reflect ambient PM10 concentrations for 2005. Nonetheless, ambient PM10 concentrations in Sechelt continue to be lower than those in major urban centres (e.g. Kitsilano) or near major point sources (e.g Squamish), a trend that has been consistent since the first complete year of PM10 monitoring in Sechelt (i.e. 2000).
0.0
5.0
10.0
15.0
20.0
25.0
30.0
Sechelt Chilliwack Langdale Powell River Squamish Kitisilano
Location
Mea
n 24
-hou
r PM
10 C
once
ntra
tion
(µg/
m3)
2000 2001 2002 2003 2004 2005
Federal 24-hour PM10 Reference Level (25µg/m3)
FIGURE 4.0 Comparison of 2000-2005 mean annual 24-hour PM10 concentrations at 6 different locations.
Ambient PM10 Monitoring Sechelt, B.C.
2004-2005 Update
Ministry of Environment Lower Mainland Region
Page 5 of 5
3.0 SUMMARY PM10 monitoring in Sechelt between 2000 and 2005 indicates: • annual mean PM10 levels have not significantly increased;
• ambient PM10 levels are below provincial Air Quality Objectives and federal Reference Levels; and • PM10 levels in Sechelt are below levels observed in major urban centres or near point sources. The Ministry of Environment will continue PM10 sampling in Sechelt and results of the 2006 sampling program will be provided in 2007.
APPENDIX A SECHELT TRAIL BAY MALL
2004 PM10 RESULTS
Month Date µg/m3 (24 hr avg) Month Date µg/m3
(24 hr avg) 4 11 2 9 10 5 8 11 16 7 14 13 22 6 20 9
January
28 5
July
26 no sample 3 7 1 8 9 9 7 no sample 15 4 13 11 21 5 19 9 27 8 25 8
February
August
31 12 4 5 6 9 10 10 12 8 16 7 18 no sample 22 13 24 10 28 16 30 10
March
3 10
September
6 11 9 8 12 9 15 8 18 8 21 6 24 no sample 27 11 30 no sample
April
3 8
October
5 no sample 9 7 11 no sample 15 13 17 no sample 21 12 23 no sample 27 no sample 30 no sample
May
2 no sample
November
5 4 8 no sample 11 6 14 5 17 9 20 14 23 6 June
26 no sample
December
30 8
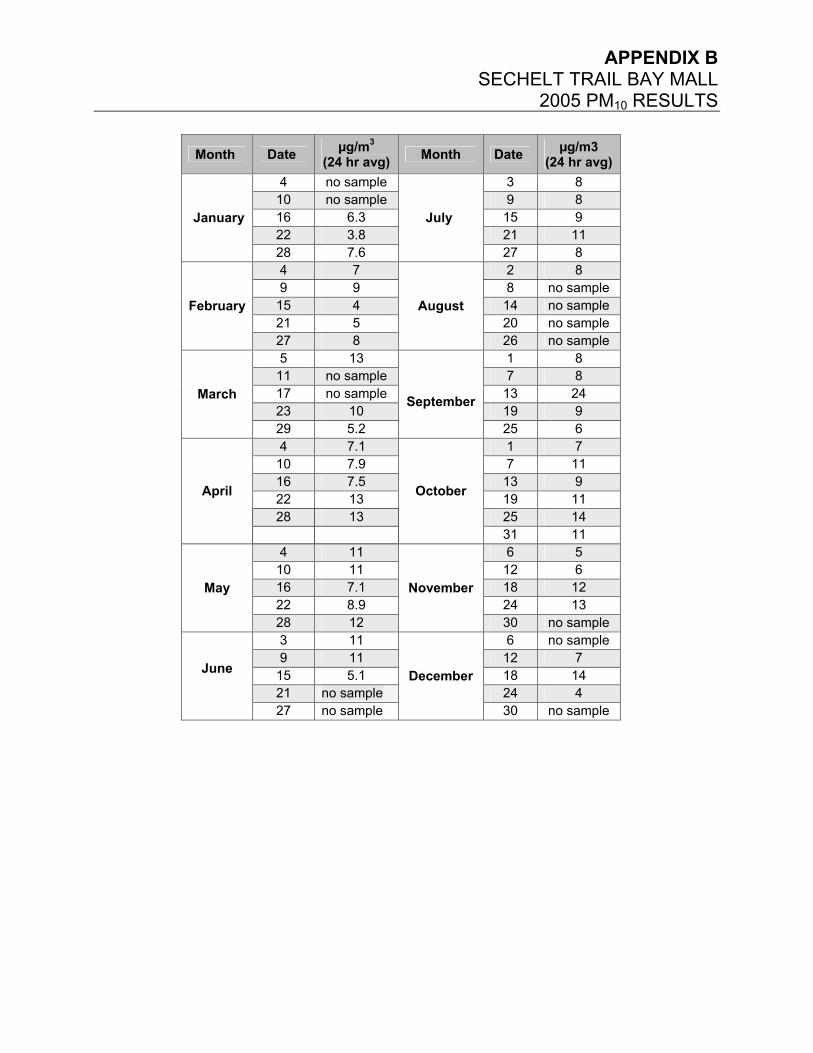
APPENDIX B SECHELT TRAIL BAY MALL
2005 PM10 RESULTS
Month Date µg/m3 (24 hr avg) Month Date µg/m3
(24 hr avg) 4 no sample 3 8
10 no sample 9 8 16 6.3 15 9 22 3.8 21 11
January
28 7.6
July
27 8 4 7 2 8 9 9 8 no sample
15 4 14 no sample 21 5 20 no sample
February
27 8
August
26 no sample 5 13 1 8
11 no sample 7 8 17 no sample 13 24 23 10 19 9
March
29 5.2
September
25 6 4 7.1 1 7
10 7.9 7 11 16 7.5 13 9 22 13 19 11 28 13 25 14
April
October
31 11 4 11 6 5
10 11 12 6 16 7.1 18 12 22 8.9 24 13
May
28 12
November
30 no sample 3 11 6 no sample 9 11 12 7
15 5.1 18 14 21 no sample 24 4
June
27 no sample
December
30 no sample
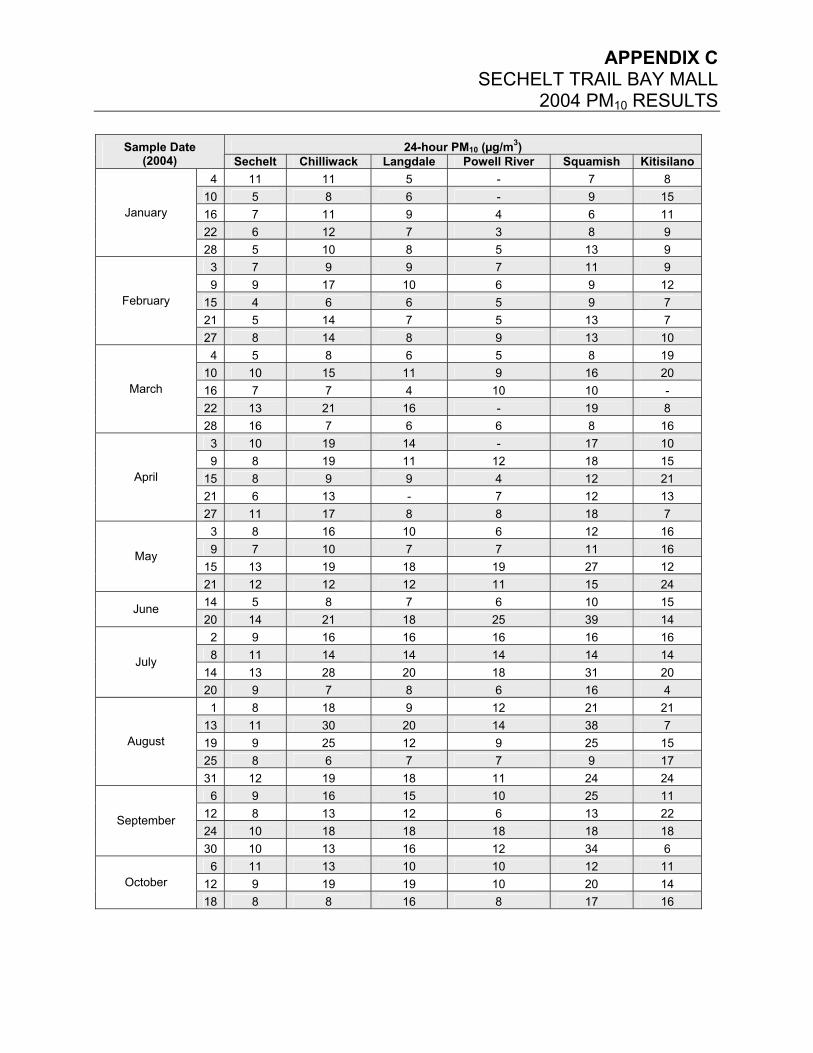
APPENDIX C SECHELT TRAIL BAY MALL
2004 PM10 RESULTS
24-hour PM10 (µg/m3) Sample Date (2004) Sechelt Chilliwack Langdale Powell River Squamish Kitisilano
4 11 11 5 - 7 8 10 5 8 6 - 9 15 16 7 11 9 4 6 11 22 6 12 7 3 8 9
January
28 5 10 8 5 13 9 3 7 9 9 7 11 9 9 9 17 10 6 9 12
15 4 6 6 5 9 7 21 5 14 7 5 13 7
February
27 8 14 8 9 13 10 4 5 8 6 5 8 19
10 10 15 11 9 16 20 16 7 7 4 10 10 - 22 13 21 16 - 19 8
March
28 16 7 6 6 8 16 3 10 19 14 - 17 10 9 8 19 11 12 18 15
15 8 9 9 4 12 21 21 6 13 - 7 12 13
April
27 11 17 8 8 18 7 3 8 16 10 6 12 16 9 7 10 7 7 11 16
15 13 19 18 19 27 12 May
21 12 12 12 11 15 24 14 5 8 7 6 10 15 June 20 14 21 18 25 39 14 2 9 16 16 16 16 16 8 11 14 14 14 14 14
14 13 28 20 18 31 20 July
20 9 7 8 6 16 4 1 8 18 9 12 21 21
13 11 30 20 14 38 7 19 9 25 12 9 25 15 25 8 6 7 7 9 17
August
31 12 19 18 11 24 24 6 9 16 15 10 25 11
12 8 13 12 6 13 22 24 10 18 18 18 18 18
September
30 10 13 16 12 34 6 6 11 13 10 10 12 11
12 9 19 19 10 20 14 October 18 8 8 16 8 17 16
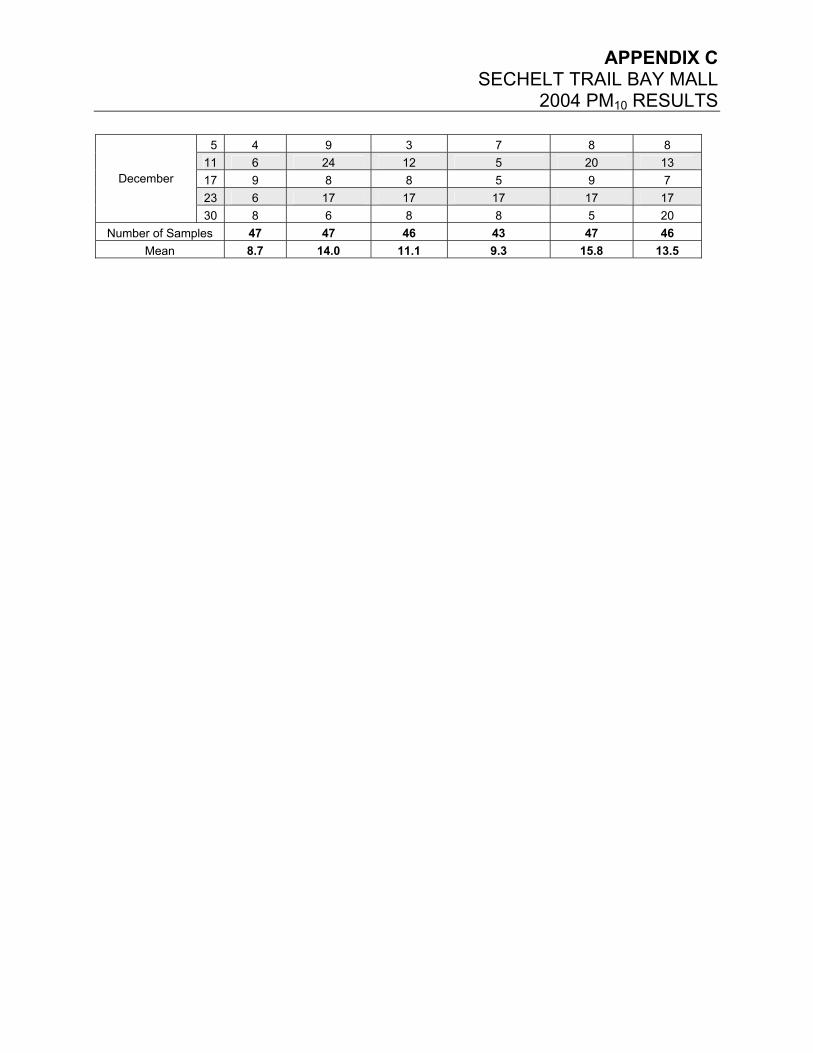
APPENDIX C SECHELT TRAIL BAY MALL
2004 PM10 RESULTS
5 4 9 3 7 8 8 11 6 24 12 5 20 13 17 9 8 8 5 9 7 23 6 17 17 17 17 17
December
30 8 6 8 8 5 20 Number of Samples 47 47 46 43 47 46
Mean 8.7 14.0 11.1 9.3 15.8 13.5
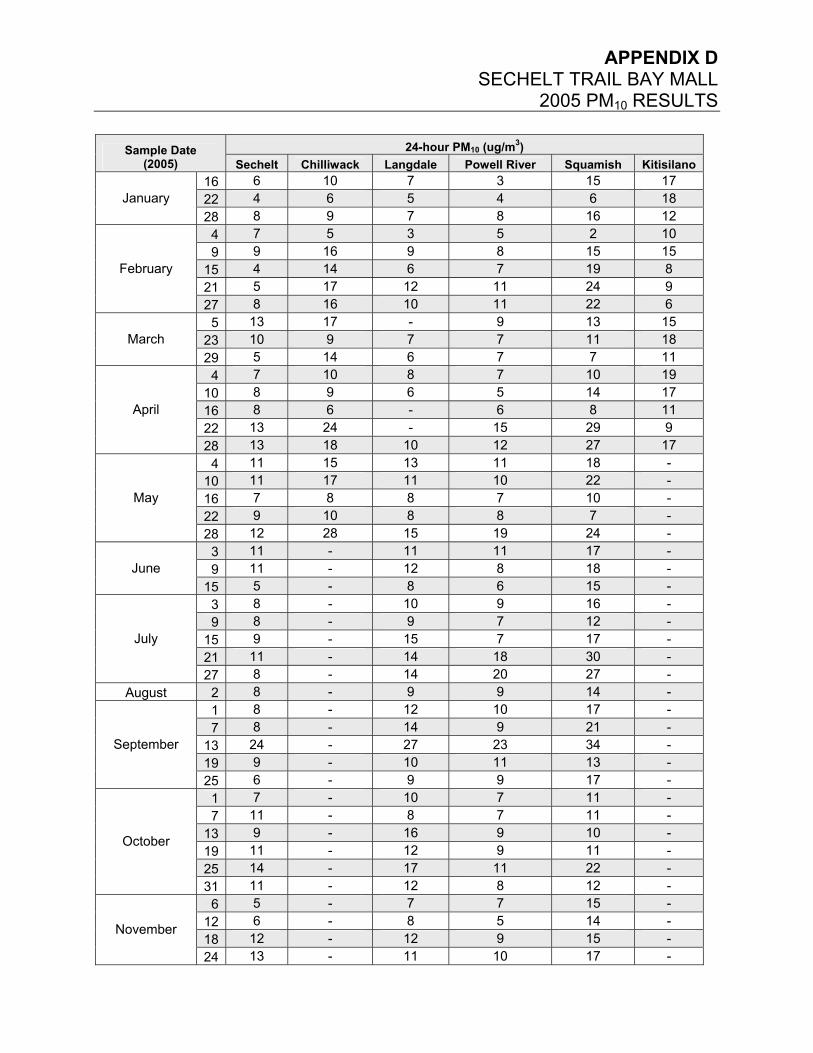
APPENDIX D SECHELT TRAIL BAY MALL
2005 PM10 RESULTS
24-hour PM10 (ug/m3) Sample Date (2005) Sechelt Chilliwack Langdale Powell River Squamish Kitisilano
16 6 10 7 3 15 17 22 4 6 5 4 6 18 January 28 8 9 7 8 16 12
4 7 5 3 5 2 10 9 9 16 9 8 15 15
15 4 14 6 7 19 8 21 5 17 12 11 24 9
February
27 8 16 10 11 22 6 5 13 17 - 9 13 15
23 10 9 7 7 11 18 March 29 5 14 6 7 7 11
4 7 10 8 7 10 19 10 8 9 6 5 14 17 16 8 6 - 6 8 11 22 13 24 - 15 29 9
April
28 13 18 10 12 27 17 4 11 15 13 11 18 -
10 11 17 11 10 22 - 16 7 8 8 7 10 - 22 9 10 8 8 7 -
May
28 12 28 15 19 24 - 3 11 - 11 11 17 - 9 11 - 12 8 18 - June
15 5 - 8 6 15 - 3 8 - 10 9 16 - 9 8 - 9 7 12 -
15 9 - 15 7 17 - 21 11 - 14 18 30 -
July
27 8 - 14 20 27 - August 2 8 - 9 9 14 -
1 8 - 12 10 17 - 7 8 - 14 9 21 -
13 24 - 27 23 34 - 19 9 - 10 11 13 -
September
25 6 - 9 9 17 - 1 7 - 10 7 11 - 7 11 - 8 7 11 -
13 9 - 16 9 10 - 19 11 - 12 9 11 - 25 14 - 17 11 22 -
October
31 11 - 12 8 12 - 6 5 - 7 7 15 -
12 6 - 8 5 14 - 18 12 - 12 9 15 -
November
24 13 - 11 10 17 -
APPENDIX D SECHELT TRAIL BAY MALL
2005 PM10 RESULTS
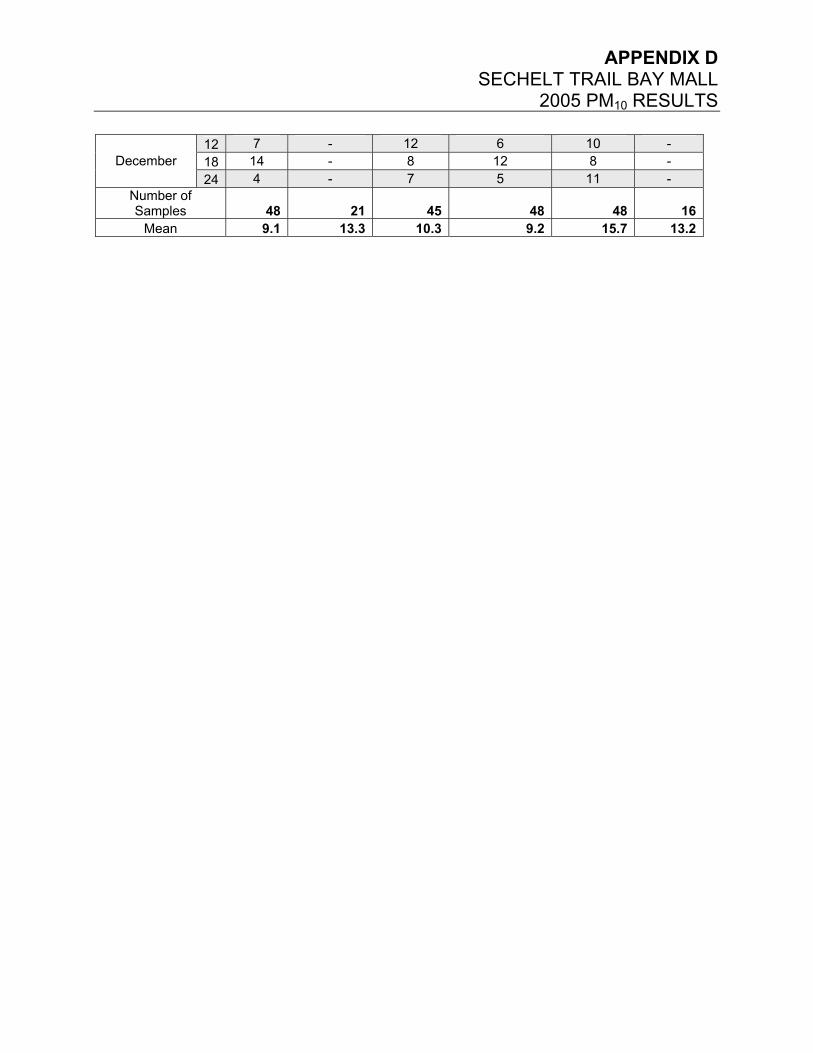
12 7 - 12 6 10 - 18 14 - 8 12 8 - December 24 4 - 7 5 11 -
Number of Samples 48 21 45 48 48 16
Mean 9.1 13.3 10.3 9.2 15.7 13.2