principal+componentanalysis+ par$al+leastsquare++...
TRANSCRIPT

Mul$variate Data Analysis
• Data characteris$cs • Data analysis types • Methods
– Principal component analysis – Par$al least square – PLS-‐DA/SIMCA
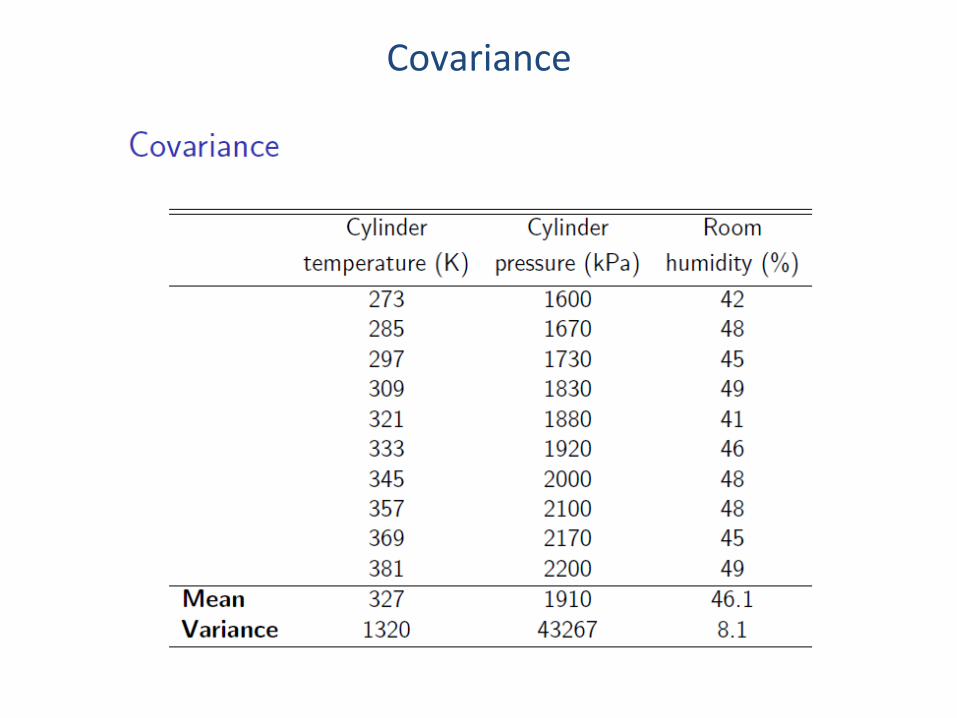
Covariance

Covariance

Correla$on

Correla$on

Data Characteris$cs
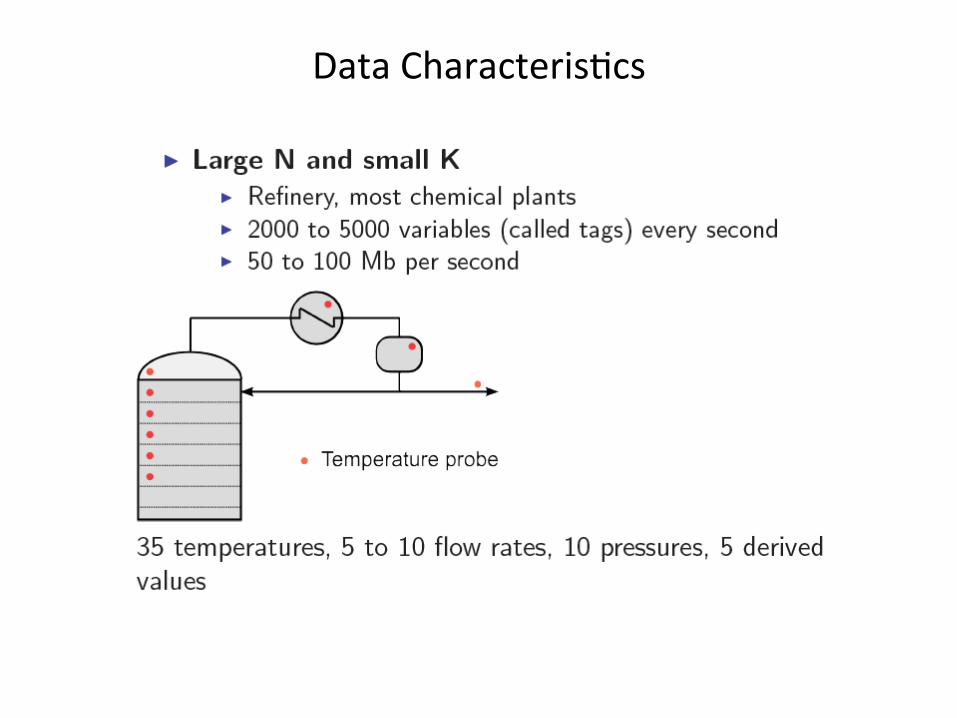
Data Characteris$cs
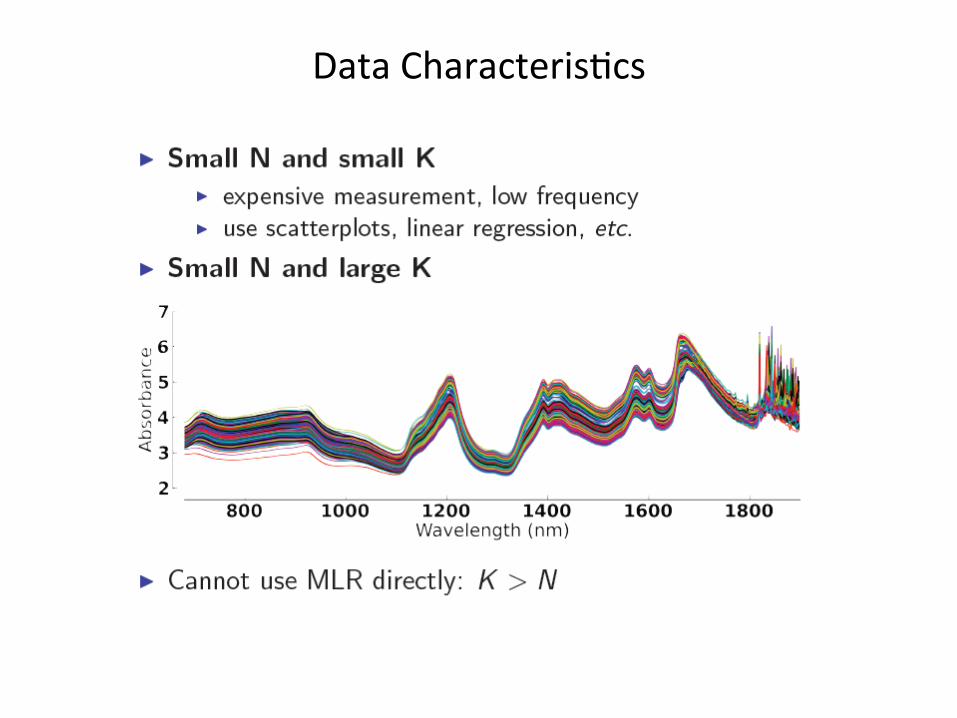
Data Characteris$cs

Data Characteris$cs
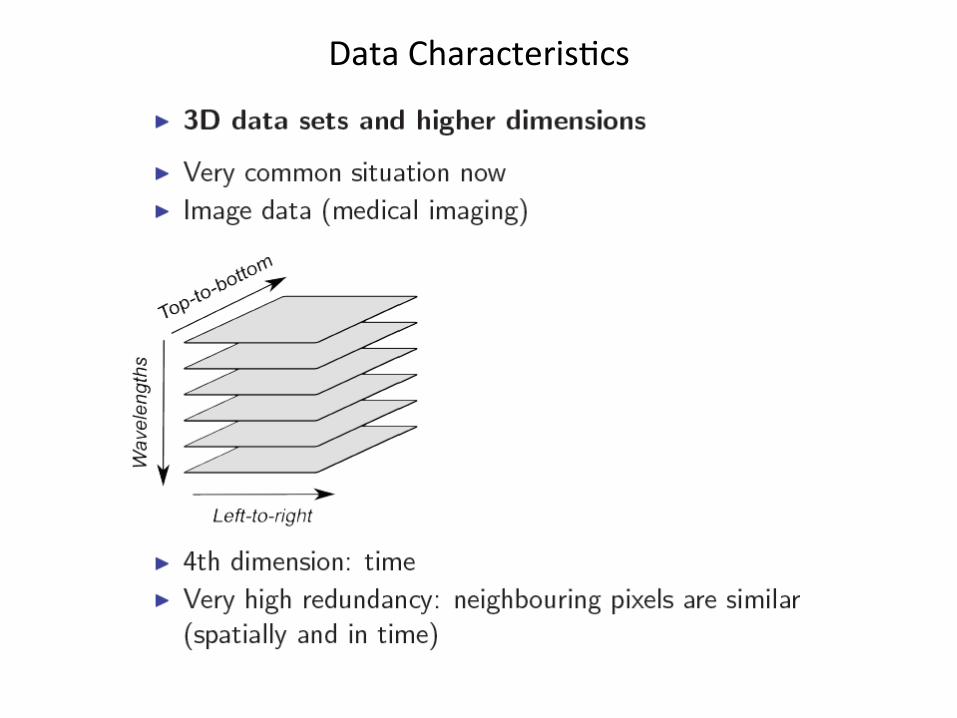
Data Characteris$cs

Data Characteris$cs
Data Analysis Purpose
• Summary • Regression • Classifica$on

Issues with engineering data
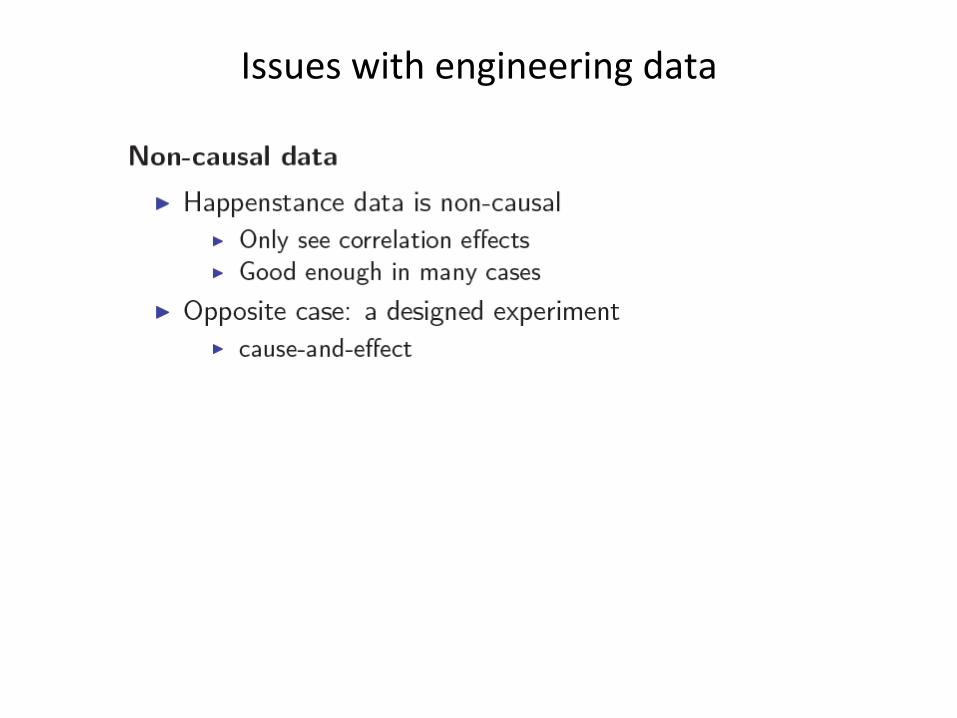
Issues with engineering data

Issues with engineering data
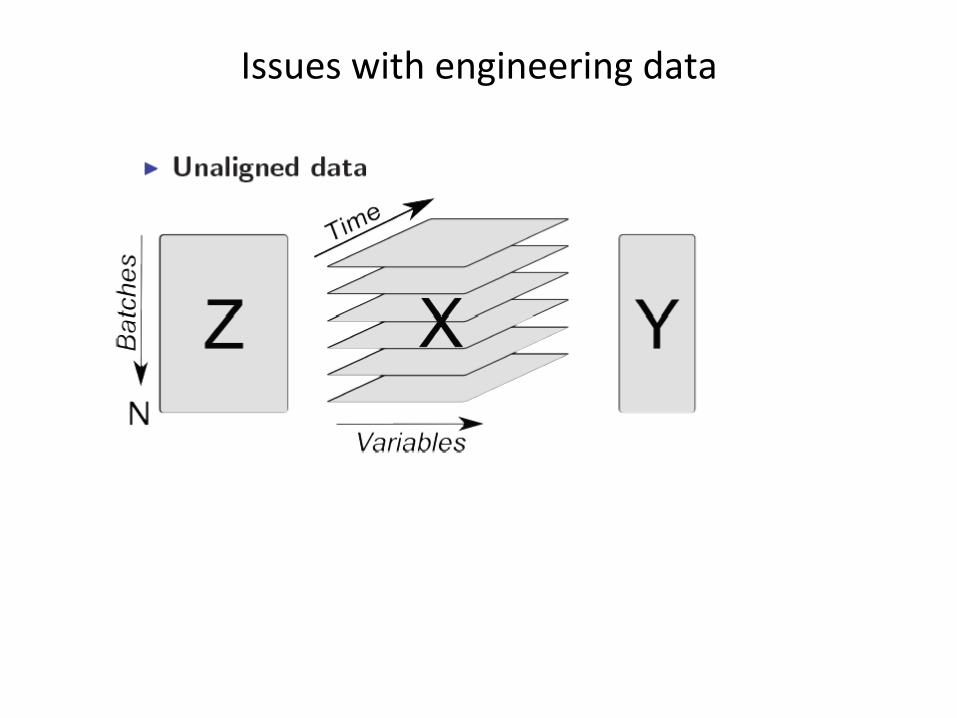
Issues with engineering data

Issues with engineering data
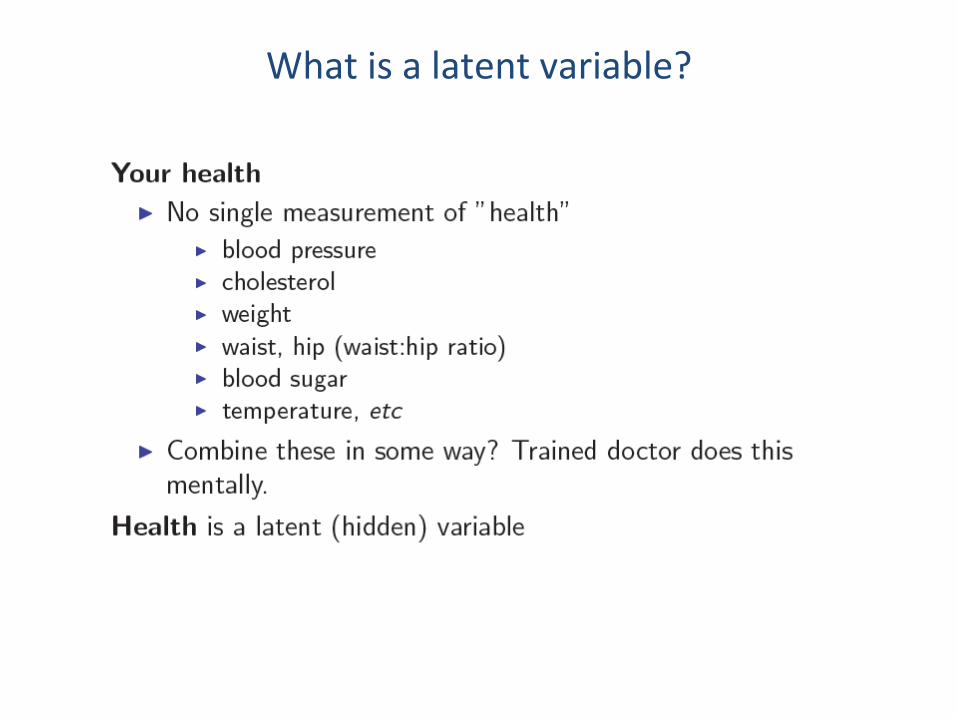
What is a latent variable?
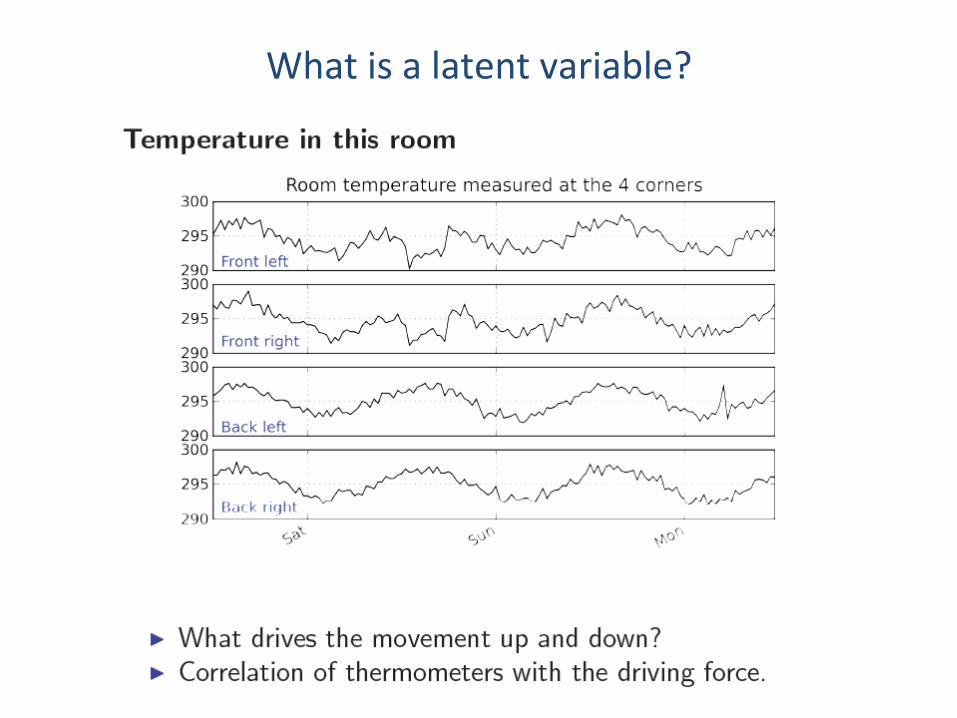
What is a latent variable?

What is a latent variable?

What is a latent variable?

What is a latent variable?
• Visualizing mul$variate data • Geometric interpreta$on of PCA • Mathema$cal interpreta$on • Example(s)
Principal Component Analysis

Principal Component Analysis
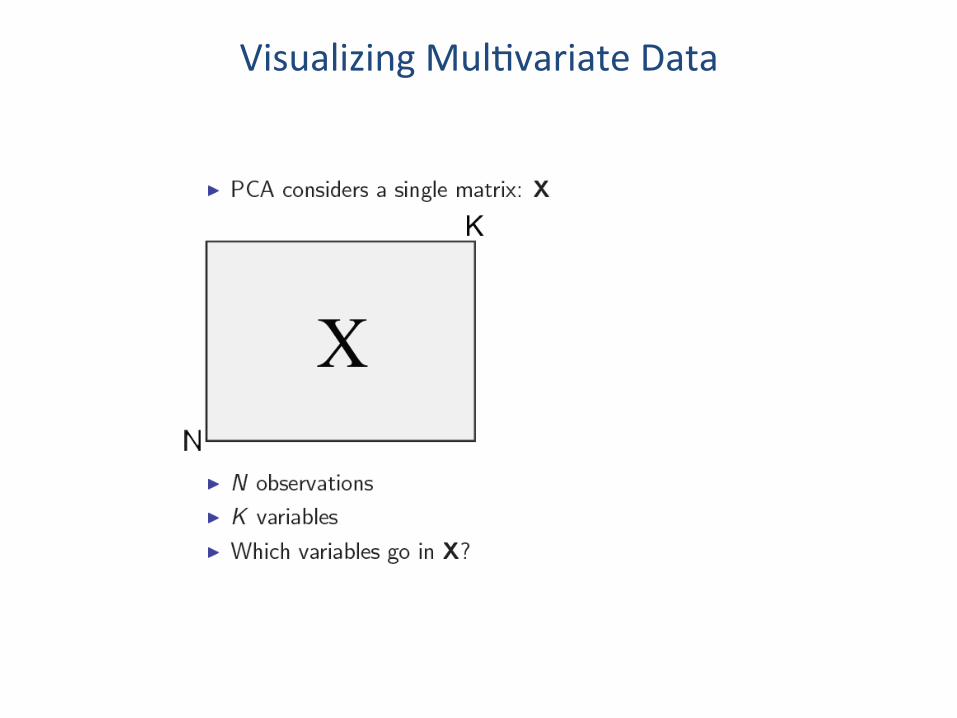
Visualizing Mul$variate Data
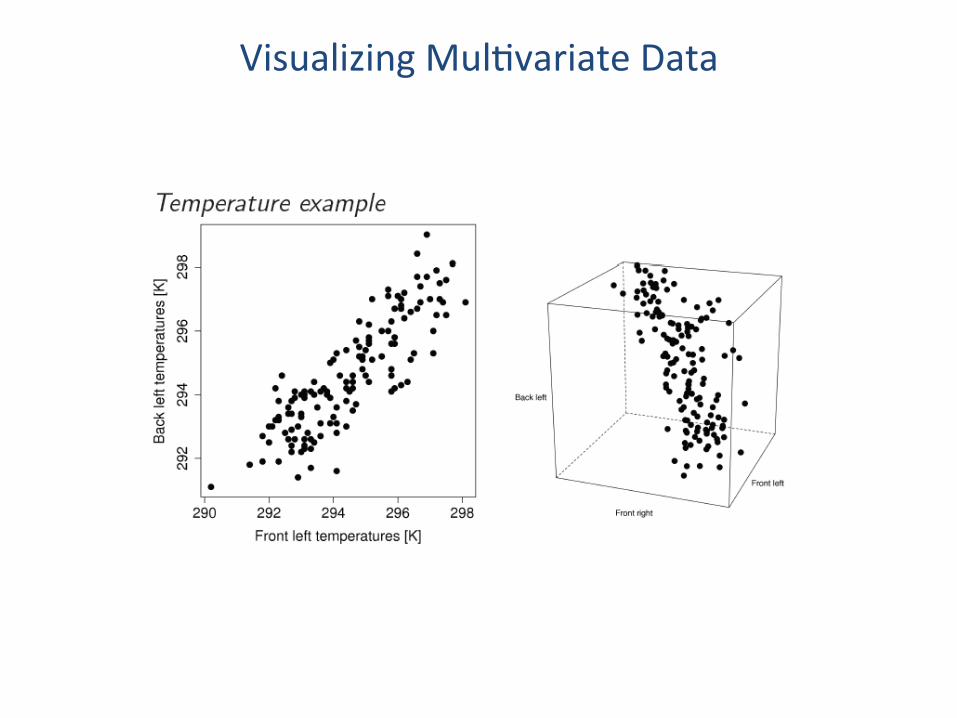
Visualizing Mul$variate Data

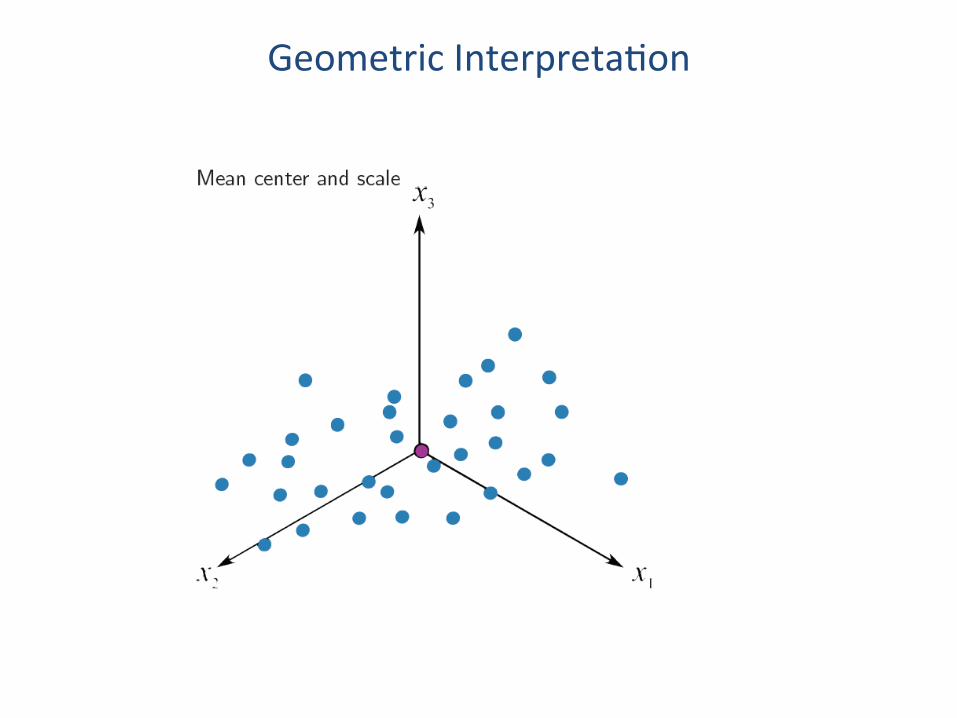
Geometric Interpreta$on

Geometric Interpreta$on
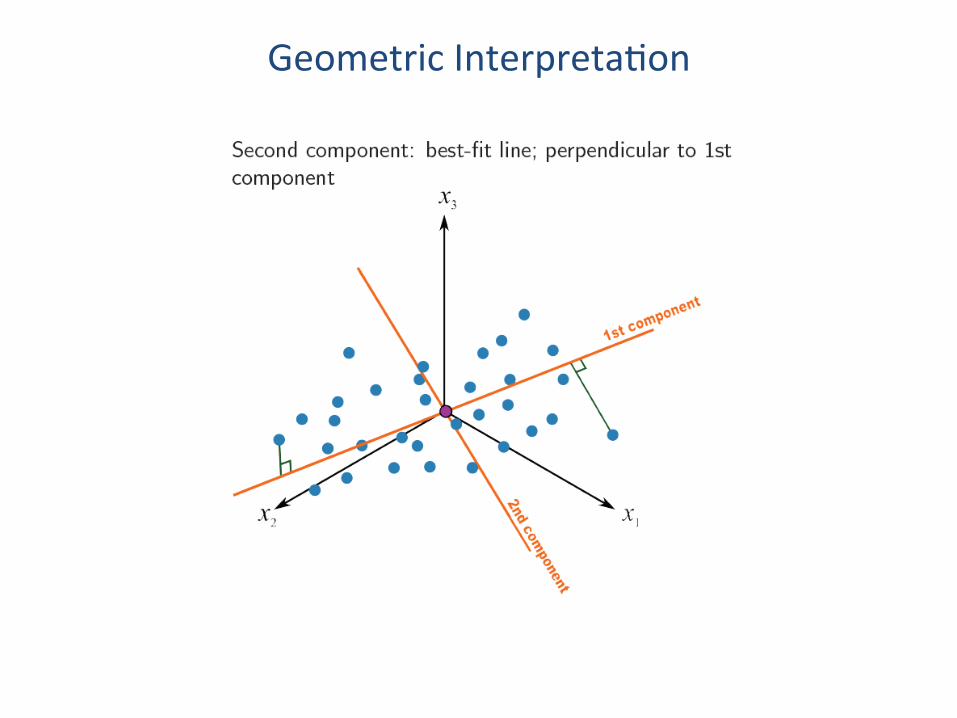
Geometric Interpreta$on

Geometric Interpreta$on

Geometric Interpreta$on
Geometric Interpreta$on

Geometric Interpreta$on

Geometric Interpreta$on
Geometric Interpreta$on
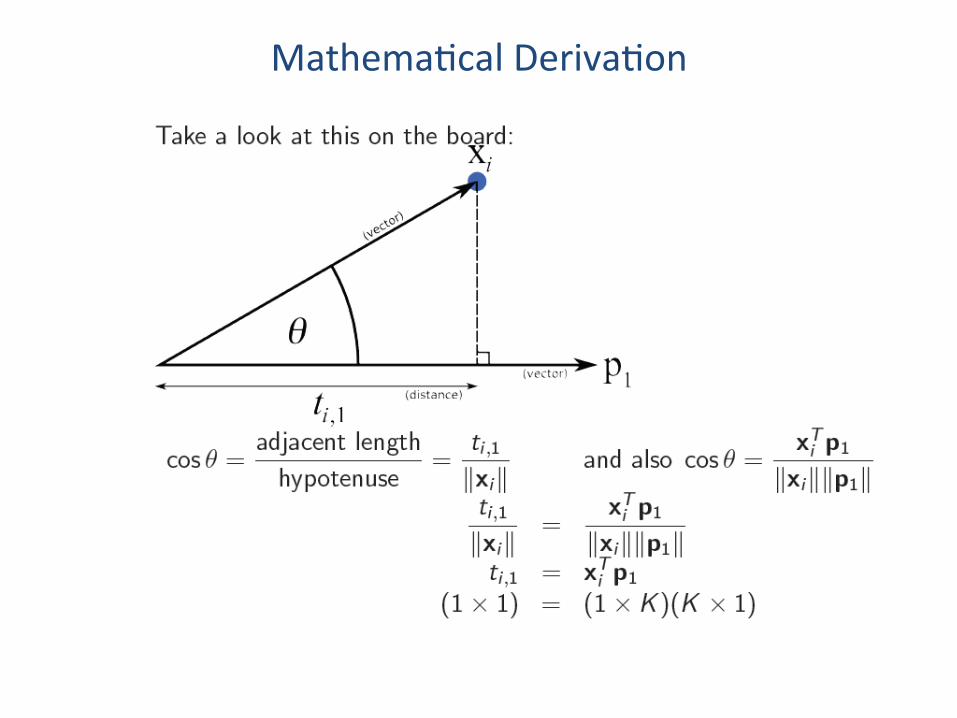
Mathema$cal Deriva$on

Mathema$cal Deriva$on

Predicted value for each observa$ons
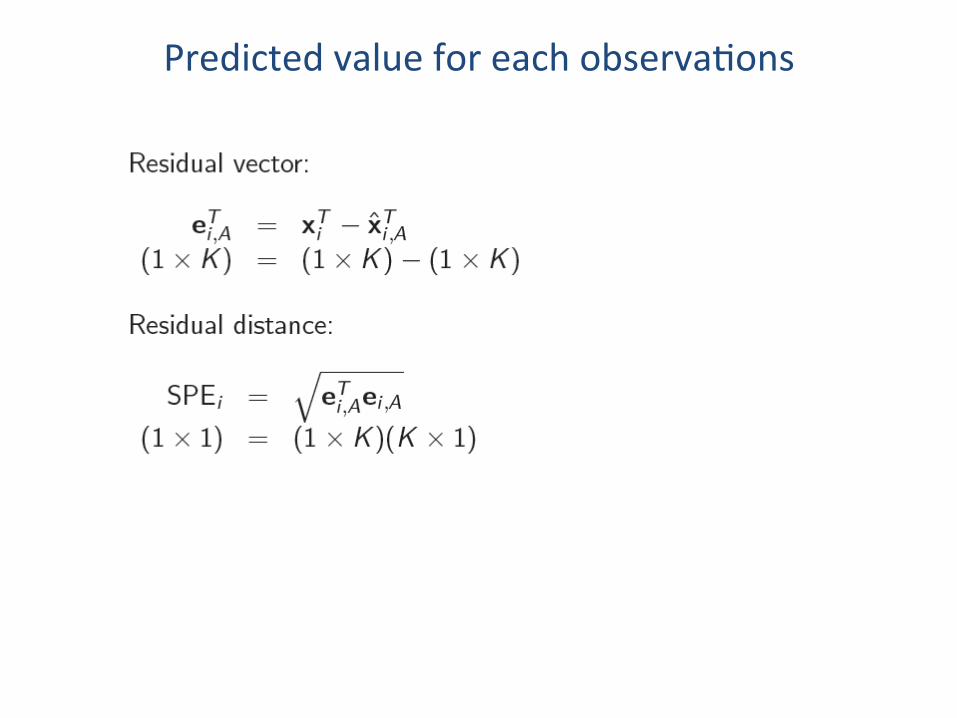
Predicted value for each observa$ons

More about direc$on vector

Preprocessing

Square Predic$on Error
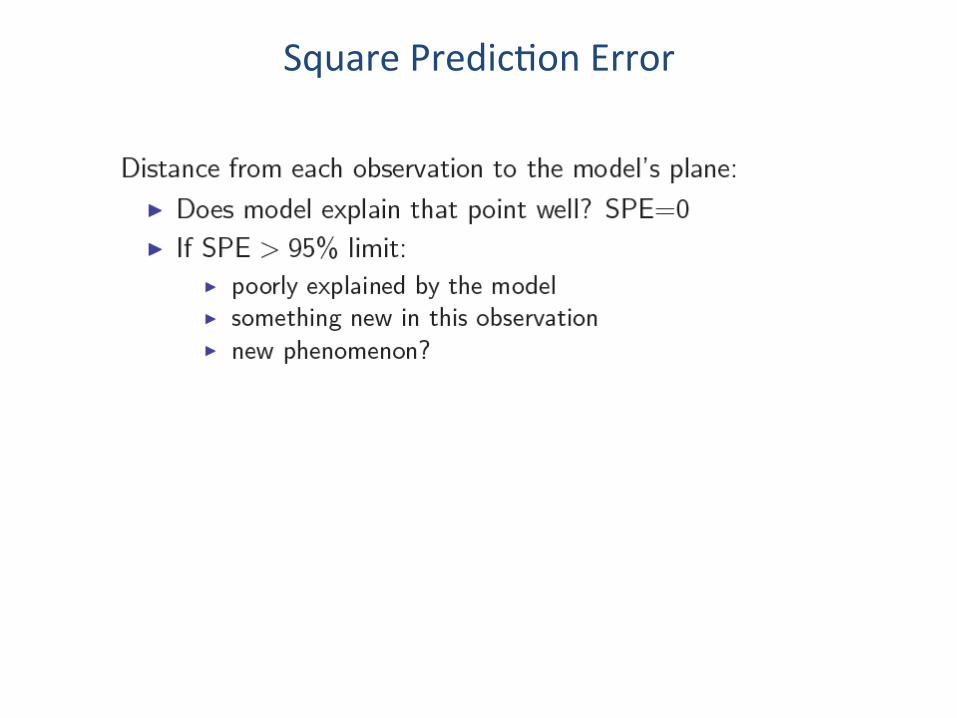
Square Predic$on Error

Square Predic,on Error

Column Residual

Column Residual

Whole Matrix Residual

Example

Example

Hotelling’s T2

Hotelling’s T2
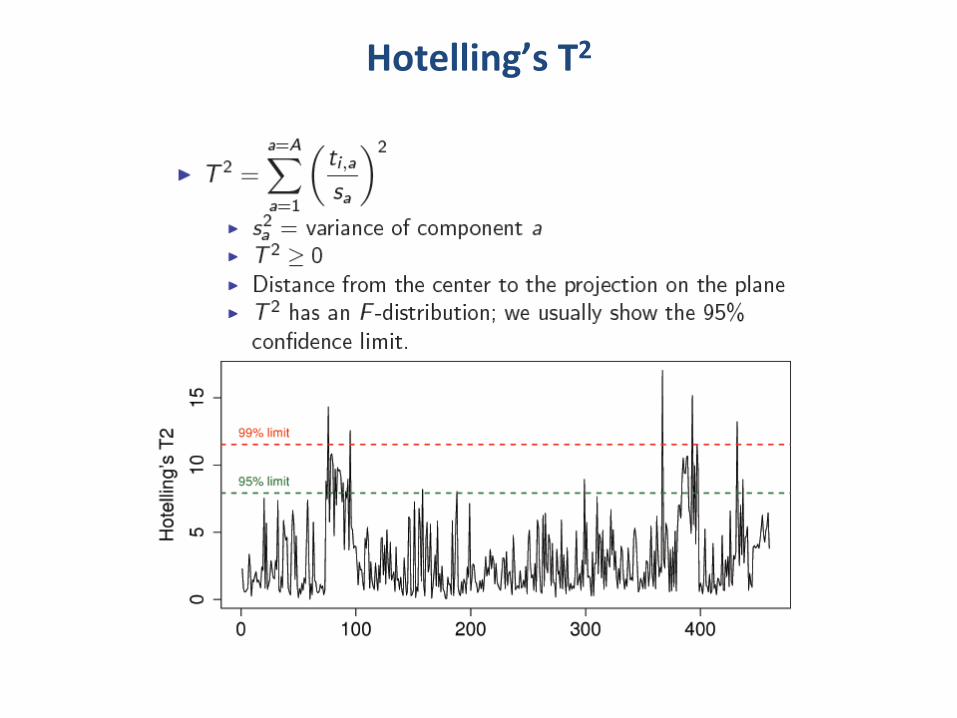
Hotelling’s T2

Preprocessing Data

How is PCA calculated?
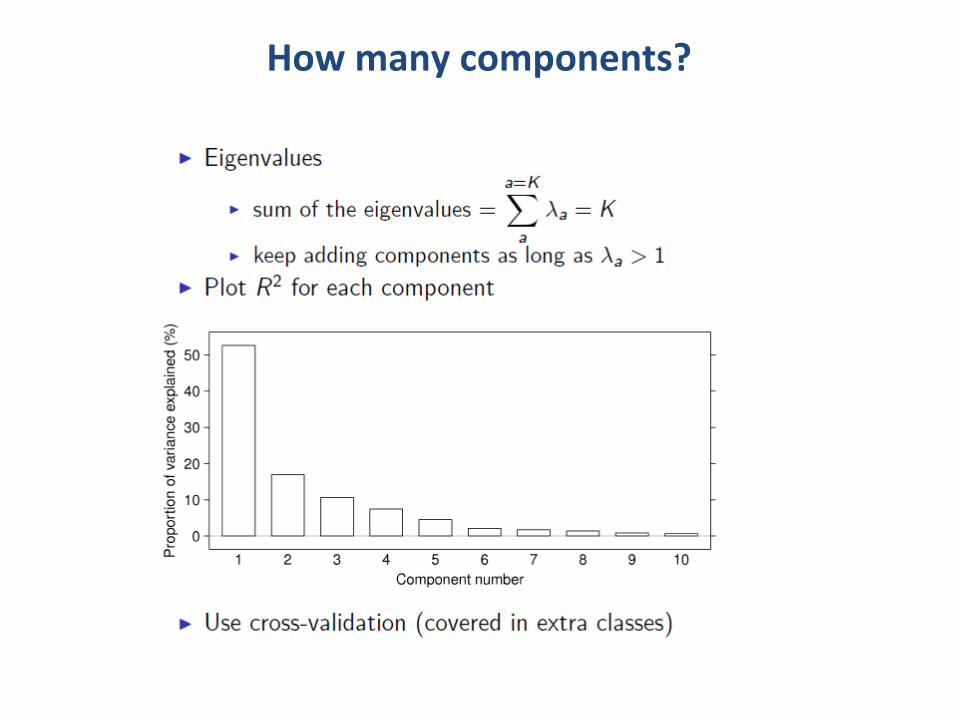
How many components?

Principal Component Regression

Principal Component Regression
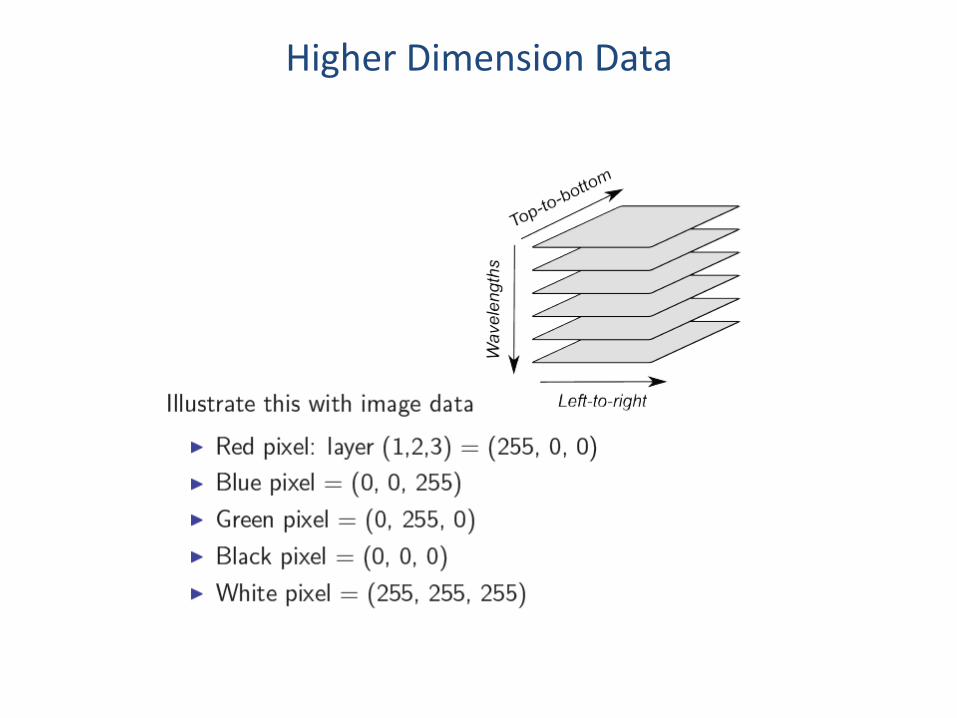
Higher Dimension Data

Higher Dimension Data
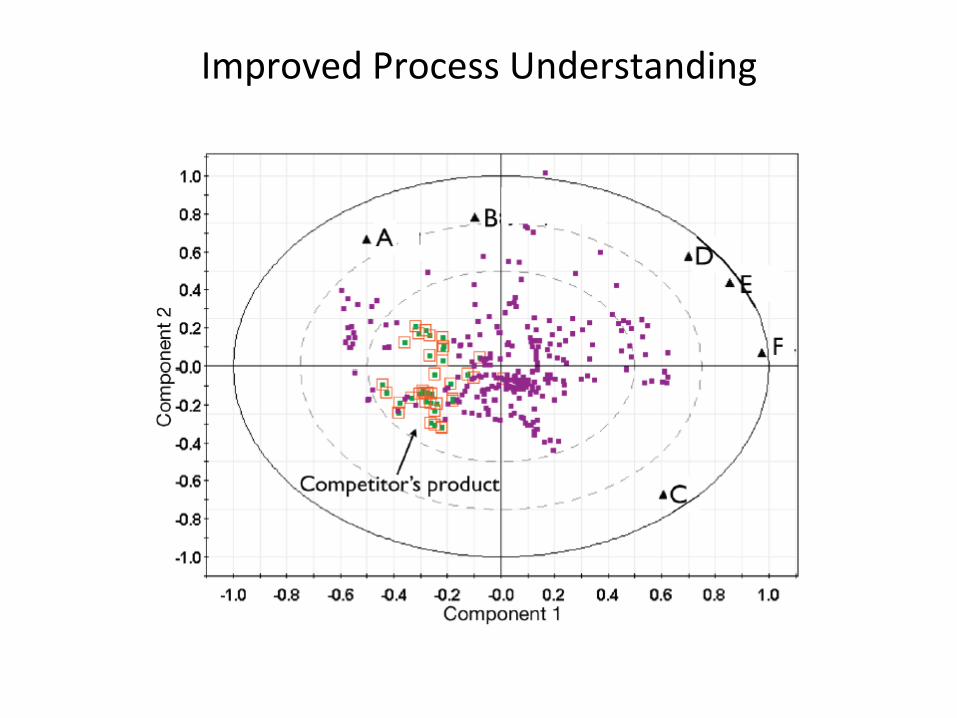
Improved Process Understanding
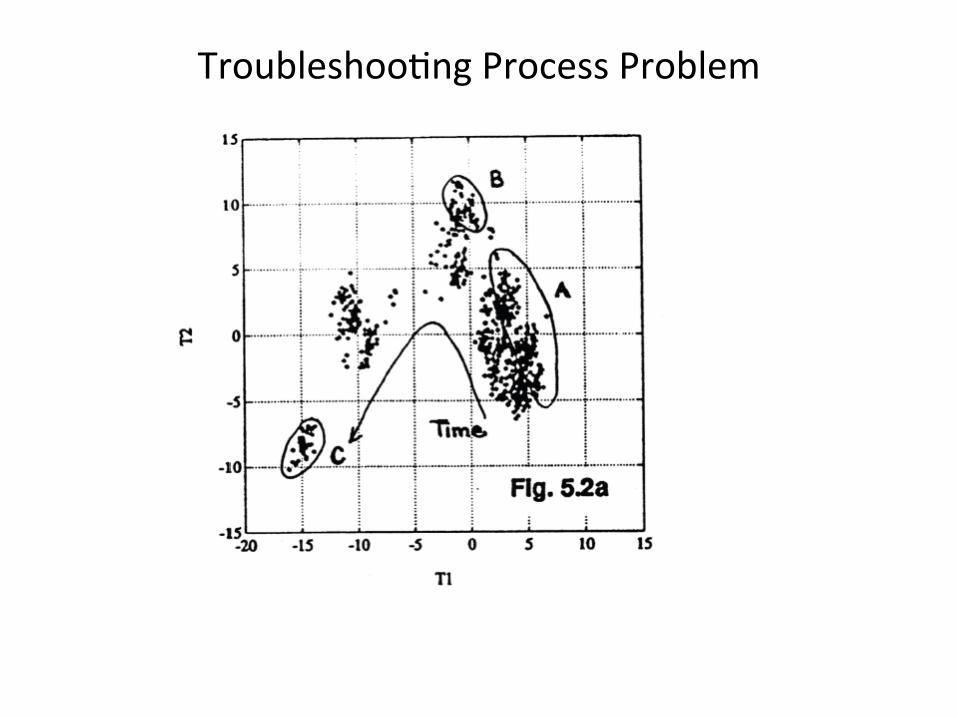
Troubleshoo$ng Process Problem
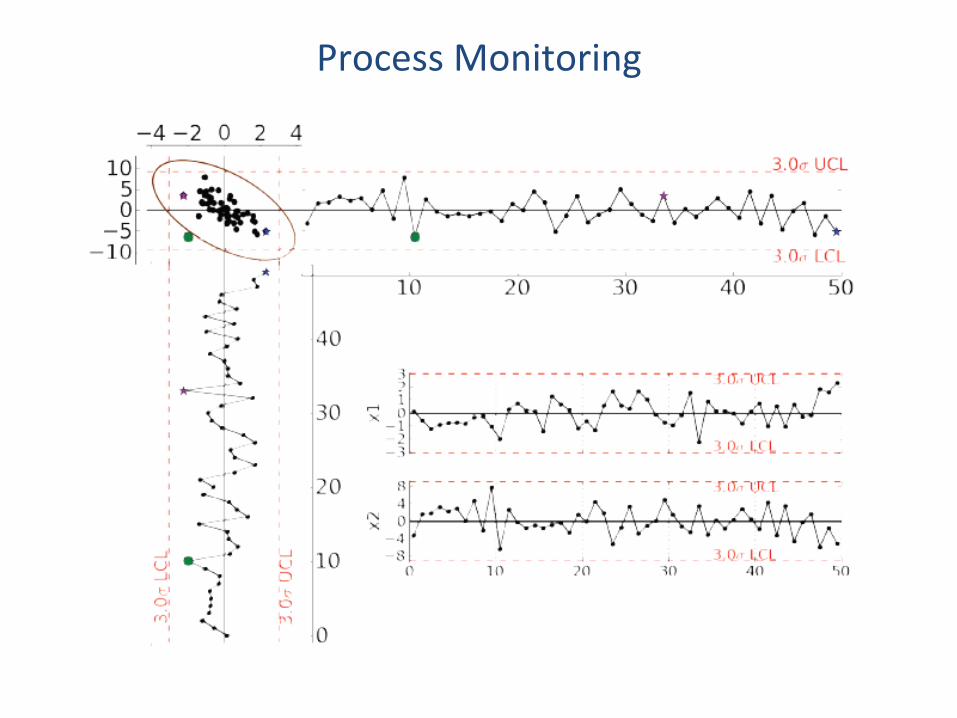
Process Monitoring
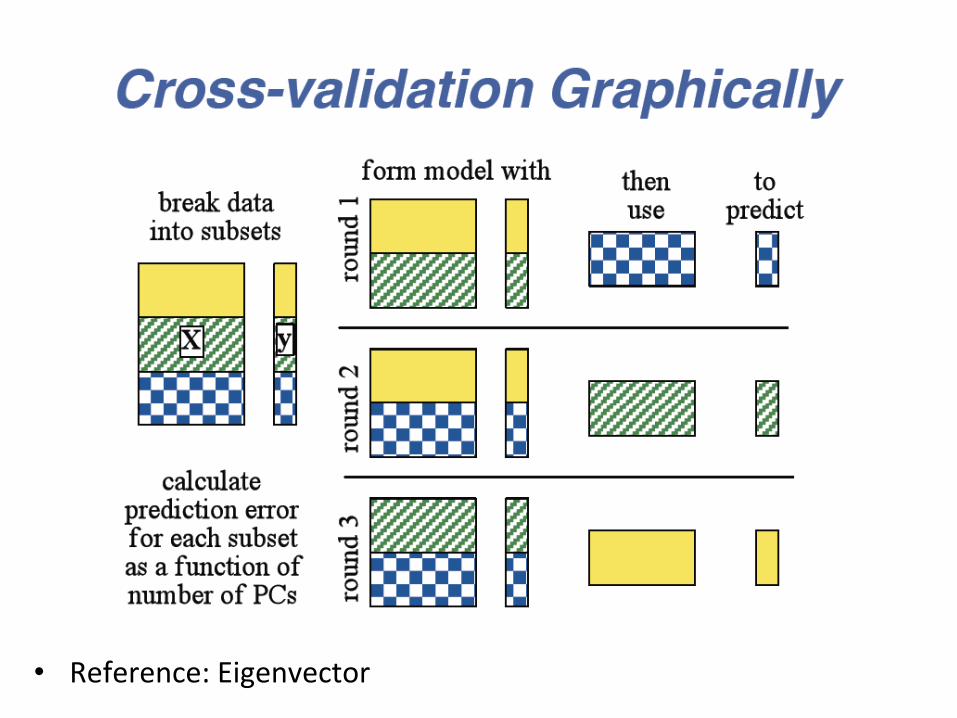
• Reference: Eigenvector
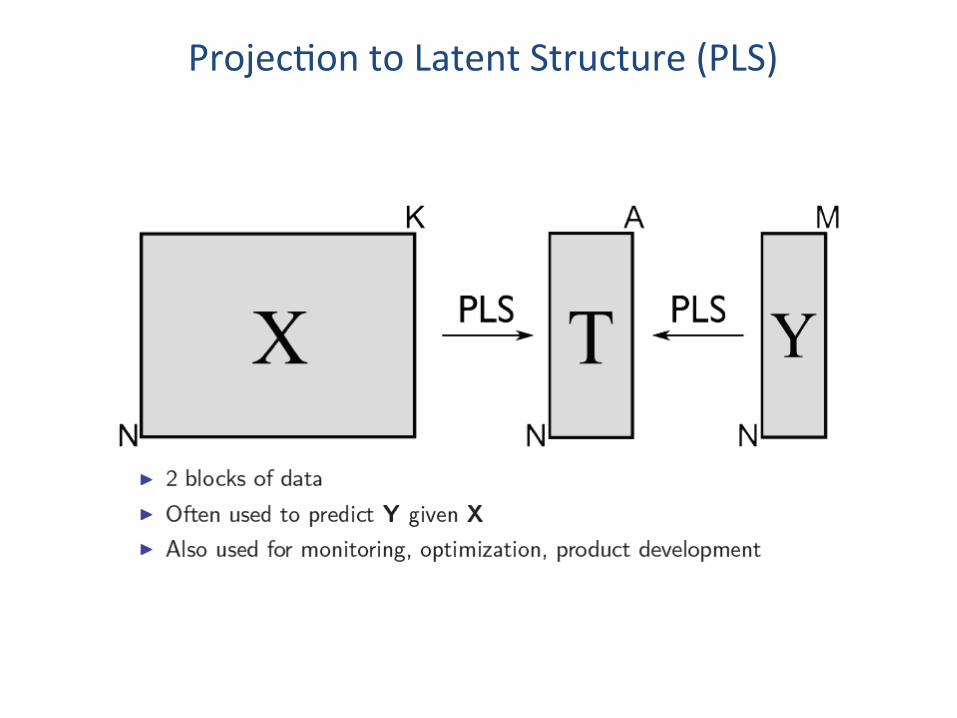
Projec$on to Latent Structure (PLS)

How is PLS model determined
• Reference: Eigenvector
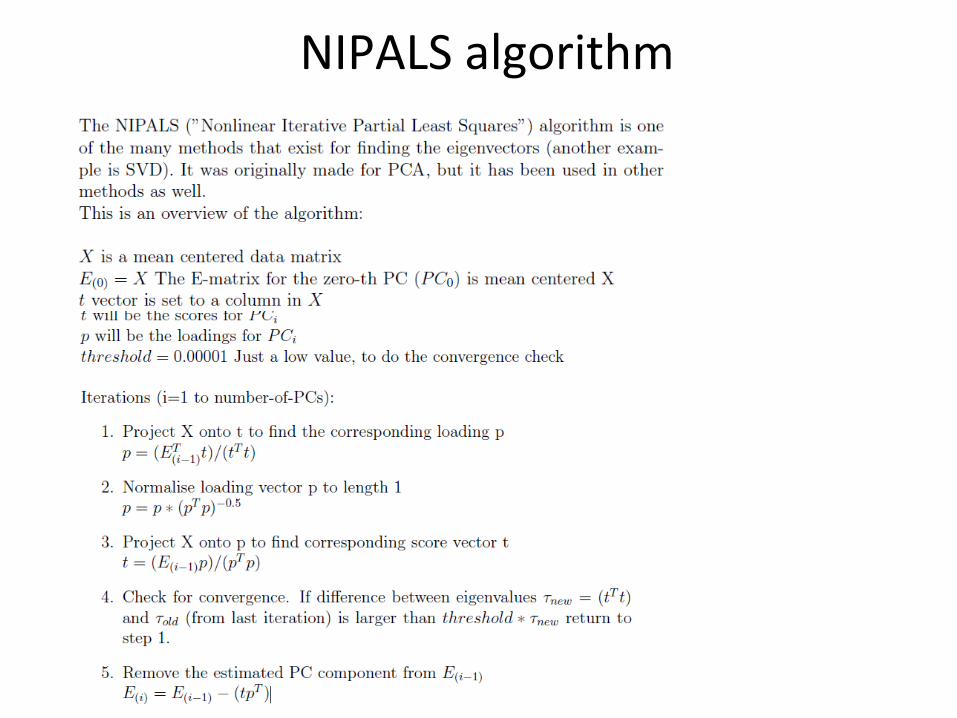
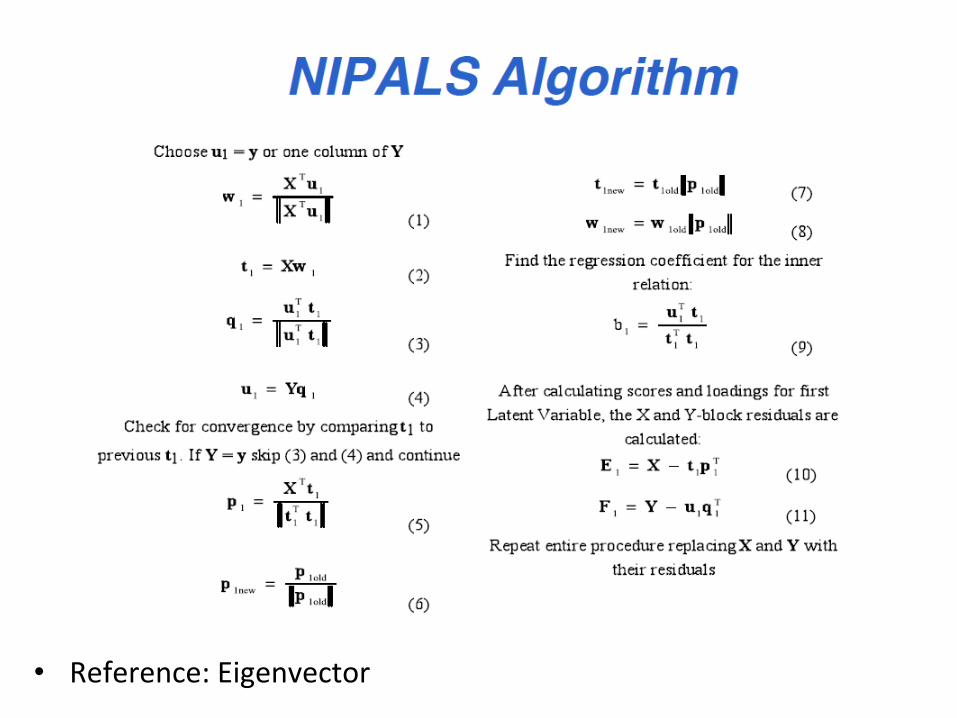
NIPALS algorithm
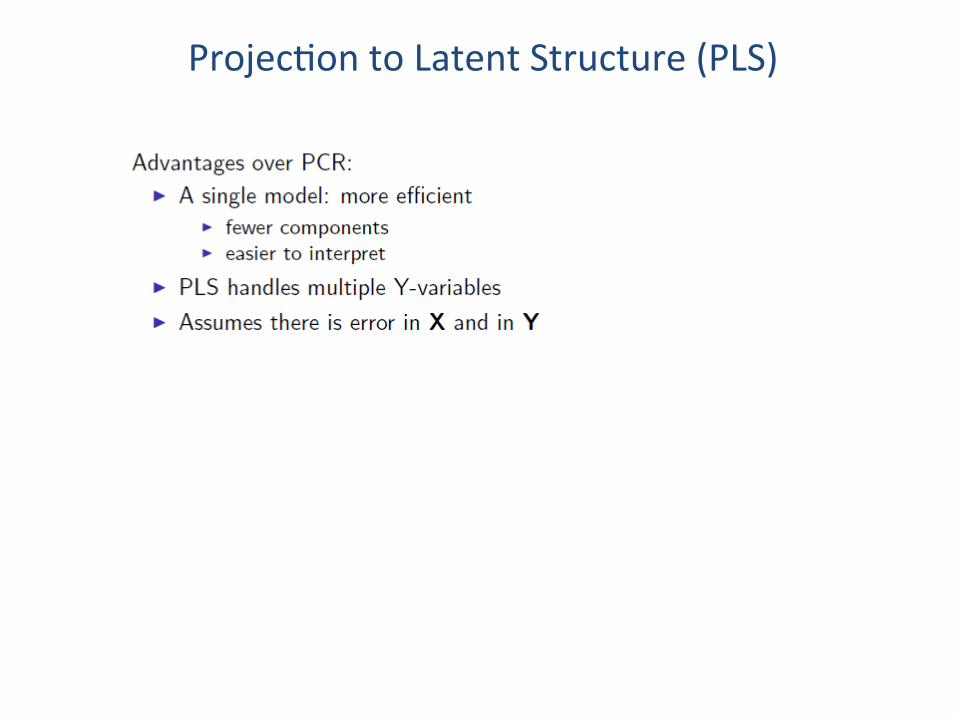
Projec$on to Latent Structure (PLS)

Projec$on to Latent Structure (PLS)

Projec$on to Latent Structure (PLS)

Projec$on to Latent Structure (PLS)
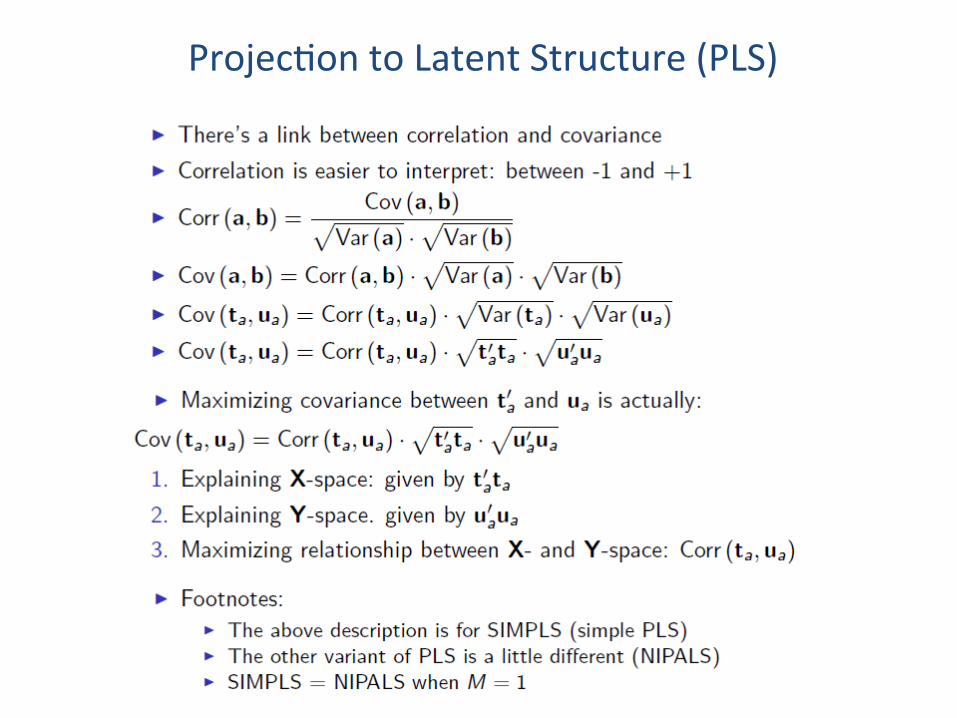
Projec$on to Latent Structure (PLS)

PLS: Geometric Interpreta$on

Interpre$ng scores in PLS

Interpre$ng scores in PLS
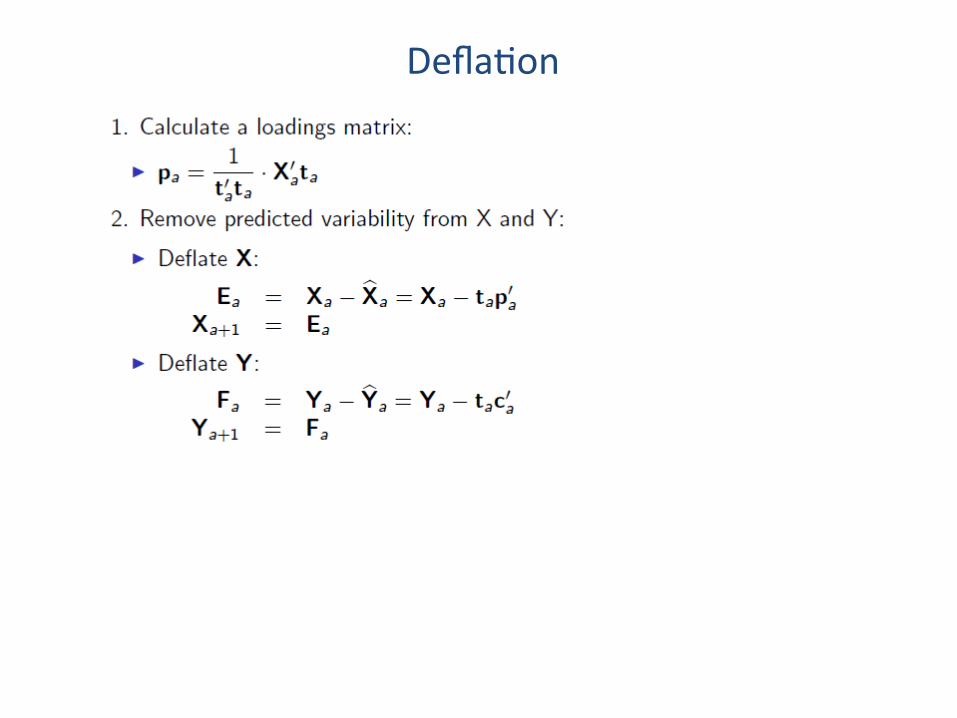
Defla$on

Defla$on

PLS: R2 Values

Classifica$on

Supervised vs. Unsupervised

Unsupervised Classifica$on: PCA

Unsupervised Classifica$on: PCA
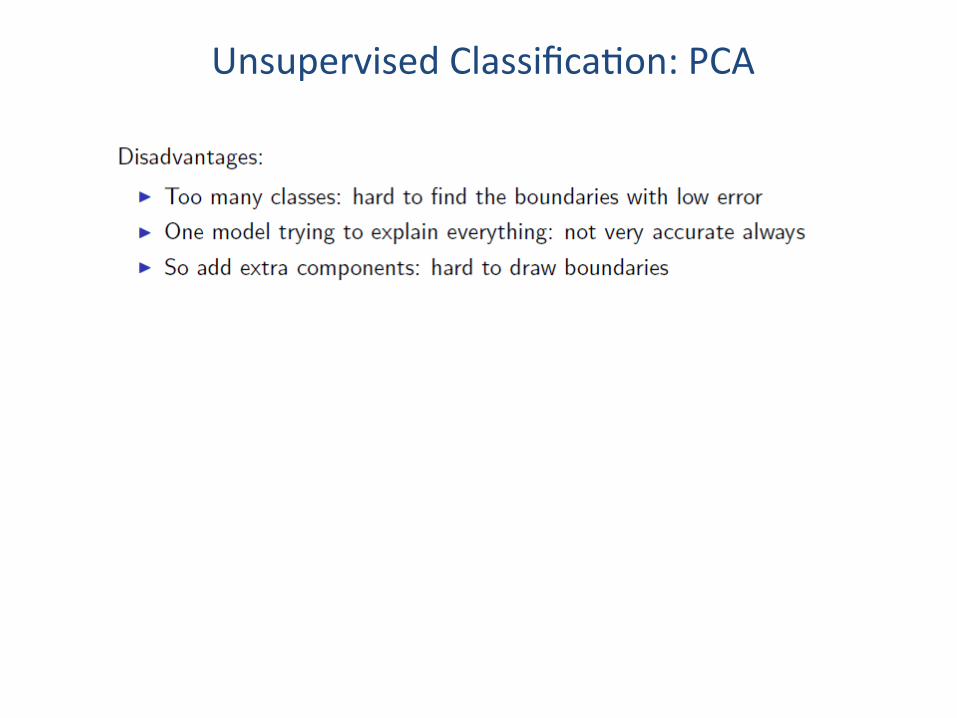
Unsupervised Classifica$on: PCA
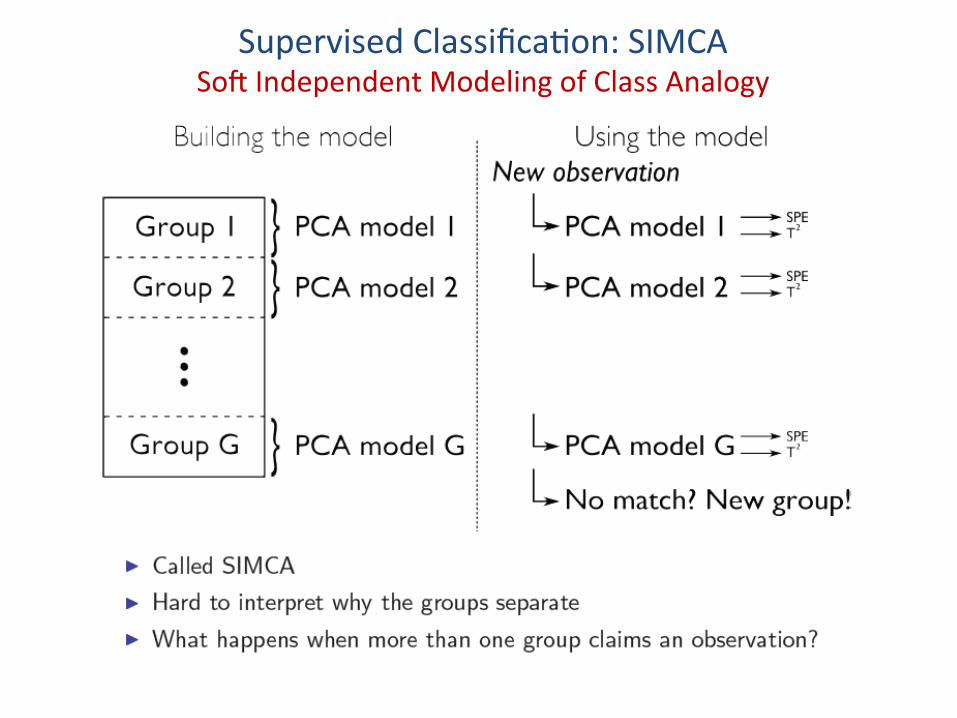
Supervised Classifica$on: SIMCA SoX Independent Modeling of Class Analogy
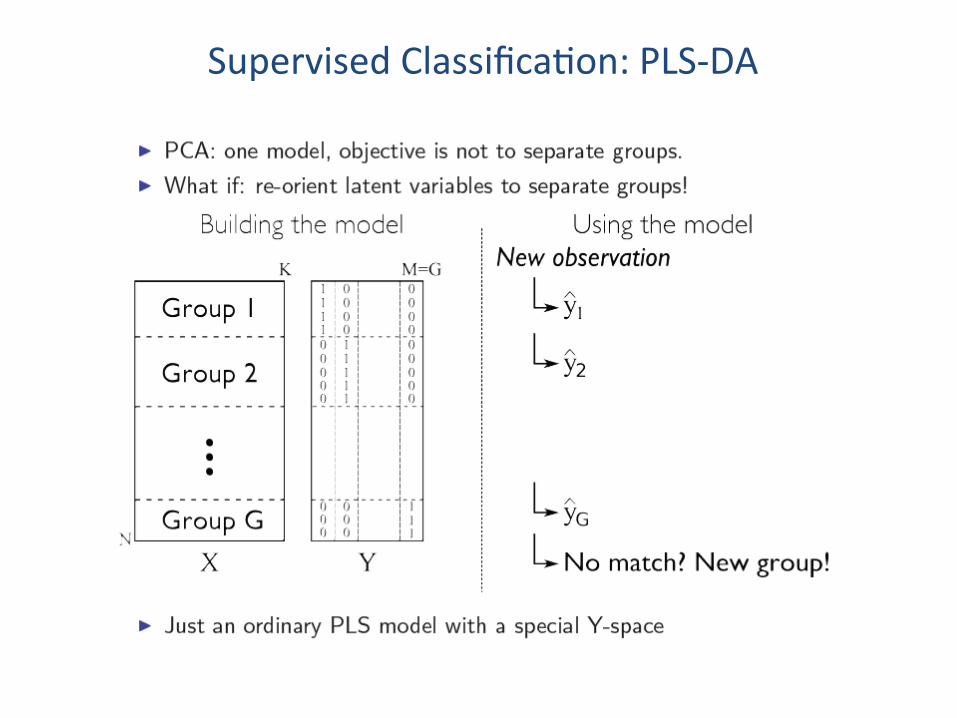
Supervised Classifica$on: PLS-‐DA

Supervised Classifica$on: PLS-‐DA
Tutorial with Raw material NIR data

Raw Material, NIR Spectra

PCA Modeling with Raw Data

PCA Modeling with 1st Deriva$ve

PCA with Cell Growth Data

PLS-‐DA (Score Plot)
Scores on LV1 (71.66%)
-0.010 -0.005 0.000 0.005 0.010
Sco
res
on L
V2
(9.8
1%)
-0.004
-0.002
0.000
0.002
0.004
8H0284B
8E0258
6L0359
9C0230
8E0330
8K0237
8K0067
8E0574
1038147910462698
M031114
1320005528
8008
10033
KA7HN3007
KA9CN6012
DMV
Kerry Milipore
Organo

PLS-‐DA (Loading Plot)
wavenumber (cm-1)
40005000600070008000900010000
Load
ing
for L
V1
-0.20
-0.15
-0.10
-0.05
0.00
0.05
0.10
wavenumber (cm-1)
40005000600070008000900010000Lo
adin
g fo
r LV2
-0.20
-0.15
-0.10
-0.05
0.00
0.05
0.10
0.15
0.20(a) (b)
PLS with Cell Growth Data
• Figure 11. True vs. es$mated values by each PLS model for (a) IVCD of K1 (b) IgG of K1 (c) IVCD of GS (d) IgG of GS (e) IVCD of EB66
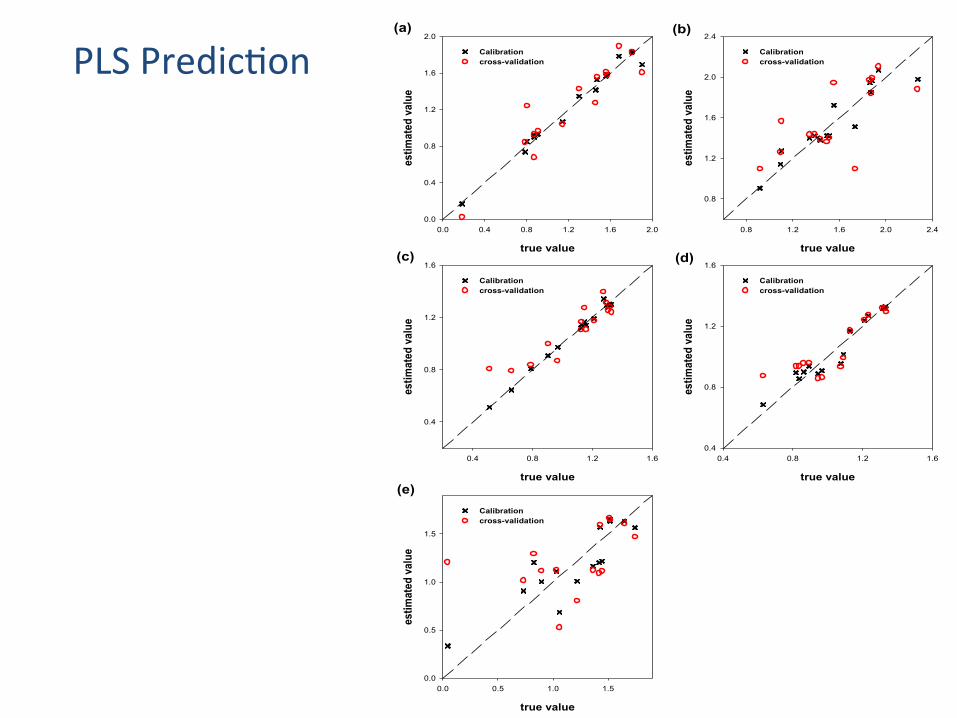
PLS Predic$on
true value
0.0 0.4 0.8 1.2 1.6 2.0
estim
ated
val
ue
0.0
0.4
0.8
1.2
1.6
2.0
Calibrationcross-validation
true value
0.8 1.2 1.6 2.0 2.4
estim
ated
val
ue
0.8
1.2
1.6
2.0
2.4
Calibrationcross-validation
true value
0.4 0.8 1.2 1.6
estim
ated
val
ue0.4
0.8
1.2
1.6
Calibrationcross-validation
true value
0.4 0.8 1.2 1.6
estim
ated
val
ue
0.4
0.8
1.2
1.6
Calibrationcross-validation
true value
0.0 0.5 1.0 1.5
estim
ated
val
ue
0.0
0.5
1.0
1.5
Calibrationcross-validation
(a) (b)
(c) (d)
(e)
PLS and PLS-‐DA • What are good applica$ons of PLS? • What are good applica$ons of PLS-‐DA? • Disadvantages?