quality improvement; problem solving - ruby...
TRANSCRIPT
Running head: QUALITY IMPROVEMENT; PROBLEM SOLVING 1
Quality Improvement: Problem Solving
Ruby Amey
Southwestern College of Professional Studies
Quality Management & Statistics
MGMT 580
Dr. Mohamed Elaoudiy
March 30, 2013
QUALITY IMPROVEMENT; PROBLEM SOLVING 2
Table of Contents
Abstract ……………………………………………………………………………….3
Introduction …………………………………………………………………………..4
Problem Solving Statement …………………………………………………………..4
Problem Solving Steps ……………………………………………………………….4
Problem Solving Step Matrix ………………………………………………………5-7
Brainstorming Particles ………………………………………………………………8
Updated Problem Solving Steps …………………………………………………..8-11
WHY-WHY Diagram ……………………………………………………………11-12
C Chart …………………………………………………………………………...12-13
Cause and Effect Diagram ……………………………………………………….13-14
Force-Field Analysis ……………………………………………………………. 15-16
Conclusion …………………………………………………………………….....16-17
Reference ……………………………………………………………………………18
QUALITY IMPROVEMENT; PROBLEM SOLVING 3
Abstract
WP Inc. is a manufacturer of small metal parts. They create tools, stamps, bends, and forms
metal parts. They deburr, wash, and ship the parts to the customer. WP has a continuous problem
with automatic parts washer that is used to wash small particles of dirt and oil from the parts.
The parts washer works like a dishwasher. The problem that is reoccurring involves the spray
nozzles that clog with particles, causing the parts washer to shut down. The problem-solving
steps plan recognizes the problem, develops performance measures, defines the problem,
document and analyzes the problem or process, and determines possible causes. The quality
assurance team will identify, select, and implement the solution. We will evaluate the solution,
ensure permanence, and have continuous improvement. The problem will be resolved using
Charts, Cause and Effect Diagrams, Why- Why Diagrams, Equations, and Force-Field Analysis
for Clogged Nozzle Problem Improvements. Management will provide a summary detailing
problem- solving steps taken in this case.
QUALITY IMPROVEMENT; PROBLEM SOLVING 4
Quality Improvement; Problem Solving
WP Inc. is a manufacturer of small metal parts. They create tools, stamps, bends, and
forms metal parts. They deburr, wash, and ship the parts to the customer. WP has a continuous
problem with automatic parts washer that is used to wash small particles of dirt and oil from the
parts. The parts washer works like a dishwasher. The problem that is reoccurring involves the
spray nozzles that clog with particles, causing the parts washer to shut down. The nozzle
clogging problem causes serious time delays, because every part that is manufactured goes
through the parts washer. The parts washing operation is a critical part of WP’s quality process.
(Summers, 2010)
Problem Solving Statement
I have designed a problem solving statement. The clogging of the nozzles need fixing and
a free- floating particles have to be stopped.
Problem Solving Steps
I have established a quality improvement team. This team was made of operators,
technicians, and engineers. This plan recognizes the problem, develops performance measures,
defines the problem, document and analyzes the problem or process, and determines possible
causes.
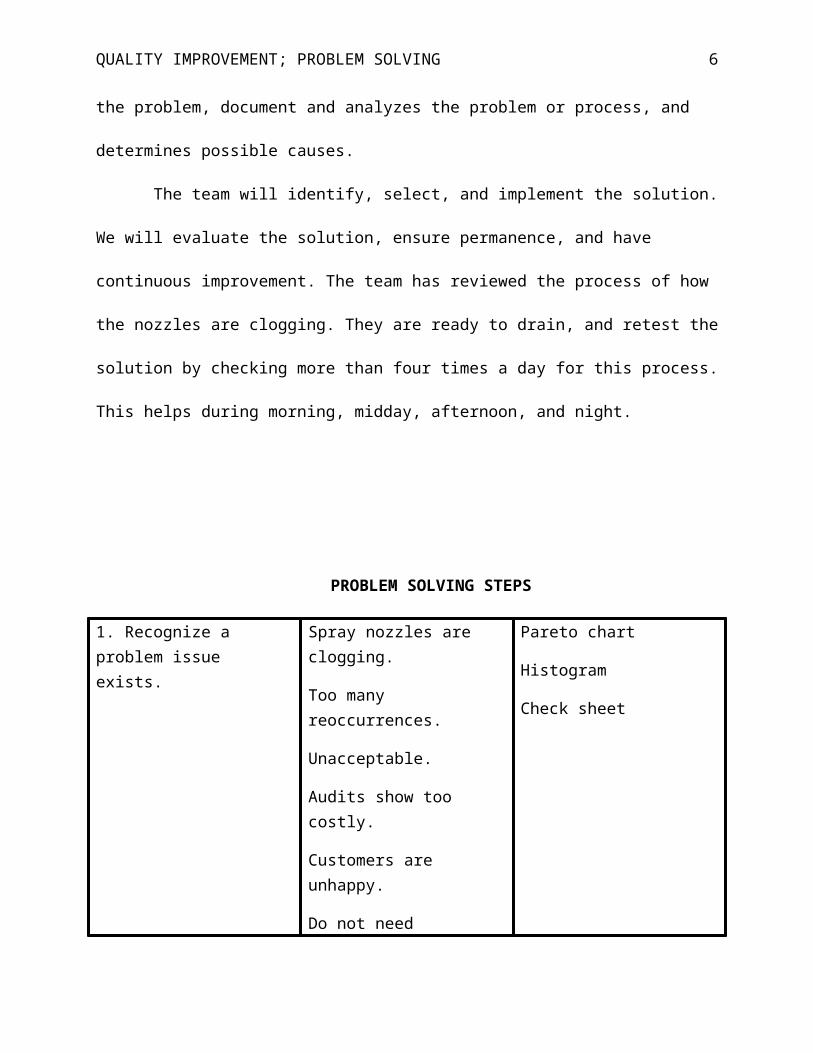
The team will identify, select, and implement the solution. We will evaluate the solution,
ensure permanence, and have continuous improvement. The team has reviewed the process of
how the nozzles are clogging. They are ready to drain, and retest the solution by checking more
than four times a day for this process. This helps during morning, midday, afternoon, and night.
QUALITY IMPROVEMENT; PROBLEM SOLVING 5
PROBLEM SOLVING STEPS
1. Recognize a problem issue exists.
Spray nozzles are clogging.
Too many reoccurrences.
Unacceptable.
Audits show too costly.
Customers are unhappy.
Do not need lawsuits.
Pareto chart
Histogram
Check sheet
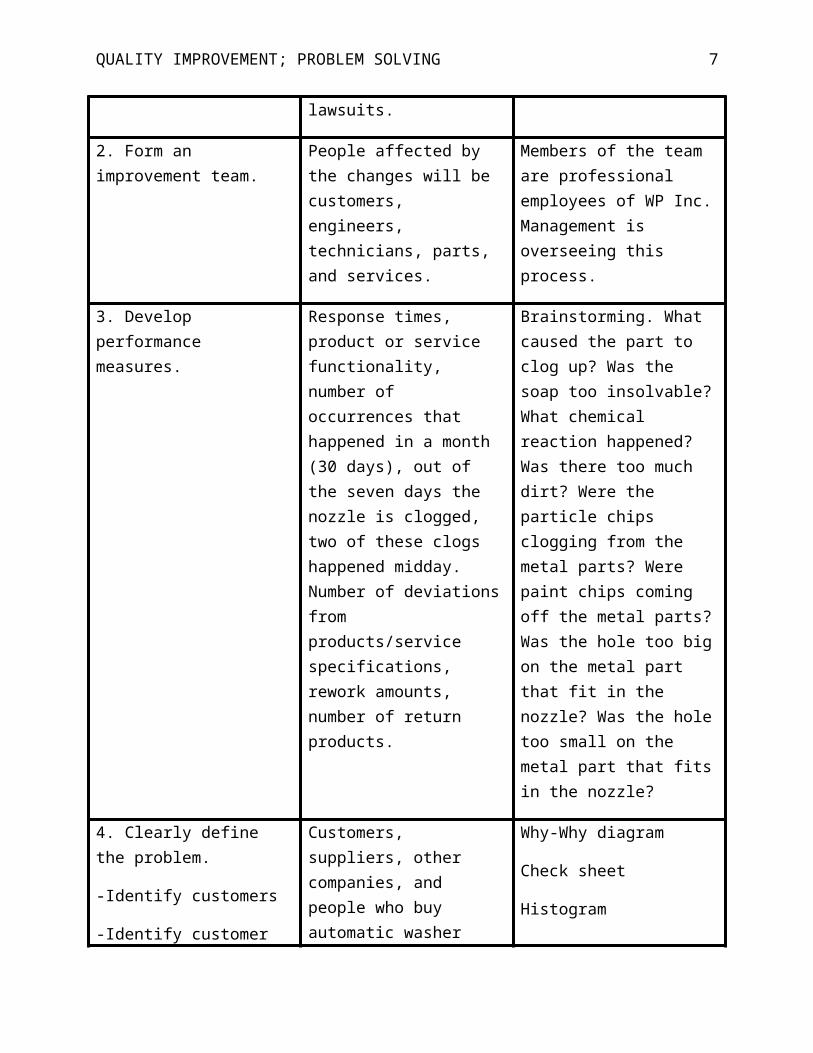
2. Form an improvement team. People affected by the changes will be customers, engineers, technicians, parts, and services.
Members of the team are professional employees of WP Inc. Management is overseeing this process.
3. Develop performance measures.
Response times, product or service functionality, number of occurrences that happened in a month (30 days), out of the seven days the nozzle is clogged, two of these clogs happened midday. Number of deviations from products/service specifications, rework amounts, number of return products.
Brainstorming. What caused the part to clog up? Was the soap too insolvable? What chemical reaction happened? Was there too much dirt? Were the particle chips clogging from the metal parts? Were paint chips coming off the metal parts? Was the hole too big on the metal part that fit in the nozzle? Was the hole too small on the metal part that fits in the nozzle?
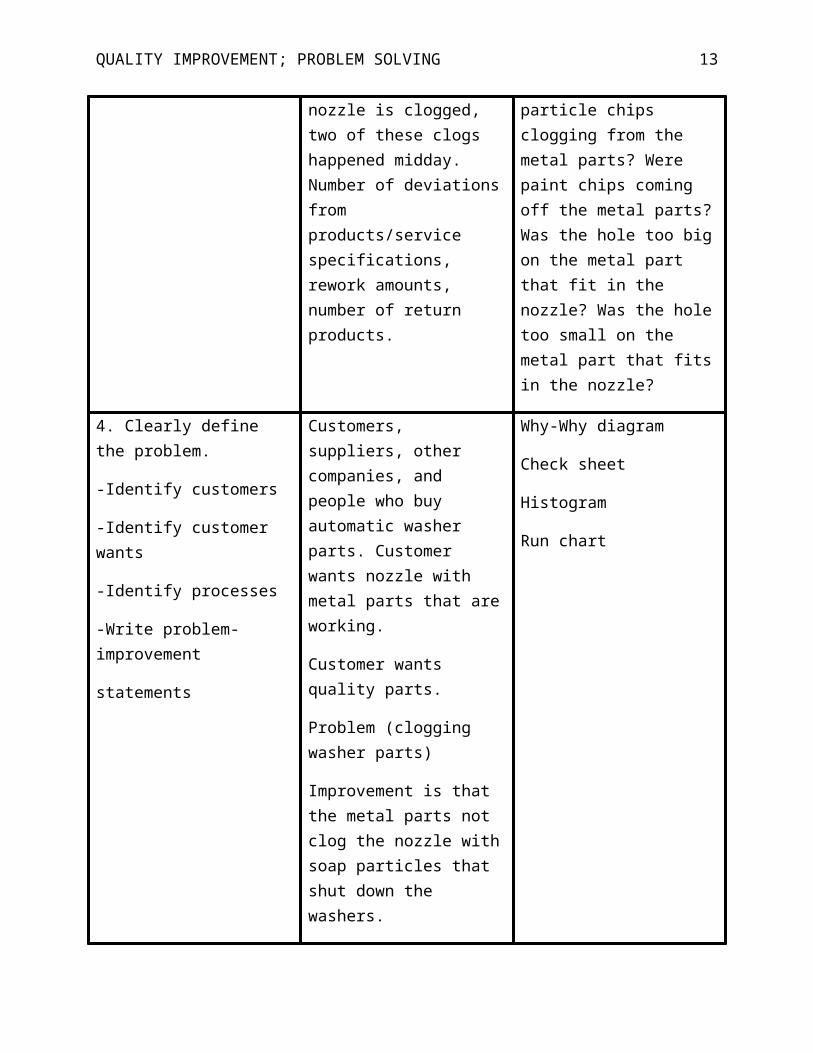
4. Clearly define the problem.
-Identify customers
-Identify customer wants
-Identify processes
-Write problem-improvement
Customers, suppliers, other companies, and people who buy automatic washer parts. Customer wants nozzle with metal parts that are working.
Customer wants quality parts.
Problem (clogging washer
Why-Why diagram
Check sheet
Histogram
Run chart
QUALITY IMPROVEMENT; PROBLEM SOLVING 6
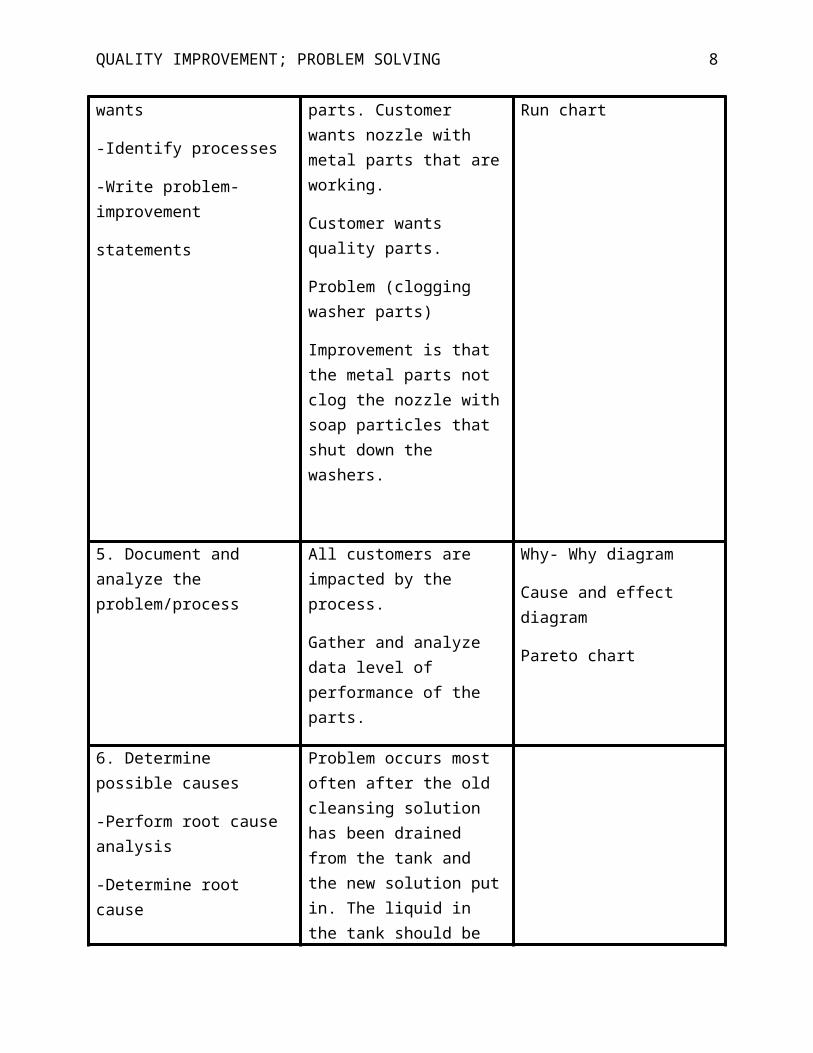
statements parts)
Improvement is that the metal parts not clog the nozzle with soap particles that shut down the washers.
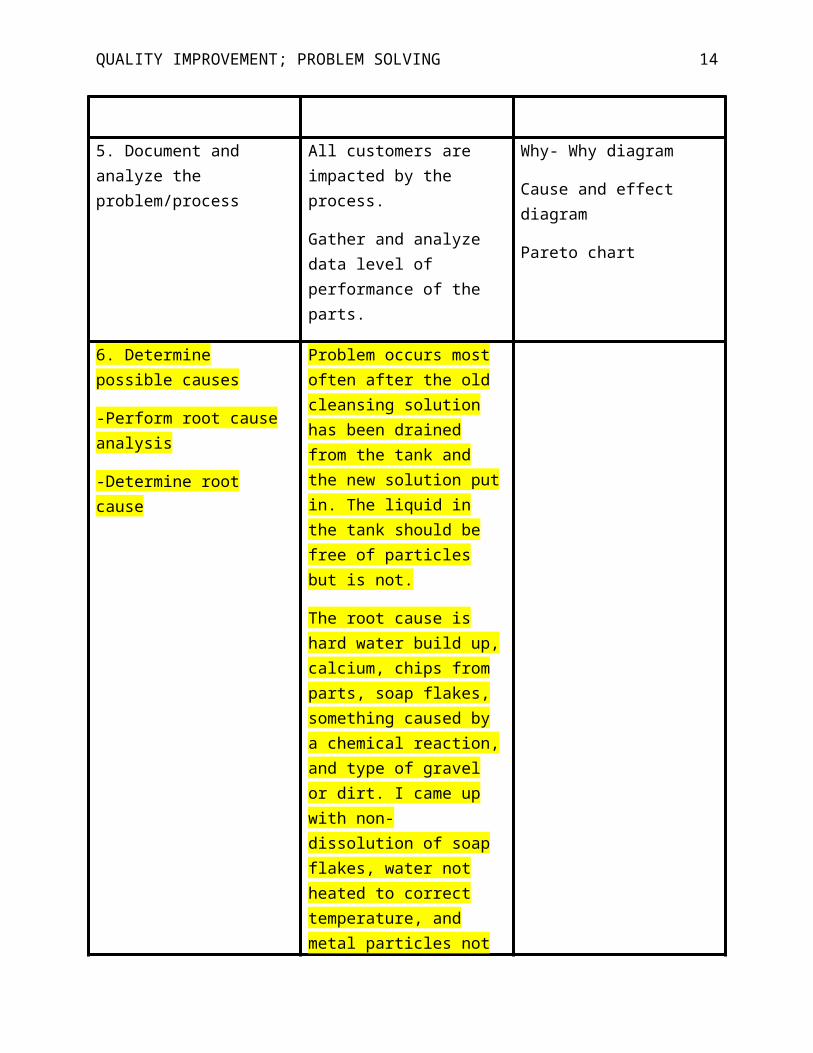
5. Document and analyze the problem/process
All customers are impacted by the process.
Gather and analyze data level of performance of the parts.
Why- Why diagram
Cause and effect diagram
Pareto chart
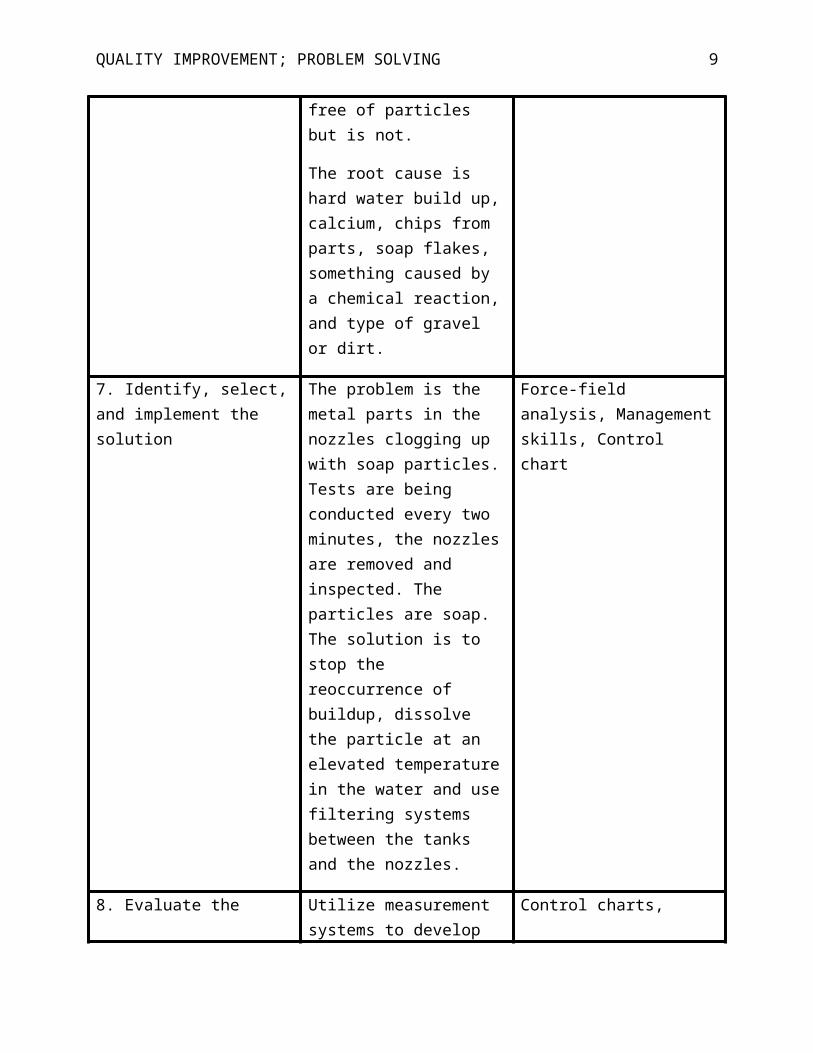
6. Determine possible causes
-Perform root cause analysis
-Determine root cause
Problem occurs most often after the old cleansing solution has been drained from the tank and the new solution put in. The liquid in the tank should be free of particles but is not.
The root cause is hard water build up, calcium, chips from parts, soap flakes, something caused by a chemical reaction, and type of gravel or dirt.
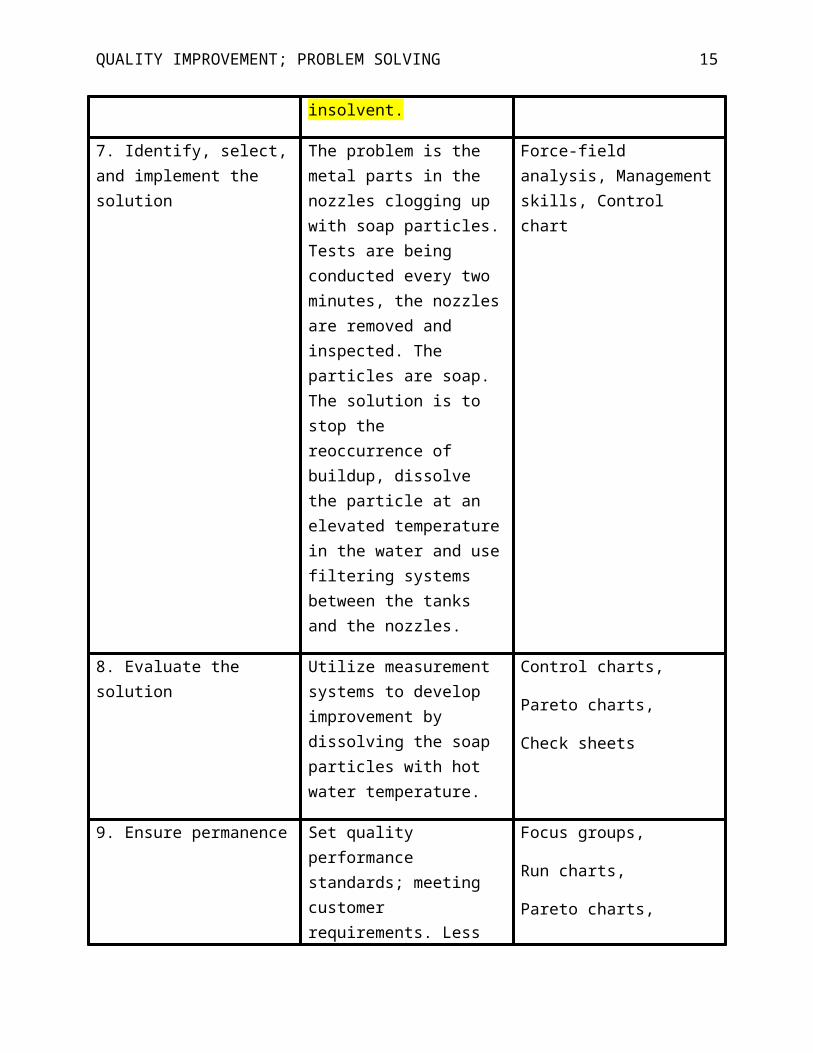
7. Identify, select, and implement the solution
The problem is the metal parts in the nozzles clogging up with soap particles. Tests are being conducted every two minutes, the nozzles are removed and inspected. The particles are soap. The solution is to stop the reoccurrence of buildup, dissolve the particle at an elevated temperature in the water and use filtering systems between the tanks and the nozzles.
Force-field analysis, Management skills, Control chart
QUALITY IMPROVEMENT; PROBLEM SOLVING 7
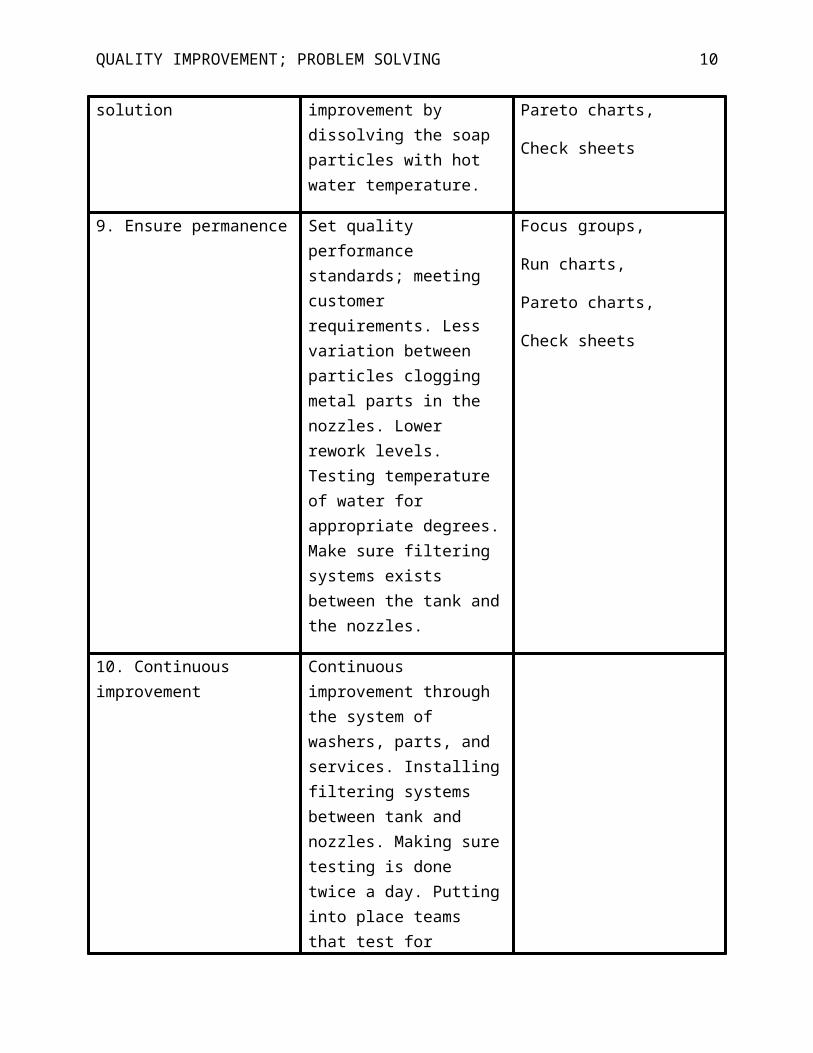
8. Evaluate the solution Utilize measurement systems to develop improvement by dissolving the soap particles with hot water temperature.
Control charts,
Pareto charts,
Check sheets
9. Ensure permanence Set quality performance standards; meeting customer requirements. Less variation between particles clogging metal parts in the nozzles. Lower rework levels. Testing temperature of water for appropriate degrees. Make sure filtering systems exists between the tank and the nozzles.
Focus groups,
Run charts,
Pareto charts,
Check sheets
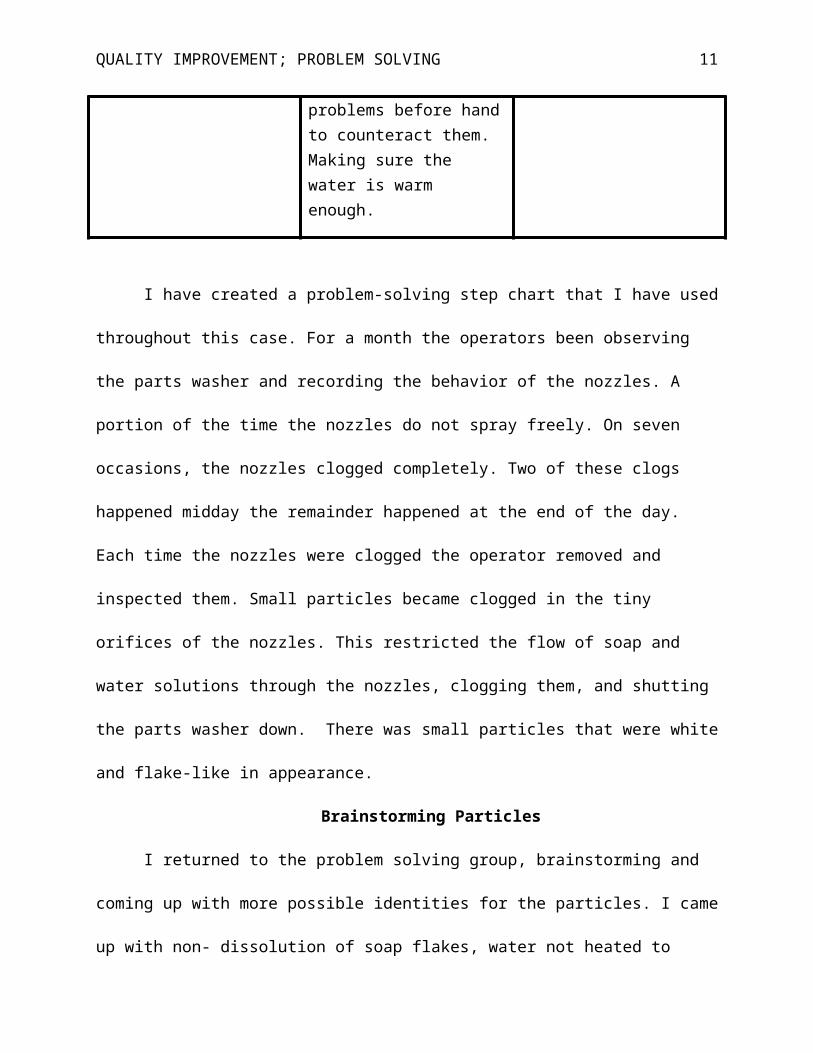
10. Continuous improvement Continuous improvement through the system of washers, parts, and services. Installing filtering systems between tank and nozzles. Making sure testing is done twice a day. Putting into place teams that test for problems before hand to counteract them. Making sure the water is warm enough.
I have created a problem-solving step chart that I have used throughout this case. For a
month the operators been observing the parts washer and recording the behavior of the nozzles.
A portion of the time the nozzles do not spray freely. On seven occasions, the nozzles clogged
completely. Two of these clogs happened midday the remainder happened at the end of the day.
Each time the nozzles were clogged the operator removed and inspected them. Small particles
became clogged in the tiny orifices of the nozzles. This restricted the flow of soap and water
QUALITY IMPROVEMENT; PROBLEM SOLVING 8
solutions through the nozzles, clogging them, and shutting the parts washer down. There was
small particles that were white and flake-like in appearance.
Brainstorming Particles
I returned to the problem solving group, brainstorming and coming up with more possible
identities for the particles. I came up with non- dissolution of soap flakes, water not heated to
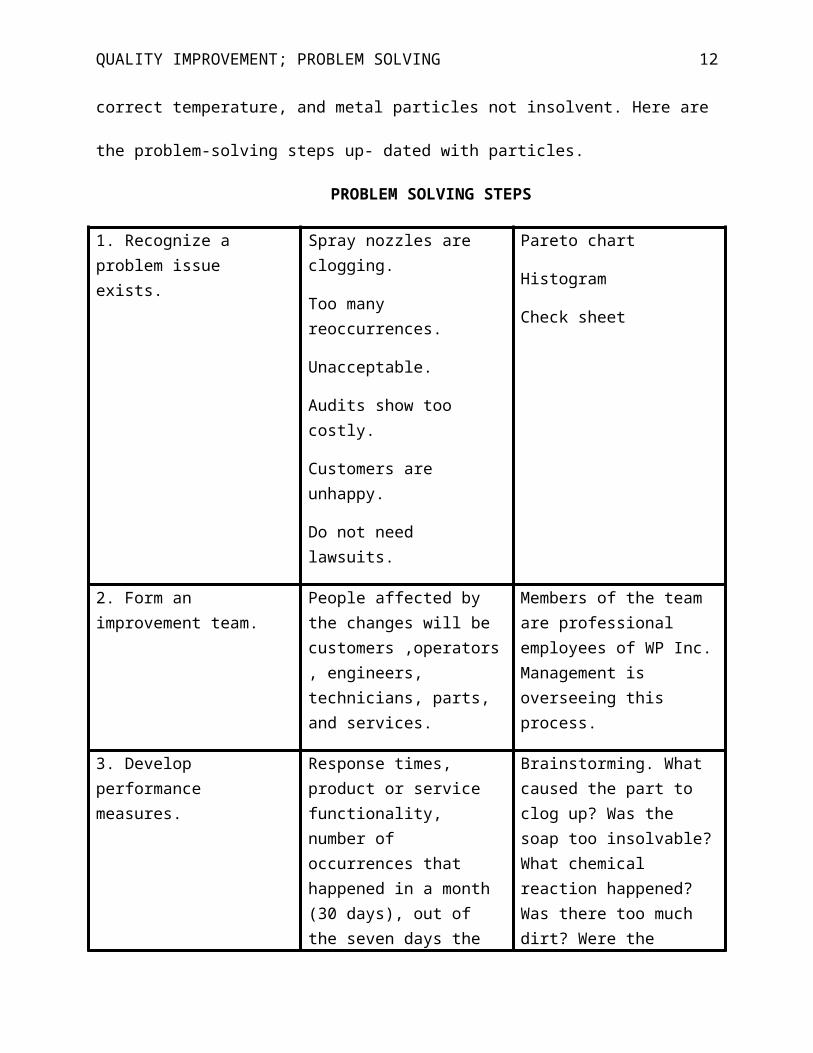
correct temperature, and metal particles not insolvent. Here are the problem-solving steps up-
dated with particles.
PROBLEM SOLVING STEPS
1. Recognize a problem issue exists.
Spray nozzles are clogging.
Too many reoccurrences.
Unacceptable.
Audits show too costly.
Customers are unhappy.
Do not need lawsuits.
Pareto chart
Histogram
Check sheet
2. Form an improvement team. People affected by the changes will be customers ,operators, engineers, technicians, parts, and services.
Members of the team are professional employees of WP Inc. Management is overseeing this process.
3. Develop performance measures.
Response times, product or service functionality, number of occurrences that happened in a month (30 days), out of the seven days the nozzle is clogged, two of these clogs happened midday. Number of deviations from products/service specifications, rework amounts, number of return products.
Brainstorming. What caused the part to clog up? Was the soap too insolvable? What chemical reaction happened? Was there too much dirt? Were the particle chips clogging from the metal parts? Were paint chips coming off the metal parts? Was the hole too big on the metal part that fit in the nozzle? Was the hole too small on the metal part
QUALITY IMPROVEMENT; PROBLEM SOLVING 9
that fits in the nozzle?
4. Clearly define the problem.
-Identify customers
-Identify customer wants
-Identify processes
-Write problem-improvement
statements
Customers, suppliers, other companies, and people who buy automatic washer parts. Customer wants nozzle with metal parts that are working.
Customer wants quality parts.
Problem (clogging washer parts)
Improvement is that the metal parts not clog the nozzle with soap particles that shut down the washers.
Why-Why diagram
Check sheet
Histogram
Run chart
5. Document and analyze the problem/process
All customers are impacted by the process.
Gather and analyze data level of performance of the parts.
Why- Why diagram
Cause and effect diagram
Pareto chart
6. Determine possible causes
-Perform root cause analysis
-Determine root cause
Problem occurs most often after the old cleansing solution has been drained from the tank and the new solution put in. The liquid in the tank should be free of particles but is not.
The root cause is hard water build up, calcium, chips from parts, soap flakes, something caused by a chemical reaction, and type of gravel or dirt. I came up with non- dissolution of soap flakes, water not heated to correct temperature, and metal particles not
QUALITY IMPROVEMENT; PROBLEM SOLVING 10
insolvent.
7. Identify, select, and implement the solution
The problem is the metal parts in the nozzles clogging up with soap particles. Tests are being conducted every two minutes, the nozzles are removed and inspected. The particles are soap. The solution is to stop the reoccurrence of buildup, dissolve the particle at an elevated temperature in the water and use filtering systems between the tanks and the nozzles.
Force-field analysis, Management skills, Control chart
8. Evaluate the solution Utilize measurement systems to develop improvement by dissolving the soap particles with hot water temperature.
Control charts,
Pareto charts,
Check sheets
9. Ensure permanence Set quality performance standards; meeting customer requirements. Less variation between particles clogging metal parts in the nozzles. Lower rework levels. Testing temperature of water for appropriate degrees. Make sure filtering systems exists between the tank and the nozzles.
Focus groups,
Run charts,
Pareto charts,
Check sheets
10. Continuous improvement Continuous improvement through the system of washers, parts, and services. Installing filtering systems between tank and nozzles. Making sure testing is done twice a day. Putting into place
QUALITY IMPROVEMENT; PROBLEM SOLVING 11
teams that test for problems before hand to counteract them. Making sure the water is warm enough.
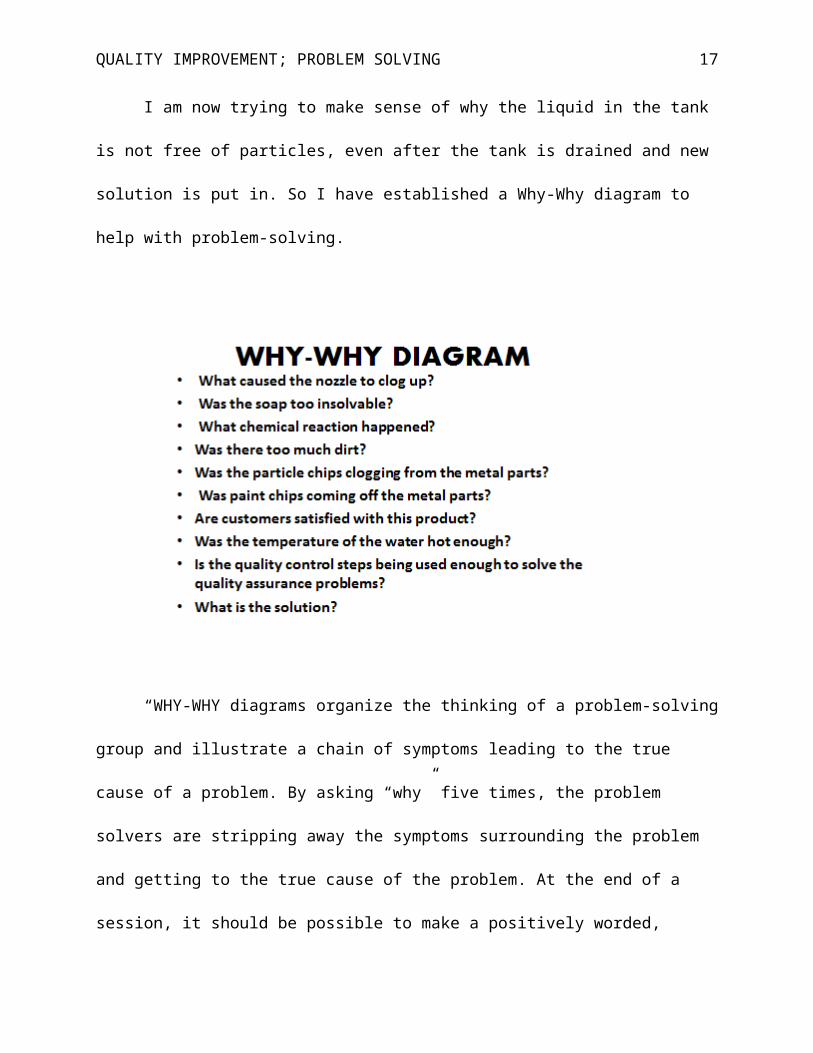
I am now trying to make sense of why the liquid in the tank is not free of particles, even
after the tank is drained and new solution is put in. So I have established a Why-Why diagram to
help with problem-solving.
“WHY-WHY diagrams organize the thinking of a problem-solving group and illustrate a
chain of symptoms leading to the true cause of a problem. By asking “why” five times, the
problem solvers are stripping away the symptoms surrounding the problem and getting to the
true cause of the problem. At the end of a session, it should be possible to make a positively
QUALITY IMPROVEMENT; PROBLEM SOLVING 12
worded, straightforward statement defining the true problem to be investigated” (Summers,
2010, p. 71).
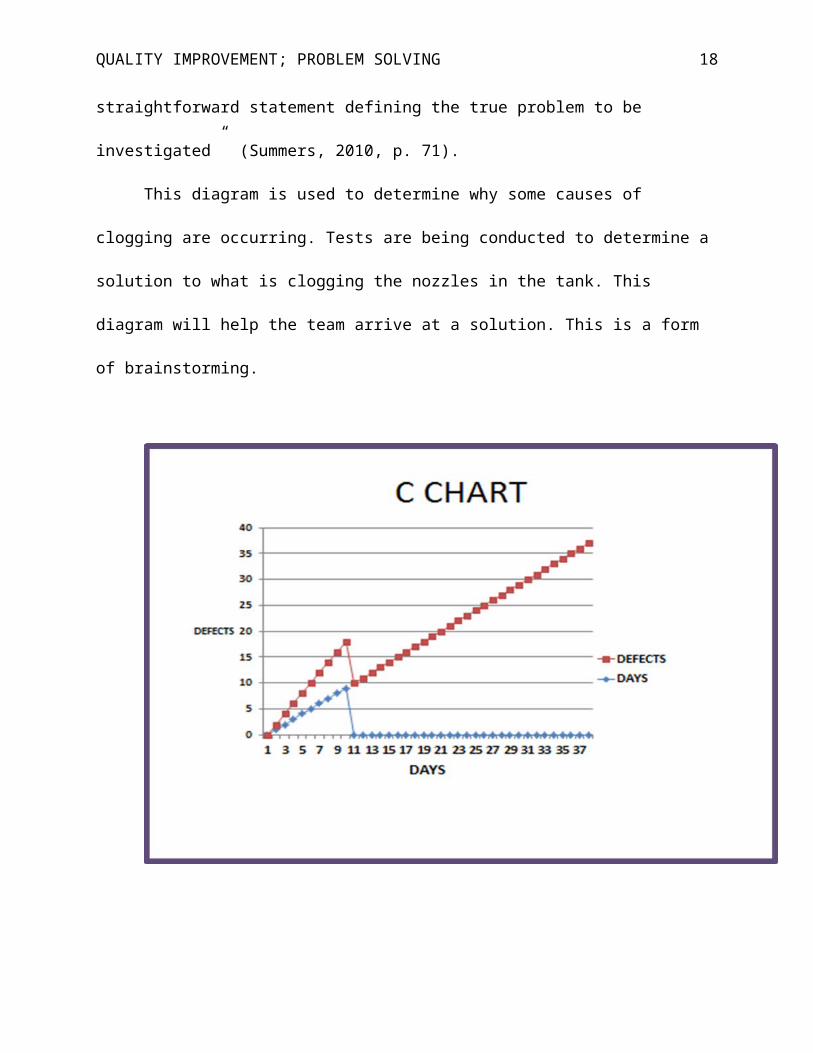
This diagram is used to determine why some causes of clogging are occurring. Tests are
being conducted to determine a solution to what is clogging the nozzles in the tank. This diagram
will help the team arrive at a solution. This is a form of brainstorming.
Centerline c ¿̄∑i=1
n
c / m = 7/30 = 0.2333= 23
UCLc = c + 3 √c
= 23 + 3√23 =37.38= 37
QUALITY IMPROVEMENT; PROBLEM SOLVING 13
LCLc = c- 3 √c
= 23 - 3√23 = 8.6 = 9
This c chart shows the centerline is 23 while the UCLc =37 and the LCLc = 9. The 23 days
did not show defects while 7 days of thirty were defective days for the nozzles being clogged.
The 4% chance of clogging in 30 days does not meet specifications and is not capable until a
filter is installed between the tank and the nozzles, and the water temperature is higher. This
could fix the problem.
One of the problem solving team members suggested the tank be drained. The bottom of
the tank is coated with a layer of hard soap. The team has decided to use a cause and effect
diagram. This diagram shows how the water in the tank is heated causing evaporation to occur.
The concentration of soap content has increase in the solution. The operator decreases fluid level
in the tank while adding more soap and water solution. This increases the soap concentration
more. The soap reaches a high level and can no longer be held in solution the particle precipitate
to the bottom of the tank. The tank is drained and new solution is put in. This causes a
disturbance of soap particles on the bottom of the tank and the particles become free-floating in
the tank. The soap dissolves in the water best at an elevated temperature. A chart of daily
temperature in the parts washer shows that the tank has not been held at the appropriate
temperature. It has been too low.
No filtering system exists between the tank and the nozzles. That is why I have created a
cause and effect diagram for the problem of soap buildup on the bottom of the tank.
QUALITY IMPROVEMENT; PROBLEM SOLVING 14
“This pictorial display is a cause and effect diagram (Ishikawa, Tree diagram, Fishbone
diagram, Dendrogramm, 4M & 1E) as those typically constructed through brainstorming
techniques” (Arvanitoyannis & Savelides, 2007, p. 1).
My next step is to create a force field analysis. This will list potential driving and
restraining forces involving in correcting this problem. “A force field analysis fundamentally
modifies our perception and provides important insights about the dynamics that govern the
strategic landscape of an organization” (Paquin, & Koplyay, 2007, p. 1).
QUALITY IMPROVEMENT; PROBLEM SOLVING 15
Spray nozzles are clogging. Too many reoccurrences of clogged nozzles were
reported. This is unacceptable. Audits show too costly. Customers are unhappy. People affected
by the changes will be customers, operators, engineers, technicians, parts, and services. Members
of the team are professional employees of WP Inc. Management is overseeing this process. I
developed performance measures. Using the charts, diagrams, and data, I was able to determine
what needed to be done to fix the problem. The response times, product or service functionality,
number of occurrences that happened in a month (30 days), out of the seven days the nozzle is
clogged, two of these clogs happened midday. Number of defects from metal parts
products/service specifications, reworking, and the number of return products was costly.
Brainstorming was very time consuming. What caused the part to clog up? Was the soap too
insolvable? What chemical reaction happened? Was there too much dirt? Were the particle chips

QUALITY IMPROVEMENT; PROBLEM SOLVING 16
clogging from the metal parts? Were paint chips coming off the metal parts? Was a filter
installed between the tank and the nozzle? Was the hole too small on the metal part that fits in
the nozzle? Customers, suppliers, other companies, and people who buy automatic washer parts
want this problem to be resolved. Customers want the nozzles to be working. Improvement is
that the metal parts not clog the nozzle with soap particles that shut down the washers. The
problem occurs most often after the old cleansing solution has been drained from the tank and
the new solution put in. The liquid in the tank should be free of particles but is not. The root
cause is hard water build up, calcium, chips from parts, soap flakes, something caused by a
chemical reaction, and type of gravel or dirt. I came up with non- dissolution of soap flakes,
water not heated to correct temperature, and metal particles not insolvent.
Tests are being conducted every two minutes, the nozzles are removed and inspected.
The particles are soap. The solution is to stop the reoccurrence of buildup, dissolve the particle at
an elevated temperature in the water and use filtering systems between the tanks and the nozzles.
Conclusion
In conclusion, testing temperature of water for appropriate degrees will help to keep
nozzles unclogged. Making sure filtering systems exists between the tank and the nozzles will
help the particles to stay at the bottom of the tank and not float to the top. When the tank is
drained, the water is emptied. New soap is added and water is put into the tank. The parts washer
is turned on. Evaporation occurs: water and soap are added. The coils heat the water. Dirty parts
are placed in the machine. Parts are run. If the parts are clean, they move to production and the
next step. If they are still dirty, they are washed again. The water is drained and the process starts
all over again. Filtering systems and warmer water will help ensure less defect days and more
productive days.
QUALITY IMPROVEMENT; PROBLEM SOLVING 17
Reference
Arvanitoyannis, I. S., & Savelides, S. C. (2007). Application of failure mode and effect analysis
and cause and effect analysis and Pareto diagram in conjunction with HACCP to a
chocolate-producing industry: a case study of tentative GMO detection at pilot plant
QUALITY IMPROVEMENT; PROBLEM SOLVING 18
scale. International Journal Of Food Science & Technology, 42(11), 1265-1289.
doi:10.1111/j.1365-2621.2006.01304.x
Paquin, J., & Koplyay, T. (2007). Force Field Analysis and Strategic Management: A Dynamic
Approach. Engineering Management Journal, 19(1), 28-37.
Summers, Donna C. S. (2010),Quality, Fifth Edition. Pearson Education Inc., Upper Saddle
River: New Jersey, Prentice Hall.