r annua l report - danske bank · 2013-02-06 · annua l report 2012 danske bank group danske bank...
TRANSCRIPT

AnnuAl RepoRt2012
DAnSKe BAnK GRoup
DAnSKe BAnK A/S
HolmenS KAnAl 2-12
DK-1092 KøBenHAvn K
tel. +45 33 44 00 00
CvR-nR. 611262 28-KøBenHAvn
www.DAnSKeBAnK.Com
An
nu
Al
Re
po
Rt
20
12
H02128 Omslag 12AR DK Enkelt_ENG.indd 1 31/01/13 08.44

AnnuAl RepoRt 2012
2 Danske bank / ANNUAL REPORT 2012
supplementary information
financial calenDar
18 March 2013 Annual general meeting
2 May 2013 Interim Report – First Quarter 2013
1 August 2013 Interim Report – First Half 2013
31 October 2013 Interim Report – First Nine Months 2013
6 February 2014 Annual Report 2013
contact
Henrik Ramlau-HansenHead of Group Finance & Legal +45 45 14 06 66
links
Danske Bank Group www.danskebank.com
Retail Banking Denmark www.danskebank.dk
Retail Banking Finland www.danskebank.fi
Retail Banking Sweden www.danskebank.se
Retail Banking Norway www.danskebank.no
Banking Activities Northern Ireland www.danskebank.co.uk
Banking Activities Ireland www.danskebank.ie
Realkredit Danmark www.rd.dk
Danske Capital www.danskecapital.com
Danica Pension www.danicapension.dk
More information about the Group’s financial results is available at www.danskebank.com/reports.
H02128 Omslag 12AR DK Enkelt_ENG.indd 3 31/01/13 08.44
DANSKE BANK / ANNUAL REPORT 2012 3
DANSKE BANK GROUP
Annual Report 2012 is a translation of the original
report in the Danish language (Årsrapport 2012).
In case of discrepancies, the Danish version prevails.
15 countries 491 branches 20,308 employees 5,000,000 customers
MANAGEMENT’S REPORT 6 To our shareholders 8 Financial highlights 9 Financial summary 10 Financial review 24 Business units 25 Banking Activities 28 Danske Markets and Treasury 30 Danske Capital 32 Danica Pension 35 Other Activities 38 Capital and liquidity management 42 Investor relations 46 Organisation and management
FINANCIAL STATEMENTS 48 Contents 50 Income statement 51 Statement of comprehensive income 52 Balance sheet 53 Statement of capital 56 Cash flow statement 57 Notes 161 Danske Bank A/S
STATEMENT AND REPORTS 182 Statement by the management 183 Auditors’ reports
MANAGEMENT AND DIRECTORSHIPS 185 Board of Directors 188 Executive Board
CONTENTS

4 DANSKE BANK / ANNUAL REPORT 2012
New Normal

DANSKE BANK / ANNUAL REPORT 2012 5
The world is changing and that demands new standards.
New Standards

6 DANSKE BANK / ANNUAL REPORT 2012
Economic environmentThe general economic environment for the financial sector in Europe was difficult in 2012. The economic headwinds continued with increased uncertainty surrounding the euro and the ability of some European nations to repay their debts. Policy measures and intervention from the ECB and other central banks gradually eased the situation, however. Although many issues remain to be resolved, there is growing confidence that the economic situation in Europe will eventually normalise. Low growth and interest rate levels are still to be expected for some time to come, also in our home markets.
Financial performanceThe 2012 financial result for Danske Bank Group of DKK 4.7 billion, compared with DKK 1.7 billion in 2011, is in line with our expectations. Several initiatives to improve profitability more than mitigated the effects of declining and low interest rate levels. Our underlying cost levels are on level with those of 2011, partly as a result of the staff reduction of 1,000 FTEs, about 5% of the total. Impairments saw a declining trend throughout 2012, and although the level is still elevated, in Q4 they were at their lowest level since the financial crisis began.
Danica Pension and our capital market businesses, Danske Markets and Danske Capital, performed better than expected and above the level in 2011.
Our lending volume is marginally lower, reflecting partly our efforts to optimise our portfolio and strengthen the capital and liquidity ratios and partly generally lower demand for loans. We have accommodated our customers’ need for funding and overall kept our market share.
Ratings and fundingIn May 2012, Danske Bank was downgraded by Moody’s and Standard & Poor’s. The downgrade from Moody’s was part of a general reassessment of the European financial sector. Danish banks in particular were affected as Moody’s considers Denmark’s level of systemic support, even to systemically important banks, to be lower than in neighbouring countries. The downgrades resulted in higher funding costs for Danske Bank in relation to our peers and did to a minor extent limit our access to certain wholesale funding sources.
We have taken two major steps to enhance our access to funding and improve our ratings.
First, in dialogue with the Danish FSA, Danske Bank agreed to accelerated compliance in 2012 with the
expected EU rules on the Liquidity Coverage Ratio (LCR), which will take effect gradually from 2015 to 2019, and to take other measures. It is, however, important to emphasise that Danske Bank’s liquidity level remained strong throughout the year and vastly exceeded regulatory requirements. Second, in October 2012, we completed a share issue with the aim of accelerating the achievement of a rating upgrade. Following the share issue, Standard & Poor’s put Danske Bank on positive outlook, and the funding cost gap to our peer group was significantly reduced in the last quarter of 2012. Danske Bank’s capital levels are strong, with a significant buffer above existing regulatory requirements. We are therefore positioned very well for the stress tests conducted by European authorities.
New strategyDanske Bank launched a new strategy, New Standards, in 2012.
Considering that conditions for financial services business have changed fundamentally since the financial crisis and that we operate in a new normal, the strategy is based on a strong mission and vision to
• set new standards in financial services and
• become our customers’ most trusted financial partner
With New Standards, Danske Bank will be a bank for all customers in our home markets. We will provide market-leading advisory services and innovative digital and automated solutions for financial transactions. Our digital and mobile platforms enable customers to do their banking business anywhere and at any time. We render our services at fair and competitive prices, and maintain a focus on balancing income and costs in all customer segments.
In January 2013, we launched a new customer programme for personal customers in Denmark to provide a simple and transparent overview of all our offerings and the benefits of using Danske Bank. The programme will subsequently be launched in our other markets. We have also responded to the rapid decline in the use of our branch network for transactions by reducing the number of branches. Moreover, we are opening a number of state-of-the-art advisory centres.
For our business and institutional customers, we strive to develop our product offerings and advisory services. We aim to automate financial transactions for business customers to the greatest extent possible,
TO OUR SHAREHOLDERS

DANSKE BANK / ANNUAL REPORT 2012 7
thereby freeing up customers’ resources for other priorities. We will focus more on individual customer segments and develop expertise tailored to each segment.
In the capital markets area, we aim to maintain our leading position as confirmed by independent market observers.
DeliverablesWhile focusing on delivering competitive propositions to our customers, New Standards will also enhance return levels and address the low customer satisfaction that we experience in some markets.
• With New Standards, the Group builds on its role as a universal bank in the markets in which we operate, and also has value-adding businesses within asset management (Danske Capital) and life insurance and pensions (Danica Pension). The non-core portfolio will be divested as soon as market conditions permit. Until then, the portfolio will be managed so as to optimise collections.
• New Standards consists of clear segmentation and customer propositions focused on industry-leading advisory services. The Group will bring the digitalisation and automation of banking to new levels, which will allow us to meet the increasing expectations of our customers while maintaining a strict efficiency focus.
• With a resolute focus on process optimisation and operational excellence, we intend to significantly improve customer satisfaction and reduce costs. Combined with improved capital efficiency, this will ensure higher returns on a stable capital base. The risk profile will be conservative.
• The Group has set and already complies with prudent capital targets: a total capital ratio of a minimum of 17% and a core tier 1 capital ratio of at least 13%.
• We aim to improve our credit ratings by at least one notch as soon as possible.
• New Standards aims to lift Danske Bank into the top half of its Nordic peer group by the end of 2015, with a return on equity above 12% after tax, assuming more normalised market conditions.
• The Group aims to resume dividend payments of 40% of net profit as soon as it is prudent. Until we meet our capital targets and rating ambitions, the pay-out ratio may be lower. No dividend payment will be recommended for 2012.
The implementation of New Standards commenced mid-2012 with a comprehensive reorganisation. The business unit structure based on geography was substituted by business units that focus on
three core customer segments: Personal, Business and Corporates & Institutions. Certain head office functions were relocated to the business units. The reorganisation enables a clearer and more responsive customer focus and will enable us to better utilise our shared IT and operational platform.
In November 2012, all banking activities were aligned behind a single brand: Danske Bank. In Denmark, the launch attracted substantial attention and spurred a more general discussion about the causes and development of the financial crisis. Danske Bank acknowledges the need for dialogue and has actively contributed its views on these subjects.
Establishing a performance cultureDanske Bank maintains a strong focus on organisational development. Transactional and administrative work will be simplified and automated, and we will continually enhance competency levels in customer-facing and specialist functions. Recruitment and talent development are imperative. We are also establishing a performance culture in which customer satisfaction and return on equity are the key parameters.
The employees at Danske Bank delivered a great effort in 2012 despite many changes and – in some markets – a challenging public debate. Our employee opinion surveys confirm high satisfaction amongst staff and pride in working for Danske Bank, and we thank all employees for their efforts and resilience.
Corporate ResponsibilityAs a financial institution, Danske Bank plays an important role in society through its obligation to provide well-functioning financial infrastructure as needed in a modern economy, and to support growth and economic stability. Danske Bank Group has come a long way in integrating environmental, social and ethical considerations into our business. New Standards will maintain this as a key focus area.
2013We will continue to execute New Standards in 2013 and progress towards our 2015 ambition. We expect 2013 to show material improvements, in comparison with 2012, and we expect to advance in the achievement of our 2015 targets.
Ole Andersen Eivind KoldingChairman of the Chief Executive OfficerBoard of Directors

8 DANSKE BANK / ANNUAL REPORT 2012
INCOME STATEMENT(DKK millions) 2012 2011
Index12/11 2010 2009 2008
Net interest income 24,788 23,537 105 23,843 27,524 27,005
Net fee income 8,782 8,298 106 8,699 7,678 8,110
Net trading income 8,901 7,325 122 7,707 18,244 6,076
Other income 2,951 3,648 81 3,882 3,083 3,585
Net income from insurance business 2,263 569 - 2,146 2,810 -1,733
Total income 47,685 43,377 110 46,277 59,339 43,043
Expenses 26,588 25,987 102 26,010 28,907 28,726
Profit before loan impairment charges 21,097 17,390 121 20,267 30,432 14,317
Loan impairment charges 12,529 13,185 95 13,817 25,677 12,088
Profit before tax 8,568 4,205 204 6,450 4,755 2,229
Tax 3,819 2,482 154 2,786 3,042 1,193
Net profit for the year 4,749 1,723 276 3,664 1,713 1,036
Attributable to non-controlling interests 4 11 36 3 -14 25
BALANCE SHEET (END OF YEAR) (DKK millions)
Due from credit institutions and central banks 113,657 74,041 154 89,619 109,236 79,795
Repo loans 307,177 256,027 120 306,962 239,183 369,999
Loans and advances 1,674,390 1,698,025 99 1,679,965 1,669,552 1,785,323
Trading portfolio assets 812,927 909,755 89 641,993 620,052 860,788
Investment securities 107,724 109,264 99 118,556 118,979 140,793
Assets under insurance contracts 241,343 230,668 105 217,515 196,944 181,259
Other assets 227,963 146,623 155 159,276 144,531 126,017
Total assets 3,485,181 3,424,403 102 3,213,886 3,098,477 3,543,974
Due to credit institutions and central banks 241,241 177,592 136 175,825 184,653 434,334
Repo deposits 359,276 269,515 133 202,603 182,164 202,785
Deposits 788,507 795,275 99 800,613 803,932 800,297
Bonds issued by Realkredit Danmark 614,325 557,699 110 555,486 517,055 479,534
Other issued bonds 340,005 366,920 93 450,219 514,601 526,606
Trading portfolio liabilities 531,860 697,913 76 478,386 380,567 623,290
Liabilities under insurance contracts 266,938 248,966 107 238,132 223,876 210,988
Other liabilities 137,010 117,340 117 130,544 110,968 110,033
Subordinated debt 67,785 67,328 101 77,336 80,002 57,860
Shareholders' equity 138,234 125,855 110 104,742 100,659 98,247
Total liabilities and equity 3,485,181 3,424,403 102 3,213,886 3,098,477 3,543,974
RATIOS AND KEY FIGURES
Earnings per share (DKK) 5.1 1.9 4.9 2.3 1.4
Diluted earnings per share (DKK) 5.1 1.9 4.9 2.3 1.4
Return on average shareholders' equity (%) 3.7 1.4 3.6 1.7 1.0
Cost/income ratio (%) 55.8 59.9 56.2 48.7 66.7
Total capital ratio (%) 21.3 17.9 17.7 17.8 13.0
Core tier 1 capital ratio (%) 14.5 11.8 10.1 9.5 8.1
Share price (end of year) (DKK) 95.7 73.0 132.3 109.2 48.1
Book value per share (DKK) 137.9 135.7 140.0 134.8 131.7
Full-time-equivalent staff (end of year) 20,308 21,320 21,522 22,093 23,624
FINANCIAL HIGHLIGHTS
Share ratios for 2011 and previous years have been divided by an adjustment factor to reflect the share capital increase in April 2011.

DANSKE BANK / ANNUAL REPORT 2012 9
FIN
AN
CIA
L S
UM
MA
RY
• In 2012, Danske Bank Group posted a profit before tax of DKK 8.6 billion. The net profit was DKK 4.7 billion,
up DKK 3.0 billion from the level in 2011. The results were generally in line with expectations. Excluding Non-
core Ireland, profit before tax was DKK 13.3 billion.
• Total income rose 10% from the year-earlier level. Pricing initiatives increased net interest income, but the
effect was partly offset by a general fall in interest rate levels.
• Improved conditions in the capital markets increased net trading income, and trading volumes remained
relatively high throughout the year.
• Expenses were up slightly from the level in 2011. The cost/income ratio improved from 60% in 2011 to 56% in
2012. Underlying cost levels are on level with those of 2011, partly as a result of the staff reduction of 1,000
FTEs, or about 5% of the total.
• Loan impairment charges were down 5%, and charges have fallen each quarter since the fourth quarter of
2011. The decline occurred mainly because of lower charges at Retail Banking Denmark, Banking Activities
Northern Ireland and Banking Activities Ireland (including Non-core).
• In the second quarter of 2012, Danske Bank’s credit ratings were lowered by Moody’s and Standard & Poor’s.
• In October 2012, the Group issued new shares for an amount of DKK 7.1 billion to accelerate the achievement
of its rating and capital targets. Shortly after the issue, Standard & Poor’s changed its credit rating outlook for
Danske Bank from stable to positive.
• The core tier 1 capital and total capital ratios were solid at 14.5% and 21.3%, against 11.8% and 17.9% at the
end of 2011.
• At the end of 2012, the Group’s Liquidity Coverage Ratio (LCR) was 121%, which is well above the requirement
expected to take effect in 2015.
• The Board of Directors is recommending that no dividend be paid for 2012.
Outlook for 2013 • Given the persistently low interest rates and low economic growth, the Group expects earnings before
impairment charges to remain at the 2012 level.
• Loan impairment charges for core activities are expected to fall slightly below the level in 2012.
• The loss at the Non-core business unit is expected to be reduced significantly in step with the stabilisation of
loan impairment charges at a lower level.
• The Group expects the net profit for 2013 to range from DKK 7.5-10 billion, corresponding to a return on
equity of 5.5-7% after tax. Earnings per share is expected to increase to DKK 7.5-10.0.
FINANCIAL SUMMARY

10 DANSKE BANK / ANNUAL REPORT 2012
INCOME STATEMENT(DKK millions) 2012 2011
Index12/11
Q42012
Q32012
Q22012
Q12012
Net interest income 24,788 23,537 105 6,200 6,198 6,218 6,172
Net fee income 8,782 8,298 106 2,653 2,116 2,026 1,987
Net trading income 8,901 7,325 122 1,432 1,785 2,462 3,222
Other income 2,951 3,648 81 628 689 846 788
Net income from insurance business 2,263 569 - 953 427 699 184
Total income 47,685 43,377 110 11,866 11,215 12,251 12,353
Expenses 26,588 25,987 102 6,990 6,116 6,632 6,850
Profit before loan impairment charges 21,097 17,390 121 4,876 5,099 5,619 5,503
Loan impairment charges 12,529 13,185 95 2,619 2,879 3,109 3,922
Profit before tax 8,568 4,205 204 2,257 2,220 2,510 1,581
Tax 3,819 2,482 154 1,111 903 1,007 798
Net profit for the year 4,749 1,723 276 1,146 1,317 1,503 783
Attributable to non-controlling interests 4 11 36 - 5 -1 -
In 2012, Danske Bank Group posted a profit before tax of DKK 8.6 billion. The net profit was DKK 4.7 billion, up DKK 3.0 billion from the level in 2011. The results were generally in line with expectations. Excluding Non-core Ireland, profit before tax was DKK 13.3 billion.
The economic downturn and low interest rates continued to affect the business environment in the
Group’s markets. This was particularly evident in Denmark as the Danish central bank lowered rates independently of the European Central Bank (ECB) on a number of occasions. Interest rates in Denmark were therefore much lower than in the Group’s other markets. Towards the end of the year, the turbulence in the financial markets lessened, mainly because of initiatives taken by the ECB and the US Federal Reserve.
Although interest rates were low in 2012, the Group’s earnings initiatives, improved conditions in the capital markets and cost-reduction initiatives led to improved financial results. Profit before loan impairment charges rose from DKK 17.4 billion in 2011 to DKK 21.1 billion in 2012.
IncomeTotal income amounted to DKK 47.7 billion, up 10% from the level in 2011.
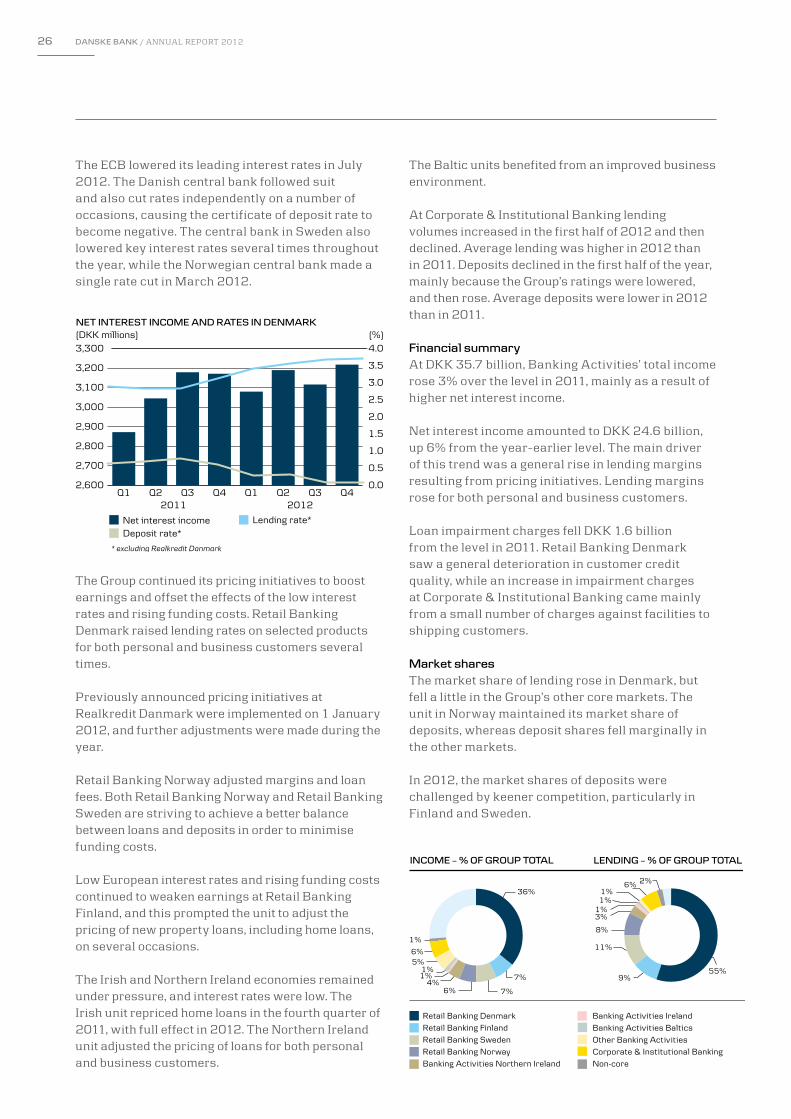
Net interest income totalled DKK 24.8 billion, up 5% from the year-earlier level. Although pricing initiatives for bank and mortgage credit products had a positive effect on net interest income, the effect was partly offset by declining short-term interest rates and rising funding costs.
Most banking units posted net interest income above the level in 2011.
Net fee income amounted to DKK 8.8 billion, up 6% from the year-earlier level.
Net trading income was 22% higher in 2012 than in 2011, mainly because of very favourable trading conditions in the first quarter of 2012. Trading volume
FINANCIAL REVIEW KEY INTEREST RATES(%)
DenmarkNorwaySweden
UKEuro zone
Central banks’ monetary policy target rates.
0.0
0.5
1.0
1.5
2.0
2.5
201220112010
KEY INTEREST RATES(%)
DenmarkNorwaySweden
UKEuro zone
Central banks’ monetary policy target rates.
0.0
0.5
1.0
1.5
2.0
2.5
201220112010
Til det trykte regnskab
NET INTEREST INCOME(DKK millions)
2011 2012
5,000
5,500
6,000
6,500
Q4Q3Q2Q1Q4Q3Q2Q1
NET INTEREST INCOME(DKK millions)
2011 2012
5,000
5,500
6,000
6,500
Q4Q3Q2Q1Q4Q3Q2Q1
til det trykte regnskab

DANSKE BANK / ANNUAL REPORT 2012 11
FIN
AN
CIA
L R
EV
IEWdeclined in the second half of the year after Danske
Bank’s short-term rating downgrade, which had an adverse effect on earnings from derivatives business.
Other income fell to DKK 3.0 billion, down 19% from the level in 2011. The 2011 figure included a refund of about DKK 150 million of excess VAT paid in previous years.
The Group’s insurance business generated net income of DKK 2.3 billion, against DKK 0.6 billion in 2011. The booking of the risk allowance for three of the four interest rate groups and the booking to income of an amount from the shadow account both had a positive effect.
At the end of 2012, the shadow account balance was DKK 0.8 billion. It may be booked to income at a later date when the technical basis permits.
ExpensesExpenses amounted to DKK 26.6 billion, up slightly from the level in 2011.
Expenses included a write-down of DKK 0.5 billion related to the Sampo Bank brand name and expenses of DKK 0.7 billion for severance payments and branch mergers.
Since the beginning of 2012, the contribution to the Danish Guarantee Fund for Depositors and Investors has been based on fixed annual contributions. Danske Bank’s contribution for 2012 amounted to DKK 0.6 billion. For 2013, Danske Bank must pay a contribution of about DKK 0.7 billion.
In 2011, expenses were affected by payments to the Guarantee Fund in particular.
The cost/income ratio based on underlying costs fell from 54.4% to 48.6%.
In 2012, a restructuring of the branch network resulted in the closure of 145 branches, including 74 in Denmark, 26 in Finland and 19 in Ireland.
In November 2012, the Irish unit started a process of merging branches. In future, the unit will serve personal customers mainly from a Personal Banking call centre in Dublin and nine Personal Banking centres.
In 2012, the Group reduced the headcount by 1,012 and made severance agreements with another 734 employees. These agreements will take effect in 2013.
Expenses for financial services employer tax and VAT amounted to DKK 1.8 billion, unchanged from the year-earlier figure.
Loan impairment chargesIn 2012, loan impairment charges amounted to DKK 12.5 billion, or 0.65% of lending and guarantees, against 0.68% in 2011.
In 2012, total charges included charges against facilities to personal customers of DKK 2.5 billion, and charges against facilities to business customers of DKK 5.3 billion – with small and medium-sized businesses accounting for DKK 3.7 billion of this amount. Financial counterparties accounted for a net reversal of DKK 0.2 billion and Non-core Ireland for DKK 4.9 billion of total charges.
Individual charges against facilities to personal customers fell throughout the year, with Retail Banking Denmark recording most of the fall. Impairment charges rose in the fourth quarter because of new collective charges at Retail Banking Denmark against customers with negative equity and charges at Banking Activities Northern Ireland against facilities to customers with investment property exposure.
EXPENSES(DKK billions) 2012 2011
Underlying costs 23.2 23.6
Write-down of domicile property 0.2 0.1
Performance-based compensation 0.9 0.5
Severance payments 0.7 0.5
Rebranding 0.2 -
Depreciation, lease assets sold 0.9 1.1
Impairment, goodwill and rights to names 0.5 0.2
Expenses 26.6 26.0
Underlying costs/income ratio (%) 48.6 54.4
Cost/income ratio (%) 55.8 59.9
LOAN IMPAIRMENT CHARGES IN 2012(DKK millions)
Q1 2012 Q2 2012
Q3 2012 Q4 2012
-500
0
500
1,000
1,500
2,000
2,500
Non-coreFinancialBusinessPersonal
LOAN IMPAIRMENT CHARGES IN 2012(DKK millions)
Q1 2012 Q2 2012 Q3 2012 Q4 2012
-500
0
500
1,000
1,500
2,000
2,500
Non-coreFinancialBusinessPersonal
til det trykte regnskab

12 DANSKE BANK / ANNUAL REPORT 2012
Other comprehensive income Other comprehensive income includes currency translation of the Group’s activities outside Denmark and unrealised value adjustments of available-for-sale financial assets.
In 2012, the fair value adjustment of the Group’s portfolio of available-for-sale bonds resulted in an unrealised gain of DKK 0.6 billion, against an unrealised loss of DKK 1.0 billion in 2011.
Losses of DKK 0.1 billion recognised in previous years were reclassified to the income statement in 2012 as part of the available-for-sale bond portfolio was sold (2011: DKK 0.0 billion).
Fourth quarter 2012Profit before tax in the fourth quarter of 2012 amounted to DKK 2.3 billion.
At DKK 6.2 billion, net interest income was un-changed from the level in the third quarter of 2012. Higher margins at Realkredit Danmark offset lower lending volumes and deposit margins.
Net trading income amounted to DKK 1.4 billion, against DKK 1.8 billion in the third quarter.
Other income fell 9% from the third-quarter level. Lower sales of lease assets were the main reason for the fall.
The Group’s insurance business generated net income of DKK 1.0 billion, against DKK 0.4 billion in the third quarter. Income rose because of the booking to income of an amount from the shadow account.
Expenses, which rose 14% from the third-quarter level, amounted to DKK 7.0 billion. The third quarter benefited in particular from seasonally lower expenses for holiday pay. The fourth quarter, however, was affected by write-downs of domicile property and by costs for the rebranding of the Group’s banking units.
Loan impairment charges amounted to DKK 2.6 billion, a fall of DKK 0.3 billion from the level in the third quarter. Most of the banking units booked higher charges in the fourth quarter. Corporate & Institutional Banking had lower charges against facilities to shipping customers, though. Charges at Non-core Ireland accounted for 45% of total charges in the fourth quarter.
Charges against facilities to business customers related mainly to shipping customers, whose market conditions remained difficult. For the shipping industry, charges equalled 2.8% of lending and guarantees and were concentrated on a few exposures.
Most of the charges at Non-core Ireland were adjustments of existing charges prompted by the persistently difficult market conditions for commercial properties. There were few transactions, and the trend in prices remained slightly negative.
Loan impairment charges in Denmark related mainly to consumer industries, reflecting falling retail sales, and to commercial property and personal customer exposures. The reduction in charges was attributable mainly to lower charges against facilities to agricultural customers.
Although charges were lower than in 2011, the Northern Ireland unit still had high loan impairment charges, particularly against commercial property exposures.
TaxTax on the profit for the year amounted to DKK 3.8 billion, or 45% of the profit before tax. The tax charge is high relative to the profit mainly because the Group did not book the tax value of losses in Ireland.
LOAN IMPAIRMENT CHARGES
2012 2011
(DKK millions) Charges
% of lending
and guar-antees Charges
% of lending
and guar-antees
Retail Banking Denmark 3,918 0.40 4,316 0.43
Retail Banking Finland 366 0.24 187 0.13
Retail Banking Sweden 414 0.22 202 0.11
Retail Banking Norway 219 0.16 380 0.28
Banking Activities Northern Ireland 1,425 2.76 2,178 4.30
Banking Activities Ireland* 661 2.65 6,334 10.34
Banking Activities Baltics -431 -2.29 -255 -1.19
Other Banking Activities 64 0.30 155 0.77
Corporate & Institutional Banking 1,094 0.82 744 0.58
Non-core Ireland* 4,921 19.22 - -
Total Banking Activities 12,651 0.73 14,241 0.82
Danske Markets and Treasury -99 -0.03 -1,033 -0.34
Danske Capital -23 -0.14 -23 -0.23
Total 12,529 0.65 13,185 0.68
* Non-core Ireland was separated from Banking Activities Ireland in 2012.

DANSKE BANK / ANNUAL REPORT 2012 13
LENDING (END OF PERIOD)(DKK millions) 2012 2011
Index12/11
Q42012
Q32012
Q22012
Q12012
Retail Banking Denmark 953,487 967,672 99 953,487 952,332 956,706 958,335
Retail Banking Finland 152,178 150,484 101 152,178 155,120 153,977 152,214
Retail Banking Sweden 184,000 185,418 99 184,000 193,105 187,665 186,133
Retail Banking Norway 141,463 132,102 107 141,463 142,161 139,873 136,866
Banking Activities Northern Ireland 45,509 53,326 85 45,509 48,278 48,043 48,146
Banking Activities Ireland* 24,046 63,728 38 24,046 25,166 25,992 26,411
Banking Activities Baltics 18,576 20,501 91 18,576 19,152 19,589 20,199
Other Banking Activities 17,394 16,833 103 17,394 16,672 16,832 16,888
Corporate & Institutional Banking 99,782 108,769 92 99,782 108,983 110,939 107,647
Non-core Ireland* 29,359 - - 29,359 29,590 35,812 36,426
Total Banking Activities 1,665,794 1,698,833 98 1,665,794 1,690,559 1,695,428 1,689,265
Danske Markets and Treasury 49,339 44,330 111 49,339 48,883 53,679 42,388
Danske Capital 5,783 6,075 95 5,783 5,785 5,937 6,279
Other Activities -851 -3,603 - -851 751 1,565 -3,312
Allowance account, lending 45,675 47,610 96 45,675 46,131 52,590 50,495
Total lending 1,674,390 1,698,025 99 1,674,390 1,699,847 1,704,019 1,684,125
DEPOSITS AND BONDS ISSUED BY REALKREDIT DANMARK (END OF PERIOD)(DKK millions)
Retail Banking Denmark 292,283 275,995 106 292,283 292,497 290,271 276,572
Retail Banking Finland 100,877 105,256 96 100,877 96,388 99,979 101,755
Retail Banking Sweden 77,625 73,072 106 77,625 74,149 71,167 72,191
Retail Banking Norway 68,198 60,223 113 68,198 63,909 65,137 60,001
Banking Activities Northern Ireland 50,769 55,060 92 50,769 51,350 51,067 50,336
Banking Activities Ireland* 22,563 37,787 60 22,563 21,664 21,645 31,214
Banking Activities Baltics 19,910 19,530 102 19,910 19,745 17,821 18,342
Other Banking Activities 7,189 5,225 138 7,189 6,190 5,271 5,261
Corporate & Institutional Banking 82,632 69,333 119 82,632 67,922 57,018 72,077
Non-core Ireland* 642 - - 642 886 1,230 298
Total Banking Activities 722,688 701,481 103 722,688 694,700 680,606 688,047
Danske Markets and Treasury 68,834 97,412 71 68,834 51,654 58,554 85,547
Danske Capital 5,167 5,700 91 5,167 5,069 5,428 5,778
Other Activities -8,182 -9,318 - -8,182 -8,818 -8,670 -5,659
Total deposits 788,507 795,275 99 788,507 742,605 735,918 773,713
Bonds issued by Realkredit Danmark 614,325 557,699 110 614,325 618,513 596,837 604,323
Own holdings of Realkredit Danmark bonds 121,751 166,580 73 121,751 109,939 127,738 117,668
Total Realkredit Danmark bonds 736,076 724,279 102 736,076 728,452 724,575 721,991
Total covered bonds 220,760 160,805 137 220,760 204,798 190,027 159,436
Deposits and issued mortgage bonds etc. 1,745,343 1,680,359 104 1,745,343 1,675,855 1,650,520 1,655,140
Lending as % of deposits and issued mortgage bonds etc. 96 101 96 101 103 102
* Non-core Ireland was separated from Banking Activities Ireland in 2012.
BALANCE SHEET
FIN
AN
CIA
L R
EV
IEW

14 DANSKE BANK / ANNUAL REPORT 2012
CREDIT EXPOSURE FROM LENDING ACTIVITIES
(DKK millions)31 Dec.
2012Share oftotal (%)
31 Dec.2011
Share oftotal (%)
Retail Banking Denmark 962,581 40 976,962 43
Retail Banking Finland 160,379 7 158,008 7
Retail Banking Sweden 197,355 8 203,319 9
Retail Banking Norway 155,467 6 145,658 6
Banking Activities Northern Ireland 45,271 2 52,480 2
Banking Activities Ireland* 24,746 1 52,695 3
Banking Activities Baltics 21,387 1 22,158 1
Other Banking Activities 96,235 4 55,586 2
Corporate & Institutional Banking 251,086 10 256,188 11
Non-core Ireland* 19,458 1 - -
Total Banking Activities 1,933,965 80 1,923,054 84
Danske Markets and Treasury 476,830 20 365,692 16
Danske Capital 12,246 - 9,965 -
Total 2,423,041 100 2,298,711 100
* Non-core Ireland was separated from Banking Activities Ireland in 2012.
LendingAt the end of 2012, total lending to personal and business customers largely matched the level at the end of 2011. Most of the Group’s markets saw weak growth, which suppressed the demand for credit.
Lending at Retail Banking Denmark was down DKK 14.2 billion from the level at the end of 2011 because of lower lending to personal customers and small and medium-sized businesses.
In Denmark, new gross lending, excluding repo loans, amounted to DKK 45.7 billion. This amount included lending to personal customers of DKK 18.5 billion.
Lending equalled 96% of the total amount of deposits, mortgage bonds and covered bonds, against 101% at the end of 2011. Excluding exchange rate effects, the lending ratio was down at all banking units.
Deposits After having been placed on negative outlook, Danske Bank saw its short-term ratings lowered in the second quarter of 2012.
As expected, the downgrades meant that some short-term money market deposits at Danske Markets were not renewed. Danske Markets thus saw a total decline in net deposits of DKK 29 billion at the end of 2012.
The Group was able almost to offset this decline in the second half of 2012, bringing the decline in total deposits to just DKK 7 billion in 2012.
Deposits at Retail Banking Denmark rose 6% from the level at the end of 2011. Excluding exchange rate effects, total deposits at the international units fell 3% from the year-earlier level, mainly because the Irish unit saw keener competition for business customer deposits.
Credit exposure At the end of 2012, credit exposure totalled DKK 3,656 billion, against DKK 3,611 billion at the end of 2011. Exposure from lending activities amounted to DKK 2,423 billion, against DKK 2,299 billion a year earlier. Some DKK 921 billion of the total exposure derived from trading and investment activities, against DKK 1,020 billion at the end of 2011.
Credit exposure from lending activitiesTotal credit exposure from lending activities included amounts due from credit institutions and
central banks, guarantees and irrevocable loan commitments. The exposure is measured net of accumulated impairment charges and includes repo loans.
Personal customers accounted for 37% of credit exposure from lending activities (2011: 39%), business customers for 36% (2011: 39%), and financial counterparties for 18% (2011: 17%). The remainder was exposure to central banks and governments. Of the exposure to business customers, small and medium-sized businesses accounted for 68% (2011: 68%).
Personal customersCredit exposure to personal customers covers loans secured on the customers’ assets, consumer loans and fully or partially secured credits.
At the end of 2012, credit exposure to personal customers amounted to DKK 896 billion, largely in line with the year-earlier level.
Personal customer demand for credit was weaker in Denmark than it was in 2011, but increased during the year. At 93%, the share of approved personal customer loan applications was the same as in 2011.
In Denmark, taxes and duties rose and real wages fell. Despite this, the quality of the loan portfolio in Denmark improved as households reduced their spending and interest rates remained low.

DANSKE BANK / ANNUAL REPORT 2012 15
FIN
AN
CIA
L R
EV
IEWMoreover, the Danish government decided to allow
people to opt out of the early retirement scheme and receive their savings in cash.
In 2013, wage growth will probably still be slow, but the majority of personal customers will see an increase in their disposable income as a result of the tax cuts that took effect at the beginning of the year. Realkredit Danmark saw a fall in the delinquency rate from 0.26% at 31 December 2011 to 0.24% at 31 December 2012.
Credit quality at the other Nordic retail units remained good, and delinquency rates were unchanged. Low interest rates and unemployment rates each had a positive effect on credit quality, and impairment charges were limited throughout the year. A slowdown in the Finnish and Swedish economies may adversely affect the credit quality of the portfolio in 2013.
In 2012, the unemployment rates in Ireland and Northern Ireland were high but stable. Impairment charges at the Irish unit amounted to DKK 0.7 billion, or 4.9% of lending and guarantees to personal customers.
At the Baltic units, a general improvement in the Baltic economies led to a net reversal of impairment charges.
Home financing Home financing accounted for DKK 812 billion of credit exposure to personal customers, with Realkredit Danmark loans accounting for DKK 431 billion of this amount.
The average loan-to-value (LTV) ratio remained high because of the decline in house prices in recent years. At Realkredit Danmark, the LTV ratio fell from 76% at the end of 2011 to 73% at the end of 2012. The Group has tightened its credit policy for home loans with a high LTV ratio and has made a collective impairment charge of DKK 0.2 billion to cover losses on customers with negative equity.
Interest-only loans provided by Realkredit Danmark to personal customers accounted for 55% of its total loans at the end of 2012, on a par with the year-earlier level. The number of Realkredit Danmark customers whose loans will start to amortise in 2013 is limited, and their LTV ratios are mostly low.
In 2012, house prices in Ireland stabilised and there were some signs of improvement in Dublin towards the end of the year.
Business customersCredit exposure to business customers comprises loans secured on assets and working capital financing.
At the end of 2012, credit exposure had fallen to DKK 875 billion from DKK 899 billion at the end of 2011. Exposure to small and medium-sized businesses fell 2.9%, and exposure to large corporate customers was down 1.9%.
On the whole, business customer credit quality was unchanged. The credit quality of small and medium-sized businesses remained under pressure. This was the case particularly for businesses dependent on consumer spending and the construction industry.
The credit quality of large corporate customers remained generally good, although difficulties persisted in the shipping industry.
Commercial property customersAt 31 December 2012, credit exposure to commercial property customers totalled DKK 252 billion, against DKK 257 billion at 31 December 2011. Of this amount, exposure in Denmark accounted for DKK 118 billion, of which DKK 105 billion represented loans provided by Realkredit Danmark. After a sustained downward trend, the
LOAN-TO-VALUE RATIO, HOME LOANS
31 Dec. 2012 31 Dec. 2011
LTV (%)
Credit exposure
LTV (%)
Credit exposure
Retail Banking Denmark 73.6 519 76.6 517
Realkredit Danmark 73.4 431 76.4 427
Retail Banking Finland 64.4 93 62.9 84
Retail Banking Sweden 68.2 74 70.8 63
Retail Banking Norway 62.0 78 63.1 68
Banking Activities Northern Ireland 77.9 16 76.7 15
Banking Activities Ireland* 109.2 15 106.0 15
Banking Activities Baltics 79.1 10 84.1 11
Non-core Ireland* 120.3 7 122.0 8
Average 72.2 812 74.5 781
* Non-core Ireland was separated from Banking Activities Ireland in 2012.

16 DANSKE BANK / ANNUAL REPORT 2012
credit quality of the property finance portfolio stabilised at a low level. At the other Nordic units, credit exposure to commercial property customers amounted to DKK 98 billion, and credit quality remained stable. The trend was driven primarily by general stabilisation of rental income and return requirements in the Nordic capitals. At the end of 2012, exposure to the Northern Ireland property segment amounted to DKK 6.7 billion. Property developers accounted for DKK 1.5 billion, or 3.3% of the total exposure of the Northern Ireland unit. Exposure to the Irish commercial property segment amounted to DKK 7.7 billion. Most of this exposure is part of Non-core Ireland. Exposure to property developers was reduced to DKK 1.9 billion, or 10% of the total exposure at Non-core Ireland. Property developers have suffered considerably during the economic downturn as the value of development projects has fallen typically 70-90% since the market peaked in 2007.
The commercial property market in Ireland remains under pressure as the slight decline in prices continues and return requirements are historically high, even though they stabilised in 2012. The number of transactions rose marginally in 2012, but from a very low level, and the market continued to suffer from low activity. The vacancy rate varied considerably, depending on the property type and location. In general, Dublin had the lowest vacancy rates, and particularly retail shops located outside large cities were hit hard.
Agricultural customersAt the end of 2012, agricultural customer credit exposure amounted to DKK 69 billion, against DKK 68 billion at the end of 2011. Loans provided by Realkredit Danmark accounted for DKK 45 billion, the same level as at the end of 2011.
The agriculture industry saw improved earnings for plant growers and pig breeders, while milk producers were subject to falling milk prices and sharply rising feed prices. As a result of the industry’s high debt levels and the financing types used, agriculture is highly sensitive to changes in interest rates. The low rates in 2012 therefore strengthened the loan portfolio. Accumulated impairment charges against facilities to agricul-tural customers amounted to DKK 3.2 billion (2011: DKK 3.0 billion), or 4.9% of lending and guarantees.
ShippingAt the end of 2012, credit exposure to the shipping industry amounted to DKK 44 billion, against DKK 48 billion at the end of 2011. The pressure on the shipping industry continued, and declines in shipping asset values had an adverse effect on the Group’s collateral. Low freight rates also continued to affect liquidity in the industry. Accumulated impairment charges against facilities to the shipping industry amounted to DKK 2.0 billion (2011: DKK 1.2 billion), or 5.7% of lending and guarantees.
Non-core Ireland The Group identified certain customer segments at Banking Activities Ireland that are no longer considered to be part of the core business. The main Non-core customer segments are commercial property and personal customer investment property. At the end of 2012, credit exposure at Non-core Ireland totalled DKK 19.5 billion, with commercial property exposures accounting for DKK 7.3 billion and personal customer investment property exposures accounting for DKK 5.1 billion. The rest of the Non-core exposure, primarily to consumer industries, amounted to DKK 7.1 billion.
Impaired exposures made up 51% of the portfolio. Charges were made against 93% of the impaired exposures. Impaired personal customer exposures made up 23% of the personal customer portfolio, and charges were made against 93% of these exposures.
Financial counterpartiesCredit exposure to financial counterparties amounted to DKK 436 billion at 31 December 2012, against DKK 389 billion a year earlier. Most of the exposure related to bank facilities that were to a large extent secured on collateral. The credit quality of financial counterparties remained good despite some downgrades.
In 2012, the Group reduced its exposure to conduits by DKK 3.4 billion through the disposal of a number of large conduit loans. The proceeds largely matched the booked values. At the end of 2012, total exposure to conduits had fallen to DKK 18 billion from DKK 29 billion at the end of 2011. The Group’s exposure to conduits will be reported as part of Non-core from 2013.
At 31 December 2012, exposure to small and medium-sized Danish banks (groups 2-4 as defined

DANSKE BANK / ANNUAL REPORT 2012 17
by the Danish FSA) accounted for 0.5% of total exposure to financial counterparties.
Risk Management 2012, which is available at www.danskebank.com/ir, provides more details on the Group’s credit risks.
Allowance accountThe allowance account holds accumulated loan impairment charges.
At 31 December 2012, accumulated individual charges were at the year-earlier level, amounting to DKK 44 billion, or 2.2% of lending and guarantees. Accumulated collective charges amounted to DKK 3.8 billion, or 0.2% of lending and guarantees. The corresponding figure at 31 December 2011 was DKK 4.1 billion.
The commercial property segments at Non-core Ireland and the Northern Ireland unit accounted for DKK 6.6 billion and DKK 3.2 billion, respectively, of the allowance account balance, while the personal customer segment at the Danish unit accounted for DKK 5.1 billion. In total, commercial property customers accounted for DKK 15.4 billion and personal customers for DKK 10.4 billion of the allowance account balance.
Write-offs rose from DKK 11.2 billion in 2011 to DKK 15 billion in 2012, mainly because of large write-offs at Non-core Ireland and the disposal of conduit loans. Other losses related mainly to small businesses at Retail Banking Denmark. Of write-offs in 2012, DKK 1.4 billion was attributable to facilities not already subject to impairment. Write-offs in 2011 included the settlement of DKK 3.3 billion for the Group’s commitment under Danish Bank Package 1.
Impaired exposuresIndividually impaired exposures are exposures in rating categories 10 and 11 with objective evidence of impairment.
Rating category 10 contains customers with impaired exposures that are not in default. These exposures show signs of financial difficulty, including a risk of further impairment in the future. Most of the customers in this category continue to service their loans in a timely manner.
Rating category 11 contains exposures to customers which, according to the Group’s definition, are in default. These customers are subject to debt collection, restructuring or bankruptcy, or have one or more facilities on which a payment is more than 90 days past due.
If a customer defaults on just a single facility, the customer’s downgrade to rating category 10 or 11 applies to the entire exposure. Downgrading takes place even if the customer has provided full collateral. The value of collateral in the table reflects a haircut of 20-40%.
FIN
AN
CIA
L R
EV
IEW
ALLOWANCE ACCOUNT 31 Dec. 2012 31 Dec. 2011
(DKK millions) Balance
% of lendingand
guarantees Balance
% of lendingand
guarantees
Retail Banking Denmark 19,055 1.94 18,180 1.81
Retail Banking Finland 1,942 1.23 1,974 1.26
Retail Banking Sweden 1,450 0.77 1,226 0.64
Retail Banking Norway 1,227 0.80 1,474 1.04
Banking Activities Northern Ireland 6,592 12.99 5,083 8.95
Banking Activities Ireland* 1,302 5.29 13,820 21.46
Banking Activities Baltics 1,651 8.52 2,244 10.63
Other Banking Activities 400 1.55 381 1.77
Corporate & Institutional Banking 2,544 1.99 1,455 1.08
Non-core Ireland* 11,348 38.53 - -
Danske Markets and Treasury 135 0.04 2,599 0.87
Danske Capital 147 0.77 168 1.04
Total 47,793 2.36 48,604 2.46
* Non-core Ireland was separated from Banking Activities Ireland in 2012.

18 DANSKE BANK / ANNUAL REPORT 2012
BOND PORTFOLIO(%)
31 Dec.2012
31 Dec.2011
Government bonds and bonds guaranteed by central or local governments 36 28
Bonds issued by quasi-government institutions 1 2
Danish mortgage bonds 42 46
Swedish covered bonds 11 14
Other covered bonds 5 5
Short-term bonds (CP etc.), primarily with banks 2 2
Corporate bonds 3 3
Total holdings 100 100
Available-for-sale bonds included in total holdings 13 15
Holdings of government bonds consisted primarily of bonds issued by the Nordic countries, Germany and the UK. The net exposure to government bonds from Ireland, Portugal, Spain and Italy was DKK 10.5 billion (2011: DKK 2.5 billion). All holdings of government bonds issued by these countries were recognised at fair value. Danica Pension’s exposure to government bonds from Ireland, Portugal, Spain and Italy totalled DKK 8.1 billion (2011: DKK 7.3 billion), with policyholders receiving most of the return and assuming most of the risk. The Group’s bond portfolio did not include government bonds issued by Greece.
Capital and solvency The Group’s capital base consists of tier 1 capital (equity capital and hybrid capital after deductions) and tier 2 capital (subordinated debt after deductions). At the end of 2012, the capital base amounted to DKK 174 billion, and the total capital ratio was 21.3%. The core tier 1 capital ratio stood at 14.5%.
At the end of October 2012, the Group issued new shares that generated gross proceeds of DKK 7.1 billion. The share capital increase raised the Group’s core tier 1 capital ratio by 0.9 of a percentage point.
“Impaired” exposure includes exposures fully covered by collateral or exposures on which the Group does not expect to recognise a loss. “Impaired with charges made” totalled DKK 48 billion at the end of 2012 (end-2011: DKK 43.3 billion), or 68% of the total amount of impaired exposure.
Trading and investment activities Credit exposure from trading and investment activities amounted to DKK 921 billion at 31 December 2012, against DKK 1,020 billion at 31 December 2011.
The Group has made agreements with many of its counterparties to net positive and negative market values. The net exposure was DKK 105 billion, against DKK 99 billion at the end of 2011, and most of it was secured by collateral management agreements.
The value of the bond portfolio, excluding customer funds at Danica Pension, was DKK 505 billion, with DKK 66 billion recognised at fair value in accordance with the rules on available-for-sale financial assets. Of the total bond portfolio, 98.4% was recognised at fair value and 1.6% at amortised cost. The Group has not reclassified bonds since 2008.
IMPAIRED EXPOSURE AT 31 DECEMBER 2012
Impaired Impaired with charges made
(DKK billions)
Per-forming
(rating category
10)
Non-per-forming
(rating category
11)
Per-forming
(rating category
10)
Non-per-forming
(rating category
11)
Credit exposure before impairment charges 50.8 65.2 36.1 57.6
Accumulated impairment charges 13.0 32.7 13.0 32.7
Credit exposure 37.8 32.5 23.1 24.9
Collateral value 27.9 28.7 17.3 22.5
Total unsecured exposure 9.9 3.8 5.8 2.3
Covered by impairment charges and collateral (%) 80.5 94.2 84.0 95.9

DANSKE BANK / ANNUAL REPORT 2012 19
FIN
AN
CIA
L R
EV
IEWChanges to financial highlights in 2013
In 2013, the following changes will be implemented in the presentation of the Group’s financial highlights:
• The internal funds transfer pricing model will change. The model will better reflect future international liquidity requirements and guidelines for funds transfer pricing. The new pricing model will reduce net interest income and increase net trading income.
• Operational leasing, excluding property leasing, will be presented on a net basis under Other income. The change will reduce other income and expenses.
• The income statement effect of Non-core activities will be presented as a separate line item. The Non-core activities consist of Irish property exposures and securitisation transactions, which are not considered part of the Group’s core business (conduits).
The changes will not affect the net profit. The table below shows adjusted highlights for 2012.
In September 2012, the Group issued DKK 5.7 billion in subordinated debt. The issue was part of the Group’s ongoing adjustment of its capital structure to meet the coming European capital requirements for banks.
In 2012, the Group redeemed subordinated debt of DKK 5.0 billion as planned.
At the end of 2012, risk-weighted assets amounted to DKK 819 billion, against DKK 906 billion at the end of 2011. The decrease was caused mainly by the disposal of conduit loans.
The Group uses primarily the internal ratings-based approach to calculate risk-weighted assets for credit risk.
At 31 December 2012, the Group’s solvency need ratio was 11.0%. Under Danish law, the Group must publish its solvency need on a quarterly basis. More detailed information is available at www.danskebank.com/ir.
INCOME STATEMENT Change
(DKK millions)Highlights
2012Funds
transfer pricing Non-core Leasing Other
Adjustedhighlights
2012
Net interest income 24,788 -1,475 -428 - -204 22,681
Net fee income 8,782 - -26 - 94 8,850
Net trading income 8,901 1,475 8 - 110 10,494
Other income 2,951 - - -1,665 - 1,286
Net income from insurance business 2,263 - - - - 2,263
Total income 47,685 - -446 -1,665 - 45,574
Expenses 26,588 - -275 -1,665 - 24,648
Profit before loan impairment charges 21,097 - -171 - - 20,926
Loan impairment charges 12,529 - -4,849 - - 7,680
Profit before tax, core - - - - - 13,246
Profit before tax, Non-core - - -4,678 - - -4,678
Profit before tax 8,568 - - - - 8,568
Tax 3,819 - - - - 3,819
Net profit for the year 4,749 - - - - 4,749

20 DANSKE BANK / ANNUAL REPORT 2012
Future financial reporting will reflect this business segmentation. Banking Activities will be split into Personal Banking, Business Banking and Corporates & Institutions. Danske Markets’ performance will be reported under Corporates & Institutions.
Personal Banking serves personal and private banking customers. The unit focuses on offering first-class self-service products and proactive advice to customers with more complex finances.
Personal Banking will set new standards for digital innovation and advisory solutions and will offer detailed advice to customers who require this.
Business Banking serves small and medium-sized businesses through a large network of finance centres, branches, contact centres and online channels. The unit offers leading solutions within financing, investing, cash management and risk management.
Corporates & Institutions is a leading provider of wholesale banking services for the largest institutional and corporate customers in the Nordic region. Products and services include cash management services; trade finance solutions; custody services; equity, bond, foreign exchange and derivatives products; corporate finance; and acquisition finance.
The new organisationOn 1 June 2012, Danske Bank Group implemented a new organisational structure in order to strengthen its focus on customers. With a view to a clearer segmentation of customers, the Group now consists of the following units:
Personal Banking
Business Banking
Corporates & Institutions
Danske Capital
Danica Pension
Other Activities
Non-core
FINANCIAL TARGETS 2012 Adjusted targets
Return on equity after tax (%) 3.7 Above 12 in 2015
Ratings S&P/Moody’s/FitchA-/Baa1/A
Improve ratings at least one notch
Core tier 1 capital ratio (%) 14.5 Minimum 13 by the end of 2013 as reported
Total capital ratio (%) 21.3 Minimum 17 by the end of 2013 as reported
Liquidity Coverage Ratio (LCR) (%) 121 Meet expected EU 2015 LCR requirement by the end of 2012
Nominal costs (DKK billions) 26.6 Below 24 billion in 2015
Full-time equivalent staff (end of year) 20,308 To be reduced by 2,000 in 2013-2015
Cost/income ratio (%) 55.8 Below 46 in 2015
Dividend payments None About 40% of profit for the year after tax once capital and rat-ing targets have been reached
In connection with the launch of New Standards, the Group also announced a number of financial targets.
The targets have been adjusted to reflect changes to financial reporting from 2013.

DANSKE BANK / ANNUAL REPORT 2012 21
FIN
AN
CIA
L R
EV
IEW
Corporates & Institutions delivered a satisfactory profit before tax of DKK 6.1 billion. Lending amounted to about DKK 161 billion, or about 10% of total Group lending. Deposits amounted to DKK 162 billion, or almost 21% of total Group deposits.
Business Banking generated a profit before tax of DKK 2.8 billion. Loan impairment charges against facilities to business customers were high, mainly because of the economic downturn. Lending amounted to DKK 642 billion, or about 38% of total Group lending. Deposits amounted to about DKK 253 billion, or 32% of total Group deposits. Personal Banking posted a profit before tax of DKK 1.7 billion as low interest rates continued to be a challenge. Lending amounted to DKK 873 billion, or about 52% of total Group lending. Deposits amounted to DKK 374 billion, or about 47% of total Group deposits.
Figures for lending include mortgage lending, which is funded through the issuance of listed mortgage bonds.
Danske Capital and Danica Pension will continue to offer asset management and life insurance products to private individuals and businesses.
Other Activities encompasses Group Treasury, Group IT, Group Services and eliminations, including the elimination of returns on own shares. Group Treasury is responsible for the Group’s liquidity management and funding.
The Group has identified certain customer segments that are no longer considered part of the core business. The Non-core business unit is responsible for the controlled winding-up of this part of the loan portfolio. Existing exposures are either wound up or divested.
The table above shows adjusted business segment figures for 2012.
In 2012, core activities posted a profit before tax of DKK 13.2 billion. About 75% of income was generated by the three banking units, and about 25% came from the capital market activities at Danske Capital and the insurance business at Danica Pension. Non-core activities posted a significant loss of DKK 4.7 billion, mainly because of loan impairment charges of DKK 4.9 billion.
(DKK millions)Personal
BankingBusiness
Banking C&IDanskeCapital
DanicaPension
OtherActivities Non- core Highlights
Net interest income 11,172 9,497 1,975 8 - 29 - 22,681
Net fee income 3,715 2,155 1,115 1,945 - -80 - 8,850
Net trading income 815 489 8,439 -3 - 754 - 10,494
Other income 608 483 17 - - 178 - 1,286
Net income from insurance business - - - - 2,263 - - 2,263
Total income 16,310 12,624 11,546 1,950 2,263 881 - 45,574
Expenses 11,864 6,030 4,307 982 - 1,465 - 24,648
Profit before loan impairment charges 4,446 6,594 7,239 968 2,263 -584 - 20,926
Loan impairment charges 2,748 3,830 1,154 - - -52 - 7,680
Profit before tax, core 1,698 2,764 6,085 968 2,263 -532 - 13,246
Profit before tax, Non-core - - - - - - -4,678 -4,678
Profit before tax 1,698 2,764 6,085 968 2,263 -532 -4,678 8,568
Cost/income ratio (%) 72.7 47.8 37.3 50.4 - 166.3 - 54.1
Full-time-equivalent staff (end of year) 7,958 3,776 1,496 481 799 5,705 93 20,308
Loans and advances (end of year) 873,199 641,867 161,129 211 - -46,553 44,537 1,674,390
Deposits (end of year) 373,921 252,970 161,815 115 - -5,062 4,748 788,507

22 DANSKE BANK / ANNUAL REPORT 2012
The trend in credit quality will generally depend on economic conditions in the Group’s markets, including the development in house prices. Loan impairment charges for core activities are expected to fall slightly below the level in 2012 (DKK 7.7 billion), while impairment charges for Non-core activities are expected to be significantly lower than the year-earlier level (DKK 4.9 billion).
The Group previously announced that impairment charges at the Irish unit (core and Non-core) were expected to amount to DKK 5.0-7.0 billion from 1 April 2012 to end-2014. We reaffirm this expectation. Total charges for 2013 and 2014 are thus expected to be around DKK 2.5 billion.
The Group’s tax rate for 2013 is expected to be somewhat above the Danish corporate tax rate of 25%.
The low interest rates continue to be challenging, putting pressure on the near-term return on equity. We expect net profit for 2013 to be in the range of DKK 7.5-10 billion (2012: DKK 4.7 billion), corresponding to a return on equity of 5.5-7%. Earnings per share is expected to increase to DKK 7.5-10.0.
This profit guidance is subject to uncertainty and depends in particular on normalised trading and insurance business income and on economic conditions not turning worse than expected.
Our return on equity target for 2015 is at least 12%, assuming short-term interest rates of 2%.
Outlook for 2013 In 2013, Europe is likely to experience only modest growth. It is not realistic to expect that the European economy as a whole will grow at a pace sufficient to prevent higher unemployment rates or reduce idle capacity, and European interest rates are likely to remain low.
We also expect low interest rates and low growth in our home markets.
In 2013, Danske Bank will continue to focus on executing our ‘New Standards’ strategy.
The outlook for 2013 as outlined below is based on the adjusted financial highlights for 2012 shown on page 19.
The Group is continuing its efforts to increase income. The announced and implemented initiatives are expected to raise net interest and net fee income in 2013, but lower key interest rates and lower lending volumes, especially at Personal Banking, will reduce the effect. Overall, net interest income is likely to remain at the 2012 level (DKK 22.7 billion), whereas net fee income is expected to increase from the level in 2012 (DKK 8.9 billion).
Net trading income is generally expected to remain at a satisfactory level, though below the level in 2012 (DKK 10.5 billion).
Other income is expected to be in line with the level in 2012 (DKK 1.3 billion).
Net income from insurance business is expected to be lower than in 2012 (DKK 2.3 billion), partly because of the effect of the booking of DKK 0.4 billion to income from the shadow account in 2012.
The Group will invest in customer offerings, but ongoing cost savings initiatives will keep total costs at the same level as in 2012 (DKK 24.6 billion).

DANSKE BANK / ÅRSRAPPORT 2012 23
FOR
RE
TN
ING
SO
MR
ÅD
ER
New NormalThere’s no doubt the next
generation will be digital. Even
now, our new digital solutions are
tempting customers away from
the traditional branches as more
and more transactions are
handled online or via an app.
It’s time to say goodbye to banks
as we know them and hello to new
standards for where and how you
will bank with us in the future.
The short version is that we’re
moving from the High Street to
your back pocket.

24 DANSKE BANK / ANNUAL REPORT 2012
PROFIT BEFORE LOAN IMPAIRMENT CHARGES
(DKK millions) 2012 2011Index
12/11
Share of total (%)
2012
Share of total (%)
2011
Retail Banking Denmark 7,751 7,735 100 37 44
Retail Banking Finland 509 353 144 2 2
Retail Banking Sweden 1,756 1,509 116 8 9
Retail Banking Norway 1,261 716 176 6 4
Banking Activities Northern Ireland 595 320 186 3 2
Banking Activities Ireland* -175 336 - -1 2
Banking Activities Baltics 384 366 105 2 2
Other Banking Activities 441 443 100 2 3
Corporate & Institutional Banking 1,964 1,973 100 9 11
Non-core Ireland* 162 - - 1 -
Total Banking Activities 14,648 13,751 107 69 79
Danske Markets and Treasury 4,388 3,064 143 21 18
Danske Capital 1,071 887 121 5 5
Danica Pension 2,263 569 - 11 3
Other Activities -1,273 -881 - -6 -5
Total Group 21,097 17,390 121 100 100
* Non-core Ireland was separated from Banking Activities Ireland in 2012.
Danske Bank Group is the largest financial services provider in Denmark and one of the largest in the Nordic region. The Group offers customers a wide range of services in the fields of banking, mortgage finance, insurance, real estate brokerage, asset management and trading in fixed income products, foreign exchange and equities.
Danske Bank is a retail bank operating in 15 coun-tries, primarily in the Nordic region. The Group is market leader in Denmark and one of the largest banks in Northern Ireland and Finland.
Danica Pension carries out the Group’s life insu-rance and pension activities.
The Group is organised in a number of business units and support functions.
See note 2 for more detailed descriptions of the business units.
INCOME – % OF GROUP TOTAL LENDING – % OF GROUP TOTAL
Retail Banking DenmarkRetail Banking FinlandRetail Banking SwedenRetail Banking NorwayBanking Activities Northern IrelandBanking Activities IrelandBanking Activities Baltics
Other Banking ActivitiesCorporate & Institutional BankingNon-coreDanske Markets and TreasuryDanske CapitalDanica PensionOther Activities
INCOME – % OF GROUP TOTAL
LENDING – % OF GROUP TOTAL
Retail Banking DenmarkRetail Banking FinlandRetail Banking SwedenRetail Banking NorwayBanking Activities Northern IrelandBanking Activities IrelandBanking Activities Baltics
Other Banking ActivitiesCorporate & Institutional BankingNon-coreDanske Markets and TreasuryDanske CapitalDanica PensionOther Activities
3%
1%
4%
55%9%
11%
8%
1%
1%6% 2% 3%
36%
7%
7%6%
1%1%
5%6%
1%
16%
5%5%
3%
1%
55%9%
11%
8%
1%
1%6% 2% 3%
4%
36%
7%
7%6%
1%1%
5%6%
1%
16%
5%5%
BANKING ACTIVITIES 25DANSKE MARKETS AND TREASURY 28DANSKE CAPITAL 30DANICA PENSION 32OTHER ACTIVITIES 35
COUNTRIES15
EMPLOYEES20,308
CUSTOMERS5 MILLION
BUSINESS UNITS
DANSKE BANK / ANNUAL REPORT 2012 25
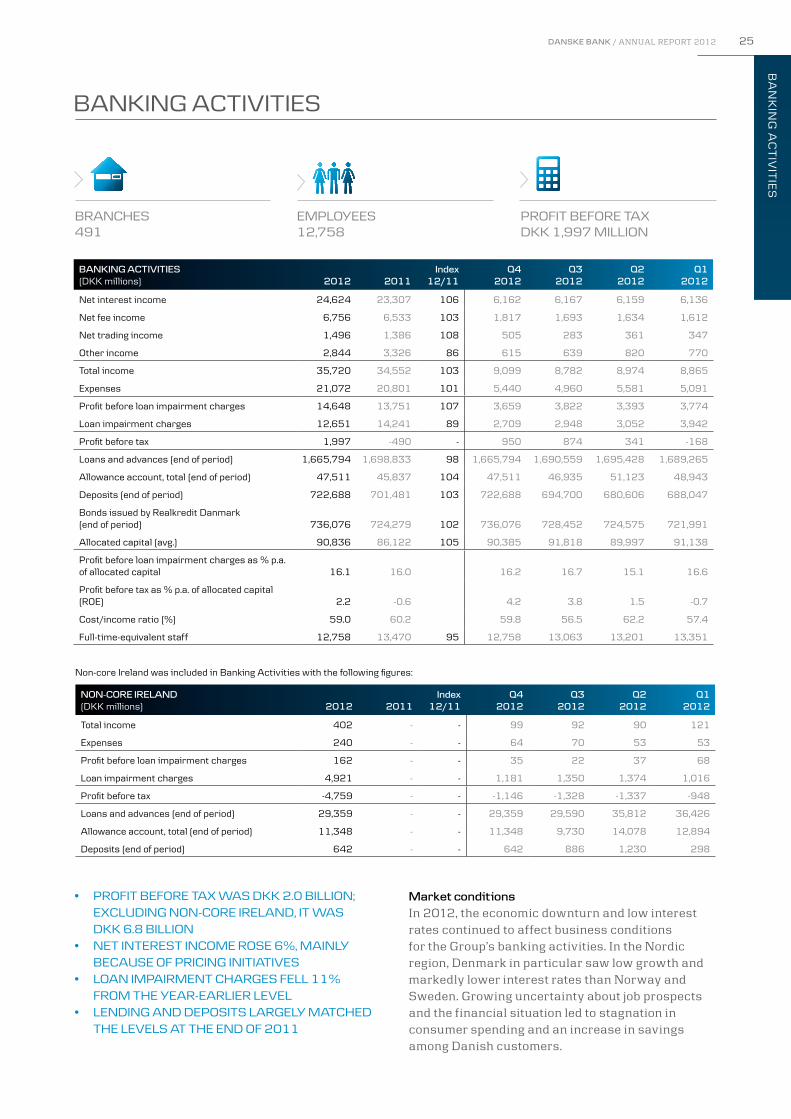
Non-core Ireland was included in Banking Activities with the following figures:
Market conditions In 2012, the economic downturn and low interest rates continued to affect business conditions for the Group’s banking activities. In the Nordic region, Denmark in particular saw low growth and markedly lower interest rates than Norway and Sweden. Growing uncertainty about job prospects and the financial situation led to stagnation in consumer spending and an increase in savings among Danish customers.
BANKING ACTIVITIES (DKK millions) 2012 2011
Index12/11
Q42012
Q32012
Q22012
Q12012
Net interest income 24,624 23,307 106 6,162 6,167 6,159 6,136
Net fee income 6,756 6,533 103 1,817 1,693 1,634 1,612
Net trading income 1,496 1,386 108 505 283 361 347
Other income 2,844 3,326 86 615 639 820 770
Total income 35,720 34,552 103 9,099 8,782 8,974 8,865
Expenses 21,072 20,801 101 5,440 4,960 5,581 5,091
Profit before loan impairment charges 14,648 13,751 107 3,659 3,822 3,393 3,774
Loan impairment charges 12,651 14,241 89 2,709 2,948 3,052 3,942
Profit before tax 1,997 -490 - 950 874 341 -168
Loans and advances (end of period) 1,665,794 1,698,833 98 1,665,794 1,690,559 1,695,428 1,689,265
Allowance account, total (end of period) 47,511 45,837 104 47,511 46,935 51,123 48,943
Deposits (end of period) 722,688 701,481 103 722,688 694,700 680,606 688,047
Bonds issued by Realkredit Danmark (end of period) 736,076 724,279 102 736,076 728,452 724,575 721,991
Allocated capital (avg.) 90,836 86,122 105 90,385 91,818 89,997 91,138
Profit before loan impairment charges as % p.a. of allocated capital 16.1 16.0 16.2 16.7 15.1 16.6
Profit before tax as % p.a. of allocated capital (ROE) 2.2 -0.6 4.2 3.8 1.5 -0.7
Cost/income ratio (%) 59.0 60.2 59.8 56.5 62.2 57.4
Full-time-equivalent staff 12,758 13,470 95 12,758 13,063 13,201 13,351
BANKING ACTIVITIES
BRANCHES491
EMPLOYEES12,758
PROFIT BEFORE TAXDKK 1,997 MILLION
BA
NK
ING
AC
TIV
ITIE
S
NON-CORE IRELAND (DKK millions) 2012 2011
Index12/11
Q42012
Q32012
Q22012
Q12012
Total income 402 - - 99 92 90 121
Expenses 240 - - 64 70 53 53
Profit before loan impairment charges 162 - - 35 22 37 68
Loan impairment charges 4,921 - - 1,181 1,350 1,374 1,016
Profit before tax -4,759 - - -1,146 -1,328 -1,337 -948
Loans and advances (end of period) 29,359 - - 29,359 29,590 35,812 36,426
Allowance account, total (end of period) 11,348 - - 11,348 9,730 14,078 12,894
Deposits (end of period) 642 - - 642 886 1,230 298
• PROFIT BEFORE TAX WAS DKK 2.0 BILLION; EXCLUDING NON-CORE IRELAND, IT WAS
DKK 6.8 BILLION • NET INTEREST INCOME ROSE 6%, MAINLY BECAUSE OF PRICING INITIATIVES• LOAN IMPAIRMENT CHARGES FELL 11%
FROM THE YEAR-EARLIER LEVEL• LENDING AND DEPOSITS LARGELY MATCHED
THE LEVELS AT THE END OF 2011
26 DANSKE BANK / ANNUAL REPORT 2012
The Baltic units benefited from an improved business environment.
At Corporate & Institutional Banking lending volumes increased in the first half of 2012 and then declined. Average lending was higher in 2012 than in 2011. Deposits declined in the first half of the year, mainly because the Group’s ratings were lowered, and then rose. Average deposits were lower in 2012 than in 2011.
Financial summaryAt DKK 35.7 billion, Banking Activities’ total income rose 3% over the level in 2011, mainly as a result of higher net interest income.
Net interest income amounted to DKK 24.6 billion, up 6% from the year-earlier level. The main driver of this trend was a general rise in lending margins resulting from pricing initiatives. Lending margins rose for both personal and business customers.
Loan impairment charges fell DKK 1.6 billion from the level in 2011. Retail Banking Denmark saw a general deterioration in customer credit quality, while an increase in impairment charges at Corporate & Institutional Banking came mainly from a small number of charges against facilities to shipping customers.
Market shares The market share of lending rose in Denmark, but fell a little in the Group’s other core markets. The unit in Norway maintained its market share of deposits, whereas deposit shares fell marginally in the other markets.
In 2012, the market shares of deposits were challenged by keener competition, particularly in Finland and Sweden.
The ECB lowered its leading interest rates in July 2012. The Danish central bank followed suit and also cut rates independently on a number of occasions, causing the certificate of deposit rate to become negative. The central bank in Sweden also lowered key interest rates several times throughout the year, while the Norwegian central bank made a single rate cut in March 2012.
The Group continued its pricing initiatives to boost earnings and offset the effects of the low interest rates and rising funding costs. Retail Banking Denmark raised lending rates on selected products for both personal and business customers several times.
Previously announced pricing initiatives at Realkredit Danmark were implemented on 1 January 2012, and further adjustments were made during the year.
Retail Banking Norway adjusted margins and loan fees. Both Retail Banking Norway and Retail Banking Sweden are striving to achieve a better balance between loans and deposits in order to minimise funding costs.
Low European interest rates and rising funding costs continued to weaken earnings at Retail Banking Finland, and this prompted the unit to adjust the pricing of new property loans, including home loans, on several occasions.
The Irish and Northern Ireland economies remained under pressure, and interest rates were low. The Irish unit repriced home loans in the fourth quarter of 2011, with full effect in 2012. The Northern Ireland unit adjusted the pricing of loans for both personal and business customers.
NET INTEREST INCOME AND RATES IN DENMARK (DKK millions)
Net interest income Lending rate*Deposit rate*
* excluding Realkredit Danmark
2011 2012
2,600
2,700
2,800
2,900
3,000
3,100
3,200
3,300
Q4Q3Q2Q1Q4Q3Q2Q1
(%)
0.0
0.5
1.0
1.5
2.0
2.5
3.0
3.5
4.0
36%
36%
Retail Banking DenmarkRetail Banking FinlandRetail Banking SwedenRetail Banking NorwayBanking Activities Northern Ireland
Banking Activities IrelandBanking Activities BalticsOther Banking ActivitiesCorporate & Institutional BankingNon-core
INCOME – % OF GROUP TOTAL LENDING – % OF GROUP TOTAL
Retail Banking DenmarkRetail Banking FinlandRetail Banking SwedenRetail Banking NorwayBanking Activities Northern IrelandBanking Activities IrelandBanking Activities BalticsOther Banking ActivitiesCorporate & Institutional BankingNon-core
INCOME – % OF GROUP TOTAL
LENDING – % OF GROUP TOTAL
3%
1%
4%
55%9%
11%
8%
1%
1%6% 2%
7%
7%6%
1%1%
5%6%
1%
3%
1%
4%
55%9%
11%
8%
1%
1%6% 2%
7%
7%6%
1%1%
5%6%
1%

DANSKE BANK / ANNUAL REPORT 2012 27
began in 2008, and the difficulties continued in 2012, when the economy contracted. There are indications of economic growth in 2013, however, when a rise in real wages, low interest rates and a more stable housing market are expected to contribute to positive growth. Growth will be slow, however, and the unemployment rate may continue to rise. The Danish economy is still fragile.
The Swedish economy, on the other hand, emerged from the financial crisis successfully, but it became clear in 2012 that the European debt crisis is also affecting Sweden. Growth in 2013 is forecast to be modest. Rate cuts and an expansive fiscal policy are expected, however, to ensure some economic recovery. House prices have started to decline, but a sharp drop in prices in 2013 is unlikely.
Norway continues to benefit from high oil prices, and investment activity in the oil industry remains strong. This will help to maintain high growth in mainland Norway in 2013. High property investment growth, driven by a steady rise in house prices, is also boosting economic activity in Norway. In the long term, however, there is a risk of unbalanced growth.
The Finnish economy is expected to grow only slightly in 2013 because of sluggish growth in Finland’s export markets in Europe and a tight fiscal policy. In addition, growth in consumer spending is limited because growth in real wages is modest.
Operations Most customers conduct an increasing number of their day-to-day banking transactions themselves through online, mobile and tablet banking solutions and the contact centre, which is open 24/7 all year round.
Over the past several years, the Group has helped customers use its self-service options by teaching them how to use eBanking, for instance. In view of the decision to merge a number of branches and close the teller functions at 131 branches, the Group will intensify these efforts and help senior-citizen customers in particular take advantage of the many digital solutions available. Read more about the Group’s initiatives at www.danskebank.dk/trinfortrin (available in Danish only).
Non-core IrelandIn the first quarter of 2012, the Group transferred non-core customer segments of Banking Activities Ireland to a separate unit.
Non-core Ireland posted a loss before tax of DKK 4.8 billion. Lending, which consists mainly of commercial and investment property exposures, including personal customer investment property exposures, totalled DKK 29.4 billion. Deposits came to DKK 0.6 billion.
Market outlook Of the economies in the Nordic region, Denmark has suffered the most from the financial crisis that
* Including Corporate & Institutional Banking** The units in Estonia, Latvia and Lithuania constitute Banking Activities BalticsMarket share information is based on data reported to local central banks.
BANKING ACTIVITIES
Population (millions)
2012
GDP forecast (%)
2013 2012
Lending (DKK billions)
2012 2011
Market share (%)
2012 2011
Deposits (DKK billions)
2012 2011
Market share (%)
2012 2011
Denmark* 5.6 0.7 -0.5 981.4 998.1 28 28 324.9 303.2 29 30
Finland* 5.4 0.5 0.0 165.6 167.4 11 12 121.8 110.4 11 12
Sweden* 9.5 1.2 0.9 206.5 206.9 5 6 88.6 86.5 5 5
Norway* 5.0 3.1 3.3 177.4 172.1 5 5 86.3 83.7 5 5
Northern Ireland 1.8 0.9 -1.0 45.5 53.3 - - 50.8 55.1 - -
Ireland 4.6 1.5 0.8 24.0 63.7 3 3 22.6 37.8 2 3
Estonia** 1.3 3.3 3.0 8.7 10.1 8 10 12.6 12.8 14 14
Latvia** 2.0 3.1 5.0 1.9 2.0 2 2 1.3 1.4 1 1
Lithuania** 3.0 3.5 3.3 8.0 8.4 6 7 6.0 5.4 6 7
Non-core - - - 29.4 - - 0.6 - - -
Other - - - 17.4 16.8 - - 7.2 5.2 - -
Total - - - 1,665.8 1,698.8 - - 722.7 701.5 - -
BA
NK
ING
AC
TIV
ITIE
S

28 DANSKE BANK / ANNUAL REPORT 2012
DANSKE MARKETS AND TREASURY
• SATISFACTORY AND INCREASING TRADING INCOME AT DANSKE MARKETS
• STRONG CUSTOMER ACTIVITY AND BETTER CONDITIONS FOR HEDGING TRANSACTIONS
• HIGH CUSTOMER SATISFACTION
Market conditionsThe year 2012 was yet another challenging period in the capital markets. The central banks’ extraordinary provision of liquidity helped stabilise the markets at the beginning of the year, but the positive sentiment was succeeded by growing uncertainty about the solution to the European debt crisis. With an outlook for a prolonged period of subdued growth, many market players remained tentative.
Financial summaryProfit before tax at Danske Markets and Treasury rose to DKK 4.5 billion from DKK 4.1 billion in 2011.
Expenses rose 16% above the year-earlier level, primarily because of higher performance-based compensation.
DANSKE MARKETS AND TREASURY(DKK millions) 2012 2011
Index12/11
Q42012
Q32012
Q22012
Q12012
Total income 7,456 5,716 130 901 1,566 2,064 2,925
Expenses 3,068 2,652 116 771 723 699 875
Profit before loan impairment charges 4,388 3,064 143 130 843 1,365 2,050
Loan impairment charges -99 -1,033 - -59 -65 52 -27
Profit before tax 4,487 4,097 110 189 908 1,313 2,077
Due from credit institutions and repo loans (end of period) 420,834 330,068 127 420,834 447,176 414,260 448,320
Loans and advances (end of period) 49,339 44,330 111 49,339 48,883 53,679 42,388
Allowance account, total (end of period) 135 2,599 5 135 294 2,702 2,498
Net trading and investment portfolio (end of period) 458,378 423,235 108 458,378 402,330 407,834 407,348
Deposits (end of period) 68,834 97,412 71 68,834 51,654 58,554 85,547
Allocated capital (avg.) 12,675 8,883 143 13,299 12,867 12,737 11,789
Profit before loan impairment charges as % p.a. of allocated capital 34.6 34.5 3.9 26.2 42.9 69.6
Profit before tax as % p.a. of allocated capital (ROE) 35.4 46.1 5.7 28.2 41.2 70.5
Cost/income ratio (%) 41.1 46.4 85.6 46.2 33.9 29.9
EMPLOYEES860
TOTAL INCOMEDKK 7,456 MILLION
PROFIT BEFORE TAXDKK 4,487 MILLION

DANSKE BANK / ANNUAL REPORT 2012 29
DA
NS
KE
MA
RK
ET
S A
ND
TR
EA
SU
RY
Loan impairment charges saw a DKK 0.1 billion net reversal of previously recognised charges.
Danske MarketsProfit before tax at Danske Markets amounted to DKK 5.1 billion, against DKK 3.8 billion in 2011.
Customer-driven trading in fixed-income, derivatives and foreign exchange products was strong throughout the year. Institutional customers in particular were active in switching hedging positions from euros to Nordic currencies. This boosted earnings – especially earnings from derivatives and government and mortgage bonds.
Income from equity trading improved, but was still unsatisfactory.
Customer earnings from Debt Capital Markets were substantially higher in 2012 than in 2011 as Danske Markets arranged a number of bond issues for customers.
Income from trading activities rose above the 2011 level in all the Nordic countries. The activities in Denmark and Norway in particular generated much higher income in 2012.
Net exposure to southern European government bonds was limited throughout the year. Fluctua-tions in the market values of these bonds had limited influence on net trading income.
Group TreasuryGroup Treasury posted a loss before tax of DKK 0.7 billion in 2012, against a profit of DKK 0.3 billion in 2011. The fall in income was caused mainly by higher non-allocated funding costs.
In the second quarter of 2012, Group Treasury realised an extraordinary gain of DKK 0.4 billion through an adjustment of the Group’s pension plans.
A positive value adjustment of DKK 0.7 billion on the available-for-sale bond portfolio was recognised in Other comprehensive income. In 2011, the Group recognised a negative value adjustment of DKK 0.9 billion in shareholders’ equity.
OperationsThroughout 2012, Danske Markets maintained its focus on serving customers by providing liquidity and risk-hedging facilities. In 2012, Danske Markets strengthened its market position and customer satisfaction level.
International research institutes regularly assess Danske Markets’ level of customer satisfaction and market shares. In 2012, the unit’s market shares were high or rising in all product areas and countries.
INCOME – % OF GROUP TOTAL LENDING – % OF GROUP TOTAL
Danske Markets and Treasury
16% 3%

30 DANSKE BANK / ANNUAL REPORT 2012
DANSKE CAPITAL
• PROFIT BEFORE LOAN IMPAIRMENT CHARGES UP 21% • STRONG SALES TO RETAIL AND
INSTITUTIONAL CUSTOMERS• STRONG INVESTMENT RESULTS –
RECORD-HIGH PERFORMANCE FEES OF DKK 426 MILLION
Market conditionsDespite weak economic growth in most countries, equities performed well in 2012. The Danish C20 index rose a full 27%, the MSCI World index was up 12%, and the MSCI Europe index rose 17%. The debt crisis in southern Europe and weak economic growth, particularly in Europe, continued to push down bond yields in northern Europe.
Overall, the Nordic mutual fund market grew 18% in 2012. The trend was driven by increasing securities prices and net mutual fund sales of DKK 210 billion. Of this amount, Danske Capital accounted for 16%. Measured by market value, Danske Capital had a 10.8% share of the Nordic markets.
Financial summaryTotal income at Danske Capital rose 11% to DKK 2.2 billion, up from DKK 2.0 billion a year earlier. Income benefited from higher performance-related fees, which rose from DKK 0.2 billion in 2011 to DKK 0.4 billion in 2012. Non-performance-related income increased just 1%. The main reason for the relatively modest increase was lower value
DANSKE CAPITAL(DKK millions) 2012 2011
Index12/11
Q42012
Q32012
Q22012
Q12012
Net interest income 114 119 96 27 27 30 30
Net fee income 2,057 1,795 115 849 425 405 378
Other income 30 66 45 - 14 12 4
Total income 2,201 1,980 111 876 466 447 412
Expenses 1,130 1,093 103 356 246 264 264
Profit before loan impairment charges 1,071 887 121 520 220 183 148
Loan impairment charges -23 -23 - -31 -4 5 7
Profit before tax 1,094 910 120 551 224 178 141
Loans and advances (end of period) 5,783 6,075 95 5,783 5,785 5,937 6,279
Allowance account, total (end of period) 147 168 88 147 177 181 176
Deposits (end of period) 5,167 5,700 91 5,167 5,069 5,428 5,778
Allocated capital (avg.) 335 311 108 332 341 340 327
Cost/income ratio (%) 51.3 55.2 40.6 52.8 59.1 64.1
Assets under management (DKK billions) 687 606 113 687 666 636 632
PROFIT BEFORE TAXDKK 1,094 MILLION
EMPLOYEES569
MARKET SHARE INTHE NORDIC REGION 10.8%

DANSKE BANK / ANNUAL REPORT 2012 31
INCOME – % OF GROUP TOTAL LENDING – % OF GROUP TOTAL
Danske Capital
5% 0%
DA
NS
KE
CA
PITA
Ladjustments. The proportion of total assets under management invested in equities was 29% in both 2011 and 2012.
Total expenses rose 3% above the level in 2011 as a result of an increase in performance-based remuneration.
At 31 December 2012, assets under management amounted to DKK 687 billion, up DKK 81 billion from the level at 31 December 2011. Net sales to institutional clients and retail banking customers totalled DKK 29 billion. Developments in the financial markets thus generated total market value gains of DKK 52 billion.
Of the net sales of DKK 29 billion, institutional clients accounted for DKK 14 billion and retail banking customers for DKK 15 billion.
In 2012, the mutual fund business posted above-benchmark returns in 77% of its funds. Of the bond-based funds, 88% delivered above-benchmark returns, and for equity-based funds, the figure was 71%. Of balanced products, 80% performed above their benchmarks. Some 50% of Danske Invest funds ranked in the top third of European funds in their categories. Products and initiativesIn the fourth quarter of 2012, Danske Capital introduced Danske Porteføljepleje (Danske Portfolio management) for personal customers, including private banking customers, in Denmark and Sweden. At 31 December 2012, the market value of this new product was DKK 3.2 billion. The rollout will be accelerated in 2013, when the product will be introduced to the Finnish market.
Danske Capital also sold mutual fund products successfully in Sweden and Norway. They accounted for 15% of total net sales in Sweden and 20% in Norway.
Danske Capital’s business with international customers outside the Nordic region continued to show considerable growth. At 31 December 2012, assets under management totalled almost DKK 30 billion, against DKK 19 billion at the beginning of the year.
Market outlookIn 2013, Danske Capital expects to maintain its positions in asset and fund management.
In Denmark, total assets under management will be slightly strained, however, because of the opportunity for capital pension savers to achieve a tax saving by cashing in their capital pensions in 2013. Many customers are expected to take advantage of this opportunity.
ASSETS UNDER MANAGEMENT
(DKK billions) 2012 2011
Share of total (%) 2012 2011
Equities 211 158 31 26
Private equity 15 15 2 2
Bonds 437 416 64 69
Cash 24 17 3 3
Total 687 606 100 100
BREAKDOWN BY TYPE OF INVESTOR
(DKK billions) 2012 2011
Share of total (%) 2012 2011
Life insurers 190 187 28 31
Mutual funds - retail 270 229 39 38
Institutions, incl.mutual funds 227 190 33 31
Total 687 606 100 100
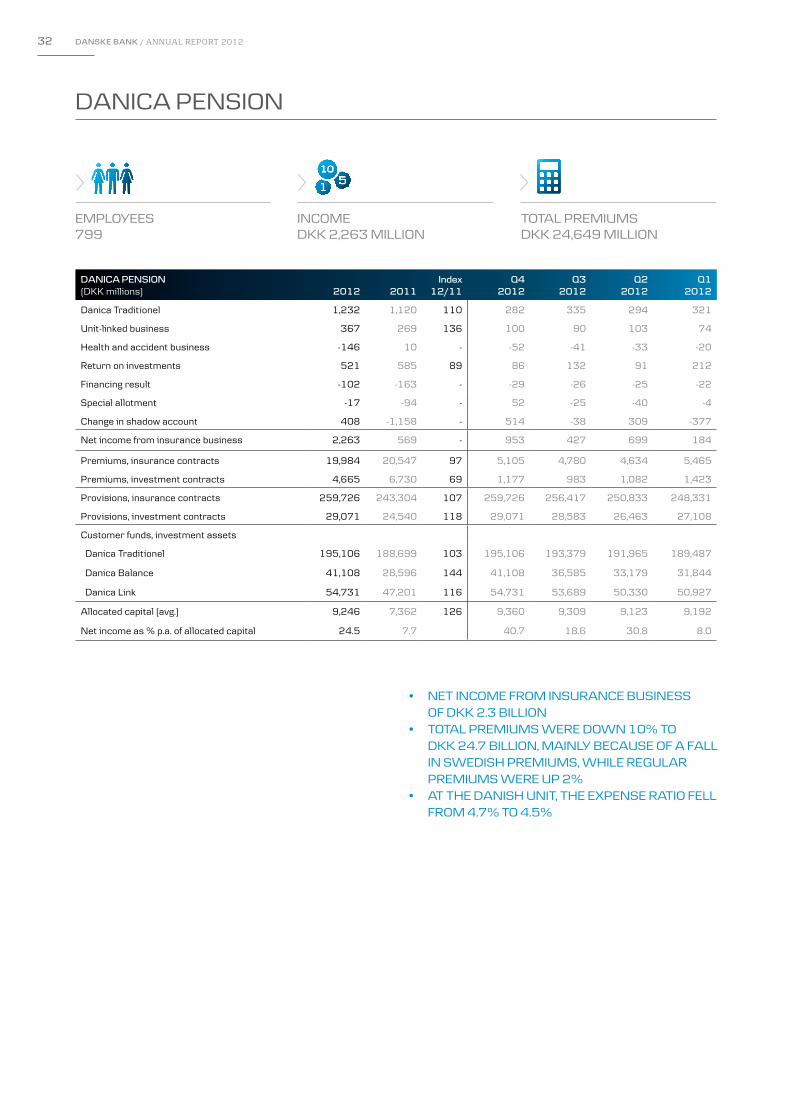
32 DANSKE BANK / ANNUAL REPORT 2012
DANICA PENSION
• NET INCOME FROM INSURANCE BUSINESS OF DKK 2.3 BILLION
• TOTAL PREMIUMS WERE DOWN 10% TO DKK 24.7 BILLION, MAINLY BECAUSE OF A FALL IN SWEDISH PREMIUMS, WHILE REGULAR PREMIUMS WERE UP 2%
• AT THE DANISH UNIT, THE EXPENSE RATIO FELL FROM 4.7% TO 4.5%
DANICA PENSION(DKK millions) 2012 2011
Index12/11
Q42012
Q32012
Q22012
Q12012
Danica Traditionel 1,232 1,120 110 282 335 294 321
Unit-linked business 367 269 136 100 90 103 74
Health and accident business -146 10 - -52 -41 -33 -20
Return on investments 521 585 89 86 132 91 212
Financing result -102 -163 - -29 -26 -25 -22
Special allotment -17 -94 - 52 -25 -40 -4
Change in shadow account 408 -1,158 - 514 -38 309 -377
Net income from insurance business 2,263 569 - 953 427 699 184
Premiums, insurance contracts 19,984 20,547 97 5,105 4,780 4,634 5,465
Premiums, investment contracts 4,665 6,730 69 1,177 983 1,082 1,423
Provisions, insurance contracts 259,726 243,304 107 259,726 256,417 250,833 248,331
Provisions, investment contracts 29,071 24,540 118 29,071 28,583 26,463 27,108
Customer funds, investment assets
Danica Traditionel 195,106 188,699 103 195,106 193,379 191,965 189,487
Danica Balance 41,108 28,596 144 41,108 36,585 33,179 31,844
Danica Link 54,731 47,201 116 54,731 53,689 50,330 50,927
Allocated capital (avg.) 9,246 7,362 126 9,360 9,309 9,123 9,192
Net income as % p.a. of allocated capital 24.5 7.7 40.7 18.6 30.8 8.0
TOTAL PREMIUMS DKK 24,649 MILLION
EMPLOYEES799
INCOMEDKK 2,263 MILLION
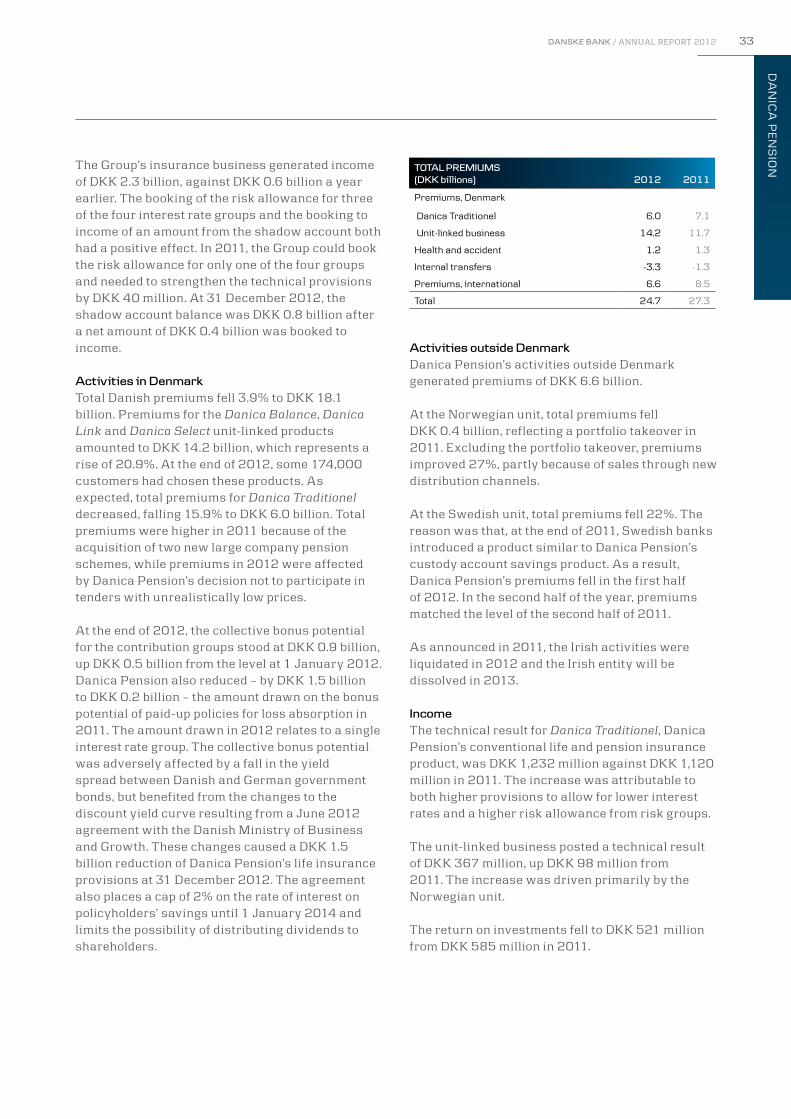
DANSKE BANK / ANNUAL REPORT 2012 33
DA
NIC
A P
EN
SIO
NThe Group’s insurance business generated income of DKK 2.3 billion, against DKK 0.6 billion a year earlier. The booking of the risk allowance for three of the four interest rate groups and the booking to income of an amount from the shadow account both had a positive effect. In 2011, the Group could book the risk allowance for only one of the four groups and needed to strengthen the technical provisions by DKK 40 million. At 31 December 2012, the shadow account balance was DKK 0.8 billion after a net amount of DKK 0.4 billion was booked to income.
Activities in DenmarkTotal Danish premiums fell 3.9% to DKK 18.1 billion. Premiums for the Danica Balance, Danica Link and Danica Select unit-linked products amounted to DKK 14.2 billion, which represents a rise of 20.9%. At the end of 2012, some 174,000 customers had chosen these products. As expected, total premiums for Danica Traditionel decreased, falling 15.9% to DKK 6.0 billion. Total premiums were higher in 2011 because of the acquisition of two new large company pension schemes, while premiums in 2012 were affected by Danica Pension’s decision not to participate in tenders with unrealistically low prices.
At the end of 2012, the collective bonus potential for the contribution groups stood at DKK 0.9 billion, up DKK 0.5 billion from the level at 1 January 2012. Danica Pension also reduced – by DKK 1.5 billion to DKK 0.2 billion – the amount drawn on the bonus potential of paid-up policies for loss absorption in 2011. The amount drawn in 2012 relates to a single interest rate group. The collective bonus potential was adversely affected by a fall in the yield spread between Danish and German government bonds, but benefited from the changes to the discount yield curve resulting from a June 2012 agreement with the Danish Ministry of Business and Growth. These changes caused a DKK 1.5 billion reduction of Danica Pension’s life insurance provisions at 31 December 2012. The agreement also places a cap of 2% on the rate of interest on policyholders’ savings until 1 January 2014 and limits the possibility of distributing dividends to shareholders.
Activities outside DenmarkDanica Pension’s activities outside Denmark generated premiums of DKK 6.6 billion.
At the Norwegian unit, total premiums fell DKK 0.4 billion, reflecting a portfolio takeover in 2011. Excluding the portfolio takeover, premiums improved 27%, partly because of sales through new distribution channels.
At the Swedish unit, total premiums fell 22%. The reason was that, at the end of 2011, Swedish banks introduced a product similar to Danica Pension’s custody account savings product. As a result, Danica Pension’s premiums fell in the first half of 2012. In the second half of the year, premiums matched the level of the second half of 2011.
As announced in 2011, the Irish activities were liquidated in 2012 and the Irish entity will be dissolved in 2013.
IncomeThe technical result for Danica Traditionel, Danica Pension’s conventional life and pension insurance product, was DKK 1,232 million against DKK 1,120 million in 2011. The increase was attributable to both higher provisions to allow for lower interest rates and a higher risk allowance from risk groups.
The unit-linked business posted a technical result of DKK 367 million, up DKK 98 million from 2011. The increase was driven primarily by the Norwegian unit.
The return on investments fell to DKK 521 million from DKK 585 million in 2011.
TOTAL PREMIUMS(DKK billions) 2012 2011
Premiums, Denmark
Danica Traditionel 6.0 7.1
Unit-linked business 14.2 11.7
Health and accident 1.2 1.3
Internal transfers -3.3 -1.3
Premiums, international 6.6 8.5
Total 24.7 27.3

34 DANSKE BANK / ANNUAL REPORT 2012
customer funds held in capital pension schemes totalled about DKK 50 billion at 31 December 2012. A large number of capital pension savers are expected to take advantage of this opportunity.
The 2013 result will depend greatly on developments in the financial markets and the possibility of booking the risk allowance and any of the balance on the shadow account to income.
For Danica to book the full risk allowance to income in 2013, assuming unchanged interest rate levels, the interest rate group with new schemes must have an investment return of 2-3%, while the other interest rate groups must have returns of 4-5%.
Investment returnDeclining interest rates lifted the return on bonds but also led to an increase in technical provisions of DKK 7.6 billion.
The return on Danica Balance, Danica Link and Danica Select investments in 2012 was DKK 6.1 billion, representing an average rate of return of 11.5%, against -2.5% in 2011. The average annual return over the past three years was 7.0% for Danica Balance and 7.1% for Danica Link.
The return on customer funds in Danica Traditionel was 9.2% in 2012, against 6.8% in 2011. Including changes in technical provisions, the return was 5.9%.
For Danica Traditionel, equity, credit bond and property exposures totalled 35.3%.
CUSTOMER FUNDS – DANICA TRADITIONEL
Holdings and returnsShare (%)
2012 2011Return (%)
2012 2011
Real property 10 10 2.8 6.2
Bonds etc. 81 84 10.0 8.4
Equities 9 6 14.8 -5.4
Total 100 100 9.2 6.8
Market outlook In 2013, Danica Pension expects to maintain its position as one of the leading Danish life insurance and pensions providers.
A Danish tax reform measure that took effect on 1 January 2013 entails a phase-out of capital pension schemes and the introduction of a new pension savings product. In 2013, pension savers can cash in their capital pensions and pay tax at a rate of 37.3% instead of the normal 40%. Danica Pension

DANSKE BANK / ANNUAL REPORT 2012 35
OT
HE
R A
CT
IVIT
IES
Other income amounted to DKK 0.1 billion, against DKK 0.3 billion a year earlier. In 2011, income benefited in particular from a refund of excess VAT paid in previous years.
Expenses amounted to DKK 1.3 billion, against DKK 1.4 billion in 2011, and included a write-down of DKK 0.5 billion related to the right to use the Sampo Bank brand name.
Other Activities posted a loss before tax of DKK 1.3 billion, against a loss before tax of DKK 0.9 billion in 2011.
The elimination of returns on own shares led to an expense of DKK 83 million in 2012, against income of DKK 274 million in 2011.
PROFIT BEFORE TAX(DKK millions)
Real property -83 266 - -248 101 -1 65
Own shares -83 274 - 26 -77 22 -54
Other, including Group support functions -1,107 -1,421 - -164 -237 -42 -664
Total Other Activities -1,273 -881 - -386 -213 -21 -653
OTHER ACTIVITIES
OTHER ACTIVITIES(DKK millions) 2012 2011
Index12/11
Q42012
Q32012
Q22012
Q12012
Net interest income 50 111 45 11 4 29 6
Net fee income -31 -30 - -13 -2 -13 -3
Net trading income -81 158 - 26 -78 25 -54
Other income 107 321 33 13 50 26 18
Total income 45 560 8 37 -26 67 -33
Expenses 1,318 1,441 91 423 187 88 620
Profit before loan impairment charges -1,273 -881 - -386 -213 -21 -653
Loan impairment charges - - - - - - -
Profit before tax -1,273 -881 - -386 -213 -21 -653
PROFIT BEFORE TAXDKK -1,273 MILLION
EMPLOYEES5,322


In today’s global economy there are no traditional borders. All that matters is the ability to reach out and grasp opportunities wherever they exist. That’s why we’re introducing new standards for how we support and service our customers who are active across borders. We have established a new, even more customer-oriented organisation that is now operating under one name: Danske Bank. This new structure means we can be a lot more agile and react much faster to international market demands. And that, of course, will be of huge benefit to our customers.
New Normal

38 DANSKE BANK / ANNUAL REPORT 2012
The Group’s capital management policies and practices support its business strategy and ensure that it is sufficiently capitalised to withstand severe macroeconomic downturns.
The Group has set prudent capital targets: a total capital ratio of at least 17% and a core tier 1 capital ratio of at least 13%.
The Group’s capital considerations are based on an assessment of the capital requirements under the current capital adequacy rules and the rules on the transition from previous regulations as well as on an assessment of the effects of future regulations, including the Capital Requirements Directive (CRD IV) and requirements for systemically important financial institutions (SIFIs). If the final regulatory requirements differ from the Group’s expectations, this may result in adjustments to the capital targets. The Group also considers criteria such as expected growth and earnings, dividend policy and stress test results.
At the end of 2012, the total capital ratio was 21.3%, and the core tier 1 capital ratio was 14.5%.
CAPITAL BASE AND RISK-WEIGHTED ASSETS
(DKK billions) 2012 2011
Core tier 1 capital 119 107
Hybrid capital, less statutory deductions 36 38
Tier 2 capital, less statutory deductions 19 17
Capital base 174 162
Risk-weighted assets 819 906
At the end of 2012, the Group’s solvency need amounted to DKK 90.3 billion, or 11.0% of risk-weighted assets (RWA). The capital base thus included a capital buffer of DKK 84.0 billion at 31 December 2012.
The decline in RWA of DKK 87 billion from 2011 was caused primarily by the disposal of conduit loans and other portfolio changes. In 2012, the Group took a number of initiatives to improve its capital position. These initiatives also contributed to a reduction of risk-weighted assets.
In October 2012, Danske Bank announced the results of the European Banking Authority’s (EBA)
update of the capital test conducted in December 2011. Danske Bank was one of 61 European banks tested. The Group performed well on the test, demonstrating a capital level substantially above the required level. The results reconfirmed that Danske Bank has a strong capital base and is among the best-capitalised banks in Europe.
The Group aims to improve its credit ratings, which are important for its access to liquidity and the pricing of its long-term funding. Rating targets are therefore included in the capital considerations.
In the second half of 2012, the Group launched initiatives to improve its ratings and prepare its capital structure for the coming European capital requirements for banks.
In September 2012, the Group issued subordinated debt for a total of DKK 5.7 billion that it expects will comply with the requirements for tier 2 capital under CRD IV. The loan has a maturity of 25 years and may be prepaid at par after five years. The issue accounted for 0.7 of a percentage point of the Group’s total capital ratio at the end of 2012.
In October 2012, Danske Bank strengthened its core tier 1 capital by issuing shares for an amount of DKK 7.1 billion through an accelerated book-building process to hasten rating improvements. At the end of 2012, the share issue had lifted the Group’s core tier 1 capital ratio by 0.9 of a percentage point.
Ratings In 2012, Fitch Ratings maintained Danske Bank’s A/F1 rating (negative outlook).
A general downgrade of many European and Danish banks by Moody’s in the first half of 2012 also affected Danske Bank. Moody’s lowered Danske Bank’s long-term rating two notches from A2 to Baa1 and its short-term rating one notch from P-1 to P-2. The long-term rating is on stable outlook.
Moody’s ratings in particular are affected by the fact that Denmark has not yet adopted regulations for SIFIs.
CAPITAL AND LIQUIDITY MANAGEMENT

DANSKE BANK / ANNUAL REPORT 2012 39
Funding and liquidity In the first half of 2012, the financial markets were under pressure because of the ongoing European sovereign debt crisis and continuing attention on the issue of liquidity in the international banking system. This occasionally caused tensions in the funding markets.
The strong involvement of the ECB and other central banks in handling the sovereign debt crisis helped improve market sentiment in the second half of 2012. In July 2012, the ECB said that it undoubtedly had sufficient means to handle the crisis, and in September, it introduced a sovereign debt purchase programme. The ECB had previously intervened through three-year Longer-Term Refinancing Operation (LTRO) programmes in December 2011 and February 2012. At the end of 2012, the Group had drawn a total of about DKK 40 billion on the LTRO facilities.
The Danish central bank followed suit by introducing a temporary opportunity for Danish banks to raise loans with a maturity of three years. The Group borrowed DKK 15 billion at an auction in March 2012 and DKK 20 billion at an auction in September 2012.
These initiatives made it easier for European banks, including Danske Bank Group, to obtain long-term financing. During the second half of 2012, spreads tightened and the funding markets eased even more.
Standard & Poor’s (S&P) lowered Danske Bank’s long-term rating to A- and its short-term rating to A-2. The long-term rating is on positive outlook.
The Group’s current ratings are not satisfactory. The initiatives launched to improve earnings and other initiatives are expected to improve the Group’s ratings.
In August 2012, Danske Bank terminated its collaboration with Moody’s on the rating of covered bonds because it is standard practice for covered bonds to have only one or two ratings and there are no advantages for investors of maintaining ratings from all three agencies. Danske Bank’s covered bonds are rated by S&P and Fitch Ratings.
Mortgage bonds and mortgage-covered bonds issued by Realkredit Danmark are rated AAA by S&P (stable outlook).
In 2012, Realkredit Danmark began collaboration with Fitch Ratings. Bonds issued from capital centre S are rated AAA, while bonds issued from capital centre T are rated AA+. Both ratings are on stable outlook.
ICAAPThe Group’s capital management policies and practices are based on an internal capital adequacy assessment process (ICAAP). In this process, the Group regularly identifies its risks and determines its solvency need.
An important part of the process is assessing whether the Group’s solvency need allows for all material risks that the Group faces. The Group has set up a process to quantify any add-ons to the solvency need on the basis of input from internal experts. Capital add-ons are additive, although they may overlap. The process thus represents a conservative assessment of the solvency need.
The calculation of the solvency need for Danske Bank Group and Danske Bank A/S is described in more detail in Risk Management 2012, which is available at www.danskebank.com/ir. Risk Management 2012 also provides details on the management of credit risk, market risk and liquidity risk.
DKK 84.1 billion
Solvency need ratio
(DKK billions)
SOLVENCY NEED AND CAPITAL BASE, END-2012
0
40
80
120
160
200
Capital baseCapital bufferTransitional rules
Pillar I+
9.9%11.0%
21.3%10.3%
CA
PITA
L A
ND
LIQ
UID
ITY
M
AN
AG
EM
EN
T

40 DANSKE BANK / ANNUAL REPORT 2012
Stress tests show that the Group’s liquidity buffer is sufficient to close any liquidity gap if all capital markets are closed and refinancing is impossible for a period of at least 12 months.
The Supervisory DiamondThe Danish FSA has identified a number of specific risk indicators for banks and introduced threshold values (called the Supervisory Diamond) that all Danish banks had to comply with by the end of 2012.
Danske Bank A/S complied with all the requirements.
SUPERVISORY DIAMOND (%)
Threshold value 2012 2011
Sum of large exposures <125 12 33
Lending growth <20 -4 -1
Real property exposure <25 12 13
Funding ratio <100 68 71
Surplus liquidity in relation to statutory liquidity requirements >50 167 107
The Group continued to issue long-term debt throughout the year in order to maintain and build up its liquidity reserves and redeemed its remaining state-guaranteed bond issues as planned at the end of July 2012.
At 31 December 2012, the Group’s total amount of outstanding long-term funding was DKK 355 billion, against DKK 378 billion at the end of 2011, excluding senior debt issued by Realkredit Danmark. The funding consisted of the following:
DANSKE BANK GROUP EXCL. REALKREDIT DANMARK(DKK billions) 2012 2011
Covered bonds 167 150
Senior unsecured debt 120 162
Subordinated debt 68 66
Total 355 378
As a result of Danske Bank’s rating downgrade and the nervous market sentiment, Danske Bank made an agreement with the Danish Financial Supervisory Authority to accelerate compliance with the expected EU rules on the Liquidity Coverage Ratio (LCR) in 2012 and to take other measures. From 2013, Danske Bank will ensure that it has an LCR of at least 110%.
It is, however, important to emphasise that Danske Bank’s liquidity level remained strong throughout the year and vastly exceeded regulatory requirements.
At the end of 2012, the Group’s LCR was 121% and the Group therefore achieved compliance with the expected requirement. The Group met the requirement by lengthening its funding profile, changing the composition of its liquidity buffer and counting holdings of covered bonds and Danish mortgage bonds, including own issued bonds. The Group will include these holdings in the ratio until the EBA’s final guidelines are announced before implementation in 2015.
Moreover, the Group will continue to ensure that it has a prudent ratio between lending and long-term funding with a solid margin to the threshold laid down in the Supervisory Diamond.
31 December 2008 31 December 2009
31 December 2010 31 December 2011
31 December 2012
12-MONTH LIQUIDITY (DKK billions)
-100
0
100
200
300
400
121110987654321Months

DANSKE BANK / ANNUAL REPORT 2012 41
annual steps to reach 100% on 1 January 2019. The revisions also include an expansion of the pool of level 2 liquid assets that can be counted in the liquidity buffer and a reduction of the weights assigned to certain liquidity outflows.
In the context of CRD IV, it is unclear how the EU authorities will choose to incorporate or modify the Basel Committee’s revisions to the LCR. The revisions are therefore not incorporated in the Group’s reported LCR.
If the Basel Committee’s revisions are to be incorporated in CRD IV and if CRD IV still enables the Group to classify most of its holdings of covered bonds, including Danish mortgage bonds, as level 1 liquid assets, these revisions are expected to have a positive effect on the Group’s LCR.
As part of the political agreement on Bank Package 4 of September 2011, a committee has been set up to analyse, on the basis of future EU regulations, the criteria that a bank must meet in order to be considered a Danish SIFI.
The Group’s position is that any requirements placed upon SIFIs in Denmark must be based on a set of clear international rules in order to avoid competitive distortions because of local differences in the treatment of SIFIs.
RegulationsThe Group supports measures that strengthen the resilience of the financial sector while ensuring a climate that enables the sector to support economic growth.
The revised EU Capital Requirements Directive (CRD IV), which will implement the Basel III rules, is not yet available in its final form. Protracted political negotiations have led to a deviation from the original plan of implementing the rules in early 2013.
On the basis of a provisional assessment, the Group estimates that the CRD IV rules will reduce its current core tier 1 capital ratio of 14.5% by about 2.0 percentage points when phased in fully in 2018.
The Group estimates that 1.4 percentage points of the reduction will derive from deductions from core tier 1 capital, mainly an expected deduction for Danica Pension as well as for net pension assets. The deductions, which are expected to be phased in gradually, will be set at 20% in 2014 and rise in equal annual steps to reach 100% in 2018.
According to the Group’s estimates, the remaining 0.6 of a percentage point will come from a rise in RWA because of a new capital requirement for derivatives exposures in the form of the so-called Credit Valuation Adjustment (CVA) capital charge and because of RWA increases for credit risk relating to exposures to financial customers.
CRD IV will have an immediate effect on the Group’s RWA when it takes effect. However, the RWA effect from Danica Pension is expected to be phased in gradually at the same pace as the capital deductions for Danica Pension.
In January 2013, the Basel Committee issued revisions to its LCR guidelines. The revisions include a phasing-in of the minimum requirement. It will be set at 60% in 2015 and rise in equal
CORE TIER 1 CAPITAL RATIO, ADJUSTED FOR CRD IV
0
3
6
9
12
15
Core tier 1 capital ratio
Deductionfor Danica
Deductions,other
RWAincrease, CVA riskcharge
RWAincrease,
other
CET1 ratio(CRD IV,
fully loaded)
(%)
14.5
12.51.0
0.4 0.2 0.4
CA
PITA
L A
ND
LIQ
UID
ITY
M
AN
AG
EM
EN
T

42 DANSKE BANK / ANNUAL REPORT 2012
DANSKE BANK SHARES (DKK) 2012 2011
Share capital (millions) 10,086 9,317
Share price (end of year) 95.7 73.0
Total market capitalisation (end of year) (billions) 97 68
Earnings per share 5.1 1.9
Dividend per share - -
Book value per share 137.9 135.7
Share price/book value per share 0.7 0.5
Share ratios for 2011 have been divided by an adjustment factor to reflect the share capital increase in April 2011.
At the end of 2012, 29 equity analysts had issued research reports on Danske Bank.
The average daily trading volume of Danske Bank shares was DKK 133 million, against DKK 227 million in 2011. The Danske Bank share was one of the most actively traded shares in the OMXC20 index.
Dividend policyDanske Bank Group’s overall financial objective is to provide shareholders with a competitive return through share price appreciation and dividend payments.
Since 1 October 2010, and for as long as the Danish state holds hybrid capital in Danske Bank, the Group may distribute dividends only if the dividends can be paid in full out of the net profit. The loan agreement with the Danish state also
The Investor Relations department is responsible for the Group’s communications with IR stake-holders, including equity and debt investors, equity and debt analysts, and rating agencies. In accordance with the Group’s overall policy of openness and transparency, Investor Relations ensures that IR stakeholders receive correct and adequate information through regular contact and the www.danskebank.com/ir site. In 2012, Danske Bank was ranked the top IR Website in Europe by IR Global Rankings.
To support stakeholder relations, Investor Relations holds roadshows four times a year upon the release of the Group’s financial reports.
Investor Relations and senior management also build relations with analysts, shareholders and potential investors by presenting and discussing current issues of relevance to the Group at seminars and conferences in and outside Denmark.
In November 2012, Danske Bank held a Capital Markets Day in London at which the Executive Board presented the Group’s new strategy.
In 2012, investor events were held in the Nordic countries, other European countries, the US, Canada, Hong Kong and Singapore and attracted about 700 investors.
Investor Relations is also responsible for regular contact with rating agencies through meetings and the presentation of data and information about essential matters, as necessary.
Danske Bank sharesDanske Bank shares are listed on NASDAQ OMX Copenhagen and are included in a number of Danish and international equity indices, for example the OMX Copenhagen 20 Index (OMXC20). At the end of 2012, Danske Bank shares had an index weighting of about 8.1%.
The share price rose from DKK 73.0 at 31 December 2011 to DKK 95.7 at 31 December 2012, an increase of 31%. In comparison, the OMXC20 index gained 27%, while the MSCI Europe Banks Index rose 25%.
INVESTOR RELATIONS
DANSKE BANK SHARESIndex 2008 = 100
Danske BankMSCI Europe Banks
0
50
100
150
20122011201020092008

DANSKE BANK / ANNUAL REPORT 2012 43
INV
ES
TOR
RE
LA
TIO
NS
• The A.P. Møller and Chastine Mc-Kinney Møller Foundation and companies of the A.P. Moller - Maersk Group, Copenhagen, hold 22.84% of the share capital.
• Realdania, Copenhagen, holds 10.07% of the share capital.
• Cevian Capital II GP Limited, Jersey, holds 5.06% of the share capital.
Each share entitles the holder to one vote, and all shares carry the same rights.
At the end of 2012, Danske Bank itself held about 0.7% of the share capital. These shares are held to compensate staff in the form of conditional shares and share options granted under share programmes in previous years and for investments on behalf of policyholders and under pooled schemes.
stipulates an increase in the interest rate if annual dividend payments exceed DKK 5.5 billion.
With due consideration to the Group’s targets of a core tier 1 capital ratio of at least 13% and an increase in ratings by at least one notch, the Board of Directors wishes to distribute about 40% of the net profit for the year. Until we meet these targets, the Board is recommending that no dividend be paid for 2012.
ShareholdersAt the end of 2012, Danske Bank had about 327,000 shareholders. The 20 largest investors together owned about 58% of the share capital.
Danske Bank estimates that shareholders outside Denmark, mainly in the UK and the US, hold almost 42% of its share capital.
According to the Danish Companies Act, shareholders in a company must notify the company if the voting rights of their shares exceed 5% of the voting rights of the company’s share capital, or if the nominal value of their shares exceeds 5% of the share capital. Shareholders must disclose changes in shareholdings if they exceed or fall below specified percentage thresholds. Three shareholder groups have notified Danske Bank that they hold more than 5% of the share capital:
DANSKE BANK’S SHAREHOLDERS 2012
Rest ofDenmark, 25%
Realdania, 10%
A.P. Møller Mærsk, 23%
USA & Canada, 9%
UK, 15%
Cevian Capital, 5%
Other, 13%

44 DANSKE BANK / ANNUAL REPORT 2012

DANSKE BANK / ANNUAL REPORT 2012 45
New Normal
In a complex f inancial world,
one of the biggest concerns is
the coming generations’ grasp
of personal f inances. Because
going forward, this will have
consequences, not just for their
own financial situation, but also
for society at large. For these
reasons, we’re introducing new
standards for what role a bank
should play in the education
of our children. Find out more
about our online programmes
available to all children, young
people, their parents and
teachers at newstandards.dk

46 DANSKE BANK / ANNUAL REPORT 2012
ORGANISATION AND MANAGEMENT
In recent years, the Board of Directors has evaluated its performance each year on the basis of a number of criteria. In 2012, the evaluation was performed in collaboration with an external consulting firm. The evaluation covered both the overall performance of the Board and each board member’s contribution. First, each board member answered an extensive questionnaire. On the basis of the answers, the consulting firm then conducted interviews with the individual board members. The outcome of the evaluation was presented and discussed by the Board of Directors in December 2012. The chairman of the Board of Directors subsequently gave feedback to the individual board members on their contributions.
The outcome of the evaluation was generally positive. It is the opinion of the Board of Directors that the change in management in February 2012 – when Eivind Kolding became the new chief executive officer and Ole Andersen took over as chairman of the Board of Directors – has been successful. Furthermore, the Board of Directors is working more and more efficiently as a unit and is, to a higher degree, contributing proactively to value creation. The evaluation also revealed potential for improvement in a number of areas such as the utilisation of individual areas of expertise, follow-up on strategy implementation and succession planning. Several initiatives have been planned for the purpose of realising this potential.
Changes to the Board of DirectorsAt Danske Bank’s annual general meeting on 27 March 2012, the members elected by the general meeting were re-elected, except for Peter Højland, who had decided not to stand for re-election, and Claus Vastrup, who resigned from the Board in accordance with the age limit for board members fixed by the Board. Urban Bäckström, Jørn P. Jensen and Trond Ø. Westlie were elected to the Board.
Executive BoardThe Executive Board consists of Eivind Kolding, Chief Executive Officer; Tonny Thierry Andersen, head of Personal Banking; Lars Mørch, head of Business Banking; Thomas F. Borgen, head of Corporates & Institutions; Henrik Ramlau-Hansen, head of Group Finance & Legal; and Robert Endersby, head of Group Risk Management.
On 15 February 2012, Eivind Kolding became the new chief executive officer after Peter Straarup
General meetingIn 2012, Danske Bank held its annual general meeting on 27 March.
The next annual general meeting will be held on 18 March 2013.
Danske Bank’s Articles of Association, available at www.danskebank.com/articles-of-association, contain information about the notice calling the general meeting, shareholders’ rights to table proposals and to have special business added to the agenda, and admission and voting rights.
There is only one class of shares and no limitations on holdings, voting rights or other opportunities for shareholders to influence decisions.
Resolutions to amend the Articles of Association that, under Danish law, cannot be made by the Board of Directors are passed only if adopted by at least two thirds of the votes cast and by at least two thirds of the share capital represented at the general meeting and entitled to vote.
A resolution to wind up Danske Bank by merger or voluntary liquidation can be passed only if adopted by at least three quarters of the votes cast and by at least three quarters of the share capital represented at the general meeting and entitled to vote.
Board of DirectorsThe Board consists of 13 members; eight are elected by the general meeting, and five are staff representatives.
Board members elected by the general meeting stand for election every year. Pursuant to Danish law, staff representatives serve on the Board for a four-year term and are elected separately by the Group’s employees in Denmark. The five current staff representatives were elected in March 2010, and their term of office will therefore expire in 2014.
Board candidates are nominated by shareholders or the Board of Directors and are elected by the general meeting, the Group’s highest decision-making authority. Danske Bank has set a retirement age for board members: they must retire at the first annual general meeting after they attain the age of 70.
In 2012, the Board held 19 meetings, including eight teleconferences.

DANSKE BANK / ANNUAL REPORT 2012 47
retired. Lars Mørch and Robert Endersby joined the Executive Board on 1 June 2012 and 1 October 2012, respectively. Georg Schubiger and Per Skovhus, members of the Executive Board, resigned from their positions on 1 June 2012 and 15 June 2012, respectively.
Corporate governance recommendationsCorporate governance recommendations issued by the Danish Committee on Corporate Governance can be found at www.corporategovernance.dk. All companies with shares admitted for trading on NASDAQ OMX Copenhagen A/S must comply with the recommendations or explain why they do not. Danske Bank complies with all the recommendations of the Danish Committee on Corporate Governance, with the exception that two members of the Board of Directors were not able to attend the general meeting in 2012.
The Group’s statutory corporate governance report in accordance with section 107 (b) of the Danish Financial Statements Act is available at www.danskebank.com/CGrapport. The report includes an explanation of the Group’s status on all the recommendations.
The Group strives to maintain diversity and increase the number of women in management positions. More details about the Group’s efforts can be found at www.danskebank.com/womeninmanagement.
Management remuneration and remuneration policyThe Board of Directors has adopted a remuneration policy that was approved by the general meeting most recently in March 2012. The principles of the remuneration policy reflect the Group’s objectives of good corporate governance, and the Board of Directors is responsible for submitting amended versions of the policy to the general meeting for approval.
Members of the Board of Directors receive a fixed fee. They are not covered by incentive programmes and do not receive performance-based compensation. The remuneration of the Board of Directors is subject to the approval of the general meeting. The Board of Directors determines the Executive Board’s remuneration, which consists of a fixed salary, various types of performance-based compensation and pension contributions.
The rules for the remuneration of the Executive Board and material risk takers entail limits on the size of performance-based compensation and partially deferred payment of such remuneration. Recipients may lose part or all of their deferred remuneration, depending on future results. In accordance with international and Danish recommendations, staff members in control functions do not receive performance-based compensation.
Remuneration Report 2012 is available at www.danskebank.com/remuneration. This report provides more details about the principles for remuneration of staff. Note 8 of the consolidated financial statements provides remuneration and salary details for the individual members of the Board of Directors and the Executive Board.
Internal controlsInformation about internal control and risk manage-ment systems related to the financial reporting is available at www.danskebank.com/cgreport.
Corporate responsibilityCorporate responsibility remains an important part of Danske Bank Group’s strategy. The Group wants to set new standards for social responsibility. This applies to the areas of credit granting, investing, the environment and climate, responsible sourcing, and the Group’s contribution to financial stability in society and to the economy in general. The Group considers responsible corporate governance a precondition for long-term value creation. In 2012, the Group merged its policies on corporate responsibility, the environment and responsible investing into a single Responsibility Policy.
The Group’s CR report (the statutory report for corporate responsibility in accordance with section 99 (a) of the Danish Financial Statements Act) is available at www.danskebank.com/crreport and is published at the same time as the Group’s annual report.
OR
GA
NIS
AT
ION
A
ND
MA
NA
GE
ME
NT

48 DANSKE BANK / ANNUAL REPORT 2012
FINANCIAL STATEMENTS 50 Income statement 51 Statement of comprehensive income 52 Balance sheet 53 Statement of capital 56 Cash flow statement 57 Notes 57 1 Significant accounting estimates 61 2 Business model and
business segmentation 65 3 Banking Activities 67 4 Net interest and net trading income 68 5 Fee income and fee expenses 68 6 Other income 69 7 Insurance contracts 70 8 Staff costs and
administrative expenses 75 9 Audit fees 75 10 Amortisation, depreciation
and impairment charges 75 11 Loan impairment charges 76 12 Tax 78 13 Cash in hand etc. 78 14 Due from credit institutions
and central banks
78 15 Trading portfolio 81 16 Investment securities 81 17 Loans and advances at
amortised cost 82 18 Loans at fair value and bonds issued
by Realkredit Danmark 83 19 Assets under pooled schemes and
unit-linked investment contracts 84 20 Assets and liabilities under insurance
contracts 85 21 Holdings in associates 87 22 Intangible assets 90 23 Investment property 91 24 Tangible assets
92 25 Other assets 92 26 Due to credit institutions
and central banks 92 27 Deposits 93 28 Deferred tax 94 29 Other liabilities 95 30 Other issued bonds 96 31 Subordinated debt 98 32 Expected due dates 99 33 Contractual due dates 100 34 Pension plans
FINANCIAL STATEMENTS – DANSKE BANK GROUP

DANSKE BANK / ANNUAL REPORT 2012 49
102 35 Risk-weighted assets 103 36 Contingent liabilities 103 37 Transferred financial assets 104 38 Assets provided as collateral 105 39 Leasing 106 40 Related parties 107 41 Danske Bank shares held by the Board of Directors and the Executive Board 108 42 Fair value information 113 43 Group holdings and undertakings 114 44 New business segments 116 45 Significant accounting policies 128 Definitions of key financial ratios 129 Risk management 129 Risk exposure 129 Capital base 130 Credit risk 149 Market risk 152 Liquidity risk 155 Insurance risk 159 Pension risk 160 Highlights, ratios and key figures
161 Financial statements of the Parent Company, Danske Bank A/S
STATEMENT AND REPORTS 182 Statement by the management 183 Auditors’ reports
MANAGEMENT AND DIRECTORSHIPS
185 Board of Directors 188 Executive Board

INCOME STATEMENT – DANSKE BANK GROUP
Note (DKK millions) 2012 2011
DANSKE BANK ANNUAL REPORT 2012 2
4 Interest income 77,988 80,819 4 Interest expense 42,985 47,478 Net interest income 35,003 33,341 5 Fee income 12,168 11,760 5 Fee expenses 3,935 4,034 4 Net trading income 12,735 -3,326 6 Other income 4,451 5,469 7 Net premiums 19,858 20,475 7 Net insurance benefits 31,089 18,705 Income from associates 166 125 Profit on sale of associates and group undertakings 6 16 8 Staff costs and administrative expenses 24,574 24,280 10 Amortisation, depreciation and impairment charges 3,692 3,451 Profit before loan impairment charges 21,097 17,390 11 Loan impairment charges 12,529 13,185 Profit before tax 8,568 4,205 12 Tax 3,819 2,482
Net profit for the year 4,749 1,723
Portion attributable to
shareholders of Danske Bank A/S (the Parent Company) 4,745 1,712 non-controlling interests 4 11
Net profit for the year 4,749 1,723
Earnings per share (DKK) 5.1 1.9 Diluted earnings per share (DKK) 5.1 1.9 Proposed dividend per share (DKK) - -
Earnings per share and diluted earnings per share for 2011 have been divided by an adjustment factor to reflect the share capital in-
crease in April 2011.
50 DANSKE BANK / GROUP 2012
INCOME STATEMENT – DANSKE BANK GROUP
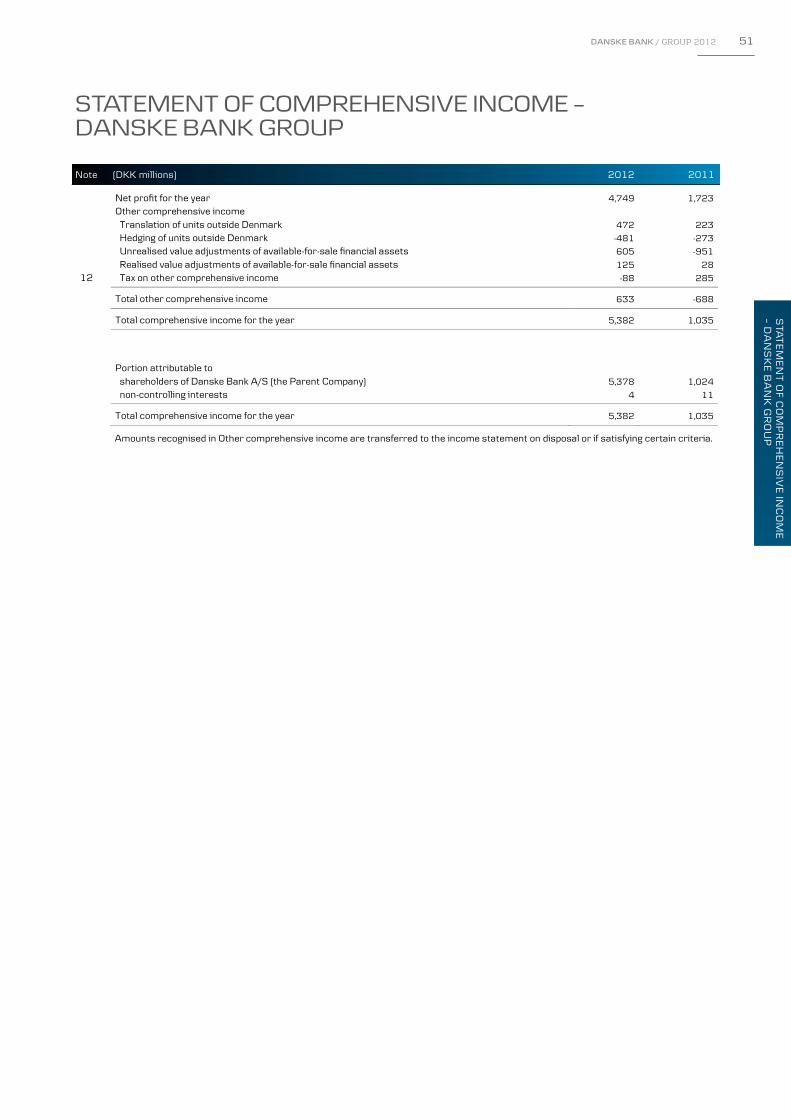
INCOME STATEMENT – DANSKE BANK GROUP
Note (DKK millions) 2012 2011
DANSKE BANK ANNUAL REPORT 2012 2
4 Interest income 77,988 80,819 4 Interest expense 42,985 47,478 Net interest income 35,003 33,341 5 Fee income 12,168 11,760 5 Fee expenses 3,935 4,034 4 Net trading income 12,735 -3,326 6 Other income 4,451 5,469 7 Net premiums 19,858 20,475 7 Net insurance benefits 31,089 18,705 Income from associates 166 125 Profit on sale of associates and group undertakings 6 16 8 Staff costs and administrative expenses 24,574 24,280 10 Amortisation, depreciation and impairment charges 3,692 3,451 Profit before loan impairment charges 21,097 17,390 11 Loan impairment charges 12,529 13,185 Profit before tax 8,568 4,205 12 Tax 3,819 2,482
Net profit for the year 4,749 1,723
Portion attributable to
shareholders of Danske Bank A/S (the Parent Company) 4,745 1,712 non-controlling interests 4 11
Net profit for the year 4,749 1,723
Earnings per share (DKK) 5.1 1.9 Diluted earnings per share (DKK) 5.1 1.9 Proposed dividend per share (DKK) - -
Earnings per share and diluted earnings per share for 2011 have been divided by an adjustment factor to reflect the share capital in-
crease in April 2011.
STATEMENT OF COMPREHENSIVE INCOME – DANSKE BANK GROUP
Note (DKK millions) 2012 2011
DANSKE BANK ANNUAL REPORT 2012 3
Net profit for the year 4,749 1,723
Other comprehensive income
Translation of units outside Denmark 472 223
Hedging of units outside Denmark -481 -273
Unrealised value adjustments of available-for-sale financial assets 605 -951
Realised value adjustments of available-for-sale financial assets 125 28
12 Tax on other comprehensive income -88 285
Total other comprehensive income 633 -688
Total comprehensive income for the year 5,382 1,035
Portion attributable to
shareholders of Danske Bank A/S (the Parent Company) 5,378 1,024
non-controlling interests 4 11
Total comprehensive income for the year 5,382 1,035
Amounts recognised in Other comprehensive income are transferred to the income statement on disposal or if satisfying certain criteria.
DANSKE BANK / GROUP 2012 51
STA
TE
ME
NT
OF
CO
MP
RE
HE
NS
IVE
INC
OM
E
– DA
NS
KE
BA
NK
GR
OU
P
STATEMENT OF COMPREHENSIVE INCOME – DANSKE BANK GROUP

BALANCE SHEET – DANSKE BANK GROUP
Note (DKK millions) 2012 2011
DANSKE BANK ANNUAL REPORT 2012 4
ASSETS
13 Cash in hand and demand deposits with central banks 97,267 28,617
14 Due from credit institutions and central banks 200,646 180,870
15 Trading portfolio assets 812,927 909,755
16 Investment securities 107,724 109,264
17 Loans and advances at amortised cost 1,161,816 1,126,482
18 Loans at fair value 732,762 720,741
19 Assets under pooled schemes and unit-linked investment contracts 70,625 61,888
20 Assets under insurance contracts 241,343 230,668
21 Holdings in associates 1,118 989
22 Intangible assets 21,181 22,233
23 Investment property 4,131 4,624
24 Tangible assets 6,544 7,267
Current tax assets 147 580
28 Deferred tax assets 1,418 1,791
25 Other assets 25,532 18,634
Total assets 3,485,181 3,424,403
LIABILITIES
26 Due to credit institutions and central banks 459,932 393,388
15 Trading portfolio liabilities 531,860 697,913
27 Deposits 929,092 848,994
18 Bonds issued by Realkredit Danmark 614,325 557,699
19 Deposits under pooled schemes and unit-linked investment contracts 78,741 69,211
20 Liabilities under insurance contracts 266,938 248,966
30 Other issued bonds 340,005 366,920
Current tax liabilities 575 423
28 Deferred tax liabilities 7,585 6,278
29 Other liabilities 50,109 41,428
31 Subordinated debt 67,785 67,328
Total liabilities 3,346,947 3,298,548
SHAREHOLDERS' EQUITY
Share capital 10,086 9,317
Foreign currency translation reserve - 195 -186
Reserve for available-for-sale financial assets - 1,523 -2,253
Retained earnings 129,862 118,917
Proposed dividends - -
Shareholders of Danske Bank A/S (the Parent Company) 138,230 125,795
Non-controlling interests 4 60
Total shareholders' equity 138,234 125,855
Total liabilities and equity 3,485,181 3,424,403
52 DANSKE BANK / GROUP 2012
BALANCE SHEET – DANSKE BANK GROUP

BALANCE SHEET – DANSKE BANK GROUP
Note (DKK millions) 2012 2011
DANSKE BANK ANNUAL REPORT 2012 4
ASSETS
13 Cash in hand and demand deposits with central banks 97,267 28,617
14 Due from credit institutions and central banks 200,646 180,870
15 Trading portfolio assets 812,927 909,755
16 Investment securities 107,724 109,264
17 Loans and advances at amortised cost 1,161,816 1,126,482
18 Loans at fair value 732,762 720,741
19 Assets under pooled schemes and unit-linked investment contracts 70,625 61,888
20 Assets under insurance contracts 241,343 230,668
21 Holdings in associates 1,118 989
22 Intangible assets 21,181 22,233
23 Investment property 4,131 4,624
24 Tangible assets 6,544 7,267
Current tax assets 147 580
28 Deferred tax assets 1,418 1,791
25 Other assets 25,532 18,634
Total assets 3,485,181 3,424,403
LIABILITIES
26 Due to credit institutions and central banks 459,932 393,388
15 Trading portfolio liabilities 531,860 697,913
27 Deposits 929,092 848,994
18 Bonds issued by Realkredit Danmark 614,325 557,699
19 Deposits under pooled schemes and unit-linked investment contracts 78,741 69,211
20 Liabilities under insurance contracts 266,938 248,966
30 Other issued bonds 340,005 366,920
Current tax liabilities 575 423
28 Deferred tax liabilities 7,585 6,278
29 Other liabilities 50,109 41,428
31 Subordinated debt 67,785 67,328
Total liabilities 3,346,947 3,298,548
SHAREHOLDERS' EQUITY
Share capital 10,086 9,317
Foreign currency translation reserve - 195 -186
Reserve for available-for-sale financial assets - 1,523 -2,253
Retained earnings 129,862 118,917
Proposed dividends - -
Shareholders of Danske Bank A/S (the Parent Company) 138,230 125,795
Non-controlling interests 4 60
Total shareholders' equity 138,234 125,855
Total liabilities and equity 3,485,181 3,424,403
STATEMENT OF CAPITAL – DANSKE BANK GROUP
(DKK millions)
DANSKE BANK ANNUAL REPORT 2012 5
Changes in shareholders' equity
Shareholders of Danske Bank A/S (the Parent Company) Foreign Reserve for currency available- Non- Share translation for-sale Retained Proposed controlling capital reserve assets earnings dividends Total interests Total
Shareholders' equity at 1 January 2012 9,317 -186 -2,253 118,917 - 125,795 60 125,855
Net profit for the year - - - 4,745 - 4,745 4 4,749
Other comprehensive income
Translation of units outside Denmark - 472 - - - 472 - 472
Hedging of units outside Denmark - -481 - - - -481 - -481
Unrealised value adjustments - - 605 - - 605 - 605
Realised value adjustments - - 125 - - 125 - 125
Tax on other comprehensive income - - - -88 - -88 - -88
Total other comprehensive income - -9 730 -88 - 633 - 633
Total comprehensive income for the year - -9 730 4,657 - 5,378 4 5,382
Transactions with owners
Dividends paid - - - - - - -10 -10
Share capital increase 769 - - 6,381 - 7,150 - 7,150
Share offering costs - - - -35 - -35 - -35
Acquisition of own shares - - - -19,399 - -19,399 - -19,399
Sale of own shares - - - 19,179 - 19,179 - 19,179
Share-based payments - - - 219 - 219 - 219
Disposal of non-controlling interests - - - - - - -50 -50
Tax on entries on shareholders' equity - - - -57 - -57 - -57
Shareholders' equity at 31 December 2012 10,086 -195 -1,523 129,862 - 138,230 4 138,234
Shareholders' equity at 1 January 2011 6,988 -136 -1,330 99,205 - 104,727 15 104,742
Net profit for the year - - - 1,712 - 1,712 11 1,723
Other comprehensive income
Translation of units outside Denmark - 223 - - - 223 - 223
Hedging of units outside Denmark - -273 - - - -273 - -273
Unrealised value adjustments - - -951 - - -951 - -951
Realised value adjustments - - 28 - - 28 - 28
Tax on other comprehensive income - - - 285 - 285 - 285
Total other comprehensive income - -50 -923 285 - -688 - -688
Total comprehensive income for the year - -50 -923 1,997 - 1,024 11 1,035
Transactions with owners
Dividends paid - - - - - - - -
Share capital increase 2,329 - - 17,703 - 20,032 - 20,032
Share offering costs - - - -271 - -271 - -271
Acquisition of own shares - - - -16,470 - -16,470 - -16,470
Sale of own shares - - - 16,596 - 16,596 - 16,596
Share-based payments - - - 127 - 127 - 127
Acquisition of non-controlling interests - - - - - - 34 34
Tax on entries on shareholders' equity - - - 30 - 30 - 30
Shareholders' equity at 31 December 2011 9,317 -186 -2,253 118,917 - 125,795 60 125,855
For as long as the Danish state holds hybrid capital in Danske Bank, Danske Bank A/S may distribute dividends if such dividends can be paid in full out of the net profit.
DANSKE BANK / GROUP 2012 53
STA
TE
ME
NT
OF
CA
PITA
L –
DA
NS
KE
BA
NK
GR
OU
P
STATEMENT OF CAPITAL – DANSKE BANK GROUP

STATEMENT OF CAPITAL – DANSKE BANK GROUP
(DKK millions) 2012 2011
DANSKE BANK ANNUAL REPORT 2012 6
Earnings per share
Net profit for the year 4,745 1,712
Number of shares issued at 1 January 931,739,034 698,804,276
Average number of own shares held by the Group 5,992,048 6,115,822
Average number of shares outstanding prior to capital increase 925,746,986 692,688,454
Average number of shares issued through capital increase 13,023,552 171,669,726
Bonus element of rights issue in capital increase, number of shares - 14,823,492
Adjusted average number of shares outstanding after capital increase 938,770,538 879,181,672
Number of dilutive shares issued for share-based payments -
Adjusted average number of shares outstanding after capital increase, including dilutive shares 938,770,538 879,181,672
Earnings per share (DKK) 5.1 1.9
Diluted earnings per share (DKK) 5.1 1.9
Earnings per share and diluted earnings per share for 2011 have been divided by an adjustment factor to reflect the share capital increase in April 2011.
The share capital consists of shares of a nominal value of DKK 10 each. All shares carry the same rights; there is thus only one class of shares.
Number of shares outstanding Issued at 31 December 1,008,620,000 931,739,034 Holding of own shares 6,925,419 4,627,536 Shares outstanding at 31 December 1,001,694,581 927,111,498 Number Number Value Value Holding of own shares 2012 2011 2012 2011
Trading portfolio 3,333,343 540,255 318 39
Investment on behalf of customers 3,592,076 4,087,281 344 299
Total 6,925,419 4,627,536 662 338
Investment Trading on behalf Total Total portfolio of customers 2012 2011
Holding at 1 January 39 299 338 1,003 Acquisition of own shares 19,263 136 19,399 16,470 Sale of own shares 18,998 181 19,179 16,596 Value adjustment 14 90 104 -539 Holding at 31 December 318 344 662 338 The Board of Directors is authorised to let Danske Bank acquire own shares up to a total nominal amount of 10% of the share capital. The shares may be held for ownership or provided as collateral. If shares are acquired for ownership, the acquisition price may not deviate by more than 10% from the price quoted at the time of acquisition.
-
54 DANSKE BANK / GROUP 2012
STATEMENT OF CAPITAL – DANSKE BANK GROUP

STATEMENT OF CAPITAL – DANSKE BANK GROUP
(DKK millions) 2012 2011
DANSKE BANK ANNUAL REPORT 2012 6
Earnings per share
Net profit for the year 4,745 1,712
Number of shares issued at 1 January 931,739,034 698,804,276
Average number of own shares held by the Group 5,992,048 6,115,822
Average number of shares outstanding prior to capital increase 925,746,986 692,688,454
Average number of shares issued through capital increase 13,023,552 171,669,726
Bonus element of rights issue in capital increase, number of shares - 14,823,492
Adjusted average number of shares outstanding after capital increase 938,770,538 879,181,672
Number of dilutive shares issued for share-based payments -
Adjusted average number of shares outstanding after capital increase, including dilutive shares 938,770,538 879,181,672
Earnings per share (DKK) 5.1 1.9
Diluted earnings per share (DKK) 5.1 1.9
Earnings per share and diluted earnings per share for 2011 have been divided by an adjustment factor to reflect the share capital increase in April 2011.
The share capital consists of shares of a nominal value of DKK 10 each. All shares carry the same rights; there is thus only one class of shares.
Number of shares outstanding Issued at 31 December 1,008,620,000 931,739,034 Holding of own shares 6,925,419 4,627,536 Shares outstanding at 31 December 1,001,694,581 927,111,498 Number Number Value Value Holding of own shares 2012 2011 2012 2011
Trading portfolio 3,333,343 540,255 318 39
Investment on behalf of customers 3,592,076 4,087,281 344 299
Total 6,925,419 4,627,536 662 338
Investment Trading on behalf Total Total portfolio of customers 2012 2011
Holding at 1 January 39 299 338 1,003 Acquisition of own shares 19,263 136 19,399 16,470 Sale of own shares 18,998 181 19,179 16,596 Value adjustment 14 90 104 -539 Holding at 31 December 318 344 662 338 The Board of Directors is authorised to let Danske Bank acquire own shares up to a total nominal amount of 10% of the share capital. The shares may be held for ownership or provided as collateral. If shares are acquired for ownership, the acquisition price may not deviate by more than 10% from the price quoted at the time of acquisition.
-
STATEMENT OF CAPITAL – DANSKE BANK GROUP
Note (DKK millions) 2012 2011
DANSKE BANK ANNUAL REPORT 2012 7
Capital base and total capital ratio
Shareholders' equity 138,234 125,855 Revaluation of domicile property at fair value 1,048 1,281 Pension obligations at fair value -235 348 Tax effect -57 -58 Reserves in undertakings consolidated on a pro rata basis 3,002 2,991 Shareholders' equity calculated in accordance with the rules of the Danish FSA 141,992 130,417 Expected dividends - - Intangible assets of banking operations -21,279 -22,127 Deferred tax assets -1,389 -1,600 Deferred tax on intangible assets 642 923 Revaluation of domicile property -642 -743 Other statutory deductions -227 -44 Core tier 1 capital 119,097 106,826 Hybrid capital 40,248 42,366 Difference between expected losses and impairment charges - - Statutory deduction for insurance subsidiaries -4,292 -4,175 Other statutory deductions -19 - Tier 1 capital 155,034 145,017 Subordinated debt, excluding hybrid capital 23,009 20,480 Revaluation of domicile property 642 743 Difference between expected losses and impairment charges - - Statutory deduction for insurance subsidiaries -4,292 -4,175 Other statutory deductions -19 - Capital base 174,374 162,065
35 Risk-weighted assets 819,436 905,979
Core tier 1 capital ratio (%) 14.5 11.8 Tier 1 capital ratio (%) 18.9 16.0
Total capital ratio (%) 21.3 17.9
The total capital and tier 1 capital ratios are calculated in accordance with the Danish Financial Business Act and applicable execu-tive orders. Risk Management 2012 provides more details about the Group’s solvency need. Risk Management 2012 is not covered by the statu-tory audit.
DANSKE BANK / GROUP 2012 55
XX
XX
XX
XX
XX
STA
TE
ME
NT
OF
CA
PITA
L –
DA
NS
KE
BA
NK
GR
OU
P
STATEMENT OF CAPITAL – DANSKE BANK GROUP

CASH FLOW STATEMENT – DANSKE BANK GROUP
(DKK millions) 2012 2011
DANSKE BANK ANNUAL REPORT 2012 8
Cash flow from operations
Profit before tax 8,568 4,205 Adjustment for non-cash operating items
Adjustment of income from associates -166 -125 Amortisation and impairment charges for intangible assets 1,317 1,127 Depreciation and impairment charges for tangible assets 1,357 1,215 Loan impairment charges 12,529 13,185 Tax paid -1,908 -671 Other non-cash operating items -49 1,857 Total 21,648 20,793
Changes in operating capital
Cash in hand and demand deposits with central banks 68,077 75,106 Trading portfolio -69,224 -48,236 Other financial instruments at fair value -2,944 -9,734 Loans and advances at amortised cost -47,863 7,065 Loans at fair value -12,021 -19,026 Deposits 80,098 -12,060 Bonds issued by Realkredit Danmark 56,626 2,213 Assets/liabilities under insurance contracts 7,297 -2,320 Other assets/liabilities -19,048 -76,455
Cash flow from operations 82,646 -62,654
Cash flow from investing activities
Acquisition of group undertakings and other business units - - Sale of group undertakings and other business units 276 19 Acquisition of own shares -19,399 -16,470 Sale of own shares 19,179 16,596 Acquisition of intangible assets -395 -418 Acquisition of tangible assets - 206 -349 Sale of tangible assets 68 10 Cash flow from investing activities - 477 -612
Cash flow from financing activities
Increase in subordinated debt and hybrid capital 5,740 - Redemption of subordinated debt and hybrid capital -5,008 -10,850 Dividends - - Share capital increase 7,115 19,761 Change in non-controlling interests -56 45 Cash flow from financing activities 7,791 8,956
Cash and cash equivalents at 1 January 206,296 260,607 Change in cash and cash equivalents 89,960 -54,310 Cash and cash equivalents at 31 December 296,256 206,297
Cash and cash equivalents at 31 December
Cash in hand and demand deposits with central banks 97,267 28,617 Amounts due from credit institutions and central banks within three months 198,989 177,680
Total 296,256 206,297 The list of group holdings and undertakings provides information about restrictions on the use of cash flows from group undertakings.
56 DANSKE BANK / GROUP 2012
CASH FLOW STATEMENT – DANSKE BANK GROUP

CASH FLOW STATEMENT – DANSKE BANK GROUP
(DKK millions) 2012 2011
DANSKE BANK ANNUAL REPORT 2012 8
Cash flow from operations
Profit before tax 8,568 4,205 Adjustment for non-cash operating items
Adjustment of income from associates -166 -125 Amortisation and impairment charges for intangible assets 1,317 1,127 Depreciation and impairment charges for tangible assets 1,357 1,215 Loan impairment charges 12,529 13,185 Tax paid -1,908 -671 Other non-cash operating items -49 1,857 Total 21,648 20,793
Changes in operating capital
Cash in hand and demand deposits with central banks 68,077 75,106 Trading portfolio -69,224 -48,236 Other financial instruments at fair value -2,944 -9,734 Loans and advances at amortised cost -47,863 7,065 Loans at fair value -12,021 -19,026 Deposits 80,098 -12,060 Bonds issued by Realkredit Danmark 56,626 2,213 Assets/liabilities under insurance contracts 7,297 -2,320 Other assets/liabilities -19,048 -76,455
Cash flow from operations 82,646 -62,654
Cash flow from investing activities
Acquisition of group undertakings and other business units - - Sale of group undertakings and other business units 276 19 Acquisition of own shares -19,399 -16,470 Sale of own shares 19,179 16,596 Acquisition of intangible assets -395 -418 Acquisition of tangible assets - 206 -349 Sale of tangible assets 68 10 Cash flow from investing activities - 477 -612
Cash flow from financing activities
Increase in subordinated debt and hybrid capital 5,740 - Redemption of subordinated debt and hybrid capital -5,008 -10,850 Dividends - - Share capital increase 7,115 19,761 Change in non-controlling interests -56 45 Cash flow from financing activities 7,791 8,956
Cash and cash equivalents at 1 January 206,296 260,607 Change in cash and cash equivalents 89,960 -54,310 Cash and cash equivalents at 31 December 296,256 206,297
Cash and cash equivalents at 31 December
Cash in hand and demand deposits with central banks 97,267 28,617 Amounts due from credit institutions and central banks within three months 198,989 177,680
Total 296,256 206,297 The list of group holdings and undertakings provides information about restrictions on the use of cash flows from group undertakings.
NOTES – DANSKE BANK GROUP
Note
DANSKE BANK ANNUAL REPORT 2012 9
1 Significant accounting estimates Danske Bank Group prepares its consolidated financial statements in accordance with the International Financial Reporting Standards (IFRSs), issued by the International Accounting Standards Board (IASB), as adopted by the EU. Note 45 presents the Group’s significant accounting poli-cies. Management’s estimates and assumptions of future events that will significantly affect the carrying amounts of assets and liabilities underlie the preparation of the consolidated financial statements. The estimates and assumptions that are deemed critical to the consolidated financial state-ments are • the fair value measurement of financial instruments • the measurement of loans and advances • the measurement of goodwill • the measurement of liabilities under insurance con-
tracts • the measurement of the net obligation for defined
benefit pension plans • the recognition of deferred tax The estimates and assumptions are based on premises that management finds reasonable but which are inherently uncertain and unpredictable. The premises may be incom-plete, unexpected future events or situations may occur, and other parties may arrive at other estimated values. Fair value measurement of financial instruments
he value is based on
Significant estimates are not used for measuring the fair value of financial instruments where tprices quoted in an active market or on generally accepted models employing observable market data. Measurements of financial instruments that are only to a limited extent based on observable market data, such as the measurement of unlisted shares and certain bonds for which there is no active market, are subject to estimates. The estimated fair value of illiquid bonds significantly de-pends on the credit spread estimate. If the credit spread widens 50bp at end-2012, the fair value of the bonds will decrease DKK 14 million (2011: DKK 3 million). For derivatives where the value is not based on prices quoted in an active market, the Group makes fair value ad-justments at portfolio level to cover model risk and bid-offer spreads. At end-2012, fair value adjustments amounted to DKK 0.3 billion (31 December 2011: DKK 0.2 billion).
tion Determination of fair value in note 45 and note
The sec42 provide more details. Measurement of loans and advances The Group makes impairment charges to account for any impairment of loans and advances that occurs after initial recognition. Impairment charges consist of individual and collective charges and rely on a number of estimates, in-cluding identification of loans or portfolios of loans with ob-jective evidence of impairment, expected future cash flows and the value of collateral. The Group determines the need for impairment charges on the basis of the customer’s ex-
pected ability to repay debt. This ability depends on a num-ber of factors, including the customer’s earnings capacity and trends in general economic growth and unemployment. Expectations of deteriorating repayment ability reduce credit quality and lead to downgrading of the customer. If all customers were downgraded one rating category, col-lective impairment charges would increase by about DKK 5.9 billion (2011: DKK 7.1 billion). The losses incurred under non-performing loan agreements depend, among other factors, on the value of collateral received. If the value of collateral decreased 10%, individual impairment charges would increase by about DKK 3.7 billion (2011: DKK 3.4 bil-lion). The notes on risk management provide more details on impairment charges for loans and advances. At end-2012, loans and advances accounted for about 54% of to-tal assets (31 December 2011: 5 4%). Measurement of goodwill Goodwill on acquisition is tested for impairment once a year or more frequently if indications of impairment exist. Im-pairment testing requires management to estimate future cash flows from acquired units. A number of factors affect the value of such cash flows, including discount rates, changes in the real economy, customer behaviour and competition. Goodwill is particularly sensitive to changes in impairment test assumptions about normalised long-term earnings. If this return was lowered 20%, goodwill would decrease DKK 0.9 billion. Note 22 provides more informa-tion about impairment tests and sensitivity to changes in impairment test assumptions. At end-2012, goodwill amounted to DKK 18.5 billion (31 December 2011: DKK 18.6 billion), with goodwill allocated to Banking Activi-ties Baltics and Banking Activities Northern Ireland ac-counting for DKK 4.2 billion (31 December 2011: 4.1 bil-lion). Goodwill allocated to these banking units is particu-larly sensitive to changes in impairment test assumptions. Measurement of liabilities under insurance contracts Calculations of liabilities under insurance contracts are based on a number of actuarial computations that rely on assumptions about a number of variables, including mortal-ity and disability rates. Assumptions are based on data from the Group’s own portfolio of insurance contracts. The liabilities also depend on the discount yield curve, which is fixed on the basis of a zero-coupon yield curve estimated on the basis of euro swap market rates to which is added the yield spread between Danish and German government bonds and a mortgage yield curve spread. The yield spread is calculated as a 12-month moving average. In mid-2012, in response to the extraordinarily low yields in the fixed-income markets, the Danish FSA changed the calculation of the discount yield curve used for long yields. The change aligns Danish rules with the expected Solvency II rules and caused a reduction of life insurance provisions of DKK 1.5 billion at end-2012. The risk management notes contain a sensitivity analysis.
DANSKE BANK / GROUP 2012 57
NO
TE
S – D
AN
SK
E B
AN
K G
RO
UP
NOTES – DANSKE BANK GROUP

NOTES – DANSKE BANK GROUP
Note
DANSKE BANK ANNUAL REPORT 2012 10
1 Measurement of the net obligation for defined benefit (cont’d) pension plans
The calculation of the net obligation is based on computa-tions made by external actuaries. These computations rely on assumptions about a number of variables, including dis-count and mortality rates and salary increases. The appli-cation of the corridor method to defined benefit pension plans limits fluctuations in reported figures that arise as a result of changes in actuarial assumptions, unless changes are caused by plan adjustments. The measurement of the net obligation for defined benefit pension plans is particu-larly sensitive to changes in the discount rate. From the be-ginning of 2013, the Group will adopt the amended IAS 19 and will no longer use the corridor method.
This will decrease shareholders’ equity at end-2012 by DKK 0.2 billion (2011: increase of DKK 0.3 billion). Note 45 provides more information about the effect of implementing the amended IAS 19. Note 34 and the section on pension risk in the notes on risk management provide details on the assumptions and contain sensitivity analyses.
Financial instruments and obligations under insurance contracts, classification and measurement Fair value Amortised cost
Directly through profit or loss
Interest rate Available- Held-to- Loans (DKK billions) Held-for-trading Designated hedge** for-sale maturity and adv. Liabilities Total
ASSETS Cash in hand and demand deposits with central banks - - - - - 97 - 97
Due from credit institutions and central banks - - - - - 201 - 201
Derivatives 370 - 39 - - - - 409
Bonds 401 30 - 66 7 - - 504
Shares 3 3 - - - - - 6
Loans and advances at amortised cost - - 3 - - 1,159 - 1,162
Loans at fair value - 733 - - - - - 733
Assets under pooled schemes and unit-linked investment contracts - 71 - - - - - 71
Assets under insurance contracts - 214 - - - - - 214
Total financial assets, 2012 774 1,051 42 66 7 1,457 - 3,397
Total financial assets, 2011 870 1,012 42 70 11 1,333 3,338
LIABILITIES Due to credit institutions and central banks - - - - - - 460 460
Trading portfolio liabilities 520 - 12 - - - - 532
Deposits - - - - - - 929 929
Bonds issued by Realkredit Danmark - 614 - - - - - 614
Deposits under pooled schemes and unit-linked investment contracts - 79 - - - - - 79
Liabilities under insurance contracts* - 267 - - - - - 267
Other issued bonds - - 15 - - - 325 340
Subordinated debt - - 4 - - - 64 68
Irrevocable loan commitments and guarantees - - - - - - 1 1
Total financial liabilities, 2012 520 960 31 - - - 1,779 3,290
Total financial liabilities, 2011 685 876 29 - - - 1,660 3,250
* Liabilities under insurance contracts are recognised at the present value of expected insurance benefits. ** The interest rate risk on fixed-rate financial assets and liabilities is hedged by derivatives (fair value hedging). The interest rate risk on
fixed-rate bonds available for sale is also hedged by derivatives.
58 DANSKE BANK / GROUP 2012
NOTES – DANSKE BANK GROUP
NOTES – DANSKE BANK GROUP
Note
DANSKE BANK ANNUAL REPORT 2012 10
1 Measurement of the net obligation for defined benefit (cont’d) pension plans
The calculation of the net obligation is based on computa-tions made by external actuaries. These computations rely on assumptions about a number of variables, including dis-count and mortality rates and salary increases. The appli-cation of the corridor method to defined benefit pension plans limits fluctuations in reported figures that arise as a result of changes in actuarial assumptions, unless changes are caused by plan adjustments. The measurement of the net obligation for defined benefit pension plans is particu-larly sensitive to changes in the discount rate. From the be-ginning of 2013, the Group will adopt the amended IAS 19 and will no longer use the corridor method.
This will decrease shareholders’ equity at end-2012 by DKK 0.2 billion (2011: increase of DKK 0.3 billion). Note 45 provides more information about the effect of implementing the amended IAS 19. Note 34 and the section on pension risk in the notes on risk management provide details on the assumptions and contain sensitivity analyses.
Financial instruments and obligations under insurance contracts, classification and measurement Fair value Amortised cost
Directly through profit or loss
Interest rate Available- Held-to- Loans (DKK billions) Held-for-trading Designated hedge** for-sale maturity and adv. Liabilities Total
ASSETS Cash in hand and demand deposits with central banks - - - - - 97 - 97
Due from credit institutions and central banks - - - - - 201 - 201
Derivatives 370 - 39 - - - - 409
Bonds 401 30 - 66 7 - - 504
Shares 3 3 - - - - - 6
Loans and advances at amortised cost - - 3 - - 1,159 - 1,162
Loans at fair value - 733 - - - - - 733
Assets under pooled schemes and unit-linked investment contracts - 71 - - - - - 71
Assets under insurance contracts - 214 - - - - - 214
Total financial assets, 2012 774 1,051 42 66 7 1,457 - 3,397
Total financial assets, 2011 870 1,012 42 70 11 1,333 3,338
LIABILITIES Due to credit institutions and central banks - - - - - - 460 460
Trading portfolio liabilities 520 - 12 - - - - 532
Deposits - - - - - - 929 929
Bonds issued by Realkredit Danmark - 614 - - - - - 614
Deposits under pooled schemes and unit-linked investment contracts - 79 - - - - - 79
Liabilities under insurance contracts* - 267 - - - - - 267
Other issued bonds - - 15 - - - 325 340
Subordinated debt - - 4 - - - 64 68
Irrevocable loan commitments and guarantees - - - - - - 1 1
Total financial liabilities, 2012 520 960 31 - - - 1,779 3,290
Total financial liabilities, 2011 685 876 29 - - - 1,660 3,250
* Liabilities under insurance contracts are recognised at the present value of expected insurance benefits. ** The interest rate risk on fixed-rate financial assets and liabilities is hedged by derivatives (fair value hedging). The interest rate risk on
fixed-rate bonds available for sale is also hedged by derivatives.
NOTES – DANSKE BANK GROUP
Note
DANSKE BANK ANNUAL REPORT 2012 11
1 Recognition of deferred tax (cont’d) Recognition of deferred tax requires management to assess
the probability and amount of future profit. Deferred tax as-sets arising from unused tax losses are recognised to the extent that such losses can be offset against tax on future profit. At end-2012, deferred tax assets stood at DKK 1.1 billion (31 December 2011: DKK 1.4 billion). The tax base of unrecognised tax loss carry-forwards, relating primarily to the Group’s banking operations in Ireland, amounted to DKK 2.9 billion (31 December 2011: DKK 1.7 billion). Note 28 provides more information about deferred tax. Financial instruments – general Financial instruments account for more than 95% of total assets and liabilities. Purchases and sales of financial instruments are measured at fair value at the settlement date. Classification At initial recognition, a financial asset is assigned to one of the following five categories: • Trading portfolio measured at fair value • Loans and advances measured at amortised cost • Held-to-maturity investments measured at amortised
cost • Financial assets designated at fair value through profit
or loss • Available-for-sale financial assets measured at fair
value through Other comprehensive income. Any im-pairment charges are recognised through profit or loss
At initial recognition, a financial liability is assigned to one of the following three categories: • Trading portfolio measured at fair value • Financial liabilities designated at fair value through
profit or loss • Other financial liabilities measured at amortised cost Trading portfolio The trading portfolio includes financial assets and liabilities acquired or undertaken by the Group for sale or repurchase in the near term. The trading portfolio also contains collec-tively managed financial assets and liabilities for which a pattern of short-term profit taking exists. Derivatives, in-cluding bifurcated embedded derivatives, form part of the trading portfolio. Fair value option – financial assets and liabilities desig-nated at fair value through profit or loss
Loans at fair value and bonds issued by Realkredit Danmark Loans granted under Danish mortgage finance law are funded by issuing listed mortgage bonds with matching terms. Borrowers may repay such loans by delivering the underlying bonds.
The Group buys and sells own bonds issued by Realkredit Danmark on an ongoing basis because such securities play an important role in the Danish money market. If these loans and bonds were measured at amortised cost, the purchase and sale of own mortgage bonds would result in timing differences in the recognition of gains and losses. Consequently, the Group measures loans and issued bonds at fair value in accordance with the fair value option offered by IAS 39 to ensure that neither gain nor loss will occur on the purchase of own bonds. Other financial assets designated at fair value Other financial assets designated at fair value include secu-rities that are not classified as trading portfolio assets. These securities do not form part of the trading portfolio because no pattern of short-term profit taking exists, but they are still managed on a fair value basis. This category includes financial assets under insurance contracts, bonds quoted in an active market and shares that are not part of the trading portfolio. Realised and unrealised capital gains and losses and divi-dends are carried in the income statement under Net trad-ing income. The financial assets are recognised in the bal-ance sheet under Investment securities and Assets under insurance contracts. Available-for-sale financial assets Available-for-sale financial assets consists of bonds which, although traded in an active market at the time of acquisi-tion, the Group intends neither to sell in the near term nor to hold to maturity. Hedge accounting The Group uses derivatives to hedge the interest rate risk on fixed-rate assets and fixed-rate liabilities measured at amortised cost, except for held-to-maturity investments and available-for-sale financial assets. Hedged risks that meet the criteria for fair value hedge accounting are treated accordingly. The interest rate risk on the hedged assets and liabilities is measured at fair value through profit or loss. At end-2012, hedging derivatives measured at fair value ac-counted for about 1.1% of total assets and about 0.4% of total liabilities (31 December 2011: 1.1% and 0.4%). If the hedge criteria cease to be met, the accumulated value adjustments of the hedged items are amortised over the term to maturity.
DANSKE BANK / GROUP 2012 59
NO
TE
S – D
AN
SK
E B
AN
K G
RO
UP
NOTES – DANSKE BANK GROUP
NOTES – DANSKE BANK GROUP
Note
DANSKE BANK ANNUAL REPORT 2012 12
1 Future adjustments to the measurement of financial (cont’d) instruments
In October 2010, the IASB reissued IFRS 9, Financial In-struments. The aim of the reissuance project is, once the amendments to IFRS 9 are completed, to let the standard replace IAS 39 in its entirety. IFRS 9 now provides princi-ples for classification and derecognition of financial instru-ments. Principles for impairment and hedge accounting are expected to follow in 2013 or later. The transitional rules of the amended IFRS 9 prescribe im-plementation of the standard by 2015. The EU has decided to postpone adoption of the amended IFRS 9 until all details of the standard are known. Meaningful classification of fi-nancial instruments is not possible without information about the future parts of IFRS 9 to clarify the overall ac-counting effects of the standard. In December 2011, the IASB clarified the IAS 32 require-ments for offsetting financial instruments. The clarification is not expected to significantly increase the offsetting of fi-nancial instruments. Note 45, Significant accounting policies, describes IFRS 9 and the clarification of IAS 32 in more detail. Insurance activities – general The Group’s net income from insurance business com-prises the return on assets funded by Danica Pension’s shareholders’ equity, income from unit-linked business and health and accident business, and a risk allowance for con-ventional life insurance. The risk allowance is determined in accordance with the Danish FSA’s executive order on the contribution principle. If the technical basis for the conven-tional life insurance business for a given period is insuffi-cient to allow booking of the risk allowance, the amount may be booked in later periods when the technical basis permits. Insurance contracts guarantee a certain long-term return on policyholders’ funds. If the technical basis exceeds the interest accrual to policyholders and the risk allowance, the difference is allocated to the bonus potential. The bonus po-tential serves as a risk buffer. If the technical basis is insuf-ficient to cover the interest accrual to policyholders, the shortfall is covered by the bonus potential. If the bonus po-tential is insufficient to cover the shortfall, the difference is paid by the Group. Similarly to the risk allowance, amounts paid by the Group are booked to the shadow account and may be recovered at a later date when the technical basis permits. Life insurance policies are divided into insurance and in-vestment contracts. Insurance contracts are contracts that entail significant insurance risk or entitle policyholders to bonuses. Investment contracts are contracts that entail no significant insurance risk and comprise unit-linked con-tracts under which the investment risk lies with the policy-holder.
Insurance contracts Insurance contracts comprise both an investment element and an insurance element, which are recognised as aggre-gate figures. Life insurance provisions are recognised at their present value under Liabilities under insurance contracts. Assets earmarked for insurance contracts are recognised under Assets under insurance contracts if most of the re-turn on the assets accrues to the policyholders. Most of these assets are measured at fair value. Insurance premiums are recognised under Net premiums. Net insurance benefits consists of benefits disbursed under insurance contracts and the annual change in insurance ob-ligations not deriving from additional provisions for benefit guarantees. The return on earmarked assets is allocated to the relevant items in the income statement. The return to policyholders is recognised under Net trading income as are changes to additional provisions for benefit guarantees. Investment contracts Investment contracts are recognised as financial liabilities, and, consequently, contributions and benefits under such contracts are recognised directly in the balance sheet as adjustments of liabilities. Deposits are measured at the value of the savings under Deposits under pooled schemes and unit-linked investment contracts. Savings under unit-linked investment contracts are meas-ured at fair value under Assets under pooled schemes and unit-linked investment contracts. The return on the assets and the crediting of the amounts to policyholders’ accounts are recognised under Net trading income. Assets funded by shareholders’ equity The separate pool of assets equal to shareholders’ equity is recognised at fair value and consolidated with the other as-sets of the Group. Financial highlights As shown in note 2 on business segments, the financial highlights deviate from the corresponding figures in the consolidated financial statements. Income from the Danske Markets segment is recognised in the consolidated income statement under Net trading in-come and Net interest income, but is recognised in the fi-nancial highlights as a total under Net trading income. Net income from insurance business is presented on a single line in the financial highlights.
60 DANSKE BANK / GROUP 2012
NOTES – DANSKE BANK GROUP
NOTES – DANSKE BANK GROUP
Note
DANSKE BANK ANNUAL REPORT 2012 12
1 Future adjustments to the measurement of financial (cont’d) instruments
In October 2010, the IASB reissued IFRS 9, Financial In-struments. The aim of the reissuance project is, once the amendments to IFRS 9 are completed, to let the standard replace IAS 39 in its entirety. IFRS 9 now provides princi-ples for classification and derecognition of financial instru-ments. Principles for impairment and hedge accounting are expected to follow in 2013 or later. The transitional rules of the amended IFRS 9 prescribe im-plementation of the standard by 2015. The EU has decided to postpone adoption of the amended IFRS 9 until all details of the standard are known. Meaningful classification of fi-nancial instruments is not possible without information about the future parts of IFRS 9 to clarify the overall ac-counting effects of the standard. In December 2011, the IASB clarified the IAS 32 require-ments for offsetting financial instruments. The clarification is not expected to significantly increase the offsetting of fi-nancial instruments. Note 45, Significant accounting policies, describes IFRS 9 and the clarification of IAS 32 in more detail. Insurance activities – general The Group’s net income from insurance business com-prises the return on assets funded by Danica Pension’s shareholders’ equity, income from unit-linked business and health and accident business, and a risk allowance for con-ventional life insurance. The risk allowance is determined in accordance with the Danish FSA’s executive order on the contribution principle. If the technical basis for the conven-tional life insurance business for a given period is insuffi-cient to allow booking of the risk allowance, the amount may be booked in later periods when the technical basis permits. Insurance contracts guarantee a certain long-term return on policyholders’ funds. If the technical basis exceeds the interest accrual to policyholders and the risk allowance, the difference is allocated to the bonus potential. The bonus po-tential serves as a risk buffer. If the technical basis is insuf-ficient to cover the interest accrual to policyholders, the shortfall is covered by the bonus potential. If the bonus po-tential is insufficient to cover the shortfall, the difference is paid by the Group. Similarly to the risk allowance, amounts paid by the Group are booked to the shadow account and may be recovered at a later date when the technical basis permits. Life insurance policies are divided into insurance and in-vestment contracts. Insurance contracts are contracts that entail significant insurance risk or entitle policyholders to bonuses. Investment contracts are contracts that entail no significant insurance risk and comprise unit-linked con-tracts under which the investment risk lies with the policy-holder.
Insurance contracts Insurance contracts comprise both an investment element and an insurance element, which are recognised as aggre-gate figures. Life insurance provisions are recognised at their present value under Liabilities under insurance contracts. Assets earmarked for insurance contracts are recognised under Assets under insurance contracts if most of the re-turn on the assets accrues to the policyholders. Most of these assets are measured at fair value. Insurance premiums are recognised under Net premiums. Net insurance benefits consists of benefits disbursed under insurance contracts and the annual change in insurance ob-ligations not deriving from additional provisions for benefit guarantees. The return on earmarked assets is allocated to the relevant items in the income statement. The return to policyholders is recognised under Net trading income as are changes to additional provisions for benefit guarantees. Investment contracts Investment contracts are recognised as financial liabilities, and, consequently, contributions and benefits under such contracts are recognised directly in the balance sheet as adjustments of liabilities. Deposits are measured at the value of the savings under Deposits under pooled schemes and unit-linked investment contracts. Savings under unit-linked investment contracts are meas-ured at fair value under Assets under pooled schemes and unit-linked investment contracts. The return on the assets and the crediting of the amounts to policyholders’ accounts are recognised under Net trading income. Assets funded by shareholders’ equity The separate pool of assets equal to shareholders’ equity is recognised at fair value and consolidated with the other as-sets of the Group. Financial highlights As shown in note 2 on business segments, the financial highlights deviate from the corresponding figures in the consolidated financial statements. Income from the Danske Markets segment is recognised in the consolidated income statement under Net trading in-come and Net interest income, but is recognised in the fi-nancial highlights as a total under Net trading income. Net income from insurance business is presented on a single line in the financial highlights.
NOTES – DANSKE BANK GROUP
Note
DANSKE BANK ANNUAL REPORT 2012 13
2 Business model and business segmentation Danske Bank Group is Denmark’s leading financial services provider and one of the largest in the Nordic region. The Group offers customers a wide range of services in the fields of banking, mortgage finance, insurance, real-estate brokerage, asset management and trading in fixed income products, foreign exchange and equities. Danske Bank is an international retail bank operating in 15 countries, mainly in the Nordic region. Danske Bank is mar-ket leader in Denmark and among the largest banks in Northern Ireland and Finland. Danica Pension carries out the Group’s activities in the life insurance and pensions markets. The Group consists of a number of business units and sup-port functions. Banking Activities consists of the Group’s retail banking units and Corporate & Institutional Banking (CIB). The retail banking units serve all types of personal customers (includ-ing private banking customers served at finance centres) as well as small and medium-sized businesses. Mortgage fi-nance operations in Denmark are carried out through Realkredit Danmark. Real estate agency operations are conducted by the home and Fokus Krogsveen estate agency chains. The results of the Group’s property financing opera-tions are included in the retail banking unit figures. The CIB units serve the largest and most complex compa-nies in the Nordic region, including pension funds, insur-ance companies, other financial institutions and multina-tional companies with significant banking business in the region. Products and services include lending, financial in-struments for risk management and investment purposes, cash management services, advice on mergers and acquisi-tions, and assistance with equity and debt issues in the in-ternational financial markets. Danske Markets is responsible for the Group’s activities in the financial markets. Trading activities include trading in fixed-income products, foreign exchange and equities. Insti-tutional Banking at Danske Markets covers facilities with international financial institutions outside the Nordic re-gion. Facilities with Nordic financial institutions form part of Banking Activities. Group Treasury is responsible for the Group’s strategic fixed-income, foreign exchange and equity portfolios and serves as the Group’s internal bank.
Danske Capital develops and provides asset and wealth management products and services that are marketed through the banking units and directly to businesses, insti-tutional clients and external distributors. Danske Capital also supports the advisory and asset management activi-ties of the banking units. Through Danske Bank Interna-tional, Luxembourg, Danske Capital provides international private banking services to clients outside the Group’s home markets. Danske Capital operates in Denmark, Swe-den, Norway, Finland, Estonia, Lithuania and Luxemburg. Danica Pension carries out the Group’s life insurance and pension activities for both personal and business custom-ers. Products are marketed through a range of channels, mainly banking units and own insurance brokers and advis-ers. Danica Pension offers two market-based products: Danica Balance and Danica Link. These products allow cus-tomers to select their own investment profiles, and the re-turn on savings depends on market trends. Danica Pension also offers Danica Traditionel. This product does not offer individual investment profiles, and Danica Pension sets the rate of interest on policyholders’ savings. Other Activities encompasses expenses for the Group’s support functions and real property. It also covers elimina-tions, including the elimination of returns on own shares. Capital is allocated to the individual business units on the basis of each unit’s share of the Group’s average risk-weighted assets calculated prior to the transition to the Capital Requirements Directive. Insurance companies are subject to special statutory requirements. Capital is allo-cated to the insurance business in compliance with these requirements. A calculated income equal to the risk-free return on its allo-cated capital is apportioned to each business unit. This in-come is calculated on the basis of the short-term money market rate. Expenses are allocated to the business units at market prices. Other Activities supplies services to business units, and transactions are settled at unit prices or on an arm’s-length basis, if possible, on the basis of consumption and activity. Assets and liabilities are broken down into business unit operations and presented in the business unit sections.
DANSKE BANK / GROUP 2012 61
NO
TE
S – D
AN
SK
E B
AN
K G
RO
UP
NOTES – DANSKE BANK GROUP

NOTES – DANSKE BANK GROUP
DANSKE BANK ANNUAL REPORT 2012 14
2 Business segments 2012
(cont'd) Banking Danske Markets Danske Danica Other Elimina- Reclassi- Activities and Treasury Capital Pension Activities tions Total fication Highlights
Net interest income 24,624 4,242 114 5,794 50 179 35,003 -10,215 24,788
Net fee income 6,756 409 2,057 -958 -31 - 8,233 549 8,782
Net trading income 1,496 2,298 30 9,171 17 -277 12,735 -3,834 8,901
Other income 2,843 374 - 335 1,032 -133 4,451 -1,500 2,951
Net premiums - - - 19,858 - - 19,858 -19,858 -
Net insurance benefits - - - 31,089 - - 31,089 -31,089 -
Income from equity investments 1 133 - 9 14 15 172 -172 -
Net income from insurance business - - - - - - - 2,263 2,263
Total income 35,720 7,456 2,201 3,120 1,082 -216 49,363 -1,678 47,685
Expenses 21,072 3,068 1,130 857 2,272 -133 28,266 -1,678 26,588
Profit before loan impairment charges 14,648 4,388 1,071 2,263 -1,190 -83 21,097 - 21,097
Loan impairment charges 12,651 -99 -23 - - - 12,529 - 12,529
Profit before tax 1,997 4,487 1,094 2,263 -1,190 -83 8,568 - 8,568
Loans and advances, excluding reverse transactions 1,628,532 49,204 5,659 - 7,917 -16,922 1,674,390 - 1,674,390
Other assets 603,342 5,930,239 20,759 316,441 -337,077 -4,722,913 1,810,791 - 1,810,791
Total assets 2,231,874 5,979,443 26,418 316,441 -329,160 -4,739,835 3,485,181 - 3,485,181
Deposits, excluding repo deposits 722,688 68,834 5,167 - 4,276 -12,458 788,507 - 788,507
Other liabilities 1,418,350 5,897,934 20,916 307,195 -358,578 -4,727,377 2,558,440 - 2,558,440
Allocated capital 90,836 12,675 335 9,246 25,142 - 138,234 - 138,234
Total liabilities and equity 2,231,874 5,979,443 26,418 316,441 -329,160 -4,739,835 3,485,181 - 3,485,181
Internal income -13,437 9,281 578 551 3,027 - -
Amortisation and depreciation charges 2,204 5 6 - 903 - 3,118
Impairment charges for intangible and tangible assets - - - - 584 - 584
Reversals of impairment charges 10 - - - - - 10
Profit before tax as % of allocated capital (avg.) 2.2 35.4 326.6 24.5 -4.7 - 6.2
Cost/income ratio (%) 59.0 41.1 51.3 27.5 210.0 - 57.3
Full-time-equivalent staff (end of year) 12,758 860 569 799 5,322 - 20,308
In its financial highlights, the Group recognises earnings contributed by Danske Markets as net trading income and earnings contrib-uted by Danica Pension as net income from insurance business. The Reclassification column shows the adjustments made to the de-tailed figures in the calculation of the highlights. Internal income and expenses are allocated to the individual segments on an arm’s-length basis. Funding costs for lending and deposit activities are allocated on the basis of a maturity analysis of loans and deposits, interbank rates and funding spreads, and depend on financial market trends.
Note (DKK millions)
62 DANSKE BANK / GROUP 2012
NOTES – DANSKE BANK GROUP
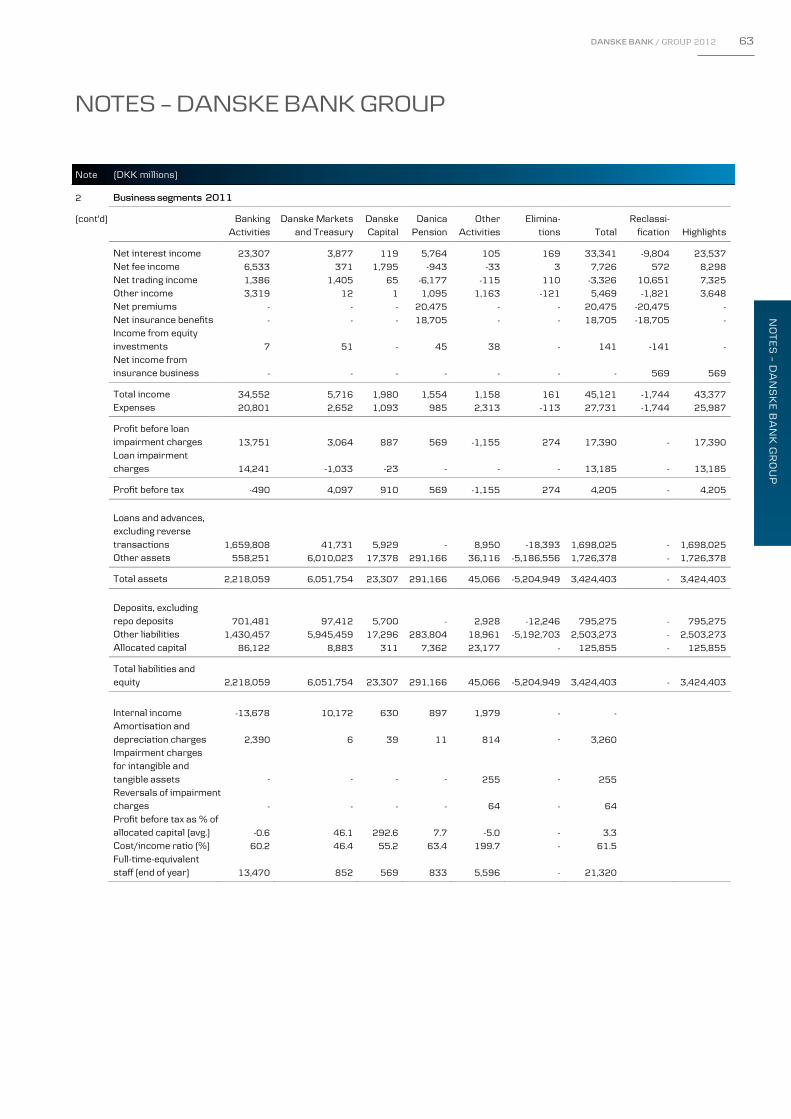
NOTES – DANSKE BANK GROUP
DANSKE BANK ANNUAL REPORT 2012 14
2 Business segments 2012
(cont'd) Banking Danske Markets Danske Danica Other Elimina- Reclassi- Activities and Treasury Capital Pension Activities tions Total fication Highlights
Net interest income 24,624 4,242 114 5,794 50 179 35,003 -10,215 24,788
Net fee income 6,756 409 2,057 -958 -31 - 8,233 549 8,782
Net trading income 1,496 2,298 30 9,171 17 -277 12,735 -3,834 8,901
Other income 2,843 374 - 335 1,032 -133 4,451 -1,500 2,951
Net premiums - - - 19,858 - - 19,858 -19,858 -
Net insurance benefits - - - 31,089 - - 31,089 -31,089 -
Income from equity investments 1 133 - 9 14 15 172 -172 -
Net income from insurance business - - - - - - - 2,263 2,263
Total income 35,720 7,456 2,201 3,120 1,082 -216 49,363 -1,678 47,685
Expenses 21,072 3,068 1,130 857 2,272 -133 28,266 -1,678 26,588
Profit before loan impairment charges 14,648 4,388 1,071 2,263 -1,190 -83 21,097 - 21,097
Loan impairment charges 12,651 -99 -23 - - - 12,529 - 12,529
Profit before tax 1,997 4,487 1,094 2,263 -1,190 -83 8,568 - 8,568
Loans and advances, excluding reverse transactions 1,628,532 49,204 5,659 - 7,917 -16,922 1,674,390 - 1,674,390
Other assets 603,342 5,930,239 20,759 316,441 -337,077 -4,722,913 1,810,791 - 1,810,791
Total assets 2,231,874 5,979,443 26,418 316,441 -329,160 -4,739,835 3,485,181 - 3,485,181
Deposits, excluding repo deposits 722,688 68,834 5,167 - 4,276 -12,458 788,507 - 788,507
Other liabilities 1,418,350 5,897,934 20,916 307,195 -358,578 -4,727,377 2,558,440 - 2,558,440
Allocated capital 90,836 12,675 335 9,246 25,142 - 138,234 - 138,234
Total liabilities and equity 2,231,874 5,979,443 26,418 316,441 -329,160 -4,739,835 3,485,181 - 3,485,181
Internal income -13,437 9,281 578 551 3,027 - -
Amortisation and depreciation charges 2,204 5 6 - 903 - 3,118
Impairment charges for intangible and tangible assets - - - - 584 - 584
Reversals of impairment charges 10 - - - - - 10
Profit before tax as % of allocated capital (avg.) 2.2 35.4 326.6 24.5 -4.7 - 6.2
Cost/income ratio (%) 59.0 41.1 51.3 27.5 210.0 - 57.3
Full-time-equivalent staff (end of year) 12,758 860 569 799 5,322 - 20,308
In its financial highlights, the Group recognises earnings contributed by Danske Markets as net trading income and earnings contrib-uted by Danica Pension as net income from insurance business. The Reclassification column shows the adjustments made to the de-tailed figures in the calculation of the highlights. Internal income and expenses are allocated to the individual segments on an arm’s-length basis. Funding costs for lending and deposit activities are allocated on the basis of a maturity analysis of loans and deposits, interbank rates and funding spreads, and depend on financial market trends.
Note (DKK millions)
NOTES – DANSKE BANK GROUP
DANSKE BANK ANNUAL REPORT 2012 15
2 Business segments 2011
(cont'd) Banking Danske Markets Danske Danica Other Elimina- Reclassi- Activities and Treasury Capital Pension Activities tions Total fication Highlights
Net interest income 23,307 3,877 119 5,764 105 169 33,341 -9,804 23,537 Net fee income 6,533 371 1,795 -943 -33 3 7,726 572 8,298 Net trading income 1,386 1,405 65 -6,177 -115 110 -3,326 10,651 7,325 Other income 3,319 12 1 1,095 1,163 -121 5,469 -1,821 3,648 Net premiums - - - 20,475 - - 20,475 -20,475 - Net insurance benefits - - - 18,705 - - 18,705 -18,705 -
Income from equity investments 7 51 - 45 38 - 141 -141 -
Net income from insurance business - - - - - - - 569 569
Total income 34,552 5,716 1,980 1,554 1,158 161 45,121 -1,744 43,377 Expenses 20,801 2,652 1,093 985 2,313 -113 27,731 -1,744 25,987
Profit before loan impairment charges 13,751 3,064 887 569 -1,155 274 17,390 - 17,390
Loan impairment charges 14,241 -1,033 -23 - - - 13,185 - 13,185
Profit before tax -490 4,097 910 569 -1,155 274 4,205 - 4,205
Loans and advances, excluding reverse transactions 1,659,808 41,731 5,929 - 8,950 -18,393 1,698,025 - 1,698,025
Other assets 558,251 6,010,023 17,378 291,166 36,116 -5,186,556 1,726,378 - 1,726,378
Total assets 2,218,059 6,051,754 23,307 291,166 45,066 -5,204,949 3,424,403 - 3,424,403
Deposits, excluding repo deposits 701,481 97,412 5,700 - 2,928 -12,246 795,275 - 795,275
Other liabilities 1,430,457 5,945,459 17,296 283,804 18,961 -5,192,703 2,503,273 - 2,503,273 Allocated capital 86,122 8,883 311 7,362 23,177 - 125,855 - 125,855
Total liabilities and equity 2,218,059 6,051,754 23,307 291,166 45,066 -5,204,949 3,424,403 - 3,424,403
Internal income -13,678 10,172 630 897 1,979 - -
Amortisation and depreciation charges 2,390 6 39 11 814 3,260
Impairment charges for intangible and tangible assets 255 255
Reversals of impairment charges - - - - 64 - 64
Profit before tax as % of allocated capital (avg.) -0.6 46.1 292.6 7.7 -5.0 - 3.3
Cost/income ratio (%) 60.2 46.4 55.2 63.4 199.7 - 61.5
Full-time-equivalent staff (end of year) 13,470 852 569 833 5,596 - 21,320
Note (DKK millions)
-
- - - - -
DANSKE BANK / GROUP 2012 63
NO
TE
S – D
AN
SK
E B
AN
K G
RO
UP
NOTES – DANSKE BANK GROUP

NOTES – DANSKE BANK GROUP
Note (DKK millions) 2012 2011
DANSKE BANK ANNUAL REPORT 2012 16
2 Income broken down by type of product
(cont'd) Business banking 13,625 12,567
Home finance and savings 11,439 9,279
Trading 9,598 7,799
Day-to-day banking 5,101 5,992
Wealth management 3,498 3,250
Leasing 2,100 3,299
Insurance 3,136 1,616
Other 866 1,319
Total 49,363 45,121
Business banking comprises interest and fee income from transactions with business customers. Home finance and savings com-prises interest and fee income from financing and savings products. Trading comprises income from fixed-income and foreign ex-change products, including brokerage. Day-to-day banking comprises income from personal banking products in the form of personal loans, cards and deposits. Wealth management comprises income from the management of assets, including pooled assets and as-sets in unit trusts. Leasing encompasses income from both finance and operating leases sold by the Group’s leasing operations. In-surance comprises income from Danica Pension and insurance services sold to customers through the banking units.
In accordance with IFRSs, Danske Bank Group is required to disclose business with a single customer that generates 10% or more of total income. The Group has no such customers.
Geographical segmentation
Income from external customers is broken down by the customer’s country of residence, except trading income, which is broken down by the country in which the activities are carried out. Assets (intangible assets, investment property, tangible assets and holdings in associates) are broken down by their location. Goodwill is allocated to the country in which the activities are carried out.
The geographical segmentation of income and assets is shown in compliance with IFRSs and does not reflect the Group’s manage-ment structure. Management believes that the business segmentation provides a more informative description of the Group’s activi-ties. Income External customers Assets 2012 2011 2012 2011
Denmark 24,733 23,030 11,080 14,133
Finland 4,759 4,960 16,231 14,697
Sweden 7,820 7,153 139 558
Norway 5,947 4,491 583 609
Ireland 1,172 1,129 49 147
Baltics 747 768 2,197 2,180
UK 2,677 2,104 2,667 2,679
Germany 209 243 - -
Luxembourg 298 302 17 21
Poland 120 126 - -
US 257 238 10 88
Other 624 577 1 1
Total 49,363 45,121 32,974 35,113
64 DANSKE BANK / GROUP 2012
NOTES – DANSKE BANK GROUP
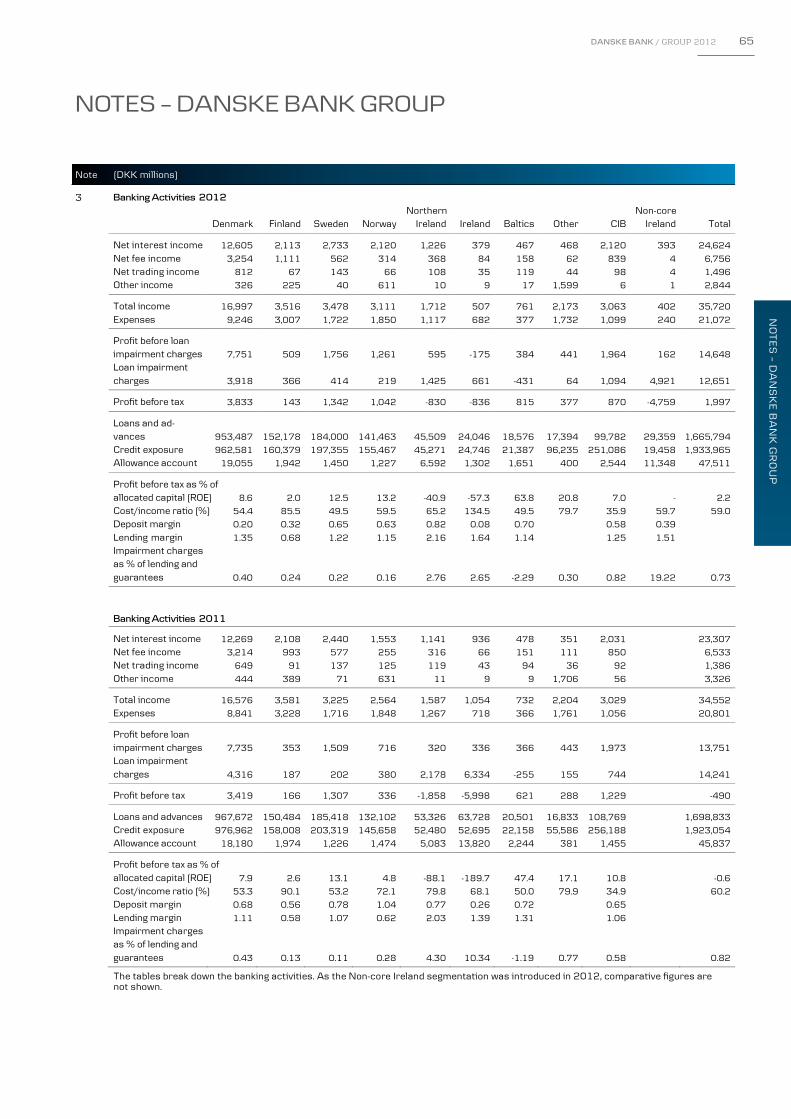
NOTES – DANSKE BANK GROUP
Note (DKK millions) 2012 2011
DANSKE BANK ANNUAL REPORT 2012 16
2 Income broken down by type of product
(cont'd) Business banking 13,625 12,567
Home finance and savings 11,439 9,279
Trading 9,598 7,799
Day-to-day banking 5,101 5,992
Wealth management 3,498 3,250
Leasing 2,100 3,299
Insurance 3,136 1,616
Other 866 1,319
Total 49,363 45,121
Business banking comprises interest and fee income from transactions with business customers. Home finance and savings com-prises interest and fee income from financing and savings products. Trading comprises income from fixed-income and foreign ex-change products, including brokerage. Day-to-day banking comprises income from personal banking products in the form of personal loans, cards and deposits. Wealth management comprises income from the management of assets, including pooled assets and as-sets in unit trusts. Leasing encompasses income from both finance and operating leases sold by the Group’s leasing operations. In-surance comprises income from Danica Pension and insurance services sold to customers through the banking units.
In accordance with IFRSs, Danske Bank Group is required to disclose business with a single customer that generates 10% or more of total income. The Group has no such customers.
Geographical segmentation
Income from external customers is broken down by the customer’s country of residence, except trading income, which is broken down by the country in which the activities are carried out. Assets (intangible assets, investment property, tangible assets and holdings in associates) are broken down by their location. Goodwill is allocated to the country in which the activities are carried out.
The geographical segmentation of income and assets is shown in compliance with IFRSs and does not reflect the Group’s manage-ment structure. Management believes that the business segmentation provides a more informative description of the Group’s activi-ties. Income External customers Assets 2012 2011 2012 2011
Denmark 24,733 23,030 11,080 14,133
Finland 4,759 4,960 16,231 14,697
Sweden 7,820 7,153 139 558
Norway 5,947 4,491 583 609
Ireland 1,172 1,129 49 147
Baltics 747 768 2,197 2,180
UK 2,677 2,104 2,667 2,679
Germany 209 243 - -
Luxembourg 298 302 17 21
Poland 120 126 - -
US 257 238 10 88
Other 624 577 1 1
Total 49,363 45,121 32,974 35,113
NOTES – DANSKE BANK GROUP
DANSKE BANK ANNUAL REPORT 2012 17
3 Banking Activities 2012
Northern Non-core Denmark Finland Sweden Norway Ireland Ireland Baltics Other CIB Ireland Total
Net interest income 12,605 2,113 2,733 2,120 1,226 379 467 468 2,120 393 24,624 Net fee income 3,254 1,111 562 314 368 84 158 62 839 4 6,756 Net trading income 812 67 143 66 108 35 119 44 98 4 1,496 Other income 326 225 40 611 10 9 17 1,599 6 1 2,844
Total income 16,997 3,516 3,478 3,111 1,712 507 761 2,173 3,063 402 35,720 Expenses 9,246 3,007 1,722 1,850 1,117 682 377 1,732 1,099 240 21,072
Profit before loan impairment charges 7,751 509 1,756 1,261 595 -175 384 441 1,964 162 14,648
Loan impairment charges 3,918 366 414 219 1,425 661 -431 64 1,094 4,921 12,651
Profit before tax 3,833 143 1,342 1,042 -830 -836 815 377 870 -4,759 1,997
Loans and ad-vances 953,487 152,178 184,000 141,463 45,509 24,046 18,576 17,394 99,782 29,359 1,665,794
Credit exposure 962,581 160,379 197,355 155,467 45,271 24,746 21,387 96,235 251,086 19,458 1,933,965 Allowance account 19,055 1,942 1,450 1,227 6,592 1,302 1,651 400 2,544 11,348 47,511
Profit before tax as % of allocated capital (ROE) 8.6 2.0 12.5 13.2 -40.9 -57.3 63.8 20.8 7.0 - 2.2
Cost/income ratio (%) 54.4 85.5 49.5 59.5 65.2 134.5 49.5 79.7 35.9 59.7 59.0 Deposit margin 0.20 0.32 0.65 0.63 0.82 0.08 0.70 0.58 0.39
Lending margin 1.35 0.68 1.22 1.15 2.16 1.64 1.14 1.25 1.51
Impairment charges as % of lending and guarantees 0.40 0.24 0.22 0.16 2.76 2.65 -2.29 0.30 0.82 19.22 0.73
Banking Activities 2011
Net interest income 12,269 2,108 2,440 1,553 1,141 936 478 351 2,031 23,307 Net fee income 3,214 993 577 255 316 66 151 111 850 6,533 Net trading income 649 91 137 125 119 43 94 36 92 1,386 Other income 444 389 71 631 11 9 9 1,706 56 3,326
Total income 16,576 3,581 3,225 2,564 1,587 1,054 732 2,204 3,029 34,552 Expenses 8,841 3,228 1,716 1,848 1,267 718 366 1,761 1,056 20,801
Profit before loan impairment charges 7,735 353 1,509 716 320 336 366 443 1,973 13,751
Loan impairment charges 4,316 187 202 380 2,178 6,334 -255 155 744 14,241
Profit before tax 3,419 166 1,307 336 -1,858 -5,998 621 288 1,229 -490
Loans and advances 967,672 150,484 185,418 132,102 53,326 63,728 20,501 16,833 108,769 1,698,833 Credit exposure 976,962 158,008 203,319 145,658 52,480 52,695 22,158 55,586 256,188 1,923,054 Allowance account 18,180 1,974 1,226 1,474 5,083 13,820 2,244 381 1,455 45,837
Profit before tax as % of allocated capital (ROE) 7.9 2.6 13.1 4.8 -88.1 -189.7 47.4 17.1 10.8 -0.6
Cost/income ratio (%) 53.3 90.1 53.2 72.1 79.8 68.1 50.0 79.9 34.9 60.2 Deposit margin 0.68 0.56 0.78 1.04 0.77 0.26 0.72 0.65
Lending margin 1.11 0.58 1.07 0.62 2.03 1.39 1.31 1.06
Impairment charges as % of lending and guarantees 0.43 0.13 0.11 0.28 4.30 10.34 -1.19 0.77 0.58 0.82 The tables break down the banking activities. As the Non-core Ireland segmentation was introduced in 2012, comparative figures are not shown.
Note (DKK millions)
DANSKE BANK / GROUP 2012 65
NO
TE
S – D
AN
SK
E B
AN
K G
RO
UP
NOTES – DANSKE BANK GROUP

NOTES – DANSKE BANK GROUP
Note (DKK millions)
DANSKE BANK ANNUAL REPORT 2012 18
3 Profit before loan impairment charges (cont'd) Index Q4 Q3 Q2 Q1 2012 2011 12/11 2012 2012 2012 2012
Retail Banking Denmark 7,751 7,735 100 2,074 1,878 1,870 1,929
Retail Banking Finland 509 353 144 21 186 103 199
Retail Banking Sweden 1,756 1,509 116 379 488 414 475
Retail Banking Norway 1,261 716 176 318 379 296 268
Banking Activities Northern Ireland 595 320 186 117 163 155 160
Banking Activities Ireland -175 336 - 15 -8 -195 13
Banking Activities Baltics 384 366 105 77 111 100 96
Other Banking Activities 441 443 100 110 110 117 104
Corporate & Institutional Banking 1,964 1,973 100 513 493 496 462
Non-core Ireland 162 - - 35 22 37 68
Total Banking Activities 14,648 13,751 107 3,659 3,822 3,393 3,774
Danske Markets and Treasury 4,388 3,064 143 130 843 1,365 2,050
Danske Capital 1,071 887 121 520 220 183 148
Danica Pension 2,263 569 - 953 427 699 184
Other Activities -1,273 -881 - -386 -213 -21 -653
Total Group 21,097 17,390 121 4,876 5,099 5,619 5,503
Profit before tax
Retail Banking Denmark 3,833 3,419 112 1,183 1,141 910 599 Retail Banking Finland 143 166 86 -36 138 -48 89 Retail Banking Sweden 1,342 1,307 103 280 444 353 265 Retail Banking Norway 1,042 336 - 254 345 289 154 Banking Activities Northern Ireland -830 -1,858 - -188 -51 -105 -486 Banking Activities Ireland -836 -5,998 - -87 -47 -279 -423 Banking Activities Baltics 815 621 131 113 249 191 262 Other Banking Activities 377 288 131 104 120 77 76 Corporate & Institutional Banking 870 1,229 71 473 -137 290 244 Non-core Ireland -4,759 - - -1,146 -1,328 -1,337 -948
Total Banking Activities 1,997 -490 - 950 874 341 -168
Danske Markets and Treasury 4,487 4,097 110 189 908 1,313 2,077 Danske Capital 1,094 910 120 551 224 178 141 Danica Pension 2,263 569 - 953 427 699 184 Other Activities -1,273 -881 - -386 -213 -21 -653
Total Group 8,568 4,205 204 2,257 2,220 2,510 1,581
66 DANSKE BANK / GROUP 2012
NOTES – DANSKE BANK GROUP

NOTES – DANSKE BANK GROUP
Note (DKK millions)
DANSKE BANK ANNUAL REPORT 2012 18
3 Profit before loan impairment charges (cont'd) Index Q4 Q3 Q2 Q1 2012 2011 12/11 2012 2012 2012 2012
Retail Banking Denmark 7,751 7,735 100 2,074 1,878 1,870 1,929
Retail Banking Finland 509 353 144 21 186 103 199
Retail Banking Sweden 1,756 1,509 116 379 488 414 475
Retail Banking Norway 1,261 716 176 318 379 296 268
Banking Activities Northern Ireland 595 320 186 117 163 155 160
Banking Activities Ireland -175 336 - 15 -8 -195 13
Banking Activities Baltics 384 366 105 77 111 100 96
Other Banking Activities 441 443 100 110 110 117 104
Corporate & Institutional Banking 1,964 1,973 100 513 493 496 462
Non-core Ireland 162 - - 35 22 37 68
Total Banking Activities 14,648 13,751 107 3,659 3,822 3,393 3,774
Danske Markets and Treasury 4,388 3,064 143 130 843 1,365 2,050
Danske Capital 1,071 887 121 520 220 183 148
Danica Pension 2,263 569 - 953 427 699 184
Other Activities -1,273 -881 - -386 -213 -21 -653
Total Group 21,097 17,390 121 4,876 5,099 5,619 5,503
Profit before tax
Retail Banking Denmark 3,833 3,419 112 1,183 1,141 910 599 Retail Banking Finland 143 166 86 -36 138 -48 89 Retail Banking Sweden 1,342 1,307 103 280 444 353 265 Retail Banking Norway 1,042 336 - 254 345 289 154 Banking Activities Northern Ireland -830 -1,858 - -188 -51 -105 -486 Banking Activities Ireland -836 -5,998 - -87 -47 -279 -423 Banking Activities Baltics 815 621 131 113 249 191 262 Other Banking Activities 377 288 131 104 120 77 76 Corporate & Institutional Banking 870 1,229 71 473 -137 290 244 Non-core Ireland -4,759 - - -1,146 -1,328 -1,337 -948
Total Banking Activities 1,997 -490 - 950 874 341 -168
Danske Markets and Treasury 4,487 4,097 110 189 908 1,313 2,077 Danske Capital 1,094 910 120 551 224 178 141 Danica Pension 2,263 569 - 953 427 699 184 Other Activities -1,273 -881 - -386 -213 -21 -653
Total Group 8,568 4,205 204 2,257 2,220 2,510 1,581
NOTES – DANSKE BANK GROUP
Note (DKK millions)
DANSKE BANK ANNUAL REPORT 2012 19
4 Net interest and net trading income The table below shows interest income, interest expense and net trading income broken down by balance sheet item and by portfolios of financial instruments recognised at amortised cost or fair value. The interest rate risk on financial portfolios recognised at amortised cost is hedged by derivatives using fair value hedge accounting. Changes to the hedged interest rate risk during the year are recognised under net trading income from the hedged balance sheet items, whereas value adjustments of hedging derivatives are recognised under net trading income from the trading portfolio. Note 15 provides more information.
Interest Interest Net interest Net trading 2012 income expense income income Total
Financial portfolios at amortised cost
Due from/to credit institutions and central banks 1,260 593 667 -8 659
Repo and reverse transactions 2,622 2,733 -111 - -111
Loans, advances and deposits 34,202 7,905 26,297 637 26,934
Held-to-maturity investments 256 - 256 - 256
Other issued bonds - 8,880 -8,880 -3,890 -12,770
Subordinated debt - 4,397 -4,397 605 -3,792
Other financial instruments 232 531 -299 - -299
Total 38,572 25,039 13,533 -2,656 10,877
Financial portfolios at fair value
Loans at fair value and bonds issued by Realkredit Danmark 23,952 17,946 6,006 - 6,006
Trading portfolio and investment securities 9,569 - 9,569 24,795 34,364
Assets and deposits under pooled schemes and
unit-linked investment contracts - - - -192 -192
Assets and liabilities under insurance contracts 5,895 - 5,895 -9,212 -3,317
Total 39,416 17,946 21,470 15,391 36,861
Total net interest and net trading income 77,988 42,985 35,003 12,735 47,738
2011
Financial portfolios at amortised cost
Due from/to credit institutions and central banks 2,323 2,137 186 -10 176
Repo and reverse transactions 4,587 3,631 956 - 956
Loans, advances and deposits 34,928 8,916 26,012 732 26,744
Held-to-maturity investments 343 - 343 - 343
Other issued bonds - 9,219 -9,219 -6,198 -15,417
Subordinated debt - 4,592 -4,592 -1,006 -5,598
Other financial instruments 471 576 -105 0 -105
Total 42,652 29,071 13,581 -6,482 7,099
Financial portfolios at fair value
Loans at fair value and bonds issued by Realkredit Danmark 25,250 18,407 6,843 - 6,843
Trading portfolio and investment securities 7,427 - 7,427 10,299 17,726
Assets and deposits under pooled schemes and
unit-linked investment contracts - - - -14 -14
Assets and liabilities under insurance contracts 5,490 - 5,490 -7,129 -1,639
Total 38,167 18,407 19,760 3,156 22,916
Total net interest and net trading income 80,819 47,478 33,341 -3,326 30,015
Net trading income includes dividends from shares of DKK 2,270 million (2011: DKK 2,064 million) and foreign exchange adjust-ments of DKK 1,103 million (2011: DKK 2,207 million).
Net trading income from insurance contracts includes the return on assets of DKK 2,040 million (2011: DKK 1,759 million), adjust-ment of additional provisions of DKK -7,565 million (2011: DKK -8,753 million), adjustment of collective bonus potential of DKK -477 million (2011: DKK 1,403 million) and tax on pension returns of DKK –3,210 million (2011: DKK -1,538 million).
Interest added to financial assets subject to individual impairment amounted to DKK 1,590 million (2011: DKK 1,757 million).
DANSKE BANK / GROUP 2012 67
NO
TE
S – D
AN
SK
E B
AN
K G
RO
UP
NOTES – DANSKE BANK GROUP

NOTES – DANSKE BANK GROUP
Note (DKK millions) 2012 2011
DANSKE BANK ANNUAL REPORT 2012 20
5 Fee income Financing (loans, advances and guarantees) 1,680 1,595 Investment (securities trading and advisory services) 2,233 2,234 Services (insurance and foreign exchange trading) 42 84
Fees generated by activities 3,955 3,913
Financing (guarantees) 704 686 Investment (asset management and custody services) 3,937 3,699 Services (payment services and cards) 3,572 3,462
Fees generated by portfolios 8,213 7,847
Total 12,168 11,760
Fee expenses
Financing (property valuation) 50 59
Investment (securities trading and advisory services) 958 1,067
Services (referrals) 44 36
Fees generated by activities 1,052 1,162
Financing (guarantees) 142 345 Investment (asset management and custody services) 645 683 Services (payment services and cards) 2,096 1,844
Fees generated by portfolios 2,883 2,872
Total 3,935 4,034
Fees generated by activities comprises fees for the execution of one-off transactions. Fees generated by portfolios comprises recur-ring fees from the product portfolio. Fees that form an integral part of the effective rates of interest on loans, advances and deposits are carried under Interest income and Interest expense. Fees for Loans at fair value are carried under Fee income. Fees for financial instruments not recognised at fair value, such as loans, advances and issued bonds, are recognised as financing fee income or expenses. Such income amounted to DKK 1,935 million (2011: DKK 1,939 million), whereas expenses amounted to DKK 142 million (2011: DKK 345 million).
Fees generated by portfolios includes commission of DKK 121 million (2011: DKK 281 million) paid to the Danish state for guaran-teed bond issues.
6 Other income Fair value adjustment of investment property -35 22 Fair value adjustment of investment property allocated to policyholders -364 176 Profit on sale of domicile and investment property 3 7 Income from lease assets and investment property 2,960 3,255 Income from real-estate brokerage 585 564 Refund of prior-year VAT and duties 5 164
Other income 1,297 1,281
Total 4,451 5,469
Other income includes income of DKK 821 million from businesses taken over until the disposal date (2011: DKK 758 million).
68 DANSKE BANK / GROUP 2012
NOTES – DANSKE BANK GROUP

NOTES – DANSKE BANK GROUP
Note (DKK millions) 2012 2011
DANSKE BANK ANNUAL REPORT 2012 20
5 Fee income Financing (loans, advances and guarantees) 1,680 1,595 Investment (securities trading and advisory services) 2,233 2,234 Services (insurance and foreign exchange trading) 42 84
Fees generated by activities 3,955 3,913
Financing (guarantees) 704 686 Investment (asset management and custody services) 3,937 3,699 Services (payment services and cards) 3,572 3,462
Fees generated by portfolios 8,213 7,847
Total 12,168 11,760
Fee expenses
Financing (property valuation) 50 59
Investment (securities trading and advisory services) 958 1,067
Services (referrals) 44 36
Fees generated by activities 1,052 1,162
Financing (guarantees) 142 345 Investment (asset management and custody services) 645 683 Services (payment services and cards) 2,096 1,844
Fees generated by portfolios 2,883 2,872
Total 3,935 4,034
Fees generated by activities comprises fees for the execution of one-off transactions. Fees generated by portfolios comprises recur-ring fees from the product portfolio. Fees that form an integral part of the effective rates of interest on loans, advances and deposits are carried under Interest income and Interest expense. Fees for Loans at fair value are carried under Fee income. Fees for financial instruments not recognised at fair value, such as loans, advances and issued bonds, are recognised as financing fee income or expenses. Such income amounted to DKK 1,935 million (2011: DKK 1,939 million), whereas expenses amounted to DKK 142 million (2011: DKK 345 million).
Fees generated by portfolios includes commission of DKK 121 million (2011: DKK 281 million) paid to the Danish state for guaran-teed bond issues.
6 Other income Fair value adjustment of investment property -35 22 Fair value adjustment of investment property allocated to policyholders -364 176 Profit on sale of domicile and investment property 3 7 Income from lease assets and investment property 2,960 3,255 Income from real-estate brokerage 585 564 Refund of prior-year VAT and duties 5 164
Other income 1,297 1,281
Total 4,451 5,469
Other income includes income of DKK 821 million from businesses taken over until the disposal date (2011: DKK 758 million).
NOTES – DANSKE BANK GROUP
Note (DKK millions) 2012 2011
DANSKE BANK ANNUAL REPORT 2012 21
7 Insurance contracts Insurance contracts are contracts entered into by Danica Pension that entail significant insurance risks or entitle policyholders to profits. Insurance premiums are carried under Net premiums. Net insurance benefits and changes to insurance obligations not deriving from ad-ditional provisions for benefit guarantees are carried under Net insurance benefits. The return on assets earmarked for insurance con-tracts is carried under Net interest income and Net trading income. Note 2 shows the effect on profit or loss of insurance activities.
Net premiums
Regular premiums, life insurance 5,447 5,192
Single premiums, life insurance 561 1,095
Regular premiums, market-based products 7,558 6,823
Single premiums, market-based products 5,097 6,059
Premiums, health and accident insurance 1,321 1,378
Reinsurance premiums paid -112 -121
Change in unearned premiums provisions -14 49
Total 19,858 20,475
Net insurance benefits
Benefits paid 18,800 16,663
Reinsurers' share received -186 -154
Claims and bonuses paid 1,433 1,340
Change in outstanding claims provisions -195 29
Change in life insurance provisions -4,304 -4,937
Change in provisions for unit-linked contracts 15,541 5,764
Total 31,089 18,705
DANSKE BANK / GROUP 2012 69
NO
TE
S – D
AN
SK
E B
AN
K G
RO
UP
NOTES – DANSKE BANK GROUP

NOTES – DANSKE BANK GROUP
Note (DKK millions) 2012 2011
DANSKE BANK ANNUAL REPORT 2012 22
8 Staff costs and administrative expenses
Staff costs 14,746 13,941 Administrative expenses 9,828 10,339
Total 24,574 24,280
Staff costs Salaries 11,029 10,555 Share-based payments 219 127 Pensions 1,373 1,402 Severance payments 619 437
Financial services employer tax and social security costs 1,506 1,420
Total 14,746 13,941
Remuneration Report 2012, which is available at www.danskebank.com/remuneration, provides a detailed description of Danske Bank Group’s remuneration policy and remuneration paid. Total salary costs stood at DKK 13.2 billion (2011: DKK 12.5 billion), with variable remuneration accounting for 6.8% of this amount (2011: 4.5%).
Remuneration of the Board of Directors (DKK thousands) Ole Andersen 1,958 1,205
Niels B. Christiansen (from 29 March 2011) 1,350 338
Urban Bäckström (from 27 March 2012) 450 -
Michael Fairey 713 581
Peter Højland (until 27 March 2012) 160 581
Mats Jansson 600 581
Jørn P. Jensen (from 27 March 2012) 480 -
Eivind Kolding (until 15 February 2012) 56 1,753
Majken Schultz 600 581
Claus Vastrup (until 27 March 2012) 188 700
Trond Ø. Westlie (from 27 March 2012) 450 -
Susanne Arboe 450 419
Helle Brøndum 450 419
Carsten Eilertsen 450 419
Charlotte Hoffmann 450 419
Per Alling Toubro 450 419
Alf Duch-Pedersen (until 29 March 2011) - 325
Sten Scheibye (until 29 March 2011) - 131
Birgit Aagaard-Svendsen (until 29 March 2011) - 141
Total remuneration 9,255 9,012
Remuneration for committee work included in total remuneration 2,253 2,149
Danske Bank’s directors receive fixed remuneration only and are not covered by the Group’s incentive programmes. Directors also receive a fee for board committee membership. The Board of Directors is remunerated by the Parent Company, Danske Bank A/S. No director has received remuneration for mem-bership of the executive board or board of directors in one or more of the Group’s subsidiaries.
The Group has no pension obligations towards the directors.
70 DANSKE BANK / GROUP 2012
NOTES – DANSKE BANK GROUP

NOTES – DANSKE BANK GROUP
Note (DKK millions) 2012 2011
DANSKE BANK ANNUAL REPORT 2012 22
8 Staff costs and administrative expenses
Staff costs 14,746 13,941 Administrative expenses 9,828 10,339
Total 24,574 24,280
Staff costs Salaries 11,029 10,555 Share-based payments 219 127 Pensions 1,373 1,402 Severance payments 619 437
Financial services employer tax and social security costs 1,506 1,420
Total 14,746 13,941
Remuneration Report 2012, which is available at www.danskebank.com/remuneration, provides a detailed description of Danske Bank Group’s remuneration policy and remuneration paid. Total salary costs stood at DKK 13.2 billion (2011: DKK 12.5 billion), with variable remuneration accounting for 6.8% of this amount (2011: 4.5%).
Remuneration of the Board of Directors (DKK thousands) Ole Andersen 1,958 1,205
Niels B. Christiansen (from 29 March 2011) 1,350 338
Urban Bäckström (from 27 March 2012) 450 -
Michael Fairey 713 581
Peter Højland (until 27 March 2012) 160 581
Mats Jansson 600 581
Jørn P. Jensen (from 27 March 2012) 480 -
Eivind Kolding (until 15 February 2012) 56 1,753
Majken Schultz 600 581
Claus Vastrup (until 27 March 2012) 188 700
Trond Ø. Westlie (from 27 March 2012) 450 -
Susanne Arboe 450 419
Helle Brøndum 450 419
Carsten Eilertsen 450 419
Charlotte Hoffmann 450 419
Per Alling Toubro 450 419
Alf Duch-Pedersen (until 29 March 2011) - 325
Sten Scheibye (until 29 March 2011) - 131
Birgit Aagaard-Svendsen (until 29 March 2011) - 141
Total remuneration 9,255 9,012
Remuneration for committee work included in total remuneration 2,253 2,149
Danske Bank’s directors receive fixed remuneration only and are not covered by the Group’s incentive programmes. Directors also receive a fee for board committee membership. The Board of Directors is remunerated by the Parent Company, Danske Bank A/S. No director has received remuneration for mem-bership of the executive board or board of directors in one or more of the Group’s subsidiaries.
The Group has no pension obligations towards the directors.
NOTES – DANSKE BANK GROUP
Note (DKK millions)
DANSKE BANK ANNUAL REPORT 2012 23
8 Remuneration of the Executive Board (cont'd) Eivind Tonny Thierry Thomas F. Robert Lars Henrik 2012 Kolding Andersen Borgen Endersby Mørch Ramlau-Hansen
Contractual remuneration 11.8 6.9 6.8 1.8 3.5 6.9 Pension - 1.0 1.0 - 0.5 1.1 Variable cash payment 1.2 0.8 0.9 0.1 0.5 0.5 Variable share-based payment 0.4 0.2 0.3 0.1 0.1 0.2
Total earned 13.4 8.9 9.0 2.0 4.6 8.7
Total paid 11.8 8.4 8.3 1.8 4.0 8.4
On 15 February 2012, Eivind Kolding became the new chief executive officer after Peter Straarup retired (remuneration DKK 1.2 mil-lion). Lars Mørch joined the Executive Board on 1 June 2012, and Robert Endersby joined the Executive Board on 1 October 2012. Georg Schubiger retired from the Executive Board on 1 June 2012 (remuneration DKK 5.0 million), and Per Skovhus retired from the Executive Board on 15 June 2012 (remuneration DKK 5.6 million).
The Executive Board received total remuneration of DKK 58.4 million for 2012, with fixed remuneration amounting to DKK 53.1 mil-lion and variable remuneration amounting to DKK million. Total paid comprises contractual remuneration and contributions to de-fined contribution pension plans for 2012, variable cash payment for 2011 and the exercise of rights to conditional shares for previ-ous financial years. The variable remuneration for 2012 will be paid in later financial years. The contractual remuneration and pen-sions for 2012 relate to the period from joining the Executive Board or to the period until retiring from the Executive Board.
5.3
The remuneration of the Executive Board includes remuneration for membership of the board of directors of one or more of the Group's subsidiaries. For such membership, Peter Straarup received remuneration of DKK 31,000 (2011: DKK 248,000), and Tonny Thierry Andersen received remuneration of DKK 190,000 for 2012 (2011: DKK 173,000). Remuneration for directorships in Group undertakings is deducted from the contractual remuneration received from Danske Bank A/S. Under the Danish Act on State-Funded Capital Injections into Credit Institutions, only 50% of the Executive Board’s salaries is tax de-ductible until hybrid capital raised has been repaid. In 2012, this deduction amounted to DKK 29 million (2011: DKK 24 million).
Peter Tonny Thierry Thomas F. Henrik Georg Per 2011 Straarup Andersen Borgen Ramlau-Hansen Schubiger Skovhus
Contractual remuneration 10.1 5.9 6.0 6.2 6.0 5.8 Pension 2.3 0.9 0.9 1.0 0.9 0.9 Variable cash payment - 0.4 0.4 0.4 0.4 0.3 Variable share-based payment - 0.4 0.4 0.4 0.4 0.3
Total earned 12.4 7.6 7.7 8.0 7.7 7.3
Total paid 11.5 7.5 6.9 7.5 6.9 7.4
In accordance with the Group’s general staff policies, Henrik Ramlau-Hansen received a 25-year anniversary benefit, equal to one month’s salary. The Executive Board received total remuneration of DKK 50.7 million for 2011, with fixed remuneration amounting to DKK 46.9 mil-lion and variable remuneration amounting to DKK 3.8 million. Total paid comprises contractual remuneration and contributions to de-fined contribution pension plans for 2011 and the exercise of rights to conditional shares for 2007 (granted in 2008). The variable remuneration for 2011 will be paid in later financial years.
DANSKE BANK / GROUP 2012 71
NO
TE
S – D
AN
SK
E B
AN
K G
RO
UP
NOTES – DANSKE BANK GROUP

NOTES – DANSKE BANK GROUP
Note
DANSKE BANK ANNUAL REPORT 2012 24
8 Pension and termination (cont'd) Eivind Tonny Thierry Thomas F. Robert Lars Henrik Kolding Andersen Borgen Endersby Mørch Ramlau-Hansen
Annual Bank contributes Bank contributes Bank contributes Bank contributes
contribution - 20% of salary p.a. 20% of salary p.a. - 20% of salary p.a. 22% of salary p.a.
Notice of termination
by Danske Bank 18 months 18 months 18 months 18 months 18 months 18 months
Notice of termination by the board member 12 months 9 months 9 months 9 months 9 months 9 months
Remuneration of other material risk takers For 2012, a total of 136 persons were designated as other material risk takers and combined they received remuneration of
DKK 42 million (2011: 140 other material risk takers and remuneration of DKK 377 million), with fixed remuneration amounting to DKK 258 million and variable remuneration amounting to DKK 16 million (2011: DKK 245 million and DKK 132 million). 6
4
Of the above remuneration for 2012, the Parent Company, Danske Bank A/S, paid DKK 355 million to 101 other material risk takers (2011: DKK 329 million to 113 other material risk takers), with fixed remuneration amounting to DKK 197 million and variable remu-neration amounting to DKK 1 million (2011: DKK 204 million and DKK 125 million). 58 The Group’s pension obligations towards other material risk takers amounted to DKK 34 million at year-end 2012 (31 December 2011: DKK 54 million). Shareholdings The number of Danske Bank shares, excluding options and rights to buy conditional shares, held by the Board of Directors and the Executive Board at 31 December 2012 totalled 73,964 and 103,941, respectively (31 December 2011: 160,700 and 144,787). Note 41, Danske Bank shares held by the Board of Directors and the Executive Board, provides additional details. Share-based payment Until 2008, the Group offered senior staff and selected employees incentive programmes that consisted of share options and rights to conditional shares. Incentive payments reflected individual performance and also depended on financial results and other measures of value creation for a given year. Options and rights were granted in the first quarter of the year following the year in which they were earned.
Issued options carry a right to buy Danske Bank shares exercisable from three to seven years after options are granted provided that the employee, with the exception of retirement, has not resigned from the Group. The exercise price of the options is computed as the average price of Danske Bank shares for 20 stock exchange days after the release of the annual report plus 10%. The fair value of the share options is calculated according to a dividend-adjusted Black & Scholes formula. Calculation of the fair value at the end of 2012 is based on the following assumptions: Share price: 96 (2011: 73). Dividend payout ratio: 2.5% (2011: 2.5%). Rate of interest: 0.2-0.3% (2011: 0.8-0.9%), equal to the swap rate. Volatility: 35% (2011: 50%). Average time of exercise: 0-1 year (2011: 0-2 years). The volatility estimate is based on historical volatility. Effective from 2010, the Group has granted rights to conditional shares to the Executive Board and selected managers and special-ists as part of the variable remuneration.
72 DANSKE BANK / GROUP 2012
NOTES – DANSKE BANK GROUP

NOTES – DANSKE BANK GROUP
Note
DANSKE BANK ANNUAL REPORT 2012 24
8 Pension and termination (cont'd) Eivind Tonny Thierry Thomas F. Robert Lars Henrik Kolding Andersen Borgen Endersby Mørch Ramlau-Hansen
Annual Bank contributes Bank contributes Bank contributes Bank contributes
contribution - 20% of salary p.a. 20% of salary p.a. - 20% of salary p.a. 22% of salary p.a.
Notice of termination
by Danske Bank 18 months 18 months 18 months 18 months 18 months 18 months
Notice of termination by the board member 12 months 9 months 9 months 9 months 9 months 9 months
Remuneration of other material risk takers For 2012, a total of 136 persons were designated as other material risk takers and combined they received remuneration of
DKK 42 million (2011: 140 other material risk takers and remuneration of DKK 377 million), with fixed remuneration amounting to DKK 258 million and variable remuneration amounting to DKK 16 million (2011: DKK 245 million and DKK 132 million). 6
4
Of the above remuneration for 2012, the Parent Company, Danske Bank A/S, paid DKK 355 million to 101 other material risk takers (2011: DKK 329 million to 113 other material risk takers), with fixed remuneration amounting to DKK 197 million and variable remu-neration amounting to DKK 1 million (2011: DKK 204 million and DKK 125 million). 58 The Group’s pension obligations towards other material risk takers amounted to DKK 34 million at year-end 2012 (31 December 2011: DKK 54 million). Shareholdings The number of Danske Bank shares, excluding options and rights to buy conditional shares, held by the Board of Directors and the Executive Board at 31 December 2012 totalled 73,964 and 103,941, respectively (31 December 2011: 160,700 and 144,787). Note 41, Danske Bank shares held by the Board of Directors and the Executive Board, provides additional details. Share-based payment Until 2008, the Group offered senior staff and selected employees incentive programmes that consisted of share options and rights to conditional shares. Incentive payments reflected individual performance and also depended on financial results and other measures of value creation for a given year. Options and rights were granted in the first quarter of the year following the year in which they were earned.
Issued options carry a right to buy Danske Bank shares exercisable from three to seven years after options are granted provided that the employee, with the exception of retirement, has not resigned from the Group. The exercise price of the options is computed as the average price of Danske Bank shares for 20 stock exchange days after the release of the annual report plus 10%. The fair value of the share options is calculated according to a dividend-adjusted Black & Scholes formula. Calculation of the fair value at the end of 2012 is based on the following assumptions: Share price: 96 (2011: 73). Dividend payout ratio: 2.5% (2011: 2.5%). Rate of interest: 0.2-0.3% (2011: 0.8-0.9%), equal to the swap rate. Volatility: 35% (2011: 50%). Average time of exercise: 0-1 year (2011: 0-2 years). The volatility estimate is based on historical volatility. Effective from 2010, the Group has granted rights to conditional shares to the Executive Board and selected managers and special-ists as part of the variable remuneration.
NOTES – DANSKE BANK GROUP
Note
DANSKE BANK ANNUAL REPORT 2012 25
Rights to Danske Bank shares under the conditional share programme vest up to five years after being granted provided that the em-ployee, with the exception of retirement, has not resigned from the Group. In addition to this requirement, rights to shares earned in 2011 and 2012 vest only if the Group as a whole and the employee’s department meet certain performance targets within the next five years.
The fair value of the conditional shares is calculated as the share price less the payment made by the employee. The intrinsic value is expensed in the year in which the share options and rights to conditional shares are earned, while the time value is accrued over the remaining service period, which is the vesting period of up to five years. Shareholders’ equity will increase corre-spondingly as the obligation is met by settlement in Danske Bank shares.
Share options Number Fair value (FV)
Executive Other Exercise At issue End of year Board staff Total price (DKK) (DKK m) (DKK m)
Granted in 2004-08 1 January 2011 1,179,601 8,242,705 9,422,306 157.1-294.1 195.2 50.5 Exercised 2011 - - - -
Forfeited 2011 -199,861 -842,972 -1,042,833
Other changes 2011 232,008 492,959 724,967
31 December 2011 1,211,748 7,892,692 9,104,440 176.0-272.2 191.6 5.1
Exercised 2012 - - - -
Forfeited 2012 -393,483 -2,269,736 -2,663,219
Other changes 2012 -358,744 358,744 -
31 December 2012 459,521 5,981,700 6,441,221 183.0-272.2 150.9 1.6
Holdings of the Executive Board and fair value, 31 December 2012 Grant year 2006-2008 (DKK millions) Number FV
Eivind Kolding - - Tonny Thierry Andersen 156,132 0.0 Thomas F. Borgen 150,685 0.0 Robert Endersby - - Lars Mørch 90,254 0.0 Henrik Ramlau-Hansen 62,450 0.0 Holdings of the Executive Board and fair value, 31 December 2011 Grant year 2005-2008
(DKK millions) Number FV
Peter Straarup 460,642 0.3 Tonny Thierry Andersen 218,136 0.1 Thomas F. Borgen 210,195 0.1
Georg Schubiger 20,100 0.0 Henrik Ramlau-Hansen 104,967 0.1 Per Skovhus 197,708 0.1
Share options were granted in 2008 or earlier. The number of shares held and the exercise price have been adjusted to reflect the share capital increase in April 2011. No share options were exercised in 2012 and 2011.
8 (cont'd)
DANSKE BANK / GROUP 2012 73
NO
TE
S – D
AN
SK
E B
AN
K G
RO
UP
NOTES – DANSKE BANK GROUP

NOTES – DANSKE BANK GROUP
Note
DANSKE BANK ANNUAL REPORT 2012 26
8
(cont'd) Conditional shares Number Fair value (FV)
Executive Other
Employee payment At issue
End of year
Board staff Total price (DKK) (DKK m) (DKK m)
Granted in 2008
1 January 2011 22,934 833,568 856,502 1.8 154.0 120.9
Vested 2011 -25,183 -827,797 -852,980 1.8
Forfeited 2011 - -3,522 -3,522
Other changes 2011 2,249 -2,249 -
31 December 2011 - - -
Granted in 2011
Granted 2011 - 1,088,786 1,088,786 1.2 135.7 78.1
Vested 2011 - -3,050 -3,050 1.2
Forfeited 2011 - -8,209 -8,209
31 December 2011 - 1,077,527 1,077,527 1.2 134.3 77.3
Vested 2012 - - - -
Forfeited 2012 - -32,763 -32,763
Other changes 2012 - - -
31 December 2012 - 1,044,764 1,044,764 1.2 130.3 98.7
Granted in 2012
Granted 2012 6,905 1,479,744 1,486,649 0.0-0.9 136.4 140.8
Vested 2012 -1,313 -226,127 -227,440 0.0-0.9
Forfeited 2012 - -23,798 -23,798
Other changes 2012 10,172 -10,172 -
31 December 2012 15,764 1,219,647 1,235,411 0.0-0.9 113.3 117.0
Holdings of the Executive Board and fair value, 31 December 2012
Grant year 2012
(DKK millions) Number FV
Eivind Kolding - -
Tonny Thierry Andersen 1,834 0.2
Thomas F. Borgen 1,899 0.2
Robert Endersby - -
Lars Mørch 10,251 1.0
Henrik Ramlau-Hansen 1,780 0.2
In 2012, the average price at the vesting date for rights to conditional shares was DKK 98.3 (2011: DKK 125.7).
Holdings of the Executive Board and fair value, 31 December 2011
At the end of 2011, the Executive Board had no holdings of conditional shares.
74 DANSKE BANK / GROUP 2012
NOTES – DANSKE BANK GROUP

NOTES – DANSKE BANK GROUP
Note
DANSKE BANK ANNUAL REPORT 2012 26
8
(cont'd) Conditional shares Number Fair value (FV)
Executive Other
Employee payment At issue
End of year
Board staff Total price (DKK) (DKK m) (DKK m)
Granted in 2008
1 January 2011 22,934 833,568 856,502 1.8 154.0 120.9
Vested 2011 -25,183 -827,797 -852,980 1.8
Forfeited 2011 - -3,522 -3,522
Other changes 2011 2,249 -2,249 -
31 December 2011 - - -
Granted in 2011
Granted 2011 - 1,088,786 1,088,786 1.2 135.7 78.1
Vested 2011 - -3,050 -3,050 1.2
Forfeited 2011 - -8,209 -8,209
31 December 2011 - 1,077,527 1,077,527 1.2 134.3 77.3
Vested 2012 - - - -
Forfeited 2012 - -32,763 -32,763
Other changes 2012 - - -
31 December 2012 - 1,044,764 1,044,764 1.2 130.3 98.7
Granted in 2012
Granted 2012 6,905 1,479,744 1,486,649 0.0-0.9 136.4 140.8
Vested 2012 -1,313 -226,127 -227,440 0.0-0.9
Forfeited 2012 - -23,798 -23,798
Other changes 2012 10,172 -10,172 -
31 December 2012 15,764 1,219,647 1,235,411 0.0-0.9 113.3 117.0
Holdings of the Executive Board and fair value, 31 December 2012
Grant year 2012
(DKK millions) Number FV
Eivind Kolding - -
Tonny Thierry Andersen 1,834 0.2
Thomas F. Borgen 1,899 0.2
Robert Endersby - -
Lars Mørch 10,251 1.0
Henrik Ramlau-Hansen 1,780 0.2
In 2012, the average price at the vesting date for rights to conditional shares was DKK 98.3 (2011: DKK 125.7).
Holdings of the Executive Board and fair value, 31 December 2011
At the end of 2011, the Executive Board had no holdings of conditional shares.
NOTES – DANSKE BANK GROUP
Note (DKK millions) 2012 2011
DANSKE BANK ANNUAL REPORT 2012 27
9 Audit fees Audit firms appointed by the general meeting
Fees for statutory audit of the consolidated and parent company financial statements 12 17
Fees for other assurance engagements 2 4
Fees for tax advisory services 4 2
Fees for other services 3 10
Total 21 33 Other audit firms
Fees for statutory audit of the consolidated and parent company financial statements 1 3
Total 22 36
Costs for the internal audit department are recognised under Staff costs and administrative expenses. 10 Amortisation, depreciation and impairment charges
Amortisation charges for intangible assets 340 953
Depreciation charges for tangible assets 1,274 1,329
Write-offs of residual value of lease assets sold 857 978
Impairment charges for intangible assets 977 175
Impairment charges for tangible assets 244 80
Reversals of impairment charges for tangible assets - 64
Total 3,692 3,451
Notes 22 and 24 provide more information about impairment charges for intangible and tangible assets.
11 Loan impairment charges
Due from credit institutions and central banks -2 7
Loans and advances at amortised cost 10,197 11,806
Loans at fair value 1,405 1,269
Other liabilities 929 103
Total 12,529 13,185 New and increased impairment charges 20,866 20,900
Reversals of impairment charges 8,722 6,347 Write-offs charged directly to income statement 1,356 1,015 Received on claims previously written off 796 2,277
Interest income, effective interest method -175 -106
Total 12,529 13,185
Received on claims previously written off in 2011 includes a compensation of DKK 0.8 billion for the termination of a credit default
swap covering potential losses on mortgage lending.
Loan impairment charges broken down by business unit
Retail Banking Denmark 3,918 4,316
Retail Banking Finland 366 187
Retail Banking Sweden 414 202
Retail Banking Norway 219 380
Banking Activities Northern Ireland 1,425 2,178
Banking Activities Ireland* 661 6,334
Banking Activities Baltics -431 -255
Other Banking Activities 64 155 Corporate & Institutional Banking 1,094 744 Non core Ireland* 4,921 -
Danske Markets and Treasury -99 -1,033 Danske Capital -23 -23
Total 12, 13,529 185
* Non-core Ireland was separated from Banking Activities Ireland in 2012.
DANSKE BANK / GROUP 2012 75
NO
TE
S – D
AN
SK
E B
AN
K G
RO
UP
NOTES – DANSKE BANK GROUP

NOTES – DANSKE BANK GROUP
Note (DKK millions)
DANSKE BANK ANNUAL REPORT 2012 29
12 Tax 2012 Denmark Finland Sweden Norway UK Ireland Other Total
Tax on profit for the year 1,410 332 826 703 71 297 180 3,819
Tax on changes in shareholders' equity -57 - - - - - - -57
Tax on profit for the year
Current tax charge 109 361 817 536 -2 2 131 1,954
Transferred to other comprehensive income -88 - - - - - - -88
Change in deferred tax 1,417 -61 39 168 -31 - 37 1,569
Adjustment of prior-year tax charges -28 32 -4 -1 4 295 12 310
Change in deferred tax charge as a result of lowered tax rate - - -26 - 100 - - 74
Total 1,410 332 826 703 71 297 180 3,819 Effective tax rate
Tax rate 25.0 24.5 26.3 28.0 24.5 12.5 15.8 33.1
Non-taxable income and non-deductible expenses -0.6 -1.0 0.3 -1.7 -9.6 -12.5 -1.2 7.0
Tax on profit for the year 24.4 23.5 26.6 26.3 14.9 - 14.6 40.1
Adjustment of prior-year tax charges -0.5 2.5 -0.1 -0.1 -6.3 -5.4 1.1 3.6
Change in deferred tax charge as a result of lowered tax rate - - -0.8 - -110.8 - - 0.9
Effective tax rate 23.9 26.0 25.7 26.2 -102.2 -5.4 15.7 44.6
Tax on other comprehensive income Hedging of units outside Denmark -94 - - - - - - -94
Unrealised value adjustments of available-for-sale financial assets 151 - - - - - - 151
Realised value adjustments of available-for-sale financial assets 31 - - - - - - 31
Total 88 - - - - - - 88
76 DANSKE BANK / GROUP 2012
NOTES – DANSKE BANK GROUP
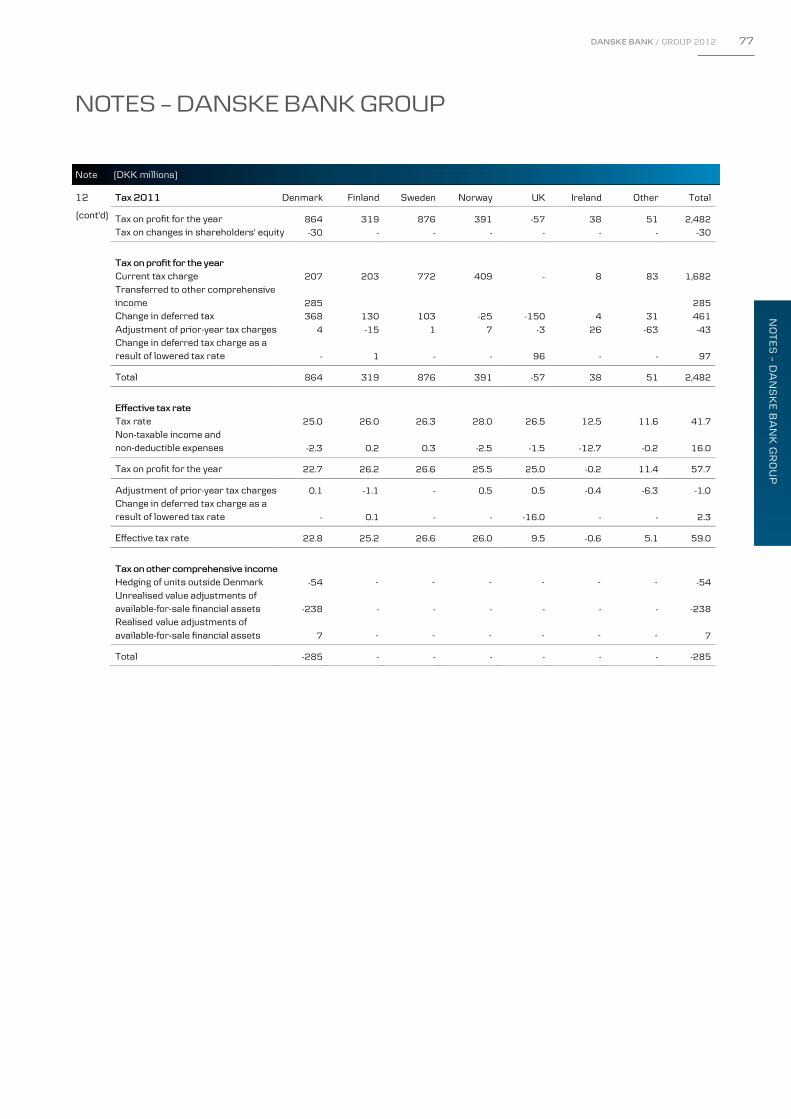
NOTES – DANSKE BANK GROUP
Note (DKK millions)
DANSKE BANK ANNUAL REPORT 2012 29
12 Tax 2012 Denmark Finland Sweden Norway UK Ireland Other Total
Tax on profit for the year 1,410 332 826 703 71 297 180 3,819
Tax on changes in shareholders' equity -57 - - - - - - -57
Tax on profit for the year
Current tax charge 109 361 817 536 -2 2 131 1,954
Transferred to other comprehensive income -88 - - - - - - -88
Change in deferred tax 1,417 -61 39 168 -31 - 37 1,569
Adjustment of prior-year tax charges -28 32 -4 -1 4 295 12 310
Change in deferred tax charge as a result of lowered tax rate - - -26 - 100 - - 74
Total 1,410 332 826 703 71 297 180 3,819 Effective tax rate
Tax rate 25.0 24.5 26.3 28.0 24.5 12.5 15.8 33.1
Non-taxable income and non-deductible expenses -0.6 -1.0 0.3 -1.7 -9.6 -12.5 -1.2 7.0
Tax on profit for the year 24.4 23.5 26.6 26.3 14.9 - 14.6 40.1
Adjustment of prior-year tax charges -0.5 2.5 -0.1 -0.1 -6.3 -5.4 1.1 3.6
Change in deferred tax charge as a result of lowered tax rate - - -0.8 - -110.8 - - 0.9
Effective tax rate 23.9 26.0 25.7 26.2 -102.2 -5.4 15.7 44.6
Tax on other comprehensive income Hedging of units outside Denmark -94 - - - - - - -94
Unrealised value adjustments of available-for-sale financial assets 151 - - - - - - 151
Realised value adjustments of available-for-sale financial assets 31 - - - - - - 31
Total 88 - - - - - - 88
NOTES – DANSKE BANK GROUP
Note (DKK millions)
DANSKE BANK ANNUAL REPORT 2012 30
12 Tax 2011 Denmark Finland Sweden Norway UK Ireland Other Total
(cont'd) Tax on profit for the year 864 319 876 391 -57 38 51 2,482
Tax on changes in shareholders' equity -30 - - - - - - -30
Tax on profit for the year
Current tax charge 207 203 772 409 - 8 83 1,682
Transferred to other comprehensive income 285 285
Change in deferred tax 368 130 103 -25 -150 4 31 461
Adjustment of prior-year tax charges 4 -15 1 7 -3 26 -63 -43
Change in deferred tax charge as a result of lowered tax rate - 1 - - 96 - - 97
Total 864 319 876 391 -57 38 51 2,482
Effective tax rate
Tax rate 25.0 26.0 26.3 28.0 26.5 12.5 11.6 41.7
Non-taxable income and
non-deductible expenses -2.3 0.2 0.3 -2.5 -1.5 -12.7 -0.2 16.0
Tax on profit for the year 22.7 26.2 26.6 25.5 25.0 -0.2 11.4 57.7
Adjustment of prior-year tax charges 0.1 -1.1 - 0.5 0.5 -0.4 -6.3 -1.0
Change in deferred tax charge as a result of lowered tax rate - 0.1 - - -16.0 - - 2.3
Effective tax rate 22.8 25.2 26.6 26.0 9.5 -0.6 5.1 59.0
Tax on other comprehensive income Hedging of units outside Denmark -54 - - - - - - -54
Unrealised value adjustments of available-for-sale financial assets -238 - - - - - - -238
Realised value adjustments of available-for-sale financial assets 7 - - - - - - 7
Total -285 - - - - - - -285
DANSKE BANK / GROUP 2012 77
NO
TE
S – D
AN
SK
E B
AN
K G
RO
UP
NOTES – DANSKE BANK GROUP

NOTES – DANSKE BANK GROUP
Note (DKK millions) 2012 2011
DANSKE BANK ANNUAL REPORT 2012 31
13 Cash in hand and demand deposits with central banks Cash in hand 11,235 10,602 Demand deposits with central banks 86,032 18,015 Total 97,267 28,617 14 Due from credit institutions and central banks Reverse transactions 86,989 106,829 Other amounts due 113,748 74,134 Impairment charges 91 93
Total 200,646 180,870
Impairment charges
At 1 January 93 87
New and increased impairment charges 4 7
Reversals of impairment charges 6 2
Foreign currency translation - 1
At 31 December 91 93
Amounts due within three months totalled DKK 198,989 million (31 December 2011: DKK 177,680 million). This amount is included in the cash flow statement under Cash and cash equivalents.
15 Trading portfolio assets Derivatives with positive fair value 408,990 550,970 Listed bonds 394,270 349,079 Unlisted bonds 6,471 9,015 Listed shares 2,635 316 Unlisted shares 561 375 Total 812,927 909,755 Trading portfolio liabilities
Derivatives with negative fair value 388,696 534,061 Obligations to repurchase securities 143,164 163,852 Total 531,860 697,913
Trading portfolio assets and liabilities are measured at fair value through profit or loss.
78 DANSKE BANK / GROUP 2012
NOTES – DANSKE BANK GROUP

NOTES – DANSKE BANK GROUP
Note (DKK millions) 2012 2011
DANSKE BANK ANNUAL REPORT 2012 31
13 Cash in hand and demand deposits with central banks Cash in hand 11,235 10,602 Demand deposits with central banks 86,032 18,015 Total 97,267 28,617 14 Due from credit institutions and central banks Reverse transactions 86,989 106,829 Other amounts due 113,748 74,134 Impairment charges 91 93
Total 200,646 180,870
Impairment charges
At 1 January 93 87
New and increased impairment charges 4 7
Reversals of impairment charges 6 2
Foreign currency translation - 1
At 31 December 91 93
Amounts due within three months totalled DKK 198,989 million (31 December 2011: DKK 177,680 million). This amount is included in the cash flow statement under Cash and cash equivalents.
15 Trading portfolio assets Derivatives with positive fair value 408,990 550,970 Listed bonds 394,270 349,079 Unlisted bonds 6,471 9,015 Listed shares 2,635 316 Unlisted shares 561 375 Total 812,927 909,755 Trading portfolio liabilities
Derivatives with negative fair value 388,696 534,061 Obligations to repurchase securities 143,164 163,852 Total 531,860 697,913
Trading portfolio assets and liabilities are measured at fair value through profit or loss.
NOTES – DANSKE BANK GROUP
Note
DANSKE BANK ANNUAL REPORT 2012 32
Derivatives
The Group’s activities in the financial markets include trading in derivatives. Derivatives are financial instruments whose value de-pends on the value of an underlying instrument or index, etc. Derivatives can be used to manage market risk exposure, for example. The Group trades a considerable volume of the most commonly used interest rate, currency and equity derivatives, including • swaps • forwards and futures • options Furthermore, the Group trades a limited number of swaps whose value depends on developments in specific credit or commodity risks, or inflation indices. The Group trades derivatives for three main purposes: First, customers are offered derivatives as individual transactions or as inte-gral parts of other services, such as the issuance of bonds with yields that depend on developments in equity or currency indices. Second, the Group trades derivatives through its own trading portfolio. Third, derivatives are used for managing the Group’s own ex-posure to foreign exchange, interest rate, equity market and credit risks. The risk management notes provide additional information about the Group’s risk management policy. Danske Markets is responsible for the day-to-day management and hedging of the Group’s market risks.
Derivatives are recognised and measured at fair value. Interest on some of the Group’s bank loans, advances, deposits, issued bonds, etc. is added at fixed rates. Generally, such fixed-rate items are carried at amortised cost. In accordance with general accounting standards, the fair value of the interest rate risk on fixed-rate loans, for example, is not included in the income statement as opposed to changes in the fair value of hedging derivatives. In addition, the Group classifies certain bonds as available-for-sale financial assets. Unrealised value adjustments of such bonds are recognised in Other comprehensive income. The Group uses fair value hedge ac-counting if the interest rate risk on fixed-rate financial assets and liabilities or bonds available for sale is hedged by derivatives. Fair value hedge accounting The interest rate risk on fixed-rate assets and liabilities with terms longer than six months is generally hedged by derivatives. The in-terest rate risk on fixed-rate loans and advances extended by the Group’s operations in Finland, Northern Ireland and Ireland is, how-ever, hedged by core free funds. Any interest rate risk not hedged by core free funds is hedged by derivatives. For hedged assets and liabilities to which a fixed rate of interest applies for a specified period of time starting at the commencement date of the agreement, future interest payments are divided into basic interest and a profit margin and into periods of time. By enter-ing into swaps or forwards with matching payment profiles in the same currencies and for the same periods, the Group hedges the risk from the commencement date. The fair values of the hedged interest rate risk and the hedging derivatives are measured at fre-quent intervals to ensure that changes in the fair value of the hedged interest rate risk lie within a band of 80-125% of the changes in the fair value of the hedging derivatives. Portfolios of hedging derivatives are adjusted if necessary. With effective hedging, the hedged interest rate risk on hedged assets and liabilities is measured at fair value and recognised as a value adjustment of the hedged items. Value adjustments are carried in the income statement under Net trading income. Any ineffec-tive portion of a hedge that lies within the range for effective hedging is therefore also included under Net trading income. At the end of 2012, the carrying amounts of effectively hedged fixed-rate financial assets and liabilities were DKK 87,106 million (31 December 2011: DKK 68,815 million) and DKK 649,165 million (31 December 2011: DKK 676,546 million), respectively. The table below shows the value adjustments of these assets and liabilities and the hedging derivatives. The value adjustments are recognised in the income statement as Net trading income.
The Group hedges the foreign exchange risk of net investments in branches and subsidiaries outside Denmark by establishing financ-ing arrangements in the matching currencies. The Group does not hedge these units’ expected financial results or other future trans-actions. The foreign exchange adjustments of the investments are recognised in Other comprehensive income together with the for-eign exchange adjustments of the financing arrangements designated as hedging of exchange rate fluctuations. The statement of comprehensive income shows the translation amounts. At the end of 2012, the carrying amount of financing arrangements in foreign currency used to hedge net investments in units outside Denmark amounted to DKK 50,990 million (31 December 2011:
lion). DKK 50,329 mil
15 (cont'd)
DANSKE BANK / GROUP 2012 79
NO
TE
S – D
AN
SK
E B
AN
K G
RO
UP
NOTES – DANSKE BANK GROUP

NOTES – DANSKE BANK GROUP
Note (DKK millions) 2012 2011
DANSKE BANK ANNUAL REPORT 2012 33
Effect of interest rate hedging on profit
Effect of fixed-rate asset hedging on profit Hedged amounts due from credit institutions -2 -3
Hedged loans and advances 491 977
Hedged bonds available for sale 150 735
Hedging derivatives -639 -1,714
Total - -5
Effect of fixed-rate liability hedging on profit Hedged amounts due to credit institutions -6 -7
Hedged deposits 146 -245
Hedged issued bonds -3,890 -6,198
Hedged subordinated debt 605 -1,006
Hedging derivatives 3,151 7,466
Total 6 10
Derivatives Positive fair value Negative fair value 2012 2011 2012 2011
Derivatives with positive or negative fair value 711,023 550,970 690,729 534,061
Netting (under accounting rules) 302,033 302,033
Carrying amount 408,990 550,970 388,696 534,061
Netting (under capital adequacy rules) 303,974 451,714 303,974 451,714
Derivatives after netting (under capital adequacy rules) 105,016 99,256 84,722 82,347
Positive and negative fair values of derivatives are recognised if the Group has agreed with a counterparty to net contractual cash flows and to make cash payments or provide cash collateral on a daily basis to cover changes in the fair value of the derivative. The in-crease in netting for accounting purposes is attributable to an increase in the use of clearing centres and the use of similar bilateral arrangements. In addition, the Group has entered into master netting or similar agreements that include rights to additional set-off in the event of counterparty default. Such agreements reduce the exposure further under capital adequacy rules, as reflected in the ta-ble above, but they do not qualify for netting under IFRS accounting rules. Derivatives 2012 2011
Notional Positive Negative Notional Positive Negative amount fair value fair value amount fair value fair value
Currency contracts
Forwards and swaps 6,968,326 93,913 98,544 7,002,857 106,715 107,238
Options 76,683 825 835 149,690 1,139 1,201
Interest rate contracts
Forwards/swaps/FRAs 29,179,318 241,092 248,941 27,823,811 366,781 379,448
Options 1,349,980 31,707 25,944 2,266,524 34,632 30,447
Equity contracts
Forwards 60,508 385 394 56,845 543 513
Options 101,992 1,339 1,338 155,531 1,413 1,410
Other contracts
Commodity contracts 10,621 802 748 17,276 868 754
Credit derivatives bought 9,245 228 67 10,175 228 67
Credit derivatives sold 8,319 175 51 9,864 71 224
Total derivatives held for trading purposes 370,466 376,862 512,390 521,302
Hedging derivatives
Currency contracts 157,283 1,580 596 206,224 1,495 1,179
Interest rate contracts 653,672 36,944 11,238 577,570 37,085 11,580
Total derivatives 408,990 388,696 550,970 534,061
15 (cont'd)
- -
80 DANSKE BANK / GROUP 2012
NOTES – DANSKE BANK GROUP

NOTES – DANSKE BANK GROUP
Note (DKK millions) 2012 2011
DANSKE BANK ANNUAL REPORT 2012 33
Effect of interest rate hedging on profit
Effect of fixed-rate asset hedging on profit Hedged amounts due from credit institutions -2 -3
Hedged loans and advances 491 977
Hedged bonds available for sale 150 735
Hedging derivatives -639 -1,714
Total - -5
Effect of fixed-rate liability hedging on profit Hedged amounts due to credit institutions -6 -7
Hedged deposits 146 -245
Hedged issued bonds -3,890 -6,198
Hedged subordinated debt 605 -1,006
Hedging derivatives 3,151 7,466
Total 6 10
Derivatives Positive fair value Negative fair value 2012 2011 2012 2011
Derivatives with positive or negative fair value 711,023 550,970 690,729 534,061
Netting (under accounting rules) 302,033 302,033
Carrying amount 408,990 550,970 388,696 534,061
Netting (under capital adequacy rules) 303,974 451,714 303,974 451,714
Derivatives after netting (under capital adequacy rules) 105,016 99,256 84,722 82,347
Positive and negative fair values of derivatives are recognised if the Group has agreed with a counterparty to net contractual cash flows and to make cash payments or provide cash collateral on a daily basis to cover changes in the fair value of the derivative. The in-crease in netting for accounting purposes is attributable to an increase in the use of clearing centres and the use of similar bilateral arrangements. In addition, the Group has entered into master netting or similar agreements that include rights to additional set-off in the event of counterparty default. Such agreements reduce the exposure further under capital adequacy rules, as reflected in the ta-ble above, but they do not qualify for netting under IFRS accounting rules. Derivatives 2012 2011
Notional Positive Negative Notional Positive Negative amount fair value fair value amount fair value fair value
Currency contracts
Forwards and swaps 6,968,326 93,913 98,544 7,002,857 106,715 107,238
Options 76,683 825 835 149,690 1,139 1,201
Interest rate contracts
Forwards/swaps/FRAs 29,179,318 241,092 248,941 27,823,811 366,781 379,448
Options 1,349,980 31,707 25,944 2,266,524 34,632 30,447
Equity contracts
Forwards 60,508 385 394 56,845 543 513
Options 101,992 1,339 1,338 155,531 1,413 1,410
Other contracts
Commodity contracts 10,621 802 748 17,276 868 754
Credit derivatives bought 9,245 228 67 10,175 228 67
Credit derivatives sold 8,319 175 51 9,864 71 224
Total derivatives held for trading purposes 370,466 376,862 512,390 521,302
Hedging derivatives
Currency contracts 157,283 1,580 596 206,224 1,495 1,179
Interest rate contracts 653,672 36,944 11,238 577,570 37,085 11,580
Total derivatives 408,990 388,696 550,970 534,061
15 (cont'd)
- -
NOTES – DANSKE BANK GROUP
Note (DKK millions) 2012 2011
DANSKE BANK ANNUAL REPORT 2012 34
16 Investment securities
Financial assets at fair value through profit or loss
Listed bonds 30,309 24,686
Unlisted bonds 45 -
Listed shares 52 134
Unlisted shares 3,032 2,586
Total financial assets at fair value 33,438 27,406
Available-for-sale financial assets
Listed bonds 65,976 70,460
Total available-for-sale financial assets 65,976 70,460
Total at fair value 99,414 97,866
Held-to-maturity financial assets
Listed bonds 7,710 11,398
Unlisted bonds 600
Total investment securities 107,724 109,264
Bonds held for trading reclassified as available-for-sale financial assets Owing to significant distortion of the pricing of bonds, in 2008, the Group reclassified bonds at a nominal value of DKK 120,607 mil-lion and a fair value of DKK 116,722 million in the held-for-trading category as available-for-sale financial assets. The portfolio of available-for-sale assets comprises primarily Danish mortgage bonds and foreign covered bonds. Some 84% of the portfolio is rated AA or higher, while the remaining portfolio has investment grade ratings. The portfolio did not include government bonds issued by Ireland, Portugal, Italy, Greece or Spain. At the end of 2012, the fair value of the bonds in the portfolio was DKK 65,976 million (31 December 2011: DKK 70,460 million). In 2012, the Group recognised unrealised value adjustments of the reclassified bonds in the amount of DKK 150 million in the income statement, corresponding to the part of the interest rate risk that is hedged by derivatives (2011: DKK 735 million). The Group recognised unrealised value adjustments of DKK 605 million (2011: DKK -951 million) in Other comprehensive income that would have been recognised in the income statement if reclassification had not taken place. From 2009 onwards, the distortion has diminished, and the Group has sold part of the portfolio. For the part of the portfolio sold in 2012, the Group realised value adjustments of DKK -125 million (2011: DKK 28 million) that were reclassified from Other comprehensive in-come to the income statement. The Group recognised interest income of DKK 1,352 million (2011: DKK 1,884 million) on the re-classified bonds. Held-to-maturity financial assets Held-to-maturity financial assets consists of bonds with quoted prices in an active market held for the purpose of generating a return until maturity. The bonds, primarily government bonds and government t-folio did not include government bonds issued by Ireland, Portugal, Italy, Greece or Spain.
-guaranteed bonds, are measured at amortised cost. The por
17 Loans and advances at amortised cost Reverse transactions 220,188 149,198
Other loans and advances 984,207 1,022,228
Impairment charges 42,579 44,944
Total 1,161,816 1,126,482
Impairment charges
At 1 January 44,944 37,630 New and increased impairment charges 17,800 18,900 Reversals of impairment charges 7,796 5,902 Write-offs debited to allowance account 13,038 6,277 Foreign currency translation 350 199 Other additions and disposals 319 394
At 31 December 42,579 44,944
-
DANSKE BANK / GROUP 2012 81
NO
TE
S – D
AN
SK
E B
AN
K G
RO
UP
NOTES – DANSKE BANK GROUP

NOTES – DANSKE BANK GROUP
Note (DKK millions) 2012 2011
DANSKE BANK ANNUAL REPORT 2012 34
18 Loans at fair value and bonds issued by Realkredit Danmark
Loans at fair value consists of loans granted by Realkredit Danmark under Danish mortgage finance law. The loans are funded by issuing listed mortgage bonds with matching terms. Borrowers may repay such loans by delivering the underlying bonds to Realkredit Danmark. The Group buys and sells bonds issued by Realkredit Danmark on an ongoing basis because such securities play a role in the Danish money market. If these loans and bonds were measured at amortised cost, the purchase and sale of own mortgage bonds would result in timing differences in the recognition of gains and losses, leading to an accounting mismatch. This is avoided by measuring both loans pro-vided by Realkredit Danmark and bonds issued by Realkredit Danmark at fair value using the fair value option. The accounting policies in note 45 provide additional information.
Loans at fair value
Nominal value 713,397 705,339
Fair value adjustment of underlying bonds 22,465 18,069
Adjustment for credit risk 3,100 2,667
Total 732,762 720,741
Bonds issued by Realkredit Danmark
Nominal value 932,639 914,702
Fair value adjustment of funding of current loans 23,157 19,398
Fair value adjustment of block issues and pre-issued bonds - -
Holding of own mortgage bonds 341,471 376,401
Total 614,325 557,699
Measurement of the loans is based on the quoted price of the underlying Realkredit Danmark bonds that borrowers use to repay the loans. Changes in the market value of the bonds will therefore result in a corresponding change in the value of loans, and profit or loss will therefore not be affected by current market value changes in respect of the interest rate and the credit risk on the issued bonds. The value of the loans is also affected by changes in the credit risk on the loans. In 2012, the Group expensed DKK 608 million regarding changes in the credit risk on loans at fair value (2011: DKK 236 million). At the end of 2012, the accumulated changes in the credit risk amounted to DKK 3,100 million (31 December 2011: DKK 2,667 million).
The holding of own mortgage bonds includes pre-issued bonds of DKK 164 billion (2011: DKK 176 billion) used for FlexLån® refinancing in January 2013 and bonds of DKK 31 billion (2011: DKK 25 billion) recognised under Assets under insurance contracts and Assets under pooled schemes and unit-linked investment contracts. The nominal value of bonds issued by Realkredit Danmark equals the amount to be redeemed on maturity. Fair value adjustment for the credit risk on issued mortgage bonds is calculated on the basis of the option-adjusted spread (OAS) to gov-ernment bond yields or, for variable rate loans, the swap rate. The calculation incorporates maturity, nominal holdings and OAS sensitivity. As a number of estimates are made, the calculation is subject to uncertainty. In 2012, the Danish mortgage bond yield spread narrowed, and the fair value of issued mortgage bonds thus increased about DKK 5 billion. In 2011, a spread widening caused a fair value decrease of about DKK 4 billion. In comparison with the fair value measured at the issuance of the bonds, the fair value had increased about DKK 0.5 billion at the end of 2012 (31 December 2011: decreased about
holders’ equity remain unaffected because the spread narrowing increased the fair value of mortgage
DKK 8 billion). The net profit and shareloans correspondingly. Fair value adjustment for the credit risk on issued mortgage bonds may also be calculated on the basis of changes in similar AAA-rated mortgage bonds offered by other Danish issuers. The market for such bonds is characterised by an absence of measurable price differ-ences between bonds with similar characteristics from different issuers. Using this method, no fair value adjustment for credit risk in 2012 or the period since issuance has been required.
82 DANSKE BANK / GROUP 2012
NOTES – DANSKE BANK GROUP

NOTES – DANSKE BANK GROUP
Note (DKK millions) 2012 2011
DANSKE BANK ANNUAL REPORT 2012 34
18 Loans at fair value and bonds issued by Realkredit Danmark
Loans at fair value consists of loans granted by Realkredit Danmark under Danish mortgage finance law. The loans are funded by issuing listed mortgage bonds with matching terms. Borrowers may repay such loans by delivering the underlying bonds to Realkredit Danmark. The Group buys and sells bonds issued by Realkredit Danmark on an ongoing basis because such securities play a role in the Danish money market. If these loans and bonds were measured at amortised cost, the purchase and sale of own mortgage bonds would result in timing differences in the recognition of gains and losses, leading to an accounting mismatch. This is avoided by measuring both loans pro-vided by Realkredit Danmark and bonds issued by Realkredit Danmark at fair value using the fair value option. The accounting policies in note 45 provide additional information.
Loans at fair value
Nominal value 713,397 705,339
Fair value adjustment of underlying bonds 22,465 18,069
Adjustment for credit risk 3,100 2,667
Total 732,762 720,741
Bonds issued by Realkredit Danmark
Nominal value 932,639 914,702
Fair value adjustment of funding of current loans 23,157 19,398
Fair value adjustment of block issues and pre-issued bonds - -
Holding of own mortgage bonds 341,471 376,401
Total 614,325 557,699
Measurement of the loans is based on the quoted price of the underlying Realkredit Danmark bonds that borrowers use to repay the loans. Changes in the market value of the bonds will therefore result in a corresponding change in the value of loans, and profit or loss will therefore not be affected by current market value changes in respect of the interest rate and the credit risk on the issued bonds. The value of the loans is also affected by changes in the credit risk on the loans. In 2012, the Group expensed DKK 608 million regarding changes in the credit risk on loans at fair value (2011: DKK 236 million). At the end of 2012, the accumulated changes in the credit risk amounted to DKK 3,100 million (31 December 2011: DKK 2,667 million).
The holding of own mortgage bonds includes pre-issued bonds of DKK 164 billion (2011: DKK 176 billion) used for FlexLån® refinancing in January 2013 and bonds of DKK 31 billion (2011: DKK 25 billion) recognised under Assets under insurance contracts and Assets under pooled schemes and unit-linked investment contracts. The nominal value of bonds issued by Realkredit Danmark equals the amount to be redeemed on maturity. Fair value adjustment for the credit risk on issued mortgage bonds is calculated on the basis of the option-adjusted spread (OAS) to gov-ernment bond yields or, for variable rate loans, the swap rate. The calculation incorporates maturity, nominal holdings and OAS sensitivity. As a number of estimates are made, the calculation is subject to uncertainty. In 2012, the Danish mortgage bond yield spread narrowed, and the fair value of issued mortgage bonds thus increased about DKK 5 billion. In 2011, a spread widening caused a fair value decrease of about DKK 4 billion. In comparison with the fair value measured at the issuance of the bonds, the fair value had increased about DKK 0.5 billion at the end of 2012 (31 December 2011: decreased about
holders’ equity remain unaffected because the spread narrowing increased the fair value of mortgage
DKK 8 billion). The net profit and shareloans correspondingly. Fair value adjustment for the credit risk on issued mortgage bonds may also be calculated on the basis of changes in similar AAA-rated mortgage bonds offered by other Danish issuers. The market for such bonds is characterised by an absence of measurable price differ-ences between bonds with similar characteristics from different issuers. Using this method, no fair value adjustment for credit risk in 2012 or the period since issuance has been required.
NOTES – DANSKE BANK GROUP
Note (DKK millions)
DANSKE BANK ANNUAL REPORT 2012 35
19 Assets under pooled schemes and unit-linked investment contracts
Pooled schemes
Unit-linked contracts
Total
2012 2011 2012 2011 2012 2011
Assets
Bonds 19,276 21,651 - - 19,276 21,651
Shares 8,188 4,866 - - 8,188 4,866
Unit trust certificates 21,541 17,218 29,071 24,541 50,612 41,759
Cash deposits 665 935 - - 665 935
Total 49,670 44,670 29,071 24,541 78,741 69,211
including
own bonds 6,310 5,564 342 231 6,652 5,795
own shares 134 117 13 6 147 123
other intra-group balances 793 1,051 524 354 1,317 1,405
Total assets 42,433 37,938 28,192 23,950 70,625 61,888
Liabilities
Deposits 49,670 44,670 29,071 24,541 78,741 69,211
DANSKE BANK / GROUP 2012 83
NO
TE
S – D
AN
SK
E B
AN
K G
RO
UP
NOTES – DANSKE BANK GROUP

NOTES – DANSKE BANK GROUP
Note (DKK millions) 2012 2011
DANSKE BANK ANNUAL REPORT 2012 36
20 Assets under insurance contracts
Due from credit institutions 8,378 8,192 Investment securities 241,070 223,153 Holdings in associates (note 21) 789 896 Investment property (note 23) 18,590 18,664 Tangible assets (note 24) 391 429 Reinsurers' share of provisions 2,291 2,210 Other assets 4,398 4,464
Total 275,907 258,008 including
own bonds 24,790 20,980 own shares 196 175 other intra-group balances 9,578 6,185
Total assets 241,343 230,668
Investment securities under insurance contracts Listed bonds 145,459 145,691
Listed shares 13,601 15,691
Unlisted shares 6,640 4,728
Unit trust certificates 66,768 51,257
Other securities 8,602 5,786
Total 241,070 223,153
Liabilities under insurance contracts Life insurance provisions 182,431 181,645
Provisions for unit-linked insurance contracts 67,006 52,116
Collective bonus potential 851 375
Other technical provisions 9,438 9,168
Total provisions for insurance contracts 259,726 243,304
Other liabilities 14,708 13,550
Intra-group balances -7,496 -7,888
Total 266,938 248,966
Provisions for insurance contracts Balance at 1 January 243,304 233,062
Premiums paid 18,663 19,169
Benefits paid -18,800 -16,663
Interest added to policyholders' savings 6,169 2,590
Fair value adjustment 7,896 8,631
Foreign currency translation 652 120
Change in collective bonus potential 477 -1,403
Other changes 1,365 -2,202
Balance at 31 December 259,726 243,304
Reinsurers' share of provisions for insurance contracts Balance at 1 January 2,210 2,042
Premiums paid 112 121
Benefits paid -186 -154
Interest added to policyholders' savings 21 41
Fair value adjustment 129 210
Other changes 5 -50
Balance at 31 December 2,291 2,210
84 DANSKE BANK / GROUP 2012
NOTES – DANSKE BANK GROUP

NOTES – DANSKE BANK GROUP
Note (DKK millions) 2012 2011
DANSKE BANK ANNUAL REPORT 2012 36
20 Assets under insurance contracts
Due from credit institutions 8,378 8,192 Investment securities 241,070 223,153 Holdings in associates (note 21) 789 896 Investment property (note 23) 18,590 18,664 Tangible assets (note 24) 391 429 Reinsurers' share of provisions 2,291 2,210 Other assets 4,398 4,464
Total 275,907 258,008 including
own bonds 24,790 20,980 own shares 196 175 other intra-group balances 9,578 6,185
Total assets 241,343 230,668
Investment securities under insurance contracts Listed bonds 145,459 145,691
Listed shares 13,601 15,691
Unlisted shares 6,640 4,728
Unit trust certificates 66,768 51,257
Other securities 8,602 5,786
Total 241,070 223,153
Liabilities under insurance contracts Life insurance provisions 182,431 181,645
Provisions for unit-linked insurance contracts 67,006 52,116
Collective bonus potential 851 375
Other technical provisions 9,438 9,168
Total provisions for insurance contracts 259,726 243,304
Other liabilities 14,708 13,550
Intra-group balances -7,496 -7,888
Total 266,938 248,966
Provisions for insurance contracts Balance at 1 January 243,304 233,062
Premiums paid 18,663 19,169
Benefits paid -18,800 -16,663
Interest added to policyholders' savings 6,169 2,590
Fair value adjustment 7,896 8,631
Foreign currency translation 652 120
Change in collective bonus potential 477 -1,403
Other changes 1,365 -2,202
Balance at 31 December 259,726 243,304
Reinsurers' share of provisions for insurance contracts Balance at 1 January 2,210 2,042
Premiums paid 112 121
Benefits paid -186 -154
Interest added to policyholders' savings 21 41
Fair value adjustment 129 210
Other changes 5 -50
Balance at 31 December 2,291 2,210
NOTES – DANSKE BANK GROUP
Note (DKK millions) 2012 2011
DANSKE BANK ANNUAL REPORT 2012 37
21 Holdings in associates
Cost at 1 January 741 895
Additions 53 -
Disposals - 154
Cost at 31 December 794 741
Revaluations at 1 January 248 145
Share of profit 166 125
Share of other comprehensive income - -18
Dividends 83 76
Reversals of revaluations -7 72
Revaluations at 31 December 324 248
Carrying amount at 31 December 1,118 989
Holdings in associates Ownership (%) Total assets Total liabilities Income Net profit Infrastructure
Bankomat® AB, Stockholm 20 113 6 - -11
Bankernes Kontantservice A/S, Copenhagen 25 161 84 23 -23
Bankpension Sverige AB, Stockholm 20 23 2 20 -
BDB Bankernas Depå AB, Stockholm 20 2,626 2,592 40 2
LR Realkredit A/S, Copenhagen 31 15,389 12,081 584 39
Danmarks Skibskredit A/S, Copenhagen 24 78,998 69,332 3,028 244
Bluegarden A/S, Ballerup 44 659 473 866 -36
e-nettet Holding A/S, Copenhagen 25 138 85 105 -5
Automatia Pankkiautomaatit Oy, Helsinki 33 2,169 1,985 422 31
Irish Clearing House Limited, Dublin 22 1 - 5 -
Investment and property operations
As Oy Espoon Leppävaaran Aurinkopiha, Helsinki 35 240 91 2 -
DKA I P/S, Copenhagen 32 42 - 1 -4
DKA I Komplementar A/S, Copenhagen 32 1 - - -
Ejendomsaktieselskabet af 22. juni 1966, Copenhagen 50 25 6 3 1
Interessentskabet af 23. dec. 1991, Copenhagen 30 799 4 74 53
MB Equity Fund Ky, Helsinki 21 - - - -
Other
Tapio Technologies OY, Helsinki 20 12 9 6 -
Sanistål A/S, Aalborg 44 2,720 2,184 4,303 65
The information disclosed is extracted from the companies’ most recent annual reports. Sanistål is the only listed company. The invest-
ment had a market value of DKK 292 million at 31 December 2012.
DANSKE BANK / GROUP 2012 85
NO
TE
S – D
AN
SK
E B
AN
K G
RO
UP
NOTES – DANSKE BANK GROUP

NOTES – DANSKE BANK GROUP
Note (DKK millions) 2012 2011
DANSKE BANK ANNUAL REPORT 2012 38
21 Holdings in associates under insurance contracts recognised at fair value
(cont'd) Fair value at 1 January 896 974
Disposals 114 99
Fair value adjustment 7 21
Fair value at 31 December 789 896
Ownership (%) Total assets Total liabilities Income Net profit
Ejendomsselskabet af Januar 2002 A/S, Copenhagen 50 479 77 24 -27 Dantop Ejendomme ApS, Copenhagen 50 194 37 7 7 DNP Ejendomme Komplementarselskab ApS, Copenhagen 50 - - - - DNP Ejendomme P/S, Copenhagen 50 1,140 22 89 38 DAN-SEB 1 A/S, Copenhagen 50 76 52 3 1 Hovedbanegårdens Komplementarselskab ApS, Copenhagen 50 - - - - Dantop Ejendomme Komplementarselskab ApS, Copenhagen 50 - - - -
Ejendomsselskabet af Januar 2002 Komplementarselskab ApS, Copenhagen 50 - - - -
The information disclosed is extracted from the companies’ most recent annual reports.
The Group has holdings in two investment companies in which Danica Pension and Danske Bank together hold more than 20% of the capital. Danica’s holdings are recognised at fair value under Assets under insurance contracts. The Group’s other holdings are also recognised at fair value under Trading portfolio assets. Because the investment companies invest solely in securities recognised at fair value, the carrying amount deviates only slightly from the fair value. The table below shows the Group’s holdings in these compa-nies at the end of 2012:
Ownership (%) Total assets Total liabilities Income Net profit
P-N 2001 A/S, Copenhagen 27 5 1 - 1
Nordic Venture Partners K/S, Copenhagen 26 230 3 9 4
The information disclosed is extracted from the companies’ most recent annual reports.
86 DANSKE BANK / GROUP 2012
NOTES – DANSKE BANK GROUP

NOTES – DANSKE BANK GROUP
Note (DKK millions) 2012 2011
DANSKE BANK ANNUAL REPORT 2012 38
21 Holdings in associates under insurance contracts recognised at fair value
(cont'd) Fair value at 1 January 896 974
Disposals 114 99
Fair value adjustment 7 21
Fair value at 31 December 789 896
Ownership (%) Total assets Total liabilities Income Net profit
Ejendomsselskabet af Januar 2002 A/S, Copenhagen 50 479 77 24 -27 Dantop Ejendomme ApS, Copenhagen 50 194 37 7 7 DNP Ejendomme Komplementarselskab ApS, Copenhagen 50 - - - - DNP Ejendomme P/S, Copenhagen 50 1,140 22 89 38 DAN-SEB 1 A/S, Copenhagen 50 76 52 3 1 Hovedbanegårdens Komplementarselskab ApS, Copenhagen 50 - - - - Dantop Ejendomme Komplementarselskab ApS, Copenhagen 50 - - - -
Ejendomsselskabet af Januar 2002 Komplementarselskab ApS, Copenhagen 50 - - - -
The information disclosed is extracted from the companies’ most recent annual reports.
The Group has holdings in two investment companies in which Danica Pension and Danske Bank together hold more than 20% of the capital. Danica’s holdings are recognised at fair value under Assets under insurance contracts. The Group’s other holdings are also recognised at fair value under Trading portfolio assets. Because the investment companies invest solely in securities recognised at fair value, the carrying amount deviates only slightly from the fair value. The table below shows the Group’s holdings in these compa-nies at the end of 2012:
Ownership (%) Total assets Total liabilities Income Net profit
P-N 2001 A/S, Copenhagen 27 5 1 - 1
Nordic Venture Partners K/S, Copenhagen 26 230 3 9 4
The information disclosed is extracted from the companies’ most recent annual reports.
NOTES – DANSKE BANK GROUP
Note (DKK millions)
DANSKE BANK ANNUAL REPORT 2012 39
22 Intangible assets Software Customer 2012 Goodwill developed relations Other Total
Cost at 1 January 18,631 3,218 4,520 1,163 27,532 Additions 28 286 - 81 395 Disposals 247 - - 464 711 Foreign currency translation 118 30 49 39 236
Cost at 31 December 18,530 3,534 4,569 819 27,452
Amortisation and impairment charges at 1 January - 2,328 2,304 667 5,299
Amortisation charges during the year - 324 437 16 777 Impairment charges during the year - 69 - 471 540
Reversals of amortisation and impairment charges - - - 464 464
Foreign currency translation - 40 42 37 119
Amortisation and impairment charges at 31 December - 2,761 2,783 727 6,271
Carrying amount at 31 December 18,530 773 1,786 92 21,181
Amortisation period Annual impairment test 3 years 3-10 years 3 years
2011
Cost at 1 January 18,773 2,861 4,497 1,151 27,282 Additions 5 398 - 15 418 Disposals 161 37 - - 198 Foreign currency translation 14 -4 23 -3 30
Cost at 31 December 18,631 3,218 4,520 1,163 27,532
Amortisation and impairment charges at 1 January - 1,928 1,838 580 4,346
Amortisation charges during the year - 424 436 92 952 Impairment charges during the year 161 14 - - 175
Reversals of amortisation and impairment charges 161 37 - - 198
Foreign currency translation - -1 30 -5 24
Amortisation and impairment charges at 31 December - 2,328 2,304 667 5,299
Carrying amount at 31 December 18,631 890 2,216 496 22,233
Amortisation period Annual impairment test 3 years 3-10 years
In 2012, the Group expensed DKK 2,079 million (2011: DKK 2,132 million) for development projects.
DANSKE BANK / GROUP 2012 87
NO
TE
S – D
AN
SK
E B
AN
K G
RO
UP
NOTES – DANSKE BANK GROUP

NOTES – DANSKE BANK GROUP
Note (DKK millions)
DANSKE BANK ANNUAL REPORT 2012 40
22 Impairment testing (cont'd) The Group’s goodwill is tested for impairment at least once a year by testing at the level of identifiable cash-generating units to which
assets have been allocated.
Since 1 January 2011, the Corporate & Institutional Banking segment has been presented separately from the Group’s other banking activities in the Nordic countries. In 2011, the Group therefore reallocated acquired goodwill among Retail Banking Finland, Corporate & Institutional Banking, and Danske Markets and Treasury on the basis of each business unit’s value. The changes are recorded under Change. The impairment test conducted in 2012 did not result in impairment charges against goodwill (2011: DKK 161 million). As a result of the Group’s decision to rebrand the banking units so that they all operate under the same name; Danske Bank, charges for 2012 in-cluded a full write-down of rights to the Sampo Bank brand name of DKK 464 million.
1 Jan. 2011 31 Dec. 2011 31 Dec. 2012
Goodwill
and Foreign Goodwill
and Foreign Goodwill
and rights Impairment currency rights Impairment currency rights to names Change charges translation to names Change charges translation to names
Retail Banking Finland 11,673 -2,238 - -19 9,416 - 464 21 8,973
Corporate & Institutional Banking - 506 - -1 505 - - 2 507
Banking Activities Baltics 2,061 - - -6 2,055 - - 8 2,063
Banking Activities Northern Ireland 1,990 - - 54 2,044 - - 53 2,097
Danske Markets and Treasury 1,165 1,732 - -6 2,891 - - 14 2,905
Danske Capital 1,819 - - -4 1,815 - - 22 1,837
Other 528 5 161 -4 368 -218 - -2 148
Total 19,236 5 161 14 19,094 -218 464 118 18,530
Impairment tests compare the carrying amount and the estimated present value of expected future cash flows. The special debt structure of financial institutions requires the use of a simplified equity model to calculate the present value of future cash flows. The model is based on approved strategies and earnings estimates for cash-generating units for the next five years (the budget period). The estimated earnings from the end of the budget period are projected on the basis of the expected development in a number of mac-roeconomic variables until earnings normalise. This is expected no later than in year ten (the normalisation period). For the terminal period, growth estimates are determined on the basis of forecasts of real GDP growth for the relevant markets. The estimated cash flows are discounted at the Group’s risk-adjusted required rates of return of 12% (pre-tax rate) and 9% (post-tax rate). Cash flow es-timates factor in entity-specific uncertainties. The difficult market conditions for the Group’s banking units continued. Low money market rates kept earnings at a low level, and the Northern Ireland banking unit recorded large loan losses. The Group expects a period of modest growth and low money market rates before economies will normalise. Normalised interest rate levels are expected to increase net profit. If the economies do not normal-ise as expected, or future regulations increase costs more than expected, intangible assets may be impaired. Owing to the expecta-tions for the budget period, around 63% of the net present value of future cash flows is expected to be generated in the terminal pe-riod (2011: 61%). Small changes in assumptions may require impairment charges against the goodwill allocated to Banking Activities Baltics and Bank-ing Activities Northern Ireland. If the Group’s risk-adjusted required rate of return is lifted from 12% to 13%, total goodwill allocated to the Group’s banking activities, will decline around DKK 1.2 billion (2011: a decline of DKK 0.4 billion). If growth estimates are low-ered by one percentage point for the terminal period, goodwill allocated to the Group’s banking activities will decrease by DKK 0.5 bil-lion (2011: no impact). If the normalised return for the terminal period is lowered 10% or 20%, goodwill will decrease by DKK 0.3 bil-lion or DKK 0.9 billion. The corresponding effect on goodwill for 2011 was DKK 0.1 billion and DKK 0.3 billion. Moreover, if the as-sumed tier 1 capital requirement is increased by one percentage point, goodwill allocated to the Group’s banking activities will de-crease by DKK 0.2 billion (2011: no impact). The goodwill allocated to trading activities is robust against changes to both the required rate of return and growth estimates for the terminal period. For Danske Capital, the required rate of return may increase by up to 0.9 of a percentage point before impairment oc-curs (2011: 2.2 percentage points), and the goodwill allocated to the unit is robust against changes in growth estimates for the termi-nal period.
88 DANSKE BANK / GROUP 2012
NOTES – DANSKE BANK GROUP

NOTES – DANSKE BANK GROUP
Note (DKK millions)
DANSKE BANK ANNUAL REPORT 2012 40
22 Impairment testing (cont'd) The Group’s goodwill is tested for impairment at least once a year by testing at the level of identifiable cash-generating units to which
assets have been allocated.
Since 1 January 2011, the Corporate & Institutional Banking segment has been presented separately from the Group’s other banking activities in the Nordic countries. In 2011, the Group therefore reallocated acquired goodwill among Retail Banking Finland, Corporate & Institutional Banking, and Danske Markets and Treasury on the basis of each business unit’s value. The changes are recorded under Change. The impairment test conducted in 2012 did not result in impairment charges against goodwill (2011: DKK 161 million). As a result of the Group’s decision to rebrand the banking units so that they all operate under the same name; Danske Bank, charges for 2012 in-cluded a full write-down of rights to the Sampo Bank brand name of DKK 464 million.
1 Jan. 2011 31 Dec. 2011 31 Dec. 2012
Goodwill
and Foreign Goodwill
and Foreign Goodwill
and rights Impairment currency rights Impairment currency rights to names Change charges translation to names Change charges translation to names
Retail Banking Finland 11,673 -2,238 - -19 9,416 - 464 21 8,973
Corporate & Institutional Banking - 506 - -1 505 - - 2 507
Banking Activities Baltics 2,061 - - -6 2,055 - - 8 2,063
Banking Activities Northern Ireland 1,990 - - 54 2,044 - - 53 2,097
Danske Markets and Treasury 1,165 1,732 - -6 2,891 - - 14 2,905
Danske Capital 1,819 - - -4 1,815 - - 22 1,837
Other 528 5 161 -4 368 -218 - -2 148
Total 19,236 5 161 14 19,094 -218 464 118 18,530
Impairment tests compare the carrying amount and the estimated present value of expected future cash flows. The special debt structure of financial institutions requires the use of a simplified equity model to calculate the present value of future cash flows. The model is based on approved strategies and earnings estimates for cash-generating units for the next five years (the budget period). The estimated earnings from the end of the budget period are projected on the basis of the expected development in a number of mac-roeconomic variables until earnings normalise. This is expected no later than in year ten (the normalisation period). For the terminal period, growth estimates are determined on the basis of forecasts of real GDP growth for the relevant markets. The estimated cash flows are discounted at the Group’s risk-adjusted required rates of return of 12% (pre-tax rate) and 9% (post-tax rate). Cash flow es-timates factor in entity-specific uncertainties. The difficult market conditions for the Group’s banking units continued. Low money market rates kept earnings at a low level, and the Northern Ireland banking unit recorded large loan losses. The Group expects a period of modest growth and low money market rates before economies will normalise. Normalised interest rate levels are expected to increase net profit. If the economies do not normal-ise as expected, or future regulations increase costs more than expected, intangible assets may be impaired. Owing to the expecta-tions for the budget period, around 63% of the net present value of future cash flows is expected to be generated in the terminal pe-riod (2011: 61%). Small changes in assumptions may require impairment charges against the goodwill allocated to Banking Activities Baltics and Bank-ing Activities Northern Ireland. If the Group’s risk-adjusted required rate of return is lifted from 12% to 13%, total goodwill allocated to the Group’s banking activities, will decline around DKK 1.2 billion (2011: a decline of DKK 0.4 billion). If growth estimates are low-ered by one percentage point for the terminal period, goodwill allocated to the Group’s banking activities will decrease by DKK 0.5 bil-lion (2011: no impact). If the normalised return for the terminal period is lowered 10% or 20%, goodwill will decrease by DKK 0.3 bil-lion or DKK 0.9 billion. The corresponding effect on goodwill for 2011 was DKK 0.1 billion and DKK 0.3 billion. Moreover, if the as-sumed tier 1 capital requirement is increased by one percentage point, goodwill allocated to the Group’s banking activities will de-crease by DKK 0.2 billion (2011: no impact). The goodwill allocated to trading activities is robust against changes to both the required rate of return and growth estimates for the terminal period. For Danske Capital, the required rate of return may increase by up to 0.9 of a percentage point before impairment oc-curs (2011: 2.2 percentage points), and the goodwill allocated to the unit is robust against changes in growth estimates for the termi-nal period.
NOTES – DANSKE BANK GROUP
Note
DANSKE BANK ANNUAL REPORT 2012 41
22 Impairment test assumptions (cont'd) 2012 2011
Annual growth Required rate of Annual growth Required rate of
(%) >10 yrs return before tax >10 yrs return before tax
Retail Banking Finland 1.8 12.0 2.0 12.0 Corporate & Institutional Banking 1.8 12.0 2.0 12.0 Banking Activities Baltics 3.5 12.0 3.0 12.0 Banking Activities Northern Ireland 2.5 12.0 2.5 12.0 Danske Markets and Treasury 1.8 12.0 2.0 12.0
Danske Capital 1.8 12.0 1.8 12.0
Retail Banking Finland In 2007, Danske Bank acquired the shares of the Sampo Bank group. The activities of the Sampo Bank group were incorporated into the business structure of Danske Bank Group at the beginning of 2007 and are reported under Banking Activities Finland. With the acquisition, the Group strengthened its competitive position in the entire northern European market. In 2008, Banking Activities Finland migrated to the Group’s platform. At the beginning of 2011, Corporate & Institutional Banking was separated from Banking Activities Finland, resulting in reallocation of goodwill. At the same time, the name was changed to Retail Banking Finland.
Corporate & Institutional Banking (CIB) CIB was established as a separate unit at the beginning of 2011, resulting in reallocation of goodwill to the unit. Banking Activities Baltics At the beginning of 2007, Danske Bank acquired the Baltic activities of the Sampo Bank group. The activities form part of the business structure of Danske Bank Group and are reported under Banking Activities Baltics. With the acquisition, the Group established a presence in the Baltic markets, primarily in Estonia and, to a lesser extent, in Lithuania. The Group’s operations in Latvia are very modest. The Group recognised goodwill impairment charges against the banking units in Latvia and Lithuania in 2009, reflecting the economic crisis in the Baltic countries. Only the goodwill allocated to the Estonian operations remains capitalised.
Banking Activities Northern Ireland In 2005, Danske Bank acquired Northern Bank, which forms part of Banking Activities Northern Ireland. The acquisition is consistent with the Group’s strategy of strengthening its competitive position in the northern European market. The launch of new product pack-ages and other services supports Northern Bank’s position as a leading retail bank in the highly competitive Northern Ireland market. Danske Markets and Treasury The trading activities of Sampo Bank were incorporated into the business structure of Danske Markets and Treasury in 2007. With the acquisition, the Group strengthened its competitive position within trading activities. The integration process and the budgets and business plans confirm the financial assumptions on which the Group based its acquisition. Danske Capital The wealth management activities of Sampo Bank were incorporated into the business structure of Danske Capital in 2007. In addi-tion to the acquisition of Sampo Bank, goodwill recognised by Danske Capital is attributable to a number of minor acquisitions. With the acquisition of Sampo Bank, the Group strengthened its competitive position within asset management in Finland.
DANSKE BANK / GROUP 2012 89
NO
TE
S – D
AN
SK
E B
AN
K G
RO
UP
NOTES – DANSKE BANK GROUP

NOTES – DANSKE BANK GROUP
Note (DKK millions) 2012 2011
DANSKE BANK ANNUAL REPORT 2012 42
23 Investment property Investment property is recognised at fair value through profit or loss. Property investments are made for own investment purposes or on behalf of insurance customers. Value adjustments of investment property are recognised under Other income in the income statement. The fair value is assessed by the Group’s valuers at least once a year on the basis of a discounted cash flow model. Valuations are based on the expected return on the Group’s property portfolio and on the required rate of return calculated for each property that re-flects the price at which the property can be exchanged between knowledgeable, willing parties under current market conditions. The required rate of return on a property is determined on the basis of its location, type, possible uses, layout and condition as well as on the terms of lease agreements, rent adjustment and the credit quality of lessees. Valuations rely substantially on non-observable in-put, in particular the required rate of return and cash flow estimates.
Investment property
Fair value at 1 January 4,624 4,799
Additions 203 382
Property improvement expenditure 2 -
Disposals 653 577
Fair value adjustment -45 20
Fair value at 31 December 4,131 4,624
Required rate of return used for calculating fair value 4.5-9.5 4.5-9.0
Average required rate of return 6.6 6.6
Rental income from investment property totalled DKK 338 million (2011: DKK 318 million). Expenses directly attributable to invest-ment property generating rental income amounted to DKK 41 million (2011: DKK 40 million), whereas expenses directly attributable to investment property not generating rental income amounted to DKK 1 million (2011: DKK 8 million).
Investment property under insurance contracts
Fair value at 1 January 18,664 18,165
Additions 241 242
Property improvement expenditure 45 248
Disposals 37 160
Fair value adjustment -323 169
Fair value at 31 December 18,590 18,664
Required rate of return used for calculating fair value 4.5-8.8 4.5-8.0
Average required rate of return 5.9 6.0
Rental income from investment property under insurance contracts amounted to DKK 1,202 million (2011: DKK 1,197 million). Ex-penses directly attributable to investment property generating rental income amounted to DKK 391 million (2011: DKK 370 million).
90 DANSKE BANK / GROUP 2012
NOTES – DANSKE BANK GROUP

NOTES – DANSKE BANK GROUP
Note (DKK millions) 2012 2011
DANSKE BANK ANNUAL REPORT 2012 42
23 Investment property Investment property is recognised at fair value through profit or loss. Property investments are made for own investment purposes or on behalf of insurance customers. Value adjustments of investment property are recognised under Other income in the income statement. The fair value is assessed by the Group’s valuers at least once a year on the basis of a discounted cash flow model. Valuations are based on the expected return on the Group’s property portfolio and on the required rate of return calculated for each property that re-flects the price at which the property can be exchanged between knowledgeable, willing parties under current market conditions. The required rate of return on a property is determined on the basis of its location, type, possible uses, layout and condition as well as on the terms of lease agreements, rent adjustment and the credit quality of lessees. Valuations rely substantially on non-observable in-put, in particular the required rate of return and cash flow estimates.
Investment property
Fair value at 1 January 4,624 4,799
Additions 203 382
Property improvement expenditure 2 -
Disposals 653 577
Fair value adjustment -45 20
Fair value at 31 December 4,131 4,624
Required rate of return used for calculating fair value 4.5-9.5 4.5-9.0
Average required rate of return 6.6 6.6
Rental income from investment property totalled DKK 338 million (2011: DKK 318 million). Expenses directly attributable to invest-ment property generating rental income amounted to DKK 41 million (2011: DKK 40 million), whereas expenses directly attributable to investment property not generating rental income amounted to DKK 1 million (2011: DKK 8 million).
Investment property under insurance contracts
Fair value at 1 January 18,664 18,165
Additions 241 242
Property improvement expenditure 45 248
Disposals 37 160
Fair value adjustment -323 169
Fair value at 31 December 18,590 18,664
Required rate of return used for calculating fair value 4.5-8.8 4.5-8.0
Average required rate of return 5.9 6.0
Rental income from investment property under insurance contracts amounted to DKK 1,202 million (2011: DKK 1,197 million). Ex-penses directly attributable to investment property generating rental income amounted to DKK 391 million (2011: DKK 370 million).
NOTES – DANSKE BANK GROUP
Note (DKK millions)
DANSKE BANK ANNUAL REPORT 2012 43
24 Tangible assets Domicile Machinery, furniture 2012 property and fixtures Lease assets Total
Cost at 1 January 4,579 2,674 5,183 12,436
Additions 22 184 1,250 1,456
Disposals 33 332 1,267 1,632
Transferred to lease assets put up for sale - - 353 353
Transferred to real property held for sale 268 - - 268
Foreign currency translation 14 389 52 455
Cost at 31 December 4,314 2,915 4,865 12,094
Depreciation and impairment charges at 1 January 1,006 2,245 1,918 5,169
Depreciation charges during the year 70 237 806 1,113
Impairment charges during the year 244 - - 244
Transferred to lease assets put up for sale - - 258 258
Transferred to real property held for sale 122 - - 122
Reversals of depreciation and impairment charges 23 296 655 974
Foreign currency translation 68 293 17 378
Depreciation and impairment charges at 31 December 1,243 2,479 1,828 5,550
Carrying amount at 31 December 3,071 436 3,037 6,554
Depreciation period 20-50 years 3-10 years 3 years
2011
Cost at 1 January 4,647 2,537 5,871 13,055
Additions 47 302 1,306 1,655
Disposals 104 206 1,372 1,682
Transferred to lease assets put up for sale - - 626 626
Transferred to real property held for sale 20 - - 20
Foreign currency translation 9 41 4 54
Cost at 31 December 4,579 2,674 5,183 12,436
Depreciation and impairment charges at 1 January 1,116 2,031 2,047 5,194
Depreciation charges during the year 57 343 735 1,135
Impairment charges during the year 71 - 9 80
Transferred to lease assets put up for sale - - 354 354
Transferred to real property held for sale 4 - - 4
Reversals of depreciation and impairment charges 216 189 520 925
Foreign currency translation -18 60 1 43
Depreciation and impairment charges at 31 December 1,006 2,245 1,918 5,169
Carrying amount at 31 December 3,573 429 3,265 7,267
Depreciation period 20-50 years 3-10 years 3 years
Lower market prices caused a DKK 244 million write-down of domicile property (2011: DKK 71 million). The properties were valued individually and written down to the value in use determined on the basis of the rate of return disclosed in note 23.
At the end of 2012, the fair value of domicile property was DKK 4,115 million (31 December 2011: DKK 4,993 million). The required rate of return of 7.0% (2011: 6.6%) was determined in accordance with Danish FSA rules.
Furthermore, Assets under insurance contracts includes domicile property of DKK 391 million (2011: DKK 429 million) and machin-ery, furniture and fixtures of DKK 0 million (2011: DKK 0 million). At the end of 2012, the fair value of such domicile property was DKK 406 million (31 December 2011: DKK 450 million).
DANSKE BANK / GROUP 2012 91
NO
TE
S – D
AN
SK
E B
AN
K G
RO
UP
NOTES – DANSKE BANK GROUP
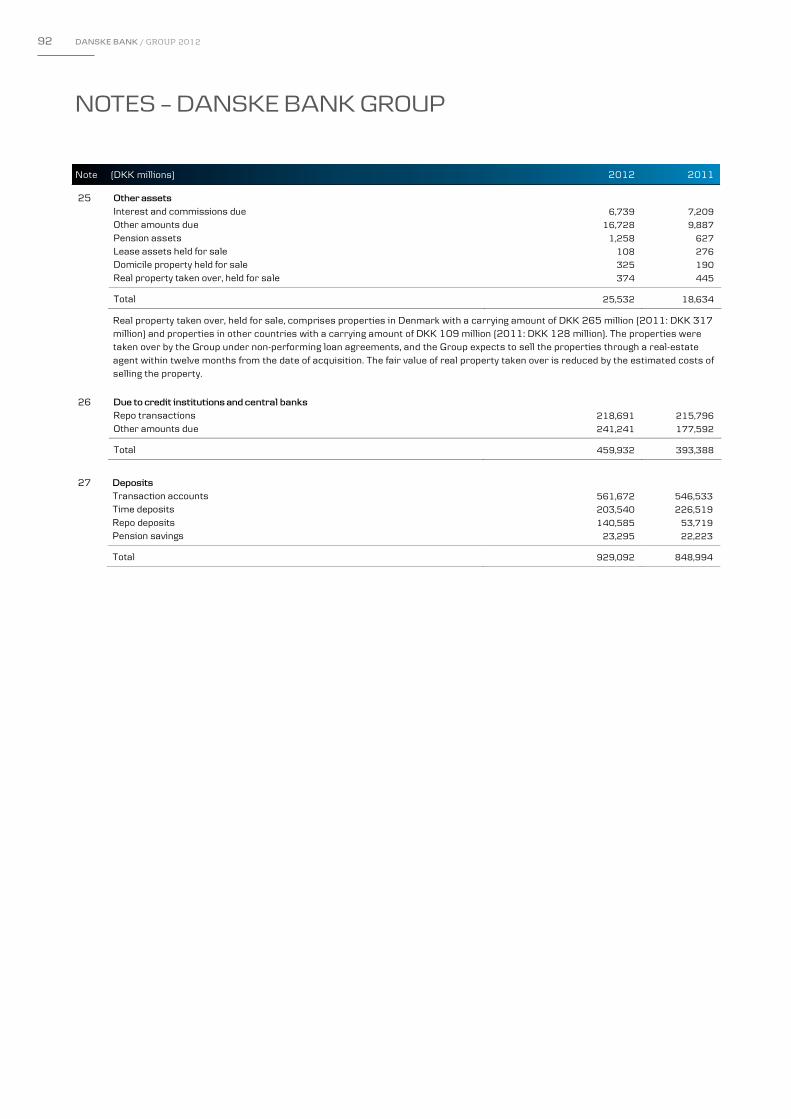
NOTES – DANSKE BANK GROUP
Note (DKK millions) 2012 2011
DANSKE BANK ANNUAL REPORT 2012 44
25 Other assets Interest and commissions due 6,739 7,209 Other amounts due 16,728 9,887 Pension assets 1,258 627 Lease assets held for sale 108 276 Domicile property held for sale 325 190 Real property taken over, held for sale 374 445
Total 25,532 18,634
Real property taken over, held for sale, comprises properties in Denmark with a carrying amount of DKK 265 million (2011: DKK 317 million) and properties in other countries with a carrying amount of DKK 109 million (2011: DKK 128 million). The properties were taken over by the Group under non-performing loan agreements, and the Group expects to sell the properties through a real-estate agent within twelve months from the date of acquisition. The fair value of real property taken over is reduced by the estimated costs of selling the property.
26 Due to credit institutions and central banks Repo transactions 218,691 215,796 Other amounts due 241,241 177,592
Total 459,932 393,388
27 Deposits Transaction accounts 561,672 546,533 Time deposits 203,540 226,519 Repo deposits 140,585 53,719 Pension savings 23,295 22,223 Total 929,092 848,994
92 DANSKE BANK / GROUP 2012
NOTES – DANSKE BANK GROUP

NOTES – DANSKE BANK GROUP
Note (DKK millions) 2012 2011
DANSKE BANK ANNUAL REPORT 2012 44
25 Other assets Interest and commissions due 6,739 7,209 Other amounts due 16,728 9,887 Pension assets 1,258 627 Lease assets held for sale 108 276 Domicile property held for sale 325 190 Real property taken over, held for sale 374 445
Total 25,532 18,634
Real property taken over, held for sale, comprises properties in Denmark with a carrying amount of DKK 265 million (2011: DKK 317 million) and properties in other countries with a carrying amount of DKK 109 million (2011: DKK 128 million). The properties were taken over by the Group under non-performing loan agreements, and the Group expects to sell the properties through a real-estate agent within twelve months from the date of acquisition. The fair value of real property taken over is reduced by the estimated costs of selling the property.
26 Due to credit institutions and central banks Repo transactions 218,691 215,796 Other amounts due 241,241 177,592
Total 459,932 393,388
27 Deposits Transaction accounts 561,672 546,533 Time deposits 203,540 226,519 Repo deposits 140,585 53,719 Pension savings 23,295 22,223 Total 929,092 848,994
NOTES – DANSKE BANK GROUP
Note (DKK millions) 2012 2011
DANSKE BANK ANNUAL REPORT 2012 45
28 Deferred tax
Deferred tax assets 1,418 1,791 Deferred tax liabilities 7,585 6,278 Deferred tax, net 6,167 4,487
Change in deferred tax Foreign Included in Included in currency profit for shareholders' 2012 1 Jan. translation the year equity 31 Dec.
Intangible assets 656 2 -214 - 444
Tangible assets 2,316 11 108 - 2,435
Securities 6 1 50 - 57
Provisions for obligations 147 18 -42 - 123
Tax loss carryforwards -1,431 -29 326 - -1,134
Recapture of tax loss 3,528 - 1,520 - 5,048
Other -735 -20 -51 - -806
Total 4,487 -17 1,697 - 6,167
Adjustment of prior-year tax charges included in above item 54
2011
Intangible assets 826 - -170 - 656
Tangible assets 2,303 -3 16 - 2,316
Securities -8 - 14 - 6
Provisions for obligations 12 2 133 - 147
Tax loss carryforwards -1,232 -23 -176 - -1,431
Recapture of tax loss 3,157 - 371 - 3,528
Other -748 -5 18 - -735
Total 4,310 -29 206 - 4,487
Adjustment of prior-year tax charges included in above item -352
Unrecognised tax loss carryforwards amounted to DKK 2.9 billion at the end of 2012 (31 December 2011: DKK 1.7 billion).
DANSKE BANK / GROUP 2012 93
NO
TE
S – D
AN
SK
E B
AN
K G
RO
UP
NOTES – DANSKE BANK GROUP

NOTES – DANSKE BANK GROUP
Note (DKK millions) 2012 2011
DANSKE BANK ANNUAL REPORT 2012 46
29 Other liabilities
Sundry creditors 29,366 21,331
Accrued interest and commissions 15,628 16,024
Pension obligations 352 472
Other staff commitments 3,127 2,629
Irrevocable loan commitments and guarantees etc. 1,253 465
Reserves subject to a reimbursement obligation 131 188
Other obligations 252 319
Total 50,109 41,428
Irrevocable loan Reserves subject to a Other commitments reimbursement obligation obligations
1 January 2012 465 188 319
New and increased obligations 915 - 126
Reversals of obligations 125 - 21
Drawings - 63 174
Effect of adjustment of discount rate or term - 6 -
Foreign currency translation -2 - 2
31 December 2012 1,253 131 252 1 January 2011 3,753 206 248
New and increased obligations 262 - 264
Reversals of obligations 217 - 84
Drawings 3,334 35 113
Effect of adjustment of discount rate or term - 17 -
Foreign currency translation 1 - 4
31 December 2011 465 188 319
The Group issues a number of irrevocable loan commitments and guarantees, etc. Such exposures are valued at the higher of the re-ceived premium amortised over the life of the individual obligation and the provision made, if any. Provisions are made if it is likely that drawings will be made under a loan commitment or claims will be made under a guarantee and the amount payable can be reliably measured. Obligations are recognised at the present value of expected payments. Reserves in early series subject to a reimbursement obligation relate to mortgage loan agreements under which the individual bor-rower’s share of the series reserve fund is disbursed to the borrower on repayment of the loan in accordance with the terms and con-ditions applying to the series. Until 2031, the Group’s obligation will gradually be reduced in step with individual borrower repayments. Factors that affect repayment patterns include changes in interest rates and the agreed repayment schedule.
94 DANSKE BANK / GROUP 2012
NOTES – DANSKE BANK GROUP
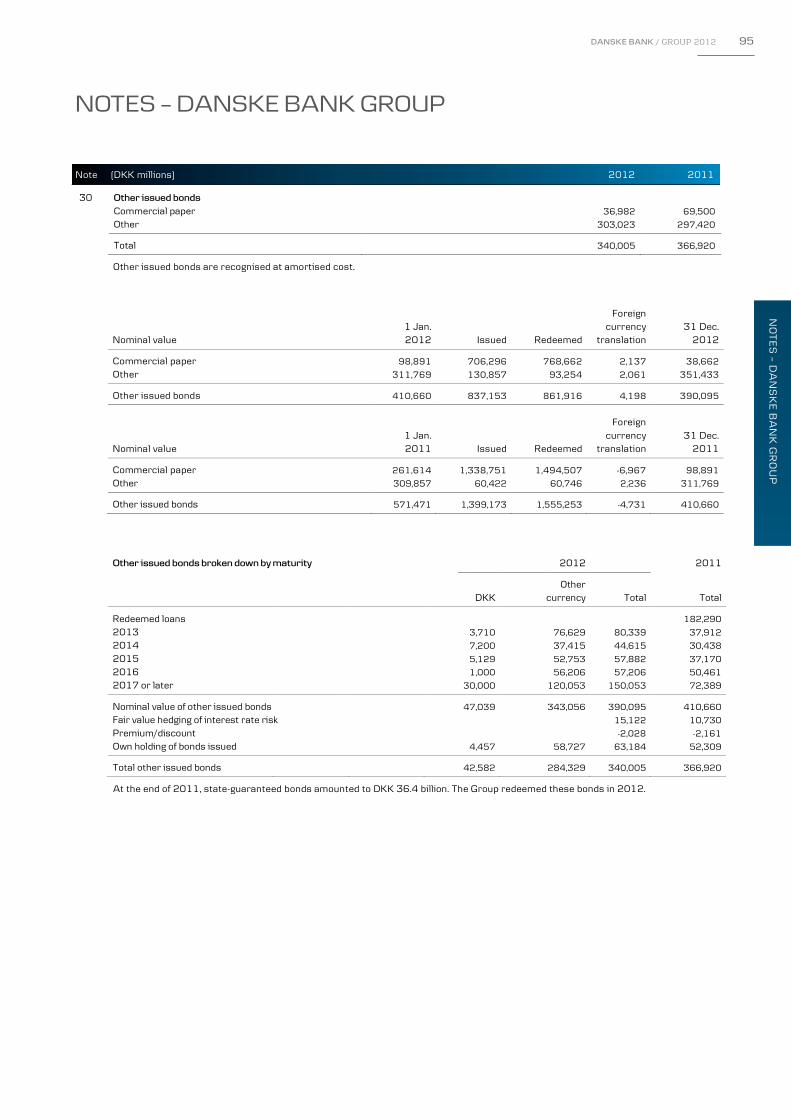
NOTES – DANSKE BANK GROUP
Note (DKK millions) 2012 2011
DANSKE BANK ANNUAL REPORT 2012 46
29 Other liabilities
Sundry creditors 29,366 21,331
Accrued interest and commissions 15,628 16,024
Pension obligations 352 472
Other staff commitments 3,127 2,629
Irrevocable loan commitments and guarantees etc. 1,253 465
Reserves subject to a reimbursement obligation 131 188
Other obligations 252 319
Total 50,109 41,428
Irrevocable loan Reserves subject to a Other commitments reimbursement obligation obligations
1 January 2012 465 188 319
New and increased obligations 915 - 126
Reversals of obligations 125 - 21
Drawings - 63 174
Effect of adjustment of discount rate or term - 6 -
Foreign currency translation -2 - 2
31 December 2012 1,253 131 252 1 January 2011 3,753 206 248
New and increased obligations 262 - 264
Reversals of obligations 217 - 84
Drawings 3,334 35 113
Effect of adjustment of discount rate or term - 17 -
Foreign currency translation 1 - 4
31 December 2011 465 188 319
The Group issues a number of irrevocable loan commitments and guarantees, etc. Such exposures are valued at the higher of the re-ceived premium amortised over the life of the individual obligation and the provision made, if any. Provisions are made if it is likely that drawings will be made under a loan commitment or claims will be made under a guarantee and the amount payable can be reliably measured. Obligations are recognised at the present value of expected payments. Reserves in early series subject to a reimbursement obligation relate to mortgage loan agreements under which the individual bor-rower’s share of the series reserve fund is disbursed to the borrower on repayment of the loan in accordance with the terms and con-ditions applying to the series. Until 2031, the Group’s obligation will gradually be reduced in step with individual borrower repayments. Factors that affect repayment patterns include changes in interest rates and the agreed repayment schedule.
NOTES – DANSKE BANK GROUP
Note (DKK millions) 2012 2011
DANSKE BANK ANNUAL REPORT 2012 47
30 Other issued bonds
Commercial paper 36,982 69,500
Other 303,023 297,420
Total 340,005 366,920
Other issued bonds are recognised at amortised cost.
1 Jan.
Foreign currency 31 Dec.
Nominal value 2012 Issued Redeemed translation 2012
Commercial paper 98,891 706,296 768,662 2,137 38,662 Other 311,769 130,857 93,254 2,061 351,433
Other issued bonds 410,660 837,153 861,916 4,198 390,095
1 Jan.
Foreign currency 31 Dec.
Nominal value 2011 Issued Redeemed translation 2011
Commercial paper 261,614 1,338,751 1,494,507 -6,967 98,891
Other 309,857 60,422 60,746 2,236 311,769
Other issued bonds 571,471 1,399,173 1,555,253 -4,731 410,660
Other issued bonds broken down by maturity
2012
2011
Other
DKK currency Total Total
Redeemed loans
182,290
2013
3,710 76,629 80,339 37,912
2014
7,200 37,415 44,615 30,438
2015
5,129 52,753 57,882 37,170
2016
1,000 56,206 57,206 50,461
2017 or later
30,000 120,053 150,053 72,389
Nominal value of other issued bonds
47,039 343,056 390,095 410,660
Fair value hedging of interest rate risk
15,122 10,730
Premium/discount
-2,028 -2,161
Own holding of bonds issued
4,457 58,727 63,184 52,309
Total other issued bonds
42,582 284,329 340,005 366,920
At the end of 2011, state-guaranteed bonds amounted to DKK 36.4 billion. The Group redeemed these bonds in 2012.
DANSKE BANK / GROUP 2012 95
NO
TE
S – D
AN
SK
E B
AN
K G
RO
UP
NOTES – DANSKE BANK GROUP
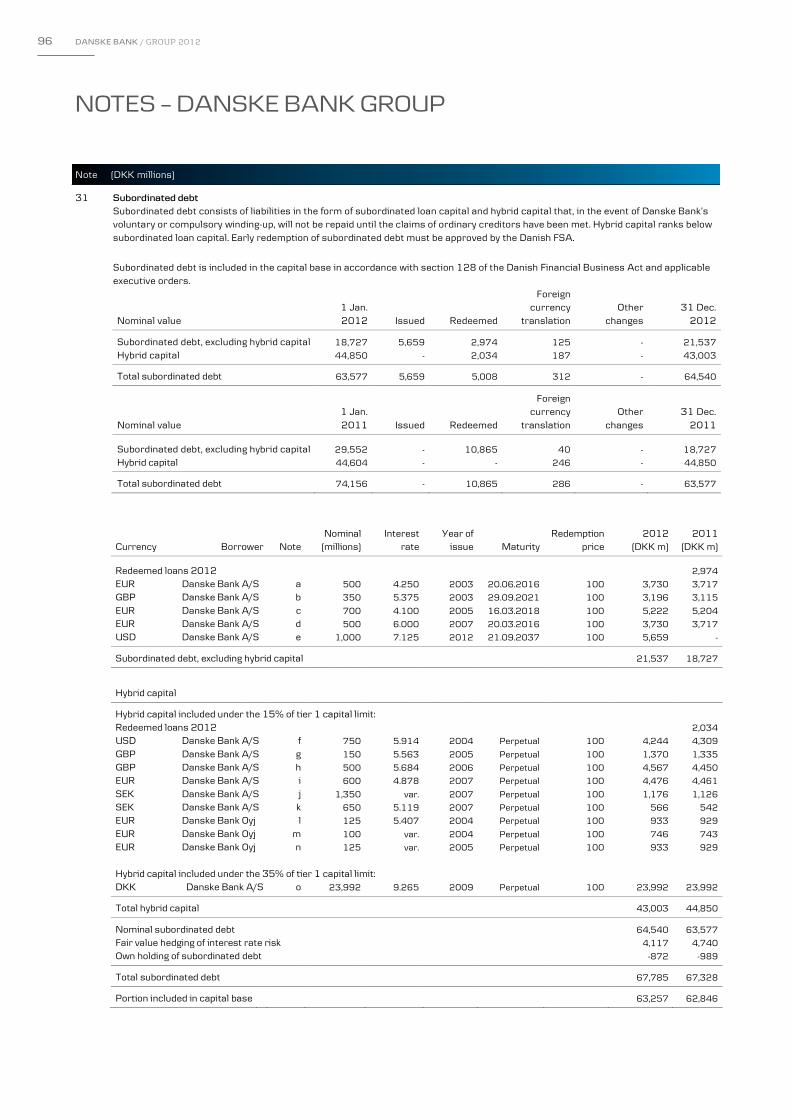
NOTES – DANSKE BANK GROUP
Note (DKK millions)
DANSKE BANK ANNUAL REPORT 2012 48
31 Subordinated debt Subordinated debt consists of liabilities in the form of subordinated loan capital and hybrid capital that, in the event of Danske Bank’s voluntary or compulsory winding-up, will not be repaid until the claims of ordinary creditors have been met. Hybrid capital ranks below subordinated loan capital. Early redemption of subordinated debt must be approved by the Danish FSA.
Subordinated debt is included in the capital base in accordance with section 128 of the Danish Financial Business Act and applicable executive orders.
Foreign
1 Jan.
currency Other 31 Dec. Nominal value 2012 Issued Redeemed translation changes 2012
Subordinated debt, excluding hybrid capital 18,727 5,659 2,974 125 - 21,537 Hybrid capital 44,850 - 2,034 187 - 43,003 Total subordinated debt 63,577 5,659 5,008 312 - 64,540
Foreign
1 Jan.
currency Other 31 Dec.
Nominal value 2011 Issued Redeemed translation changes 2011
Subordinated debt, excluding hybrid capital 29,552 - 10,865 40 - 18,727
Hybrid capital 44,604 - - 246 - 44,850
Total subordinated debt 74,156 - 10,865 286 - 63,577
Nominal Interest Year of Redemption 2012 2011 Currency Borrower Note (millions) rate issue Maturity price (DKK m) (DKK m) Redeemed loans 2012 2,974
EUR Danske Bank A/S a 500 4.250 2003 20.06.2016 100 3,730 3,717
GBP Danske Bank A/S b 350 5.375 2003 29.09.2021 100 3,196 3,115
EUR Danske Bank A/S c 700 4.100 2005 16.03.2018 100 5,222 5,204
EUR Danske Bank A/S d 500 6.000 2007 20.03.2016 100 3,730 3,717
USD Danske Bank A/S e 1,000 7.125 2012 21.09.2037 100 5,659 -
Subordinated debt, excluding hybrid capital 21,537 18,727
Hybrid capital
Hybrid capital included under the 15% of tier 1 capital limit:
Redeemed loans 2012 2,034
USD Danske Bank A/S f 750 5.914 2004 Perpetual 100 4,244 4,309
GBP Danske Bank A/S g 150 5.563 2005 Perpetual 100 1,370 1,335
GBP Danske Bank A/S h 500 5.684 2006 Perpetual 100 4,567 4,450
EUR Danske Bank A/S i 600 4.878 2007 Perpetual 100 4,476 4,461
SEK Danske Bank A/S j 1,350 var. 2007 Perpetual 100 1,176 1,126
SEK Danske Bank A/S k 650 5.119 2007 Perpetual 100 566 542
EUR Danske Bank Oyj l 125 5.407 2004 Perpetual 100 933 929
EUR Danske Bank Oyj m 100 var. 2004 Perpetual 100 746 743
EUR Danske Bank Oyj n 125 var. 2005 Perpetual 100 933 929
Hybrid capital included under the 35% of tier 1 capital limit:
DKK Danske Bank A/S o 23,992 9.265 2009 Perpetual 100 23,992 23,992
Total hybrid capital 43,003 44,850
Nominal subordinated debt 64,540 63,577
Fair value hedging of interest rate risk 4,117 4,740
Own holding of subordinated debt -872 -989
Total subordinated debt 67,785 67,328
Portion included in capital base 63,257 62,846
96 DANSKE BANK / GROUP 2012
NOTES – DANSKE BANK GROUP

NOTES – DANSKE BANK GROUP
Note (DKK millions)
DANSKE BANK ANNUAL REPORT 2012 48
31 Subordinated debt Subordinated debt consists of liabilities in the form of subordinated loan capital and hybrid capital that, in the event of Danske Bank’s voluntary or compulsory winding-up, will not be repaid until the claims of ordinary creditors have been met. Hybrid capital ranks below subordinated loan capital. Early redemption of subordinated debt must be approved by the Danish FSA.
Subordinated debt is included in the capital base in accordance with section 128 of the Danish Financial Business Act and applicable executive orders.
Foreign
1 Jan.
currency Other 31 Dec. Nominal value 2012 Issued Redeemed translation changes 2012
Subordinated debt, excluding hybrid capital 18,727 5,659 2,974 125 - 21,537 Hybrid capital 44,850 - 2,034 187 - 43,003 Total subordinated debt 63,577 5,659 5,008 312 - 64,540
Foreign
1 Jan.
currency Other 31 Dec.
Nominal value 2011 Issued Redeemed translation changes 2011
Subordinated debt, excluding hybrid capital 29,552 - 10,865 40 - 18,727
Hybrid capital 44,604 - - 246 - 44,850
Total subordinated debt 74,156 - 10,865 286 - 63,577
Nominal Interest Year of Redemption 2012 2011 Currency Borrower Note (millions) rate issue Maturity price (DKK m) (DKK m) Redeemed loans 2012 2,974
EUR Danske Bank A/S a 500 4.250 2003 20.06.2016 100 3,730 3,717
GBP Danske Bank A/S b 350 5.375 2003 29.09.2021 100 3,196 3,115
EUR Danske Bank A/S c 700 4.100 2005 16.03.2018 100 5,222 5,204
EUR Danske Bank A/S d 500 6.000 2007 20.03.2016 100 3,730 3,717
USD Danske Bank A/S e 1,000 7.125 2012 21.09.2037 100 5,659 -
Subordinated debt, excluding hybrid capital 21,537 18,727
Hybrid capital
Hybrid capital included under the 15% of tier 1 capital limit:
Redeemed loans 2012 2,034
USD Danske Bank A/S f 750 5.914 2004 Perpetual 100 4,244 4,309
GBP Danske Bank A/S g 150 5.563 2005 Perpetual 100 1,370 1,335
GBP Danske Bank A/S h 500 5.684 2006 Perpetual 100 4,567 4,450
EUR Danske Bank A/S i 600 4.878 2007 Perpetual 100 4,476 4,461
SEK Danske Bank A/S j 1,350 var. 2007 Perpetual 100 1,176 1,126
SEK Danske Bank A/S k 650 5.119 2007 Perpetual 100 566 542
EUR Danske Bank Oyj l 125 5.407 2004 Perpetual 100 933 929
EUR Danske Bank Oyj m 100 var. 2004 Perpetual 100 746 743
EUR Danske Bank Oyj n 125 var. 2005 Perpetual 100 933 929
Hybrid capital included under the 35% of tier 1 capital limit:
DKK Danske Bank A/S o 23,992 9.265 2009 Perpetual 100 23,992 23,992
Total hybrid capital 43,003 44,850
Nominal subordinated debt 64,540 63,577
Fair value hedging of interest rate risk 4,117 4,740
Own holding of subordinated debt -872 -989
Total subordinated debt 67,785 67,328
Portion included in capital base 63,257 62,846
NOTES – DANSKE BANK GROUP
Note
DANSKE BANK ANNUAL REPORT 2012 49
31 a Optional redemption from June 2013. If the loan is not redeemed, the annual interest rate will be 2.05 percentage (cont’d) points above 3-month EURIBOR.
b Optional redemption from September 2018. If the loan is not redeemed, the annual interest rate will be 1.94 percentage points above 3-month GBP LIBOR.
c Optional redemption from March 2015. If the loan is not redeemed, the annual interest rate will be 1.81 percentage points above 3-month EURIBOR.
d Optional redemption from March 2013. If the loan is not redeemed, the annual interest rate will be 2.95 percentage points above 3-month EURIBOR.
e Optional redemption from September 2017. If the loan is not redeemed, the annual interest rate is reset every five years at 6.32 percentage points above the 5-year USD swap rate.
f Optional redemption from June 2014. If the loan is not redeemed, the annual interest rate will be 1.66 percentage points above 3-month USD LIBOR.
g Optional redemption from March 2017. If the loan is not redeemed, the annual interest rate will be 1.44 percentage points above 3-month GBP LIBOR.
h Optional redemption from February 2017. If the loan is not redeemed, the annual interest rate will be 1.70 percentage points above 3-month GBP LIBOR.
i Optional redemption from May 2017. If the loan is not redeemed, the annual interest rate will be 1.62 percentage points above 3-month EURIBOR.
j Interest is paid at an annual rate of 0.65 of a percentage point above 3-month STIBOR. Optional redemption from February 2017. If the loan is not redeemed, the annual interest rate will be 1.65 percentage points above 3-month STIBOR.
k Optional redemption from August 2017. If the loan is not redeemed, the annual interest rate will be 1.65 percentage points above 3-month STIBOR.
l Optional redemption from March 2014. If the loan is not redeemed, the annual interest rate will be 2.15 percentage points above 3-month EURIBOR. The loan is included in the Group’s capital base as tier 2 capital.
m Interest is paid at an annual rate of 0.3 of a percentage point above TEC 10. Optional redemption from March 2014. The loan is included in the Group’s capital base as tier 2 capital.
n Interest is paid at an annual rate of 1.6 percentage points above 3-month EURIBOR. Optional redemption from December 2010. The loan is included in the Group’s capital base as tier 2 capital.
o Interest is paid at an annual rate of 9.265 percentage points with an annual premium of 0.5 of a percentage point for the con-version option. If Danske Bank makes annual dividend payouts exceeding DKK 5.5 billion, the interest rate will increase. Unless otherwise agreed, Danske Bank may not redeem the loan earlier than 11 April 2014. From 11 April 2014 to 10 May 2014, Danske Bank may redeem the loan at a price of 100 provided that the tier 1 capital ratio is at least 12% following such redemption or that the loan is replaced by other loss-absorbing tier 1 capital of the same or a higher quality. From 11 May 2014 to 10 May 2015, Danske Bank may redeem the loan at a price of 105, and from 11 May 2015, Danske Bank may re-deem the loan at a price of 110. Redemption must be approved by the Danish FSA. Until 14 May 2014, Danske Bank will have the option of gradually converting the loan capital into shares in Danske Bank A/S if the hybrid capital exceeds 35% of tier 1 capital. Danske Bank must, however, gradually convert the loan capital into share capital in the same period if the hybrid capi-tal exceeds 50% of tier 1 capital. Conversion must be made at market price. At the end of 2012, the hybrid capital accounted for 25.3% of tier 1 capital.
DANSKE BANK / GROUP 2012 97
NO
TE
S – D
AN
SK
E B
AN
K G
RO
UP
NOTES – DANSKE BANK GROUP
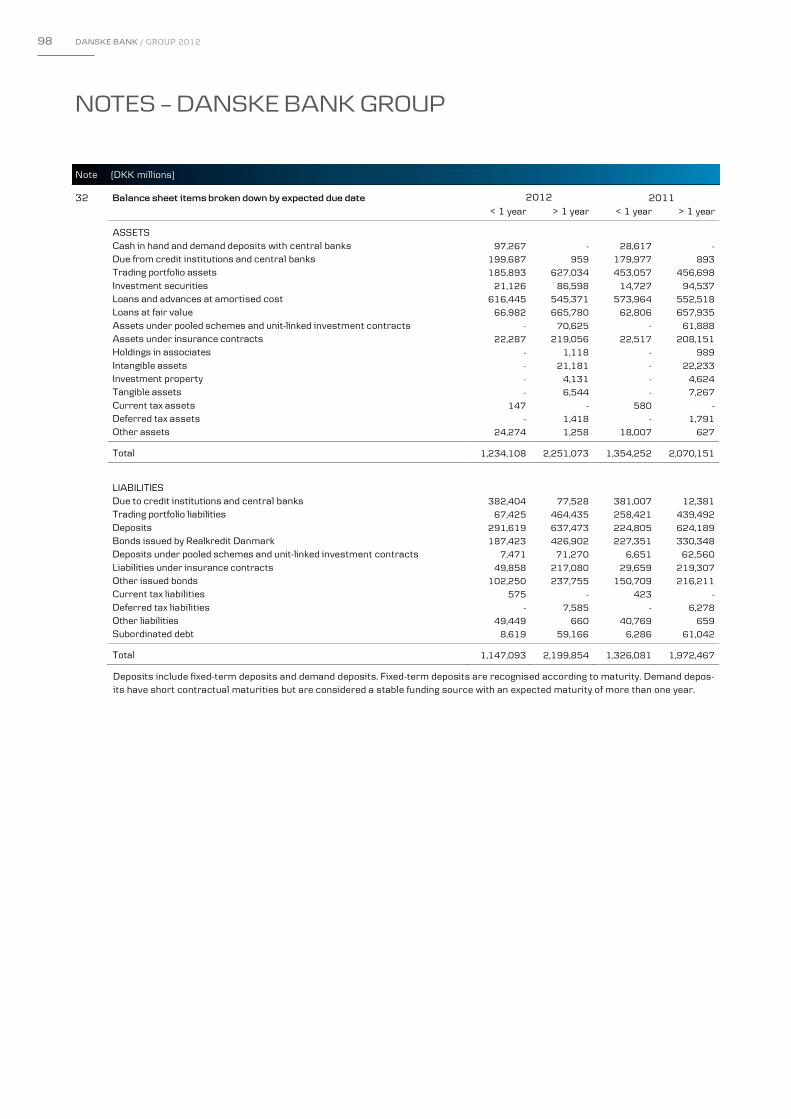
NOTES – DANSKE BANK GROUP
Note (DKK millions)
DANSKE BANK ANNUAL REPORT 2012 50
32 Balance sheet items broken down by expected due date 2012 2011
< 1 year > 1 year < 1 year > 1 year
ASSETS
Cash in hand and demand deposits with central banks 97,267 - 28,617 - Due from credit institutions and central banks 199,687 959 179,977 893 Trading portfolio assets 185,893 627,034 453,057 456,698 Investment securities 21,126 86,598 14,727 94,537 Loans and advances at amortised cost 616,445 545,371 573,964 552,518 Loans at fair value 66,982 665,780 62,806 657,935 Assets under pooled schemes and unit-linked investment contracts - 70,625 - 61,888 Assets under insurance contracts 22,287 219,056 22,517 208,151 Holdings in associates - 1,118 - 989 Intangible assets - 21,181 - 22,233 Investment property - 4,131 - 4,624 Tangible assets - 6,544 - 7,267 Current tax assets 147 - 580 - Deferred tax assets - 1,418 - 1,791 Other assets 24,274 1,258 18,007 627
Total 1,234,108 2,251,073 1,354,252 2,070,151
LIABILITIES
Due to credit institutions and central banks 382,404 77,528 381,007 12,381 Trading portfolio liabilities 67,425 464,435 258,421 439,492 Deposits 291,619 637,473 224,805 624,189 Bonds issued by Realkredit Danmark 187,423 426,902 227,351 330,348 Deposits under pooled schemes and unit-linked investment contracts 7,471 71,270 6,651 62,560
Liabilities under insurance contracts 49,858 217,080 29,659 219,307 Other issued bonds 102,250 237,755 150,709 216,211 Current tax liabilities 575 - 423 - Deferred tax liabilities - 7,585 - 6,278 Other liabilities 49,449 660 40,769 659 Subordinated debt 8,619 59,166 6,286 61,042
Total 1,147,093 2,199,854 1,326,081 1,972,467
Deposits include fixed-term deposits and demand deposits. Fixed-term deposits are recognised according to maturity. Demand depos-its have short contractual maturities but are considered a stable funding source with an expected maturity of more than one year.
98 DANSKE BANK / GROUP 2012
NOTES – DANSKE BANK GROUP
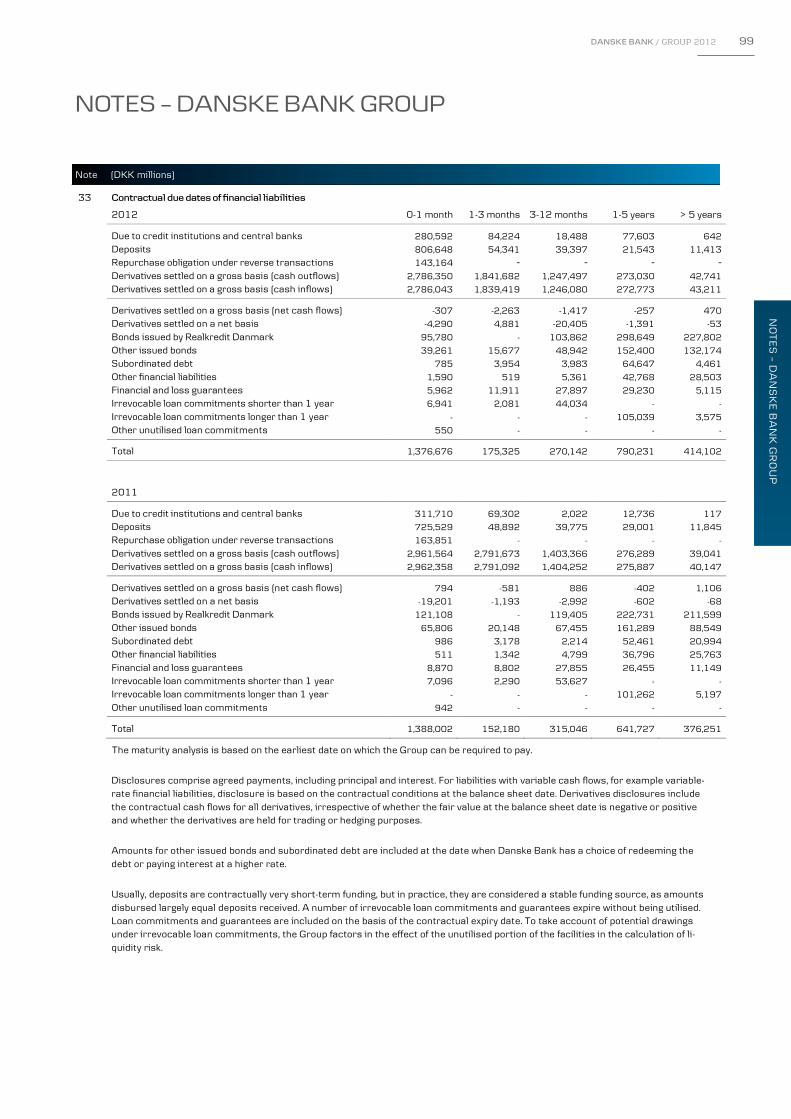
NOTES – DANSKE BANK GROUP
Note (DKK millions)
DANSKE BANK ANNUAL REPORT 2012 50
32 Balance sheet items broken down by expected due date 2012 2011
< 1 year > 1 year < 1 year > 1 year
ASSETS
Cash in hand and demand deposits with central banks 97,267 - 28,617 - Due from credit institutions and central banks 199,687 959 179,977 893 Trading portfolio assets 185,893 627,034 453,057 456,698 Investment securities 21,126 86,598 14,727 94,537 Loans and advances at amortised cost 616,445 545,371 573,964 552,518 Loans at fair value 66,982 665,780 62,806 657,935 Assets under pooled schemes and unit-linked investment contracts - 70,625 - 61,888 Assets under insurance contracts 22,287 219,056 22,517 208,151 Holdings in associates - 1,118 - 989 Intangible assets - 21,181 - 22,233 Investment property - 4,131 - 4,624 Tangible assets - 6,544 - 7,267 Current tax assets 147 - 580 - Deferred tax assets - 1,418 - 1,791 Other assets 24,274 1,258 18,007 627
Total 1,234,108 2,251,073 1,354,252 2,070,151
LIABILITIES
Due to credit institutions and central banks 382,404 77,528 381,007 12,381 Trading portfolio liabilities 67,425 464,435 258,421 439,492 Deposits 291,619 637,473 224,805 624,189 Bonds issued by Realkredit Danmark 187,423 426,902 227,351 330,348 Deposits under pooled schemes and unit-linked investment contracts 7,471 71,270 6,651 62,560
Liabilities under insurance contracts 49,858 217,080 29,659 219,307 Other issued bonds 102,250 237,755 150,709 216,211 Current tax liabilities 575 - 423 - Deferred tax liabilities - 7,585 - 6,278 Other liabilities 49,449 660 40,769 659 Subordinated debt 8,619 59,166 6,286 61,042
Total 1,147,093 2,199,854 1,326,081 1,972,467
Deposits include fixed-term deposits and demand deposits. Fixed-term deposits are recognised according to maturity. Demand depos-its have short contractual maturities but are considered a stable funding source with an expected maturity of more than one year.
NOTES – DANSKE BANK GROUP
Note (DKK millions)
DANSKE BANK ANNUAL REPORT 2012 51
33 Contractual due dates of financial liabilities
2012 0-1 month 1-3 months 3-12 months 1-5 years > 5 years
Due to credit institutions and central banks 280,592 84,224 18,488 77,603 642 Deposits 806,648 54,341 39,397 21,543 11,413 Repurchase obligation under reverse transactions 143,164 - - - - Derivatives settled on a gross basis (cash outflows) 2,786,350 1,841,682 1,247,497 273,030 42,741 Derivatives settled on a gross basis (cash inflows) 2,786,043 1,839,419 1,246,080 272,773 43,211
Derivatives settled on a gross basis (net cash flows) -307 -2,263 -1,417 -257 470
Derivatives settled on a net basis -4,290 4,881 -20,405 -1,391 -53
Bonds issued by Realkredit Danmark 95,780 - 103,862 298,649 227,802
Other issued bonds 39,261 15,677 48,942 152,400 132,174
Subordinated debt 785 3,954 3,983 64,647 4,461
Other financial liabilities 1,590 519 5,361 42,768 28,503
Financial and loss guarantees 5,962 11,911 27,897 29,230 5,115
Irrevocable loan commitments shorter than 1 year 6,941 2,081 44,034 - -
Irrevocable loan commitments longer than 1 year - - - 105,039 3,575
Other unutilised loan commitments 550 - - - -
Total 1,376,676 175,325 270,142 790,231 414,102
2011
Due to credit institutions and central banks 311,710 69,302 2,022 12,736 117 Deposits 725,529 48,892 39,775 29,001 11,845 Repurchase obligation under reverse transactions 163,851 - - - - Derivatives settled on a gross basis (cash outflows) 2,961,564 2,791,673 1,403,366 276,289 39,041
Derivatives settled on a gross basis (cash inflows) 2,962,358 2,791,092 1,404,252 275,887 40,147
Derivatives settled on a gross basis (net cash flows) 794 -581 886 -402 1,106 Derivatives settled on a net basis -19,201 -1,193 -2,992 -602 -68 Bonds issued by Realkredit Danmark 121,108 - 119,405 222,731 211,599 Other issued bonds 65,806 20,148 67,455 161,289 88,549 Subordinated debt 986 3,178 2,214 52,461 20,994 Other financial liabilities 511 1,342 4,799 36,796 25,763 Financial and loss guarantees 8,870 8,802 27,855 26,455 11,149 Irrevocable loan commitments shorter than 1 year 7,096 2,290 53,627 - - Irrevocable loan commitments longer than 1 year - - - 101,262 5,197
Other unutilised loan commitments 942 - - - -
Total 1,388,002 152,180 315,046 641,727 376,251
The maturity analysis is based on the earliest date on which the Group can be required to pay.
Disclosures comprise agreed payments, including principal and interest. For liabilities with variable cash flows, for example variable-rate financial liabilities, disclosure is based on the contractual conditions at the balance sheet date. Derivatives disclosures include the contractual cash flows for all derivatives, irrespective of whether the fair value at the balance sheet date is negative or positive and whether the derivatives are held for trading or hedging purposes.
Amounts for other issued bonds and subordinated debt are included at the date when Danske Bank has a choice of redeeming the debt or paying interest at a higher rate.
Usually, deposits are contractually very short-term funding, but in practice, they are considered a stable funding source, as amounts disbursed largely equal deposits received. A number of irrevocable loan commitments and guarantees expire without being utilised. Loan commitments and guarantees are included on the basis of the contractual expiry date. To take account of potential drawings under irrevocable loan commitments, the Group factors in the effect of the unutilised portion of the facilities in the calculation of li-quidity risk.
DANSKE BANK / GROUP 2012 99
NO
TE
S – D
AN
SK
E B
AN
K G
RO
UP
NOTES – DANSKE BANK GROUP

NOTES – DANSKE BANK GROUP
Note (DKK millions) 2012 2011
DANSKE BANK ANNUAL REPORT 2012 52
34 Pension plans Contributions to external defined contribution plans 893 591
Contributions to internal defined contribution plans 786 724
Total contributions to defined contribution plans 1,679 1,315
Expenses for defined benefit plans, standard cost 187 122
Adjustment of plans and business acquisitions -431 - Foreign currency translation -62 -35
Total 1,373 1,402
A significant number of the Group’s pension plans are defined contribution plans under which the Group makes contributions to in-surance companies, including Danica Pension. Such payments are expensed when made. Defined benefit plans are typically funded by ordinary contributions made by employers and employees to separate pension funds investing the contributions on behalf of the members to fund future pension obligations. The Group also has unfunded pension plans, which are recognised directly in the balance sheet.
Defined benefit plans in Northern Ireland and Ireland account for most of the Group’s obligations under such plans. The defined bene-fit plans in these countries do not accept new members, and pension obligations are funded through pension funds. For the plan in Ire-land, contributions payable by existing members were discontinued on 1 January 2011. All employees are now covered by a plan combining defined benefit and defined contribution elements. Pensions in payment, including spouses’ and children’s benefits in Northern Ireland and Ireland, are reviewed annually by the Group and the trustee boards of the plans. In Denmark, most employees have defined contribution plans. Defined benefit plans for employees working in Denmark are funded by contributions to pension funds, the majority of which are regulated by Danish company pension funds law. Most of these plans do not accept new members, and most of them are in payment. In Sweden, the defined benefit plan stopped accepting new members on 1 February 2013. The plan is funded through a pension fund, with an upper salary limit on the basis of which pension obligations accumulate. The Group’s defined benefit plans are computed on the basis of external actuarial calculations, and actuarial gains and losses are recognised using the corridor method. The actuarial calculations showed unrecognised losses of DKK 235 million at 31 December 2012 (31 December 2011: unrecognised gains of DKK 387 million). The net pension assets and obligations of the individual pension funds are recognised under Other assets and Other liabilities, re-spectively.
Defined benefit plans Present value of unfunded pension obligations 214 236
Present value of fully or partly funded pension obligations 14,566 13,167
Fair value of plan assets 15,451 13,945
Net pension obligation at 31 December -671 -542
Actuarial gains/losses not recognised in the net pension obligation -235 387
Net pension obligation in accordance with IFRSs at 31 December -906 -155
Net pension obligation recognised in the balance sheet Pension assets recognised under Other assets 1,258 627
Pension obligations recognised under Other liabilities 352 472
Total -906 -155
100 DANSKE BANK / GROUP 2012
NOTES – DANSKE BANK GROUP

NOTES – DANSKE BANK GROUP
Note (DKK millions) 2012 2011
DANSKE BANK ANNUAL REPORT 2012 52
34 Pension plans Contributions to external defined contribution plans 893 591
Contributions to internal defined contribution plans 786 724
Total contributions to defined contribution plans 1,679 1,315
Expenses for defined benefit plans, standard cost 187 122
Adjustment of plans and business acquisitions -431 - Foreign currency translation -62 -35
Total 1,373 1,402
A significant number of the Group’s pension plans are defined contribution plans under which the Group makes contributions to in-surance companies, including Danica Pension. Such payments are expensed when made. Defined benefit plans are typically funded by ordinary contributions made by employers and employees to separate pension funds investing the contributions on behalf of the members to fund future pension obligations. The Group also has unfunded pension plans, which are recognised directly in the balance sheet.
Defined benefit plans in Northern Ireland and Ireland account for most of the Group’s obligations under such plans. The defined bene-fit plans in these countries do not accept new members, and pension obligations are funded through pension funds. For the plan in Ire-land, contributions payable by existing members were discontinued on 1 January 2011. All employees are now covered by a plan combining defined benefit and defined contribution elements. Pensions in payment, including spouses’ and children’s benefits in Northern Ireland and Ireland, are reviewed annually by the Group and the trustee boards of the plans. In Denmark, most employees have defined contribution plans. Defined benefit plans for employees working in Denmark are funded by contributions to pension funds, the majority of which are regulated by Danish company pension funds law. Most of these plans do not accept new members, and most of them are in payment. In Sweden, the defined benefit plan stopped accepting new members on 1 February 2013. The plan is funded through a pension fund, with an upper salary limit on the basis of which pension obligations accumulate. The Group’s defined benefit plans are computed on the basis of external actuarial calculations, and actuarial gains and losses are recognised using the corridor method. The actuarial calculations showed unrecognised losses of DKK 235 million at 31 December 2012 (31 December 2011: unrecognised gains of DKK 387 million). The net pension assets and obligations of the individual pension funds are recognised under Other assets and Other liabilities, re-spectively.
Defined benefit plans Present value of unfunded pension obligations 214 236
Present value of fully or partly funded pension obligations 14,566 13,167
Fair value of plan assets 15,451 13,945
Net pension obligation at 31 December -671 -542
Actuarial gains/losses not recognised in the net pension obligation -235 387
Net pension obligation in accordance with IFRSs at 31 December -906 -155
Net pension obligation recognised in the balance sheet Pension assets recognised under Other assets 1,258 627
Pension obligations recognised under Other liabilities 352 472
Total -906 -155
NOTES – DANSKE BANK GROUP
Note (DKK millions)
DANSKE BANK ANNUAL REPORT 2012 53
34 Changes in net pension obligation
(cont'd) 2012 2011 Assets Liabilities Net Assets Liabilities Net
At 1 January 13,945 13,403 -542 11,960 12,178 218
Current service costs - 163 163 - 163 163
Calculated interest expenses - 609 609 - 616 616
Estimated return on plan assets 726 - 726 706 - 706
Past service costs - 141 141 - 49 49
Standard cost 726 913 187 706 828 122
Actuarial gains/losses 903 1,525 -622 1,311 885 426
Employer contributions to plans 445 - 445 421 - 421
Employee contributions 11 11 - 11 11 -
Benefits paid out by pension funds -611 -611 - -482 -482 -
Adjustment of plans and business acquisitions - -431 -431 - - -
Foreign currency translation 32 -30 -62 18 -17 -35
At 31 December 15,451 14,780 -671 13,945 13,403 -542
Actuarial gains/losses not recognised in net pension obligation 1,144 1,379 -235 241 -146 387
Net pension obligation at 31 December 14,307 13,401 -906 13,704 13,549 -155
The Group expects its pension contributions to total DKK 186 million in 2013.
Expenses for defined benefit plans 2012 2011 Current service costs 163 163
Calculated interest expenses 609 616
Estimated return on plan assets 726 706
Past service costs 141 49
Standard cost 187 122
Actuarial gains/losses -622 426
Adjustment of plans and business acquisitions -431 -
Foreign currency translation -62 -35
Total 316 -339
The Group’s obligations under defined benefit plans are recognised on the basis of actuarial calculations of the present value of the estimated benefits. The table below shows the assumptions for calculating the present value of the individual plans at year end:
Average actuarial assumptions (%) 2012 2011
Discount rate 4.0 4.7 Return on plan assets 4.0 4.8 Inflation rate 2.1 2.7 Salary adjustment rate 3.3 3.6 Pension adjustment rate 2.4 2.9
The expected return on plan assets is calculated on the basis of the asset mix at the beginning of the year and long-term expectations for the return on the various asset types. The mortality assumptions used for recognising pension obligations at the end of 2012 are based on the Group’s own FT11 mortality table for pension obligations in Denmark and the FFFS2007:31 standard table for pension obligations in Sweden. The Northern Ire-land and Ireland mortality rates are based on the 00 series of mortality tables for annuitants and pensioners produced by the British Institute and Faculty of Actuaries. The mortality tables are adjusted to reflect general trends in the mortality rates of populations and general data on portfolios of insured persons. Life expectancies of persons insured at 31 December 2012 were 86.7 years for men and 88.5 years for women (60-year-olds), and 86.9 years for men and 88.7 years for women (65-year-olds). The corresponding fig-ures for 2011 were 86.6 years for men and 88.4 years for women (60-year-olds), and 86.8 years for men and 88.6 years for women (65-year-olds). The notes on risk management include a sensitivity analysis.
DANSKE BANK / GROUP 2012 101
NO
TE
S – D
AN
SK
E B
AN
K G
RO
UP
NOTES – DANSKE BANK GROUP

NOTES – DANSKE BANK GROUP
Note (DKK millions)
DANSKE BANK ANNUAL REPORT 2012 54
34 Pension assets 2012 2011
(cont'd) Percentage Estimated Actual Percentage Estimated Actual
(%) at 31 Dec. return at 1 Jan. return at 31 Dec. at 31 Dec. return at 1 Jan. return at 31 Dec.
Shares 36 8 14 34 8 -7
Government and mortgage bonds 29 4 7 29 4 12
Index-linked bonds 7 3 25 9 4 25
Corporate bonds 15 4 15 12 5 12
Real property 4 7 3 4 7 -2
Cash and cash equivalents 9 2 7 12 2 -
Total 100 5 12 100 6 4
Historical trend in defined benefit plans 2012 2011 2010 2009 2008
Present value of pension obligations 14,780 13,403 12,178 11,878 9,717 Fair value of plan assets 15,451 13,945 11,960 9,988 9,301 Actuarial gains/losses not recognised in the net pension obligation -235 387 -39 -1,103 483 Experience adjustments of plan liabilities included in above item 80 -89 247 -38 -59 Experience adjustments of plan assets included in above item 675 1,144 599 -217 -664
Net pension obligation at 31 December -906 -155 179 787 899
Transactions with related pension funds comprised loans and advances in the amount of DKK 9 million (2011: DKK 9 million), depos-its in the amount of DKK 171 million (2011: DKK 152 million), issued bonds worth DKK 486 million (2011: DKK 507 million), deriva-tives with a positive fair value of DKK 0 million (2011: DKK 19 million), derivatives with a negative fair value of DKK 1,277 million (2011: DKK 1,425 million), interest expenses of DKK 20 million (2011: DKK 21 million), fee income of DKK 1 million (2011: DKK 1 million), and pension contributions of DKK 445 million (2011: DKK 423 million).
35 Risk-weighted assets 2012 2011
Credit risk (IRB approach) 438,260 494,989 Credit risk (standardised approach) 195,839 213,382 Counterparty risk 50,362 44,508
Total credit risk 684,461 752,879 Market risk 59,789 63,686 Operational risk 75,186 89,414
Total 819,436 905,979
The total capital and tier 1 capital ratios are calculated in accordance with the Capital Requirements Directive. Risk-weighted assets calculated under the Basel I rules amounted to DKK 1,411,357 million at 31 December 2012 (31 December 2011: DKK 1,414,566 million). The solvency need under the transitional rules was DKK 90,327 million, equal to 6.4% of risk-weighted assets under the Basel I rules (31 December 2011: DKK 90,532 million).
Risk Management 2012 provides more details about the Group’s solvency need. Risk Management 2012 is not covered by the statu-tory audit.
102 DANSKE BANK / GROUP 2012
NOTES – DANSKE BANK GROUP
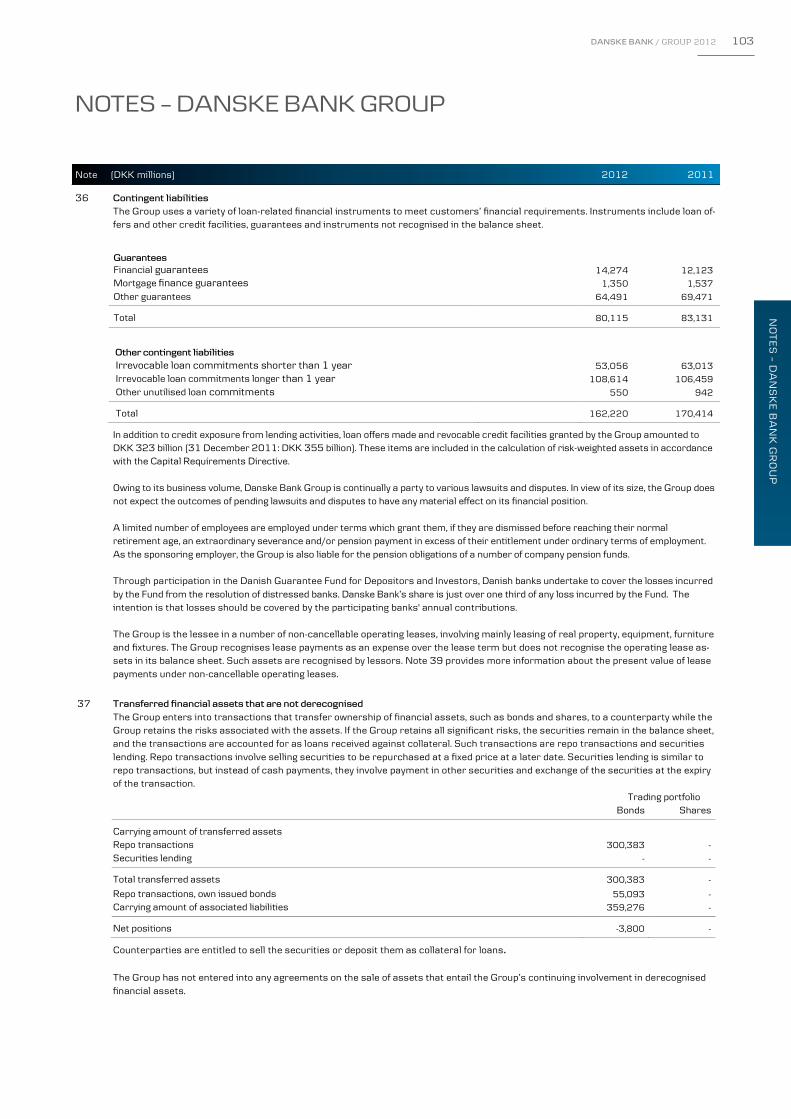
NOTES – DANSKE BANK GROUP
Note (DKK millions)
DANSKE BANK ANNUAL REPORT 2012 54
34 Pension assets 2012 2011
(cont'd) Percentage Estimated Actual Percentage Estimated Actual
(%) at 31 Dec. return at 1 Jan. return at 31 Dec. at 31 Dec. return at 1 Jan. return at 31 Dec.
Shares 36 8 14 34 8 -7
Government and mortgage bonds 29 4 7 29 4 12
Index-linked bonds 7 3 25 9 4 25
Corporate bonds 15 4 15 12 5 12
Real property 4 7 3 4 7 -2
Cash and cash equivalents 9 2 7 12 2 -
Total 100 5 12 100 6 4
Historical trend in defined benefit plans 2012 2011 2010 2009 2008
Present value of pension obligations 14,780 13,403 12,178 11,878 9,717 Fair value of plan assets 15,451 13,945 11,960 9,988 9,301 Actuarial gains/losses not recognised in the net pension obligation -235 387 -39 -1,103 483 Experience adjustments of plan liabilities included in above item 80 -89 247 -38 -59 Experience adjustments of plan assets included in above item 675 1,144 599 -217 -664
Net pension obligation at 31 December -906 -155 179 787 899
Transactions with related pension funds comprised loans and advances in the amount of DKK 9 million (2011: DKK 9 million), depos-its in the amount of DKK 171 million (2011: DKK 152 million), issued bonds worth DKK 486 million (2011: DKK 507 million), deriva-tives with a positive fair value of DKK 0 million (2011: DKK 19 million), derivatives with a negative fair value of DKK 1,277 million (2011: DKK 1,425 million), interest expenses of DKK 20 million (2011: DKK 21 million), fee income of DKK 1 million (2011: DKK 1 million), and pension contributions of DKK 445 million (2011: DKK 423 million).
35 Risk-weighted assets 2012 2011
Credit risk (IRB approach) 438,260 494,989 Credit risk (standardised approach) 195,839 213,382 Counterparty risk 50,362 44,508
Total credit risk 684,461 752,879 Market risk 59,789 63,686 Operational risk 75,186 89,414
Total 819,436 905,979
The total capital and tier 1 capital ratios are calculated in accordance with the Capital Requirements Directive. Risk-weighted assets calculated under the Basel I rules amounted to DKK 1,411,357 million at 31 December 2012 (31 December 2011: DKK 1,414,566 million). The solvency need under the transitional rules was DKK 90,327 million, equal to 6.4% of risk-weighted assets under the Basel I rules (31 December 2011: DKK 90,532 million).
Risk Management 2012 provides more details about the Group’s solvency need. Risk Management 2012 is not covered by the statu-tory audit.
NOTES – DANSKE BANK GROUP
Note (DKK millions) 2012 2011
DANSKE BANK ANNUAL REPORT 2012 55
36 Contingent liabilities The Group uses a variety of loan-related financial instruments to meet customers’ financial requirements. Instruments include loan of-fers and other credit facilities, guarantees and instruments not recognised in the balance sheet.
Guarantees Financial guarantees 14,274 12,123
Mortgage finance guarantees 1,350 1,537
Other guarantees 64,491 69,471
Total 80,115 83,131
Other contingent liabilities
Irrevocable loan commitments shorter than 1 year 53,056 63,013
Irrevocable loan commitments longer than 1 year 108,614 106,459
Other unutilised loan commitments 550 942
Total 162,220 170,414
In addition to credit exposure from lending activities, loan offers made and revocable credit facilities granted by the Group amounted to DKK 323 billion (31 December 2011: DKK 355 billion). These items are included in the calculation of risk-weighted assets in accordance with the Capital Requirements Directive. Owing to its business volume, Danske Bank Group is continually a party to various lawsuits and disputes. In view of its size, the Group does not expect the outcomes of pending lawsuits and disputes to have any material effect on its financial position. A limited number of employees are employed under terms which grant them, if they are dismissed before reaching their normal retirement age, an extraordinary severance and/or pension payment in excess of their entitlement under ordinary terms of employment. As the sponsoring employer, the Group is also liable for the pension obligations of a number of company pension funds. Through participation in the Danish Guarantee Fund for Depositors and Investors, Danish banks undertake to cover the losses incurred by the Fund from the resolution of distressed banks. Danske Bank’s share is just over one third of any loss incurred by the Fund. The intention is that losses should be covered by the participating banks' annual contributions. The Group is the lessee in a number of non-cancellable operating leases, involving mainly leasing of real property, equipment, furniture and fixtures. The Group recognises lease payments as an expense over the lease term but does not recognise the operating lease as-sets in its balance sheet. Such assets are recognised by lessors. Note 39 provides more information about the present value of lease payments under non-cancellable operating leases.
37 Transferred financial assets that are not derecognised The Group enters into transactions that transfer ownership of financial assets, such as bonds and shares, to a counterparty while the Group retains the risks associated with the assets. If the Group retains all significant risks, the securities remain in the balance sheet, and the transactions are accounted for as loans received against collateral. Such transactions are repo transactions and securities lending. Repo transactions involve selling securities to be repurchased at a fixed price at a later date. Securities lending is similar to repo transactions, but instead of cash payments, they involve payment in other securities and exchange of the securities at the expiry of the transaction. Trading portfolio Bonds Shares Carrying amount of transferred assets Repo transactions 300,383 - Securities lending - -
Total transferred assets 300,383 - Repo transactions, own issued bonds 55,093 - Carrying amount of associated liabilities 359,276 -
Net positions -3,800 -
Counterparties are entitled to sell the securities or deposit them as collateral for loans. The Group has not entered into any agreements on the sale of assets that entail the Group’s continuing involvement in derecognised financial assets.
DANSKE BANK / GROUP 2012 103
NO
TE
S – D
AN
SK
E B
AN
K G
RO
UP
NOTES – DANSKE BANK GROUP

NOTES – DANSKE BANK GROUP
Note (DKK millions)
DANSKE BANK ANNUAL REPORT 2012 56
38 Assets provided or received as collateral At the end of 2012, Danske Bank A/S had deposited securities worth DKK 33.0 billion as collateral with Danish and international clearing centres and other institutions (31 December 2011: DKK 39.7 billion).
At the end of 2012, Danske Bank A/S had provided cash and securities worth DKK 75.8 billion as collateral for derivatives transac-tions (31 December 2011: DKK 66.9 billion). At the end of 2012, the Group had registered assets under insurance contracts worth DKK 259.7 billion (31 December 2011: DKK 261.9 billion) as collateral for policyholders savings of DKK 262.3 billion (31 December 2011: DKK 248.1 billion).
At the end of 2012, the Group had registered loans at fair value and securities worth a total of DKK 732.8 billion (31 December 2011: DKK 720.7 billion) as collateral for bonds issued by Realkredit Danmark, including mortgage-covered bonds, worth a total of DKK 614.3 billion (31 December 2011: DKK 557.7 billion). Note 18 provides additional information. Similarly, the Group had regis-tered loans and other assets worth DKK 269.9 billion (31 December 2011: DKK 198.8 billion) as collateral for covered bonds issued under Danish and Finnish law. The table below shows assets provided as collateral for obligations, including obligations under repo transactions and securities lend-ing:
2012 2011 Repo Other Total Repo Other Total
Due from credit institutions - 24,251 24,251 - 26,304 26,304
Trading portfolio securities 300,383 85,262 385,645 233,076 90,435 323,511
Available-for-sale bonds - - - - - -
Loans at fair value - 732,762 732,762 - 720,741 720,741
Loans and advances at amortised cost - 291,241 291,241 - 212,552 212,552
Assets under insurance contracts - 248,294 248,294 - 233,463 233,463
Other assets - 187 187 - 300 300
Total 300,383 1,381,997 1,682,380 233,076 1,283,795 1,516,871
Own issued bonds 55,093 110,397 165,490 34,848 79,109 113,957
Total, incl. own issued bonds 355,476 1,492,394 1,847,870 267,924 1,362,904 1,630,828
Securities provided as collateral under agreements that entitle the counterparty to sell the securities or provide them as collateral for other loans amounted to DKK 300.4 billion at the end of 2012 (31 December 2011: DKK 233.1 billion). At the end of 2012, the Group had received securities worth DKK 304.3 billion (31 December 2011: DKK 254.4 billion) as collateral for reverse repo transactions, securities lending, derivatives transactions and other transactions entered into on the standard terms for such transactions. As the party receiving the collateral, the Group is entitled in many cases to sell the securities or provide the se-curities as collateral for other loans in exchange for returning similar securities to the counterparty at the expiry of the transactions. At the end of 2012, the Group had sold securities or provided securities as collateral worth DKK 143.2 billion (31 December 2011: DKK 163.9 billion). The Group also receives many other types of assets as collateral in connection with its ordinary lending activities. The Group has not transferred the ownership of these assets. The notes on risk management provide more details on assets received as collateral.
104 DANSKE BANK / GROUP 2012
NOTES – DANSKE BANK GROUP

NOTES – DANSKE BANK GROUP
Note (DKK millions)
DANSKE BANK ANNUAL REPORT 2012 56
38 Assets provided or received as collateral At the end of 2012, Danske Bank A/S had deposited securities worth DKK 33.0 billion as collateral with Danish and international clearing centres and other institutions (31 December 2011: DKK 39.7 billion).
At the end of 2012, Danske Bank A/S had provided cash and securities worth DKK 75.8 billion as collateral for derivatives transac-tions (31 December 2011: DKK 66.9 billion). At the end of 2012, the Group had registered assets under insurance contracts worth DKK 259.7 billion (31 December 2011: DKK 261.9 billion) as collateral for policyholders savings of DKK 262.3 billion (31 December 2011: DKK 248.1 billion).
At the end of 2012, the Group had registered loans at fair value and securities worth a total of DKK 732.8 billion (31 December 2011: DKK 720.7 billion) as collateral for bonds issued by Realkredit Danmark, including mortgage-covered bonds, worth a total of DKK 614.3 billion (31 December 2011: DKK 557.7 billion). Note 18 provides additional information. Similarly, the Group had regis-tered loans and other assets worth DKK 269.9 billion (31 December 2011: DKK 198.8 billion) as collateral for covered bonds issued under Danish and Finnish law. The table below shows assets provided as collateral for obligations, including obligations under repo transactions and securities lend-ing:
2012 2011 Repo Other Total Repo Other Total
Due from credit institutions - 24,251 24,251 - 26,304 26,304
Trading portfolio securities 300,383 85,262 385,645 233,076 90,435 323,511
Available-for-sale bonds - - - - - -
Loans at fair value - 732,762 732,762 - 720,741 720,741
Loans and advances at amortised cost - 291,241 291,241 - 212,552 212,552
Assets under insurance contracts - 248,294 248,294 - 233,463 233,463
Other assets - 187 187 - 300 300
Total 300,383 1,381,997 1,682,380 233,076 1,283,795 1,516,871
Own issued bonds 55,093 110,397 165,490 34,848 79,109 113,957
Total, incl. own issued bonds 355,476 1,492,394 1,847,870 267,924 1,362,904 1,630,828
Securities provided as collateral under agreements that entitle the counterparty to sell the securities or provide them as collateral for other loans amounted to DKK 300.4 billion at the end of 2012 (31 December 2011: DKK 233.1 billion). At the end of 2012, the Group had received securities worth DKK 304.3 billion (31 December 2011: DKK 254.4 billion) as collateral for reverse repo transactions, securities lending, derivatives transactions and other transactions entered into on the standard terms for such transactions. As the party receiving the collateral, the Group is entitled in many cases to sell the securities or provide the se-curities as collateral for other loans in exchange for returning similar securities to the counterparty at the expiry of the transactions. At the end of 2012, the Group had sold securities or provided securities as collateral worth DKK 143.2 billion (31 December 2011: DKK 163.9 billion). The Group also receives many other types of assets as collateral in connection with its ordinary lending activities. The Group has not transferred the ownership of these assets. The notes on risk management provide more details on assets received as collateral.
NOTES – DANSKE BANK GROUP
Note (DKK millions) 2012 2011
DANSKE BANK ANNUAL REPORT 2012 57
39 Leasing The Group as lessor The Group offers fleet management, truck leasing, IT leasing, machinery leasing (such as agricultural machinery), and real property leasing under both finance and operating leases. Payments due under finance leases Loans and advances included payments due under finance leases of DKK 24,528 million at the end of 2012 (31 December 2011: DKK 23,735 million).
Finance leases
At 1 January 23,735 25,888
Additions 8,321 6,311
Disposals 7,928 8,511
Foreign currency translation 400 47
At 31 December 24,528 23,735
Finance leases expiring
within 1 year 3,746 3,766
in 1-5 years 15,041 14,548
after 5 years 5,741 5,421
Total 24,528 23,735
Gross investment in finance leases expiring
within 1 year 5,402 5,393
in 1-5 years 17,809 17,551
after 5 years 6,924 6,761
Total 30,135 29,705
Unearned finance income 5,607 5,970
Unguaranteed residual value 2,922 3,346
Impairment charges for finance leases amounted to DKK 681 million at the end of 2012 (31 December 2011: DKK 862 million). In-terest income on variable-rate leases amounted to DKK 652 million (2011: DKK 629 million). Payments due under operating leases The Group recognises assets leased under operating leases as tangible assets (lease assets), investment property and investment property under insurance contracts. The table below breaks down minimum lease payments by lease term. Operating leases expiring
within 1 year 1,934 1,846
in 1-5 years 2,499 2,467
after 5 years 584 479
Total 5,017 4,792
Interest income on variable-rate leases amounted to DKK 81 million (2011: DKK 92 million). The Group as lessee The Group is the lessee under a number of operating leases. Under such leases, the Group is entitled to use an asset for a specified period of time against lease payments, but it does not take over significant risks associated with the asset nor does it benefit from any returns. The leases involve mainly leasing of real property, equipment, furniture and fixtures and are not recognised in the Group’s balance sheet. The table below breaks down minimum lease payments by lease term. Operating leases expiring
within 1 year 569 589
in 1-5 years 1,484 1,579
after 5 years 1,268 1,327
Total 3,321 3,495
Staff costs and administrative expenses includes lease payments in the amount of DKK 746 million (2011: DKK 695 million). Interest expenses on variable-rate leases amounted to DKK 0 million (2011: DKK 0 million). In 2012, the Group did not enter into finance leases as lessee.
DANSKE BANK / GROUP 2012 105
NO
TE
S – D
AN
SK
E B
AN
K G
RO
UP
NOTES – DANSKE BANK GROUP
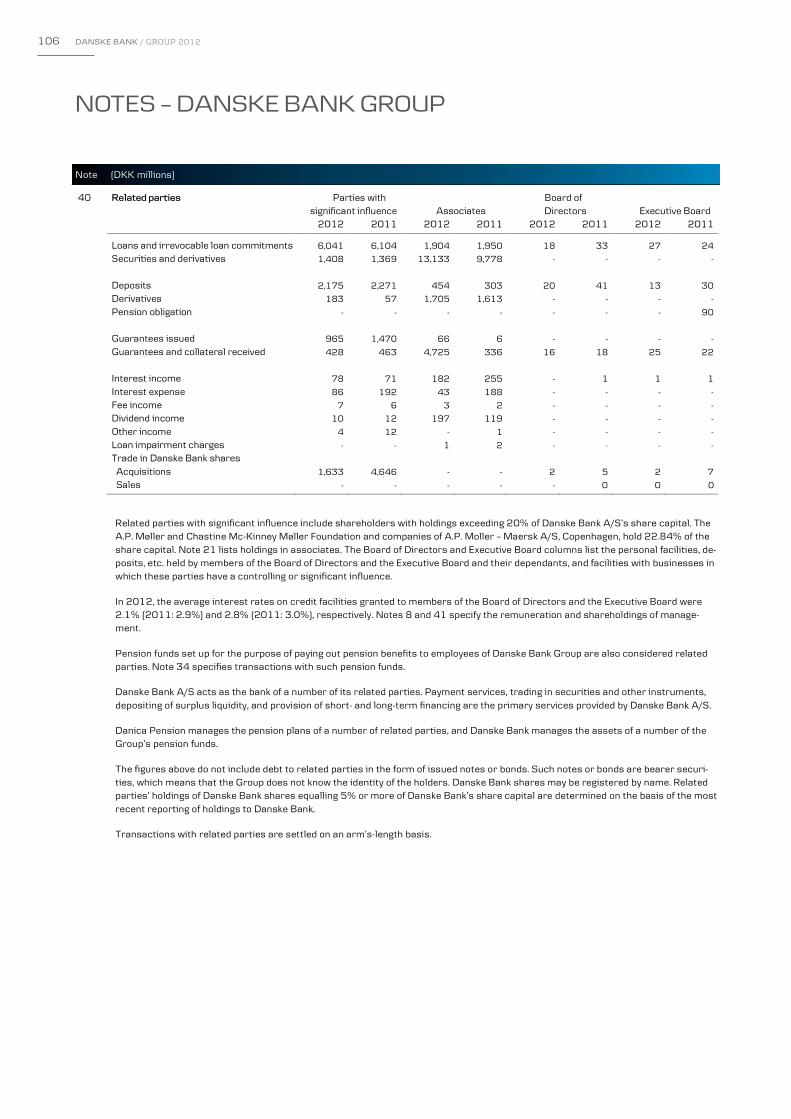
NOTES – DANSKE BANK GROUP
Note (DKK millions)
DANSKE BANK ANNUAL REPORT 2012 58
40 Related parties Parties with Board of significant influence Associates Directors Executive Board 2012 2011 2012 2011 2012 2011 2012 2011
Loans and irrevocable loan commitments 6,041 6,104 1,904 1,950 18 33 27 24
Securities and derivatives 1,408 1,369 13,133 9,778 - - - -
Deposits 2,175 2,271 454 303 20 41 13 30
Derivatives 183 57 1,705 1,613 - - - -
Pension obligation - - - - - - - 90
Guarantees issued 965 1,470 66 6 - - - -
Guarantees and collateral received 428 463 4,725 336 16 18 25 22
Interest income 78 71 182 255 - 1 1 1
Interest expense 86 192 43 188 - - - -
Fee income 7 6 3 2 - - - -
Dividend income 10 12 197 119 - - - -
Other income 4 12 - 1 - - - -
Loan impairment charges - - 1 2 - - - -
Trade in Danske Bank shares
Acquisitions 1,633 4,646 - - 2 5 2 7
Sales - - - - - 0 0 0
Related parties with significant influence include shareholders with holdings exceeding 20% of Danske Bank A/S’s share capital. The A.P. Møller and Chastine Mc-Kinney Møller Foundation and companies of A.P. Moller – Maersk A/S, Copenhagen, hold 22.84% of the share capital. Note 21 lists holdings in associates. The Board of Directors and Executive Board columns list the personal facilities, de-posits, etc. held by members of the Board of Directors and the Executive Board and their dependants, and facilities with businesses in which these parties have a controlling or significant influence. In 2012, the average interest rates on credit facilities granted to members of the Board of Directors and the Executive Board were 2.1% (2011: 2.9%) and 2.8% (2011: 3.0%), respectively. Notes 8 and 41 specify the remuneration and shareholdings of manage-ment. Pension funds set up for the purpose of paying out pension benefits to employees of Danske Bank Group are also considered related parties. Note 34 specifies transactions with such pension funds. Danske Bank A/S acts as the bank of a number of its related parties. Payment services, trading in securities and other instruments, depositing of surplus liquidity, and provision of short- and long-term financing are the primary services provided by Danske Bank A/S. Danica Pension manages the pension plans of a number of related parties, and Danske Bank manages the assets of a number of the Group’s pension funds. The figures above do not include debt to related parties in the form of issued notes or bonds. Such notes or bonds are bearer securi-ties, which means that the Group does not know the identity of the holders. Danske Bank shares may be registered by name. Related parties’ holdings of Danske Bank shares equalling 5% or more of Danske Bank’s share capital are determined on the basis of the most recent reporting of holdings to Danske Bank. Transactions with related parties are settled on an arm’s-length basis.
106 DANSKE BANK / GROUP 2012
NOTES – DANSKE BANK GROUP
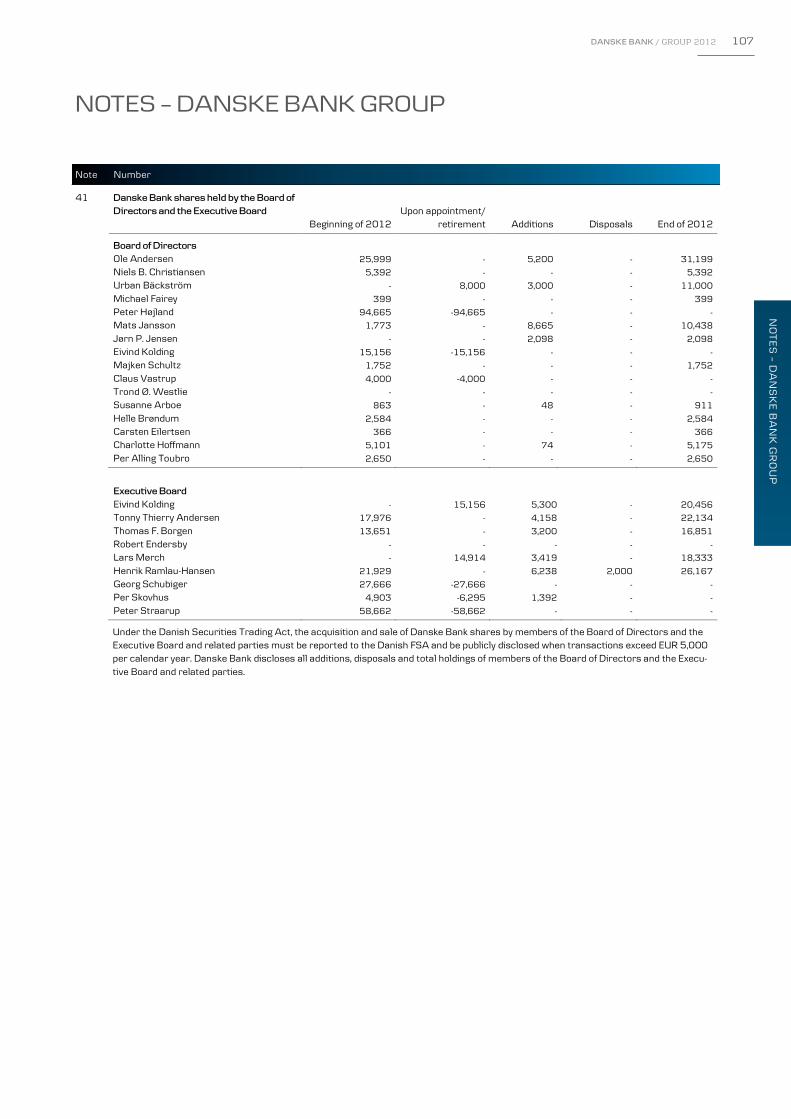
NOTES – DANSKE BANK GROUP
Note (DKK millions)
DANSKE BANK ANNUAL REPORT 2012 58
40 Related parties Parties with Board of significant influence Associates Directors Executive Board 2012 2011 2012 2011 2012 2011 2012 2011
Loans and irrevocable loan commitments 6,041 6,104 1,904 1,950 18 33 27 24
Securities and derivatives 1,408 1,369 13,133 9,778 - - - -
Deposits 2,175 2,271 454 303 20 41 13 30
Derivatives 183 57 1,705 1,613 - - - -
Pension obligation - - - - - - - 90
Guarantees issued 965 1,470 66 6 - - - -
Guarantees and collateral received 428 463 4,725 336 16 18 25 22
Interest income 78 71 182 255 - 1 1 1
Interest expense 86 192 43 188 - - - -
Fee income 7 6 3 2 - - - -
Dividend income 10 12 197 119 - - - -
Other income 4 12 - 1 - - - -
Loan impairment charges - - 1 2 - - - -
Trade in Danske Bank shares
Acquisitions 1,633 4,646 - - 2 5 2 7
Sales - - - - - 0 0 0
Related parties with significant influence include shareholders with holdings exceeding 20% of Danske Bank A/S’s share capital. The A.P. Møller and Chastine Mc-Kinney Møller Foundation and companies of A.P. Moller – Maersk A/S, Copenhagen, hold 22.84% of the share capital. Note 21 lists holdings in associates. The Board of Directors and Executive Board columns list the personal facilities, de-posits, etc. held by members of the Board of Directors and the Executive Board and their dependants, and facilities with businesses in which these parties have a controlling or significant influence. In 2012, the average interest rates on credit facilities granted to members of the Board of Directors and the Executive Board were 2.1% (2011: 2.9%) and 2.8% (2011: 3.0%), respectively. Notes 8 and 41 specify the remuneration and shareholdings of manage-ment. Pension funds set up for the purpose of paying out pension benefits to employees of Danske Bank Group are also considered related parties. Note 34 specifies transactions with such pension funds. Danske Bank A/S acts as the bank of a number of its related parties. Payment services, trading in securities and other instruments, depositing of surplus liquidity, and provision of short- and long-term financing are the primary services provided by Danske Bank A/S. Danica Pension manages the pension plans of a number of related parties, and Danske Bank manages the assets of a number of the Group’s pension funds. The figures above do not include debt to related parties in the form of issued notes or bonds. Such notes or bonds are bearer securi-ties, which means that the Group does not know the identity of the holders. Danske Bank shares may be registered by name. Related parties’ holdings of Danske Bank shares equalling 5% or more of Danske Bank’s share capital are determined on the basis of the most recent reporting of holdings to Danske Bank. Transactions with related parties are settled on an arm’s-length basis.
NOTES – DANSKE BANK GROUP
Note Number
DANSKE BANK ANNUAL REPORT 2012 59
41 Danske Bank shares held by the Board of
Directors and the Executive Board
Upon appointment/
Beginning of 2012 retirement Additions Disposals End of 2012
Board of Directors
Ole Andersen 25,999 - 5,200 - 31,199
Niels B. Christiansen 5,392 - - - 5,392
Urban Bäckström - 8,000 3,000 - 11,000
Michael Fairey 399 - - - 399
Peter Højland 94,665 -94,665 - - -
Mats Jansson 1,773 - 8,665 - 10,438
Jørn P. Jensen - - 2,098 - 2,098
Eivind Kolding 15,156 -15,156 - - -
Majken Schultz 1,752 - - - 1,752
Claus Vastrup 4,000 -4,000 - - -
Trond Ø. Westlie - - - - -
Susanne Arboe 863 - 48 - 911
Helle Brøndum 2,584 - - - 2,584
Carsten Eilertsen 366 - - - 366
Charlotte Hoffmann 5,101 - 74 - 5,175
Per Alling Toubro 2,650 - - - 2,650
Executive Board
Eivind Kolding - 15,156 5,300 - 20,456 Tonny Thierry Andersen 17,976 - 4,158 - 22,134 Thomas F. Borgen 13,651 - 3,200 - 16,851 Robert Endersby - - - - - Lars Mørch - 14,914 3,419 - 18,333 Henrik Ramlau-Hansen 21,929 - 6,238 2,000 26,167 Georg Schubiger 27,666 -27,666 - - - Per Skovhus 4,903 -6,295 1,392 - - Peter Straarup 58,662 -58,662 - - -
Under the Danish Securities Trading Act, the acquisition and sale of Danske Bank shares by members of the Board of Directors and the Executive Board and related parties must be reported to the Danish FSA and be publicly disclosed when transactions exceed EUR 5,000 per calendar year. Danske Bank discloses all additions, disposals and total holdings of members of the Board of Directors and the Execu-tive Board and related parties.
DANSKE BANK / GROUP 2012 107
NO
TE
S – D
AN
SK
E B
AN
K G
RO
UP
NOTES – DANSKE BANK GROUP
NOTES – DANSKE BANK GROUP
Note
DANSKE BANK ANNUAL REPORT 2012 60
42 Fair value information for financial instruments Financial instruments are carried in the balance sheet at fair value or amortised cost. The Group breaks down its financial instru-ments by valuation method (note 1 provides additional information). Financial instruments at fair value The fair value is the amount for which a financial asset can be exchanged between knowledgeable, willing parties. Fair value is meas-ured on the basis of the following hierarchy: • Quoted price (level 1): If an active market exists for the financial instrument, the Group uses the quoted price. • Valuation technique based on observable input (level 2): If a financial instrument is quoted in a market that is not active, the
Group bases its measurement on the most recent transaction price. Adjustment is made for subsequent changes in market conditions, for instance, by including transactions in similar financial instruments that are assumed to be motivated by normal business considerations. For a number of financial assets and liabilities, no market exists. In such cases, the Group uses recent transactions in similar instruments and discounted cash flows or other generally accepted estimation and valuation techniques based on market conditions at the balance sheet date to calculate an estimated value.
• Valuation technique based on significant non-observable input (level 3): The valuation of certain financial instruments is based substantially on non-observable input. Such instruments include unlisted shares, some unlisted bonds and a limited portion of the derivatives portfolio (4%). The value of derivatives, primarily long-term contracts, is therefore extrapolated on the basis of observable yield curves. Moreover, some credit derivatives are valued on the basis of observable input as well as assumptions about the probability of default (recovery rate). Unlisted shares are measured at fair value in accordance with the International Private Equity and Venture Capital Valuation Guidelines (IPEV). These guidelines calculate the estimated fair value of unlisted shares as the price at which an asset can be exchanged between knowledgeable, willing parties.
The most frequently used valuation techniques include the pricing of transactions with future settlement and swap models that apply present value calculations, credit pricing models and options models, such as Black & Scholes models. As part of the Group’s control environment, valuation models are validated by units that are independent of the business units that develop the models and trade in the products covered by the models. Validation is made to test the implementation, quality and operating stability of models to ensure that the models can be used for pricing and risk management of financial products. Loans at fair value (mortgage loans) and bonds issued by Realkredit Danmark are recognised at the fair value of the issued bonds. The Group adjusts for changes in the fair value of the credit risk on borrowers. For loans granted to customers in rating categories 10 and 11, such adjustment is made on the basis of an assessment of the expected cash flows from the loans. For the remaining portion of the portfolio, adjustments depend on the possibility of raising the administration margin on loans (credit margin) sufficiently to offset higher credit risk and market risk premiums on mortgage loans. No changes are made if it is possible to raise the administration mar-gin sufficiently. If it is not possible to raise the administration margin sufficiently or at all, a collective adjustment is made, reflecting trends in expected losses, unexpected losses (volatility) and the possibility of raising administration margins in the future. The ex-pected future cash flows are discounted at the current market rate with the addition of a risk premium. Note 45
policies provides additional information on the method. Significant accounting
In 2012, the global debt crisis continued to have a significant impact on the bond markets, and volatility remained high. In the second half of the year, sentiment gradually shifted towards a more benign environment for the riskier bond segments. Volatility persisted but the bond markets were generally well-functioning. Fair value adjustments Management estimates underlie the valuation of financial instruments where the value is based on valuation techniques. To account for the uncertainty associated with measuring the value of derivatives on the basis of non-observable input (level 3 in the fair value hierarchy), the Group has established guidelines to quantify model risk. The Group calculates and monitors the model reserve on an ongoing basis. At the end of 2012, the reserve totalled DKK 10 million (31 December 2011: DKK 15 million). For portfolios of assets and liabilities with offsetting market risks, the Group bases its measurement of the portfolios on mid-market prices and makes fair value adjustments to recognise net assets at bid price and net liabilities at offering price (exit prices). At the end of 2012, the fair value adjustments totalled DKK 173 million (31 December 2011: DKK 192 million).
If, at the balance sheet date, a financial instrument’s classification differs from its classification at the beginning of the year, the classi- fication of the instrument changes.
108 DANSKE BANK / GROUP 2012
NOTES – DANSKE BANK GROUP

NOTES – DANSKE BANK GROUP
Note
DANSKE BANK ANNUAL REPORT 2012 60
42 Fair value information for financial instruments Financial instruments are carried in the balance sheet at fair value or amortised cost. The Group breaks down its financial instru-ments by valuation method (note 1 provides additional information). Financial instruments at fair value The fair value is the amount for which a financial asset can be exchanged between knowledgeable, willing parties. Fair value is meas-ured on the basis of the following hierarchy: • Quoted price (level 1): If an active market exists for the financial instrument, the Group uses the quoted price. • Valuation technique based on observable input (level 2): If a financial instrument is quoted in a market that is not active, the
Group bases its measurement on the most recent transaction price. Adjustment is made for subsequent changes in market conditions, for instance, by including transactions in similar financial instruments that are assumed to be motivated by normal business considerations. For a number of financial assets and liabilities, no market exists. In such cases, the Group uses recent transactions in similar instruments and discounted cash flows or other generally accepted estimation and valuation techniques based on market conditions at the balance sheet date to calculate an estimated value.
• Valuation technique based on significant non-observable input (level 3): The valuation of certain financial instruments is based substantially on non-observable input. Such instruments include unlisted shares, some unlisted bonds and a limited portion of the derivatives portfolio (4%). The value of derivatives, primarily long-term contracts, is therefore extrapolated on the basis of observable yield curves. Moreover, some credit derivatives are valued on the basis of observable input as well as assumptions about the probability of default (recovery rate). Unlisted shares are measured at fair value in accordance with the International Private Equity and Venture Capital Valuation Guidelines (IPEV). These guidelines calculate the estimated fair value of unlisted shares as the price at which an asset can be exchanged between knowledgeable, willing parties.
The most frequently used valuation techniques include the pricing of transactions with future settlement and swap models that apply present value calculations, credit pricing models and options models, such as Black & Scholes models. As part of the Group’s control environment, valuation models are validated by units that are independent of the business units that develop the models and trade in the products covered by the models. Validation is made to test the implementation, quality and operating stability of models to ensure that the models can be used for pricing and risk management of financial products. Loans at fair value (mortgage loans) and bonds issued by Realkredit Danmark are recognised at the fair value of the issued bonds. The Group adjusts for changes in the fair value of the credit risk on borrowers. For loans granted to customers in rating categories 10 and 11, such adjustment is made on the basis of an assessment of the expected cash flows from the loans. For the remaining portion of the portfolio, adjustments depend on the possibility of raising the administration margin on loans (credit margin) sufficiently to offset higher credit risk and market risk premiums on mortgage loans. No changes are made if it is possible to raise the administration mar-gin sufficiently. If it is not possible to raise the administration margin sufficiently or at all, a collective adjustment is made, reflecting trends in expected losses, unexpected losses (volatility) and the possibility of raising administration margins in the future. The ex-pected future cash flows are discounted at the current market rate with the addition of a risk premium. Note 45
policies provides additional information on the method. Significant accounting
In 2012, the global debt crisis continued to have a significant impact on the bond markets, and volatility remained high. In the second half of the year, sentiment gradually shifted towards a more benign environment for the riskier bond segments. Volatility persisted but the bond markets were generally well-functioning. Fair value adjustments Management estimates underlie the valuation of financial instruments where the value is based on valuation techniques. To account for the uncertainty associated with measuring the value of derivatives on the basis of non-observable input (level 3 in the fair value hierarchy), the Group has established guidelines to quantify model risk. The Group calculates and monitors the model reserve on an ongoing basis. At the end of 2012, the reserve totalled DKK 10 million (31 December 2011: DKK 15 million). For portfolios of assets and liabilities with offsetting market risks, the Group bases its measurement of the portfolios on mid-market prices and makes fair value adjustments to recognise net assets at bid price and net liabilities at offering price (exit prices). At the end of 2012, the fair value adjustments totalled DKK 173 million (31 December 2011: DKK 192 million).
If, at the balance sheet date, a financial instrument’s classification differs from its classification at the beginning of the year, the classi- fication of the instrument changes.
NOTES – DANSKE BANK GROUP
Note (DKK millions)
DANSKE BANK ANNUAL REPORT 2012 61
The Group makes a fair value adjustment to cover the credit risk on derivatives with a positive fair value (a credit value adjustment – CVA). For a given counterparty’s portfolio of derivatives, CVA is calculated as a function of the probability of default (PD), the expected positive exposure (EPE) and the loss given default (LGD), and represents the loss ratio in the event of bankruptcy. The Group enters into derivatives transactions mainly with counterparties on the Scandinavian market. For a small number of counterparties (about 5% of the total positive fair value after netting and collateral), the credit risk can be assessed on the basis of observable market input in the form of listed credit default swaps. The Group therefore uses its internal rating of the individual counterparty and assesses the development in the rating over time on the basis of historical migration matrices. In calculating EPE, the Group uses simulations to es-timate the range of positive exposures to the counterparty’s portfolio over the term of the derivatives. In calculating LGD, the Group uses internal estimates for each counterparty. At the end of 2012, CVA totalled DKK 127 million. CVA can be determined by using other methods such as calculating PD on the basis of market transactions, CDS spreads for example. As observable market input is available for only a small number of the Group's counterparties, the calculation of PD on the basis of market data for the total derivatives portfolio will rely substantially on estimates. If, at the time of acquisition, a difference arises between the model value of a financial instrument calculated on the basis of non-observable input and actual cost (day-one profit or loss) and the difference is not the result of transaction costs, the Group adjusts model parameters to actual cost. The valuation of derivatives thus includes amortisation of the value of initial margins over the re-maining term to maturity. At 31 December 2012, the value of unamortised initial margins was DKK 1,182 million (2011: DKK 1,103 million).
2012 2011
Unamortised initial margins at 1 January 1,103 914
Amortised during the year -139 -121
Initial margins on new derivatives contracts 375 456
Terminated derivatives contracts -157 -146
Unamortised initial margins at 31 December 1,182 1,103
42 (cont'd)
DANSKE BANK / GROUP 2012 109
NO
TE
S – D
AN
SK
E B
AN
K G
RO
UP
NOTES – DANSKE BANK GROUP

NOTES – DANSKE BANK GROUP
Note (DKK millions)
DANSKE BANK ANNUAL REPORT 2012 62
Quoted Observable Non-observable 2012 prices input input Total
Financial assets Derivatives 2,843 390,406 15,741 408,990 Trading portfolio bonds 384,075 16,666 - 400,741 Trading portfolio shares 2,675 - 521 3,196 Investment securities, bonds 85,317 11,013 - 96,330 Investment securities, shares 52 - 3,032 3,084 Loans at fair value - 732,762 - 732,762 Assets under pooled schemes and unit-linked in-vestment contracts 70,625 - - 70,625 Assets under insurance contracts, bonds 149,514 2,133 586 152,233 Assets under insurance contracts, shares 48,442 647 6,641 55,730 Assets under insurance contracts, derivatives 2,397 3,696 - 6,093
Total 745,940 1,157,323 26,521 1,929,784 Financial liabilities Derivatives 3,313 369,475 15,908 388,696 Obligations to repurchase securities 142,965 189 10 143,164 Liabilities held for sale - - - - Bonds issued by Realkredit Danmark 614,325 - - 614,325 Deposits under pooled schemes and unit-linked investment contracts - 78,741 - 78,741
Total 760,603 448,405 15,918 1,224,926
2011
Financial assets
Derivatives 3,948 529,305 17,717 550,970
Trading portfolio bonds 348,141 9,953 - 358,094
Trading portfolio shares 348 - 343 691
Investment securities, bonds 86,374 8,772 - 95,146
Investment securities, shares 133 - 2,587 2,720
Loans at fair value - 720,741 - 720,741
Assets under pooled schemes and unit-linked in-vestment contracts 61,888 - - 61,888
Assets under insurance contracts, bonds 144,855 2,491 151 147,497
Assets under insurance contracts, shares 43,524 526 4,728 48,778
Assets under insurance contracts, derivatives 1,085 3,528 - 4,613
Total 690,296 1,275,316 25,526 1,991,138 Financial liabilities
Derivatives 4,368 510,721 18,972 534,061 Obligations to repurchase securities 163,092 743 17 163,852
Bonds issued by Realkredit Danmark 557,699 - - 557,699
Deposits under pooled schemes and unit-linked in-vestment contracts - 69,211 - 69,211
Total 725,159 580,675 18,989 1,324,823
At 31 December 2012, financial instruments valued on the basis of non-observable input comprised unlisted shares of DKK 10,184 million (31 December 2011: DKK 7,658 million), illiquid bonds of DKK 586 million (31 December 2011: DKK 151 million) and deriva-tives with a net market value of DKK -167 million (31 December 2011: DKK -1,255 million). A 10% increase or decrease in the fair value of unlisted shares would amount to DKK 1,018 million (2011: DKK 766 million), with DKK 664 million (2011: DKK 473 million) relating to shares allocated to policyholders, who assume most of the risk on the shares. The estimated fair value of illiquid bonds de-pends significantly on the estimated credit spread.
42 (cont'd)
110 DANSKE BANK / GROUP 2012
NOTES – DANSKE BANK GROUP
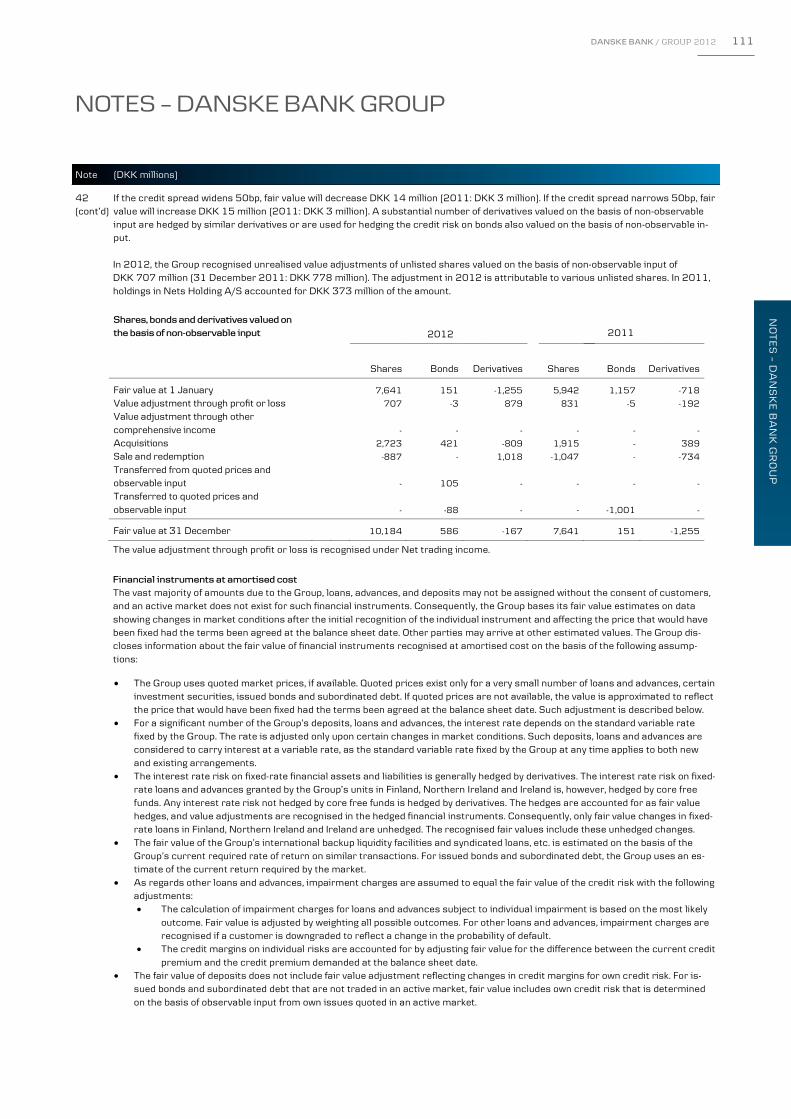
NOTES – DANSKE BANK GROUP
Note (DKK millions)
DANSKE BANK ANNUAL REPORT 2012 62
Quoted Observable Non-observable 2012 prices input input Total
Financial assets Derivatives 2,843 390,406 15,741 408,990 Trading portfolio bonds 384,075 16,666 - 400,741 Trading portfolio shares 2,675 - 521 3,196 Investment securities, bonds 85,317 11,013 - 96,330 Investment securities, shares 52 - 3,032 3,084 Loans at fair value - 732,762 - 732,762 Assets under pooled schemes and unit-linked in-vestment contracts 70,625 - - 70,625 Assets under insurance contracts, bonds 149,514 2,133 586 152,233 Assets under insurance contracts, shares 48,442 647 6,641 55,730 Assets under insurance contracts, derivatives 2,397 3,696 - 6,093
Total 745,940 1,157,323 26,521 1,929,784 Financial liabilities Derivatives 3,313 369,475 15,908 388,696 Obligations to repurchase securities 142,965 189 10 143,164 Liabilities held for sale - - - - Bonds issued by Realkredit Danmark 614,325 - - 614,325 Deposits under pooled schemes and unit-linked investment contracts - 78,741 - 78,741
Total 760,603 448,405 15,918 1,224,926
2011
Financial assets
Derivatives 3,948 529,305 17,717 550,970
Trading portfolio bonds 348,141 9,953 - 358,094
Trading portfolio shares 348 - 343 691
Investment securities, bonds 86,374 8,772 - 95,146
Investment securities, shares 133 - 2,587 2,720
Loans at fair value - 720,741 - 720,741
Assets under pooled schemes and unit-linked in-vestment contracts 61,888 - - 61,888
Assets under insurance contracts, bonds 144,855 2,491 151 147,497
Assets under insurance contracts, shares 43,524 526 4,728 48,778
Assets under insurance contracts, derivatives 1,085 3,528 - 4,613
Total 690,296 1,275,316 25,526 1,991,138 Financial liabilities
Derivatives 4,368 510,721 18,972 534,061 Obligations to repurchase securities 163,092 743 17 163,852
Bonds issued by Realkredit Danmark 557,699 - - 557,699
Deposits under pooled schemes and unit-linked in-vestment contracts - 69,211 - 69,211
Total 725,159 580,675 18,989 1,324,823
At 31 December 2012, financial instruments valued on the basis of non-observable input comprised unlisted shares of DKK 10,184 million (31 December 2011: DKK 7,658 million), illiquid bonds of DKK 586 million (31 December 2011: DKK 151 million) and deriva-tives with a net market value of DKK -167 million (31 December 2011: DKK -1,255 million). A 10% increase or decrease in the fair value of unlisted shares would amount to DKK 1,018 million (2011: DKK 766 million), with DKK 664 million (2011: DKK 473 million) relating to shares allocated to policyholders, who assume most of the risk on the shares. The estimated fair value of illiquid bonds de-pends significantly on the estimated credit spread.
42 (cont'd)
NOTES – DANSKE BANK GROUP
Note (DKK millions)
DANSKE BANK ANNUAL REPORT 2012 63
42 If the credit spread widens 50bp, fair value will decrease DKK 14 million (2011: DKK 3 million). If the credit spread narrows 50bp, fair (cont’d) value will increase DKK 15 million (2011: DKK 3 million). A substantial number of derivatives valued on the basis of non-observable
input are hedged by similar derivatives or are used for hedging the credit risk on bonds also valued on the basis of non-observable in-put.
In 2012, the Group recognised unrealised value adjustments of unlisted shares valued on the basis of non-observable input of DKK 707 million (31 December 2011: DKK 778 million). The adjustment in 2012 is attributable to various unlisted shares. In 2011, holdings in Nets Holding A/S accounted for DKK 373 million of the amount.
Shares, bonds and derivatives valued on the basis of non-observable input
2012 2011
Shares Bonds Derivatives Shares Bonds Derivatives
Fair value at 1 January 7,641 151 -1,255 5,942 1,157 -718
Value adjustment through profit or loss 707 -3 879 831 -5 -192
Value adjustment through other comprehensive income - - - - - -
Acquisitions 2,723 421 -809 1,915 - 389
Sale and redemption -887 - 1,018 -1,047 - -734
Transferred from quoted prices and observable input - 105 - - - -
Transferred to quoted prices and observable input - -88 - - -1,001 -
Fair value at 31 December 10,184 586 -167 7,641 151 -1,255
The value adjustment through profit or loss is recognised under Net trading income.
Financial instruments at amortised cost The vast majority of amounts due to the Group, loans, advances, and deposits may not be assigned without the consent of customers, and an active market does not exist for such financial instruments. Consequently, the Group bases its fair value estimates on data showing changes in market conditions after the initial recognition of the individual instrument and affecting the price that would have been fixed had the terms been agreed at the balance sheet date. Other parties may arrive at other estimated values. The Group dis-closes information about the fair value of financial instruments recognised at amortised cost on the basis of the following assump-tions: • The Group uses quoted market prices, if available. Quoted prices exist only for a very small number of loans and advances, certain
investment securities, issued bonds and subordinated debt. If quoted prices are not available, the value is approximated to reflect the price that would have been fixed had the terms been agreed at the balance sheet date. Such adjustment is described below.
• For a significant number of the Group’s deposits, loans and advances, the interest rate depends on the standard variable rate fixed by the Group. The rate is adjusted only upon certain changes in market conditions. Such deposits, loans and advances are considered to carry interest at a variable rate, as the standard variable rate fixed by the Group at any time applies to both new and existing arrangements.
• The interest rate risk on fixed-rate financial assets and liabilities is generally hedged by derivatives. The interest rate risk on fixed-rate loans and advances granted by the Group’s units in Finland, Northern Ireland and Ireland is, however, hedged by core free funds. Any interest rate risk not hedged by core free funds is hedged by derivatives. The hedges are accounted for as fair value hedges, and value adjustments are recognised in the hedged financial instruments. Consequently, only fair value changes in fixed-rate loans in Finland, Northern Ireland and Ireland are unhedged. The recognised fair values include these unhedged changes.
• The fair value of the Group’s international backup liquidity facilities and syndicated loans, etc. is estimated on the basis of the Group’s current required rate of return on similar transactions. For issued bonds and subordinated debt, the Group uses an es-timate of the current return required by the market.
• As regards other loans and advances, impairment charges are assumed to equal the fair value of the credit risk with the following adjustments: • The calculation of impairment charges for loans and advances subject to individual impairment is based on the most likely
outcome. Fair value is adjusted by weighting all possible outcomes. For other loans and advances, impairment charges are recognised if a customer is downgraded to reflect a change in the probability of default.
• The credit margins on individual risks are accounted for by adjusting fair value for the difference between the current credit premium and the credit premium demanded at the balance sheet date.
• The fair value of deposits does not include fair value adjustment reflecting changes in credit margins for own credit risk. For is-sued bonds and subordinated debt that are not traded in an active market, fair value includes own credit risk that is determined on the basis of observable input from own issues quoted in an active market.
DANSKE BANK / GROUP 2012 111
NO
TE
S – D
AN
SK
E B
AN
K G
RO
UP
NOTES – DANSKE BANK GROUP

NOTES – DANSKE BANK GROUP
Note (DKK millions)
DANSKE BANK ANNUAL REPORT 2012 64
42 Fair value calculations for financial instruments recognised at amortised cost rely largely on estimates and are subject to significant (cont’d) uncertainty.
The fair value of 93% of the Group’s financial assets is based on models with non-observable input (2011: 93%). The cor
figure for financial liabilities is 69% (2011: 67%). responding
2012 Carrying amount Fair value Quoted prices
Observable input
Non-observable input
Financial assets Cash in hand and demand deposits with central banks 97,267 97,267 11,235 - 86,032 Due from credit institutions and central banks 200,646 200,646 - 13,989 186,657 Investment securities 8,310 8,461 7,861 - 600 Loans and advances at amortised cost 1,161,816 1,148,130 - 73,457 1,074,673 Assets under insurance contracts - - - - -
Total 1,468,039 1,454,504 19,096 87,446 1,347,961
Financial liabilities
Due to credit institutions and central banks 459,932 459,932 - 100,167 359,765 Deposits 929,092 929,111 - 89,061 840,050 Other issued bonds 340,005 343,394 263,644 63,654 16,096 Subordinated debt 67,785 64,323 40,308 - 24,015 Irrevocable loan commitments and guarantees 1,253 1,198 - - 1,198
Total 1,798,067 1,797,958 303,952 252,882 1,241,124
2011
Financial assets
Cash in hand and demand deposits with central banks 28,617 28,617 10,602 - 18,015
Due from credit institutions and central banks 180,870 180,870 - 5,439 175,431
Investment securities 11,398 11,248 8,461 - -
Loans and advances at amortised cost 1,126,482 1,109,779 - 64,229 1,045,551
Assets under insurance contracts - - - - -
Total 1,347,367 1,330,514 19,063 69,668 1,238,996
Financial liabilities
Due to credit institutions and central banks 393,388 393,388 - 94,972 393,388
Deposits 848,994 849,261 - 129,593 719,669
Other issued bonds 366,920 360,421 - 360,421 -
Subordinated debt 67,328 56,945 - 56,945 -
Irrevocable loan commitments and guarantees 465 206 - - 206
Total 1,677,095 1,660,221 - 641,930 1,113,263
112 DANSKE BANK / GROUP 2012
NOTES – DANSKE BANK GROUP

NOTES – DANSKE BANK GROUP
Note (DKK millions)
DANSKE BANK ANNUAL REPORT 2012 64
42 Fair value calculations for financial instruments recognised at amortised cost rely largely on estimates and are subject to significant (cont’d) uncertainty.
The fair value of 93% of the Group’s financial assets is based on models with non-observable input (2011: 93%). The cor
figure for financial liabilities is 69% (2011: 67%). responding
2012 Carrying amount Fair value Quoted prices
Observable input
Non-observable input
Financial assets Cash in hand and demand deposits with central banks 97,267 97,267 11,235 - 86,032 Due from credit institutions and central banks 200,646 200,646 - 13,989 186,657 Investment securities 8,310 8,461 7,861 - 600 Loans and advances at amortised cost 1,161,816 1,148,130 - 73,457 1,074,673 Assets under insurance contracts - - - - -
Total 1,468,039 1,454,504 19,096 87,446 1,347,961
Financial liabilities
Due to credit institutions and central banks 459,932 459,932 - 100,167 359,765 Deposits 929,092 929,111 - 89,061 840,050 Other issued bonds 340,005 343,394 263,644 63,654 16,096 Subordinated debt 67,785 64,323 40,308 - 24,015 Irrevocable loan commitments and guarantees 1,253 1,198 - - 1,198
Total 1,798,067 1,797,958 303,952 252,882 1,241,124
2011
Financial assets
Cash in hand and demand deposits with central banks 28,617 28,617 10,602 - 18,015
Due from credit institutions and central banks 180,870 180,870 - 5,439 175,431
Investment securities 11,398 11,248 8,461 - -
Loans and advances at amortised cost 1,126,482 1,109,779 - 64,229 1,045,551
Assets under insurance contracts - - - - -
Total 1,347,367 1,330,514 19,063 69,668 1,238,996
Financial liabilities
Due to credit institutions and central banks 393,388 393,388 - 94,972 393,388
Deposits 848,994 849,261 - 129,593 719,669
Other issued bonds 366,920 360,421 - 360,421 -
Subordinated debt 67,328 56,945 - 56,945 -
Irrevocable loan commitments and guarantees 465 206 - - 206
Total 1,677,095 1,660,221 - 641,930 1,113,263
NOTES – DANSKE BANK GROUP
Note
DANSKE BANK ANNUAL REPORT 2012 65
43 Group holdings and undertakings
Share capital Net profit Shareholders' equity Share capital (thousands) (DKK m) (DKK m) (%)
Danske Bank A/S, Copenhagen DKK 10,086,200 4,749 138,234
Credit institutions
Realkredit Danmark A/S, Copenhagen DKK 630,000 2,439 46,410 100
Danske Bank Oyj, Helsinki EUR 106,000 869 17,747 100
Northern Bank Limited, Belfast GBP 218,170 -476 5,903 100
Danske Bank International S.A., Luxembourg EUR 90,625 99 1,088 100
Danske Bank, St. Petersburg RUB 1,048,000 23 282 100
Insurance operations Forsikringsselskabet Danica, Skadeforsikringsaktieselskab af 1999, Copenhagen DKK 1,000,000 1,786 18,986 100
Danica Pension, Livsforsikringsaktieselskab, Copenhagen DKK 1,100,000 1,747 18,986 100
Danica Pension Försäkringsaktiebolag, Stockholm SEK 100,000 13 69 100 Danica Pensjonsforsikring AS, Trondheim NOK 106,344 69 271 100 Danica Life Ltd., Dublin EUR 5,301 9 296 100 Investment and real property operations etc. Danica Ejendomsselskab ApS, Copenhagen DKK 2,627,590 585 21,252 100
Danske Capital AS, Tallinn EUR 3,003 11 115 100
Danske Capital Norge AS, Trondheim NOK 6,000 20 70 100
DDB Invest AB, Linköping SEK 100,000 15 442 100
Danske Corporation, Delaware USD 4 0 1 100
Danske Invest Management A/S, Copenhagen DKK 118,000 13 155 100
Danske Leasing A/S, Birkerød DKK 10,000 111 1,654 100
Danske Markets Inc., Delaware USD 2,000 -11 56 100
Danske Private Equity A/S, Copenhagen DKK 5,000 39 44 100
Fokus Krogsveen AS, Trondheim NOK 25,000 43 154 100
Gonzalo Residential Asset Trust, Delaware USD 0 71 1,383 100
home a/s, Åbyhøj DKK 15,000 4 130 100 National Irish Asset Finance Ltd., Dublin EUR 32,382 -4 152 100 UAB Danske Lizingas, Vilnius LTL 4,000 7 78 100
The list above includes major active subsidiary operations only. The financial information above provides the basis for consolidation in the consolidated financial statements. All credit institutions and insurance companies supervised by national FSAs are subject to local statutory capital requirements. These requirements restrict intra-group facilities and dividend payouts. Danica Pension has an obligation to allocate part of the margin by which Danica Pension’s equity exceeds the statutory solvency requirement to certain policyholders who were previously policyholders of Statsanstalten for Livsforsikring (now part of Danica Pension). This applies only if the margin exceeds the margin in Statsanstalten for Livsforsikring before the privatisation in 1990. In addition, it is the intention for Danica Pension not to distribute dividends for a period of at least 25 years from 1990. Paid-up capital and interest thereon may, however, be distributed. Under the agreement with the Danish Ministry of Business and Growth, Danica Pension may distribute dividends until 1 January 2014 only if its solvency exceeds the minimum requirement by 175%.
DANSKE BANK / GROUP 2012 113
NO
TE
S – D
AN
SK
E B
AN
K G
RO
UP
NOTES – DANSKE BANK GROUP

NOTES – DANSKE BANK GROUP
Note (DKK millions)
DANSKE BANK ÅRSRAPPORT 2011 66
44 New business segments
Business segmentation and business segment reporting will change from 2013 because of the new organisational structure implement-ed on 1 June 2012. Banking Activities have been split into Personal Banking, Business Banking and Corporates & Institutions. The Corpo-rates & Institutions unit includes Danske Markets.
In 2013, business segment reporting and the financial highlights will be subject to the following changes:
• The internal funds transfer pricing model will change. The new model will better reflect future international liquidity require-ments and guidelines for funds transfer pricing. In business segment reporting, the change will reduce net interest income at Personal Banking, Business Banking and C&I and increase net interest income at Other Activities. In the financial highlights, the change will result in lower net interest income and higher trading income.
• Operational leasing, excluding property leasing, will be presented on a net basis under Other income. In business segment re-porting, the change will reduce other income and expenses primarily at Business Banking . In the financial highlights, the effect of the change will also be a reduction of other income and expenses.
• The non-core activities will be presented as a separate business segment in business segment reporting, and the income statement effect of the non-core activities will be presented as a separate line item in the financial highlights.
The effect of these changes on the financial highlights for 2012 are presented in the table below.
Change
Adjusted Highlights Funds highlights
2012 transfer pricing Non-core Leasing Other 2012
Net interest income 24,788 -1,475 -428 - -204 22,681
Net fee income 8,782 - -26 - 94 8,850
Net trading income 8,901 1,475 8 - 110 10,494
Other income 2,951 - - -1,665 - 1,286
Net income from insurance business 2,263 - - - - 2,263
Total income 47,685 - -446 -1,665 - 45,574
Expenses 26,588 - -275 -1,665 - 24,648
Profit before loan impairment charges 21,097 - -171 - - 20,926
Loan impairment charges 12,529 - -4,849 - - 7,680
Profit before tax, core - - - - 13,246
Profit before tax, Non-core - -4,678 - - -4,678
Profit before tax 8,568 - - - - 8,568
Tax 3,819 - - - - 3,819
Net profit for the year 4,749 - - - - 4,749
The Group’s activities are segmented into business units in accordance with legislative requirements and by product and service charac-teristics. After the implementation of the new organisation, the Group now consists of the following units: Personal Banking serves personal and private banking customers. The unit focuses on offering first-class self-service products and proac-tive advice to customers with more complex finances. Personal Banking will set new standards for digital innovation and advisory solutions, and will offer detailed advice to customers who require this. Business Banking serves small and medium-sized businesses through a large network of finance centres, branches, contact centres and online channels. The unit offers leading solutions within financing, investing, cash management and risk management. Corporates & Institutions is a leading provider of wholesale banking services for the largest institutional and corporate customers in the Nordic region. Products and services include cash management services; trade finance solutions; custody services; equity, bond, foreign exchange and derivatives products; corporate finance; and acquisition finance. Danske Capital develops and sells asset and wealth management products and services that are marketed through Personal Banking and directly to businesses, institutional clients and external distributors. Danske Capital also supports the advisory and asset management ac-tivities of Personal Banking.
-
-
114 DANSKE BANK / GROUP 2012
NOTES – DANSKE BANK GROUP

NOTES – DANSKE BANK GROUP
Note (DKK millions)
DANSKE BANK ÅRSRAPPORT 2011 66
44 New business segments
Business segmentation and business segment reporting will change from 2013 because of the new organisational structure implement-ed on 1 June 2012. Banking Activities have been split into Personal Banking, Business Banking and Corporates & Institutions. The Corpo-rates & Institutions unit includes Danske Markets.
In 2013, business segment reporting and the financial highlights will be subject to the following changes:
• The internal funds transfer pricing model will change. The new model will better reflect future international liquidity require-ments and guidelines for funds transfer pricing. In business segment reporting, the change will reduce net interest income at Personal Banking, Business Banking and C&I and increase net interest income at Other Activities. In the financial highlights, the change will result in lower net interest income and higher trading income.
• Operational leasing, excluding property leasing, will be presented on a net basis under Other income. In business segment re-porting, the change will reduce other income and expenses primarily at Business Banking . In the financial highlights, the effect of the change will also be a reduction of other income and expenses.
• The non-core activities will be presented as a separate business segment in business segment reporting, and the income statement effect of the non-core activities will be presented as a separate line item in the financial highlights.
The effect of these changes on the financial highlights for 2012 are presented in the table below.
Change
Adjusted Highlights Funds highlights
2012 transfer pricing Non-core Leasing Other 2012
Net interest income 24,788 -1,475 -428 - -204 22,681
Net fee income 8,782 - -26 - 94 8,850
Net trading income 8,901 1,475 8 - 110 10,494
Other income 2,951 - - -1,665 - 1,286
Net income from insurance business 2,263 - - - - 2,263
Total income 47,685 - -446 -1,665 - 45,574
Expenses 26,588 - -275 -1,665 - 24,648
Profit before loan impairment charges 21,097 - -171 - - 20,926
Loan impairment charges 12,529 - -4,849 - - 7,680
Profit before tax, core - - - - 13,246
Profit before tax, Non-core - -4,678 - - -4,678
Profit before tax 8,568 - - - - 8,568
Tax 3,819 - - - - 3,819
Net profit for the year 4,749 - - - - 4,749
The Group’s activities are segmented into business units in accordance with legislative requirements and by product and service charac-teristics. After the implementation of the new organisation, the Group now consists of the following units: Personal Banking serves personal and private banking customers. The unit focuses on offering first-class self-service products and proac-tive advice to customers with more complex finances. Personal Banking will set new standards for digital innovation and advisory solutions, and will offer detailed advice to customers who require this. Business Banking serves small and medium-sized businesses through a large network of finance centres, branches, contact centres and online channels. The unit offers leading solutions within financing, investing, cash management and risk management. Corporates & Institutions is a leading provider of wholesale banking services for the largest institutional and corporate customers in the Nordic region. Products and services include cash management services; trade finance solutions; custody services; equity, bond, foreign exchange and derivatives products; corporate finance; and acquisition finance. Danske Capital develops and sells asset and wealth management products and services that are marketed through Personal Banking and directly to businesses, institutional clients and external distributors. Danske Capital also supports the advisory and asset management ac-tivities of Personal Banking.
-
-
NOTES – DANSKE BANK GROUP
Note (DKK millions)
DANSKE BANK ÅRSRAPPORT 2011 67
44 Danica Pension carries out the Group’s activities in the life insurance and pensions market. Danica Pension serves both personal and busi- (cont’d) ness customers. Its products are marketed through a range of channels in the Group, primarily Personal Banking and Danica Pension’s
own insurance brokers and advisers. Danica Pension offers market-based products that allow customers to select their own investment profiles and the return on savings depends on market trends. Danica Pension also offers Danica Traditionel. This product does not offer in-dividual investment profiles, and Danica Pension sets the rate of interest on policyholders’ savings. Other Activities encompasses Group Treasury, Group IT, Group Services and eliminations, including the elimination of returns on own shares. Group Treasury is responsible for the Group’s liquidity management and funding. Non-core includes certain customer segments that are no longer considered part of the core business. The Non-core unit is responsible for the controlled winding-up of this part of the loan portfolio. Existing exposures are either wound up or divested. The table below shows the new business segments with the adjusted 2012 figures.
Net interest income 11,172 9,497 1,975 8 - 29 - 22,681
Net fee income 3,715 2,155 1,115 1,945 - -80 - 8,850
Net trading income 815 489 8,439 -3 - 754 - 10,494
Other income 608 483 17 - - 178 - 1,286
Net income from insurance business - - - - 2,263 - - 2,263
Total income 16,310 12,624 11,546 1,950 2,263 881 - 45,574
Expenses 11,864 6,030 4,307 982 - 1,465 - 24,648
Profit before loan impairment charges 4,446 6,594 7,239 968 2,263 -584 - 20,926
Loan impairment charges 2,748 3,830 1,154 - - -52 - 7,680
Profit before tax, core 1,698 2,764 6,085 968 2,263 -532 - 13,246
Profit before tax, Non-core - - - - - - -4,678 -4,678
Profit before tax 1,698 2,764 6,085 968 2,263 -532 -4,678 8,568
Cost/income ratio (%) 72.7 47.8 37.3 50.4 - 166.3 - 54.1
Full-time-equivalent staff (end of year) 7,958 3,776 1,496 481 799 5,705 93 20,308
Loans and advances (end of year) 873,199 641,867 161,129 211 - -46,553 44,537 1,674,390
Deposits (end of year) 373,921 252,970 161,815 115 - -5,062 4,748 788,507 In 2012, core activities posted a profit before tax of DKK 13.2 billion. About 75% of income was generated by the three banking units, and about 25% came from the capital market activities at Danske Capital and the insurance business at Danica Pension. Non-core activities posted a significant loss of DKK 4.7 billion, mainly because of loan impairment charges of DKK 4.9 billion. Corporates & Institutions delivered a satisfactory profit before tax of DKK 6.1 billion. Lending amounted to about DKK 161 billion, or about 10% of total Group lending. Deposits amounted to DKK 162 billion, or almost 21% of total Group deposits. Business Banking generated a profit before tax of DKK 2.8 billion. Loan impairment charges against facilities to business customers were high, mainly because of the economic downturn. Lending amounted to DKK 642 billion, or about 38% of total Group lending. Deposits amounted to about DKK 253 billion, or 32% of total Group deposits. Personal Banking posted a profit before tax of DKK 1.7 billion as low interest rates continued to be a challenge. Lending, amounted to DKK 873 billion, or about 52% of total Group lending. Deposits amounted to DKK 374 billion, or about 47% of total Group deposits. Figures for lending include mortgage lending, which is funded through the issuance of listed mortgage bonds with matching terms.
Personal Business Danske Danica Other Non- Adjusted
(DKK millions) Banking Banking C&I Capital Pension Activities corehighlights
2012
DANSKE BANK / GROUP 2012 115
NO
TE
S – D
AN
SK
E B
AN
K G
RO
UP
NOTES – DANSKE BANK GROUP

NOTES – DANSKE BANK GROUP
Note
DANSKE BANK ANNUAL REPORT 2012 68
45 Significant accounting policies Contents 1. General 2. Standards and interpretations not yet in force 3. Consolidation 4. Segment reporting 5. Offsetting 6. Translation of transaction in foreign currency BALANCE SHEET 7. Financial instruments – general 8. Due from credit institutions and central banks 9. Trading portfolio (assets and liabilities) 10. Investment securities 11. Loans and advances at amortised cost 12. Loans at fair value and bonds issued by Realkredit
Danmark 13. Assets and deposits under pooled schemes and unit-
linked investment contracts 14. Assets and liabilities under insurance contracts 15. Intangible assets 16. Investment property 17. Tangible assets 18. Other assets 19. Amounts due to credit institutions and central banks
and Deposits 20. Other issued bonds and Subordinated debt 21. Other liabilities 22. Deferred tax assets and Deferred tax liabilities 23. Current tax assets and Current tax liabilities 24. Shareholders’ equity 25. Contingent assets and Contingent liabilities INCOME STATEMENT 26. Interest income and expenses 27. Fee income and expenses 28. Net trading income 29. Other income 30. Net premiums 31. Net insurance benefits 32. Income from associates 33. Profit on sale of associates and group undertakings 34. Staff costs and administrative expenses 35. Amortisation, depreciation and impairment charges 36. Loan impairment charges 37. Tax 38. Comprehensive income 39. Cash flow statement 40. Financial highlights
1. General Danske Bank Group prepares its consolidated financial statements in accordance with the International Financial Reporting Standards (IFRSs), issued by the International Accounting Standards Board (IASB), as adopted by the EU and with applicable interpretations issued by the Interna-tional Financial Reporting Interpretations Committee (IFRIC). Furthermore, the consolidated financial statements comply with the requirements for annual reports formu-lated by NASDAQ OMX Copenhagen and the Danish FSA’s executive order No. 1306 dated 16 December 2008 on the use of IFRSs by undertakings subject to the Danish Finan-cial Business Act. The Group has not changed its significant accounting poli-cies from those followed in Annual Report 2011. Note 1 describes the Group’s significant accounting esti-mates. 2. Standards and interpretations not yet in force The IASB has issued a number of amendments to IFRSs that have not yet come into force. Similarly, the IFRIC has issued a new interpretation that has not yet come into force. The sections below explain the changes that are likely to affect the Group’s future financial reporting. In October 2010, the IASB reissued IFRS 9, Financial In-struments. The aim of the reissuance project is, once the amendments to IFRS 9 are completed, to let the standard replace IAS 39 in its entirety. IFRS 9 now provides princi-ples for classification and derecognition of financial instru-ments. Principles for impairment and hedge accounting are expected to follow in 2013 or later. The IASB has released a proposal to make certain changes to the principles for classification. The transitional rules of the amended IFRS 9 prescribe im-plementation of the standard by 2015. The EU has decided to postpone adoption of the amended IFRS 9 until all details of the standard are known. Under the amended IFRS 9, financial assets are classified on the basis of the business model adopted for managing the assets and on the basis of their contractual cash flow characteristics, including any embedded derivatives (unlike IAS 39, IFRS 9 no longer requires bifurcation). Assets held with the objective of collecting contractual cash flows that are solely payments of principal and interest are measured at amortised cost. Other assets are measured at fair value through profit or loss. Equities may be measured at fair value through Other comprehensive income, however, and satisfying certain requirements, a business may opt for fair value adjustment of its loans, advances, etc. The principles applicable to financial liabilities are largely unchanged from IAS 39. Generally, financial liabilities are still measured at amortised cost with bifurcation of embed-ded derivatives not closely related to a host contract. Fi-nancial liabilities measured at fair value comprise deriva-tives, the trading portfolio and liabilities designated at fair value through profit or loss. Value adjustments relating to the inherent credit risk of financial liabilities designated at fair value are, however, recognised in Other comprehensive income unless this leads to an accounting mismatch.
116 DANSKE BANK / GROUP 2012
NOTES – DANSKE BANK GROUP

NOTES – DANSKE BANK GROUP
Note
DANSKE BANK ANNUAL REPORT 2012 68
45 Significant accounting policies Contents 1. General 2. Standards and interpretations not yet in force 3. Consolidation 4. Segment reporting 5. Offsetting 6. Translation of transaction in foreign currency BALANCE SHEET 7. Financial instruments – general 8. Due from credit institutions and central banks 9. Trading portfolio (assets and liabilities) 10. Investment securities 11. Loans and advances at amortised cost 12. Loans at fair value and bonds issued by Realkredit
Danmark 13. Assets and deposits under pooled schemes and unit-
linked investment contracts 14. Assets and liabilities under insurance contracts 15. Intangible assets 16. Investment property 17. Tangible assets 18. Other assets 19. Amounts due to credit institutions and central banks
and Deposits 20. Other issued bonds and Subordinated debt 21. Other liabilities 22. Deferred tax assets and Deferred tax liabilities 23. Current tax assets and Current tax liabilities 24. Shareholders’ equity 25. Contingent assets and Contingent liabilities INCOME STATEMENT 26. Interest income and expenses 27. Fee income and expenses 28. Net trading income 29. Other income 30. Net premiums 31. Net insurance benefits 32. Income from associates 33. Profit on sale of associates and group undertakings 34. Staff costs and administrative expenses 35. Amortisation, depreciation and impairment charges 36. Loan impairment charges 37. Tax 38. Comprehensive income 39. Cash flow statement 40. Financial highlights
1. General Danske Bank Group prepares its consolidated financial statements in accordance with the International Financial Reporting Standards (IFRSs), issued by the International Accounting Standards Board (IASB), as adopted by the EU and with applicable interpretations issued by the Interna-tional Financial Reporting Interpretations Committee (IFRIC). Furthermore, the consolidated financial statements comply with the requirements for annual reports formu-lated by NASDAQ OMX Copenhagen and the Danish FSA’s executive order No. 1306 dated 16 December 2008 on the use of IFRSs by undertakings subject to the Danish Finan-cial Business Act. The Group has not changed its significant accounting poli-cies from those followed in Annual Report 2011. Note 1 describes the Group’s significant accounting esti-mates. 2. Standards and interpretations not yet in force The IASB has issued a number of amendments to IFRSs that have not yet come into force. Similarly, the IFRIC has issued a new interpretation that has not yet come into force. The sections below explain the changes that are likely to affect the Group’s future financial reporting. In October 2010, the IASB reissued IFRS 9, Financial In-struments. The aim of the reissuance project is, once the amendments to IFRS 9 are completed, to let the standard replace IAS 39 in its entirety. IFRS 9 now provides princi-ples for classification and derecognition of financial instru-ments. Principles for impairment and hedge accounting are expected to follow in 2013 or later. The IASB has released a proposal to make certain changes to the principles for classification. The transitional rules of the amended IFRS 9 prescribe im-plementation of the standard by 2015. The EU has decided to postpone adoption of the amended IFRS 9 until all details of the standard are known. Under the amended IFRS 9, financial assets are classified on the basis of the business model adopted for managing the assets and on the basis of their contractual cash flow characteristics, including any embedded derivatives (unlike IAS 39, IFRS 9 no longer requires bifurcation). Assets held with the objective of collecting contractual cash flows that are solely payments of principal and interest are measured at amortised cost. Other assets are measured at fair value through profit or loss. Equities may be measured at fair value through Other comprehensive income, however, and satisfying certain requirements, a business may opt for fair value adjustment of its loans, advances, etc. The principles applicable to financial liabilities are largely unchanged from IAS 39. Generally, financial liabilities are still measured at amortised cost with bifurcation of embed-ded derivatives not closely related to a host contract. Fi-nancial liabilities measured at fair value comprise deriva-tives, the trading portfolio and liabilities designated at fair value through profit or loss. Value adjustments relating to the inherent credit risk of financial liabilities designated at fair value are, however, recognised in Other comprehensive income unless this leads to an accounting mismatch.
NOTES – DANSKE BANK GROUP
Note
DANSKE BANK ANNUAL REPORT 2012 69
45 IFRS 9 incorporates the existing derecognition principles of (cont’d) IAS 39.
Meaningful classification of financial instruments is not possible without information about the future parts of IFRS 9 to clarify the overall accounting effects of the standard. The IASB ended its project on consolidation in May 2011 by issuing a number of new International Financial Report-ing Standards (IFRS 10, IFRS 11 and IFRS 12) and revised standards (IAS 27 and IAS 28). With these standards, the IASB establishes a uniform definition of control to be used for determining whether an entity should be consolidated and introduces enhanced disclosure requirements for con-solidated and unconsolidated entities, joint arrangements and associates. Danske Bank will adopt the standard from 1 January 2014 in accordance with the EU’s postponement of the effective date by one year. The Group does not expect the new requirements to significantly change its consolida-tion of businesses. In May 2011, the IASB issued IFRS 13, Fair Value Meas-urement. The standard introduces a new definition of fair value and provides guidance on how to measure fair value along with disclosure requirements for fair value. IFRS 13 applies when another standard requires fair value to be used or disclosed. The standard was adopted from 1 Janu-ary 2013. Adoption did not result in any significant effect on the Group’s financial results. In June 2011, the IASB reissued IAS 19, Employee Bene-fits. The amended standard eliminates the option of defer-ring the recognition of actuarial gains and losses on defined benefit pension plans, known as the “corridor method”. The present value of pension obligations and the fair value of pension plan assets must be recognised in the balance sheet instead. The Group will adopt the standard from the beginning of 2013 with restatement of comparative figures for 2012. The new requirements will increase sharehold-ers’ equity at 1 January 2012 by DKK 290 million (the amount deferred under the corridor method net of tax). The end-2012 effect will be an increase of net pension obliga-tions of DKK 235 million, a reduction of deferred tax of DKK 59 million and a reduction of shareholders’ equity of DKK 176 million. The net profit for 2012 will be increased by DKK 20 million because of decreased pension costs (af-ter tax). Actuarial losses of DKK 467 million after tax will be recognised in Other comprehensive income for 2012. The effect on earnings per share is insignificant. The Statement of capital will not be affected as it is already prepared without the use of the corridor method. In December 2011, the IASB clarified the IAS 32 require-ments for offsetting financial instruments. The clarification is not expected to increase the offsetting of financial in-struments to any significant degree. The IASB also en-hanced its IFRS 7 disclosure requirements to include both gross and net amounts when offsetting financial instru-ments and rights to additional set-off in the event of coun-terparty default. The changes, which have not yet been adopted by the EU, are expected to be implemented in 2014 and 2013, respectively.
3. Consolidation Group undertakings The financial statements consolidate Danske Bank A/S and group undertakings in which the Group has control over fi-nancial and operating policy decisions. Control is said to ex-ist if Danske Bank A/S, directly or indirectly, holds more than half of the voting rights in an undertaking or otherwise has power to control management and operating policy de-cisions, provided that most of the return on the undertaking accrues to the Group and that the Group assumes most of the risk. Operating policy control may be exercised through agreements about the undertaking’s activities. Potential voting rights exercisable at the balance sheet date are in-cluded in the assessment of whether Danske Bank A/S con-trols an undertaking. The consolidated financial statements are prepared by consolidating items of the same nature and eliminating in-tra-group transactions, balances and trading profits and losses. Undertakings acquired are included in the financial state-ments at the time of acquisition. The net assets of such un-dertakings (assets, including identifiable intangible assets, less liabilities and contingent liabilities) are measured at fair value at the date of acquisition according to the acquisi-tion method. If the cost of acquisition (until 1 January 2010 including di-rect transaction costs ) exceeds the fair value of the net as-sets acquired, the excess amount is recognised as goodwill. Goodwill is recognised in the functional currency of the un-dertaking acquired. If the fair value of the net assets ex-ceeds the cost of acquisition (negative goodwill), the excess amount is recognised as income at the date of acquisition. The portion of the acquisition that is attributable to non-controlling interests does not include goodwill. Divested undertakings are included in the financial state-ments until the transfer date. Held-for-sale group undertakings The assets and liabilities of undertakings that are actively marketed for sale and expected to be sold within 12 months of classification are recognised under Other assets and Other liabilities at the lower of cost and fair value less ex-pected costs to sell. Associates Associates are businesses, other than group undertakings, in which the Group has holdings and significant but not con-trolling influence. The Group generally classifies businesses as associates if Danske Bank A/S, directly or indirectly, holds 20-50% of the share capital and has influence over management and operating policy decisions. Holdings are recognised at cost at the date of acquisition and are subsequently measured according to the equity method. The proportionate share of the net profit or loss of the individual business is included under Income from as-sociates. The share is calculated on the basis of data from financial statements with balance sheet dates no earlier than three months before the Group’s balance sheet date.
DANSKE BANK / GROUP 2012 117
NO
TE
S – D
AN
SK
E B
AN
K G
RO
UP
NOTES – DANSKE BANK GROUP

NOTES – DANSKE BANK GROUP
Note
DANSKE BANK ANNUAL REPORT 2012 70
45 The proportionate share of the profit or loss on transac- (cont’d) tions between associates and group undertakings is elimi-
nated. Voting rights held by the Group’s insurance business are not included in the holding that determines whether or not a business is an associate. Such holdings are treated as held by a venture capital organisation and measured at fair value. 4. Segment reporting The Group consists of a number of business units and re-source and support functions. The business units are seg-mented according to legislation and product and services characteristics. Segment reporting complies with the Group’s significant accounting policies. Inter-segment transactions are settled on an arm’s-length basis. Expenses incurred centrally, including expenses in-curred by support, administrative and back-office functions, are charged to the business units according to consump-tion and activity at calculated unit prices or market prices, if available. Segment assets and liabilities are assets and liabilities that are used for maintaining the operating activities of a seg-ment or have come into existence as a result of such activi-ties and that are either directly attributable or may be rea-sonably allocated to a segment. A calculated share of shareholders’ equity is allocated to each segment. Other assets and liabilities are recognised in the Other activities segment. Liquidity expenses are allocated on the basis of a maturity analysis of loans and deposits. Prices are based on inter-bank rates and funding spreads. 5. Offsetting Assets and liabilities are netted when the Group has a le-gally enforceable right to set off recognised amounts and in-tends either to settle the balance on a net basis or to real-ise the asset and settle the liability simultaneously. 6. Translation of transactions in foreign currency The presentation currency of the consolidated financial statements is Danish kroner. The functional currency of each of the Group’s units is the currency of the country in which the unit is domiciled, as most income and expenses are settled in the local currency. Transactions in foreign currency are translated at the ex-change rate of the unit’s functional currency at the transac-tion date. Gains and losses on exchange rate differences between the transaction date and the settlement date are recognised in the income statement. Monetary assets and liabilities in foreign currency are translated at the exchange rates at the balance sheet date. Exchange rate adjustments of monetary assets and liabili-ties arising as a result of differences in the exchange rates at the transaction date and at the balance sheet date are recognised in the income statement. Non-monetary assets and liabilities in foreign currency that are subsequently re-valued at fair value are translated at the exchange rates
at the date of revaluation. Exchange rate adjustments are included in the fair value adjustment of an asset or liability. Other non-monetary items in foreign currency are trans-lated at the exchange rates at the transaction date. Translation of units outside Denmark Assets and liabilities of units outside Denmark are trans-lated into Danish kroner at the exchange rates at the bal-ance sheet date. Income and expenses are translated at the exchange rates at the transaction date. Gains and losses arising at the translation of net investments in units outside Denmark are recognised in Other comprehensive income. Net investments include the net assets and goodwill of the units as well as holdings in the form of subordinated loan capital. Exchange rate adjustments of financial liabilities used for hedging the Group’s net investments are also rec-ognised in Other comprehensive income.
BALANCE SHEET 7. Financial instruments – general Purchases and sales of financial instruments are measured at fair value at the settlement date. Fair value adjustments of unsettled financial instruments are recognised from the trading date to the settlement date. Note 1, Significant accounting estimates, explains the clas-sification of financial assets and liabilities. 8. Due from credit institutions and central banks Amounts due from credit institutions and central banks comprise amounts due from other credit institutions and term deposits with central banks. Reverse transactions (purchases of securities from credit institutions and central banks that the Group agrees to resell at a later date) are recognised as amounts due from credit institutions and central banks. Amounts due from credit institutions and central banks are measured at amortised cost as described under Loans and advances at amortised cost. 9. Trading portfolio (assets and liabilities) Trading portfolio assets comprise the equities, bonds and derivatives with positive fair value held by the Group’s trad-ing departments. Trading portfolio liabilities consist of de-rivatives with negative fair value and obligations to deliver securities (obligations to repurchase securities). At initial recognition, the trading portfolio is measured at fair value, excluding transaction costs. Subsequently, the portfolio is measured at fair value through profit or loss. Realised and unrealised capital gains and losses and divi-dends are recognised in the income statement under Net trading income. Determination of fair value The fair value of financial assets and liabilities is measured on the basis of quoted market prices of financial instru-ments traded in active markets. The fair value of such in-struments is therefore based on the most recently ob-served market price at the balance sheet date.
118 DANSKE BANK / GROUP 2012
NOTES – DANSKE BANK GROUP
NOTES – DANSKE BANK GROUP
Note
DANSKE BANK ANNUAL REPORT 2012 70
45 The proportionate share of the profit or loss on transac- (cont’d) tions between associates and group undertakings is elimi-
nated. Voting rights held by the Group’s insurance business are not included in the holding that determines whether or not a business is an associate. Such holdings are treated as held by a venture capital organisation and measured at fair value. 4. Segment reporting The Group consists of a number of business units and re-source and support functions. The business units are seg-mented according to legislation and product and services characteristics. Segment reporting complies with the Group’s significant accounting policies. Inter-segment transactions are settled on an arm’s-length basis. Expenses incurred centrally, including expenses in-curred by support, administrative and back-office functions, are charged to the business units according to consump-tion and activity at calculated unit prices or market prices, if available. Segment assets and liabilities are assets and liabilities that are used for maintaining the operating activities of a seg-ment or have come into existence as a result of such activi-ties and that are either directly attributable or may be rea-sonably allocated to a segment. A calculated share of shareholders’ equity is allocated to each segment. Other assets and liabilities are recognised in the Other activities segment. Liquidity expenses are allocated on the basis of a maturity analysis of loans and deposits. Prices are based on inter-bank rates and funding spreads. 5. Offsetting Assets and liabilities are netted when the Group has a le-gally enforceable right to set off recognised amounts and in-tends either to settle the balance on a net basis or to real-ise the asset and settle the liability simultaneously. 6. Translation of transactions in foreign currency The presentation currency of the consolidated financial statements is Danish kroner. The functional currency of each of the Group’s units is the currency of the country in which the unit is domiciled, as most income and expenses are settled in the local currency. Transactions in foreign currency are translated at the ex-change rate of the unit’s functional currency at the transac-tion date. Gains and losses on exchange rate differences between the transaction date and the settlement date are recognised in the income statement. Monetary assets and liabilities in foreign currency are translated at the exchange rates at the balance sheet date. Exchange rate adjustments of monetary assets and liabili-ties arising as a result of differences in the exchange rates at the transaction date and at the balance sheet date are recognised in the income statement. Non-monetary assets and liabilities in foreign currency that are subsequently re-valued at fair value are translated at the exchange rates
at the date of revaluation. Exchange rate adjustments are included in the fair value adjustment of an asset or liability. Other non-monetary items in foreign currency are trans-lated at the exchange rates at the transaction date. Translation of units outside Denmark Assets and liabilities of units outside Denmark are trans-lated into Danish kroner at the exchange rates at the bal-ance sheet date. Income and expenses are translated at the exchange rates at the transaction date. Gains and losses arising at the translation of net investments in units outside Denmark are recognised in Other comprehensive income. Net investments include the net assets and goodwill of the units as well as holdings in the form of subordinated loan capital. Exchange rate adjustments of financial liabilities used for hedging the Group’s net investments are also rec-ognised in Other comprehensive income.
BALANCE SHEET 7. Financial instruments – general Purchases and sales of financial instruments are measured at fair value at the settlement date. Fair value adjustments of unsettled financial instruments are recognised from the trading date to the settlement date. Note 1, Significant accounting estimates, explains the clas-sification of financial assets and liabilities. 8. Due from credit institutions and central banks Amounts due from credit institutions and central banks comprise amounts due from other credit institutions and term deposits with central banks. Reverse transactions (purchases of securities from credit institutions and central banks that the Group agrees to resell at a later date) are recognised as amounts due from credit institutions and central banks. Amounts due from credit institutions and central banks are measured at amortised cost as described under Loans and advances at amortised cost. 9. Trading portfolio (assets and liabilities) Trading portfolio assets comprise the equities, bonds and derivatives with positive fair value held by the Group’s trad-ing departments. Trading portfolio liabilities consist of de-rivatives with negative fair value and obligations to deliver securities (obligations to repurchase securities). At initial recognition, the trading portfolio is measured at fair value, excluding transaction costs. Subsequently, the portfolio is measured at fair value through profit or loss. Realised and unrealised capital gains and losses and divi-dends are recognised in the income statement under Net trading income. Determination of fair value The fair value of financial assets and liabilities is measured on the basis of quoted market prices of financial instru-ments traded in active markets. The fair value of such in-struments is therefore based on the most recently ob-served market price at the balance sheet date.
NOTES – DANSKE BANK GROUP
Note
DANSKE BANK ANNUAL REPORT 2012 71
45 If a financial instrument is quoted in a market that is not (cont’d) active, the Group bases its measurement on the most re-
cent transaction price. Adjustment is made for subsequent changes in market conditions, for instance by including transactions in similar financial instruments that are as-sumed to be motivated by normal business considerations. If no active market exists for standard and simple financial instruments, such as interest rate and currency swaps and unlisted bonds, fair value is calculated on the basis of gen-erally accepted valuation techniques and market-based pa-rameters. The fair value of more complex financial instru-ments, such as swaptions and interest rate caps and floors, and other OTC products is measured on the basis of inter-nal models, many of which are based on valuation tech-niques generally accepted in the industry. Note 42 provides more information about fair value meas-urement and fair value adjustments. 10. Investment securities Investment securities consists of financial assets which, under the fair value option, the Group designates at fair value through profit or loss, available-for-sale financial as-sets and held-to-maturity investments. Financial assets at fair value Financial assets at fair value comprises securities man-aged on a fair value basis but without short-term profit-taking. Realised and unrealised capital gains and losses and dividends are recognised in the income statement under Net trading income. Available-for-sale financial assets Available-for-sale financial assets consists of bonds which, although traded in an active market at the time of acquisi-tion, the Group intends neither to sell in the near term nor to hold to maturity. Bonds treated as available-for-sale fi-nancial assets are measured at fair value at initial recogni-tion and subsequently at fair value through Other compre-hensive income. Unrealised value adjustments of hedged in-terest rate risks that qualify for fair value hedge accounting are, however, recognised under Net trading income. The Group recognises interest income according to the effec-tive interest method, amortising the difference between cost and the redemption value over the term to maturity of the bonds. If objective evidence of impairment exists as described un-der Loans and advances at amortised cost, the Group rec-ognises the impairment charge under Loan impairment charges. The impairment charge equals the difference be-tween the fair value at the time of calculation and amortised cost. If the fair value subsequently rises, and the increase is attributable to one or more events that have occurred after the impairment charge was recognised, the Group reverses the charge in the income statement. When bonds are sold, the Group reclassifies unrealised value adjustments recognised in Other comprehensive in-come under Net trading income in the income statement.
Held-to-maturity investments Held-to-maturity investments consists of bonds with quoted prices in an active market held for the purpose of generat-ing a return until maturity. Held-to-maturity investments are measured at amortised cost. 11. Loans and advances at amortised cost Loans and advances consists of loans and advances dis-bursed directly to borrowers and loans and advances ac-quired after disbursement. Loans and advances includes conventional bank loans; finance leases; mortgages and pledges; reverse transactions, except for transactions with credit institutions and central banks; and certain bonds not quoted in an active market at the time of acquisition. More-over, the item includes loans secured on real property, ex-cept for loans granted by Realkredit Danmark that are rec-ognised under Loans at fair value. At initial recognition, loans and advances are measured at fair value plus transaction costs less origination fees and other charges. This usually corresponds to the amount dis-bursed to the customer. Subsequently, they are measured at amortised cost, using the effective interest method, less any impairment charges. The difference between the value at initial recognition and the redemption value is amortised over the term to maturity and recognised under Interest in-come. If fixed-rate loans and advances and amounts due are hedged effectively by derivatives, the fair value of the hedged interest rate risk is added to the amortised cost of the assets. Impairment If objective evidence of impairment of a loan, an advance or an amount due exists, and the effect of the impairment event or events on the expected cash flow is reliably meas-urable, the Group determines the impairment charge indi-vidually. Objective evidence of impairment of loans and advances ex-ists if at least one of the following events has occurred: • The borrower is experiencing significant financial diffi-
culty. • The borrower’s actions, such as default or delinquency
in interest or principal payments, lead to a breach of contract.
• The Group, for reasons relating to the borrower’s fi-nancial difficulty, grants to the borrower a concession that the Group would not otherwise have granted.
• It becomes probable that the borrower will enter bank-ruptcy or other financial restructuring.
Significant loans, advances and amounts due are tested in-dividually for impairment at the end of each reporting pe-riod.
DANSKE BANK / GROUP 2012 119
NO
TE
S – D
AN
SK
E B
AN
K G
RO
UP
NOTES – DANSKE BANK GROUP

NOTES – DANSKE BANK GROUP
Note
DANSKE BANK ANNUAL REPORT 2012 72
45 Customers with loans and advances for which objective (cont’d) evidence of impairment exists, including loans and ad-
vances for which no impairment charges have been recog-nised, for example because adequate collateral has been provided, are placed in rating category 10 or 11. If a cus-tomer facility is 90 days or more past due, the customer is placed in rating category 11 and an impairment charge is recognised for the customer’s total exposure. The impairment charge equals the difference between the carrying amount of the loan or advance and the present value of the most likely future cash flows from the loan or advance and is assessed by credit officers. The present value of fixed-rate loans and advances is calculated at the original effective interest rate, whereas the present value of loans and advances with a variable rate of interest is calcu-lated at the current effective interest rate. The customer’s debt is written down to the amount that the borrower is expected to be able to repay after financial re-structuring. If financial restructuring is not possible, the writedown equals the estimated recoverable amount in the event of bankruptcy. If the borrower’s ability to repay de-pends significantly on the assets that have been provided as collateral (asset financing), the customer’s debt is writ-ten down to the fair value of the collateral. Loans and advances without objective evidence of impair-ment are included in an assessment of collective impair-ment at portfolio level. Collective impairment is calculated for portfolios of loans and advances with similar credit characteristics when impairment of expected future cash flows from a portfolio has occurred but no interest rate change has been agreed on to adjust the credit margin. The collective impairment charge reflects the lowering of cus-tomer ratings over time (migration). The loans and ad-vances are divided into portfolios on the basis of current ratings. Calculation of charges also factors in portfolios of loans held by customers with improved ratings. The cash flows are specified by means of parameters used for solvency calculations and historical loss data adjusted for use in the financial statements, for example. The ad-justment reflects the loss identification period shown by the Group’s empirical data. This period is the period from the first evidence of impairment to the determination of a loss at customer level. Collective impairment charges are calculated as the differ-ence between the carrying amount of the loans and ad-vances of the portfolio and the present value of expected fu-ture cash flows. The collective impairment charge based on migration is ad-justed if the Group becomes aware of market conditions at the balance sheet date that are not fully reflected in the Group’s models. In times of favourable economic conditions, adjustments will reduce the impairment charge, while it may increase in an economic downturn. Examples of factors that determine economic conditions are levels of unem-ployment, housing prices and freight rates.
Impairment charges for loans, advances and guarantees are booked in an allowance account and set off against loans and advances or recognised as provisions for guaran-tees. Impairment charges for loans and advances are re-corded under Loan impairment charges in the income statement. If subsequent events show that impairment is not permanent, charges are reversed. Loans and advances that are considered uncollectible are written off. Write-offs are debited to the allowance account. Loans and advances are written off once the usual collec-tion procedure has been completed and the loss on the in-dividual loan or advance can be calculated. If the full loss is not expected to be realised until after a number of years, for example in the event of administration of complex estates, a partial write-off is recognised, reflecting the Group’s claim less collateral, estimated dividend and other cash flows. In accordance with the effective interest method, interest is recognised on the basis of the value of the loans and ad-vances less impairment charges. Consequently, part of the allowance account balance is set aside for future interest income until the time of write-off. 12. Loans at fair value and bonds issued by Realkredit
Danmark Loans granted under Danish mortgage finance law are funded by issuing listed mortgage bonds with matching terms. Borrowers may repay such loans by delivering the underlying bonds. The Group buys and sells own bonds issued by Realkredit Danmark on an ongoing basis because such securities play an important role in the Danish money market. If these loans and bonds were measured at amortised cost, the purchase and sale of own mortgage bonds would result in timing differences in the recognition of gains and losses on Realkredit Danmark bonds repurchased and the relevant loans. The purchase price of the mortgage bond portfolio would not equal the amortised cost of the issued bonds, and elimination would result in arbitrary recognition of gains and losses. If the Group subsequently decided to sell its holding of own bonds, the new amortised cost of this “new issue” would not equal the amortised cost of the matching loans, and the difference would be amortised over the re-maining term to maturity. Consequently, the Group meas-ures loans and issued bonds at fair value in accordance with the fair value option offered by IAS 39 to ensure that neither gains nor losses will occur on the purchase of own bonds. At initial recognition, loans and issued bonds are measured at fair value, excluding transaction costs. Subsequently, such assets and liabilities are measured at fair value. The fair value of the bonds issued by Realkredit Danmark is normally defined as their market value. A small number of the issued bonds are illiquid, however, and the fair value of these bonds is calculated on the basis of a discounted cash flow valuation technique.
120 DANSKE BANK / GROUP 2012
NOTES – DANSKE BANK GROUP
NOTES – DANSKE BANK GROUP
Note
DANSKE BANK ANNUAL REPORT 2012 72
45 Customers with loans and advances for which objective (cont’d) evidence of impairment exists, including loans and ad-
vances for which no impairment charges have been recog-nised, for example because adequate collateral has been provided, are placed in rating category 10 or 11. If a cus-tomer facility is 90 days or more past due, the customer is placed in rating category 11 and an impairment charge is recognised for the customer’s total exposure. The impairment charge equals the difference between the carrying amount of the loan or advance and the present value of the most likely future cash flows from the loan or advance and is assessed by credit officers. The present value of fixed-rate loans and advances is calculated at the original effective interest rate, whereas the present value of loans and advances with a variable rate of interest is calcu-lated at the current effective interest rate. The customer’s debt is written down to the amount that the borrower is expected to be able to repay after financial re-structuring. If financial restructuring is not possible, the writedown equals the estimated recoverable amount in the event of bankruptcy. If the borrower’s ability to repay de-pends significantly on the assets that have been provided as collateral (asset financing), the customer’s debt is writ-ten down to the fair value of the collateral. Loans and advances without objective evidence of impair-ment are included in an assessment of collective impair-ment at portfolio level. Collective impairment is calculated for portfolios of loans and advances with similar credit characteristics when impairment of expected future cash flows from a portfolio has occurred but no interest rate change has been agreed on to adjust the credit margin. The collective impairment charge reflects the lowering of cus-tomer ratings over time (migration). The loans and ad-vances are divided into portfolios on the basis of current ratings. Calculation of charges also factors in portfolios of loans held by customers with improved ratings. The cash flows are specified by means of parameters used for solvency calculations and historical loss data adjusted for use in the financial statements, for example. The ad-justment reflects the loss identification period shown by the Group’s empirical data. This period is the period from the first evidence of impairment to the determination of a loss at customer level. Collective impairment charges are calculated as the differ-ence between the carrying amount of the loans and ad-vances of the portfolio and the present value of expected fu-ture cash flows. The collective impairment charge based on migration is ad-justed if the Group becomes aware of market conditions at the balance sheet date that are not fully reflected in the Group’s models. In times of favourable economic conditions, adjustments will reduce the impairment charge, while it may increase in an economic downturn. Examples of factors that determine economic conditions are levels of unem-ployment, housing prices and freight rates.
Impairment charges for loans, advances and guarantees are booked in an allowance account and set off against loans and advances or recognised as provisions for guaran-tees. Impairment charges for loans and advances are re-corded under Loan impairment charges in the income statement. If subsequent events show that impairment is not permanent, charges are reversed. Loans and advances that are considered uncollectible are written off. Write-offs are debited to the allowance account. Loans and advances are written off once the usual collec-tion procedure has been completed and the loss on the in-dividual loan or advance can be calculated. If the full loss is not expected to be realised until after a number of years, for example in the event of administration of complex estates, a partial write-off is recognised, reflecting the Group’s claim less collateral, estimated dividend and other cash flows. In accordance with the effective interest method, interest is recognised on the basis of the value of the loans and ad-vances less impairment charges. Consequently, part of the allowance account balance is set aside for future interest income until the time of write-off. 12. Loans at fair value and bonds issued by Realkredit
Danmark Loans granted under Danish mortgage finance law are funded by issuing listed mortgage bonds with matching terms. Borrowers may repay such loans by delivering the underlying bonds. The Group buys and sells own bonds issued by Realkredit Danmark on an ongoing basis because such securities play an important role in the Danish money market. If these loans and bonds were measured at amortised cost, the purchase and sale of own mortgage bonds would result in timing differences in the recognition of gains and losses on Realkredit Danmark bonds repurchased and the relevant loans. The purchase price of the mortgage bond portfolio would not equal the amortised cost of the issued bonds, and elimination would result in arbitrary recognition of gains and losses. If the Group subsequently decided to sell its holding of own bonds, the new amortised cost of this “new issue” would not equal the amortised cost of the matching loans, and the difference would be amortised over the re-maining term to maturity. Consequently, the Group meas-ures loans and issued bonds at fair value in accordance with the fair value option offered by IAS 39 to ensure that neither gains nor losses will occur on the purchase of own bonds. At initial recognition, loans and issued bonds are measured at fair value, excluding transaction costs. Subsequently, such assets and liabilities are measured at fair value. The fair value of the bonds issued by Realkredit Danmark is normally defined as their market value. A small number of the issued bonds are illiquid, however, and the fair value of these bonds is calculated on the basis of a discounted cash flow valuation technique.
NOTES – DANSKE BANK GROUP
Note
DANSKE BANK ANNUAL REPORT 2012 73
45 The fair value of the loans is based on the fair value of the (cont’d) underlying bonds adjusted for changes in the fair value of
the credit risk on borrowers. For loans granted to custom-ers in rating categories 10 and 11 (loans with objective evidence of impairment), such adjustment is made in ac-cordance with principles similar to the principles for calcu-lating individual impairment charges for loans at amortised cost with two exceptions. For discounting purposes, the current effective interest rate is used instead of the original effective interest rate. Loans are written down to the fair value of the collateral if financial restructuring is not possi-ble. A collective assessment also determines the need for ad-justments to reflect changes in the fair value of the credit risk on the remaining portion of the portfolio. No changes are made if it is possible to raise the administration margin on loans (credit margin) sufficiently to compensate for the higher credit risk and market risk premium on mortgage loans. If it is not possible to raise the administration margin sufficiently or at all, a collective adjustment is made, reflect-ing trends in expected losses, unexpected losses (volatility) and the possibility of raising administration margins in the future. The expected future cash flows are discounted at the current market rate with the addition of a risk premium. 13. Assets and deposits under pooled schemes and unit-
linked investment contracts These items include assets and deposits under pooled schemes and unit-linked contracts defined as investment contracts. Assets earmarked for customer savings are measured at fair value and recognised under Assets under pooled schemes and unit-linked investment contracts. Similarly, deposits made by customers are recognised under Depos-its under pooled schemes and unit-linked investment con-tracts. These deposits are measured at the value of sav-ings. Holdings of shares and bonds issued by the Group are de-ducted from shareholders’ equity or eliminated. Conse-quently, the value of Deposits under pooled schemes and unit-linked investment contracts exceeds that of Assets under pooled schemes and unit-linked investment con-tracts. 14. Assets and liabilities under insurance contracts Assets under insurance contracts comprises assets ear-marked for policyholders, that is, assets on which most of the return accrues to policyholders. The assets, which in-clude financial assets, investment property, tangible assets and associates, are specified in the notes. The valuation technique used matches the Group’s accounting policy for similar assets with the exception of holdings in associates. Such holdings are treated as held by a venture capital or-ganisation and measured at fair value. Note 21 shows hold-ings in associates at group level. A few property holdings are jointly owned and therefore consolidated in the financial statements on a pro rata basis.
Liabilities under insurance contracts consists of life insur-ance provisions, provisions for unit-linked insurance con-tracts, collective bonus potential, other technical provisions and other liabilities. Holdings of shares and bonds issued by the Group are de-ducted from shareholders’ equity or eliminated. Conse-quently, the value of Liabilities under insurance contracts exceeds that of Assets under insurance contracts. Life insurance provisions Life insurance provisions comprises obligations towards policyholders to • pay guaranteed benefits • pay bonuses over time on agreed premiums not yet
due • pay bonuses on premiums and other payments due Recognition of life insurance provisions is based on actuar-ial computations of the present value of expected benefits for each insurance contract using the discount rate at the balance sheet date. These computations rely on specific assumptions about ex-pected future mortality and disability rates based on em-pirical data from Danica Pension’s portfolio and include a
risk allowance. Obligations for guaranteed benefits are calculated as the present value of the current guaranteed benefits plus the present value of expected future administrative expenses less the present value of future premiums. Danish rules on insurance accounting determine the dis-count yield curve, which is fixed on the basis of a zero-coupon yield curve estimated on the basis of euro swap market rates to which is added the yield spread between Danish and German government bonds and a mortgage yield curve spread. Since the end of 2011, the yield spread has been calculated as a 12-month moving average. This means that daily market changes are reflected in the spread, but the effect of fluctuations is reduced. In response to the extraordinarily low yields in the fixed-income markets, the Danish Ministry of Business and Growth reached an agreement with the insurance and pension industry under which the discount yield curve used for long yields was changed. The agreement took effect on 12 June 2012. The change aligns Danish rules with the expected Solvency II rules and caused a reduction of life insurance provisions of DKK 1.5 billion at the end of 2012. Provisions for unit-linked insurance contracts Provisions are measured at fair value on the basis of each contract’s share of the earmarked assets and the guaran-teed benefits. Collective bonus potential Provisions for the collective bonus potential comprise poli-cyholders’ share of the technical basis for insurance poli-cies with a bonus entitlement not yet allocated to the indi-vidual policyholder.
DANSKE BANK / GROUP 2012 121
NO
TE
S – D
AN
SK
E B
AN
K G
RO
UP
NOTES – DANSKE BANK GROUP

NOTES – DANSKE BANK GROUP
Note
DANSKE BANK KONCERNREGNSKAB 2011 74
45 Other technical provisions (cont’d) Other technical provisions includes outstanding claims pro-
visions, unearned premiums provisions, and provisions for bonuses and premium discounts. Other liabilities Other liabilities includes the portion of Danica Pension’s other liabilities assumed by customers. Other types of liabil-ity are measured in accordance with the Group’s account-ing policies for such liability types. 15. Intangible assets Goodwill Goodwill arises on the acquisition of an undertaking and is calculated as the difference between the cost (until 1 January 2010 including direct transaction costs) of the undertaking and the fair value of its net assets, including contingent liabilities, at the time of acquisition. Goodwill on acquisitions made before 2002 was written off against shareholders’ equity in the year of acquisition. Goodwill on associates is recognised under Holdings in associates. Goodwill is allocated to cash-generating units at the level at which management monitors the investment. Goodwill is not amortised; instead each cash-generating unit is tested for impairment once a year or more frequently if indications of impairment exist. Goodwill is written down to its recov- erable amount through profit or loss if the carrying amount of the net assets of the cash-generating unit exceeds the higher of the assets’ fair value less costs to sell and their value in use, which equals the present value of the future cash flows expected from the unit. Other intangible assets Software acquired is measured at cost, including expenses incurred to make each software application ready for use. Software acquired is amortised over its expected useful life, usually three years, according to the straight-line method. Software developed by the Group is recognised as an asset if the cost of development is reliably measurable and anal- yses show that the future earnings from using the individual software applications exceed cost. Cost includes expenses incurred to make each software application ready for use. Once a software application has been developed, the cost is amortised over its expected useful life, usually three years, according to the straight-line method. The cost of development consists primarily of direct remuneration and other directly attributable development costs. Expenses incurred in the planning phase are not included but booked when incurred. Identifiable intangible assets taken over on the acquisition of undertakings are measured at their fair value at the time of acquisition and amortised over their expected useful lives, usually three years, according to the straight-line method. The value of intangible assets with indefinite useful lives is not amortised, but the assets are tested for impair- ment at least once a year according to the principles applicable to goodwill.
Other intangible assets to be amortised are tested for im-pairment if indications of impairment exist, and the assets are subsequently written down to their value in use. Costs attributable to the maintenance of intangible assets are expensed in the year of maintenance. 16. Investment property Investment property is real property, including real property let under operating leases, which the Group owns for the purpose of receiving rent and/or obtaining capital gains. The section on domicile property below explains the distinc-tion between domicile and investment property. On acquisition, investment property is measured at cost, including transaction costs, and subsequently measured at fair value. Fair value adjustments and rental income are recognised under Other income in the income statement. Real property taken over by the Group under non-performingloan agreements that is expected to be sold within 12 months of classification is valued in accordance with the principles used for investment property but presented as assets held for sale. 17. Tangible assets Tangible assets includes domicile property, machinery, fur-niture and fixtures. Machinery, furniture and fixtures covers equipment, vehicles, furniture, fixtures and leasehold im-provements. Assets are grouped by assets used by the Group and lease assets. Domicile property Domicile property is real property occupied by the Group’s administrative departments, branches and other service units. Real property with both domicile and investment property elements is allocated proportionally to the two categories if the elements are separately sellable. If that is not the case, such real property is classified as domicile property, unless the Group occupies less than 10% of the total floorage. Domicile property is measured at cost plus property im-provement expenditure and less depreciation and impair-ment charges. The straight-line depreciation of the property is based on the expected scrap value and an estimated use-ful life of 20 to 50 years. Real property held under long-term leases is depreciated on a progressive scale. Investment property which becomes domicile property be-cause the Group starts using it for its own activities is measured at fair value at the time of reclassification. Domi-cile property which becomes investment property is meas-ured at fair value at the time of reclassification. Any re-valuation of domicile property is recognised in Other com-prehensive income. Domicile property which, according to a publicly announced plan, the Group expects to sell within 12 months is recog-nised as an asset held for sale under Other assets. The same principle applies to property taken over in connection with the settlement of debt if such property is likely to be sold within 12 months. If the property is unlikely to be sold within this period, it is classified as investment property.
122 DANSKE BANK / GROUP 2012
NOTES – DANSKE BANK GROUP

NOTES – DANSKE BANK GROUP
Note
DANSKE BANK KONCERNREGNSKAB 2011 74
45 Other technical provisions (cont’d) Other technical provisions includes outstanding claims pro-
visions, unearned premiums provisions, and provisions for bonuses and premium discounts. Other liabilities Other liabilities includes the portion of Danica Pension’s other liabilities assumed by customers. Other types of liabil-ity are measured in accordance with the Group’s account-ing policies for such liability types. 15. Intangible assets Goodwill Goodwill arises on the acquisition of an undertaking and is calculated as the difference between the cost (until 1 January 2010 including direct transaction costs) of the undertaking and the fair value of its net assets, including contingent liabilities, at the time of acquisition. Goodwill on acquisitions made before 2002 was written off against shareholders’ equity in the year of acquisition. Goodwill on associates is recognised under Holdings in associates. Goodwill is allocated to cash-generating units at the level at which management monitors the investment. Goodwill is not amortised; instead each cash-generating unit is tested for impairment once a year or more frequently if indications of impairment exist. Goodwill is written down to its recov- erable amount through profit or loss if the carrying amount of the net assets of the cash-generating unit exceeds the higher of the assets’ fair value less costs to sell and their value in use, which equals the present value of the future cash flows expected from the unit. Other intangible assets Software acquired is measured at cost, including expenses incurred to make each software application ready for use. Software acquired is amortised over its expected useful life, usually three years, according to the straight-line method. Software developed by the Group is recognised as an asset if the cost of development is reliably measurable and anal- yses show that the future earnings from using the individual software applications exceed cost. Cost includes expenses incurred to make each software application ready for use. Once a software application has been developed, the cost is amortised over its expected useful life, usually three years, according to the straight-line method. The cost of development consists primarily of direct remuneration and other directly attributable development costs. Expenses incurred in the planning phase are not included but booked when incurred. Identifiable intangible assets taken over on the acquisition of undertakings are measured at their fair value at the time of acquisition and amortised over their expected useful lives, usually three years, according to the straight-line method. The value of intangible assets with indefinite useful lives is not amortised, but the assets are tested for impair- ment at least once a year according to the principles applicable to goodwill.
Other intangible assets to be amortised are tested for im-pairment if indications of impairment exist, and the assets are subsequently written down to their value in use. Costs attributable to the maintenance of intangible assets are expensed in the year of maintenance. 16. Investment property Investment property is real property, including real property let under operating leases, which the Group owns for the purpose of receiving rent and/or obtaining capital gains. The section on domicile property below explains the distinc-tion between domicile and investment property. On acquisition, investment property is measured at cost, including transaction costs, and subsequently measured at fair value. Fair value adjustments and rental income are recognised under Other income in the income statement. Real property taken over by the Group under non-performingloan agreements that is expected to be sold within 12 months of classification is valued in accordance with the principles used for investment property but presented as assets held for sale. 17. Tangible assets Tangible assets includes domicile property, machinery, fur-niture and fixtures. Machinery, furniture and fixtures covers equipment, vehicles, furniture, fixtures and leasehold im-provements. Assets are grouped by assets used by the Group and lease assets. Domicile property Domicile property is real property occupied by the Group’s administrative departments, branches and other service units. Real property with both domicile and investment property elements is allocated proportionally to the two categories if the elements are separately sellable. If that is not the case, such real property is classified as domicile property, unless the Group occupies less than 10% of the total floorage. Domicile property is measured at cost plus property im-provement expenditure and less depreciation and impair-ment charges. The straight-line depreciation of the property is based on the expected scrap value and an estimated use-ful life of 20 to 50 years. Real property held under long-term leases is depreciated on a progressive scale. Investment property which becomes domicile property be-cause the Group starts using it for its own activities is measured at fair value at the time of reclassification. Domi-cile property which becomes investment property is meas-ured at fair value at the time of reclassification. Any re-valuation of domicile property is recognised in Other com-prehensive income. Domicile property which, according to a publicly announced plan, the Group expects to sell within 12 months is recog-nised as an asset held for sale under Other assets. The same principle applies to property taken over in connection with the settlement of debt if such property is likely to be sold within 12 months. If the property is unlikely to be sold within this period, it is classified as investment property.
NOTES – DANSKE BANK GROUP
Note
DANSKE BANK ANNUAL REPORT 2012 75
45 Machinery, furniture and fixtures (cont’d) Equipment, vehicles, furniture, fixtures and leasehold im-
provements are measured at cost less depreciation and impairment charges. Assets are depreciated over their ex-pected useful lives, usually three years, according to the straight-line method. Leasehold improvements are depreci-ated over the term of the individual lease, with a maximum of ten years. Lease assets Lease assets consists of assets, except real property, let under operating leases. Lease assets are measured using the same valuation technique as that applied by the Group to its other equipment, vehicles, furniture and fixtures. When, at the end of the lease period, lease assets are put up for sale, the assets are transferred to Other assets. Impairment Tangible assets are tested for impairment if indications of impairment exist. An impaired asset is written down to its recoverable amount, which is the higher of its fair value less costs to sell and its value in use. 18. Other assets Other assets includes interest and commission due, pre-payments, lease assets put up for sale at the expiry of lease agreements and assets held for sale. Lease assets put up for sale Lease assets put up for sale are measured at the lower of their carrying amount at the time of reclassification (expiry of lease agreements) and their fair value less expected costs to sell. Assets held for sale Assets held for sale are tangible assets and assets of group undertakings actively marketed for sale within 12 months, for example assets and businesses taken over under non-performing loan agreements. Such assets are measured at the lower of their carrying amount at the time of reclassification and their fair value less expected costs to sell and are no longer depreciated. Liabilities of group undertakings are initially measured at fair value and subsequently in accordance with the Group’s general accounting policies. The section on investment property explains the valuation and presentation of invest-ment property and real property taken over. Financial guarantees issued to the Group Financial guarantees issued to the Group are contracts that require the issuer to make specified payments to reimburse the Group if a specified debtor or group of debtors fails to make payments when due in accordance with the terms of a debt instrument. Prepaid guarantee premiums are recog-nised under Other assets. Future payments that the Group is likely to receive are recognised as amounts due at pre-sent value.
19. Amounts due to credit institutions and central banks and Deposits
Amounts due to credit institutions and central banks and Deposits include amounts received under repo transac-tions (sales of securities which the Group agrees to repur-chase at a later date). Amounts due to credit institutions and central banks and Deposits are measured at amortised cost plus the fair value of the hedged interest rate risk. 20. Other issued bonds and Subordinated debt Other issued bonds and Subordinated debt comprise bonds issued by the Group except bonds issued by Realkredit Danmark. Subordinated debt is liabilities in the form of sub-ordinated loan capital and other capital investments which, in case of the Group’s voluntary or compulsory winding-up, will not be repaid until the claims of its ordinary creditors have been met. Other issued bonds and Subordinated debt are measured at amortised cost plus the fair value of the hedged interest rate risk. The yield on some issued bonds depends on an index that is not closely linked to the bonds’ financial characteristics, for example an equity or commodity index. Such embedded de-rivatives are bifurcated and measured at fair value in the trading portfolio. 21. Other liabilities Other liabilities includes accrued interest, fees and com-missions that do not form part of the amortised cost of a fi-nancial instrument. Other liabilities also includes pension obligations, reserves subject to a reimbursement obligation relating to mortgage loan agreements, and provisions for other obligations, such as lawsuits and guarantees. If a lawsuit is likely to result in a payment obligation, a liabil-ity is recognised if it can be measured reliably. The liability is recognised at the present value of expected payments. Pension obligations The Group’s pension obligations consist of both defined contribution and defined benefit pension plans for its staff. Under defined contribution pension plans, the Group pays regular contributions to insurance companies and other in-stitutions. Such payments are expensed as they are earned by the staff, and the obligations under the plans are taken over by the insurance companies and other institutions. Under defined benefit pension plans, the Group is under an obligation to pay defined future benefits from the time of re-tirement. The amounts payable are recognised on the basis of an actuarial computation of the present value of expected benefits. The present value is calculated on the basis of ex-pected future trends in salaries and interest rates, the time of retirement, mortality rates and other factors.
DANSKE BANK / GROUP 2012 123
NO
TE
S – D
AN
SK
E B
AN
K G
RO
UP
NOTES – DANSKE BANK GROUP

NOTES – DANSKE BANK GROUP
Note
DANSKE BANK KONCERNREGNSKAB 2011 76
45 The present value of pension benefits less the fair value of (cont’d) pension assets is recognised as a pension obligation for
each plan under Other liabilities. If the net amount of a de-fined benefit pension plan is positive and may be repaid to the Group or reduce its future contributions to the plan, the net amount is recognised under Other assets. The discount rate is determined by reference to yields on high-quality corporate bonds with terms matching the terms of the pen-sion obligations. The difference between expected trends in pension assets and benefits and actual trends will result in actuarial gains or losses. Actuarial gains or losses that do not exceed the higher of 10% of the present value of benefits and 10% of the fair value of pension assets are not recognised in the income statement or in the balance sheet but form part of the corridor. If the accumulated actuarial gains or losses exceed both these threshold values, the excess amount is recognised both in the income statement and in the net pension obligation distributed over the expected remaining period of service of the staff covered by the plan. Irrevocable loan commitments and guarantees At initial recognition, irrevocable loan commitments and guarantees are recognised at the amount of premiums re-ceived. Subsequently, irrevocable loan commitments and guarantees are measured at the higher of the received premiums amortised over the guarantee or commitment period and the provision made, if any. Provisions for irrevo-cable loan commitments and guarantees are recognised under Other liabilities if it is likely that drawings will be made under a loan commitment or claims be made under a guarantee and the amount payable can be reliably meas-ured. The liability is measured at the present value of ex-pected payments. Irrevocable loan commitments are dis-counted in accordance with the interest terms. 22. Deferred tax assets and Deferred tax liabilities Deferred tax on all temporary differences between the tax base of assets and liabilities and their carrying amounts is accounted for in accordance with the balance sheet liability method. Deferred tax is recognised under Deferred tax as-sets and Deferred tax liabilities. The Group does not recognise deferred tax on temporary differences between the tax base and the carrying amounts of goodwill not subject to amortisation for tax purposes and other items if the temporary differences arose at the time of acquisition without effect on net profit or taxable income. If the tax base may be calculated according to several sets of tax regulations, deferred tax is measured in accordance with the regulations that apply to the use of the asset or settlement of the liability as planned by management. Tax assets arising from unused tax losses and unused tax credits are recognised to the extent that such unused tax losses and unused tax credits can be used.
Deferred tax is measured on the basis of the tax regulations and rates that, according to the rules in force at the balance sheet date, are applicable in the relevant countries at the time the deferred tax is expected to crystallise as current tax. Changes in deferred tax as a result of changes in tax rates are recognised in the income statement. 23. Current tax assets and Current tax liabilities Current tax assets and liabilities are recognised in the bal-ance sheet as the estimated tax payable on the profit for the year adjusted for prepaid tax and prior-year tax pay-ables and receivables. Tax assets and liabilities are offset if the Group has a legally enforceable right to set off such assets and liabilities and intends either to settle the assets and liabilities on a net basis or to realise the assets and settle the liabilities simul-taneously. 24. Shareholders’ equity Foreign currency translation reserve The foreign currency translation reserve includes differ-ences that have arisen since 1 January 2004 from the translation of the financial results of and net investments in units outside Denmark from their functional currencies into Danish kroner. The reserve also includes exchange rate ad-justments of financial liabilities used to hedge net invest-ments in such units. If the net investment in a unit outside Denmark is fully or partly realised, translation differences are recognised in the income statement. Reserve for assets available for sale The reserve covers unrealised value adjustments of bonds treated as available-for-sale financial assets recognised in Other comprehensive income. Unrealised value adjustmentsof hedged interest rate risks that qualify for fair value hedge accounting are recognised in the income statement and are not included in the reserve. If objective evidence of impairment exists, the Group re-classifies accumulated unrealised capital losses from the reserve to the income statement. When bonds are sold, the Group also reclassifies unrealised value adjustments from the reserve to the income statement. Proposed dividends The Board of Directors’ proposal for dividends for the year submitted to the general meeting is included as a separate reserve in shareholders’ equity. The dividends are recog-nised as a liability when the general meeting has adopted the proposal.
124 DANSKE BANK / GROUP 2012
NOTES – DANSKE BANK GROUP
NOTES – DANSKE BANK GROUP
Note
DANSKE BANK KONCERNREGNSKAB 2011 76
45 The present value of pension benefits less the fair value of (cont’d) pension assets is recognised as a pension obligation for
each plan under Other liabilities. If the net amount of a de-fined benefit pension plan is positive and may be repaid to the Group or reduce its future contributions to the plan, the net amount is recognised under Other assets. The discount rate is determined by reference to yields on high-quality corporate bonds with terms matching the terms of the pen-sion obligations. The difference between expected trends in pension assets and benefits and actual trends will result in actuarial gains or losses. Actuarial gains or losses that do not exceed the higher of 10% of the present value of benefits and 10% of the fair value of pension assets are not recognised in the income statement or in the balance sheet but form part of the corridor. If the accumulated actuarial gains or losses exceed both these threshold values, the excess amount is recognised both in the income statement and in the net pension obligation distributed over the expected remaining period of service of the staff covered by the plan. Irrevocable loan commitments and guarantees At initial recognition, irrevocable loan commitments and guarantees are recognised at the amount of premiums re-ceived. Subsequently, irrevocable loan commitments and guarantees are measured at the higher of the received premiums amortised over the guarantee or commitment period and the provision made, if any. Provisions for irrevo-cable loan commitments and guarantees are recognised under Other liabilities if it is likely that drawings will be made under a loan commitment or claims be made under a guarantee and the amount payable can be reliably meas-ured. The liability is measured at the present value of ex-pected payments. Irrevocable loan commitments are dis-counted in accordance with the interest terms. 22. Deferred tax assets and Deferred tax liabilities Deferred tax on all temporary differences between the tax base of assets and liabilities and their carrying amounts is accounted for in accordance with the balance sheet liability method. Deferred tax is recognised under Deferred tax as-sets and Deferred tax liabilities. The Group does not recognise deferred tax on temporary differences between the tax base and the carrying amounts of goodwill not subject to amortisation for tax purposes and other items if the temporary differences arose at the time of acquisition without effect on net profit or taxable income. If the tax base may be calculated according to several sets of tax regulations, deferred tax is measured in accordance with the regulations that apply to the use of the asset or settlement of the liability as planned by management. Tax assets arising from unused tax losses and unused tax credits are recognised to the extent that such unused tax losses and unused tax credits can be used.
Deferred tax is measured on the basis of the tax regulations and rates that, according to the rules in force at the balance sheet date, are applicable in the relevant countries at the time the deferred tax is expected to crystallise as current tax. Changes in deferred tax as a result of changes in tax rates are recognised in the income statement. 23. Current tax assets and Current tax liabilities Current tax assets and liabilities are recognised in the bal-ance sheet as the estimated tax payable on the profit for the year adjusted for prepaid tax and prior-year tax pay-ables and receivables. Tax assets and liabilities are offset if the Group has a legally enforceable right to set off such assets and liabilities and intends either to settle the assets and liabilities on a net basis or to realise the assets and settle the liabilities simul-taneously. 24. Shareholders’ equity Foreign currency translation reserve The foreign currency translation reserve includes differ-ences that have arisen since 1 January 2004 from the translation of the financial results of and net investments in units outside Denmark from their functional currencies into Danish kroner. The reserve also includes exchange rate ad-justments of financial liabilities used to hedge net invest-ments in such units. If the net investment in a unit outside Denmark is fully or partly realised, translation differences are recognised in the income statement. Reserve for assets available for sale The reserve covers unrealised value adjustments of bonds treated as available-for-sale financial assets recognised in Other comprehensive income. Unrealised value adjustmentsof hedged interest rate risks that qualify for fair value hedge accounting are recognised in the income statement and are not included in the reserve. If objective evidence of impairment exists, the Group re-classifies accumulated unrealised capital losses from the reserve to the income statement. When bonds are sold, the Group also reclassifies unrealised value adjustments from the reserve to the income statement. Proposed dividends The Board of Directors’ proposal for dividends for the year submitted to the general meeting is included as a separate reserve in shareholders’ equity. The dividends are recog-nised as a liability when the general meeting has adopted the proposal.
NOTES – DANSKE BANK GROUP
Note
DANSKE BANK KONCERNREGNSKAB 2011 77
45 Own shares (cont’d) Amounts received and paid for the Group’s purchase and
sale of Danske Bank shares are recognised directly in shareholders’ equity under transactions with owners. The same applies to premiums received or paid for derivatives entailing settlement in own shares. A capital reduction by cancellation of own shares will lower the share capital by an amount equal to the nominal value of the shares at the time of registration of the capital reduc-tion. Share-based payments Share-based payments by the Group are settled in Danske Bank shares. The fair value at the grant date is expensed over the vesting period and is set off against shareholders’ equity. At the time of exercise, payments by employees are recognised as an increase in shareholders’ equity. As with other purchases of Danske Bank shares, shares acquired for hedging purposes reduce shareholders’ equity by the amount paid. Non-controlling interests Non-controlling interests’ share of shareholders’ equity equals the carrying amounts of the net assets in group un-dertakings not owned directly or indirectly by Danske Bank A/S. 25. Contingent assets and Contingent liabilities Contingent assets and Contingent liabilities consist of pos-sible assets and liabilities arising from past events. The ex-istence of such assets and liabilities will be confirmed only by the occurrence or non-occurrence of one or more uncer-tain future events not wholly within the Group’s control. Contingent assets are disclosed when an inflow of eco-nomic benefits is probable. Contingent liabilities that can, but are not likely to, result in an outflow of economic resources are disclosed. In addition, disclosure is made of current liabilities that are not recog-nised because it is not probable that they will entail an out-flow of economic resources or because no reliable estimate can be made. INCOME STATEMENT 26. Interest income and expenses Interest income and expenses arising from interest-bearing financial instruments measured at amortised cost are rec-ognised in the income statement according to the effective interest method on the basis of the cost of the individual fi-nancial instrument. Interest includes amortised amounts of fees that are an integral part of the effective yield on a fi-nancial instrument, such as origination fees, and amortised differences between cost and redemption price, if any.
Interest income and expenses also include interest on fi-nancial instruments measured at fair value but not interest on assets and deposits under pooled schemes and unit-linked investment contracts; the latter is recognised under Net trading income. Origination fees on loans measured at fair value are recognised under Interest income at origina-tion. Interest on loans and advances subject to individual im-pairment is recognised on the basis of the impaired value. 27. Fee income and expenses Fee income and expenses are broken down into fees gener-ated by activities and fees generated by portfolios. Income from and expenses for services provided over a pe-riod of time, such as guarantee commissions and invest-ment management fees, are accrued over the period. Transaction fees, such as brokerage and custody fees, are recognised on settlement of the individual transaction. 28. Net trading income Net trading income includes realised and unrealised capital gains and losses on trading portfolio assets and other se-curities (including securities recognised under Assets un-der insurance contracts, Loans at fair value and Bonds is-sued by Realkredit Danmark) as well as exchange rate ad-justments and dividends. Fair value adjustments of the credit risk on loans measured at fair value are recognised under loan impairment charges, however. The effect on profit or loss of fair value hedge accounting is also recog-nised under Net trading income. Returns on assets under pooled schemes and unit-linked in-vestment contracts and the crediting of the returns to cus-tomer accounts are also recognised under Net trading in-come. Moreover, the item includes the change in insurance obligations during the year due to additional provisions for benefit guarantees and tax on pension returns. 29. Other income Other income includes rental income and lease payments under operating leases, fair value adjustments of invest-ment property, amounts received on the sale of lease as-sets and gains and losses on the sale of other tangible and intangible assets. 30. Net premiums Regular and single premiums on insurance contracts are recognised in the income statement at their due dates. Premiums on investment contracts are recognised directly in the balance sheet. Reinsurance premiums paid are de-ducted from premiums received. 31. Net insurance benefits Net insurance benefits includes benefits disbursed under insurance contracts. The item also includes adjustments to outstanding claims provisions and life insurance provisions that are not additional provisions for benefit guarantees. The benefits are recognised net of reinsurance.
DANSKE BANK / GROUP 2012 125
NO
TE
S – D
AN
SK
E B
AN
K G
RO
UP
NOTES – DANSKE BANK GROUP

NOTES – DANSKE BANK GROUP
Note
DANSKE BANK KONCERNREGNSKAB 2011 78
45 32. Income from associates (cont’d) Income from associates comprises the Group’s proportion-
ate share of the net profit or loss of the individual busines-ses. Fair value adjustment of venture capital holdings is recognised under Net trading income, however. 33. Profit on sale of associates and group undertakings The profit on sale of associates and group undertakings is the difference between the selling price and the carrying amount, including goodwill, if any, of such sale. 34. Staff costs and administrative expenses Staff costs Salaries and other remuneration that the Group expects to pay for work carried out during the year are expensed under Staff costs and administrative expenses. This item includes salaries, performance-based pay, expenses for share-based payments, holiday allowances, anniversary bonuses, pen-sion costs and other remuneration. Performance-based pay and share-based payments Performance-based pay is expensed as it is earned. Part of the performance-based pay for the year is paid in the form of equity-settled options (suspended in 2008) and condi-tional shares. Share options may not be exercised until three years after the grant date and are conditional on the individual employee’s not having resigned from the Group. Rights to conditional shares vest up to five years after the grant date, provided that the employee, with the exception of retirement, has not resigned from the Group. In addition to this requirement, the vesting of rights earned from 2010 is conditional on certain targets. The fair value of share-based payments at the grant date is expensed over the service period that unconditionally enti-tles the employee to the payment. The intrinsic value of the options is expensed in the year in which the share-based payments are earned, while the time value is accrued over the remaining service period. Expenses are set off against shareholders’ equity. Subsequent fair value adjustments are not carried in the income statement. Pension obligations The Group’s contributions to defined contribution pension plans are recognised in the income statement as they are earned by the employees. The Group applies the corridor method to defined benefit pension plans, and the income statement thus includes actuarial pension expenses (stan-dard cost). 35. Amortisation, depreciation and impairment charges In addition to amortisation, depreciation and impairment charges for intangible and tangible assets, the Group ex-penses the carrying amount of lease assets sold at the ex-piry of a lease agreement.
36. Loan impairment charges Loan impairment charges includes losses on and impair-ment charges against loans, advances, amounts due from credit institutions and guarantees, as well as fair value ad-justments of the credit risk on loans measured at fair value. The item also includes impairment charges and realised gains and losses on tangible assets and group undertakings taken over by the Group under non-performing loan agree-ments if the assets qualify as held-for-sale assets. Similarly, subsequent value adjustments of assets that the Group has taken over and does not expect to sell within 12 months are recognised under loan impairment charges, provided that the Group has a right of recourse against the borrower. 37. Tax Calculated current and deferred tax on the profit for the year and adjustments of prior-year tax charges are recog-nised in the income statement. Income tax for the year is recognised in accordance with the tax laws in force in the countries in which the Group operates. Tax on items recog-nised in Other comprehensive income is recognised in Other comprehensive income. Similarly, tax on items rec-ognised in shareholders’ equity is recognised in sharehold-ers’ equity. 38. Comprehensive income Comprehensive income includes the net profit for the year and Other comprehensive income from translation of units outside Denmark, hedging of units outside Denmark and un-realised value adjustments of available-for-sale financial assets. 39. Cash flow statement The Group has prepared its cash flow statement according to the indirect method. The statement is based on the pre-tax profit for the year and shows the cash flows from oper-ating, investing and financing activities and the increase or decrease in cash and cash equivalents during the year. Cash and cash equivalents consists of cash in hand and demand deposits with central banks and amounts due from credit institutions and central banks with original maturi-ties shorter than three months. 40. Financial highlights The financial highlights in note 2 deviate from the corre-sponding figures in the consolidated financial statements. Income from the Danske Markets segment is recognised in the consolidated income statement under Net trading in-come and Net interest income. The value of each item may vary considerably from year to year, depending on the un-derlying transactions and market conditions. Therefore, the Net trading income item in the financial highlights shows all trading activity income, except yields on bonds classified as available-for-sale assets.
126 DANSKE BANK / GROUP 2012
NOTES – DANSKE BANK GROUP

NOTES – DANSKE BANK GROUP
Note
DANSKE BANK KONCERNREGNSKAB 2011 78
45 32. Income from associates (cont’d) Income from associates comprises the Group’s proportion-
ate share of the net profit or loss of the individual busines-ses. Fair value adjustment of venture capital holdings is recognised under Net trading income, however. 33. Profit on sale of associates and group undertakings The profit on sale of associates and group undertakings is the difference between the selling price and the carrying amount, including goodwill, if any, of such sale. 34. Staff costs and administrative expenses Staff costs Salaries and other remuneration that the Group expects to pay for work carried out during the year are expensed under Staff costs and administrative expenses. This item includes salaries, performance-based pay, expenses for share-based payments, holiday allowances, anniversary bonuses, pen-sion costs and other remuneration. Performance-based pay and share-based payments Performance-based pay is expensed as it is earned. Part of the performance-based pay for the year is paid in the form of equity-settled options (suspended in 2008) and condi-tional shares. Share options may not be exercised until three years after the grant date and are conditional on the individual employee’s not having resigned from the Group. Rights to conditional shares vest up to five years after the grant date, provided that the employee, with the exception of retirement, has not resigned from the Group. In addition to this requirement, the vesting of rights earned from 2010 is conditional on certain targets. The fair value of share-based payments at the grant date is expensed over the service period that unconditionally enti-tles the employee to the payment. The intrinsic value of the options is expensed in the year in which the share-based payments are earned, while the time value is accrued over the remaining service period. Expenses are set off against shareholders’ equity. Subsequent fair value adjustments are not carried in the income statement. Pension obligations The Group’s contributions to defined contribution pension plans are recognised in the income statement as they are earned by the employees. The Group applies the corridor method to defined benefit pension plans, and the income statement thus includes actuarial pension expenses (stan-dard cost). 35. Amortisation, depreciation and impairment charges In addition to amortisation, depreciation and impairment charges for intangible and tangible assets, the Group ex-penses the carrying amount of lease assets sold at the ex-piry of a lease agreement.
36. Loan impairment charges Loan impairment charges includes losses on and impair-ment charges against loans, advances, amounts due from credit institutions and guarantees, as well as fair value ad-justments of the credit risk on loans measured at fair value. The item also includes impairment charges and realised gains and losses on tangible assets and group undertakings taken over by the Group under non-performing loan agree-ments if the assets qualify as held-for-sale assets. Similarly, subsequent value adjustments of assets that the Group has taken over and does not expect to sell within 12 months are recognised under loan impairment charges, provided that the Group has a right of recourse against the borrower. 37. Tax Calculated current and deferred tax on the profit for the year and adjustments of prior-year tax charges are recog-nised in the income statement. Income tax for the year is recognised in accordance with the tax laws in force in the countries in which the Group operates. Tax on items recog-nised in Other comprehensive income is recognised in Other comprehensive income. Similarly, tax on items rec-ognised in shareholders’ equity is recognised in sharehold-ers’ equity. 38. Comprehensive income Comprehensive income includes the net profit for the year and Other comprehensive income from translation of units outside Denmark, hedging of units outside Denmark and un-realised value adjustments of available-for-sale financial assets. 39. Cash flow statement The Group has prepared its cash flow statement according to the indirect method. The statement is based on the pre-tax profit for the year and shows the cash flows from oper-ating, investing and financing activities and the increase or decrease in cash and cash equivalents during the year. Cash and cash equivalents consists of cash in hand and demand deposits with central banks and amounts due from credit institutions and central banks with original maturi-ties shorter than three months. 40. Financial highlights The financial highlights in note 2 deviate from the corre-sponding figures in the consolidated financial statements. Income from the Danske Markets segment is recognised in the consolidated income statement under Net trading in-come and Net interest income. The value of each item may vary considerably from year to year, depending on the un-derlying transactions and market conditions. Therefore, the Net trading income item in the financial highlights shows all trading activity income, except yields on bonds classified as available-for-sale assets.
NOTES – DANSKE BANK GROUP
Note
DANSKE BANK KONCERNREGNSKAB 2011 79
45 Income and expenses from the Danica Pension segment are (cont’d) consolidated on a line-by-line basis. The return on insurance
activities accruing to the Group is determined by the con-tribution principle. The contribution calculation is based primarily on life insurance obligations. Since the Group’s re-turn cannot be derived directly from the individual income statement items, net income from insurance business is presented on a single line in the financial highlights. Other income includes earnings contributed by fully con-solidated subsidiaries taken over by the Group under non-performing loan agreements and held for sale.
DANSKE BANK / GROUP 2012 127
NO
TE
S – D
AN
SK
E B
AN
K G
RO
UP
NOTES – DANSKE BANK GROUP

NOTES – DANSKE BANK GROUP
DANSKE BANK ANNUAL REPORT 2012 80
Definitions of ratios and key figures
Ratios and key figures Definition Earnings per share (DKK) Net profit for the year divided by the average number of shares outstanding during the year. For com-
parative purposes, ratios for 2011 have been adjusted to reflect the dilutive effect of the share issue with pre-emption rights for existing shareholders. The factor is calculated as the weighted average share price of existing and new shares divided by the share price on the day before the exercise of subscription rights.
Diluted earnings per share (DKK) Net profit for the year divided by the average number of shares outstanding during the year, including
the dilutive effect of share options and conditional shares granted as share-based payments. Ratios have been adjusted to reflect the share capital increase in April 2011.
Return on average shareholders’ equity (%) Net profit for the year divided by average shareholders’ equity during the year. Cost/income ratio (%) Expenses divided by total income. Total capital ratio Total capital base divided by risk-weighted assets. Tier 1 capital ratio Tier 1 capital divided by risk-weighted assets. Tier 1 capital Primarily paid-up share capital plus retained earnings and hybrid capital, less certain deductions,
such as intangible assets. Hybrid capital Loans that form part of tier 1 capital. This means that hybrid capital is used for covering losses if
shareholders’ equity is lost. Tier 2 capital Subordinated loan capital subject to certain restrictions. For example, if the Group defaults on its
payment obligations, lenders cannot claim early redemption of the loan capital. Capital base Tier 1 capital and tier 2 capital, less certain deductions. Tier 2 capital may not account for more than
half of the capital base. Risk-weighted assets Total risk-weighted assets and off-balance-sheet items that involve credit risk, market risk and opera-
tional risk as calculated in accordance with the Danish FSA’s rules on capital adequacy. Dividend per share (DKK) Proposed dividend on the net profit for the year divided by the number of issued shares at the end of
the year. Ratios have been adjusted to reflect the share capital increase in April 2011. Share price at 31 December Closing price of Danske Bank shares at the end of the year. Book value per share (DKK) Shareholders’ equity at 31 December divided by the number of shares outstanding at the end of the
year. Ratios have been adjusted to reflect the share capital increase in April 2011. Number of full-time-equivalent staff Number of full-time-equivalent staff (part-time staff translated into full-time staff) at the end of the at 31 December year. The figure does not include the staff of businesses held for sale. Funding ratio Lending divided by working capital less bond issues with a term to maturity shorter than one year.
Working capital comprises deposits, issued bonds, subordinated debt and shareholders’ equity. Lend-ing and deposit figures do not include repo transactions.
Lending growth (year-on-year) Growth in lending from the beginning to the end of the year.
Real property exposure Share of total lending and guarantees to the Real property and Building projects industry segments
as defined by Statistics Denmark.
128 DANSKE BANK / GROUP 2012
NOTES – DANSKE BANK GROUP

NOTES – DANSKE BANK GROUP
DANSKE BANK ANNUAL REPORT 2012 80
Definitions of ratios and key figures
Ratios and key figures Definition Earnings per share (DKK) Net profit for the year divided by the average number of shares outstanding during the year. For com-
parative purposes, ratios for 2011 have been adjusted to reflect the dilutive effect of the share issue with pre-emption rights for existing shareholders. The factor is calculated as the weighted average share price of existing and new shares divided by the share price on the day before the exercise of subscription rights.
Diluted earnings per share (DKK) Net profit for the year divided by the average number of shares outstanding during the year, including
the dilutive effect of share options and conditional shares granted as share-based payments. Ratios have been adjusted to reflect the share capital increase in April 2011.
Return on average shareholders’ equity (%) Net profit for the year divided by average shareholders’ equity during the year. Cost/income ratio (%) Expenses divided by total income. Total capital ratio Total capital base divided by risk-weighted assets. Tier 1 capital ratio Tier 1 capital divided by risk-weighted assets. Tier 1 capital Primarily paid-up share capital plus retained earnings and hybrid capital, less certain deductions,
such as intangible assets. Hybrid capital Loans that form part of tier 1 capital. This means that hybrid capital is used for covering losses if
shareholders’ equity is lost. Tier 2 capital Subordinated loan capital subject to certain restrictions. For example, if the Group defaults on its
payment obligations, lenders cannot claim early redemption of the loan capital. Capital base Tier 1 capital and tier 2 capital, less certain deductions. Tier 2 capital may not account for more than
half of the capital base. Risk-weighted assets Total risk-weighted assets and off-balance-sheet items that involve credit risk, market risk and opera-
tional risk as calculated in accordance with the Danish FSA’s rules on capital adequacy. Dividend per share (DKK) Proposed dividend on the net profit for the year divided by the number of issued shares at the end of
the year. Ratios have been adjusted to reflect the share capital increase in April 2011. Share price at 31 December Closing price of Danske Bank shares at the end of the year. Book value per share (DKK) Shareholders’ equity at 31 December divided by the number of shares outstanding at the end of the
year. Ratios have been adjusted to reflect the share capital increase in April 2011. Number of full-time-equivalent staff Number of full-time-equivalent staff (part-time staff translated into full-time staff) at the end of the at 31 December year. The figure does not include the staff of businesses held for sale. Funding ratio Lending divided by working capital less bond issues with a term to maturity shorter than one year.
Working capital comprises deposits, issued bonds, subordinated debt and shareholders’ equity. Lend-ing and deposit figures do not include repo transactions.
Lending growth (year-on-year) Growth in lending from the beginning to the end of the year.
Real property exposure Share of total lending and guarantees to the Real property and Building projects industry segments
as defined by Statistics Denmark.
NOTES – DANSKE BANK GROUP – RISK MANAGEMENT
DANSKE BANK ANNUAL REPORT 2012 81
Risk exposure Danske Bank Group is exposed to a number of risks that it manages at different organisational levels. The main categories of risk are the following: • Credit risk: The risk of losses because counterparties fail to meet all or part of their payment obligations to the Group. • Market risk: The risk of losses because the fair value of the Group’s assets and liabilities varies with changes in market conditions. • Liquidity risk: The risk of losses because the Group’s funding costs increase disproportionately, a lack of funding prevents the Group from
establishing new business, or a lack of funding ultimately prevents the Group from meeting its obligations. • Insurance risk: All types of risk at Danica Pension, including market risk, life insurance risk and operational risk. • Pension risk: The risk of a pension shortfall in the Group’s defined benefit plans that requires it to make additional contributions to cover
pension obligations to current and former employees. Danica Pension is a wholly-owned subsidiary of Danske Bank. As required by Danish law and the executive order on the contribution principle, Danica Pension has notified the Danish FSA of its profit policy. The contribution principle and the profit policy imply that policyholders assume the risks and receive the returns on assets allocated to them. Assets are allocated to policyholders to secure guaranteed benefits. Market risk and other risks on assets and liabilities allocated to policyholders are therefore not consolidated in the tables of this section, but are treated in the section on insurance risk. The management’s report and Risk Management 2012 provide a detailed description of Danske Bank Group’s risk management practices. Risk Management 2012 is available at www.danskebank.com/ir. The publication is not covered by the statutory audit. Capital base The Group’s capital management policies and practices support its business strategy and ensure that it is sufficiently capitalised to withstand even severe macroeconomic downturns. Danske Bank is a licensed financial services provider and must therefore comply with the capital requirements of the Danish Financial Busi-ness Act. The Danish rules are based on the EU capital requirements directives (CRD) and apply to both the Parent Company, Danske Bank A/S, and the Group. Similarly, the Group’s financial subsidiaries in and outside Denmark must comply with local capital requirements. The regulatory requirements stipulate a minimum capital level of 8% of risk-weighted assets under Pillar I (risk-weighted assets for credit risk, market risk and operational risk). In addition, financial institutions are required to calculate their internal solvency need under Pillar II to reflect all relevant risks. The Group’s capital base consists of tier 1 capital (share capital and hybrid capital after deductions) and tier 2 capital (subordinated loan capi-tal after deductions). Core tier 1 capital is based on the carrying amount of shareholders’ equity with the following adjustments: domicile property is revalued at its estimated fair value, the corridor method is not applied to pension obligations, and proposed dividends, goodwill and other intangible assets, etc., are not included. The presentation of the capital base and the total capital ratio in the statement of capital shows the difference between the carrying amount of shareholders’ equity and core tier 1 capital. The Group’s hybrid capital and subordinated loan capital may, subject to certain conditions, be included in the capital base. Section 128 of the Danish Financial Business Act and applicable executive orders specify these conditions. Note 31 shows the Group’s hybrid capital and subor-dinated loan capital. At the end of 2012, the capital base was DKK 174.4 billion (31 December 2011: DKK 162.1 billion), and the total capital ratio was 21.3% (31 December 2011: 17.9%). Total tier 1 capital was DKK 155.0 billion (31 December 2011: DKK 145.0 billion), and the tier 1 capital ratio was 18.9% (31 December 2011: 16.0%). Risk Management 2012 provides a description of the Group’s solvency need. The publication is not covered by the statutory audit. The Group’s capital considerations are based on an assessment of the capital requirements under the current capital adequacy rules and the rules on the transition from previous regulation as well as on an assessment of the effects of future regulations, including CRD IV and re-quirements for systemically important financial institutions (SIFIs). If the final regulatory requirements differ from the Group’s expectations, this may result in adjustments of the capital targets. The Group also considers criteria such as expected growth and earnings, dividend policy and stress test scenarios.
The Group has set prudent capital targets: a total capital ratio of at least 17% and a core tier 1 capital ratio of at least 13%. The Group aspires to improve its credit ratings, which are important for its access to liquidity and for the pricing of its long-term funding. The Group therefore includes rating targets in its capital considerations.
DANSKE BANK / GROUP 2012 129
NO
TE
S – D
AN
SK
E B
AN
K G
RO
UP
NOTES – DANSKE BANK GROUP – RISK MANAGEMENT

NOTES – DANSKE BANK GROUP – RISK MANAGEMENT
DANSKE BANK ANNUAL REPORT 2012 82
Credit risk Danske Bank Group offers loans, credits, guarantees and other products as part of its business model and thus incurs credit risk. Credit risk is the risk of losses arising because counterparties or debtors fail to meet all or part of their payment obligations. Credit risk in-cludes the risk of losses encounter financial difficulties, or losses because of political decisions on nationalisation and expropriation, for example.
if a sovereign state s
The Group grants credits on the basis of information about customers’ individual financial circumstances and monitors their financial situation on an ongoing basis with the aim of assessing whether the basis for credit has changed. Facilities should match customers’ financial situation, including their earnings, capital and assets, and business volume with Danske Bank, to a reasonable degree, and customers should be able to substantiate their repayment ability. Collateral is usually required for credit facilities with long maturities (typically over five years) and for the financing of fixed assets. Credit exposure In the following tables, the Group’s credit exposure is defined as the maximum credit risk excluding collateral. Credit exposure is measured net of accumulated impairment charges. This section also includes detailed information about collateral received. Credit exposure consists of balance sheet items and off-balance-sheet items that carry credit risk. Most of the exposure derives from lending activities in the form of secured and unsecured loans. Positions taken by the Group’s trading and investment units also involve credit risk. A segment of credit risk concerns derivatives and is designated counterparty risk. The overall management of credit risk covers counterparty risk; the credit exposure from securities positions, mainly at trading and investment units; and the risk on direct lending to the same counter-parties. The Group is only to a limited extent exposed to the risk on some balance sheet items. This is the case for assets under customer-funded in-vestment pools, unit-linked investment contracts and insurance contracts. The risk on assets under pooled schemes and unit-linked invest-ment contracts is assumed solely by the customers, while the risk on assets under insurance contracts is assumed primarily by the custom-ers. The section on insurance risk describes the Group’s credit risk on insurance contracts.
130 DANSKE BANK / GROUP 2012
NOTES – DANSKE BANK GROUP – RISK MANAGEMENT

NOTES – DANSKE BANK GROUP – RISK MANAGEMENT
DANSKE BANK ANNUAL REPORT 2012 82
Credit risk Danske Bank Group offers loans, credits, guarantees and other products as part of its business model and thus incurs credit risk. Credit risk is the risk of losses arising because counterparties or debtors fail to meet all or part of their payment obligations. Credit risk in-cludes the risk of losses encounter financial difficulties, or losses because of political decisions on nationalisation and expropriation, for example.
if a sovereign state s
The Group grants credits on the basis of information about customers’ individual financial circumstances and monitors their financial situation on an ongoing basis with the aim of assessing whether the basis for credit has changed. Facilities should match customers’ financial situation, including their earnings, capital and assets, and business volume with Danske Bank, to a reasonable degree, and customers should be able to substantiate their repayment ability. Collateral is usually required for credit facilities with long maturities (typically over five years) and for the financing of fixed assets. Credit exposure In the following tables, the Group’s credit exposure is defined as the maximum credit risk excluding collateral. Credit exposure is measured net of accumulated impairment charges. This section also includes detailed information about collateral received. Credit exposure consists of balance sheet items and off-balance-sheet items that carry credit risk. Most of the exposure derives from lending activities in the form of secured and unsecured loans. Positions taken by the Group’s trading and investment units also involve credit risk. A segment of credit risk concerns derivatives and is designated counterparty risk. The overall management of credit risk covers counterparty risk; the credit exposure from securities positions, mainly at trading and investment units; and the risk on direct lending to the same counter-parties. The Group is only to a limited extent exposed to the risk on some balance sheet items. This is the case for assets under customer-funded in-vestment pools, unit-linked investment contracts and insurance contracts. The risk on assets under pooled schemes and unit-linked invest-ment contracts is assumed solely by the customers, while the risk on assets under insurance contracts is assumed primarily by the custom-ers. The section on insurance risk describes the Group’s credit risk on insurance contracts.
NOTES – DANSKE BANK GROUP – RISK MANAGEMENT
(DKK millions)
DANSKE BANK ANNUAL REPORT 2012 83
Breakdown of credit exposure Credit exposure, Contracts, Credit exposure, Counterparty risk other trading and full risk assumed 2012 Total lending activities (derivatives) investing activities Insurance risk by customers
Balance sheet items
Demand deposits with central banks 86,032 86,032 - - - -
Due from credit institutions and central banks 113,657 113,657 - - - -
Repo loans with credit institutions and central banks 86,989 86,989 - - - -
Trading portfolio assets 812,927 - 408,990 403,937 - -
Investment securities 107,724 - - 107,724 - -
Loans and advances at amortised cost 941,628 941,628 - - - -
Repo loans 220,188 220,188 - - - -
Loans at fair value 732,762 732,762 - - - -
Assets under pooled schemes and unit-linked investment contracts 70,625 - - - - 70,625
Assets under insurance contracts 241,343 - - - 241,343 -
Off-balance-sheet items
Guarantees 80,115 80,115 - - - -
Irrevocable loan commitments shorter than 1 year 53,056 53,056 - - - -
Irrevocable loan commitments longer than 1 year 108,614 108,614 - - - -
Other unutilised commitments 550 - - 550 - -
Total 3,656,210 2,423,041 408,990 512,211 241,343 70,625
Non-core Ireland portion 19,458 19,458 - - - -
2011
Balance sheet items
Demand deposits with central banks 18,015 18,015 - - - -
Due from credit institutions and central banks 74,041 74,041 - - - -
Repo loans with credit institutions and central banks 106,829 106,829 - - - -
Trading portfolio assets 909,755 - 550,970 358,785 - -
Investment securities 109,264 - - 109,264 - -
Loans and advances at amortised cost 977,284 977,284 - - - -
Repo loans 149,198 149,198 - - - -
Loans at fair value 720,741 720,741 - - - -
Assets under pooled schemes and unit-linked investment contracts 61,888 - - - - 61,888
Assets under insurance contracts 230,668 - - - 230,668 -
Off-balance-sheet items
Guarantees 83,131 83,131 - - - -
Irrevocable loan commitments shorter than 1 year 63,013 63,013 - - - -
Irrevocable loan commitments longer than 1 year 106,459 106,459 - - - -
Other unutilised commitments 942 - - 942 - -
Total 3,611,228 2,298,711 550,970 468,991 230,668 61,888
In addition to credit exposure from lending activities, loan offers made and revocable credit facilities granted by the Group amounted to DKK 323 billion (31 December 2011: DKK 355 billion). These items are included in the calculation of risk-weighted assets in accordance with the Capital Requirements Directive.
DANSKE BANK / GROUP 2012 131
NO
TE
S – D
AN
SK
E B
AN
K G
RO
UP
NOTES – DANSKE BANK GROUP – RISK MANAGEMENT
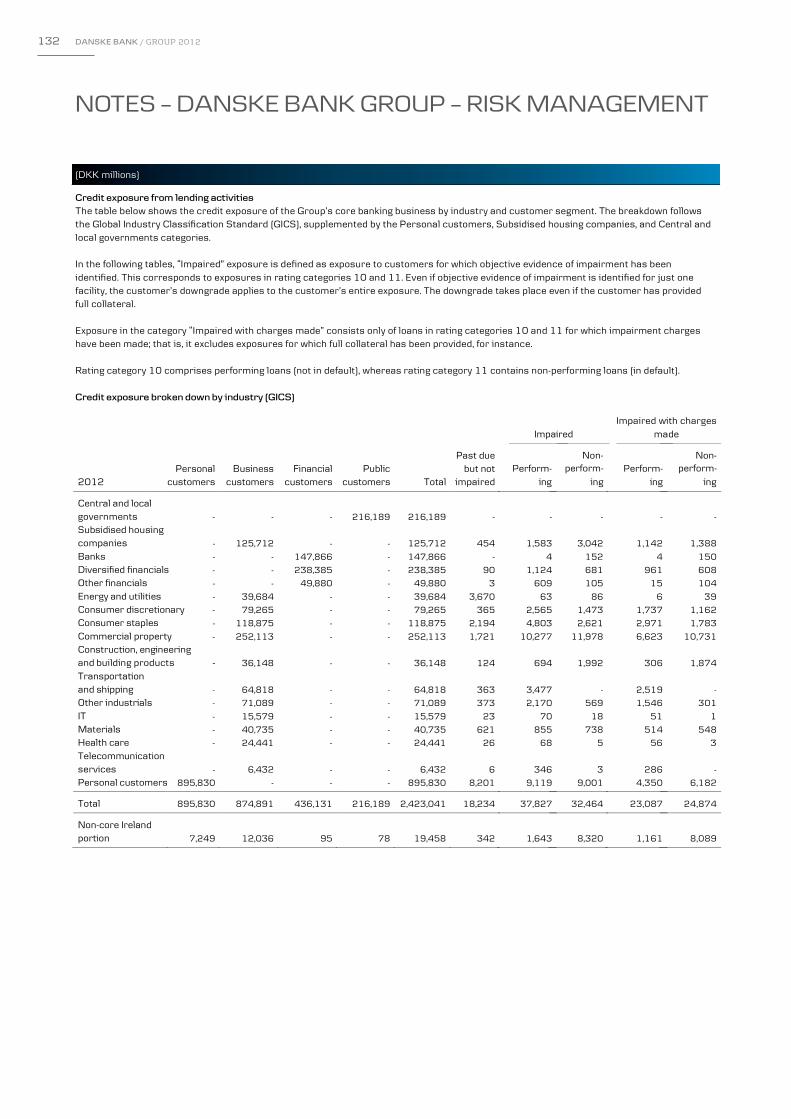
NOTES – DANSKE BANK GROUP – RISK MANAGEMENT
(DKK millions)
DANSKE BANK ANNUAL REPORT 2012 84
Credit exposure from lending activities The table below shows the credit exposure of the Group’s core banking business by industry and customer segment. The breakdown follows the Global Industry Classification Standard (GICS), supplemented by the Personal customers, Subsidised housing companies, and Central and local governments categories. In the following tables, “Impaired” exposure is defined as exposure to customers for which objective evidence of impairment has been identified. This corresponds to exposures in rating categories 10 and 11. Even if objective evidence of impairment is identified for just one facility, the customer’s downgrade applies to the customer’s entire exposure. The downgrade takes place even if the customer has provided full collateral. Exposure in the category “Impaired with charges made” consists only of loans in rating categories 10 and 11 for which impairment charges have been made; that is, it excludes exposures for which full collateral has been provided, for instance. Rating category 10 comprises performing loans (not in default), whereas rating category 11 contains non-performing loans (in default). Credit exposure broken down by industry (GICS)
Impaired Impaired with charges
made
2012 Personal
customers Business
customers Financial
customers Public
customers Total
Past due but not
impaired ing
Non-perform-
ing
Central and local governments - - - 216,189 216,189 - - - - -
Subsidised housing companies - 125,712 - - 125,712 454 1,583 3,042 1,142 1,388
Banks - - 147,866 - 147,866 - 4 152 4 150
Diversified financials - - 238,385 - 238,385 90 1,124 681 961 608
Other financials - - 49,880 - 49,880 3 609 105 15 104
Energy and utilities - 39,684 - - 39,684 3,670 63 86 6 39
Consumer discretionary - 79,265 - - 79,265 365 2,565 1,473 1,737 1,162
Consumer staples - 118,875 - - 118,875 2,194 4,803 2,621 2,971 1,783
Commercial property - 252,113 - - 252,113 1,721 10,277 11,978 6,623 10,731
Construction, engineering and building products - 36,148 - - 36,148 124 694 1,992 306 1,874
Transportation and shipping - 64,818 - - 64,818 363 3,477 - 2,519 -
Other industrials - 71,089 - - 71,089 373 2,170 569 1,546 301
IT - 15,579 - - 15,579 23 70 18 51 1
Materials - 40,735 - - 40,735 621 855 738 514 548
Health care - 24,441 - - 24,441 26 68 5 56 3
Telecommunication services - 6,432 - - 6,432 6 346 3 286 -
Personal customers 895,830 - - - 895,830 8,201 9,119 9,001 4,350 6,182
Total 895,830 874,891 436,131 216,189 2,423,041 18,234 37,827 32,464 23,087 24,874
Non-core Ireland portion 7,249 12,036 95 78 19,458 342 1,643 8,320 1,161 8,089
Perform- perform-ing
Non-
ingPerform-
132 DANSKE BANK / GROUP 2012
NOTES – DANSKE BANK GROUP – RISK MANAGEMENT

NOTES – DANSKE BANK GROUP – RISK MANAGEMENT
(DKK millions)
DANSKE BANK ANNUAL REPORT 2012 84
Credit exposure from lending activities The table below shows the credit exposure of the Group’s core banking business by industry and customer segment. The breakdown follows the Global Industry Classification Standard (GICS), supplemented by the Personal customers, Subsidised housing companies, and Central and local governments categories. In the following tables, “Impaired” exposure is defined as exposure to customers for which objective evidence of impairment has been identified. This corresponds to exposures in rating categories 10 and 11. Even if objective evidence of impairment is identified for just one facility, the customer’s downgrade applies to the customer’s entire exposure. The downgrade takes place even if the customer has provided full collateral. Exposure in the category “Impaired with charges made” consists only of loans in rating categories 10 and 11 for which impairment charges have been made; that is, it excludes exposures for which full collateral has been provided, for instance. Rating category 10 comprises performing loans (not in default), whereas rating category 11 contains non-performing loans (in default). Credit exposure broken down by industry (GICS)
Impaired Impaired with charges
made
2012 Personal
customers Business
customers Financial
customers Public
customers Total
Past due but not
impaired ing
Non-perform-
ing
Central and local governments - - - 216,189 216,189 - - - - -
Subsidised housing companies - 125,712 - - 125,712 454 1,583 3,042 1,142 1,388
Banks - - 147,866 - 147,866 - 4 152 4 150
Diversified financials - - 238,385 - 238,385 90 1,124 681 961 608
Other financials - - 49,880 - 49,880 3 609 105 15 104
Energy and utilities - 39,684 - - 39,684 3,670 63 86 6 39
Consumer discretionary - 79,265 - - 79,265 365 2,565 1,473 1,737 1,162
Consumer staples - 118,875 - - 118,875 2,194 4,803 2,621 2,971 1,783
Commercial property - 252,113 - - 252,113 1,721 10,277 11,978 6,623 10,731
Construction, engineering and building products - 36,148 - - 36,148 124 694 1,992 306 1,874
Transportation and shipping - 64,818 - - 64,818 363 3,477 - 2,519 -
Other industrials - 71,089 - - 71,089 373 2,170 569 1,546 301
IT - 15,579 - - 15,579 23 70 18 51 1
Materials - 40,735 - - 40,735 621 855 738 514 548
Health care - 24,441 - - 24,441 26 68 5 56 3
Telecommunication services - 6,432 - - 6,432 6 346 3 286 -
Personal customers 895,830 - - - 895,830 8,201 9,119 9,001 4,350 6,182
Total 895,830 874,891 436,131 216,189 2,423,041 18,234 37,827 32,464 23,087 24,874
Non-core Ireland portion 7,249 12,036 95 78 19,458 342 1,643 8,320 1,161 8,089
Perform- perform-ing
Non-
ingPerform-
NOTES – DANSKE BANK GROUP – RISK MANAGEMENT
(DKK millions)
DANSKE BANK ANNUAL REPORT 2012 85
Impaired Impaired with charges
made
2011 Personal
customers Business
customers Financial
customers Public
customers Total
Past due but not
impaired
Central and local governments - - - 122,495 122,495 106 - - - -
Subsidised housing companies - 123,161 - - 123,161 227 789 1,580 480 925
Banks - - 178,778 - 178,778 - 47 - - 149
Diversified financials - - 153,010 - 153,010 402 1,540 3,901 1,323 3,546
Other financials - - 56,915 - 56,915 33 2 186 - 158
Energy and utilities - 40,698 - - 40,698 24 100 28 35 27
Consumer discretionary - 83,208 - - 83,208 942 2,438 1,321 1,225 1,014
Consumer staples - 117,666 - - 117,666 745 5,381 1,770 1,148 581
Commercial property - 257,267 - - 257,267 1,775 10,823 10,382 5,714 8,685
Construction, engineering and building products - 36,572 - - 36,572 245 1,895 1,893 1,522 1,795
Transportation and shipping - 71,824 - - 71,824 336 941 2,019 670 1,833
Other industrials - 77,995 - - 77,995 397 3,505 1,654 2,740 1,455
IT - 15,615 - - 15,615 66 113 54 79 30
Materials - 42,483 - - 42,483 138 358 - 230 -
Health care - 27,562 - - 27,562 144 80 39 50 11
Telecommunication services - 4,494 - - 4,494 3 550 15 171 7
Personal customers 888,968 - - - 888,968 9,839 7,072 8,324 2,343 5,323
Total 888,968 898,545 388,703 122,495 2,298,711 15,422 35,634 33,166 17,730 25,539
ing Perform-
Non-perform-
ing
Non-perform-
ing ing Perform-
DANSKE BANK / GROUP 2012 133
NO
TE
S – D
AN
SK
E B
AN
K G
RO
UP
NOTES – DANSKE BANK GROUP – RISK MANAGEMENT

NOTES – DANSKE BANK GROUP – RISK MANAGEMENT
(DKK millions)
DANSKE BANK ANNUAL REPORT 2012 86
Credit exposure broken down by geographical area
The table shows the credit exposure of the Group’s core banking business by country and customer segment.
Impaired Impaired with changes
made
2012 Personal
customers Business
customers Financial
customers Public
customers Total
Past due but not
impaired Performing Non-
performing Performing Non-
performing
Denmark 554,728 425,256 168,482 120,970 1,269,436 9,036 27,286 14,184 16,626 8,390
Finland 103,587 86,928 5,904 26,865 223,284 1,656 1,515 2,460 753 2,165
Sweden 91,514 148,999 32,745 28,825 302,083 4,789 1,317 1,499 880 906
Ireland 22,137 20,248 5,988 7,009 55,382 651 2,087 8,858 1,498 8,517
UK 20,368 30,588 89,117 8,288 148,361 148 1,655 2,261 830 2,062
Germany 594 12,799 10,921 12,937 37,251 9 138 74 41 41
Estonia 5,111 4,130 173 168 9,582 408 225 379 197 272
Latvia 993 1,156 182 19 2,350 66 164 80 162 75
Lithuania 4,667 2,823 197 545 8,232 1 582 618 432 586
Spain 822 62 934 - 1,818 8 29 22 12 20
France 594 1,465 8,510 - 10,569 6 7 90 2 88
Italy 103 66 538 - 707 103 - 10 - 10
Portugal 63 1 13 1 78 - 5 - 5 -
Greece 34 4 - - 38 - 1 - 1 -
Belgium 334 1,773 3,902 - 6,009 6 135 8 1 8
Cyprus 31 3,147 80 - 3,258 - 38 - 34 -
Netherlands 179 1,157 2,145 - 3,481 4 10 25 7 25
Luxembourg 297 377 57,389 74 58,137 - 7 21 - 9
Poland 52 2,213 1,098 31 3,394 2 1 14 1 12
Other EU member states 213 377 586 67 1,243 1 - 4 - 3
Norway 84,967 105,546 6,675 8,131 205,319 1,313 1,982 1,251 1,325 1,124
Eastern Europe 110 1,639 1,582 172 3,503 - 3 2 - 1
Switzerland 898 1,875 1,450 - 4,223 4 - 32 - 26
Turkey 40 50 1,337 - 1,427 - - 2 - 1
Other European countries 201 11 627 - 839 5 15 173 4 171
North America 1,158 17,155 27,655 - 45,968 8 594 378 260 356
Central and South America 166 587 2,999 103 3,855 1 2 1 - 1
Africa 139 1,288 662 622 2,711 - - 2 - 2
Asia 1,548 2,708 3,640 1,362 9,258 6 29 16 16 3
Oceania 182 463 600 - 1,245 3 - - - -
Total 895,830 874,891 436,131 216,189 2,423,041 18,234 37,827 32,464 23,087 24,874
Geographical segmentation is based on the customer’s country of residence rather than the location in which the individual transaction is recorded. The table lists the countries to which the Group has a total exposure above DKK 1 billion together with Ireland, Portugal, Italy, Greece and Spain.
134 DANSKE BANK / GROUP 2012
NOTES – DANSKE BANK GROUP – RISK MANAGEMENT

NOTES – DANSKE BANK GROUP – RISK MANAGEMENT
(DKK millions)
DANSKE BANK ANNUAL REPORT 2012 86
Credit exposure broken down by geographical area
The table shows the credit exposure of the Group’s core banking business by country and customer segment.
Impaired Impaired with changes
made
2012 Personal
customers Business
customers Financial
customers Public
customers Total
Past due but not
impaired Performing Non-
performing Performing Non-
performing
Denmark 554,728 425,256 168,482 120,970 1,269,436 9,036 27,286 14,184 16,626 8,390
Finland 103,587 86,928 5,904 26,865 223,284 1,656 1,515 2,460 753 2,165
Sweden 91,514 148,999 32,745 28,825 302,083 4,789 1,317 1,499 880 906
Ireland 22,137 20,248 5,988 7,009 55,382 651 2,087 8,858 1,498 8,517
UK 20,368 30,588 89,117 8,288 148,361 148 1,655 2,261 830 2,062
Germany 594 12,799 10,921 12,937 37,251 9 138 74 41 41
Estonia 5,111 4,130 173 168 9,582 408 225 379 197 272
Latvia 993 1,156 182 19 2,350 66 164 80 162 75
Lithuania 4,667 2,823 197 545 8,232 1 582 618 432 586
Spain 822 62 934 - 1,818 8 29 22 12 20
France 594 1,465 8,510 - 10,569 6 7 90 2 88
Italy 103 66 538 - 707 103 - 10 - 10
Portugal 63 1 13 1 78 - 5 - 5 -
Greece 34 4 - - 38 - 1 - 1 -
Belgium 334 1,773 3,902 - 6,009 6 135 8 1 8
Cyprus 31 3,147 80 - 3,258 - 38 - 34 -
Netherlands 179 1,157 2,145 - 3,481 4 10 25 7 25
Luxembourg 297 377 57,389 74 58,137 - 7 21 - 9
Poland 52 2,213 1,098 31 3,394 2 1 14 1 12
Other EU member states 213 377 586 67 1,243 1 - 4 - 3
Norway 84,967 105,546 6,675 8,131 205,319 1,313 1,982 1,251 1,325 1,124
Eastern Europe 110 1,639 1,582 172 3,503 - 3 2 - 1
Switzerland 898 1,875 1,450 - 4,223 4 - 32 - 26
Turkey 40 50 1,337 - 1,427 - - 2 - 1
Other European countries 201 11 627 - 839 5 15 173 4 171
North America 1,158 17,155 27,655 - 45,968 8 594 378 260 356
Central and South America 166 587 2,999 103 3,855 1 2 1 - 1
Africa 139 1,288 662 622 2,711 - - 2 - 2
Asia 1,548 2,708 3,640 1,362 9,258 6 29 16 16 3
Oceania 182 463 600 - 1,245 3 - - - -
Total 895,830 874,891 436,131 216,189 2,423,041 18,234 37,827 32,464 23,087 24,874
Geographical segmentation is based on the customer’s country of residence rather than the location in which the individual transaction is recorded. The table lists the countries to which the Group has a total exposure above DKK 1 billion together with Ireland, Portugal, Italy, Greece and Spain.
NOTES – DANSKE BANK GROUP – RISK MANAGEMENT
(DKK millions)
DANSKE BANK ANNUAL REPORT 2012 87
Impaired Impaired with charges
made
2011
Personal customers
Business customers
Financial customers
Public customers Total
Past due but not
impaired Performing Non-
performing Performing Non-
performing
Denmark 561,918 428,731 188,286 62,721 1,241,656 7,864 23,197 13,038 9,682 7,401
Finland 100,937 88,684 4,369 6,800 200,790 2,063 1,095 2,585 660 2,115
Sweden 85,567 158,662 27,727 16,812 288,768 288 1,173 1,062 608 751
Ireland 24,543 25,169 9,966 7,430 67,108 902 5,262 7,519 4,010 7,020
UK 19,968 33,535 66,088 16,802 136,393 462 966 2,695 593 2,471
Germany 545 12,389 2,180 390 15,504 19 180 35 105 13
Estonia 5,553 4,545 145 336 10,579 480 32 426 - 426
Latvia 1,075 890 177 - 2,142 50 179 85 179 85
Lithuania 4,723 3,211 554 784 9,272 136 600 635 600 635
Spain 879 45 433 - 1,357 8 29 30 16 22
France 581 1,742 3,147 - 5,470 9 4 63 - 48
Italy 127 62 106 - 295 1 4 10 - 10
Portugal 109 - 70 - 179 1 1 1 1 1
Greece 40 2 - - 42 - - - - -
Belgium 273 1,175 3,131 - 4,579 1 1 8 1 8
Cyprus 15 2,511 76 - 2,602 - 90 - 90 -
Netherlands 166 1,248 2,107 - 3,521 1 3 - - -
Luxembourg 272 316 27,957 151 28,696 1 153 11 142 4
Poland 76 2,593 1,212 36 3,917 2 22 15 - 14
Other EU member states 193 354 292 - 839 2 59 3 18 2
Norway 77,395 104,493 8,062 8,930 198,880 3,077 2,364 1,213 929 1,102
Eastern Europe 78 1,571 1,849 145 3,643 - 2 1 - 1
Switzerland 718 2,483 1,354 - 4,555 27 - 18 - 13
Turkey 31 65 1,833 - 1,929 - 47 1 - 1
Other European countries 212 164 570 - 946 7 10 176 1 176
North America 1,106 18,082 26,905 - 46,093 7 133 3,507 94 3,212
Central and South America 110 663 1,473 127 2,373 - 6 1 - -
Africa 146 1,275 1,401 696 3,518 1 - 2 1 2
Asia 1,458 3,149 7,069 335 12,011 13 21 25 - 5
Oceania 154 736 164 - 1,054 - 1 1 - 1
Total 888,968 898,545 388,703 122,495 2,298,711 15,422 35,634 33,166 17,730 25,539
DANSKE BANK / GROUP 2012 135
NO
TE
S – D
AN
SK
E B
AN
K G
RO
UP
NOTES – DANSKE BANK GROUP – RISK MANAGEMENT
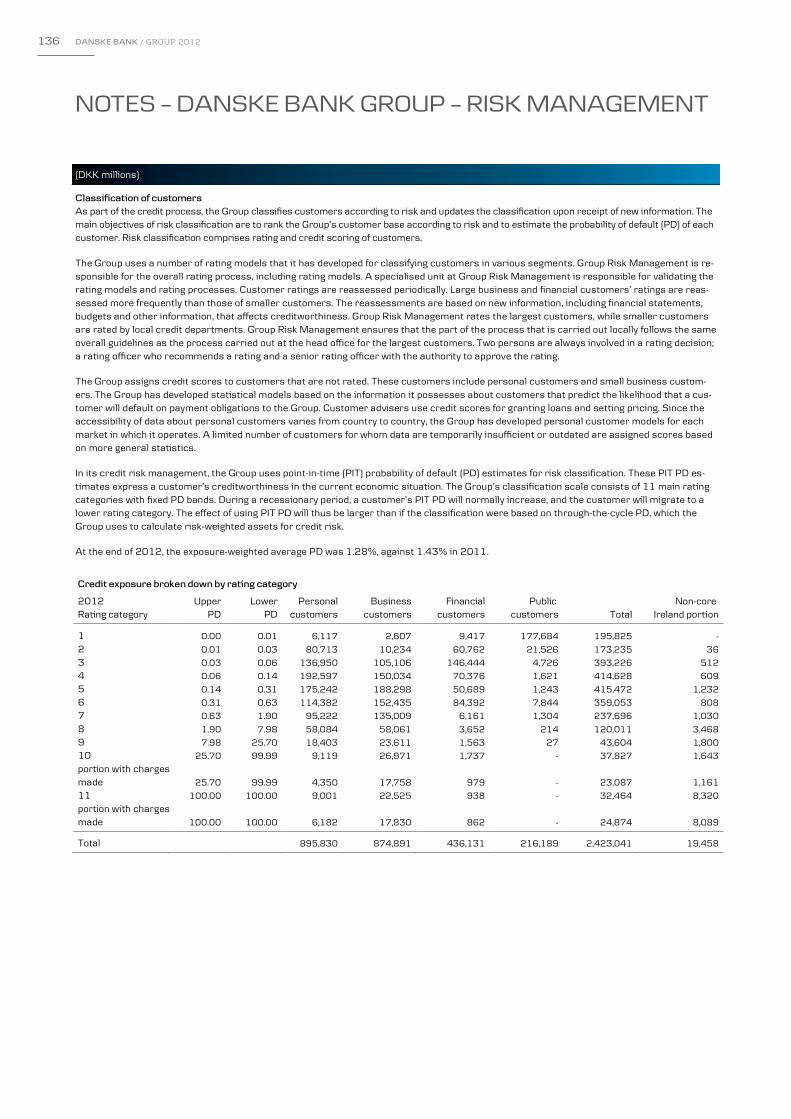
NOTES – DANSKE BANK GROUP – RISK MANAGEMENT
(DKK millions)
DANSKE BANK ANNUAL REPORT 2012 88
Classification of customers As part of the credit process, the Group classifies customers according to risk and updates the classification upon receipt of new information. The main objectives of risk classification are to rank the Group’s customer base according to risk and to estimate the probability of default (PD) of each customer. Risk classification comprises rating and credit scoring of customers. The Group uses a number of rating models that it has developed for classifying customers in various segments. Group Risk Management is re-sponsible for the overall rating process, including rating models. A specialised unit at Group Risk Management is responsible for validating the rating models and rating processes. Customer ratings are reassessed periodically. Large business and financial customers’ ratings are reas-sessed more frequently than those of smaller customers. The reassessments are based on new information, including financial statements, budgets and other information, that affects creditworthiness. Group Risk Management rates the largest customers, while smaller customers are rated by local credit departments. Group Risk Management ensures that the part of the process that is carried out locally follows the same overall guidelines as the process carried out at the head office for the largest customers. Two persons are always involved in a rating decision; a rating officer who recommends a rating and a senior rating officer with the authority to approve the rating. The Group assigns credit scores to customers that are not rated. These customers include personal customers and small business custom-ers. The Group has developed statistical models based on the information it possesses about customers that predict the likelihood that a cus-tomer will default on payment obligations to the Group. Customer advisers use credit scores for granting loans and setting pricing. Since the accessibility of data about personal customers varies from country to country, the Group has developed personal customer models for each market in which it operates. A limited number of customers for whom data are temporarily insufficient or outdated are assigned scores based on more general statistics. In its credit risk management, the Group uses point-in-time (PIT) probability of default (PD) estimates for risk classification. These PIT PD es-timates express a customer’s creditworthiness in the current economic situation. The Group’s classification scale consists of 11 main rating categories with fixed PD bands. During a recessionary period, a customer’s PIT PD will normally increase, and the customer will migrate to a lower rating category. The effect of using PIT PD will thus be larger than if the classification were based on through-the-cycle PD, which the Group uses to calculate risk-weighted assets for credit risk. At the end of 2012, the exposure-weighted average PD was 1.28%, against 1.43% in 2011.
Credit exposure broken down by rating category
2012 Upper Lower Personal Business Financial Public Non-core Rating category PD PD customers customers customers customers Total Ireland portion 1 0.00 0.01 6,117 2,607 9,417 177,684 195,825 - 2 0.01 0.03 80,713 10,234 60,762 21,526 173,235 36
3 0.03 0.06 136,950 105,106 146,444 4,726 393,226 512
4 0.06 0.14 192,597 150,034 70,376 1,621 414,628 609
5 0.14 0.31 175,242 188,298 50,689 1,243 415,472 1,232
6 0.31 0.63 114,382 152,435 84,392 7,844 359,053 808
7 0.63 1.90 95,222 135,009 6,161 1,304 237,696 1,030
8 1.90 7.98 58,084 58,061 3,652 214 120,011 3,468
9 7.98 25.70 18,403 23,611 1,563 27 43,604 1,800
10 25.70 99.99 9,119 26,971 1,737 - 37,827 1,643
portion with charges made 25.70 99.99 4,350 17,758 979 - 23,087 1,161
11 100.00 100.00 9,001 22,525 938 - 32,464 8,320
portion with charges made 100.00 100.00 6,182 17,830 862 - 24,874 8,089
Total 895,830 874,891 436,131 216,189 2,423,041 19,458
136 DANSKE BANK / GROUP 2012
NOTES – DANSKE BANK GROUP – RISK MANAGEMENT

NOTES – DANSKE BANK GROUP – RISK MANAGEMENT
(DKK millions)
DANSKE BANK ANNUAL REPORT 2012 88
Classification of customers As part of the credit process, the Group classifies customers according to risk and updates the classification upon receipt of new information. The main objectives of risk classification are to rank the Group’s customer base according to risk and to estimate the probability of default (PD) of each customer. Risk classification comprises rating and credit scoring of customers. The Group uses a number of rating models that it has developed for classifying customers in various segments. Group Risk Management is re-sponsible for the overall rating process, including rating models. A specialised unit at Group Risk Management is responsible for validating the rating models and rating processes. Customer ratings are reassessed periodically. Large business and financial customers’ ratings are reas-sessed more frequently than those of smaller customers. The reassessments are based on new information, including financial statements, budgets and other information, that affects creditworthiness. Group Risk Management rates the largest customers, while smaller customers are rated by local credit departments. Group Risk Management ensures that the part of the process that is carried out locally follows the same overall guidelines as the process carried out at the head office for the largest customers. Two persons are always involved in a rating decision; a rating officer who recommends a rating and a senior rating officer with the authority to approve the rating. The Group assigns credit scores to customers that are not rated. These customers include personal customers and small business custom-ers. The Group has developed statistical models based on the information it possesses about customers that predict the likelihood that a cus-tomer will default on payment obligations to the Group. Customer advisers use credit scores for granting loans and setting pricing. Since the accessibility of data about personal customers varies from country to country, the Group has developed personal customer models for each market in which it operates. A limited number of customers for whom data are temporarily insufficient or outdated are assigned scores based on more general statistics. In its credit risk management, the Group uses point-in-time (PIT) probability of default (PD) estimates for risk classification. These PIT PD es-timates express a customer’s creditworthiness in the current economic situation. The Group’s classification scale consists of 11 main rating categories with fixed PD bands. During a recessionary period, a customer’s PIT PD will normally increase, and the customer will migrate to a lower rating category. The effect of using PIT PD will thus be larger than if the classification were based on through-the-cycle PD, which the Group uses to calculate risk-weighted assets for credit risk. At the end of 2012, the exposure-weighted average PD was 1.28%, against 1.43% in 2011.
Credit exposure broken down by rating category
2012 Upper Lower Personal Business Financial Public Non-core Rating category PD PD customers customers customers customers Total Ireland portion 1 0.00 0.01 6,117 2,607 9,417 177,684 195,825 - 2 0.01 0.03 80,713 10,234 60,762 21,526 173,235 36
3 0.03 0.06 136,950 105,106 146,444 4,726 393,226 512
4 0.06 0.14 192,597 150,034 70,376 1,621 414,628 609
5 0.14 0.31 175,242 188,298 50,689 1,243 415,472 1,232
6 0.31 0.63 114,382 152,435 84,392 7,844 359,053 808
7 0.63 1.90 95,222 135,009 6,161 1,304 237,696 1,030
8 1.90 7.98 58,084 58,061 3,652 214 120,011 3,468
9 7.98 25.70 18,403 23,611 1,563 27 43,604 1,800
10 25.70 99.99 9,119 26,971 1,737 - 37,827 1,643
portion with charges made 25.70 99.99 4,350 17,758 979 - 23,087 1,161
11 100.00 100.00 9,001 22,525 938 - 32,464 8,320
portion with charges made 100.00 100.00 6,182 17,830 862 - 24,874 8,089
Total 895,830 874,891 436,131 216,189 2,423,041 19,458
NOTES – DANSKE BANK GROUP – RISK MANAGEMENT
(DKK millions)
DANSKE BANK ANNUAL REPORT 2012 89
2011 Upper Lower Personal Business Financial Public Non-core Rating category PD PD customers customers customers customers Total Ireland portion 1 0.00 0.01 6,253 3,704 10,132 70,133 90,222 -
2 0.01 0.03 76,962 10,811 53,557 23,423 164,753 -
3 0.03 0.06 121,592 110,004 133,683 5,525 370,804 -
4 0.06 0.14 171,951 144,554 65,229 4,078 385,812 -
5 0.14 0.31 183,553 182,371 46,465 4,332 416,721 -
6 0.31 0.63 119,536 160,654 53,146 9,194 342,530 -
7 0.63 1.90 106,557 134,648 11,436 4,293 256,934 -
8 1.90 7.98 67,841 74,841 6,453 1,173 150,308 -
9 7.98 25.70 19,327 29,230 2,926 344 51,827 -
10 25.70 99.99 7,072 26,973 1,589 - 35,634 -
portion with charges made 25.70 99.99 2,343 14,064 1,323 - 17,730 -
11 100.00 100.00 8,324 20,755 4,087 - 33,166 -
portion with charges made 100.00 100.00 5,323 16,362 3,854 - 25,539 -
Total 888,968 898,545 388,703 122,495 2,298,711 -
Concentration risk The Group uses the concentrations it identifies in the credit portfolio as a credit risk management parameter. Concentration risk arises in the credit portfolio as an inevitable consequence of the Group’s business strategy. Risk concentrations can be divided into single customer concentrations and portfolio concentrations.
risk
Single customer concentrations Under section 145 of the Danish Financial Business Act, exposure to a single customer or a group of related customers – after deduction of particularly secure claims – may not exceed 25% of the capital base. In addition, according to the Danish FSA’s Supervisory Diamond, the sum of exposures that each equal or exceed 10% of the capital base may not exceed 125% of the capital base. In 2012, the Group’s exposures did not exceed the limits established by section 145 or the Supervisory Diamond.
The table below shows credit exposures to groups equalling 10% or more of the Group’s capital base. The table does not include intra-group balances. At the end of 2012, no exposure exceeded 20% of the capital base, and one exposure exceeded 10% of the capital base (classified in rating category two).
2012 2011 Exposures calculated in Exposures calculated in accordance with section 145 accordance with section 145
Number 1 1
Exposure > 20% of capital base - -
Exposure between 10% and 20% of capital base 20,289 18,035
Total 20,289 18,035
The Group has introduced a stricter internal portfolio limit of 95% of the capital base for the sum of individual exposures that exceed 10% of the capital base as well as a limit of 150% of the capital base for the sum of exposures from 5-9.99% of the capital base – that is, the largest individual exposures not covered by the rules on large exposures. Portfolio concentrations The Group’s credit exposure is concentrated especially on personal customers and business customers, including SMEs. At the end of 2012, exposure to personal customers amounted to 37% of total credit exposure (31 December 2011: 39%). Most of this exposure involved home financing secured on real property. Exposure to business customers amounted to 36% of total credit exposure (31 December 2011: 39%). SMEs accounted for 25% of total credit exposure (31 December 2011: 27%). Most of this exposure involved property financing, with working capital financing accounting for most of the remainder. Customers domiciled in Denmark accounted for 52% of the Group’s total credit exposure (31 December 2011: 54%), and customers in the other Nordic countries accounted for 30% (31 December 2011: 30%). Collateral Mitigating risks in the credit portfolio is a key element of the Group’s credit policy. The most important means of mitigating risk are collateral and guarantees. The most common collateral types, measured by collateral value, are real property and financial assets (shares or bonds).
DANSKE BANK / GROUP 2012 137
NO
TE
S – D
AN
SK
E B
AN
K G
RO
UP
NOTES – DANSKE BANK GROUP – RISK MANAGEMENT

NOTES – DANSKE BANK GROUP – RISK MANAGEMENT
(DKK millions)
DANSKE BANK ANNUAL REPORT 2012 90
The initial valuation of collateral takes place during the credit approval process when the Group collects information that enables it to make a sound valuation. In compliance with local statutory regulations, the Group regularly reassesses the value of collateral. The value of collateral is calculated as the estimated amount at which it can be sold on the valuation date to an independent party, adjusted for a haircut and the out-standing debt on any senior claims. For the most common collateral types, the Group uses models to estimate the value. For collateral types for which there is no valuation model, the Group calculates the value manually. A haircut is a measure of the risk that the Group will not be able to sell collateral at a price equal to the expected market value. The haircut thus includes maintenance costs in the period when the asset is for sale, fees for external advisory services and any loss in value. For real property, haircuts depend on the property type and usually range between 20% and 40% of the market value. For listed securities, the haircut is calculated using an internal model based on 20-day price volatility. For unlisted securities, the haircut is 100%. Realisation of collateral is generally made on behalf of the borrower. However, if the Group submits the highest bid at a forced sale of property and acquires title, it will seek to sell the property as soon as possible. At the end of 2012, the Group recognised properties taken over in Den-mark at a carrying amount of DKK 265 million (31 December 2011: DKK 317 million) and properties taken over in other countries at DKK 109 million (31 December 2011: DKK 128 million). The properties are held for sale. Collateral Personal Business Financial Public 2012 customers customers customers customers Total
Credit exposure 895,830 874,891 436,131 216,189 2,423,041
Collateral value 752,911 502,334 292,835 17,114 1,565,194
Total unsecured credit exposure 142,919 372,557 143,296 199,075 857,847
Unsecured portion of credit exposure (%) 16.0 42.6 32.9 92.1 35.4
2011
Credit exposure 888,968 898,545 388,703 122,495 2,298,711 Collateral value 686,661 472,854 255,632 39,554 1,454,701
Total unsecured credit exposure 202,307 425,691 133,071 82,941 844,010
Unsecured portion of credit exposure (%) 22.8 47.4 34.2 67.7 36.7
Overcollateralisation is not included.
138 DANSKE BANK / GROUP 2012
NOTES – DANSKE BANK GROUP – RISK MANAGEMENT

NOTES – DANSKE BANK GROUP – RISK MANAGEMENT
(DKK millions)
DANSKE BANK ANNUAL REPORT 2012 90
The initial valuation of collateral takes place during the credit approval process when the Group collects information that enables it to make a sound valuation. In compliance with local statutory regulations, the Group regularly reassesses the value of collateral. The value of collateral is calculated as the estimated amount at which it can be sold on the valuation date to an independent party, adjusted for a haircut and the out-standing debt on any senior claims. For the most common collateral types, the Group uses models to estimate the value. For collateral types for which there is no valuation model, the Group calculates the value manually. A haircut is a measure of the risk that the Group will not be able to sell collateral at a price equal to the expected market value. The haircut thus includes maintenance costs in the period when the asset is for sale, fees for external advisory services and any loss in value. For real property, haircuts depend on the property type and usually range between 20% and 40% of the market value. For listed securities, the haircut is calculated using an internal model based on 20-day price volatility. For unlisted securities, the haircut is 100%. Realisation of collateral is generally made on behalf of the borrower. However, if the Group submits the highest bid at a forced sale of property and acquires title, it will seek to sell the property as soon as possible. At the end of 2012, the Group recognised properties taken over in Den-mark at a carrying amount of DKK 265 million (31 December 2011: DKK 317 million) and properties taken over in other countries at DKK 109 million (31 December 2011: DKK 128 million). The properties are held for sale. Collateral Personal Business Financial Public 2012 customers customers customers customers Total
Credit exposure 895,830 874,891 436,131 216,189 2,423,041
Collateral value 752,911 502,334 292,835 17,114 1,565,194
Total unsecured credit exposure 142,919 372,557 143,296 199,075 857,847
Unsecured portion of credit exposure (%) 16.0 42.6 32.9 92.1 35.4
2011
Credit exposure 888,968 898,545 388,703 122,495 2,298,711 Collateral value 686,661 472,854 255,632 39,554 1,454,701
Total unsecured credit exposure 202,307 425,691 133,071 82,941 844,010
Unsecured portion of credit exposure (%) 22.8 47.4 34.2 67.7 36.7
Overcollateralisation is not included.
NOTES – DANSKE BANK GROUP – RISK MANAGEMENT
(DKK millions)
DANSKE BANK ANNUAL REPORT 2012 91
Collateral value by type Personal Business Financial Public 2012 customers customers customers customers Total
Real property 733,429 404,547 3,070 3,462 1,144,508
Personal 733,429 - - - 733,429
Commercial - 353,735 - - 353,735
Agricultural - 50,812 - - 50,812
Other - - 3,070 3,462 6,532
Bank accounts 789 966 124 4 1,883
Custody accounts and securities 5,211 12,152 273,917 11,222 302,502
Vehicles 8,035 11,523 43 399 20,000
Equipment 349 21,995 737 3 23,084
Vessels and aircraft 125 24,596 2 - 24,723
Guarantees 4,170 5,355 866 1,080 11,471
Amounts due 159 5,357 382 51 5,949
Other assets 644 15,843 13,694 893 31,074
Total 752,911 502,334 292,835 17,114 1,565,194 2011
Real property 667,042 364,222 4,484 3,020 1,038,768
Personal 667,042 - - - 667,042
Commercial - 319,995 - - 319,995
Agricultural - 44,227 - - 44,227
Other - - 4,484 3,020 7,504
Bank accounts 882 2,369 326 7 3,584
Custody accounts and securities 5,818 13,416 222,440 32,865 274,539
Vehicles 7,268 10,303 53 332 17,956
Equipment 283 21,187 460 11 21,941
Vessels and aircraft 127 28,348 7 - 28,482
Guarantees 4,849 9,103 1,099 2,386 17,437
Amounts due 122 5,007 122 49 5,300
Other assets 270 18,899 26,641 884 46,694
Total 686,661 472,854 255,632 39,554 1,454,701
DANSKE BANK / GROUP 2012 139
NO
TE
S – D
AN
SK
E B
AN
K G
RO
UP
NOTES – DANSKE BANK GROUP – RISK MANAGEMENT
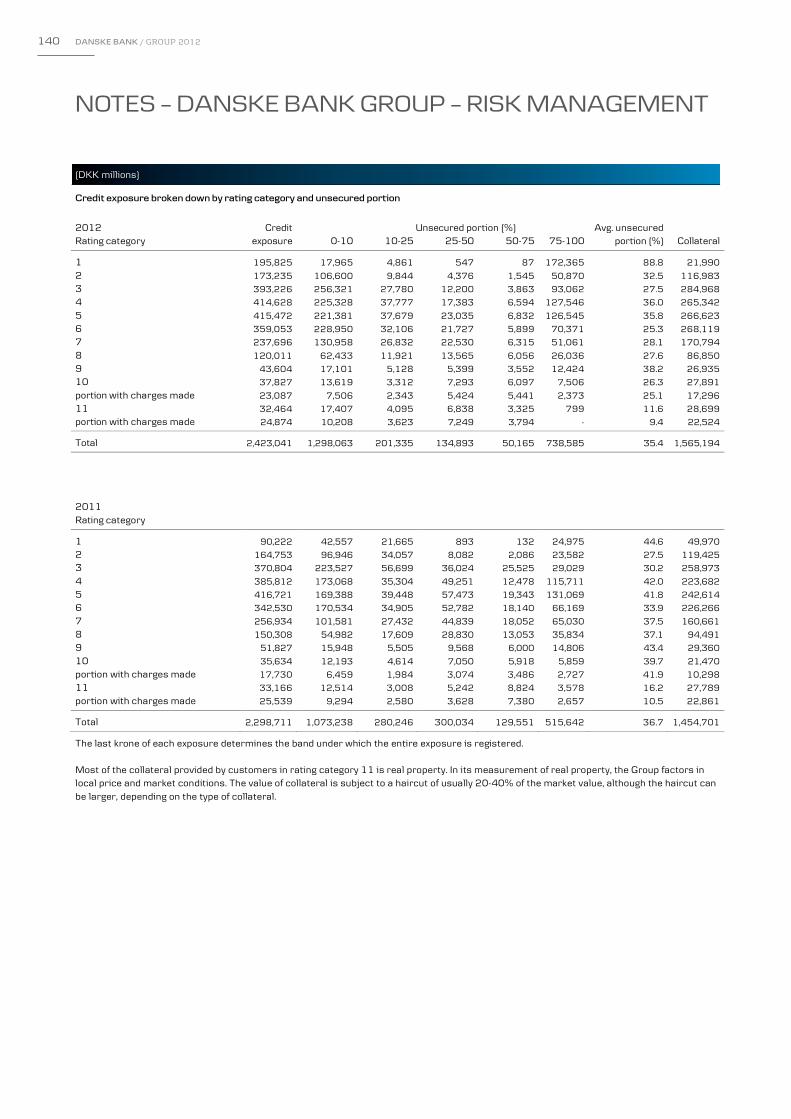
NOTES – DANSKE BANK GROUP – RISK MANAGEMENT
(DKK millions)
DANSKE BANK ANNUAL REPORT 2012 92
Credit exposure broken down by rating category and unsecured portion 2012 Credit Unsecured portion (%) Avg. unsecured Rating category exposure 0-10 10-25 25-50 50-75 75-100 portion (%) Collateral
1 195,825 17,965 4,861 547 87 172,365 88.8 21,990
2 173,235 106,600 9,844 4,376 1,545 50,870 32.5 116,983
3 393,226 256,321 27,780 12,200 3,863 93,062 27.5 284,968
4 414,628 225,328 37,777 17,383 6,594 127,546 36.0 265,342
5 415,472 221,381 37,679 23,035 6,832 126,545 35.8 266,623
6 359,053 228,950 32,106 21,727 5,899 70,371 25.3 268,119
7 237,696 130,958 26,832 22,530 6,315 51,061 28.1 170,794
8 120,011 62,433 11,921 13,565 6,056 26,036 27.6 86,850
9 43,604 17,101 5,128 5,399 3,552 12,424 38.2 26,935
10 37,827 13,619 3,312 7,293 6,097 7,506 26.3 27,891
portion with charges made 23,087 7,506 2,343 5,424 5,441 2,373 25.1 17,296
11 32,464 17,407 4,095 6,838 3,325 799 11.6 28,699
portion with charges made 24,874 10,208 3,623 7,249 3,794 - 9.4 22,524
Total 2,423,041 1,298,063 201,335 134,893 50,165 738,585 35.4 1,565,194
2011
Rating category
1 90,222 42,557 21,665 893 132 24,975 44.6 49,970
2 164,753 96,946 34,057 8,082 2,086 23,582 27.5 119,425
3 370,804 223,527 56,699 36,024 25,525 29,029 30.2 258,973
4 385,812 173,068 35,304 49,251 12,478 115,711 42.0 223,682
5 416,721 169,388 39,448 57,473 19,343 131,069 41.8 242,614
6 342,530 170,534 34,905 52,782 18,140 66,169 33.9 226,266
7 256,934 101,581 27,432 44,839 18,052 65,030 37.5 160,661
8 150,308 54,982 17,609 28,830 13,053 35,834 37.1 94,491
9 51,827 15,948 5,505 9,568 6,000 14,806 43.4 29,360
10 35,634 12,193 4,614 7,050 5,918 5,859 39.7 21,470
portion with charges made 17,730 6,459 1,984 3,074 3,486 2,727 41.9 10,298
11 33,166 12,514 3,008 5,242 8,824 3,578 16.2 27,789
portion with charges made 25,539 9,294 2,580 3,628 7,380 2,657 10.5 22,861
Total 2,298,711 1,073,238 280,246 300,034 129,551 515,642 36.7 1,454,701
The last krone of each exposure determines the band under which the entire exposure is registered. Most of the collateral provided by customers in rating category 11 is real property. In its measurement of real property, the Group factors in local price and market conditions. The value of collateral is subject to a haircut of usually 20-40% of the market value, although the haircut can be larger, depending on the type of collateral.
140 DANSKE BANK / GROUP 2012
NOTES – DANSKE BANK GROUP – RISK MANAGEMENT

NOTES – DANSKE BANK GROUP – RISK MANAGEMENT
(DKK millions)
DANSKE BANK ANNUAL REPORT 2012 92
Credit exposure broken down by rating category and unsecured portion 2012 Credit Unsecured portion (%) Avg. unsecured Rating category exposure 0-10 10-25 25-50 50-75 75-100 portion (%) Collateral
1 195,825 17,965 4,861 547 87 172,365 88.8 21,990
2 173,235 106,600 9,844 4,376 1,545 50,870 32.5 116,983
3 393,226 256,321 27,780 12,200 3,863 93,062 27.5 284,968
4 414,628 225,328 37,777 17,383 6,594 127,546 36.0 265,342
5 415,472 221,381 37,679 23,035 6,832 126,545 35.8 266,623
6 359,053 228,950 32,106 21,727 5,899 70,371 25.3 268,119
7 237,696 130,958 26,832 22,530 6,315 51,061 28.1 170,794
8 120,011 62,433 11,921 13,565 6,056 26,036 27.6 86,850
9 43,604 17,101 5,128 5,399 3,552 12,424 38.2 26,935
10 37,827 13,619 3,312 7,293 6,097 7,506 26.3 27,891
portion with charges made 23,087 7,506 2,343 5,424 5,441 2,373 25.1 17,296
11 32,464 17,407 4,095 6,838 3,325 799 11.6 28,699
portion with charges made 24,874 10,208 3,623 7,249 3,794 - 9.4 22,524
Total 2,423,041 1,298,063 201,335 134,893 50,165 738,585 35.4 1,565,194
2011
Rating category
1 90,222 42,557 21,665 893 132 24,975 44.6 49,970
2 164,753 96,946 34,057 8,082 2,086 23,582 27.5 119,425
3 370,804 223,527 56,699 36,024 25,525 29,029 30.2 258,973
4 385,812 173,068 35,304 49,251 12,478 115,711 42.0 223,682
5 416,721 169,388 39,448 57,473 19,343 131,069 41.8 242,614
6 342,530 170,534 34,905 52,782 18,140 66,169 33.9 226,266
7 256,934 101,581 27,432 44,839 18,052 65,030 37.5 160,661
8 150,308 54,982 17,609 28,830 13,053 35,834 37.1 94,491
9 51,827 15,948 5,505 9,568 6,000 14,806 43.4 29,360
10 35,634 12,193 4,614 7,050 5,918 5,859 39.7 21,470
portion with charges made 17,730 6,459 1,984 3,074 3,486 2,727 41.9 10,298
11 33,166 12,514 3,008 5,242 8,824 3,578 16.2 27,789
portion with charges made 25,539 9,294 2,580 3,628 7,380 2,657 10.5 22,861
Total 2,298,711 1,073,238 280,246 300,034 129,551 515,642 36.7 1,454,701
The last krone of each exposure determines the band under which the entire exposure is registered. Most of the collateral provided by customers in rating category 11 is real property. In its measurement of real property, the Group factors in local price and market conditions. The value of collateral is subject to a haircut of usually 20-40% of the market value, although the haircut can be larger, depending on the type of collateral.
NOTES – DANSKE BANK GROUP – RISK MANAGEMENT
(DKK millions)
DANSKE BANK ANNUAL REPORT 2012 93
Past due amounts (no evidence of impairment)
Personal Business Financial Public Due under 2012 customers customers customers customers Total loans
1-5 days 200 96 31 - 327 5,661
6-30 days 73 47 3 - 123 5,447
31-60 days 37 24 2 - 63 1,998
61-90 days 15 28 1 - 44 625
> 90 days 19 19 - - 38 4,503
Total 344 214 37 - 595 18,234
2011
1-5 days 289 330 20 1 640 9,481
6-30 days 94 62 2 3 161 2,957
31-60 days 75 21 1 - 97 1,583
61-90 days 15 23 - - 38 624
> 90 days 24 58 2 11 95 777
Total 497 494 25 15 1,031 15,422
Among other definitions, the Group uses 90 days past due as a definition of default (rating category 11). Exemptions are made, for example, when new loan documents are under preparation. The average unsecured portion of the claims recorded as past due amounts with no evidence of impairment was 32.3% at the end of 2012 (31 December 2011: 22.2%). Real property accounted for 93.6% of the collateral provided (31 December 2011: 86.7%).
Forbearance practices
Under certain circumstances, the Group will grant concessions in borrowing terms to customers that have financial difficulties, for example
substantial drop in turnover. Concessions are granted mainly if
limit the
the financial difficulties are considered to be temporary, but may also be granted if a restructuring is considered necessary to
losses on an exposure.
if a personal customer becomes unemployed or a business customer sees a
Forbearance measures include interest-only schedules and interest rate reductions applying for short periods. If a customer is expected to be
able to resume normal repayments after such period, the exposure is not considered to be subject to objective evidence of impairment, and
the impaired exposure will be covered by collective impairment charges. In other cases, including restructuring, the customer will be down-
graded to rating category 10 and the entire exposure will be impaired. The exposure is then written down to the amount the customer
If the customer’s ability to repay depends significantly on the assets that have been provided as
collateral (asset financing), the exposure is written down to the fair value of the collateral in accordance with the accounting policies set out in
note 45.
or 11,
is estimated to be able to service in the future.
Once a customer has proven able to service the restructured facility, the exposure will, after a certain period, no longer be considered subject
to objective evidence of impairment, and the customer will move from rating category 10 or 11 to a better category. In case of asset financing,
-down to the fair value of collateral will be reversed. the write Impairment charges Rating categories 10 and 11 include customers with exposures for which objective evidence of impairment exists. Exposure to customers
Note 45 provides additional information about impairment charges for loans and advances recognised at amortised cost. in the other rating categories is subject to collective impairment testing.
The allowance account includes all impairment charges against loans and advances at amortised cost, loans at fair value, amounts due from credit institutions and central banks, and irrevocable loan commitments and guarantees.
Group’s’s
DANSKE BANK / GROUP 2012 141
NO
TE
S – D
AN
SK
E B
AN
K G
RO
UP
NOTES – DANSKE BANK GROUP – RISK MANAGEMENT

NOTES – DANSKE BANK GROUP – RISK MANAGEMENT
(DKK millions)
DANSKE BANK ANNUAL REPORT 2012 94
Allowance account broken down by segment and type of impairment
Impairment charges
Personal Business Financial Public Allowance
account, customers customers customers customers total Individual Collective
1 January 2011 7,206 28,706 7,855 2 43,769 39,201 4,568
New impairment charges 4,522 15,854 522 2 20,900 19,701 1,199
Reversals of impairment charges from previous periods 2,250 3,484 613 - 6,347 4,703 1,644
Write-offs debited to allowance account 703 5,746 3,702 - 10,151 10,151 -
Foreign currency translation 9 144 49 - 202 193 9
Other items 58 182 -9 - 231 231 -
31 December 2011 8,842 35,656 4,102 4 48,604 44,472 4,132
New impairment charges 5,214 15,082 552 18 20,866 18,921 1,945
Reversals of impairment charges from previ-ous periods 2,411 5,726 576 9 8,722 6,428 2,294
Write-offs debited to allowance account 1,374 9,518 2,731 - 13,623 13,623 -
Foreign currency translation 53 280 16 - 349 318 31
Other items 35 279 5 - 319 319 -
31 December 2012 10,359 36,053 1,368 13 47,793 43,979 3,814
Non-core Ireland portion 1,787 9,483 78 - 11,348 10,997 351
Collective impairment charges include charges that reflect the migration of customers from one rating category to another. If all customers were downgraded one rating category with no corresponding interest rate change, collective impairment charges would increase by about DKK 5.9 billion (31 December 2011: DKK 7.1 billion). If the value of collateral provided by customers in rating categories 10 and 11 decreased 10%, individual impairment charges would increase by about DKK 3.7 billion (31 December 2011: about DKK 3.4 billion).
Allowance account broken down by items on and off the balance sheet 2012 2011
Due from credit institutions and central banks 91 93
Loans and advances at amortised cost 42,579 44,943
Loans at fair value 3,096 2,667
Other liabilities 2,027 901
Total 47,793 48,604
142 DANSKE BANK / GROUP 2012
NOTES – DANSKE BANK GROUP – RISK MANAGEMENT

NOTES – DANSKE BANK GROUP – RISK MANAGEMENT
(DKK millions)
DANSKE BANK ANNUAL REPORT 2012 94
Allowance account broken down by segment and type of impairment
Impairment charges
Personal Business Financial Public Allowance
account, customers customers customers customers total Individual Collective
1 January 2011 7,206 28,706 7,855 2 43,769 39,201 4,568
New impairment charges 4,522 15,854 522 2 20,900 19,701 1,199
Reversals of impairment charges from previous periods 2,250 3,484 613 - 6,347 4,703 1,644
Write-offs debited to allowance account 703 5,746 3,702 - 10,151 10,151 -
Foreign currency translation 9 144 49 - 202 193 9
Other items 58 182 -9 - 231 231 -
31 December 2011 8,842 35,656 4,102 4 48,604 44,472 4,132
New impairment charges 5,214 15,082 552 18 20,866 18,921 1,945
Reversals of impairment charges from previ-ous periods 2,411 5,726 576 9 8,722 6,428 2,294
Write-offs debited to allowance account 1,374 9,518 2,731 - 13,623 13,623 -
Foreign currency translation 53 280 16 - 349 318 31
Other items 35 279 5 - 319 319 -
31 December 2012 10,359 36,053 1,368 13 47,793 43,979 3,814
Non-core Ireland portion 1,787 9,483 78 - 11,348 10,997 351
Collective impairment charges include charges that reflect the migration of customers from one rating category to another. If all customers were downgraded one rating category with no corresponding interest rate change, collective impairment charges would increase by about DKK 5.9 billion (31 December 2011: DKK 7.1 billion). If the value of collateral provided by customers in rating categories 10 and 11 decreased 10%, individual impairment charges would increase by about DKK 3.7 billion (31 December 2011: about DKK 3.4 billion).
Allowance account broken down by items on and off the balance sheet 2012 2011
Due from credit institutions and central banks 91 93
Loans and advances at amortised cost 42,579 44,943
Loans at fair value 3,096 2,667
Other liabilities 2,027 901
Total 47,793 48,604
NOTES – DANSKE BANK GROUP – RISK MANAGEMENT
(DKK millions)
DANSKE BANK ANNUAL REPORT 2012 95
Allowance account, impairment charges and collateral broken down by industry
Credit exposure Collateral Allowance account Impairment charges
2012 2011 2012 2011 2012 2011 2012 2011 Central and local governments 216,189 122,495 17,114 39,555 13 4 -1 3
Subsidised housing companies 125,712 123,161 104,513 94,709 1,027 763 313 231
Banks 147,866 178,778 78,664 85,775 99 94 -4 5
Diversified financials 238,385 153,010 179,191 119,352 1,157 3,872 25 -948
Other financials 49,880 56,915 34,978 50,504 112 136 - 7
Energy and utilities 39,684 40,698 6,981 7,895 91 62 42 24
Consumer discretionary 79,265 83,208 35,870 35,562 4,307 4,733 790 1,128
Consumer staples 118,875 117,666 70,726 62,249 3,940 3,867 500 1,392
Commercial property 252,113 257,267 200,547 182,445 15,366 15,614 4,819 6,370
Construction, engineering and building products 36,148 36,572 10,667 14,339 4,554 4,089 1,519 1,649
Transportation and shipping 64,818 71,824 34,347 35,902 2,442 1,682 1,060 788
Other industrials 71,089 77,995 19,222 20,368 2,472 2,857 428 782
IT 15,579 15,615 1,879 2,145 419 486 -5 -93
Materials 40,735 42,483 9,939 9,952 1,111 1,253 -234 46
Health care 24,441 27,562 7,259 6,833 142 136 11 36
Telecommunication services 6,432 4,494 385 455 182 114 99 43
Personal customers 895,830 888,968 752,913 686,661 10,359 8,842 3,167 1,722
Total 2,423,041 2,298,711 1,565,195 1,454,701 47,793 48,604 12,529 13,185
DANSKE BANK / GROUP 2012 143
NO
TE
S – D
AN
SK
E B
AN
K G
RO
UP
NOTES – DANSKE BANK GROUP – RISK MANAGEMENT

NOTES – DANSKE BANK GROUP – RISK MANAGEMENT
(DKK millions)
DANSKE BANK ANNUAL REPORT 2012 96
Allowance account, impairment charges and collateral broken down by geographical area
2012 2011 2012 2011 2012 2011 2012 2011
Denmark 1,269,436 1,241,656 866,882 775,243 20,026 19,102 3,820 4,799
Finland 223,284 200,790 131,500 131,115 2,687 2,371 670 295
Sweden 302,083 288,768 181,088 197,764 1,525 1,313 471 191
Ireland 55,382 67,108 30,533 38,323 12,662 13,814 5,696 6,324
UK 148,361 136,393 106,526 110,056 6,841 5,353 1,552 2,119
Germany 37,251 15,504 2,880 1,943 255 180 81 50
Estonia 9,582 10,579 6,655 6,484 540 834 -208 -97
Latvia 2,350 2,142 1,013 944 293 353 -30 -86
Lithuania 8,232 9,272 5,004 5,250 848 1,042 -165 -87
Spain 1,818 1,357 638 758 24 23 6 7
France 10,569 5,470 6,077 5,793 89 51 73 -
Italy 707 295 83 69 7 7 2 4
Portugal 78 179 49 103 3 3 1 2
Greece 38 42 29 32 - 1 - -
Belgium 6,009 4,579 2,619 1,499 8 18 - 5
Cyprus 3,258 2,602 1,804 1,748 56 18 45 18
Netherlands 3,481 3,521 1,290 1,388 40 16 21 -4
Luxembourg 58,137 28,696 54,268 24,210 43 90 -17 12
Poland 3,394 3,917 918 840 10 11 -3 -1
Other EU member states 1,243 839 190 144 22 9 14 -3
Norway 205,319 198,880 136,581 123,263 1,419 1,526 334 401
Eastern Europe 3,503 3,643 377 559 3 5 -1 3
Switzerland 4,223 4,555 1,041 755 41 52 16 -1
Turkey 1,427 1,929 130 164 1 2 1 -1
Other European countries 839 946 535 672 64 81 -15 -9
North America 45,968 46,093 17,528 19,280 222 2,228 154 -764
Central and South America 3,855 2,373 3,415 1,701 2 2 -1 1
Africa 2,711 3,518 1,485 1,311 2 14 -5 -
Asia 9,258 12,011 3,907 3,176 54 78 17 7
Oceania 1,245 1,054 150 114 6 7 - -
Total 2,423,041 2,298,711 1,565,195 1,454,701 47,793 48,604 12,529 13,185
Allowance account for individual impairment charges broken down by evidence of impairment 2012 2011
Credit exposure Allowance Credit exposure Allowance after account, after account,
impairment charges Collateral individual impairment charges Collateral individual
Rating category 10
Financial difficulties 37,827 27,891 12,956 35,634 21,470 11,063
Rating category 11
90 days past due 11,548 10,209 3,407 3,557 9,701 3,583
Restructuring of debt 10,754 9,506 9,394 9,864 7,637 9,936
Collection/suspension of payments 7,484 6,616 14,383 13,625 7,117 13,725
Bankruptcy 2,678 2,367 3,839 6,120 3,334 6,165
Total 70,291 56,589 43,979 68,800 49,259 44,472
The average unsecured portion of impaired exposures was 19.5% at the end of 2012 (31 December 2011: 28.5%). Real property accounted for 86.9% of collateral provided (31 December 2011: 77%).
Credit exposure Collateral Allowance account Impairment charges
144 DANSKE BANK / GROUP 2012
NOTES – DANSKE BANK GROUP – RISK MANAGEMENT

NOTES – DANSKE BANK GROUP – RISK MANAGEMENT
(DKK millions)
DANSKE BANK ANNUAL REPORT 2012 96
Allowance account, impairment charges and collateral broken down by geographical area
2012 2011 2012 2011 2012 2011 2012 2011
Denmark 1,269,436 1,241,656 866,882 775,243 20,026 19,102 3,820 4,799
Finland 223,284 200,790 131,500 131,115 2,687 2,371 670 295
Sweden 302,083 288,768 181,088 197,764 1,525 1,313 471 191
Ireland 55,382 67,108 30,533 38,323 12,662 13,814 5,696 6,324
UK 148,361 136,393 106,526 110,056 6,841 5,353 1,552 2,119
Germany 37,251 15,504 2,880 1,943 255 180 81 50
Estonia 9,582 10,579 6,655 6,484 540 834 -208 -97
Latvia 2,350 2,142 1,013 944 293 353 -30 -86
Lithuania 8,232 9,272 5,004 5,250 848 1,042 -165 -87
Spain 1,818 1,357 638 758 24 23 6 7
France 10,569 5,470 6,077 5,793 89 51 73 -
Italy 707 295 83 69 7 7 2 4
Portugal 78 179 49 103 3 3 1 2
Greece 38 42 29 32 - 1 - -
Belgium 6,009 4,579 2,619 1,499 8 18 - 5
Cyprus 3,258 2,602 1,804 1,748 56 18 45 18
Netherlands 3,481 3,521 1,290 1,388 40 16 21 -4
Luxembourg 58,137 28,696 54,268 24,210 43 90 -17 12
Poland 3,394 3,917 918 840 10 11 -3 -1
Other EU member states 1,243 839 190 144 22 9 14 -3
Norway 205,319 198,880 136,581 123,263 1,419 1,526 334 401
Eastern Europe 3,503 3,643 377 559 3 5 -1 3
Switzerland 4,223 4,555 1,041 755 41 52 16 -1
Turkey 1,427 1,929 130 164 1 2 1 -1
Other European countries 839 946 535 672 64 81 -15 -9
North America 45,968 46,093 17,528 19,280 222 2,228 154 -764
Central and South America 3,855 2,373 3,415 1,701 2 2 -1 1
Africa 2,711 3,518 1,485 1,311 2 14 -5 -
Asia 9,258 12,011 3,907 3,176 54 78 17 7
Oceania 1,245 1,054 150 114 6 7 - -
Total 2,423,041 2,298,711 1,565,195 1,454,701 47,793 48,604 12,529 13,185
Allowance account for individual impairment charges broken down by evidence of impairment 2012 2011
Credit exposure Allowance Credit exposure Allowance after account, after account,
impairment charges Collateral individual impairment charges Collateral individual
Rating category 10
Financial difficulties 37,827 27,891 12,956 35,634 21,470 11,063
Rating category 11
90 days past due 11,548 10,209 3,407 3,557 9,701 3,583
Restructuring of debt 10,754 9,506 9,394 9,864 7,637 9,936
Collection/suspension of payments 7,484 6,616 14,383 13,625 7,117 13,725
Bankruptcy 2,678 2,367 3,839 6,120 3,334 6,165
Total 70,291 56,589 43,979 68,800 49,259 44,472
The average unsecured portion of impaired exposures was 19.5% at the end of 2012 (31 December 2011: 28.5%). Real property accounted for 86.9% of collateral provided (31 December 2011: 77%).
Credit exposure Collateral Allowance account Impairment charges
NOTES – DANSKE BANK GROUP – RISK MANAGEMENT
(DKK millions)
DANSKE BANK ANNUAL REPORT 2012 97
Exposure to counterparty risk and credit exposure from other trading and investing activities
Personal Business Financial Public 2012 customers customers customers customers Total
Counterparty risk
Derivatives with positive fair value 175 30,094 354,488 24,233 408,990 Credit exposure from other trading and investing activities
Bonds - 10,793 299,554 195,034 505,381 Shares - 3,678 2,602 - 6,280 Other unutilised commitments - - 550 - 550
Total 175 44,565 657,194 219,267 921,201 2011
Counterparty risk
Derivatives with positive fair value 303 30,964 500,717 18,986 550,970
Credit exposure from other trading and investing activities Bonds - 5,261 287,255 172,122 464,638
Shares - 2,529 882 - 3,411
Other unutilised commitments - - 942 - 942
Total 303 38,754 789,796 191,108 1,019,961
Other unutilised commitments comprises private equity investment commitments and other obligations. Derivatives with positive fair value 2012 2011
Derivatives with positive fair value before netting 711,023 550,970 Netting (under accounting rules) 302,033 -
Carrying amount 408,990 550,970 Netting (under capital adequacy rules) 303,974 451,714 Net current exposure 105,016 99,256
Derivatives with positive fair value after netting for accounting purposes: Interest rate contracts 309,743 438,498 Currency contracts 96,318 109,349 Other contracts 2,929 3,123 Total 408,990 550,970
The increase in netting for accounting purposes was attributable mainly to an increase in the use of clearing centres. Net current exposure is calculated on the basis of positive and negative fair values of derivatives covered by the same netting agreement and factors in rights to additional set-off in the event of counterparty default.
DANSKE BANK / GROUP 2012 145
NO
TE
S – D
AN
SK
E B
AN
K G
RO
UP
NOTES – DANSKE BANK GROUP – RISK MANAGEMENT
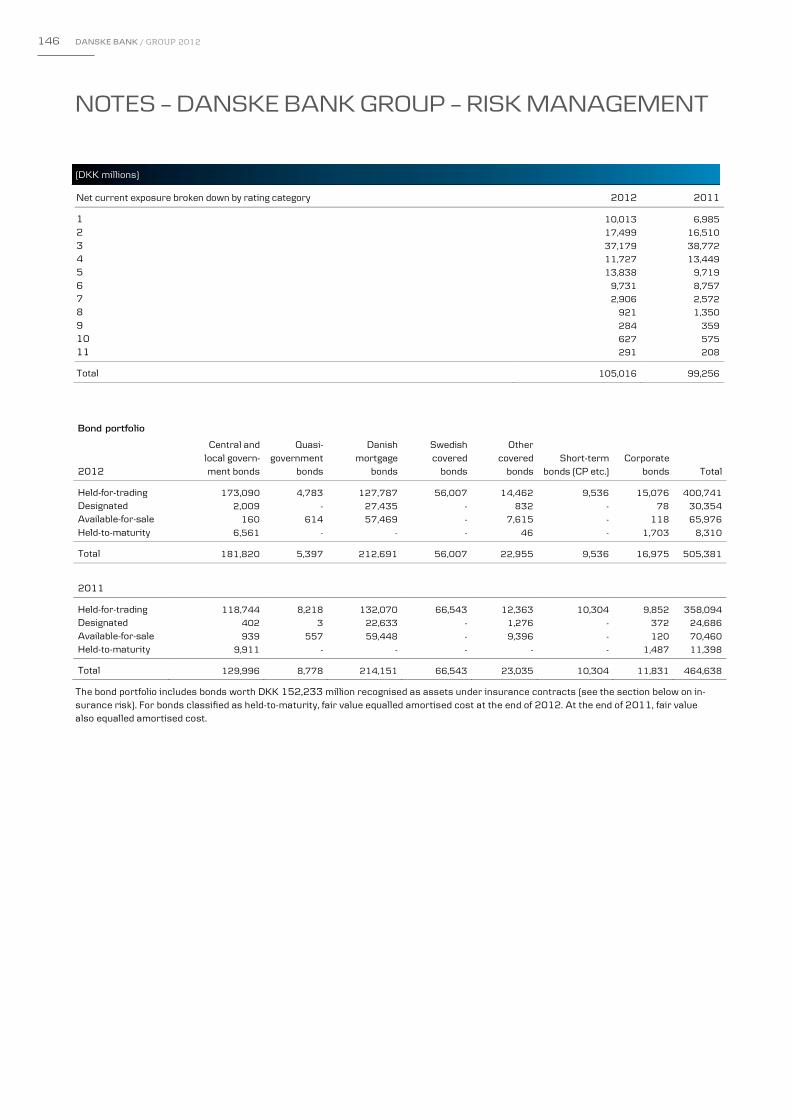
NOTES – DANSKE BANK GROUP – RISK MANAGEMENT
(DKK millions)
DANSKE BANK ANNUAL REPORT 2012 98
Net current exposure broken down by rating category 2012 2011
1 10,013 6,985
2 17,499 16,510
3 37,179 38,772
4 11,727 13,449
5 13,838 9,719
6 9,731 8,757
7 2,906 2,572
8 921 1,350
9 284 359
10 627 575
11 291 208
Total 105,016 99,256
Bond portfolio
Central and Quasi- Danish Swedish Other local govern- government mortgage covered covered Short-term Corporate 2012 ment bonds bonds bonds bonds bonds bonds (CP etc.) bonds Total Held-for-trading 173,090 4,783 127,787 56,007 14,462 9,536 15,076 400,741
Designated 2,009 - 27,435 - 832 - 78 30,354
Available-for-sale 160 614 57,469 - 7,615 - 118 65,976
Held-to-maturity 6,561 - - - 46 - 1,703 8,310
Total 181,820 5,397 212,691 56,007 22,955 9,536 16,975 505,381
2011 Held-for-trading 118,744 8,218 132,070 66,543 12,363 10,304 9,852 358,094
Designated 402 3 22,633 - 1,276 - 372 24,686
Available-for-sale 939 557 59,448 - 9,396 - 120 70,460
Held-to-maturity 9,911 - - - - - 1,487 11,398
Total 129,996 8,778 214,151 66,543 23,035 10,304 11,831 464,638
The bond portfolio includes bonds worth DKK 152,233 million recognised as assets under insurance contracts (see the section below on in-surance risk). For bonds classified as held-to-maturity, fair value equalled amortised cost at the end of 2012. At the end of 2011, fair value also equalled amortised cost.
146 DANSKE BANK / GROUP 2012
NOTES – DANSKE BANK GROUP – RISK MANAGEMENT

NOTES – DANSKE BANK GROUP – RISK MANAGEMENT
(DKK millions)
DANSKE BANK ANNUAL REPORT 2012 98
Net current exposure broken down by rating category 2012 2011
1 10,013 6,985
2 17,499 16,510
3 37,179 38,772
4 11,727 13,449
5 13,838 9,719
6 9,731 8,757
7 2,906 2,572
8 921 1,350
9 284 359
10 627 575
11 291 208
Total 105,016 99,256
Bond portfolio
Central and Quasi- Danish Swedish Other local govern- government mortgage covered covered Short-term Corporate 2012 ment bonds bonds bonds bonds bonds bonds (CP etc.) bonds Total Held-for-trading 173,090 4,783 127,787 56,007 14,462 9,536 15,076 400,741
Designated 2,009 - 27,435 - 832 - 78 30,354
Available-for-sale 160 614 57,469 - 7,615 - 118 65,976
Held-to-maturity 6,561 - - - 46 - 1,703 8,310
Total 181,820 5,397 212,691 56,007 22,955 9,536 16,975 505,381
2011 Held-for-trading 118,744 8,218 132,070 66,543 12,363 10,304 9,852 358,094
Designated 402 3 22,633 - 1,276 - 372 24,686
Available-for-sale 939 557 59,448 - 9,396 - 120 70,460
Held-to-maturity 9,911 - - - - - 1,487 11,398
Total 129,996 8,778 214,151 66,543 23,035 10,304 11,831 464,638
The bond portfolio includes bonds worth DKK 152,233 million recognised as assets under insurance contracts (see the section below on in-surance risk). For bonds classified as held-to-maturity, fair value equalled amortised cost at the end of 2012. At the end of 2011, fair value also equalled amortised cost.
NOTES – DANSKE BANK GROUP – RISK MANAGEMENT
(DKK millions)
DANSKE BANK ANNUAL REPORT 2012 99
Bond portfolio broken down by geographical area
Central and Quasi- Danish Swedish Other local govern- government mortgage covered covered Short-term Corporate
2012 ment bonds bonds bonds bonds bonds bonds (CP etc.) bonds Total
Denmark 25,221 - 212,691 - 77 883 5,350 244,222 Sweden 41,407 - - 56,007 - 2,569 2,674 102,657 UK 12,358 20 - - 8,268 378 119 21,143 Norway 3,593 - - - 6,544 2,680 3,305 16,122 USA 5,839 1,478 - - 237 - 883 8,437 Spain 3,161 - - - 4,513 179 19 7,872 France 14,191 - - - 1,719 1,283 489 17,682 Luxembourg - 3,791 - - - - 1,609 5,400 Canada 1,027 - - - - - 54 1,081 Finland 6,278 108 - - 654 215 660 7,915 Ireland 2,582 - - - 71 - 47 2,700 Italy 4,614 - - - 4 - - 4,618 Portugal 120 - - - - - 120 240 Austria 3,233 - - - - - 162 3,395 Netherlands 8,946 - - - 593 1,139 1,112 11,790 Germany 44,877 - - - 19 210 372 45,478 Belgium 3,419 - - - 53 - - 3,472 Lithuania 327 - - - - - - 327 Other 627 203 830
Total 181,820 5,397 212,691 56,007 22,955 9,536 16,975 505,381
2011
Denmark 25,777 - 214,151 - - 1,061 2,199 243,188
Sweden 18,687 - - 66,543 - 2,936 3,641 91,807
UK 16,202 33 - - 7,768 306 8 24,317
Norway 6,337 - - - 3,947 2,706 2,468 15,458
USA 1,329 4,709 - - 233 2 591 6,864
Spain 884 - - - 6,145 155 217 7,401
France 10,598 - - - 3,800 1,825 105 16,328
Luxembourg - 4,035 - - - - 558 4,593
Canada 2,836 - - - - - 335 3,171
Finland 5,230 1 - - 333 199 461 6,224
Ireland 1,503 - - - 90 - 18 1,611
Italy 6 - - - - 7 - 13
Portugal 83 - - - - - - 83
Austria 2,495 - - - - - - 2,495
Netherlands 4,568 - - - 481 657 916 6,622
Germany 31,340 - - - 2 414 309 32,065
Belgium 637 - - - - - - 637 Lithuania 1,370 - - - - - - 1,370
Other 114 - - - 236 36 5 391
Total 129,996 8,778 214,151 66,543 23,035 10,304 11,831 464,638
Credit exposure to government bonds issued by Ireland, Portugal, Italy and Spain amounted to DKK 10.5 billion at the end of 2012 (31 De-cember 2011: DKK 2.5 billion). All government bonds issued by these countries were recognised at fair value. When unsettled transactions in bonds issued by these countries and hedging transactions are taken into account, the total risk exposure was DKK 3.2 billion (31 December 2011: DKK 1.3 billion). In 2012, the bond portfolio did not include government bonds issued by Greece. Exposures below DKK 1 billion are ag-gregated in the Other category. Risk Management 2012 provides additional details about the Group’s risk on its bond portfolio. The publication is not covered by the statutory audit.
- - - - -
DANSKE BANK / GROUP 2012 147
NO
TE
S – D
AN
SK
E B
AN
K G
RO
UP
NOTES – DANSKE BANK GROUP – RISK MANAGEMENT

NOTES – DANSKE BANK GROUP – RISK MANAGEMENT
(DKK millions)
DANSKE BANK ANNUAL REPORT 2012 100
Bond portfolio broken down by rating category
Central and Quasi- Danish Swedish Other local govern- government mortgage covered covered Short-term Corporate 2012 ment bonds bonds bonds bonds bonds bonds (CP etc.) bonds Total
AAA 149,835 5,150 193,816 55,895 15,454 296 1,910 422,356
AA+ 15,611 235 - - 564 42 152 16,604
AA 2,138 - - - 1,171 546 481 4,336
AA- 1,997 - 837 - 97 170 492 3,593
A+ 165 - 2,535 - 302 1,567 4,347 8,916
A 46 - 14,013 - 148 2,091 1,518 17,816
A- 201 - - - 2,552 224 1,225 4,202
BBB+ 447 - 88 - 509 504 979 2,527
BBB 4,651 - 1,337 - 1,556 1,308 3,462 12,314
BBB- 3,624 - - - 429 161 216 4,430
Sub-inv. grade or unrated 3,105 12 65 112 173 2,627 2,193 8,287
Total 181,820 5,397 212,691 56,007 22,955 9,536 16,975 505,381 2011
AAA 122,022 8,712 108,998 66,543 16,391 163 2,378 325,207
AA+ 296 51 103,944 - 1,863 111 119 106,384
AA 676 - 1 - 1,351 970 525 3,523
AA- 1,068 - 492 - 107 1,543 609 3,819
A+ 986 - - - 72 2,469 992 4,519
A 170 - 708 - 573 1,268 1,924 4,643
A- 33 - - - 1,478 78 1,417 3,006
BBB+ - - - - 224 102 928 1,254
BBB 188 - - - 729 1,939 2,204 5,060
BBB- - - - - 90 - 82 172
Sub-inv. grade or unrated 4,557 15 8 - 157 1,661 653 7,051
Total 129,996 8,778 214,151 66,543 23,035 10,304 11,831 464,638
148 DANSKE BANK / GROUP 2012
NOTES – DANSKE BANK GROUP – RISK MANAGEMENT

NOTES – DANSKE BANK GROUP – RISK MANAGEMENT
(DKK millions)
DANSKE BANK ANNUAL REPORT 2012 100
Bond portfolio broken down by rating category
Central and Quasi- Danish Swedish Other local govern- government mortgage covered covered Short-term Corporate 2012 ment bonds bonds bonds bonds bonds bonds (CP etc.) bonds Total
AAA 149,835 5,150 193,816 55,895 15,454 296 1,910 422,356
AA+ 15,611 235 - - 564 42 152 16,604
AA 2,138 - - - 1,171 546 481 4,336
AA- 1,997 - 837 - 97 170 492 3,593
A+ 165 - 2,535 - 302 1,567 4,347 8,916
A 46 - 14,013 - 148 2,091 1,518 17,816
A- 201 - - - 2,552 224 1,225 4,202
BBB+ 447 - 88 - 509 504 979 2,527
BBB 4,651 - 1,337 - 1,556 1,308 3,462 12,314
BBB- 3,624 - - - 429 161 216 4,430
Sub-inv. grade or unrated 3,105 12 65 112 173 2,627 2,193 8,287
Total 181,820 5,397 212,691 56,007 22,955 9,536 16,975 505,381 2011
AAA 122,022 8,712 108,998 66,543 16,391 163 2,378 325,207
AA+ 296 51 103,944 - 1,863 111 119 106,384
AA 676 - 1 - 1,351 970 525 3,523
AA- 1,068 - 492 - 107 1,543 609 3,819
A+ 986 - - - 72 2,469 992 4,519
A 170 - 708 - 573 1,268 1,924 4,643
A- 33 - - - 1,478 78 1,417 3,006
BBB+ - - - - 224 102 928 1,254
BBB 188 - - - 729 1,939 2,204 5,060
BBB- - - - - 90 - 82 172
Sub-inv. grade or unrated 4,557 15 8 - 157 1,661 653 7,051
Total 129,996 8,778 214,151 66,543 23,035 10,304 11,831 464,638
NOTES – DANSKE BANK GROUP – RISK MANAGEMENT
DANSKE BANK ANNUAL REPORT 2012 101
Market risk Taking on market risk is an integral part of the Group’s business strategy. The activities that involve market risk derive mainly from the Group’s focus on business and personal customer banking; the Group provides all its products to Nordic customers and core products to customers outside the Nordic region. Sophisticated products are traded mainly with professional customers. Besides the exposure to market risk arising from servicing customers, the Board of Directors has set authorisations that allow the Group’s trading units to take positions for their own ac-counts and at their own risk. The Group also takes on market risk as part of treasury management to support the procurement and day-to-day management of liquidity. The Group uses both conventional risk measures and mathematical and statistical models, such as Value at Risk (VaR), to manage and monitor market risk on a daily basis and treats risk exposure in and outside the trading portfolio as a single portfolio. The Group uses limits for the ex-posure to each type of market risk. The market risk on assets in which the shareholders’ equity of Danica Pension is invested and on assets allocated to its policyholders is treated as an insurance risk. The market risk on the Group’s defined benefit pension plans is treated as a pension risk. Models The Group measures the interest rate risk on positions exposed to interest rate changes on a daily basis. The risk is calculated as the maxi-mum loss upon a parallel shift in yields of 1 percentage point. Most of the Group’s interest rate risk derives from positions in Danish kroner and euros. As part of the daily monitoring of interest rate risk, the Group calculates yield curve risk and interest rate basis risk. Yield curve risk ex-presses the risk of losses arising because yields for various maturities change independently of one another. Interest rate basis risk is the risk that, upon changes in yields, the market values of offsetting exposures used for hedging do not change to exactly the same degree. Interest rate basis risk occurs mainly because of non-parallel shifts in various currencies’ yield curves or non-parallel shifts in the yield curves in one cur-rency used for pricing financial instruments with differing interest reset dates. Positions in bonds are also exposed to spread risk. The bond spread reflects the additional net return required by an investor on securities with a given credit quality and liquidity compared with the return on liquid securities without credit risk or a reference rate (such as a swap rate). Bond spread risk thus measures the change in value due to changes in the market’s assessment of credit quality and liquidity. For internal monitoring purposes, the Group divides bond spread risk into three sub-categories: mortgage spread risk, government spread risk and credit spread risk. Most of the Group’s bond spread risk can be attributed to bonds issued to fund real property loans. The Group’s management of its bond exposure is based on an individual credit assessment and approval of issuer lines for nominal amounts of bond holdings supplemented by limits on the price sensitivity to a change in bond spreads of 1 basis point (BPV). Besides the current rating, government spread risk monitoring includes an assessment of market information on expectations about future risk. Key factors are the rating agencies’ expectations about future ratings (the rating outlook), the spread on credit default swaps for the issuer, and the spread to the yield on the equivalent German government bonds. The assessment of government bond risk is thus based on more criteria than the current rating. The Group uses a VaR model that includes all currency positions, including options, to measure and monitor its foreign exchange risk. The cal-culation of foreign exchange risk is based on two parameters: a confidence level of 95% and a time horizon of ten days. Equity market risk distinguishes between the risk associated with listed shares and that associated with unlisted shares. For listed shares, the Group calculates equity market risk as the net market value of short and long positions in equities and equity-related instruments. For unlisted shares, the Group distinguishes between ordinary open positions, unutilised private equity commitments and banking-related investments. Banking-related investments comprise equity holdings in financial infrastructure and payment service companies. Inflation rate risk is determined as expected losses because of changes in traded future inflation rates of +/-1 percentage point. Commodity risk is measured as the expected loss on commodity instruments caused by changes of +/-10% in individual commodity indices.
DANSKE BANK / GROUP 2012 149
NO
TE
S – D
AN
SK
E B
AN
K G
RO
UP
NOTES – DANSKE BANK GROUP – RISK MANAGEMENT

NOTES – DANSKE BANK GROUP – RISK MANAGEMENT
(DKK millions)
DANSKE BANK ANNUAL REPORT 2012 102
The table below shows the Group’s market risk at the end of 2012 and 2011 calculated according to conventional market risk measures. 2012 2011 Interest rate risk (1 percentage point parallel shift of the yield curve) 386 870 Interest rate basis risk (scenarios based on historical yield curve changes) 30 199 Foreign exchange risk (VaR, confidence level of 95%, 10-day horizon) 37 24 Equity market risk, listed shares (net position) 199 252 Equity market risk, unlisted shares (net position) 4,404 3,921 Mortgage spread risk (basis point value) 63 67 Government spread risk (basis point value) -6 -2 Credit spread risk on corporate bonds (basis point value) 4 1 Inflation rate risk (1 percentage point change in traded future inflation) 4 37 Commodity risk (10% change in commodity prices) 2 -
Value-at-Risk To supplement conventional risk measures, the Group uses its VaR model for the internal management and monitoring of general interest rate, yield volatility, inflation rate, foreign exchange and equity market risks. As the Group’s exposure to commodities is very limited, the VaR measure does not cover commodity risk. One of the major strengths of VaR is that it provides an aggregate measure of all risk types included in the model and factors in the correlation structure of the financial markets. The internal VaR model is used for various purposes – risk monitoring at portfolio level and calculation of the capital requirement for general market risk:
Risk monitoring Capital requirement
Horizon 10 days 10 days
Confidence level 95% 99%
The current version of the VaR model used for calculating the capital requirement for general market risk was approved by the Danish FSA in 2007 (the Group uses the standardised approach to calculate regulatory capital for specific risk). The table below shows the VaR figures used to calculate the capital requirement for market risk:
2012 Daily VaR Stressed VaR
Avg. Minimum Maximum Avg. Minimum Maximum Risk category VaR VaR VaR 31 Dec. VaR VaR VaR 31 Dec.
Interest rate risk 210 130 319 158 227 135 327 231
Foreign exchange risk 31 2 85 60 64 25 114 54
Equity market risk 22 9 44 19 49 25 86 32 Diversification benefit -55 -70 -103 -80
Total VaR 208 130 322 167 237 116 356 237
2011 Daily VaR Stressed VaR
Avg. Minimum Maximum Avg. Minimum Maximum Risk category VaR VaR VaR 31 Dec. VaR VaR VaR 31 Dec.
Interest rate risk 196 87 390 246 268 Foreign exchange risk 37 11 110 39 59 Equity market risk 46 18 125 22 39 Diversification benefit -68 -70 -104
Total VaR 211 92 406 237 262
150 DANSKE BANK / GROUP 2012
NOTES – DANSKE BANK GROUP – RISK MANAGEMENT

NOTES – DANSKE BANK GROUP – RISK MANAGEMENT
(DKK millions)
DANSKE BANK ANNUAL REPORT 2012 102
The table below shows the Group’s market risk at the end of 2012 and 2011 calculated according to conventional market risk measures. 2012 2011 Interest rate risk (1 percentage point parallel shift of the yield curve) 386 870 Interest rate basis risk (scenarios based on historical yield curve changes) 30 199 Foreign exchange risk (VaR, confidence level of 95%, 10-day horizon) 37 24 Equity market risk, listed shares (net position) 199 252 Equity market risk, unlisted shares (net position) 4,404 3,921 Mortgage spread risk (basis point value) 63 67 Government spread risk (basis point value) -6 -2 Credit spread risk on corporate bonds (basis point value) 4 1 Inflation rate risk (1 percentage point change in traded future inflation) 4 37 Commodity risk (10% change in commodity prices) 2 -
Value-at-Risk To supplement conventional risk measures, the Group uses its VaR model for the internal management and monitoring of general interest rate, yield volatility, inflation rate, foreign exchange and equity market risks. As the Group’s exposure to commodities is very limited, the VaR measure does not cover commodity risk. One of the major strengths of VaR is that it provides an aggregate measure of all risk types included in the model and factors in the correlation structure of the financial markets. The internal VaR model is used for various purposes – risk monitoring at portfolio level and calculation of the capital requirement for general market risk:
Risk monitoring Capital requirement
Horizon 10 days 10 days
Confidence level 95% 99%
The current version of the VaR model used for calculating the capital requirement for general market risk was approved by the Danish FSA in 2007 (the Group uses the standardised approach to calculate regulatory capital for specific risk). The table below shows the VaR figures used to calculate the capital requirement for market risk:
2012 Daily VaR Stressed VaR
Avg. Minimum Maximum Avg. Minimum Maximum Risk category VaR VaR VaR 31 Dec. VaR VaR VaR 31 Dec.
Interest rate risk 210 130 319 158 227 135 327 231
Foreign exchange risk 31 2 85 60 64 25 114 54
Equity market risk 22 9 44 19 49 25 86 32 Diversification benefit -55 -70 -103 -80
Total VaR 208 130 322 167 237 116 356 237
2011 Daily VaR Stressed VaR
Avg. Minimum Maximum Avg. Minimum Maximum Risk category VaR VaR VaR 31 Dec. VaR VaR VaR 31 Dec.
Interest rate risk 196 87 390 246 268 Foreign exchange risk 37 11 110 39 59 Equity market risk 46 18 125 22 39 Diversification benefit -68 -70 -104
Total VaR 211 92 406 237 262
NOTES – DANSKE BANK GROUP – RISK MANAGEMENT
(DKK millions)
DANSKE BANK ANNUAL REPORT 2012 103
Backtesting and stress testing The Group conducts backtests daily to document the accuracy of the internal VaR model. Backtesting compares 1-day VaR calculated on trad-ing book positions with the actual and hypothetical profit or loss. For the latter, positions are assumed to be unchanged until the following business day (no intra-day trading is included). If the hypothetical or actual loss exceeds the predicted possible loss (VaR), an exception has occurred. Since the VaR figures used for backtesting are based on a confidence level of 99% (as in the calculation of the capital requirement), the expected number of exceptions per year is two to three. The backtest results for 2011 and 2012 are shown in the chart below.
In both 2011 and 2012, the VaR model backtest showed two exceptions, which was acceptable in relation to the expected number of excep-tions. An analysis of the individual exceptions in 2012 showed that they were caused by large fluctuations in yields in the financial markets.
As a supplement to the daily calculation of VaR and the more conventional risk figures, the Group performs stress tests and sensitivity analy-ses on a regular basis. Some of these tests are part of the daily limit control, while others are performed weekly or quarterly. Stress test scenarios feature changes in interest rates, exchange rates, equity prices, volatilities and bond spreads. Such changes affect the Group’s earnings directly through value adjustments. The scenarios are often based on large changes in a single risk factor or on conditions that reflect historical periods of economic or financial crisis, combined with factors relevant under the current market conditions. In addition, some scenarios are constructed so that they are consistent with the set of scenarios applied across the Group’s business units. The table below shows the maximum loss in a number of extreme, but not necessarily probable, scenarios. Risk category Change Maximum loss 2012 Maximum loss 2011
Equity market risk +20/-20% 82 26 Foreign exchange risk +10/-10% 143 693 Interest rate risk +200/-200 bp 1,339 1,798
The Group’s periodic stress tests and sensitivity analyses also include scenarios with extreme market developments as defined by the Euro-pean Banking Authority (EBA) as well as hypothetical scenarios involving extreme financial or macroeconomic events.
Actual P/L effect
BACKTEST RESULTS, P/L EFFECT(DKK millions)
-300-250
-200-150
-100-50
050
100150
200250
Lower VaR
2011 2012
Hypothetical P/L effect
DANSKE BANK / GROUP 2012 151
NO
TE
S – D
AN
SK
E B
AN
K G
RO
UP
NOTES – DANSKE BANK GROUP – RISK MANAGEMENT
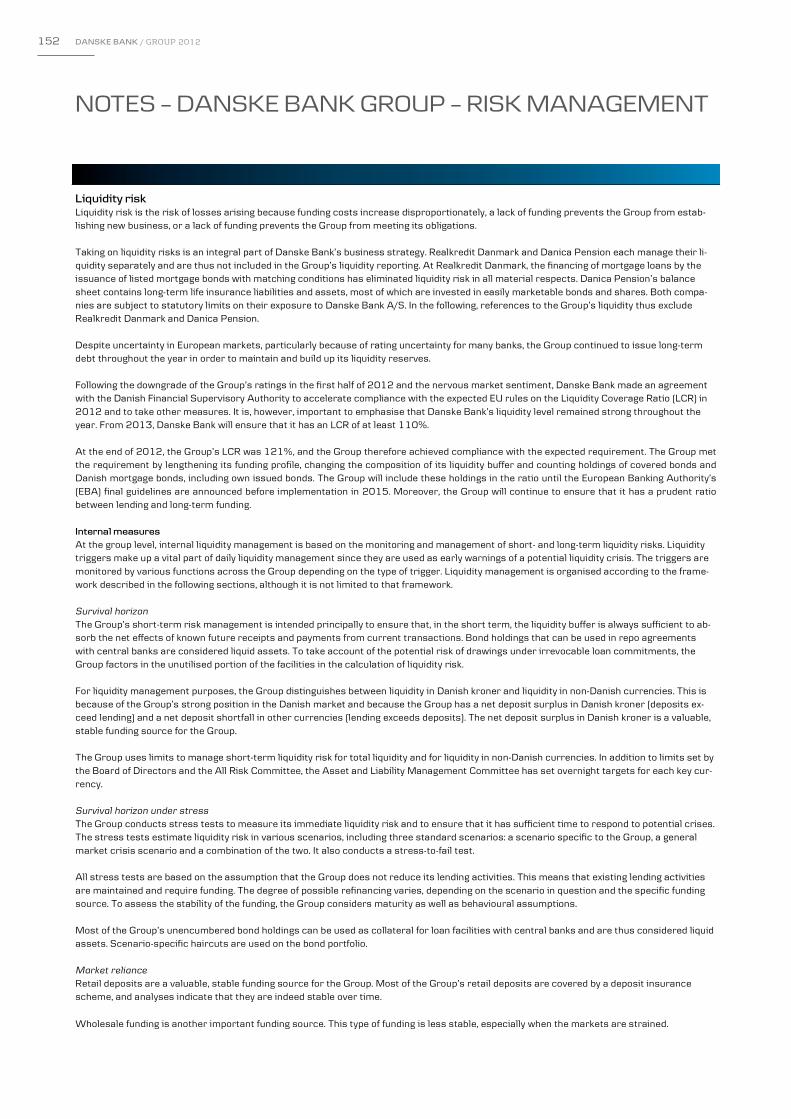
NOTES – DANSKE BANK GROUP – RISK MANAGEMENT
DANSKE BANK ANNUAL REPORT 2012 104
Liquidity risk Liquidity risk is the risk of losses arising because funding costs increase disproportionately, a lack of funding prevents the Group from estab-lishing new business, or a lack of funding prevents the Group from meeting its obligations. Taking on liquidity risks is an integral part of Danske Bank’s business strategy. Realkredit Danmark and Danica Pension each manage their li-quidity separately and are thus not included in the Group’s liquidity reporting. At Realkredit Danmark, the financing of mortgage loans by the issuance of listed mortgage bonds with matching conditions has eliminated liquidity risk in all material respects. Danica Pension’s balance sheet contains long-term life insurance liabilities and assets, most of which are invested in easily marketable bonds and shares. Both compa-nies are subject to statutory limits on their exposure to Danske Bank A/S. In the following, references to the Group’s liquidity thus exclude Realkredit Danmark and Danica Pension. Despite uncertainty in European markets, particularly because of rating uncertainty for many banks, the Group continued to issue long-term debt throughout the year in order to maintain and build up its liquidity reserves. Following the downgrade of the Group’s ratings in the first half of 2012 and the nervous market sentiment, Danske Bank made an agreement with the Danish Financial Supervisory Authority to accelerate compliance with the expected EU rules on the Liquidity Coverage Ratio (LCR) in 2012 and to take other measures. It is, however, important to emphasise that Danske Bank’s liquidity level remained strong throughout the year. From 2013, Danske Bank will ensure that it has an LCR of at least 110%. At the end of 2012, the Group’s LCR was 121%, and the Group therefore achieved compliance with the expected requirement. The Group met the requirement by lengthening its funding profile, changing the composition of its liquidity buffer and counting holdings of covered bonds and Danish mortgage bonds, including own issued bonds. The Group will include these holdings in the ratio until the European Banking Authority’s (EBA) final guidelines are announced before implementation in 2015. Moreover, the Group will continue to ensure that it has a prudent ratio between lending and long-term funding. Internal measures At the group level, internal liquidity management is based on the monitoring and management of short- and long-term liquidity risks. Liquidity triggers make up a vital part of daily liquidity management since they are used as early warnings of a potential liquidity crisis. The triggers are monitored by various functions across the Group depending on the type of trigger. Liquidity management is organised according to the frame-work described in the following sections, although it is not limited to that framework. Survival horizon The Group’s short-term risk management is intended principally to ensure that, in the short term, the liquidity buffer is always sufficient to ab-sorb the net effects of known future receipts and payments from current transactions. Bond holdings that can be used in repo agreements with central banks are considered liquid assets. To take account of the potential risk of drawings under irrevocable loan commitments, the Group factors in the unutilised portion of the facilities in the calculation of liquidity risk. For liquidity management purposes, the Group distinguishes between liquidity in Danish kroner and liquidity in non-Danish currencies. This is because of the Group’s strong position in the Danish market and because the Group has a net deposit surplus in Danish kroner (deposits ex-ceed lending) and a net deposit shortfall in other currencies (lending exceeds deposits). The net deposit surplus in Danish kroner is a valuable, stable funding source for the Group. The Group uses limits to manage short-term liquidity risk for total liquidity and for liquidity in non-Danish currencies. In addition to limits set by the Board of Directors and the All Risk Committee, the Asset and Liability Management Committee has set overnight targets for each key cur-rency. Survival horizon under stress The Group conducts stress tests to measure its immediate liquidity risk and to ensure that it has sufficient time to respond to potential crises. The stress tests estimate liquidity risk in various scenarios, including three standard scenarios: a scenario specific to the Group, a general market crisis scenario and a combination of the two. It also conducts a stress-to-fail test. All stress tests are based on the assumption that the Group does not reduce its lending activities. This means that existing lending activities are maintained and require funding. The degree of possible refinancing varies, depending on the scenario in question and the specific funding source. To assess the stability of the funding, the Group considers maturity as well as behavioural assumptions. Most of the Group’s unencumbered bond holdings can be used as collateral for loan facilities with central banks and are thus considered liquid assets. Scenario-specific haircuts are used on the bond portfolio. Market reliance Retail deposits are a valuable, stable funding source for the Group. Most of the Group’s retail deposits are covered by a deposit insurance scheme, and analyses indicate that they are indeed stable over time. Wholesale funding is another important funding source. This type of funding is less stable, especially when the markets are strained.
152 DANSKE BANK / GROUP 2012
NOTES – DANSKE BANK GROUP – RISK MANAGEMENT
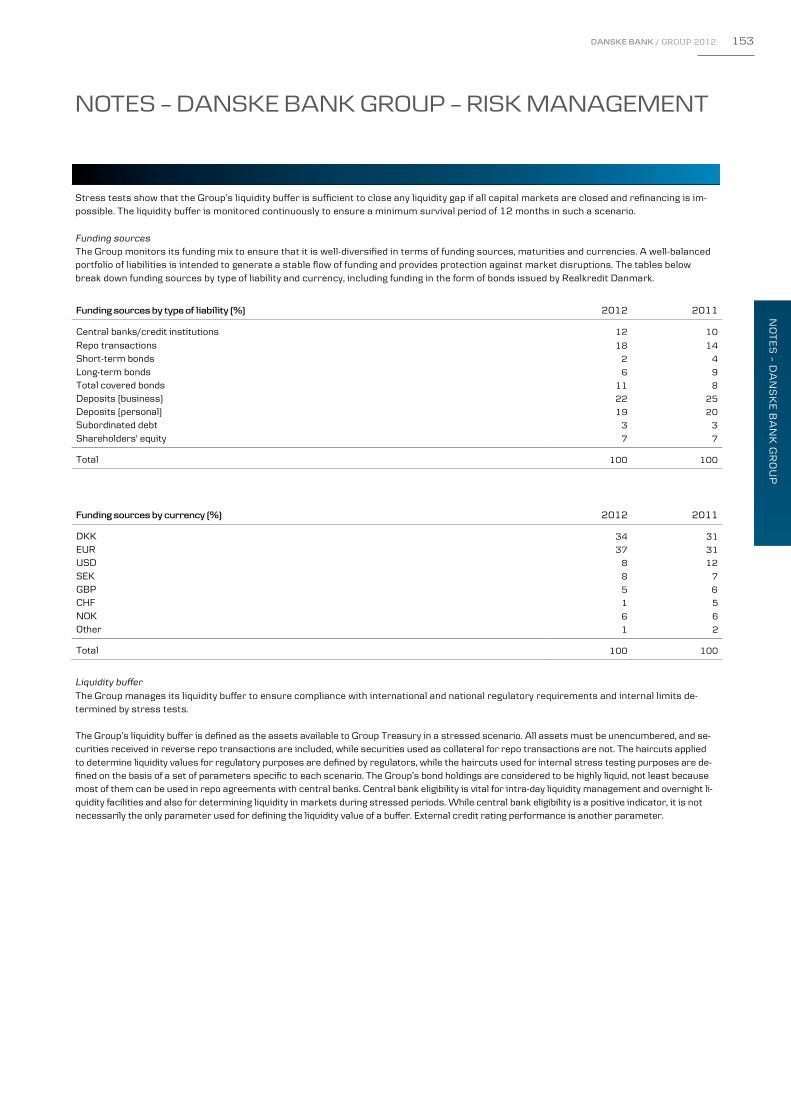
NOTES – DANSKE BANK GROUP – RISK MANAGEMENT
DANSKE BANK ANNUAL REPORT 2012 104
Liquidity risk Liquidity risk is the risk of losses arising because funding costs increase disproportionately, a lack of funding prevents the Group from estab-lishing new business, or a lack of funding prevents the Group from meeting its obligations. Taking on liquidity risks is an integral part of Danske Bank’s business strategy. Realkredit Danmark and Danica Pension each manage their li-quidity separately and are thus not included in the Group’s liquidity reporting. At Realkredit Danmark, the financing of mortgage loans by the issuance of listed mortgage bonds with matching conditions has eliminated liquidity risk in all material respects. Danica Pension’s balance sheet contains long-term life insurance liabilities and assets, most of which are invested in easily marketable bonds and shares. Both compa-nies are subject to statutory limits on their exposure to Danske Bank A/S. In the following, references to the Group’s liquidity thus exclude Realkredit Danmark and Danica Pension. Despite uncertainty in European markets, particularly because of rating uncertainty for many banks, the Group continued to issue long-term debt throughout the year in order to maintain and build up its liquidity reserves. Following the downgrade of the Group’s ratings in the first half of 2012 and the nervous market sentiment, Danske Bank made an agreement with the Danish Financial Supervisory Authority to accelerate compliance with the expected EU rules on the Liquidity Coverage Ratio (LCR) in 2012 and to take other measures. It is, however, important to emphasise that Danske Bank’s liquidity level remained strong throughout the year. From 2013, Danske Bank will ensure that it has an LCR of at least 110%. At the end of 2012, the Group’s LCR was 121%, and the Group therefore achieved compliance with the expected requirement. The Group met the requirement by lengthening its funding profile, changing the composition of its liquidity buffer and counting holdings of covered bonds and Danish mortgage bonds, including own issued bonds. The Group will include these holdings in the ratio until the European Banking Authority’s (EBA) final guidelines are announced before implementation in 2015. Moreover, the Group will continue to ensure that it has a prudent ratio between lending and long-term funding. Internal measures At the group level, internal liquidity management is based on the monitoring and management of short- and long-term liquidity risks. Liquidity triggers make up a vital part of daily liquidity management since they are used as early warnings of a potential liquidity crisis. The triggers are monitored by various functions across the Group depending on the type of trigger. Liquidity management is organised according to the frame-work described in the following sections, although it is not limited to that framework. Survival horizon The Group’s short-term risk management is intended principally to ensure that, in the short term, the liquidity buffer is always sufficient to ab-sorb the net effects of known future receipts and payments from current transactions. Bond holdings that can be used in repo agreements with central banks are considered liquid assets. To take account of the potential risk of drawings under irrevocable loan commitments, the Group factors in the unutilised portion of the facilities in the calculation of liquidity risk. For liquidity management purposes, the Group distinguishes between liquidity in Danish kroner and liquidity in non-Danish currencies. This is because of the Group’s strong position in the Danish market and because the Group has a net deposit surplus in Danish kroner (deposits ex-ceed lending) and a net deposit shortfall in other currencies (lending exceeds deposits). The net deposit surplus in Danish kroner is a valuable, stable funding source for the Group. The Group uses limits to manage short-term liquidity risk for total liquidity and for liquidity in non-Danish currencies. In addition to limits set by the Board of Directors and the All Risk Committee, the Asset and Liability Management Committee has set overnight targets for each key cur-rency. Survival horizon under stress The Group conducts stress tests to measure its immediate liquidity risk and to ensure that it has sufficient time to respond to potential crises. The stress tests estimate liquidity risk in various scenarios, including three standard scenarios: a scenario specific to the Group, a general market crisis scenario and a combination of the two. It also conducts a stress-to-fail test. All stress tests are based on the assumption that the Group does not reduce its lending activities. This means that existing lending activities are maintained and require funding. The degree of possible refinancing varies, depending on the scenario in question and the specific funding source. To assess the stability of the funding, the Group considers maturity as well as behavioural assumptions. Most of the Group’s unencumbered bond holdings can be used as collateral for loan facilities with central banks and are thus considered liquid assets. Scenario-specific haircuts are used on the bond portfolio. Market reliance Retail deposits are a valuable, stable funding source for the Group. Most of the Group’s retail deposits are covered by a deposit insurance scheme, and analyses indicate that they are indeed stable over time. Wholesale funding is another important funding source. This type of funding is less stable, especially when the markets are strained.
NOTES – DANSKE BANK GROUP – RISK MANAGEMENT
DANSKE BANK ANNUAL REPORT 2012 105
Stress tests show that the Group’s liquidity buffer is sufficient to close any liquidity gap if all capital markets are closed and refinancing is im-possible. The liquidity buffer is monitored continuously to ensure a minimum survival period of 12 months in such a scenario. Funding sources The Group monitors its funding mix to ensure that it is well-diversified in terms of funding sources, maturities and currencies. A well-balanced portfolio of liabilities is intended to generate a stable flow of funding and provides protection against market disruptions. The tables below break down funding sources by type of liability and currency, including funding in the form of bonds issued by Realkredit Danmark.
Funding sources by type of liability (%) 2012 2011
Central banks/credit institutions 12 10 Repo transactions 18 14 Short-term bonds 2 4 Long-term bonds 6 9 Total covered bonds 11 8 Deposits (business) 22 25 Deposits (personal) 19 20 Subordinated debt 3 3 Shareholders' equity 7 7 Total 100 100
Funding sources by currency (%) 2012 2011
DKK 34 EUR 37 USD 8 SEK GBP 5 CHF 1 NOK 6 Other 1 Total 100 Liquidity buffer The Group manages its liquidity buffer to ensure compliance with international and national regulatory requirements and internal limits de-termined by stress tests. The Group’s liquidity buffer is defined as the assets available to Group Treasury in a stressed scenario. All assets must be unencumbered, and se-curities received in reverse repo transactions are included, while securities used as collateral for repo transactions are not. The haircuts applied to determine liquidity values for regulatory purposes are defined by regulators, while the haircuts used for internal stress testing purposes are de-fined on the basis of a set of parameters specific to each scenario. The Group’s bond holdings are considered to be highly liquid, not least because most of them can be used in repo agreements with central banks. Central bank eligibility is vital for intra-day liquidity management and overnight li-quidity facilities and also for determining liquidity in markets during stressed periods. While central bank eligibility is a positive indicator, it is not necessarily the only parameter used for defining the liquidity value of a buffer. External credit rating performance is another parameter.
8
31
31
12
7
6
5
6
2
100
NO
TE
S – D
AN
SK
E B
AN
K G
RO
UP
DANSKE BANK / GROUP 2012 153
NOTES – DANSKE BANK GROUP – RISK MANAGEMENT

NOTES – DANSKE BANK GROUP – RISK MANAGEMENT
DANSKE BANK ANNUAL REPORT 2012 106
Regulatory measures The Basel Committee has defined new liquidity standards in the form of the Liquidity Coverage Ratio (LCR) and the Net Stable Funding Ratio (NSFR). The LCR stipulates that banks must have a liquidity buffer that ensures a survival horizon of at least 30 calendar days in case of a se-riously stressed liquidity situation. The NSFR is intended to ensure a sound funding structure by promoting more long-dated funding. The NSFR stipulates that banks must at all times have stable funding equal to the amount of their illiquid assets for one year ahead. In Europe, the revision of the Capital Requirements Directive (CRD IV) continues. Focus is on the LCR, but the definition of LCR is still awaiting additional technical guidance from the European Banking Authority (EBA). Nevertheless, it is of great significance in the measurement of the Group’s liquidity buffer with the LCR that the CRD IV proposal allows most of the Group’s covered bond holdings, including Danish mortgage bonds, to be classified as level 1 liquid assets, on a par with Danish government bonds. The national liquidity requirements that apply to the Group are set forth in section 152 of the Danish Financial Business Act, which states that a credit institution’s liquidity must equal at least • 15% of the debt obligations that, regardless of any disbursement conditions, the institution must pay on demand or at less than one
month’s notice • 10% of the institution’s total debt and guarantee obligations, excluding subordinated loan capital infusions that can be counted as part of
the capital base In 2010, the Danish FSA introduced the Supervisory Diamond, which includes benchmarks for liquidity and funding for the parent company. The liquidity benchmark states that banks must have excess liquidity coverage that is 50% above the regulatory requirement in section 152 of the Danish Financial Business Act. At the end of 2012, Danske Bank’s excess liquidity coverage ratios were 170% and 167%, respectively, above the regulatory requirements. The funding benchmark stipulates that lending may not exceed stable funding (deposits as well as issued bonds and subordinated debt with a maturity of more than one year). This means that banks must have a funding ratio of less than 1.00. At the end of 2012, the Group’s ratio was 0.68%.
154 DANSKE BANK / GROUP 2012
NOTES – DANSKE BANK GROUP – RISK MANAGEMENT

NOTES – DANSKE BANK GROUP – RISK MANAGEMENT
DANSKE BANK ANNUAL REPORT 2012 106
Regulatory measures The Basel Committee has defined new liquidity standards in the form of the Liquidity Coverage Ratio (LCR) and the Net Stable Funding Ratio (NSFR). The LCR stipulates that banks must have a liquidity buffer that ensures a survival horizon of at least 30 calendar days in case of a se-riously stressed liquidity situation. The NSFR is intended to ensure a sound funding structure by promoting more long-dated funding. The NSFR stipulates that banks must at all times have stable funding equal to the amount of their illiquid assets for one year ahead. In Europe, the revision of the Capital Requirements Directive (CRD IV) continues. Focus is on the LCR, but the definition of LCR is still awaiting additional technical guidance from the European Banking Authority (EBA). Nevertheless, it is of great significance in the measurement of the Group’s liquidity buffer with the LCR that the CRD IV proposal allows most of the Group’s covered bond holdings, including Danish mortgage bonds, to be classified as level 1 liquid assets, on a par with Danish government bonds. The national liquidity requirements that apply to the Group are set forth in section 152 of the Danish Financial Business Act, which states that a credit institution’s liquidity must equal at least • 15% of the debt obligations that, regardless of any disbursement conditions, the institution must pay on demand or at less than one
month’s notice • 10% of the institution’s total debt and guarantee obligations, excluding subordinated loan capital infusions that can be counted as part of
the capital base In 2010, the Danish FSA introduced the Supervisory Diamond, which includes benchmarks for liquidity and funding for the parent company. The liquidity benchmark states that banks must have excess liquidity coverage that is 50% above the regulatory requirement in section 152 of the Danish Financial Business Act. At the end of 2012, Danske Bank’s excess liquidity coverage ratios were 170% and 167%, respectively, above the regulatory requirements. The funding benchmark stipulates that lending may not exceed stable funding (deposits as well as issued bonds and subordinated debt with a maturity of more than one year). This means that banks must have a funding ratio of less than 1.00. At the end of 2012, the Group’s ratio was 0.68%.
NOTES – DANSKE BANK GROUP – RISK MANAGEMENT
DANSKE BANK ANNUAL REPORT 2012 107
Insurance risk The Group’s insurance risk consists of all risks related to its investment in the Danica group, including market risk and life insurance risks. Net income from insurance business is derived primarily from
• the risk allowance and guarantees for conventional life insurance • unit-linked business • health and accident business • return on assets in which the shareholders’ equity of Danica Pension is invested
The risk allowance is the annual return that Danica Pension may book from its conventional life insurance business (Danica Traditionel), and it currently amounts to 0.50-0.85% of technical provisions. The risk allowance is governed by the Danish FSA’s executive order on the contribu-tion principle and may be booked only if the technical basis permits and if the bonus potential of paid-up policies is not used for loss absorption. The technical basis for the risk allowance is essentially the investment return on policyholders’ funds less the change in life insurance provi-sions. If the risk allowance cannot be booked, in whole or in part, or the Group must cover losses that cannot be absorbed by the collective bo-nus potential, the amount can be transferred to a shadow account and booked at a later date when the technical basis so permits. All profits and losses after interest payments to policyholders, risk allowance and changes in insurance provisions are transferred to the collective bo-nus potential. According to the Danish FSA’s executive order on the contribution principle, Danica Traditionel insurance policies must be divided into groups with generally the same interest rates (interest rate groups), insurance risk and expenses. In addition, the policyholders’ capital buffer, also called the collective bonus potential, is divided among these groups. Danica Pension therefore has individual investment and hedging strate-gies for each group. Finally, the risk allowance is also determined for each group individually. The decline in interest rates in 2011 continued in the first six months of 2012. Long European yields fell to a record low. Investor interest in Danish government bonds lowered Danish government bond yields further. The low yields increased pension companies’ need for hedging, and since the European market for long-term bonds was illiquid, this demand pushed long yields further down. Because of this, Danish insurance companies saw a substantial rise in life insurance provisions. The Danish Ministry of Business and Growth therefore reached an agreement with the insurance and pension industry to change the discount yield curve used for long yields. This aligns the Danish rules more closely with the expected Solvency II rules. The agreement took effect on 12 June 2012. The change caused a reduction of Danica Pension’s life insurance provisions of DKK 1.5 billion at 31 December 2012. The agreement also places a ceiling of 2% on the rate of interest on policyholders’ savings until 1January 2014 and limits the possibility of distributing dividends to shareholders. Financial risks Market risk involves the risk of losses on assets in which the shareholders’ equity of Danica Pension is invested and the risk of losses on poli-cies with guaranteed benefits arising because the fair value of assets and liabilities allocated to these contracts changes. Such changes in fair value can be caused by changes in interest rates, exchange rates, equity prices, property prices, credit spreads and market liquidity as well as by issuer or counterparty defaults. Insurance obligations carry interest rate risk owing to the guarantees issued. For example, if market inter-est rates drop, the market value of obligations increases. The Group monitors the market risk on an ongoing basis and has set maximum risk targets for each asset class. Danica Pension conducts in-ternal stress tests to ensure that it can withstand significant losses on its equity and credit exposure and substantial changes in interest rates. The risk related to the relationship between investment assets and guaranteed benefits is reduced by keeping the interest-rate sensitivity of the bond portfolio at a suitable level and by hedging through derivatives. The credit spread risk on bond holdings is limited, since, at end-2012, about 74% of the portfolio consisted of government and mortgage bonds of high quality (AA-AAA ratings from the international rating agencies) or unrated mortgage bonds issued by institutions with similarly high ratings, and only 9% of the portfolio was invested in sub-investment grade bonds. This risk is managed as an equity market risk.
NO
TE
S – D
AN
SK
E B
AN
K G
RO
UP
DANSKE BANK / GROUP 2012 155
NOTES – DANSKE BANK GROUP – RISK MANAGEMENT
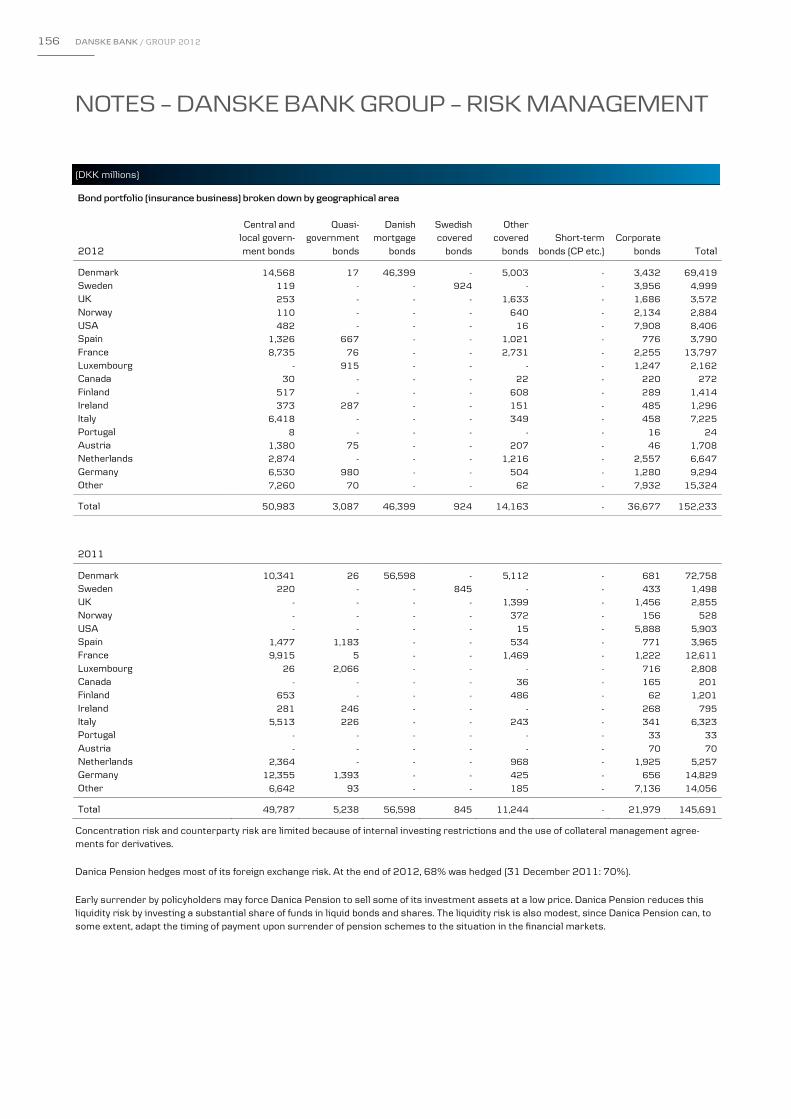
NOTES – DANSKE BANK GROUP – RISK MANAGEMENT
(DKK millions)
DANSKE BANK ANNUAL REPORT 2012 108
Bond portfolio (insurance business) broken down by geographical area
Central and Quasi- Danish Swedish Other local govern- government mortgage covered covered Short-term Corporate 2012 ment bonds bonds bonds bonds bonds bonds (CP etc.) bonds Total
Denmark 14,568 17 46,399 - 5,003 - 3,432 69,419
Sweden 119 - - 924 - - 3,956 4,999
UK 253 - - - 1,633 - 1,686 3,572
Norway 110 - - - 640 - 2,134 2,884
USA 482 - - - 16 - 7,908 8,406
Spain 1,326 667 - - 1,021 - 776 3,790
France 8,735 76 - - 2,731 - 2,255 13,797
Luxembourg - 915 - - - - 1,247 2,162
Canada 30 - - - 22 - 220 272
Finland 517 - - - 608 - 289 1,414
Ireland 373 287 - - 151 - 485 1,296
Italy 6,418 - - - 349 - 458 7,225
Portugal 8 - - - - - 16 24
Austria 1,380 75 - - 207 - 46 1,708
Netherlands 2,874 - - - 1,216 - 2,557 6,647
Germany 6,530 980 - - 504 - 1,280 9,294
Other 7,260 70 - - 62 - 7,932 15,324
Total 50,983 3,087 46,399 924 14,163 - 36,677 152,233
2011
Denmark 10,341 26 56,598 - 5,112 - 681 72,758 Sweden 220 - - 845 - - 433 1,498 UK - - - - 1,399 - 1,456 2,855 Norway - - - - 372 - 156 528 USA - - - - 15 - 5,888 5,903 Spain 1,477 1,183 - - 534 - 771 3,965 France 9,915 5 - - 1,469 - 1,222 12,611 Luxembourg 26 2,066 - - - - 716 2,808 Canada - - - - 36 - 165 201 Finland 653 - - - 486 - 62 1,201 Ireland 281 246 - - - - 268 795 Italy 5,513 226 - - 243 - 341 6,323 Portugal - - - - - - 33 33 Austria - - - - - - 70 70 Netherlands 2,364 - - - 968 - 1,925 5,257 Germany 12,355 1,393 - - 425 - 656 14,829 Other 6,642 93 - - 185 - 7,136 14,056
Total 49,787 5,238 56,598 845 11,244 - 21,979 145,691
Concentration risk and counterparty risk are limited because of internal investing restrictions and the use of collateral management agree-ments for derivatives.
Danica Pension hedges most of its foreign exchange risk. At the end of 2012, 68% was hedged (31 December 2011: 70%). Early surrender by policyholders may force Danica Pension to sell some of its investment assets at a low price. Danica Pension reduces this liquidity risk by investing a substantial share of funds in liquid bonds and shares. The liquidity risk is also modest, since Danica Pension can, to some extent, adapt the timing of payment upon surrender of pension schemes to the situation in the financial markets.
156 DANSKE BANK / GROUP 2012
NOTES – DANSKE BANK GROUP – RISK MANAGEMENT
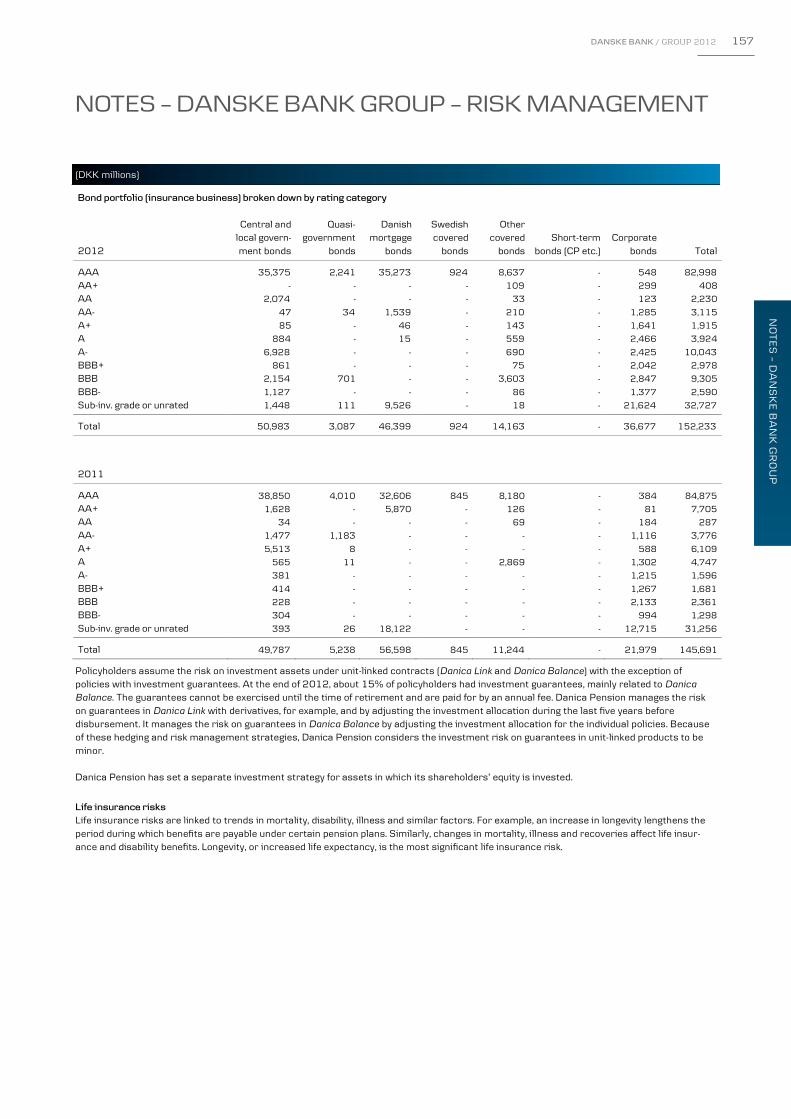
NOTES – DANSKE BANK GROUP – RISK MANAGEMENT
(DKK millions)
DANSKE BANK ANNUAL REPORT 2012 108
Bond portfolio (insurance business) broken down by geographical area
Central and Quasi- Danish Swedish Other local govern- government mortgage covered covered Short-term Corporate 2012 ment bonds bonds bonds bonds bonds bonds (CP etc.) bonds Total
Denmark 14,568 17 46,399 - 5,003 - 3,432 69,419
Sweden 119 - - 924 - - 3,956 4,999
UK 253 - - - 1,633 - 1,686 3,572
Norway 110 - - - 640 - 2,134 2,884
USA 482 - - - 16 - 7,908 8,406
Spain 1,326 667 - - 1,021 - 776 3,790
France 8,735 76 - - 2,731 - 2,255 13,797
Luxembourg - 915 - - - - 1,247 2,162
Canada 30 - - - 22 - 220 272
Finland 517 - - - 608 - 289 1,414
Ireland 373 287 - - 151 - 485 1,296
Italy 6,418 - - - 349 - 458 7,225
Portugal 8 - - - - - 16 24
Austria 1,380 75 - - 207 - 46 1,708
Netherlands 2,874 - - - 1,216 - 2,557 6,647
Germany 6,530 980 - - 504 - 1,280 9,294
Other 7,260 70 - - 62 - 7,932 15,324
Total 50,983 3,087 46,399 924 14,163 - 36,677 152,233
2011
Denmark 10,341 26 56,598 - 5,112 - 681 72,758 Sweden 220 - - 845 - - 433 1,498 UK - - - - 1,399 - 1,456 2,855 Norway - - - - 372 - 156 528 USA - - - - 15 - 5,888 5,903 Spain 1,477 1,183 - - 534 - 771 3,965 France 9,915 5 - - 1,469 - 1,222 12,611 Luxembourg 26 2,066 - - - - 716 2,808 Canada - - - - 36 - 165 201 Finland 653 - - - 486 - 62 1,201 Ireland 281 246 - - - - 268 795 Italy 5,513 226 - - 243 - 341 6,323 Portugal - - - - - - 33 33 Austria - - - - - - 70 70 Netherlands 2,364 - - - 968 - 1,925 5,257 Germany 12,355 1,393 - - 425 - 656 14,829 Other 6,642 93 - - 185 - 7,136 14,056
Total 49,787 5,238 56,598 845 11,244 - 21,979 145,691
Concentration risk and counterparty risk are limited because of internal investing restrictions and the use of collateral management agree-ments for derivatives.
Danica Pension hedges most of its foreign exchange risk. At the end of 2012, 68% was hedged (31 December 2011: 70%). Early surrender by policyholders may force Danica Pension to sell some of its investment assets at a low price. Danica Pension reduces this liquidity risk by investing a substantial share of funds in liquid bonds and shares. The liquidity risk is also modest, since Danica Pension can, to some extent, adapt the timing of payment upon surrender of pension schemes to the situation in the financial markets.
NOTES – DANSKE BANK GROUP – RISK MANAGEMENT
(DKK millions)
DANSKE BANK ANNUAL REPORT 2012 109
Bond portfolio (insurance business) broken down by rating category
Central and Quasi- Danish Swedish Other local govern- government mortgage covered covered Short-term Corporate 2012 ment bonds bonds bonds bonds bonds bonds (CP etc.) bonds Total
AAA 35,375 2,241 35,273 924 8,637 - 548 82,998 AA+ - - - - 109 - 299 408 AA 2,074 - - - 33 - 123 2,230 AA- 47 34 1,539 - 210 - 1,285 3,115 A+ 85 - 46 - 143 - 1,641 1,915 A 884 - 15 - 559 - 2,466 3,924 A- 6,928 - - - 690 - 2,425 10,043 BBB+ 861 - - - 75 - 2,042 2,978 BBB 2,154 701 - - 3,603 - 2,847 9,305 BBB- 1,127 - - - 86 - 1,377 2,590 Sub-inv. grade or unrated 1,448 111 9,526 - 18 - 21,624 32,727 Total 50,983 3,087 46,399 924 14,163 - 36,677 152,233
2011
AAA 38,850 4,010 32,606 845 8,180 - 384 84,875 AA+ 1,628 - 5,870 - 126 - 81 7,705 AA 34 - - - 69 - 184 287 AA- 1,477 1,183 - - - - 1,116 3,776 A+ 5,513 8 - - - - 588 6,109 A 565 11 - - 2,869 - 1,302 4,747 A- 381 - - - - - 1,215 1,596 BBB+ 414 - - - - - 1,267 1,681 BBB 228 - - - - - 2,133 2,361 BBB- 304 - - - - - 994 1,298 Sub-inv. grade or unrated 393 26 18,122 - - - 12,715 31,256
Total 49,787 5,238 56,598 845 11,244 - 21,979 145,691
Policyholders assume the risk on investment assets under unit-linked contracts (Danica Link and Danica Balance) with the exception of policies with investment guarantees. At the end of 2012, about 15% of policyholders had investment guarantees, mainly related to Danica Balance. The guarantees cannot be exercised until the time of retirement and are paid for by an annual fee. Danica Pension manages the risk on guarantees in Danica Link with derivatives, for example, and by adjusting the investment allocation during the last five years before disbursement. It manages the risk on guarantees in Danica Balance by adjusting the investment allocation for the individual policies. Because of these hedging and risk management strategies, Danica Pension considers the investment risk on guarantees in unit-linked products to be minor. Danica Pension has set a separate investment strategy for assets in which its shareholders’ equity is invested.
Life insurance risks Life insurance risks are linked to trends in mortality, disability, illness and similar factors. For example, an increase in longevity lengthens the period during which benefits are payable under certain pension plans. Similarly, changes in mortality, illness and recoveries affect life insur-ance and disability benefits. Longevity, or increased life expectancy, is the most significant life insurance risk.
NO
TE
S – D
AN
SK
E B
AN
K G
RO
UP
DANSKE BANK / GROUP 2012 157
NOTES – DANSKE BANK GROUP – RISK MANAGEMENT

NOTES – DANSKE BANK GROUP – RISK MANAGEMENT
(DKK billions)
DANSKE BANK ANNUAL REPORT 2012 110
The various risk elements are subject to ongoing actuarial assessment for the purpose of calculating insurance obligations and making rele-vant business adjustments. Life insurance obligations are calculated on the basis of expected future mortality rates. Estimates are based on empirical data from Danica Pension’s own portfolio of insurance contracts. The rates reflect a likely increase in life expectancy in the future. For health and personal accident policies, insurance obligations are calculated on the basis of expected future recoveries and reopenings of old claims. Estimates are based on empirical data from Danica Pension’s own portfolio of insurance contracts and are updated regularly. To mitigate life insurance risk, Danica Pension reinsures large individual policy exposures. Danica Pension also reinsures the risk of losses due to disasters. Sensitivity analysis for life insurance The sensitivity indicators show the effect on shareholders’ equity, the collective bonus potential and the bonus potential of paid-up policies generated by separate changes in interest rates, equity prices, real property prices and actuarial assumptions. If the bonus potential is insuffi-cient to cover policyholders’ share of the effect, the shortfall will be covered by funds allocated from shareholders’ equity. Of the two interest rate scenarios, the rate decrease is the most severe for Danica Pension. The effect of a 0.7 of a percentage point decline in interest rates would reduce the collective bonus potential by DKK 0.6 billion and shareholders’ equity by DKK 1.8 billion. A 10% fall in mortal-ity, equal to a one-year increase in life expectancy, would increase insurance obligations by DKK 0.4 billion and reduce shareholders’ equity by DKK 1.6 billion.
The sensitivity analysis reflects the Group’s increased exposure to changes in market conditions because the collective bonus potential and the bonus potential of paid-up policies were reduced in 2012 and therefore to a lesser degree can be used to cover any future negative in-vestment returns.
Change in Change in
collective bonus bonus potential of Change in 2012 potential paid-up policies equity
Interest rate increase of 0.7 of a percentage point -0.3 -1.4 -0.9
Interest rate decline of 0.7 of a percentage point -0.6 -0.1 -1.8
Decline in equity prices of 12% -0.3 -1.1 -0.4
Decline in property prices of 8% -0.2 -0.4 -0.8
Foreign exchange risk (VaR 99.0%) -0.2 -0.2 -0.2
Loss on counterparties of 8% -0.3 -0.7 -1.1
Increase in credit spreads of 1.0 percentage point -0.3 -0.5 -0.5
Decrease in mortality of 10% -0.2 -0.1 -1.6
Increase in mortality of 10% 1.7 - -
Increase in disability of 10% - - -0.1
2011
Interest rate increase of 0.7 of a percentage point -0.2 3.1 -0.5 Interest rate decline of 0.7 of a percentage point 0.9 -2.5 0.1 Decline in equity prices of 12% -0.1 -0.8 -0.3 Decline in property prices of 8% -0.2 -0.5 -0.8 Foreign exchange risk (VaR 99.0%) -0.1 -0.1 -0.1 Loss on counterparties of 8% -0.2 -0.6 -1.2 Increase in credit spreads of 1.0 percentage point -0.1 -0.3 -0.4 Decrease in mortality of 10% -0.2 -0.2 -1.5 Increase in mortality of 10% 1.6 0.1 - Increase in disability of 10% -0.1 - -
158 DANSKE BANK / GROUP 2012
NOTES – DANSKE BANK GROUP – RISK MANAGEMENT

NOTES – DANSKE BANK GROUP – RISK MANAGEMENT
(DKK billions)
DANSKE BANK ANNUAL REPORT 2012 110
The various risk elements are subject to ongoing actuarial assessment for the purpose of calculating insurance obligations and making rele-vant business adjustments. Life insurance obligations are calculated on the basis of expected future mortality rates. Estimates are based on empirical data from Danica Pension’s own portfolio of insurance contracts. The rates reflect a likely increase in life expectancy in the future. For health and personal accident policies, insurance obligations are calculated on the basis of expected future recoveries and reopenings of old claims. Estimates are based on empirical data from Danica Pension’s own portfolio of insurance contracts and are updated regularly. To mitigate life insurance risk, Danica Pension reinsures large individual policy exposures. Danica Pension also reinsures the risk of losses due to disasters. Sensitivity analysis for life insurance The sensitivity indicators show the effect on shareholders’ equity, the collective bonus potential and the bonus potential of paid-up policies generated by separate changes in interest rates, equity prices, real property prices and actuarial assumptions. If the bonus potential is insuffi-cient to cover policyholders’ share of the effect, the shortfall will be covered by funds allocated from shareholders’ equity. Of the two interest rate scenarios, the rate decrease is the most severe for Danica Pension. The effect of a 0.7 of a percentage point decline in interest rates would reduce the collective bonus potential by DKK 0.6 billion and shareholders’ equity by DKK 1.8 billion. A 10% fall in mortal-ity, equal to a one-year increase in life expectancy, would increase insurance obligations by DKK 0.4 billion and reduce shareholders’ equity by DKK 1.6 billion.
The sensitivity analysis reflects the Group’s increased exposure to changes in market conditions because the collective bonus potential and the bonus potential of paid-up policies were reduced in 2012 and therefore to a lesser degree can be used to cover any future negative in-vestment returns.
Change in Change in
collective bonus bonus potential of Change in 2012 potential paid-up policies equity
Interest rate increase of 0.7 of a percentage point -0.3 -1.4 -0.9
Interest rate decline of 0.7 of a percentage point -0.6 -0.1 -1.8
Decline in equity prices of 12% -0.3 -1.1 -0.4
Decline in property prices of 8% -0.2 -0.4 -0.8
Foreign exchange risk (VaR 99.0%) -0.2 -0.2 -0.2
Loss on counterparties of 8% -0.3 -0.7 -1.1
Increase in credit spreads of 1.0 percentage point -0.3 -0.5 -0.5
Decrease in mortality of 10% -0.2 -0.1 -1.6
Increase in mortality of 10% 1.7 - -
Increase in disability of 10% - - -0.1
2011
Interest rate increase of 0.7 of a percentage point -0.2 3.1 -0.5 Interest rate decline of 0.7 of a percentage point 0.9 -2.5 0.1 Decline in equity prices of 12% -0.1 -0.8 -0.3 Decline in property prices of 8% -0.2 -0.5 -0.8 Foreign exchange risk (VaR 99.0%) -0.1 -0.1 -0.1 Loss on counterparties of 8% -0.2 -0.6 -1.2 Increase in credit spreads of 1.0 percentage point -0.1 -0.3 -0.4 Decrease in mortality of 10% -0.2 -0.2 -1.5 Increase in mortality of 10% 1.6 0.1 - Increase in disability of 10% -0.1 - -
NOTES – DANSKE BANK GROUP – RISK MANAGEMENT
(DKK millions)
DANSKE BANK ANNUAL REPORT 2012 111
Pension risk The Group’s pension risk is the risk of a pension shortfall in the Group’s defined benefit plans that requires it to make additional contributions to cover pension obligations to current and former employees. The use of financial derivatives to mitigate inflation and interest rate risks is a key element of risk management. By matching the return on the derivatives and the associated assets with expected future pension obligations, the Group minimises its pension risk. Because of the complexity of its pension obligations, the Group manages market risk on the basis of special follow-up and monitoring principles – so-called business objectives. Quarterly risk reports follow up on the objectives and analyse the financial status of the individual plans on the basis of sensitivity analyses and the Value at Risk (VaR) measure. The objectives include specific limits that indicate acceptable risk exposure levels. For each pension plan, the Group calculates net funding and the sensitivity of net funding to changes in interest rates, equity prices and life ex-pectancy. Net funding expresses the difference between the market value of the assets and the present value of the pension obligations.
Sensitivity analysis Change Effect 2012 Effect 2011
Equity prices -20% -1,108 -950 Interest rate +1/-1% +1,198/-959 +798/-518
Life expectancy +1 year -446 -379 To supplement the sensitivity analyses, the Group calculates the risk of the individual pension plans as a VaR measure. The calculations are based on a long-term horizon with equity price volatility (20%) and correlation between interest rates and equity prices (25%) set at values re-flecting normal market data. The duration of the pension obligations is reduced by half since empirical data show that inflation risk reduces the interest rate risk on the obligations by approximately 50% in the long term. At the end of 2012, VaR was DKK 2,992 million (31 December 2011: DKK 2,966 million). The VaR measure is calculated at a confidence level of 99.97% and with a time horizon of one year. The calculation is adjusted for inflation risk. Note 34 provides additional information about the Group’s defined benefit plans.
NO
TE
S – D
AN
SK
E B
AN
K G
RO
UP
DANSKE BANK / GROUP 2012 159
NOTES – DANSKE BANK GROUP – RISK MANAGEMENT

NOTES – DANSKE BANK GROUP
(DKK millions) 2012 2011 2010 2009 2008
DANSKE BANK ANNUAL REPORT 2012 112
HIGHLIGHTS
Net interest and fee income 43,610 41,215 44,280 54,855 47,312 Value adjustments 12,361 -3,474 5,892 14,031 -10,852 Staff costs and administrative expenses 23,649 22,774 21,697 22,364 22,607 Loan impairment charges etc. 12,529 13,185 13,817 25,678 12,088 Income from associates and group undertakings 172 141 743 293 217 Net profit for the year 4,749 1,723 3,664 1,713 1,036 Loans and advances 1,894,578 1,847,223 1,848,446 1,815,615 2,040,801 Shareholders' equity 138,234 125,855 104,742 100,659 98,247 Total assets 3,485,181 3,424,403 3,213,886 3,098,477 3,543,974
RATIOS AND KEY FIGURES Total capital ratio (%)* 21.3 17.9 17.7 17.8 13.0 Tier 1 capital ratio (%)* 18.9 16.0 14.8 14.1 9.2 Return on equity before tax (%) 6.5 3.6 6.3 3.0 0.5 Return on equity after tax (%) 3.6 1.5 3.6 1.0 -0.4 Cost/income ratio (DKK) 1.21 1.10 1.16 1.05 1.01 Interest rate risk (%)* 0.2 0.6 0.4 1.0 3.1 Foreign exchange position (%)* 1.7 2.6 3.1 2.0 4.6 Foreign exchange risk (%)* - - - - 0.1 Loans and advances plus impairment charges as % of deposits 192.6 206.4 203.4 207.6 225.0 Gearing of loans and advances (%) 13.7 14.7 17.6 17.6 19.8 Growth in loans and advances (%) 2.6 -0.1 1.8 -10.1 1.7 Surplus liquidity in relation to statutory liquidity requirement (%)* 140.7 85.5 168.2 164.3 83.6 Sum of large exposures as % of capital base* 11.6 21.9 56.5 35.7 124.7 Impairment ratio (%) 0.6 0.7 0.6 1.2 0.6 Earnings per share (DKK) 5.1 2.1 5.2 2.3 1.4 Book value per share (DKK) 137.9 135.4 151.1 134.8 131.7 Proposed dividend per share (DKK) - - - - - Share price at 31 December/earnings per share (DKK) 18.9 34.4 27.3 47.5 34.4 Share price at 31 December/book value per share (DKK) 0.69 0.54 0.95 0.81 0.37 The ratios and key figures are defined in the Danish FSA’s Executive Order on Financial Reports for Credit Institutions and Investment Compa-nies, etc. The ratios and key figures are calculated in accordance with IFRSs with the exception of ratios and key figures marked *. These are calculated in accordance with Danish FSA rules. Share ratios have been divided by an adjustment factor to reflect the share capital increase in April 2011.
160 DANSKE BANK / GROUP 2012
NOTES – DANSKE BANK GROUP

NOTES – DANSKE BANK GROUP
(DKK millions) 2012 2011 2010 2009 2008
DANSKE BANK ANNUAL REPORT 2012 112
HIGHLIGHTS
Net interest and fee income 43,610 41,215 44,280 54,855 47,312 Value adjustments 12,361 -3,474 5,892 14,031 -10,852 Staff costs and administrative expenses 23,649 22,774 21,697 22,364 22,607 Loan impairment charges etc. 12,529 13,185 13,817 25,678 12,088 Income from associates and group undertakings 172 141 743 293 217 Net profit for the year 4,749 1,723 3,664 1,713 1,036 Loans and advances 1,894,578 1,847,223 1,848,446 1,815,615 2,040,801 Shareholders' equity 138,234 125,855 104,742 100,659 98,247 Total assets 3,485,181 3,424,403 3,213,886 3,098,477 3,543,974
RATIOS AND KEY FIGURES Total capital ratio (%)* 21.3 17.9 17.7 17.8 13.0 Tier 1 capital ratio (%)* 18.9 16.0 14.8 14.1 9.2 Return on equity before tax (%) 6.5 3.6 6.3 3.0 0.5 Return on equity after tax (%) 3.6 1.5 3.6 1.0 -0.4 Cost/income ratio (DKK) 1.21 1.10 1.16 1.05 1.01 Interest rate risk (%)* 0.2 0.6 0.4 1.0 3.1 Foreign exchange position (%)* 1.7 2.6 3.1 2.0 4.6 Foreign exchange risk (%)* - - - - 0.1 Loans and advances plus impairment charges as % of deposits 192.6 206.4 203.4 207.6 225.0 Gearing of loans and advances (%) 13.7 14.7 17.6 17.6 19.8 Growth in loans and advances (%) 2.6 -0.1 1.8 -10.1 1.7 Surplus liquidity in relation to statutory liquidity requirement (%)* 140.7 85.5 168.2 164.3 83.6 Sum of large exposures as % of capital base* 11.6 21.9 56.5 35.7 124.7 Impairment ratio (%) 0.6 0.7 0.6 1.2 0.6 Earnings per share (DKK) 5.1 2.1 5.2 2.3 1.4 Book value per share (DKK) 137.9 135.4 151.1 134.8 131.7 Proposed dividend per share (DKK) - - - - - Share price at 31 December/earnings per share (DKK) 18.9 34.4 27.3 47.5 34.4 Share price at 31 December/book value per share (DKK) 0.69 0.54 0.95 0.81 0.37 The ratios and key figures are defined in the Danish FSA’s Executive Order on Financial Reports for Credit Institutions and Investment Compa-nies, etc. The ratios and key figures are calculated in accordance with IFRSs with the exception of ratios and key figures marked *. These are calculated in accordance with Danish FSA rules. Share ratios have been divided by an adjustment factor to reflect the share capital increase in April 2011.
FINANCIAL STATEMENTS – DANSKE BANK A/S
(DKK millions)
DANSKE BANK ANNUAL REPORT 2012 113
The financial statements of the Parent Company, Danske Bank A/S, are prepared in accordance with the Danish Financial Business Act and the Danish FSA’s Executive Order No. 312 of 30 March 2012 on Financial Reports for Credit Institutions and Investment Companies, etc.
The rules are identical to the Group’s IFRS-compliant valuation and measurement principles with the following exceptions:
• Domicile property is measured (revalued) at its estimated fair value through Other comprehensive income
• The corridor method is not applied to pension obligations
• The available-for-sale financial assets category is not used The estimated fair value of domicile property is determined in accordance with the Danish FSA’s Executive Order on Financial Reports for Credit Institutions and Investment Companies, etc. Available-for-sale financial assets are measured at fair value through profit or loss. Holdings in subsidiaries are measured on the basis of the equity method, and tax payable by these undertakings is expensed under Income from associates and group undertakings. The format of the Parent Company’s financial statements is not identical to the format of the consolidated financial statements prepared in accordance with IFRSs. The table below shows the differences in net profit and shareholders’ equity between the IFRS consolidated financial statements and the Par-ent Company’s financial statements presented in accordance with Danish FSA rules.
Net profit Shareholders' equity 31 Dec. 31 Dec. 2012 2011 2012 2011
Consolidated financial statements (IFRSs) 4,749 1,723 138,234 125,855
Domicile property -46 -77 1,048 1,281
Available-for-sale financial assets 729 -923 - -
Pension obligations -632 438 -235 348
Tax effect -164 174 -57 -58
Reserves in undertakings consolidated on a pro rata basis - - 3,002 2,991
Consolidated financial statements (Danish FSA rules) 4,636 1,335 141,992 130,417
Non-controlling interests 4 11 4 60
Reserves in undertakings consolidated on a pro rata basis - - 3,002 2,991
Goodwill on acquisition of non-controlling interests - - 10 24
Parent Company financial statements (Danish FSA rules) 4,632 1,324 138,996 127,390
The consolidated financial statements (note 43) list the Group’s holdings and undertakings.
FIN
AN
CIA
L S
TAT
EM
EN
TS
– D
AN
SK
E B
AN
K A
/S
DANSKE BANK / PARENT COMPANY 2012 161
FINANCIAL STATEMENTS – DANSKE BANK A/S

INCOME STATEMENT– DANSKE BANK A/S
Note (DKK millions) 2012 2011
DANSKE BANK ANNUAL REPORT 2012 114
Interest income 41,579 45,907 Interest expense 23,735 27,680
Net interest income 17,844 18,227 Dividends from shares etc. 330 144 Fee and commission income 9,952 9,740 Fees and commissions paid 2,544 2,783
Net interest and fee income 25,582 25,328 5 Value adjustments 4,758 1,491 Other operating income 1,679 2,232 Staff costs and administrative expenses 17,551 15,702 Amortisation, depreciation and impairment charges 2,289 2,315 Other operating expenses 100 736 Loan impairment charges etc. 9,308 9,725 Income from associates and group undertakings 4,315 2,309
Profit before tax 7,086 2,882 Tax 2,454 1,558
Net profit for the year 4,632 1,324
Proposed profit allocation
Equity method reserve 431 -1,030 Dividends for the year - -
Retained earnings 4,201 2,354
Total 4,632 1,324
23
4
678
10
162 DANSKE BANK / PARENT COMPANY 2012
INCOME STATEMENT – DANSKE BANK A/S

INCOME STATEMENT– DANSKE BANK A/S
Note (DKK millions) 2012 2011
DANSKE BANK ANNUAL REPORT 2012 114
Interest income 41,579 45,907 Interest expense 23,735 27,680
Net interest income 17,844 18,227 Dividends from shares etc. 330 144 Fee and commission income 9,952 9,740 Fees and commissions paid 2,544 2,783
Net interest and fee income 25,582 25,328 5 Value adjustments 4,758 1,491 Other operating income 1,679 2,232 Staff costs and administrative expenses 17,551 15,702 Amortisation, depreciation and impairment charges 2,289 2,315 Other operating expenses 100 736 Loan impairment charges etc. 9,308 9,725 Income from associates and group undertakings 4,315 2,309
Profit before tax 7,086 2,882 Tax 2,454 1,558
Net profit for the year 4,632 1,324
Proposed profit allocation
Equity method reserve 431 -1,030 Dividends for the year - -
Retained earnings 4,201 2,354
Total 4,632 1,324
23
4
678
10
STATEMENT OF COMPREHENSIVE INCOME – DANSKE BANK A/S
Note (DKK millions) 2012 2011
DANSKE BANK ANNUAL REPORT 2012 115
Net profit for the year 4,632 1,324
Other comprehensive income
Translation of units outside Denmark 488 214
Hedging of units outside Denmark -481 -273
Fair value adjustment of domicile property -298 76
10 Tax on other comprehensive income 153 46
Total other comprehensive income -138 63
Total comprehensive income for the year 4,494 1,387
STA
TE
ME
NT
OF
CO
MP
RE
HE
NS
IVE
INC
OM
E
– DA
NS
KE
BA
NK
A/S
DANSKE BANK / PARENT COMPANY 2012 163
STATEMENT OF COMPREHENSIVE INCOME – DANSKE BANK A/S

BALANCE SHEET – DANSKE BANK A/S
Note (DKK millions) 2012 2011
DANSKE BANK ANNUAL REPORT 2012 116
ASSETS Cash in hand and demand deposits with central banks 69,141 17,536 11 Due from credit institutions and central banks 217,162 217,386 12 Loans, advances and other amounts due at amortised cost 957,971 917,201 Bonds at fair value 509,727 530,544 18 Bonds at amortised cost 3,959 5,172 Shares etc. 5,660 3,076 Holdings in associates 803 701 Holdings in group undertakings 98,742 97,408 19 Assets under pooled schemes 48,743 43,503 Intangible assets 19,212 19,186 Land and buildings 3,522 4,242 15 Investment property 109 112 15 Domicile property 3,413 4,130 16 Other tangible assets 2,949 3,171 Current tax assets 381 487 17 Deferred tax assets 58 467 Assets temporarily taken over 344 230 20 Other assets 418,213 565,643 Prepayments 771 682 Total assets 2,357,358 2,426,635
LIABILITIES AND EQUITY
AMOUNTS DUE
21 Due to credit institutions and central banks 499,899 453,317 22 Deposits and other amounts due 761,317 685,872 Deposits under pooled schemes 49,670 44,670 23 Issued bonds at amortised cost 273,223 326,729 Current tax liabilities 645 410 24 Other liabilities 558,831 717,931 Deferred income 1,002 1,099 Total amounts due 2,144,587 2,230,028
PROVISIONS FOR LIABILITIES
Provisions for pensions and similar obligations 724 849 17 Provisions for deferred tax 5,443 4,029 13 Provisions for losses on guarantees 1,661 1,087 Other provisions for liabilities 101 11 Total provisions for liabilities 7,929 5,976
SUBORDINATED DEBT
25 Subordinated debt 65,846 63,241
SHAREHOLDERS' EQUITY
Share capital 10,086 9,317 Accumulated value adjustments 280 374 Equity method reserve 25,315 24,884 Retained earnings 103,315 92,815 Proposed dividends - - Total shareholders' equity 138,996 127,390 Total liabilities and equity 2,357,358 2,426,635
164 DANSKE BANK / PARENT COMPANY 2012
BALANCE SHEET – DANSKE BANK A/S

BALANCE SHEET – DANSKE BANK A/S
Note (DKK millions) 2012 2011
DANSKE BANK ANNUAL REPORT 2012 116
ASSETS Cash in hand and demand deposits with central banks 69,141 17,536 11 Due from credit institutions and central banks 217,162 217,386 12 Loans, advances and other amounts due at amortised cost 957,971 917,201 Bonds at fair value 509,727 530,544 18 Bonds at amortised cost 3,959 5,172 Shares etc. 5,660 3,076 Holdings in associates 803 701 Holdings in group undertakings 98,742 97,408 19 Assets under pooled schemes 48,743 43,503 Intangible assets 19,212 19,186 Land and buildings 3,522 4,242 15 Investment property 109 112 15 Domicile property 3,413 4,130 16 Other tangible assets 2,949 3,171 Current tax assets 381 487 17 Deferred tax assets 58 467 Assets temporarily taken over 344 230 20 Other assets 418,213 565,643 Prepayments 771 682 Total assets 2,357,358 2,426,635
LIABILITIES AND EQUITY
AMOUNTS DUE
21 Due to credit institutions and central banks 499,899 453,317 22 Deposits and other amounts due 761,317 685,872 Deposits under pooled schemes 49,670 44,670 23 Issued bonds at amortised cost 273,223 326,729 Current tax liabilities 645 410 24 Other liabilities 558,831 717,931 Deferred income 1,002 1,099 Total amounts due 2,144,587 2,230,028
PROVISIONS FOR LIABILITIES
Provisions for pensions and similar obligations 724 849 17 Provisions for deferred tax 5,443 4,029 13 Provisions for losses on guarantees 1,661 1,087 Other provisions for liabilities 101 11 Total provisions for liabilities 7,929 5,976
SUBORDINATED DEBT
25 Subordinated debt 65,846 63,241
SHAREHOLDERS' EQUITY
Share capital 10,086 9,317 Accumulated value adjustments 280 374 Equity method reserve 25,315 24,884 Retained earnings 103,315 92,815 Proposed dividends - - Total shareholders' equity 138,996 127,390 Total liabilities and equity 2,357,358 2,426,635
STATEMENT OF CAPITAL – DANSKE BANK A/S
(DKK millions)
DANSKE BANK ANNUAL REPORT 2012 117
Changes in shareholders' equity
Foreign
currency Equity Share translation Revaluation method Retained Proposed capital reserve reserve reserve earnings dividends Total
Shareholders' equity at 1 January 2012 9,317 -369 743 24,884 92,815 - 127,390
Net profit for the year - - - 431 4,201 - 4,632
Other comprehensive income
Translation of units outside Denmark - 488 - - - - 488
Hedging of units outside Denmark - -481 - - - - -481
Fair value adjustment of domicile property - - -151 - -147 - -298
Sale of domicile property - - -9 - 9 - -
Tax on other comprehensive income - - 59 - 94 - 153
Total other comprehensive income - 7 -101 - -44 - -138
Total comprehensive income for the year - 7 -101 431 4,157 - 4,494 Transactions with owners
Share capital increase 769 - - - 6,381 - 7,150
Share offering costs - - - - -35 - -35
Acquisition of own shares - - - - -19,399 - -19,399
Sale of own shares - - - - 19,179 - 19,179
Share-based payments - - - - 219 - 219
Tax on entries on shareholders' equity - - - - -2 - -2
Shareholders' equity at 31 December 2012 10,086 -362 642 25,315 103,315 - 138,996 Shareholders' equity at 1 January 2011 6,988 -310 675 25,914 72,689 - 105,956
Net profit for the year - - - -1,030 2,354 - 1,324
Other comprehensive income
Translation of units outside Denmark - 214 - - - - 214
Hedging of units outside Denmark - -273 - - - - -273
Fair value adjustment of domicile property - - 76 - - - 76
Tax on other comprehensive income - - -8 - 54 - 46
Total other comprehensive income - -59 68 - 54 - 63
Total comprehensive income for the year - -59 68 -1,030 2,408 - 1,387
Transactions with owners
Share capital increase 2,329 - - - 17,703 - 20,032
Share offering costs - - - - -271 - -271
Acquisition of own shares - - - - -16,470 - -16,470
Sale of own shares - - - - 16,596 - 16,596
Share-based payments - - - - 127 - 127
Tax on entries on shareholders' equity - - - - 33 - 33
Shareholders' equity at 31 December 2011 9,317 -369 743 24,884 92,815 - 127,390
At the end of 2012, the share capital consisted of 1,008,620,000 shares of a nominal value of DKK 10 each. All shares carry the same rights; there is thus only one class of shares. For as long as the Danish state holds hybrid capital in Danske Bank, Danske Bank A/S may distribute dividends if such dividends can be paid in full out of the net profit.
STA
TE
ME
NT
OF
CA
PITA
L –
DA
NS
KE
BA
NK
A/S
DANSKE BANK / PARENT COMPANY 2012 165
STATEMENT OF CAPITAL – DANSKE BANK A/S

STATEMENT OF CAPITAL – DANSKE BANK A/S
DANSKE BANK ANNUAL REPORT 2012 118
Holding of own shares, Danske Bank A/S Nominal Sales/purchase Number of value Percentage of price shares (DKK m) share capital (DKK m)
Holding at 1 January 2011 5,503,559 56 0.79
Acquired in 2011 157,129,369 1,571 16.86 16,267 Sold in 2011 160,485,224 1,605 17.22 16,479 Holding at 31 December 2011 2,147,704 22 0.23
Acquired in 2012 209,019,440 2,090 20.72 19,351 Sold in 2012 206,429,103 2,064 20.47 19,101
Holding at 31 December 2012 4,738,041 48 0.47
Acquisitions in 2012 and 2011 comprised shares acquired for the trading portfolio and shares acquired on behalf of customers.
Danske Bank shares held by subsidiares Nominal Sales/purchase Number of value Percentage of price shares (DKK m) share capital (DKK m)
Holding at 1 January 2011 1,509,622 14 0.22
Acquired in 2011 1,787,487 18 0.19 203 Sold in 2011 817,277 8 0.09 117 Holding at 31 December 2011 2,479,832 24 0.27
Acquired in 2012 515,495 5 0.05 48 Sold in 2012 807,949 8 0.08 78
Holding at 31 December 2012 2,187,378 21 0.22
Acquisitions in 2012 and 2011 comprised shares acquired on behalf of customers.
166 DANSKE BANK / PARENT COMPANY 2012
STATEMENT OF CAPITAL – DANSKE BANK A/S

STATEMENT OF CAPITAL – DANSKE BANK A/S
DANSKE BANK ANNUAL REPORT 2012 118
Holding of own shares, Danske Bank A/S Nominal Sales/purchase Number of value Percentage of price shares (DKK m) share capital (DKK m)
Holding at 1 January 2011 5,503,559 56 0.79
Acquired in 2011 157,129,369 1,571 16.86 16,267 Sold in 2011 160,485,224 1,605 17.22 16,479 Holding at 31 December 2011 2,147,704 22 0.23
Acquired in 2012 209,019,440 2,090 20.72 19,351 Sold in 2012 206,429,103 2,064 20.47 19,101
Holding at 31 December 2012 4,738,041 48 0.47
Acquisitions in 2012 and 2011 comprised shares acquired for the trading portfolio and shares acquired on behalf of customers.
Danske Bank shares held by subsidiares Nominal Sales/purchase Number of value Percentage of price shares (DKK m) share capital (DKK m)
Holding at 1 January 2011 1,509,622 14 0.22
Acquired in 2011 1,787,487 18 0.19 203 Sold in 2011 817,277 8 0.09 117 Holding at 31 December 2011 2,479,832 24 0.27
Acquired in 2012 515,495 5 0.05 48 Sold in 2012 807,949 8 0.08 78
Holding at 31 December 2012 2,187,378 21 0.22
Acquisitions in 2012 and 2011 comprised shares acquired on behalf of customers.
STATEMENT OF CAPITAL – DANSKE BANK A/S
(DKK millions) 2012 2011
DANSKE BANK ANNUAL REPORT 2012 119
Capital base and total capital ratio
Shareholders' equity 138,996 127,390 Proposed dividends - - Intangible assets -19,425 -19,399 Deferred tax assets -58 -467 Deferred tax on intangible assets 204 225 Revaluation of domicile property -642 -743 Other statutory deductions -227 -44 Core tier 1 capital 118,848 106,962 Hybrid capital 40,248 40,117 Difference between expected losses and impairment charges - - Statutory deduction for insurance subsidiaries -4,292 -4,175 Other statutory deductions -19 - Tier 1 capital 154,785 142,904 Subordinated debt, excluding hybrid capital 21,124 18,480 Hybrid capital - - Revaluation of domicile property 642 743 Difference between expected losses and impairment charges - - Statutory deduction for insurance subsidiaries -4,292 -4,175 Other statutory deductions -19 - Capital base 172,240 157,952 Risk-weighted assets 616,415 684,852
Core tier 1 capital ratio (%) 19.3 15.6 Tier 1 capital ratio (%) 25.1 20.9 Total capital ratio (%) 27.9 23.1 The total capital and tier 1 capital ratios are calculated in accordance with the Danish Financial Business Act and applicable executive orders.
Risk Management 2012 provides more details about the Group’s solvency need. Risk Management 2012 is not covered by the statutory audit.
STA
TE
ME
NT
OF
CA
PITA
L –
DA
NS
KE
BA
NK
A/S
DANSKE BANK / PARENT COMPANY 2012 167
STATEMENT OF CAPITAL – DANSKE BANK A/S

NOTES – DANSKE BANK A/S
Note (DKK millions) 2012 2011
DANSKE BANK ANNUAL REPORT 2012 120
1 Net interest and fee income and value adjustments broken down by business segment
Banking Activities 22,955 22,649 Danske Markets and Treasury 6,605 3,619 Danske Capital 1,343 1,092 Other -563 -541 Total 30,340 26,819
Geographical segmentation
Denmark 16,734 15,249 Finland 294 284 Ireland 1,151 1,050 Norway 4,564 3,223 UK 469 419 Sweden 6,082 5,524 Baltics 767 756 Germany 177 207 Poland 102 107 Total 30,340 26,819
Geographical segmentation is based on the location in which the individual transaction is recorded. The figures for Denmark include financing costs related to investments in activities outside Denmark.
2 Interest income Reverse transactions with credit institutions and central banks 463 1,191 Other transactions with credit institutions and central banks 1,353 2,718 Reverse loans 2,281 3,530 Loans, advances and other amounts due 28,264 28,921 Bonds 7,828 9,607 Derivatives total 1,257 -470 Currency contracts -2,919 -3,626 Interest rate contracts 4,176 3,156 Other interest income 133 410 Total 41,579 45,907
3 Interest expense
Repo transactions with credit institutions and central banks 1,167 1,303 Other transactions with credit institutions and central banks 1,565 3,301 Repo deposits 1,706 2,452 Deposits and other amounts due 6,942 7,564 Issued bonds 8,065 8,437 Subordinated debt 4,116 4,252 Other interest expenses 174 371 Total 23,735 27,680
4 Fee and commission income
Securities trading and custody account fees 4,755 4,581 Payment services fees 1,402 1,484 Origination fees 1,543 1,404 Guarantee commissions 891 867 Other fees and commissions 1,361 1,404 Total 9,952 9,740
168 DANSKE BANK / PARENT COMPANY 2012
NOTES – DANSKE BANK A/S

NOTES – DANSKE BANK A/S
Note (DKK millions) 2012 2011
DANSKE BANK ANNUAL REPORT 2012 120
1 Net interest and fee income and value adjustments broken down by business segment
Banking Activities 22,955 22,649 Danske Markets and Treasury 6,605 3,619 Danske Capital 1,343 1,092 Other -563 -541 Total 30,340 26,819
Geographical segmentation
Denmark 16,734 15,249 Finland 294 284 Ireland 1,151 1,050 Norway 4,564 3,223 UK 469 419 Sweden 6,082 5,524 Baltics 767 756 Germany 177 207 Poland 102 107 Total 30,340 26,819
Geographical segmentation is based on the location in which the individual transaction is recorded. The figures for Denmark include financing costs related to investments in activities outside Denmark.
2 Interest income Reverse transactions with credit institutions and central banks 463 1,191 Other transactions with credit institutions and central banks 1,353 2,718 Reverse loans 2,281 3,530 Loans, advances and other amounts due 28,264 28,921 Bonds 7,828 9,607 Derivatives total 1,257 -470 Currency contracts -2,919 -3,626 Interest rate contracts 4,176 3,156 Other interest income 133 410 Total 41,579 45,907
3 Interest expense
Repo transactions with credit institutions and central banks 1,167 1,303 Other transactions with credit institutions and central banks 1,565 3,301 Repo deposits 1,706 2,452 Deposits and other amounts due 6,942 7,564 Issued bonds 8,065 8,437 Subordinated debt 4,116 4,252 Other interest expenses 174 371 Total 23,735 27,680
4 Fee and commission income
Securities trading and custody account fees 4,755 4,581 Payment services fees 1,402 1,484 Origination fees 1,543 1,404 Guarantee commissions 891 867 Other fees and commissions 1,361 1,404 Total 9,952 9,740
NOTES – DANSKE BANK A/S
Note (DKK millions) 2012 2011
DANSKE BANK ANNUAL REPORT 2012 121
5 Value adjustments
Loans at fair value 468 620
Bonds 2,903 4,874
Shares etc. 57 148
Investment property -1 -8
Currency 998 1,976
Derivatives 2,395 351
Assets under pooled schemes 5,487 -445
Deposits under pooled schemes -5,500 593
Other liabilities -2,049 -6,618
Total 4,758 1,491
6 Other income Other income includes a refund of excess taxes and duties paid of DKK 5 million (2011: DKK 164 million). 7 Staff costs and administrative expenses Remuneration of the Executive Board and the Board of Directors Executive Board 58 51 Board of Directors 9 9 Total 67 60
The remuneration of the Executive Board includes remuneration for membership of the board of directors of one or more of the Group's subsidiaries. Such remuneration is deducted from the contractual remuneration. Under the Danish Act on State-Funded Capital Injections into Credit Institutions, only 50% of the Executive Board’s salaries is tax deducti-ble until hybrid capital raised has been repaid. In 2012, this deduction amounted to DKK 29 million (2011: DKK 24 million).
Staff costs Salaries 9,244 8,353 Pensions 1,520 1,041 Financial services employer tax and social security costs 1,258 1,188 Total 12,022 10,582 Other administrative expenses 5,462 5,060 Total staff costs and administrative expenses 17,551 15,702 Number of full-time-equivalent staff (avg.) 15,287 15,550 Note 8 of the consolidated financial statements contains additional information about the remuneration of the Board of Directors, the Executive Board, and other material risk takers.
8 Amortisation, depreciation and impairment charges This item includes an impairment charge relating to rights to names of DKK 0.5 billion for 2012. Note 22 of the consolidated financial statements contains additional information.
9 Audit fees
Audit firms appointed by the general meeting
Fees for statutory audit of the parent company financial statements 4 8 Fees for other assurance engagements 1 4 Fees for tax advisory services 3 2 Fees for other services - 8 Total 8 22
NO
TE
S – D
AN
SK
E B
AN
K A
/S
DANSKE BANK / PARENT COMPANY 2012 169
NOTES – DANSKE BANK A/S

NOTES – DANSKE BANK A/S
Note (DKK millions) 2012 2011
DANSKE BANK ANNUAL REPORT 2012 122
10 Tax
Calculated tax charge for the year 389 835 Deferred tax 1,863 657 Adjustment of prior-year tax charges 206 60 Lowering of tax rate -4 6
Total 2,454 1,558
Effective tax rate (%) (%) Danish tax rate 25.0 25.0 Non-taxable income and non-deductible expenses 27.8 118.7 Difference between tax rates of units outside Denmark and Danish tax rate 28.4 116.6 Adjustment of prior-year tax charges 7.1 10.6 Lowering of tax rate 0.2 1.0
Effective tax rate 88.5 271.9 Portion included under Income from associates and group undertakings -53.9 -217.8
Total 34.6 54.1
Tax on other comprehensive income
Hedging of units outside Denmark -94 -54 Fair value adjustment of domicile property -59 8
Total -153 -46
11 Due from credit institutions and central banks On demand 13,964 34,612 Up to 3 months 197,677 171,768 From 3 months to 1 year 1,853 5,894 From 1 to 5 years 2,277 3,637 Over 5 years 1,391 1,475 Total 217,162 217,386 Due from credit institutions 141,121 181,942 Term deposits with central banks 76,041 35,444 Total 217,162 217,386 Reverse transactions included in above item 88,660 125,392
170 DANSKE BANK / PARENT COMPANY 2012
NOTES – DANSKE BANK A/S

NOTES – DANSKE BANK A/S
Note (DKK millions) 2012 2011
DANSKE BANK ANNUAL REPORT 2012 122
10 Tax
Calculated tax charge for the year 389 835 Deferred tax 1,863 657 Adjustment of prior-year tax charges 206 60 Lowering of tax rate -4 6
Total 2,454 1,558
Effective tax rate (%) (%) Danish tax rate 25.0 25.0 Non-taxable income and non-deductible expenses 27.8 118.7 Difference between tax rates of units outside Denmark and Danish tax rate 28.4 116.6 Adjustment of prior-year tax charges 7.1 10.6 Lowering of tax rate 0.2 1.0
Effective tax rate 88.5 271.9 Portion included under Income from associates and group undertakings -53.9 -217.8
Total 34.6 54.1
Tax on other comprehensive income
Hedging of units outside Denmark -94 -54 Fair value adjustment of domicile property -59 8
Total -153 -46
11 Due from credit institutions and central banks On demand 13,964 34,612 Up to 3 months 197,677 171,768 From 3 months to 1 year 1,853 5,894 From 1 to 5 years 2,277 3,637 Over 5 years 1,391 1,475 Total 217,162 217,386 Due from credit institutions 141,121 181,942 Term deposits with central banks 76,041 35,444 Total 217,162 217,386 Reverse transactions included in above item 88,660 125,392
NOTES – DANSKE BANK A/S
Note (DKK millions) 2012 2011
DANSKE BANK ANNUAL REPORT 2012 123
12 Loans, advances and other amounts due at amortised cost On demand 70,392 72,503 Up to 3 months 350,277 282,001 From 3 months to 1 year 138,841 158,495 From 1 to 5 years 104,748 105,507 Over 5 years 293,713 298,695 Total 957,971 917,201 Reverse transactions included in above item 226,897 155,766
Loans, advances and guarantees broken down by sector and industry (%) Public sector 3.1 5.0 Business customers
Agriculture, hunting, forestry and fisheries 1.1 1.6 Manufacturing industries and extraction of raw materials 6.1 8.5 Energy and utilities 1.3 1.2 Building and construction 1.5 2.1 Trade 2.8 4.2 Transport, hotels and restaurants 3.8 4.7 Information and communication 0.7 0.7 Finance and insurance 34.1 25.0 Property administration 11.4 12.2 Other 2.5 3.1 Total business customers 65.3 63.3 Personal customers 31.6 31.7 Total 100.0 100.0
13 Impairment charges for loans, advances and guarantees Loans, advances Loans, advances Other Other and guarantees, and guarantees, amounts due, amounts due, individual collective individual collective impairment impairment impairment impairment Total
Impairment charges at 1 January 2012 34,793 3,405 93 - 38,291 Impairment charges during the year 15,274 1,120 4 - 16,398 Reversals of impairment charges from previous years 17,786 1,869 5 - 19,660 Other changes 454 19 - - 473
Impairment charges at 31 December 2012 32,735 2,675 92 - 35,502
Value adjustment of assets taken over - - - - -
Impairment charges at 1 January 2011 31,537 3,833 86 - 35,456 Impairment charges during the year 15,204 989 7 - 16,200 Reversals of impairment charges from previous years 12,170 1,417 1 - 13,588 Other changes 222 - 1 - 223
Impairment charges at 31 December 2011 34,793 3,405 93 - 38,291
Value adjustment of assets taken over - - - - -
2012 2011 Individual Collective Individual Collective
Total loans, advances and other amounts due,
with objective evidence of impairment before impairment charges. The amount does not include loans, advances and other amounts due recognised at nil 58,426 58,611 194,475
Carrying amount net of impairment charges 30,865 30,767 191,070
125,143
122,468
NO
TE
S – D
AN
SK
E B
AN
K A
/S
DANSKE BANK / PARENT COMPANY 2012 171
NOTES – DANSKE BANK A/S
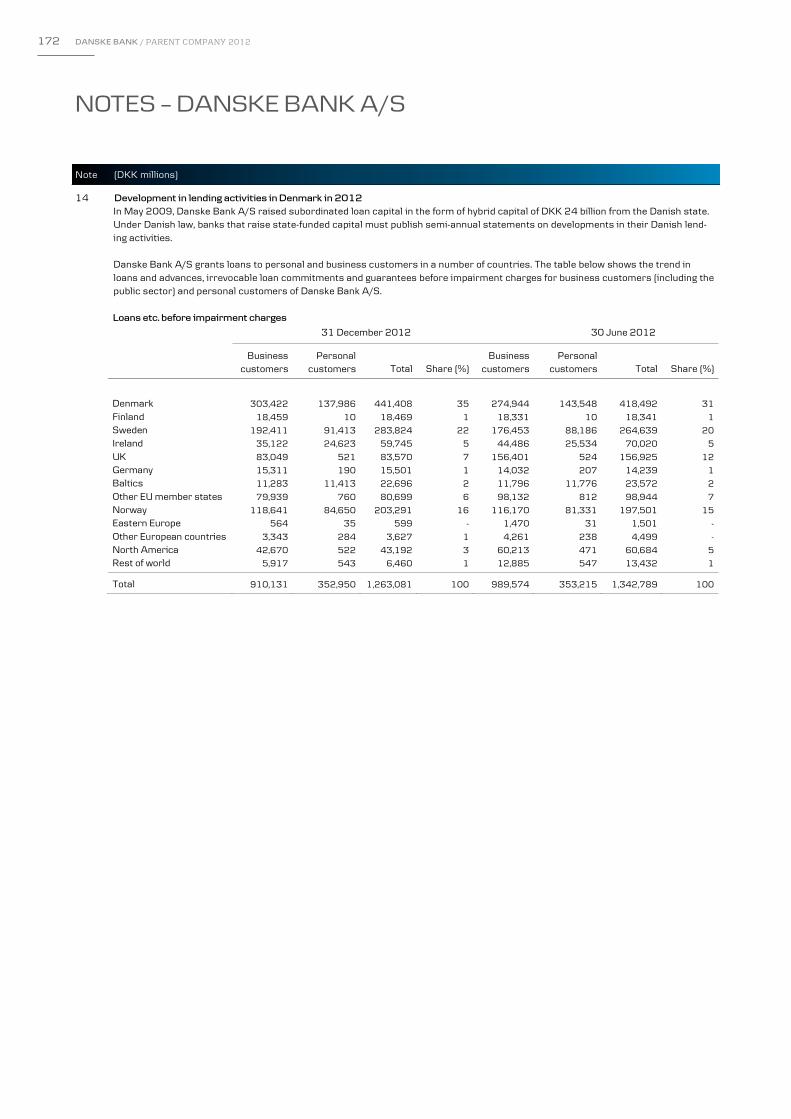
NOTES – DANSKE BANK A/S
Note
DANSKE BANK ANNUAL REPORT 2012 124
14 Development in lending activities in Denmark in 2012 In May 2009, Danske Bank A/S raised subordinated loan capital in the form of hybrid capital of DKK 24 billion from the Danish state. Under Danish law, banks that raise state-funded capital must publish semi-annual statements on developments in their Danish lend-ing activities. Danske Bank A/S grants loans to personal and business customers in a number of countries. The table below shows the trend in loans and advances, irrevocable loan commitments and guarantees before impairment charges for business customers (including the public sector) and personal customers of Danske Bank A/S. Loans etc. before impairment charges 31 December 2012 30 June 2012
Business
customers Personal
customers Total Share (%) Business
customers Personal
customers Total Share (%)
Denmark 303,422 137,986 441,408 35 274,944 143,548 418,492 31 Finland 18,459 10 18,469 1 18,331 10 18,341 1 Sweden 192,411 91,413 283,824 22 176,453 88,186 264,639 20 Ireland 35,122 24,623 59,745 5 44,486 25,534 70,020 5 UK 83,049 521 83,570 7 156,401 524 156,925 12 Germany 15,311 190 15,501 1 14,032 207 14,239 1 Baltics 11,283 11,413 22,696 2 11,796 11,776 23,572 2 Other EU member states 79,939 760 80,699 6 98,132 812 98,944 7 Norway 118,641 84,650 203,291 16 116,170 81,331 197,501 15 Eastern Europe 564 35 599 - 1,470 31 1,501 - Other European countries 3,343 284 3,627 1 4,261 238 4,499 - North America 42,670 522 43,192 3 60,213 471 60,684 5 Rest of world 5,917 543 6,460 1 12,885 547 13,432 1 Total 910,131 352,950 1,263,081 100 989,574 353,215 1,342,789 100
(DKK millions)
172 DANSKE BANK / PARENT COMPANY 2012
NOTES – DANSKE BANK A/S
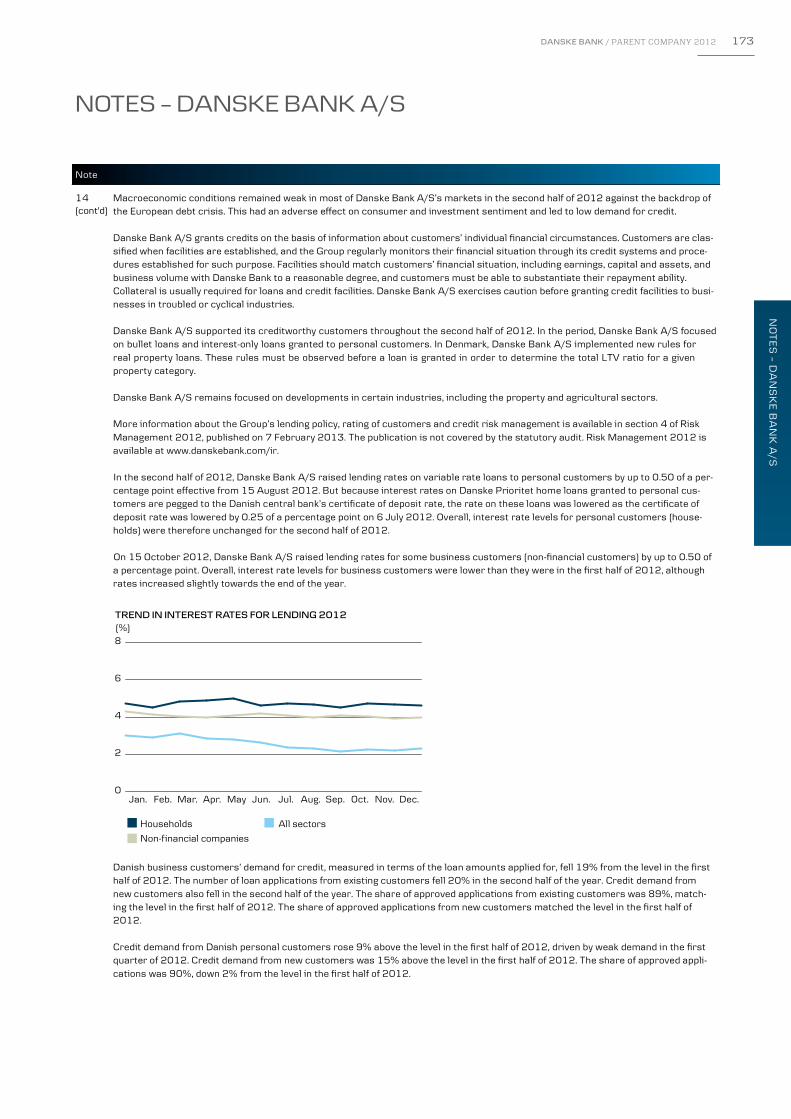
NOTES – DANSKE BANK A/S
Note
DANSKE BANK ANNUAL REPORT 2012 124
14 Development in lending activities in Denmark in 2012 In May 2009, Danske Bank A/S raised subordinated loan capital in the form of hybrid capital of DKK 24 billion from the Danish state. Under Danish law, banks that raise state-funded capital must publish semi-annual statements on developments in their Danish lend-ing activities. Danske Bank A/S grants loans to personal and business customers in a number of countries. The table below shows the trend in loans and advances, irrevocable loan commitments and guarantees before impairment charges for business customers (including the public sector) and personal customers of Danske Bank A/S. Loans etc. before impairment charges 31 December 2012 30 June 2012
Business
customers Personal
customers Total Share (%) Business
customers Personal
customers Total Share (%)
Denmark 303,422 137,986 441,408 35 274,944 143,548 418,492 31 Finland 18,459 10 18,469 1 18,331 10 18,341 1 Sweden 192,411 91,413 283,824 22 176,453 88,186 264,639 20 Ireland 35,122 24,623 59,745 5 44,486 25,534 70,020 5 UK 83,049 521 83,570 7 156,401 524 156,925 12 Germany 15,311 190 15,501 1 14,032 207 14,239 1 Baltics 11,283 11,413 22,696 2 11,796 11,776 23,572 2 Other EU member states 79,939 760 80,699 6 98,132 812 98,944 7 Norway 118,641 84,650 203,291 16 116,170 81,331 197,501 15 Eastern Europe 564 35 599 - 1,470 31 1,501 - Other European countries 3,343 284 3,627 1 4,261 238 4,499 - North America 42,670 522 43,192 3 60,213 471 60,684 5 Rest of world 5,917 543 6,460 1 12,885 547 13,432 1 Total 910,131 352,950 1,263,081 100 989,574 353,215 1,342,789 100
(DKK millions)
NOTES – DANSKE BANK A/S
Note
DANSKE BANK ANNUAL REPORT 2012 125
14 Macroeconomic conditions remained weak in most of Danske Bank A/S’s markets in the second half of 2012 against the backdrop of the European debt crisis. This had an adverse effect on consumer and investment sentiment and led to low demand for credit.
Danske Bank A/S grants credits on the basis of information about customers’ individual financial circumstances. Customers are clas-sified when facilities are established, and the Group regularly monitors their financial situation through its credit systems and proce-dures established for such purpose. Facilities should match customers’ financial situation, including earnings, capital and assets, and business volume with Danske Bank to a reasonable degree, and customers must be able to substantiate their repayment ability.
loans and credit facilities. Danske Bank A/S exercises caution before granting credit facilities to busi-nesses in troubled or cyclical industries. Collateral is usually required for
Danske Bank A/S supported its creditworthy customers throughout the second half of 2012. In the period, Danske Bank A/S focused on bullet loans and interest-only loans granted to personal customers. In Denmark, Danske Bank A/S implemented new rules for
ules must be observed before a loan is granted in order to determine the total LTV ratio for a given
real property loans. These rproperty category. Danske Bank A/S remains focused on developments in certain industries, including the property and agricultural sectors. More information about the Group’s lending policy, rating of customers and credit risk management is available in section 4 of Risk Management 2012, published on 7 February 2013. The publication is not covered by the statutory audit. Risk Management 2012 is available at www.danskebank.com/ir. In the second half of 2012, Danske Bank A/S raised lending rates on variable rate loans to personal customers by up to 0.50 of a per-centage point effective from 15 August 2012. But because interest rates on Danske Prioritet home loans granted to personal cus-tomers are pegged to the Danish central bank’s certificate of deposit rate, the rate on these loans was lowered as the certificate of deposit rate was lowered by 0.25 of a percentage point on 6 July 2012. Overall, interest rate levels for personal customers (house-holds) were therefore unchanged for the second half of 2012. On 15 October 2012, Danske Bank A/S raised lending rates for some business customers (non-financial customers) by up to 0.50 of a percentage point. Overall, interest rate levels for business customers were lower than they were in the first half of 2012, although rates increased slightly towards the end of the year.
Danish business customers’ demand for credit, measured in terms of the loan amounts applied for, fell 19% from the level in the first half of 2012. The number of loan applications from existing customers fell 20% in the second half of the year. Credit demand from new customers also fell in the second half of the year. The share of approved applications from existing customers was 89%, match-ing the level in the first half of 2012. The share of approved applications from new customers matched the level in the first half of 2012. Credit demand from Danish personal customers rose 9% above the level in the first half of 2012, driven by weak demand in the first quarter of 2012. Credit demand from new customers was 15% above the level in the first half of 2012. The share of approved appli-cations was 90%, down 2% from the level in the first half of 2012.
(cont'd)
TREND IN INTEREST RATES FOR LENDING 2012(%)
0
2
4
6
8
Dec.Nov.Oct.Sep.Aug.Jul.Jun.MayApr.Mar.Feb.Jan.
Households All sectors
Non-financial companies
DANSKE BANK / PARENT COMPANY 2012 173
NO
TE
S – D
AN
SK
E B
AN
K A
/S
NOTES – DANSKE BANK A/S

NOTES – DANSKE BANK A/S
Note (DKK millions)
DANSKE BANK ANNUAL REPORT 2012 126
14 The table below shows the trend in loans and advances, irrevocable loan commitments and guarantees before impairment charges (cont’d) for customers of Danske Bank A/S resident in Denmark.
Loans etc. before impairment charges 31 December 2012 30 June 2012
Existing customers New customers Total Total
Public sector 12,807 5 12,812 14,390 Business customers
Agriculture, hunting, forestry and fisheries 9,683 49 9,732 10,771 Manufacturing industries and extraction of raw materials 35,957 209 36,166 38,243 Energy and utilities 6,363 2 6,365 6,695 Building and construction 5,142 234 5,376 5,919 Trade 16,423 95 16,518 17,783 Transport, hotels and restaurants 17,622 190 17,812 19,348 Information and communication 4,492 553 5,045 4,954 Finance and insurance 149,976 80 150,056 114,383 Property administration 20,713 346 21,059 23,306 Other 22,401 80 22,481 19,152 Total business customers 288,772 1,838 290,610 260,554 Personal customers
Mortgages 106,847 2,033 108,880 112,924 Other 28,894 212 29,106 30,624 Total personal customers 135,741 2,245 137,986 143,548 Total 437,320 4,088 441,408 418,492 New customers are customers to whom Danske Bank A/S has not granted loans or other credit facilities in the past 12 months. In compliance with statutory requirements, this lending statement is available as a separate document at www.danskebank.com/ir.
15 Investment and domicile property 2012 2011
Investment Domicile Investment Domicile
property property property property
Fair value/revaluation at 1 January 112 4,130 88 4,073 Additions, including property improvement expenditure 11 3 27 10 Disposals 13 18 3 12 Depreciation charges - 46 - 46 Value adjustment recognised through other comprehensive income - -151 - 76 Value adjustment recognised through profit or loss -1 -223 - - Other changes - -282 - 29 Fair value/revaluation at 31 December 109 3,413 112 4,130
Required rate of return for calculation of fair value/revaluation (% p.a.) 4.8 5.0-10.0 4.8-8.5 5.0-9.0
Fair value and revaluations are assessed by the Group’s valuers.
174 DANSKE BANK / PARENT COMPANY 2012
NOTES – DANSKE BANK A/S
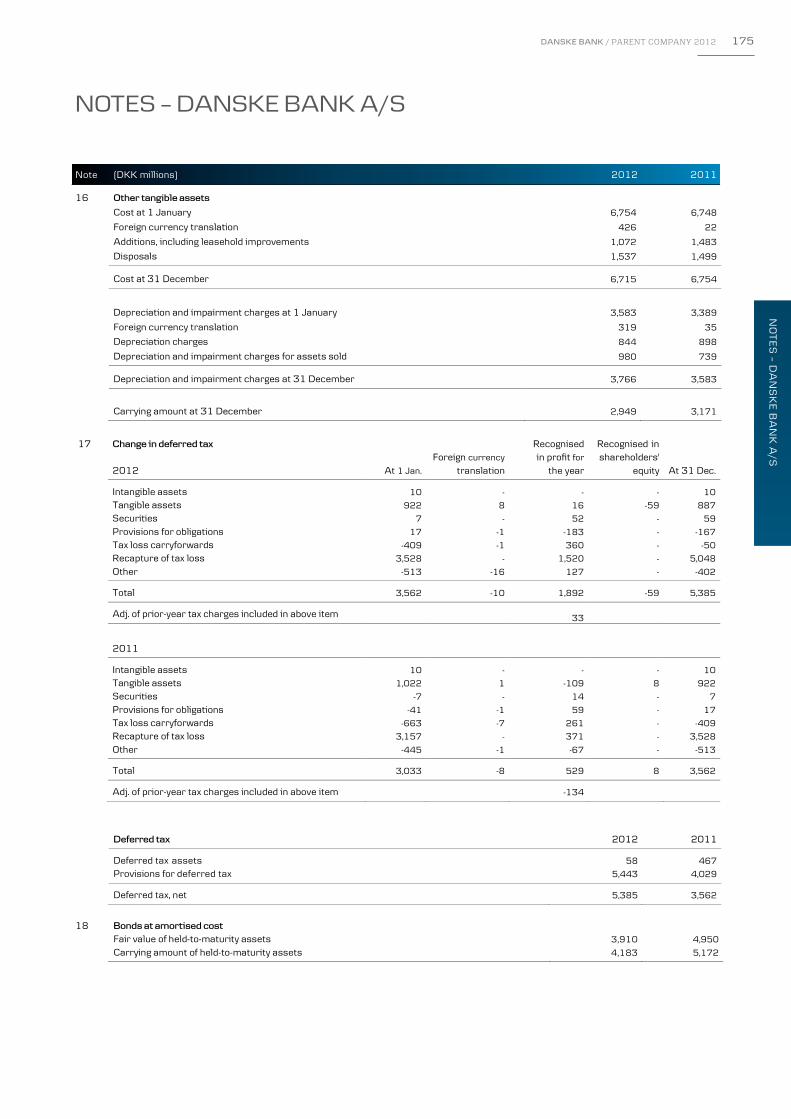
NOTES – DANSKE BANK A/S
Note (DKK millions)
DANSKE BANK ANNUAL REPORT 2012 126
14 The table below shows the trend in loans and advances, irrevocable loan commitments and guarantees before impairment charges (cont’d) for customers of Danske Bank A/S resident in Denmark.
Loans etc. before impairment charges 31 December 2012 30 June 2012
Existing customers New customers Total Total
Public sector 12,807 5 12,812 14,390 Business customers
Agriculture, hunting, forestry and fisheries 9,683 49 9,732 10,771 Manufacturing industries and extraction of raw materials 35,957 209 36,166 38,243 Energy and utilities 6,363 2 6,365 6,695 Building and construction 5,142 234 5,376 5,919 Trade 16,423 95 16,518 17,783 Transport, hotels and restaurants 17,622 190 17,812 19,348 Information and communication 4,492 553 5,045 4,954 Finance and insurance 149,976 80 150,056 114,383 Property administration 20,713 346 21,059 23,306 Other 22,401 80 22,481 19,152 Total business customers 288,772 1,838 290,610 260,554 Personal customers
Mortgages 106,847 2,033 108,880 112,924 Other 28,894 212 29,106 30,624 Total personal customers 135,741 2,245 137,986 143,548 Total 437,320 4,088 441,408 418,492 New customers are customers to whom Danske Bank A/S has not granted loans or other credit facilities in the past 12 months. In compliance with statutory requirements, this lending statement is available as a separate document at www.danskebank.com/ir.
15 Investment and domicile property 2012 2011
Investment Domicile Investment Domicile
property property property property
Fair value/revaluation at 1 January 112 4,130 88 4,073 Additions, including property improvement expenditure 11 3 27 10 Disposals 13 18 3 12 Depreciation charges - 46 - 46 Value adjustment recognised through other comprehensive income - -151 - 76 Value adjustment recognised through profit or loss -1 -223 - - Other changes - -282 - 29 Fair value/revaluation at 31 December 109 3,413 112 4,130
Required rate of return for calculation of fair value/revaluation (% p.a.) 4.8 5.0-10.0 4.8-8.5 5.0-9.0
Fair value and revaluations are assessed by the Group’s valuers.
NOTES – DANSKE BANK A/S
Note (DKK millions) 2012 2011
DANSKE BANK ANNUAL REPORT 2012 127
16 Other tangible assets Cost at 1 January 6,754 6,748 Foreign currency translation 426 22 Additions, including leasehold improvements 1,072 1,483 Disposals 1,537 1,499
Cost at 31 December 6,715 6,754
Depreciation and impairment charges at 1 January 3,583 3,389 Foreign currency translation 319 35 Depreciation charges 844 898 Depreciation and impairment charges for assets sold 980 739
Depreciation and impairment charges at 31 December 3,766 3,583
Carrying amount at 31 December 2,949 3,171
17 Change in deferred tax Recognised Recognised in
Foreign currency in profit for shareholders'
2012 At 1 Jan. translation the year equity At 31 Dec.
Intangible assets 10 - - - 10 Tangible assets 922 8 16 -59 887 Securities 7 - 52 - 59 Provisions for obligations 17 -1 -183 - -167 Tax loss carryforwards -409 -1 360 - -50 Recapture of tax loss 3,528 - 1,520 - 5,048 Other -513 -16 127 - -402 Total 3,562 -10 1,892 -59 5,385 Adj. of prior-year tax charges included in above item 33 2011
Intangible assets 10 - - - 10 Tangible assets 1,022 1 -109 8 922 Securities -7 - 14 - 7 Provisions for obligations -41 -1 59 - 17 Tax loss carryforwards -663 -7 261 - -409 Recapture of tax loss 3,157 - 371 - 3,528 Other -445 -1 -67 - -513
Total 3,033 -8 529 8 3,562
Adj. of prior-year tax charges included in above item -134
Deferred tax 2012 2011
Deferred tax assets 58 467 Provisions for deferred tax 5,443 4,029
Deferred tax, net 5,385 3,562 18 Bonds at amortised cost Fair value of held-to-maturity assets 3,910 4,950
Carrying amount of held-to-maturity assets 4,183 5,172
DANSKE BANK / PARENT COMPANY 2012 175
NO
TE
S – D
AN
SK
E B
AN
K A
/S
NOTES – DANSKE BANK A/S

NOTES – DANSKE BANK A/S
Note (DKK millions) 2012 2011
DANSKE BANK ANNUAL REPORT 2012 128
19 Assets under pooled schemes Bonds at fair value 19,276 21,651 Shares 8,188 4,866 Unit trust certificates 21,541 17,218 Cash deposits etc. 665 935
Total assets before elimination 49,670 44,670 Own shares 134 117 Other internal balances 793 1,050
Total 48,743 43,503
20 Other assets
Positive fair value of derivatives 406,687 549,887 Other assets 11,526 15,756
Total 418,213 565,643
21 Due to credit institutions and central banks On demand 34,468 74,274 Up to 3 months 369,918 364,790 From 3 months to 1 year 18,379 2,071 From 1 to 5 years 76,575 11,944 Over 5 years 559 238 Total 499,899 453,317
Repo transactions included in above item 249,061 252,617 22 Deposits and other amounts due On demand 438,099 425,534 Term deposits 8,900 3,379 Time deposits 150,457 181,031 Repo deposits 140,585 53,719 Special deposits 23,276 22,209 Total 761,317 685,872
On demand 438,099 425,534 Up to 3 months 267,041 198,589 From 3 months to 1 year 27,470 25,636 From 1 to 5 years 18,378 26,135 Over 5 years 10,329 9,978 Total 761,317 685,872 23 Issued bonds at amortised cost
On demand - - Up to 3 months 32,057 75,731 From 3 months to 1 year 40,972 63,887 From 1 to 5 years 171,283 124,611 Over 5 years 28,911 62,500 Total 273,223 326,729 24 Other liabilities Negative fair value of derivatives 389,849 534,011 Other liabilities 168,982 183,920 Total 558,831 717,931
176 DANSKE BANK / PARENT COMPANY 2012
NOTES – DANSKE BANK A/S

NOTES – DANSKE BANK A/S
Note (DKK millions) 2012 2011
DANSKE BANK ANNUAL REPORT 2012 128
19 Assets under pooled schemes Bonds at fair value 19,276 21,651 Shares 8,188 4,866 Unit trust certificates 21,541 17,218 Cash deposits etc. 665 935
Total assets before elimination 49,670 44,670 Own shares 134 117 Other internal balances 793 1,050
Total 48,743 43,503
20 Other assets
Positive fair value of derivatives 406,687 549,887 Other assets 11,526 15,756
Total 418,213 565,643
21 Due to credit institutions and central banks On demand 34,468 74,274 Up to 3 months 369,918 364,790 From 3 months to 1 year 18,379 2,071 From 1 to 5 years 76,575 11,944 Over 5 years 559 238 Total 499,899 453,317
Repo transactions included in above item 249,061 252,617 22 Deposits and other amounts due On demand 438,099 425,534 Term deposits 8,900 3,379 Time deposits 150,457 181,031 Repo deposits 140,585 53,719 Special deposits 23,276 22,209 Total 761,317 685,872
On demand 438,099 425,534 Up to 3 months 267,041 198,589 From 3 months to 1 year 27,470 25,636 From 1 to 5 years 18,378 26,135 Over 5 years 10,329 9,978 Total 761,317 685,872 23 Issued bonds at amortised cost
On demand - - Up to 3 months 32,057 75,731 From 3 months to 1 year 40,972 63,887 From 1 to 5 years 171,283 124,611 Over 5 years 28,911 62,500 Total 273,223 326,729 24 Other liabilities Negative fair value of derivatives 389,849 534,011 Other liabilities 168,982 183,920 Total 558,831 717,931
NOTES – DANSKE BANK A/S
Note
DANSKE BANK ANNUAL REPORT 2012 129
25 Subordinated debt Subordinated debt consists of liabilities in the form of subordinated loan capital and hybrid capital, which, in the event of Danske Bank’s voluntary or compulsory winding-up, will not be repaid until the claims of ordinary creditors have been met. Hybrid capital ranks below subordinated loan capital. Early redemption of subordinated debt must be approved by the Danish FSA. Subordinated debt is included in the capital base in accordance with section 128 of the Danish Financial Business Act.
Nominal Interest Year of Redemption 2012 2011 Currency (millions) rate issue Maturity price (DKK m) (DKK m)
Redeemed loans 2,974 EUR 500 4.250 2003 20.06.2016 100 3,730 3,717 GBP 350 5.375 2003 29.09.2021 100 3,196 3,115
EUR 700 4.100 2005 16.03.2018 100 5,222 5,204
EUR 500 6.000 2007 20.03.2016 100 3,730 3,717
USD 1,000 7.125 2012 21.09.2037 100 5,659 -
Subordinated debt, excluding hybrid capital 21,537 18,727
Hybrid capital
Hybrid capital included under the 15% of tier 1 capital limit
USD 750 5.914 2004 Perpetual 100 4,244 4,309
GBP 150 5.563 2005 Perpetual 100 1,370 1,335
GBP 500 5.684 2006 Perpetual 100 4,567 4,450
EUR 600 4.878 2007 Perpetual 100 4,476 4,461
SEK 1,350 var. 2007 Perpetual 100 1,176 1,126
SEK 650 5.119 2007 Perpetual 100 566 542
Hybrid capital included under the 35% of tier 1 capital limit
DKK 23,992 9.265 2009 Perpetual 100 23,992 23,992
Total hybrid capital 40,391 40,215
Nominal subordinated debt 61,928 58,942
Fair value hedging of interest rate risk 4,067 4,679
Own holding of subordinated debt -149 -380
Total subordinated debt 65,846 63,241
Interest on subordinated debt and related items
Interest 4,116 4,252
Extraordinary repayments 2,974 6,392
Origination and redemption costs 13 -
Amount included in capital base at 31 December 61,372 58,597
Note 31 of the consolidated financial statements contains additional information about subordinated debt and contractual terms.
DANSKE BANK / PARENT COMPANY 2012 177
NO
TE
S – D
AN
SK
E B
AN
K A
/S
NOTES – DANSKE BANK A/S

NOTES – DANSKE BANK A/S
Note (DKK millions) 2012 2011
DANSKE BANK ANNUAL REPORT 2012 130
26 Assets deposited as collateral
At the end of 2012, Danske Bank A/S had deposited securities worth DKK 52,348 million as collateral with Danish and international clearing centres and other institutions (31 December 2011: DKK 38,166 million). In addition, the Group had deposited own bonds worth DKK 2,365 million (31 December 2011: DKK 7,440 million). The amount has been eliminated in the balance sheet. In repo transactions, which involve selling securities to be repurchased at a later date, the securities remain in the balance sheet, and the amounts received are recognised as deposits. Repo transaction securities are treated as assets provided as collateral for liabili-ties. Counterparties are entitled to sell the securities or deposit them as collateral for other loans.
Assets sold in repo transactions Bonds at fair value 357,662 290,450
Shares etc. - -
Total 357,662 290,450 Total collateral deposited for subsidiaries 1,471 607
In addition, the Group had deposited own bonds worth DKK 28,189 million as collateral for repo transactions and securities lending (31 December 2011: DKK 14,295 million). The amount has been eliminated in the balance sheet.
At the end of 2012, Danske Bank A/S had provided cash and securities worth DKK 84,659 million as collateral for derivatives trans-actions (31 December 2011: DKK 68,463 million).
Danske Bank A/S had registered loans and advances worth DKK 225,139 million and other assets worth DKK 6,491 million as col-lateral for covered bonds at the end of 2012 (31 December 2011: DKK 172,325 million and DKK 8,108 million, respectively).
27 Contingent liabilities The Group uses a variety of loan-related financial instruments to meet the financial requirements of its customers. These include loan offers and other credit facilities, guarantees and instruments that are not recognised in the balance sheet.
Guarantees and other liabilities Guarantees etc.
Financial guarantees 9,713 6,958 Mortgage finance guarantees 51,936 50,379 Registration and remortgaging guarantees 7,520 9,478 Other guarantees 57,869 90,773 Total 127,038 157,588
Other liabilities
Irrevocable loan commitments shorter than 1 year 47,005 59,140 Irrevocable loan commitments longer than 1 year 95,657 93,656 Other obligations 386 495 Total 143,048 153,291 In addition to credit exposure from lending activities, loan offers made and revocable credit facilities granted by the Group amounted to DKK 449,969 million (2011: DKK 445,043 million). These items are included in the calculation of risk-weighted assets in accor-dance with the Capital Requirements Directive. Owing to its business volume, Danske Bank is continually a party to various lawsuits and disputes. In view of its size, Danske Bank does not expect the outcomes of pending lawsuits and disputes to have any material effect on its financial position. A limited number of employees are employed under terms which grant them, if they are dismissed before reaching their normal re-tirement age, an extraordinary severance and/or pension payment in excess of their entitlement under ordinary terms of employment. As the sponsoring employer, Danske Bank is also liable for the pension obligations of a number of company pension funds.
178 DANSKE BANK / PARENT COMPANY 2012
NOTES – DANSKE BANK A/S

NOTES – DANSKE BANK A/S
Note (DKK millions) 2012 2011
DANSKE BANK ANNUAL REPORT 2012 130
26 Assets deposited as collateral
At the end of 2012, Danske Bank A/S had deposited securities worth DKK 52,348 million as collateral with Danish and international clearing centres and other institutions (31 December 2011: DKK 38,166 million). In addition, the Group had deposited own bonds worth DKK 2,365 million (31 December 2011: DKK 7,440 million). The amount has been eliminated in the balance sheet. In repo transactions, which involve selling securities to be repurchased at a later date, the securities remain in the balance sheet, and the amounts received are recognised as deposits. Repo transaction securities are treated as assets provided as collateral for liabili-ties. Counterparties are entitled to sell the securities or deposit them as collateral for other loans.
Assets sold in repo transactions Bonds at fair value 357,662 290,450
Shares etc. - -
Total 357,662 290,450 Total collateral deposited for subsidiaries 1,471 607
In addition, the Group had deposited own bonds worth DKK 28,189 million as collateral for repo transactions and securities lending (31 December 2011: DKK 14,295 million). The amount has been eliminated in the balance sheet.
At the end of 2012, Danske Bank A/S had provided cash and securities worth DKK 84,659 million as collateral for derivatives trans-actions (31 December 2011: DKK 68,463 million).
Danske Bank A/S had registered loans and advances worth DKK 225,139 million and other assets worth DKK 6,491 million as col-lateral for covered bonds at the end of 2012 (31 December 2011: DKK 172,325 million and DKK 8,108 million, respectively).
27 Contingent liabilities The Group uses a variety of loan-related financial instruments to meet the financial requirements of its customers. These include loan offers and other credit facilities, guarantees and instruments that are not recognised in the balance sheet.
Guarantees and other liabilities Guarantees etc.
Financial guarantees 9,713 6,958 Mortgage finance guarantees 51,936 50,379 Registration and remortgaging guarantees 7,520 9,478 Other guarantees 57,869 90,773 Total 127,038 157,588
Other liabilities
Irrevocable loan commitments shorter than 1 year 47,005 59,140 Irrevocable loan commitments longer than 1 year 95,657 93,656 Other obligations 386 495 Total 143,048 153,291 In addition to credit exposure from lending activities, loan offers made and revocable credit facilities granted by the Group amounted to DKK 449,969 million (2011: DKK 445,043 million). These items are included in the calculation of risk-weighted assets in accor-dance with the Capital Requirements Directive. Owing to its business volume, Danske Bank is continually a party to various lawsuits and disputes. In view of its size, Danske Bank does not expect the outcomes of pending lawsuits and disputes to have any material effect on its financial position. A limited number of employees are employed under terms which grant them, if they are dismissed before reaching their normal re-tirement age, an extraordinary severance and/or pension payment in excess of their entitlement under ordinary terms of employment. As the sponsoring employer, Danske Bank is also liable for the pension obligations of a number of company pension funds.
NOTES – DANSKE BANK A/S
Note (DKK millions)
DANSKE BANK ANNUAL REPORT 2012 131
28 Related parties
Parties with Group Board of significant influence Associates undertakings Directors Executive Board
2012 2011 2012 2011 2012 2011 2012 2011 2012 2011
Loans and irrevocable loan commitments 6,041 6,104 1,092 1,217 42,105 57,149 12 14 2 5
Securities and derivatives 1,041 1,161 8,088 4,918 175,769 217,076 - - - -
Deposits 2,175 2,198 429 248 66,506 76,794 20 40 12 30
Derivatives 183 57 1,700 1,612 8,203 5,811 - - - -
Issued bonds - - - - 1,018 28,774 - - - -
Pension obligation - - - - - - - - - 90
Guarantees issued 965 1,470 66 7 51,819 77,914 - - - 4
Guarantees and collateral received 428 463 4,583 295 1,186 1,719 11 1 2 5
Interest income 78 71 62 86 2,002 3,574 - - - -
Interest expense 86 192 43 188 1,105 194 - - - -
Fee income 7 6 3 2 25 22 - - - -
Dividend income 2 6 61 49 3,903 3,101 - - - -
Other income 4 12 - 1 7 6 - - - - Loan impairment charges - - 1 1 - - - - - -
Trade in Danske Bank shares
Acquisitions 1,633 4,646 - - - - 2 5 2 7
Sales - - - - - - - 0 0 0
Related parties with significant influence include shareholders with holdings exceeding 20% of Danske Bank A/S’s share capital. The A.P. Møller and Chastine Mc-Kinney Møller Foundation and companies of A.P. Moller – Maersk A/S, Copenhagen, hold 22.84% of the share capital. Note 21 of the consolidated financial statements lists holdings in associates. The consolidated financial statements specify group holdings under Group holdings and undertakings. The Board of Directors and Executive Board columns list the personal facilities, deposits, etc. held by members of the Board of Directors and the Executive Board and their dependants, and facilities with businesses in which these parties have a controlling or significant influence.
In 2012, the average interest rates on credit facilities granted to members of the Board of Directors and the Executive Board were 1.9% (2011: 2.2%) and 1.9% (2011: 2.4%), respectively. Notes 8 and 41 of the consolidated financial statements specify the remu-neration and shareholdings of management. Pension funds set up for the purpose of paying out pension benefits to employees of Danske Bank A/S are also considered related par-ties. In 2012, transactions with these funds comprised loans and advances in the amount of DKK 3 million (2011: DKK 3 million), de-posits in the amount of DKK 130 million (2011: DKK 121 million), derivatives with a positive fair value of DKK 0 million (2011: DKK 0 million), derivatives with a negative fair value of DKK 460 million (2011: DKK 581 million), interest expenses of DKK 3 million (2011: DKK 3 million), and pension contributions of DKK 89 million (2011: DKK 284 million). Danske Bank A/S acts as the bank of a number of its related parties. Payment services, trading in securities and other instruments, depositing of surplus liquidity, and provision of short- and long-term financing are the primary services provided by Danske Bank A/S. In addition, Danske Bank A/S and group undertakings receive interest on holdings, if any, of listed bonds issued by Realkredit Danmark A/S. Note 18 of the consolidated financial statements specifies the Group’s holdings of own mortgage bonds. Danske Bank A/S handles a number of administrative functions, such as IT operations and development, HR management, purchases and marketing activities for group undertakings. Danske Bank A/S received a total fee of DKK 1,498 million for services provided in 2012 (2011: DKK 1,619 million). The figures above do not include debt to related parties in the form of issued notes or bonds. Such notes or bonds are bearer securi-ties, which means that Danske Bank does not know the identity of the holders. Danske Bank shares may be registered by name. Re-lated parties’ holdings of Danske Bank shares equalling 5% or more of Danske Bank’s share capital are determined on the basis of the most recent reporting of holdings to Danske Bank. Transactions with related parties are settled on an arm’s-length basis, whereas transactions with group undertakings are settled on a cost-reimbursement basis.
DANSKE BANK / PARENT COMPANY 2012 179
NO
TE
S – D
AN
SK
E B
AN
K A
/S
NOTES – DANSKE BANK A/S
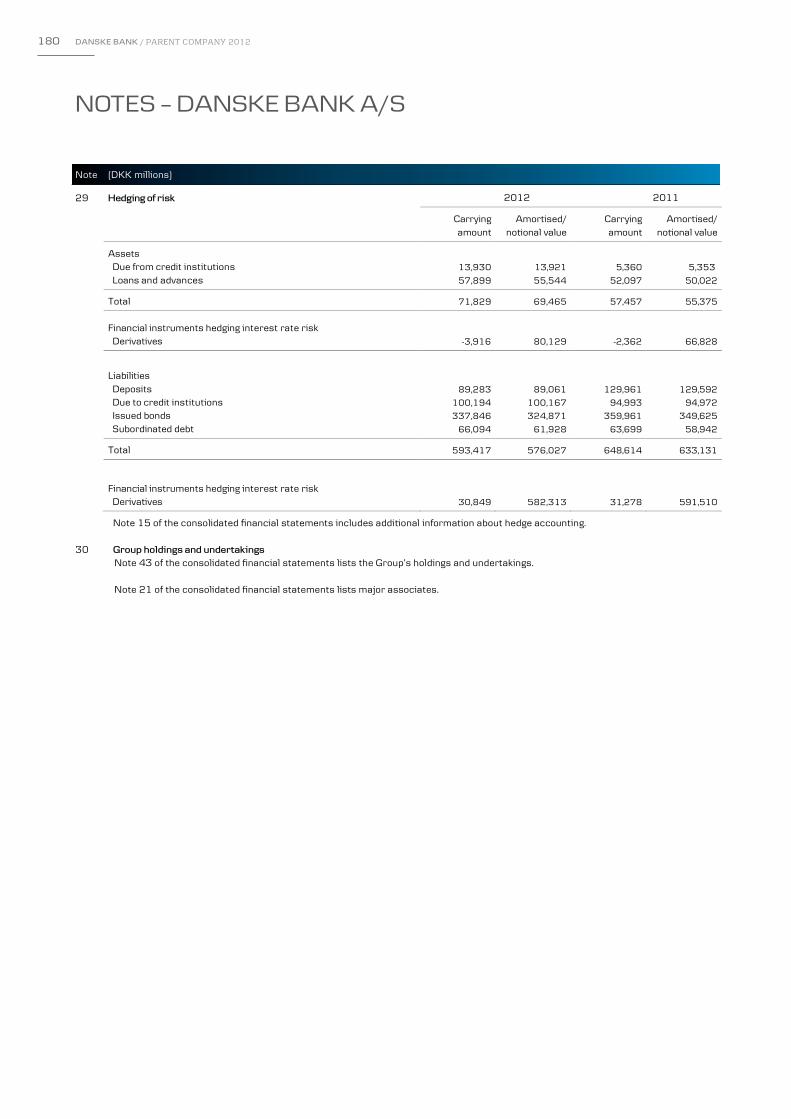
NOTES – DANSKE BANK A/S
Note (DKK millions)
DANSKE BANK ANNUAL REPORT 2012 132
29 Hedging of risk 2012 2011
Carrying Amortised/ Carrying Amortised/ amount notional value amount notional value
Assets
Due from credit institutions 13,930 13,921 5,360 5,353
Loans and advances 57,899 55,544 52,097 50,022
Total 71,829 69,465 57,457 55,375
Financial instruments hedging interest rate risk Derivatives -3,916 80,129 -2,362 66,828
Liabilities
Deposits 89,283 89,061 129,961 129,592
Due to credit institutions 100,194 100,167 94,993 94,972
Issued bonds 337,846 324,871 359,961 349,625
Subordinated debt 66,094 61,928 63,699 58,942
Total 593,417 576,027 648,614 633,131
Financial instruments hedging interest rate risk Derivatives 30,849 582,313 31,278 591,510
Note 15 of the consolidated financial statements includes additional information about hedge accounting.
30 Group holdings and undertakings Note 43 of the consolidated financial statements lists the Group’s holdings and undertakings. Note 21 of the consolidated financial statements lists major associates.
180 DANSKE BANK / PARENT COMPANY 2012
NOTES – DANSKE BANK A/S

NOTES – DANSKE BANK A/S
Note (DKK millions)
DANSKE BANK ANNUAL REPORT 2012 132
29 Hedging of risk 2012 2011
Carrying Amortised/ Carrying Amortised/ amount notional value amount notional value
Assets
Due from credit institutions 13,930 13,921 5,360 5,353
Loans and advances 57,899 55,544 52,097 50,022
Total 71,829 69,465 57,457 55,375
Financial instruments hedging interest rate risk Derivatives -3,916 80,129 -2,362 66,828
Liabilities
Deposits 89,283 89,061 129,961 129,592
Due to credit institutions 100,194 100,167 94,993 94,972
Issued bonds 337,846 324,871 359,961 349,625
Subordinated debt 66,094 61,928 63,699 58,942
Total 593,417 576,027 648,614 633,131
Financial instruments hedging interest rate risk Derivatives 30,849 582,313 31,278 591,510
Note 15 of the consolidated financial statements includes additional information about hedge accounting.
30 Group holdings and undertakings Note 43 of the consolidated financial statements lists the Group’s holdings and undertakings. Note 21 of the consolidated financial statements lists major associates.
NOTES – DANSKE BANK A/S
(DKK millions) 2012 2011 2010 2009 2008 2010
DANSKE BANK ANNUAL REPORT 2012 133
HIGHLIGHTS
Net interest and fee income 25,582 25,328 28,049 35,645 28,507 Value adjustments 4,758 1,491 1,102 5,347 -3,774 Staff costs and administrative expenses 17,551 15,702 14,625 15,723 15,438 Loan impairment charges etc. 9,308 9,725 11,390 21,118 10,265 Income from associates and group undertakings 4,315 2,309 4,699 3,211 3,889 Net profit for the year 4,632 1,324 4,361 1,001 -448 Loans and advances 957,971 917,201 938,839 920,557 1,120,719 Shareholders' equity 138,996 127,390 105,956 101,094 100,013 Total assets 2,357,358 2,426,635 2,227,331 2,188,762 2,678,868 RATIOS AND KEY FIGURES Total capital ratio (%) 27.9 23.1 21.9 21.3 15.3 Tier 1 capital ratio (%) 25.1 20.9 18.5 17.2 11.1 Return on equity before tax (%) 5.3 2.5 5.9 2.8 -0.9 Return on equity after tax (%) 3.5 1.1 4.2 1.0 -0.4 Cost/income ratio (DKK) 1.24 1.10 1.20 1.06 0.97 Interest rate risk (%) 0.1 0.4 - 0.7 2.5 Foreign exchange position (%) 2.1 2.5 3.7 2.9 3.3 Foreign exchange risk (%) - - - - 0.1 Loans and advances plus impairment charges as % of deposits 122.3 130.6 130.9 126.2 147.9 Gearing of loans and advances (%) 6.9 7.2 8.9 9.1 11.2 Growth in loans and advances (%) 4.4 -2.3 2.0 -17.9 - Surplus liquidity in relation to statutory liquidity requirement (%) 166.5 107.4 144.6 138.3 66.3 Sum of large exposures as % of capital base 11.8 32.6 46.7 22.8 98.2 Funding ratio 0.7 0.7 0.7 0.7 0.9 Lending growth (year-on-year) -4.0 -1.2 -0.5 -12.7 6.4 Real property exposure 12 13 12 12 10 Impairment ratio (%) 0.8 0.9 0.8 1.6 0.7 Earnings per share (DKK) 4.8 1.6 6.3 1.5 -6.5 Book value per share (DKK) 138.5 137.0 152.8 146.0 144.5 Proposed dividend per share (DKK) - - - - - Share price at 31 December/earnings per share (DKK) 20.0 44.7 22.7 81.6 -8.0 Share price at 31 December/book value per share (DKK) 0.69 0.53 0.94 0.81 0.36 The ratios are defined by the Danish FSA in, for example, its Executive Order on Financial Reports for Credit Institutions and Investment Com-panies, etc. Share ratios have not been adjusted to reflect the share capital increase in April 2011.
DANSKE BANK / PARENT COMPANY 2012 181
NO
TE
S – D
AN
SK
E B
AN
K A
/S
NOTES – DANSKE BANK A/S
182 DANSKE BANK / ANNUAL REPORT 2012
The Board of Directors and the Executive Board (the management) have considered and approved the annual report of Danske Bank A/S for the financial year 2012.
The consolidated financial statements have been prepared in accordance with the International Financial Reporting Standards as adopted by the EU, and the Parent Company financial statements have been prepared in accordance with the Danish Financial Business Act. Furthermore, the annual report has been prepared in accordance with Danish disclosure requirements for annual reports of listed financial institutions.
In our opinion, the consolidated financial statements and the Parent Company financial statements give a true and fair view of the Group’s and the Parent Company’s assets, liabilities, shareholders’ equity and financial position at 31 December 2012 and of the results of the Group’s and the Parent Company’s operations and the consolidated cash flows for the financial year 2012. Moreover, in our opinion, the management’s report includes a fair review of developments in the Group’s and the Parent Company’s operations and financial position and describes the significant risks and uncertainty factors that may affect the Group and the Parent Company.
The management will submit the annual report to the general meeting for approval.
Copenhagen, 7 February 2013
STATEMENT BY THE MANAGEMENT
BOARD OF DIRECTORS
Ole AndersenChairman
Niels B. ChristiansenVice Chairman
Urban Bäckström
Michael Fairey Mats Jansson Jørn P. Jensen
Majken Schultz Trond Ø. Westlie Susanne Arboe
Helle Brøndum Carsten Eilertsen Charlotte Hoffmann
Per Alling Toubro
EXECUTIVE BOARD
Eivind KoldingChairman
Tonny Thierry Andersen Thomas F. Borgen Robert Endersby
Lars Mørch Henrik Ramlau-Hansen

DANSKE BANK / ANNUAL REPORT 2012 183
INTERNAL AUDIT’S REPORT We have audited the consolidated financial statements, pp. 48-160, and the Parent Company financial statements of Danske Bank A/S, pp. 161-181, for the financial year 2012. The consolidated financial statements and the Parent Company financial statements comprise the income statement, statement of comprehensive income, balance sheet, statement of capital and notes for the Group as well as for the Parent Company and the consolidated cash flow statement. The consolidated financial statements have been prepared in accordance with the International Financial Reporting Standards as adopted by the EU, and the Parent Company financial statements have been prepared in accordance with the Danish Financial Business Act. Furthermore, the consolidated financial statements and the Parent Company financial statements have been prepared in accordance with Danish disclosure requirements for listed financial institutions.
Basis of opinionWe conducted our audit in accordance with the Danish Financial Supervisory Authority’s Executive Order on Auditing Financial Undertakings etc. as well as Financial Groups and in accordance with International Standards on Auditing. This requires that we plan and perform the audit to obtain reasonable assurance as to whether the consolidated financial statements and the Parent Company financial statements are free from material misstatement.
We planned and conducted our audit such that we have assessed the business and internal control procedures, including the risk and capital management implemented by the management, aimed at the Group’s and the Parent Company’s reporting processes and major business risks.
An audit involves performing procedures to obtain audit evidence about the amounts and disclosures in the consolidated financial statements and the Parent Company financial statements. The procedures selected depend on the auditor’s judgment, including the assessment of the risks of material misstatement of the consolidated financial statements and the Parent Company financial statements, whether due to fraud or error. In making those risk assessments, the auditor considers internal control relevant to the preparation of consolidated financial statements and Parent Company financial statements that give a true and fair view in order to design procedures that are appropriate in the circumstances. An audit also includes evaluating the appropriateness of accounting policies used and the reasonableness of accounting estimates made by the management, as well as evaluating the overall presentation of the consolidated financial statements and the Parent Company financial statements.
We believe that the audit evidence we have obtained is sufficient and appropriate to provide a basis for our audit opinion.
Our audit did not result in any qualification.
OpinionIn our opinion, the consolidated financial statements and the Parent Company financial statements give a true and fair view of the Group’s and the Parent Company’s assets, liabilities, shareholders’ equity and financial position at 31 December 2012 and of the results of the Group’s and the Parent Company’s operations and consolidated cash flows for the financial year 2012 in accordance with the International Financial Reporting Standards as adopted by the EU in respect of the consolidated financial statements, in accordance with the Danish Financial Business Act in respect of the Parent Company financial statements, and in accordance with Danish disclosure requirements for listed financial institutions.
Furthermore, we believe that the business and internal control procedures, including the risk and capital management implemented by the management, aimed at the Group’s and the Parent Company’s reporting processes and major business risks, operate effectively.
Copenhagen, 7 February 2013
Jens Peter ThomassenGroup Chief Auditor
AUDITORS’ REPORTS
STA
TE
ME
NT
AN
D R
EP
OR
TS

184 DANSKE BANK / ANNUAL REPORT 2012
INDEPENDENT AUDITORS’ REPORT To the shareholders of Danske Bank A/S
Independent auditors’ report on the consolidated financial statements and the Parent Company financial statements We have audited the consolidated financial statements, pp. 48-160, and the Parent Company financial statements of Danske Bank A/S, pp. 161-181, for the financial year 2012. The consolidated financial statements and the Par-ent Company financial statements comprise the income statement, statement of comprehensive income, balance sheet, statement of capital and notes for the Group as well as for the Parent Company and the consolidated cash flow statement. The consolidated financial statements have been prepared in accordance with the International Financial Reporting Standards as adopted by the EU, and the Parent Company financial statements have been prepared in accordance with the Danish Financial Business Act. Furthermore, the consolidated financial state-ments and the Parent Company financial statements have been prepared in accordance with Danish disclosure requirements for listed financial institutions.
Management’s responsibility for the consolidated financial statements and the Parent Company financial statements Management is responsible for preparing consolidated financial statements and Parent Company financial statements that give a true and fair view in accordance with the International Financial Reporting Standards as adopted by the EU (the consolidated financial statements), the Danish Financial Business Act (the Parent Compa-ny financial statements) and Danish disclosure requirements for listed financial institutions and for such internal control that management determines is necessary to enable the preparation of consolidated financial statements and Parent Company financial statements that are free from material misstatement, whether due to fraud or error.
Auditors’ responsibilityOur responsibility is to express an opinion on the consolidated financial statements and the Parent Company financial statements based on our audit. We conducted our audit in accordance with International Standards on Auditing and additional requirements under Danish audit regulation. This requires that we comply with ethi-cal requirements and plan and perform the audit to obtain reasonable assurance as to whether the consolidated financial statements and the Parent Company financial statements are free from material misstatement.
An audit involves performing procedures to obtain audit evidence about the amounts and disclosures in the consolidated financial statements and the Parent Company financial statements. The procedures selected depend on the auditor’s judgment, including the assessment of the risks of material misstatement of the consolidated financial statements and the Parent Company financial statements, whether due to fraud or error. In making those risk assessments, the auditor considers internal control relevant to the preparation of the consolidated financial statements and the Parent Company financial statements that give a true and fair view in order to design proce-dures that are appropriate in the circumstances, but not for the purpose of expressing an opinion on the effective-ness of internal control. An audit also includes evaluating the appropriateness of accounting policies used and the reasonableness of accounting estimates made by the management, as well as evaluating the overall presentation of the consolidated financial statements and the Parent Company financial statements.
We believe that the audit evidence we have obtained is sufficient and appropriate to provide a basis for our audit opinion.
Our audit did not result in any qualification.
Opinion In our opinion, the consolidated financial statements and the Parent Company financial statements give a true and fair view of the Group’s and the Parent Company’s assets, liabilities, shareholders’ equity and financial position at 31 December 2012 and of the results of the Group’s and the Parent Company’s operations and consolidated cash flows for the financial year 2012 in accordance with the International Financial Reporting Standards as adopted by the EU in respect of the consolidated financial statements, in accordance with the Danish Financial Business Act in respect of the Parent Company financial statements, and in accordance with Danish disclosure require-ments for listed financial institutions.
Statement on the management’s report Pursuant to the Danish Financial Business Act, we have read the management’s report. We have not performed any further procedures in addition to the audit of the consolidated financial statements and the Parent Company financial statements. On this basis, it is our opinion that the information provided in the management’s report is consistent with the consolidated financial statements and the Parent Company financial statements.
Copenhagen, 7 February 2013KPMG
Statsautoriseret Revisionspartnerselskab
Lars Rhod Søndergaard Jesper Ridder Olsen State Authorised State Authorised Public Accountant Public Accountant
AUDITORS’ REPORTS

DANSKE BANK / ANNUAL REPORT 2012 185
OLE ANDERSENMANAGING DIRECTOR OF OGA HOLDING APS AND TWO SUBSIDIARIESChairman
Born on 11 July 1956Nationality: DanishJoined the Board on 23 March 2010Most recently re-elected in 2012Independent
Chairman of the Remuneration Committee, the Credit and Risk Committee and the Nomination Committee
Competencies:Experience in leading and developing large financial and non-financial international companiesSetting of corporate strategies, budgets and targetsFinancial and economic expertiseGeneral risk management experience
Directorships and other offices:Bang & Olufsen A/S (Chairman)Chr. Hansen Holding A/S (Chairman)EQT Partners (Senior Adviser)ISS A/S and one subsidiary (Chairman)NASDAQ OMX Nordic (Member of the Nomination Committee)Zebra A/S (Chairman)
NIELS B. CHRISTIANSENCHIEF EXECUTIVE OFFICER OF DANFOSS A/SVice Chairman
Born on 12 April 1966Nationality: DanishJoined the Board on 29 March 2011Most recently re-elected in 2012Independent
Member of the Remuneration Committee, the Credit and Risk Committee and the Nomination Committee
Competencies:Experience in leading a large, international industrial group based in DenmarkInsight into and experience in corporate finance and capital marketsUnderstanding of the bank/client relationship strategyGeneral risk management experience
Directorships and other offices:Axcel II A/S and two subsidiaries (Chairman)Danfoss A/S (Chairman or member of the boards of directors of four subsidiaries)The Denmark-America FoundationDI (Vice Chairman of the Central Board and the Executive Committee)Provinsindustriens Arbejdsgiverforening (PA)Sauer-Danfoss Inc. (Vice Chairman)William Demant Holding A/S
URBAN BÄCKSTRÖMDIRECTOR GENERAL OF THE CONFEDERATION OF SWEDISH ENTERPRISE Elected by the general meeting
Born on 25 May 1954Nationality: SwedishJoined the Board on 27 March 2012Independent
Member of the Credit and Risk Committee
Competencies:Broad and in-depth experience in economics and financeLeading major financial companies and not-for-profit institutionsInsight into the Swedish business sectors and international influence on theseExperience in and knowledge of sophisticated risk models
Directorships and other offices:Exportrådet – Swedish Trade CouncilInstitutet för Näringslivsforskning
MANAGEMENT AND DIRECTORSHIPS – BOARD OF DIRECTORS
MA
NA
GE
ME
NT
AN
D D
IRE
CTO
RS
HIP
S

186 DANSKE BANK / ANNUAL REPORT 2012
MICHAEL FAIREYElected by the general meeting
Born on 17 June 1948Nationality: BritishJoined the Board on 23 March 2010Most recently re-elected in 2012Independent
Member of the Credit and Risk Committee and the Audit Committee
Competencies:Experience in managing the operations of a large, international banking groupInsight into and understanding of the importance of customer service and adaptation to market conditionsBroad finance and corporate finance experienceExperience in and knowledge of sophisticated risk models
Directorships and other offices:APR Energy PLC (Chairman)Consumer Credit Counselling Service (Trustee)Energy Saving Trust Foundation (Trustee)Legal & General Group PLCLloyds TSB Pension Funds (Chairman)Vertex Group Limited (Chairman)
MATS JANSSON Elected by the general meeting
Born on 17 December 1951Nationality: SwedishJoined the Board on 4 March 2008Most recently re-elected in 2012Independent
Member of the Remuneration Committee
Competencies:Experience in leading large, listed companiesCorporate finance understandingInsight into the Nordic and European consumer and convenience goods sectors
Directorships and other offices:Delhaize Group SAJ.P. Morgan (Senior Adviser)
JØRN P. JENSENDEPUTY CEO AND CHIEF FINANCIAL OFFICER OF CARLSBERG BREWERIES AND CARLSBERG A/SElected by the general meeting
Born on 2 January 1964Nationality: DanishJoined the Board on 27 March 2012Independent
Chairman of the Audit Committee
Competencies:Broad experience in international business operations and solid understanding of Danish and international financial reporting practicesFunding of international companies requiring significant investments through debt and equity marketsKnowledge of cultures and economic/political conditions in Danske Bank’s marketsGeneral risk management experience
Directorships and other offices:Carlsberg Group (Chairman or member of the boards of directors of 20 subsidiaries)DONG Energy A/SEkeløf Invest ApS (CEO)The Danish Committee on Corporate Governance
MAJKEN SCHULTZPROFESSOR OF ORGANISATION AT COPENHAGEN BUSINESS SCHOOLElected by the general meeting
Born on 28 October 1958Nationality: DanishJoined the Board on 30 November 2000Most recently re-elected in 2012Dependent
Member of the Nomination Committee
Competencies:Experience in strategic development, branding and change managementInsight from multiple companies operating in different market conditionsExperience from orchestrating brand and reputation management processesUnderstanding of providing financial services in different market conditions

DANSKE BANK / ANNUAL REPORT 2012 187
Directorships and other offices:Danske Spil A/SRealdaniaReputation Institute (Partner)Said Business School, Oxford University(International Research Fellow)Vci Holding ApS (Chief Executive Officer)
TROND Ø. WESTLIEGROUP CHIEF FINANCIAL OFFICER AND MEMBER OF THE EXECUTIVE BOARD OF A.P. MØLLER-MÆRSK A/S
Elected by the general meeting
Born on 8 June 1961Nationality: NorwegianJoined the Board on 27 March 2012Independent
Trond Ø. Westlie is Group Chief Financial Officer at and a member of the executive board of A.P. Møller-Mærsk A/S. A.P. Møller-Mærsk A/S holds 20% of the share capital of Danske Bank A/S.
Member of the Audit Committee
Competencies:Long experience in managing overall corporate financial affairsFunding of international companies requiring significant investments through debt and equity marketsStrategic and business development expertiseExperience in managing large international operationsGeneral risk management experience
Directorships and other offices:A.P. Møller-Mærsk A/S (Vice Chairman or member of the boards of directors of 9 subsidiaries)Danmarks Skibskredit A/SPepita AS, NorwayShama A/S, Norway (CEO)Subsea 7 S.A.Tønsberg Delikatesse AS, Norway
SUSANNE ARBOEADVISERStaff representative
Born on 16 May 1957Nationality: DanishJoined the Board on 23 March 2010
Directorships and other offices:Danske Kreds
HELLE BRØNDUMBANK CLERKStaff representative
Born on 26 September 1952Nationality: DanishJoined the Board on 19 March 2002Most recently re-elected in 2010
Directorships and other offices:Danske Kreds
CARSTEN EILERTSENSENIOR PERSONAL CUSTOMER ADVISERStaff representative
Born on 17 September 1949Nationality: DanishJoined the Board on 23 March 2010
Directorships and other offices:Apostelgaardens Fond (Vice Chairman)Danske Kreds (Vice Chairman)Danske UnionsThe Parish Church Council of Sct. Mortens Church, Næstved (Vice Chairman)The Næstved Cemeteries
CHARLOTTE HOFFMANNPERSONAL CUSTOMER ADVISERStaff representative
Born on 8 October 1966Nationality: DanishJoined the Board on 14 March 2006Most recently re-elected in 2010
PER ALLING TOUBRO HR SPECIALISTStaff representative
Born on 25 June 1953Nationality: DanishJoined the Board on 14 March 2006Most recently re-elected in 2010
MA
NA
GE
ME
NT
AN
D D
IRE
CTO
RS
HIP
S

188 DANSKE BANK / ANNUAL REPORT 2012
MANAGEMENT AND DIRECTORSHIPS – EXECUTIVE BOARD
EIVIND KOLDINGCHAIRMAN OF THE EXECUTIVE BOARD
Born on 16 November 1959Joined the Board on 15 February 2012
Directorships and other offices:Dagmar Marshalls FondThe Denmark-America FoundationThe Trilateral CommissionGrænsefondenInstitut International d’Etudes BancairesThe International Monetary Conference
TONNY THIERRY ANDERSENHEAD OF PERSONAL BANKING
Born on 30 September 1964Joined the Board on 1 September 2006
Directorships and other offices:Bankernes Kontantservice A/SBluegarden Holding A/SBluegarden A/SDanske Bank International S.A. (Chairman)Danske Bank Oyj (Chairman)Forsikringsselskabet Danica, Skadeforsikringsaktie-selskab af 1999 (Vice Chairman)Danica Pension, Livsforsikringsaktieselskab (Vice Chairman)The Private Contingency Association for the Winding up of Distressed Banks, Savings Banks and Cooperative Banks (Vice Chairman)The Danish Bankers Association (Vice Chairman)Kreditforeningen Danmarks Pensionsafviklingskasse (Chairman)Nets Holding A/SOlga og Esper Boels FondRealkredit Danmark A/S (Chairman)YPO, Denmark (CFO)
THOMAS F. BORGENHEAD OF CORPORATES & INSTITUTIONS
Born on 27 March 1964Joined the Board on 1 September 2009
Directorships and other offices:Danmarks Skibskredit A/S (Vice Chairman)Kong Olav V’s FondNorthern Bank Limited (Chairman)
ROBERT ENDERSBYHEAD OF GROUP RISK MANAGEMENT
Born on 28 October 1959Joined the Board on 1 October 2012
Directorships and other offices:Northern Bank Limited
LARS MØRCHHEAD OF BUSINESS BANKING
Born on 11 May 1972Joined the Board on 1 June 2012
Directorships and other offices:Northern Bank LimitedRealkredit Danmark A/S (Vice Chairman)
HENRIK RAMLAU-HANSENHEAD OF GROUP FINANCE & LEGAL
Born on 2 October 1956Joined the Board on 1 January 2011
Directorships and other offices:Danske Bank OyjKreditforeningen Danmarks PensionsafviklingskasseRealkredit Danmark A/S

DANSKE BANK / ANNUAL REPORT 2012 189
MANAGEMENT AND DIRECTORSHIPS – EXECUTIVE BOARD

190 DANSKE BANK / ANNUAL REPORT 2012
Danske Bank A/S
Holmens Kanal 2-12
DK-1092 København K
Tel. +45 33 44 00 00
Cvr-nr. 611262 28-København
www.danskebank.com
17689 · 2013.02 · Danske Bank A/S · CVR-nr. 61 12 62 28 – København
CORPORATERESPONSIBILITY2012
BUSINESS
ONE BANK FOR THE FUTURE
EMPLOYEES
RESPONDING TO CHANGE WITH OPPORTUNITIES AND RESPECT
ENVIRONMENT
A BALANCED APROACH TO REDUCING ENVIRON-MENTAL IMPACT
SOCIETY
BANKING IN THE NEW NORMAL
DANSKE BANK GROUP
FINANCIAL LITERACY
SHARING KNOWLEDGE TO IMPROVE SKILLS
OTHER DANSKE BANK GROUP PUBLICATIONS, AVAILABLE AT WWW.DANSKEBANK.COM/IR:
RISK MANAGEMENT2012
DANSKE BANK GROUP
DANSKE BANK A/S
HOLMENS KANAL 2-12
DK-1092 KØBENHAVN K
TEL. +45 33 44 00 00
CVR-NR. 61 12 62 28 - KØBENHAVN
WWW.DANSKEBANK.COM
RIS
K M
AN
AG
EM
EN
T 2
01
2
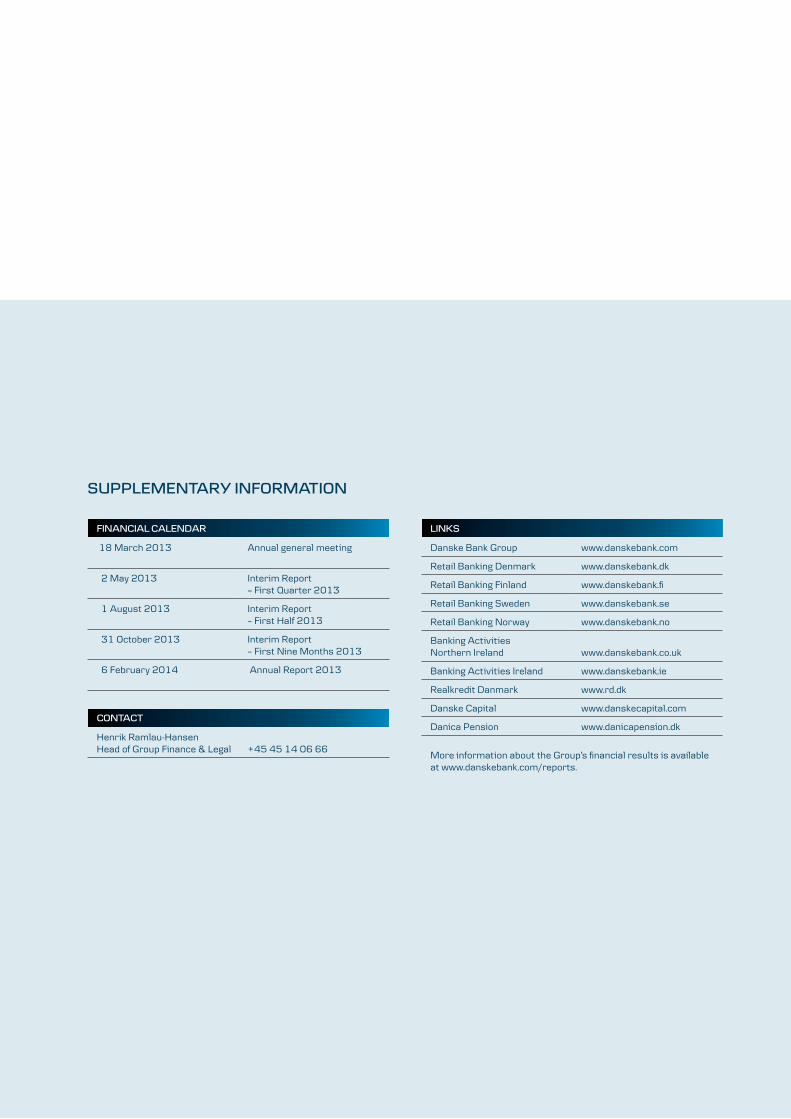
AnnuAl RepoRt 2012
3 Danske bank / ANNUAL REPORT 2012
supplementary information
financial calenDar
18 March 2013 Annual general meeting
2 May 2013 Interim Report – First Quarter 2013
1 August 2013 Interim Report – First Half 2013
31 October 2013 Interim Report – First Nine Months 2013
6 February 2014 Annual Report 2013
contact
Henrik Ramlau-HansenHead of Group Finance & Legal +45 45 14 06 66
links
Danske Bank Group www.danskebank.com
Retail Banking Denmark www.danskebank.dk
Retail Banking Finland www.danskebank.fi
Retail Banking Sweden www.danskebank.se
Retail Banking Norway www.danskebank.no
Banking Activities Northern Ireland www.danskebank.co.uk
Banking Activities Ireland www.danskebank.ie
Realkredit Danmark www.rd.dk
Danske Capital www.danskecapital.com
Danica Pension www.danicapension.dk
More information about the Group’s financial results is available at www.danskebank.com/reports.
H02128 Omslag 12AR DK Enkelt_ENG.indd 3 31/01/13 08.44

AnnuAl RepoRt2012
DAnSKe BAnK GRoup
DAnSKe BAnK A/S
HolmenS KAnAl 2-12
DK-1092 KøBenHAvn K
tel. +45 33 44 00 00
CvR-nR. 611262 28-KøBenHAvn
www.DAnSKeBAnK.Com
An
nu
Al
Re
po
Rt
20
12
H02128 Omslag 12AR DK Enkelt_ENG.indd 1 31/01/13 08.44