sara 2012 report
DESCRIPTION
ÂTRANSCRIPT

1
SOUTH AFRICAN REGISTER OFASSISTED REPRODUCTIVE TECHNIQUES
SARA 2012

2
CONTENTS
TITLE PAGE
Introduction 3
General 5
Participating ART Centres 7 - 9
Summary Data 10
IVF & ICSI: Procedures & Outcome 11
IVF: Age 12
IVF: Embryo Transfers 13
ICSI: Age 14
ICSI: Embryo Transfers 15
Cause of Infertility 16
Ovarian Stimulation 17
IVF & ICSI: Clinical Pregnancies by Age and Embryo Transfer 18, 19
IVF & ICSI: Pregnancy Outcome by Age 20, 21
Cryopreservation 22
Oocyte Donation 23, 24
Overview: 2009 - 2012 25

3
INTRODUCTION
Dear Colleagues,
I congratulate Professor Silke Dyer and the SARA team on the publication of another outstanding report. The analysis of the 2012 data was more detailed than in previous years, and the results provide us with new insights into the South African practice of ART.
SASREG (Southern African Society for Reproductive Medicine and Gynecological Endoscopy) is proud to
have SARA as its official agency for national anonymous IVF data collection. Many of the goals of SASREG are dependent on having this accurate data, in order to negotiate with government and funders to ultimately improve our patient care. We are also proud to contribute to the ICMART (International Committee Monitoring Assisted Reproductive Techniques) database and world reports.
The high pregnancy rates in this report compare favorably with international data, and we can be proud of the high quality of care provided to our patients. However, despite this success, we are only providing a service to approximately 6% of couples in need and hence must seek to improve access to ART.
Although the average number of embryos transferred was 2, there were still a significant number of procedures where more than 2 embryos were transferred. If funding models for IVF treatment are introduced in the future, it is likely that the number of embryos transferred will have to be reduced as part of a managed health care system.
Many clinics provided separate oocyte donation data for the 2012 report, and national benchmark pregnancy rates are now available.
Valid and accurate data are vital for SARA to produce meaningful national reports. IVF units need to have adequately trained staff and proper record keeping systems in order to provide accurate data. The ongoing accreditation of IVF units and clinic personnel remains interlinked with the collection of ART data. I encourage all clinics to remain dedicated to submitting their data and participating in national accreditation programs in the future.
Thank you to everyone who has contributed to make this report a success.
Dr Paul le RouxSASREG President 2014-2017SARA Committee
Dear Colleagues,
This is the 4th report of the South African Registry of Assisted Reproductive Techniques (SARA).
Once again it has been a privilege to analyse the pooled data and generate this report. ART data monitoring is a team effort and my sincere gratitude goes to all the ART units and their clinical and laboratory staff who have made this report possible. It is particularly
encouraging to see that the majority of units are now using our on-line program, and as a result the quality and quantity of our data continues to improve. You will for example find new information in this report on the indication for ART, use of stimulation protocols, mean number of embryos transferred and multiple pregnancy rates.
While SARA is now well established, we are engaging with an exciting regional project namely to establish an ART registry in sub-Saharan Africa. I am grateful to the SASREG Committee for supporting my involvement in this initiative. The increasing use and globalisation of ART make monitoring of safety and effectiveness mandatory. This is arguably nowhere more important than in low resource settings where the use of precious health resources should be paralleled by information on resultant impact and outcome. In addition, forming a regional ART registry is a powerful way of putting infertility and ART on the map of reproductive health in Africa, and of putting Africa on the global map of ART and infertility-related reproductive health. The project is still in its infancy, but I have received positive responses from ART units in Mauritius, Kenya, Uganda, Ghana and Nigeria and upcoming units in Namibia and Botswana have also expressed interest. While this will be first and foremost an intra-African collaboration, we have the full support from ICMART (International Committee Monitoring Assisted Reproductive Techniques) in addition to which WHO has also expressed interest. It is fortuitous that the Latin American Registry for ART, which has been operational since 1991, has recently implemented a new, case-by-case data collection program. This was presented at the 2014 ESHRE conference in Munich, Germany, by Dr Fernando Zegers-Hochschild . We have received much support from him and his team, and once again they are offering their assistance by making the new data collection program available to us and our region. Not only does this program provide us with a firm platform from which to launch multinational data collection, but it also offers our national ART units an easier and better way of collecting and reporting their data in future. Details will be circulated to all medical and laboratory directors of SARA participating ART centres in the near future.
As in previous years I wish to thank and acknowledge the SASREG secretariat, in particular Ms Virosha Basdeo, who assisted in the handling of the data, and Mr Dudley Randall for his overall supervision. I am most grateful to the RLA team: Dr Fernando Zegers-Hochschild and Ms Carolina Musri, who pooled and reported on the data submitted on line. Merck (Pty) Ltd, South Africa provided some financial support to SARA.
Prof Silke DyerChair: SARA CommitteeSASREG Committee Member

4
Dear Colleagues,
It is always with great excitement that I anticipate the release of the next SARA report -maybe because as an embryologist our data is our pride and joy. I am therefore also very excited to join the SARA task team and be part of such an excellent project.
I would like to thank Professor Silke Dyer and her task team for preparing another insightful SARA report. I also
wish to acknowledge every embryologist and their time and effort required to report their clinic’s data. The online electronic submission has made it easier for some and is one of SARA’s points of interest to improve in the coming years.
The 2012 report contains new and valuable information regarding our clinical and laboratory practice and in turn informing our work. It will, for example, be interesting to observe whether our joint practice will follow the overall international trend of transferring fewer embryos to the point of elective single embryo or blastocyst transfer. As embryologists we play a key role in the success and safety of ART through our handling of gametes and embryos, our culture conditions and laboratory quality control systems, as well as the careful selection of the best embryo(s) for transfer.
Our field of fertility treatment continuously develops, changes, improves and widens. We need to ensure that the scope of collected data is adapted accordingly even though a time delay is to be expected. Currently for example, aspirations in embryo ‘freeze-all’ cycles, which are especially used in cancer patients or to avoid ovarian hyperstimulation syndrome, and more recently in frozen oocyte cycles, are either lost to our data collection or, if included, reduce our pregnancy rate per aspiration. Frozen embryo transfers are becoming increasingly successful and may represent the largest cohort of data requiring attention for better inclusion in the SARA report. PGD/PDS cycles are similarly candidates for consideration as their use in South Africa is established but the clinical outcomes insufficiently documented.
The active participation and responsible data collection by clinics and especially by the embryologists is central to the growth of SARA and in turn for SARA to continuously contribute to the advancement of our fertility treatment services on all levels. SARA helps us to establish a trusted benchmark of results for our clinics, laboratories and our patients. It also benchmarks South Africa on the international stage, presenting our high quality ART treatment provided year after year.
Well done to all who have contributed to another excellent SARA report. Keep up the good work.
Ms Lydia Els-Smit (Embryologist)SARA and SASREG Committee Member
INTRODUCTION

5
GENERAL
Comments
• If both IVF and ICSI were done in one cycle, the cycle was captured according to which embryo(s) were transferred; if ‘mixed’ embryos were transferred (ie embryos from IVF and ICSI), the cycle was captured under ICSI.
• Embryo Transfers Presented data refer to fresh embryo transfers unless otherwise stated.
• Oocyte Donations [OD] Four centres reported OD donations as part of the general IVF and ICSI data. These centres included OD aspirations and OD transfers under the age of the DONOR and not the recipient. The remaining centres reported OD separately as part of the extended data reporting (page 23-24).
AbbreviAtions
• OD Oocyte Donation
• CPR Clinical Pregnancy Rate
• ET Embryo Transfer
• IVF In Vitro Fertilisation
• ICSI Intracytoplasmic Sperm Injection
Definitions
• Aspirations The number of cycles resulting in attempted oocyte retrieval irrespective of whether oocytes were successfully retrieved or not.
• Clinical Pregnancy Any pregnancy with clinical products of conception (ectopic, miscarriage, termination, birth) or ultrasound evidence of pregnancy (irrespective of presence of fetal heart); includes clinical miscarriage, ectopic pregnancy, missed abortion, viable ongoing pregnancy, birth (live or still birth); excludes biochemical pregnancy.
Note: all recorded pregnancies are clinical pregnancies only.

6
PARTICIPATING ART CENTRES
ACCORDING TO NUMBER OF ASPIRATIONS
No. of Apsirations per Year No. of Centres
< 50 1
50 - 100 2
101 - 200 2
201 - 350 3
351 - 500 2
> 500 3
13 CENTRES REPORTING
tAbLe 1: DistribUtion of Centres

7
SARA: PARTICIPATING ART CENTRES
CAPe fertiLitY CLiniC209 Library Square, 1 Wilderness Road, Claremont - Cape Town Phone 021 674 2088Fax 021 671 2709Email [email protected] www.capefertilityclinic.co.zaClinicians Dr Paul le Roux, Dr Sulaiman Heylen, Dr Klaus Wiswedel, Dr Nomathamsanqa Matebese, Dr Razak DhansayEmbryologists Ms Kimenthra Raja, Ms Gloria Raidani, Mrs Zulaigha Williams, Mrs Hughlene Baker, Ms Kerith
Ferreira, Ms Liezel PotgieterNurses Sr Karin Schwenke, Sr Heidi Clark, Sr Liz Carter, Sr Di Davids, Sr Florence Rodrigues, Mrs Elaine
Brenkman, Sr Cyndi Nel, Sr Jenny Loverock, Sr Danelle GroeneveldReceptionists Mrs Sonia Van Rooyen, Mrs Janine Pasquall, Mrs Nazeema Abrahams, Mrs Roshaan Sheldon,
Mrs Desire Heyburgh, Ms Jennifer ParrishCounsellors Ms L van der Westhuizen
CAre CLiniC21 Jan Hofmeyer Road, Westville - KwaZulu NatalPhone 031 267 7920Fax 031 267 7928Email [email protected] www.careoffice.co.zaClinicians Dr A RamdeoEmbryologists Mr K K Naidoo, Ms S UmarsinghNurses Sr K Harilall, Sr V Dicks, Staff Nurse L Dladla
Drs AevitAs inCorPorAteDVincent Pallotti Hospital, Park Road, Pinelands - Cape TownPhone 021 531 6999Fax 021 531 7919Email [email protected] www.aevitas.co.zaClinicians Dr JP Van der Merwe, Prof TF Kruger, Prof TI Siebert, Dr V HulmeEmbryologists Dr ML Windt, Mr GM Tinney, Ms N Lans, Ms C ThwaitsNurses Sr S Botha, Sr T Fourie, Sr A Mans, Sr L Zonneveld
DUrbAn fertiLitY CLiniC607 Kingsway Rd, Kingsway Hospital, Amanzimtoti - KwaZulu NatalPhone 031 904 3980Fax 031 904 3980Email [email protected], [email protected], [email protected] Clinicians Dr Sagie Naidu, Dr Mahesh BhanaEmbryologists Mr Neville S Moodley
fembrYo fertiLitY CLiniC40A Park Drive, Central Port Elizabeth - Eastern CapePhone 041 373 0771Fax 041 374 2006Email [email protected] www.fembryo.co.za Clinicians Dr Danie BothaEmbryologists Ms Michelle Rijsdijk, Mr Wilhelm Schoeman

8
Genesis reProDUCtive CentreSuite G15 Kloof Medi-Clinic, 511 Jochemus Street, Erasmus Kloof Ext 3, Pretoria - GautengPhone 012 367 4378Fax 012 367 4379Email [email protected], [email protected] Clinicians Dr Abri de Bruin, Dr Johan PentzEmbryologists Mr J Lourens, Mrs S Lourens, Mrs R van Staden
GYnomeDSuite 11, Block B, Wilgeheuwel Hospital, Amplifier Road, Honeydew - GautengPhone 011 796 1100Fax 011 794 2987Email [email protected] www.gynomed.co.zaClinicians Dr HW Lindeque, Dr MVK Giesteira, Dr DS Schulz, Dr B PotgieterEmbryologists Ms Cecile BooyseNurses Sr Sharon Uren, Sr Nicky LabuschagneCounsellors Dr Kobus van Biljon
meDfem CLiniCCorner Peter Place and Nursery Road, 1st Floor, Bryanston - GautengPhone 011 540 3440Fax 011 463 1875 / 0866 521 977Email [email protected] Website www.medfem.co.za Clinicians Dr Van Rensburg, Dr Van Schouwenburg, Dr Rodrigues, Dr Clark, Dr Divanovic Embryologists Ms Edolene Bosman, Ms Vicky Wolf, Ms Lizelle Griessel, Ms Esmari Du Plessis, Ms Bianca FaberNurses Sr Heather Sparrow, Sr Krina Von Molendorff, Sr Hanlie Monerry, Sr Sandra BotesCounsellors Dr Mandy Wolf (Clinical Psychologist)
PretoriA fertiLitY CenterSuite M19 Pretoria East Hospital, Pretoria - Gauteng Phone 012 998 8854/5Fax 012 998 8856Email [email protected] www.ptafertility.co.zaClinicians Dr MA Trouw Embryologists Ms Elsie McDonald, Ms Linmarié Venter Nurses Sr Lizette White, Sr Rhynette Van Rensburg
reProDUCtive meDiCine Unit Department of Obstetrics & Gynaecology, Groote Schuur Hospital and Faculty of Health Sciences, UCTMaternity Building F Floor, Observatory, 7925 - Western CapePhone 021 404 6027/8Fax 021 404 6016Email [email protected] Prof S Dyer, Dr M Patel, Dr M Matjila, Dr L Walmsley, Dr F Olarogun, Prof Z van der SpuyEmbryologists Mrs M Vienings, Ms L Cindi, Ms B Wager
SARA: PARTICIPATING ART CENTRES

9
sAnDton fertiLitY Centre Suite 310, East Wing, Morningside Mediclinic, cnr Rivonia and Hill Road, Sandton - GautengPhone 011 883 1776, 0861 442 211Fax 011 784 6886Email [email protected] Website www.sandtonfertility.com Clinicians Dr GH Mohamed, Dr M Faesen, Dr R PatelEmbryologists Mr Prashan MaharajNurses Sr Iris Davids
vitALAb fertiLitY UnitInner Circle, 159 Rivonia Road, Morningside, Sandton - GautengPhone 011 911 4700Fax 011 911 4744Email [email protected] Website www.vitalab.com Clinicians Dr Stephan Volschenk & Partners, Dr MJ Jacobson, Dr L GobetzEmbryologists Ms Jane Meintjies & ColleaguesNurses Sr Anne Hacking & ColleaguesCounsellors Ms Bernice Lits, Ms Tanya Rubin
WiJnLAnD fertiLitY9 Oewerpark, Die Boord, Stellenbosch - CapePhone 021 882 9666Fax 086 566 1701Email [email protected] Website www.wijnlandfertility.co.za Clinicians Dr Johannes van Waart, Dr Paul Dalmeyer, Dr Lizette WhiteEmbryologists Mrs Lydia Els-Smit, Ms Riana BurgerNurses Sr Ronel Jubber, Sr Anel Prins
SARA: PARTICIPATING ART CENTRES

10
SUMMARY DATA
sUmmArY DAtA: ivf & iCsi Note: These data include OD cycles.
• Total no. aspirations: 4991
• Total no. fresh embryo transfers: 4193
• Total no. clinical pregnancies: 1567
• Clinical PR / aspiration: 31.4%
• Clinical PR / ET: 37.4%
nAtionAL CoverAGe: ivf & iCsi
4991 aspirations/ 51.8 million people*/year = 96.3 aspirations/ million people/year = 6.4% of estimated optimal ART coverage
Estimated need for ART: 1500 cycles/million population/year 1
* According to Census 2011, Statistics South Africa (www.statssa.gov.za)1 Collins, Hum Reprod Update 2002: 8, 265
13 CENTRES REPORTING

11
BASIC DATA REPORTING
The following information was provided by 12 centres and is an amalgamation of data provided by three centres that reported basic data only, and nine centres that also reported
more extensive data using the SARA On Line Program. One participating centre had to be excluded from the basic data as it did not separate IVF and ICSI cycles, but their data are
included in the summary data.
tAbLe 2: ivf & iCsi sUmmArY
fiGUre 1: DistribUtion of ivf AnD iCsi ProCeDUres
IVF ICSI
Aspirations 994 2423
Embryo Transfers 791 1965
Clinical Pregnancies 281 675
CPR/aspiration 28.2% 27.8%
CPR/ET 35.5% 34.3%
Data include OD cycles from 3 centres that did not report OD separately.
ICSI
IVF
Aspirations Embryo Transfers0%
70.9%
30.3%
71.3%
28.7%

12
tAbLe 3: ivf - ProCeDUres AnD PreGnAnCies bY AGe
< 35 YRS 35 - 39 YRS > 39 YRS TOTAL
Aspirations (n) 449 354 191 994
Fresh Embryo Transfers (n) 375 293 123 791
Clinical Pregnancies (n) 152 101 28 281
CPR/aspiration (%) 33.8% 28.5% 14.6% 28.3%
CPR/embryo transfers (%) 40.5% 34.5% 22.8% 35.5%
fiGUre 2: ivf - DistribUtion of ProCeDUres AnD PreGnAnCies bY AGe
>39y35-39y<35y
Aspirations Transfers Pregnancies0%
100%
Data include OD cycles from 3 centres that did not report OD separately.The OD cycles included are captured by age of donor.
BASIC DATA REPORTING
19.2
35.6
15.5
37
47.4
10
35.9
54.145.2

13
< 35 YRS 35 - 39 YRS > 39 YRS TOTAL
Single embryo or blastocyst 50 43 23 116
2 embryos or blastocysts 198 147 44 389
3 embryos or blastocysts 32 26 16 74
≥4 embryos or blastocysts 1 5 3 9
Total transfer cycles 281 221 86 588
Mean no. embryos/blastocysts transferred1 1.94 1.96 1.98 1.95
1. Calculation based on the assumption that only 4 embryos/blastocysts were transferred in the category “≥4”.
tAbLe 4: ivf - no. of trAnsfers WitH Different nUmber of embrYos or bLAstoCYstsNo. centres reporting: 10 (2 centres did not capture this information) Note: Data include OD cycles from 3 centres that did not report OD separately.The OD cycles included are captured by age of donor.
BASIC DATA REPORTING
fiGUre 3: ivf - PreCentAGe of trAnsfers WitH Different nUmber embrYos/bLAstoCYsts bY AGe
Mean no. 1.94 1.96 1.98transferred
1 2 3 4 or more
< 35y 35-39y > 39y0%
100% 0.32.3 3.5
11.411.8
18.6
17.8 19.4 26.7
70.5 66.5 51.2

14
tAbLe 5: iCsi - ProCeDUres AnD PreGnAnCies bY AGe
< 35 YRS 35 - 39 YRS > 39 YRS TOTAL
Aspirations (n) 1165 799 459 2423
Fresh Embryo Transfers (n) 995 653 317 1965
Clinical Pregnancies (n) 381 222 72 675
CPR/aspiration (%) 32.7% 27.8% 15.7% 27.8%
CPR/embryo transfers (%) 38.3% 34.0% 22.7% 34.3%
fiGUre 4: iCsi - DistribUtion of ProCeDUres AnD PreGnAnCies bY AGe
>39y35-39y<35y
Aspirations Transfers Pregnancies0%
100%
Data include OD cycles from 4 centres that did not report OD separately.The OD cycles included are captured by age of donor.
BASIC DATA REPORTING
18.9 16.110.7
33 33.2 32.9
48.150.6 56.4

15
BASIC DATA REPORTING
< 35 YRS 35 - 39 YRS > 39 YRS TOTAL
Single embryo or blastocyst 122 125 72 319
2 embryos or blastocysts 607 332 132 1071
3 embryos or blastocysts 140 122 77 339
≥4 embryos or blastocysts 22 14 16 52
Total transfer cycles 891 593 297 1781
Mean no. embryos/blastocysts transferred1 2.06 2.04 2.12 2.07
1. Calculation based on the assumption that only 4 embryos/blastocysts were transferred in the category “≥4”.
tAbLe 6: iCsi - no. of trAnsfers WitH Different nUmber of embrYos or bLAstoCYstsNo. centres reporting: 10 (2 centres did not capture this information) Note: Data include OD cycles from 4 centres that did not report OD separately.The OD cycles included are captured by age of donor.
fiGUre 5: iCsi - PreCentAGe of trAnsfers WitH Different nUmber embrYos/bLAstoCYsts bY AGe
Mean no. 2.06 2.04 2.12transferred
< 35y 35-39y > 39y0%
100% 2.5 2.4 5.4
13.721.1 24.2
15.7 20.625.9
68.1 5644.4
1 2 3 4 or more

16
The following information was provided by nine centres that submitted their data using the SARA on-line program which captures more extensive information pertaining to
ART. However, not all nine centres completed all tables, therefore the number of centres submitting information is specified for each table and figure.
EXTENDED DATA REPORTING
tAbLe 7: ovAriAn stimULAtion for ivf & iCsiNo. centres rerporting: 7Note: This table does not include OD or frozen embryo transfers.
No. centres rerporting: 6
OVARIAN STIMULATION IVF ICSI TOTAL %
Agonist & FSH/LH/HMG 163 601 764 46.7
Antagonist & FSH/LH/HMG/Clomiphene 103 707 810 49.5
FSH/LH/HMG 3 3 6 0.4
Clomiphene + FSH/LH/HMG 18 28 46 2.8
Others 2 8 10 0.6
Total 289 1347 1636 100
fiGUre 6: CAUse of infertiLitY
HIV
UNEXPLAINED
MULTIPLE CAUSES
MALE ONLY
FEMALE ONLY
TUBAL ONLY
ICSI1604 Cycles
IVF656 Cycles
0%
100%
30.9 32.5
11.4
32.5
31.7
15.8
7.9 3
1814.3

17
EXTENDED DATA REPORTING
No. centres rerporting: 7Note: Only the three most common stimulation protocols are depicted.These data do not include OD or frozen embryo transfers.
fiGUre 7: ovAriAn stimULAtion for ivf & iCsi
ivf iCsi
AGONIST
ANTAGONIST
CLOMIPHENE + GONADOTROPHINS
AGONIST
ANTAGONIST
CLOMIPHENE + GONADOTROPHINS

18
No. centres rerporting: 8Note: This table does not include OD or frozen embryo transfers.
tAbLe 8: ivf & iCsi - oUtCome bY AGe AnD nUmber of embrYos/bLAstoCYsts trAnsferreD
EXTENDED DATA REPORTING
NO. TRANSFERRED EMBRYOSCP / TFC (%) 1-3
BLASTOCYSTSCP / TFC (%)
TOTALCP / TFC (%)
<35yOneTwoThree
3/27 (11.1)24/84 (28.6)
6/13
4/1181/170 (47.6)
2/19
7/38 (18.4)105/254 (41.4)
8/32 (25)35-39y
OneTwoThree≥ Four
2/34 (5.9) 14/53 (26.4)15/32 (46.8)
1/3
2/1326/71 (36.6)12/27 (44.4)
0/0
4/47 (8.5)40/124 (32.2)27/59 (45.8)
1/3
≥ 40yOneTwoThree≥ Four
2/197/30 (23.3)7/26 (26.9)
2/3
2/72/9
1/160/2
4/28 (14.3)9/39 (23)8/42 (19)
2/5
1. CP= Clinical Pregnancy 2. TFC = Transfer cycle 3. Percentage in brackets if no. TFC >25
Comment: The higher pregnancy rates associated with the transfer of two instead of one embryo or blastocyst in women < 35y, and with transfer of three instead of two embryo or blastocyst in women 35-39y must be interpreted with caution. Firstly, in several sub-categories the numbers are small and secondly the associated risk of multiple pregnancy is not documented.

19
fiGUre 8: ivf & iCsi - PreCentAGe of trAnsfers WitH Different nUmber of embrYos AnD bLAstoCYsts
EXTENDED DATA REPORTING
Comment: Blastocysts were transferred in 48.5% of all transfer cycles. The average number of embryos and blastocysts transferred was 2.0 and 2.1 respectively.For calculation of the average, it was assumed that only 4 embryos/blastocysts were transferred in the category “≥4”.
Embryos Blastocysts0%
100%
24.79
51.5 72.5
21.9 18
1.8 0.6
1 2 3 4 or more
20
EXTENDED DATA REPORTING
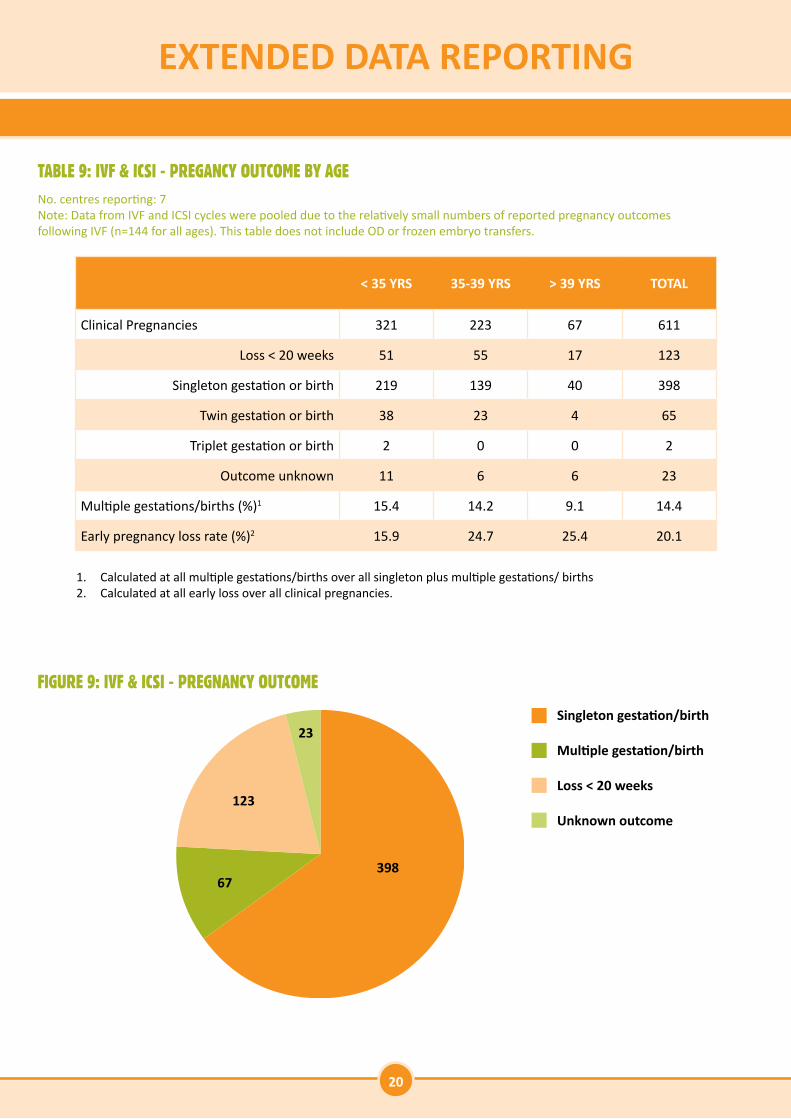
No. centres reporting: 7 Note: Data from IVF and ICSI cycles were pooled due to the relatively small numbers of reported pregnancy outcomesfollowing IVF (n=144 for all ages). This table does not include OD or frozen embryo transfers.
1. Calculated at all multiple gestations/births over all singleton plus multiple gestations/ births2. Calculated at all early loss over all clinical pregnancies.
tAbLe 9: ivf & iCsi - PreGAnCY oUtCome bY AGe
fiGUre 9: ivf & iCsi - PreGnAnCY oUtCome
< 35 YRS 35-39 YRS > 39 YRS TOTAL
Clinical Pregnancies 321 223 67 611
Loss < 20 weeks 51 55 17 123
Singleton gestation or birth 219 139 40 398
Twin gestation or birth 38 23 4 65
Triplet gestation or birth 2 0 0 2
Outcome unknown 11 6 6 23
Multiple gestations/births (%)1 15.4 14.2 9.1 14.4
Early pregnancy loss rate (%)2 15.9 24.7 25.4 20.1
Singleton gestation/birth
Multiple gestation/birth
Loss < 20 weeks
Unknown outcome
23
39867
123

21
EXTENDED DATA REPORTING
No. centres reporting: 7 Note: Data from IVF and ICSI cycles were pooled due to the relatively small numbers of reported pregnancy outcomesfollowing IVF (n=144 for all ages). This figure does not include OD or frozen embryo transfers.
fiGUre 10: ivf & iCsi - PreGnAnCY oUtCome (%) bY AGe
Comment: In figure 10 the multiple PR was calculated as multiple pregnancies over all pregnancies. The rate is thus lower than the rate reported in table 9 which reported it as multiple gestations/births over all singleton plus multiple gestations/ births.
* Number of clinical pregnancies
< 35y (N*=321) 35-39y (N=223) > 39y (N=67)
100%
0%
Outcome unknown Multiple gestation/birth Singleton gestation/birth Loss < 2 weeks
3.4 2.78.9
12.5 10.36
68.262.3
59.7
15.924.7 25.4

22
EXTENDED DATA REPORTING
No. centres reporting: 9 Note: This table does not include cryopreservation in OD cycles.
No. centres reporting: 7 Note: Data do not include OD.
tAbLe 10: embrYo AnD bLAstoCYst CrYoPreservAtion
tAbLe 11: embrYo AnD bLAstoCYst CrYoPreservAtion - PreGAnCY oUtCome bY AGe
< 35 YRS 35-39 YRS > 39 YRS TOTAL
Cycles with embryo/blastocyst thawed 292 161 109 562
Cycles with embryo/blastocyst transfers 281 156 104 541
Average no. embryos/blastocysts transferred - - - 2.08
Clinical pregnancies 87 52 21 160
CPR/thaw (%) 29.8 32.3 19.3 28.5
CPR/transfer (%) 31 33.3 20.2 29.6
< 35 YRS 35-39 YRS > 39 YRS TOTAL
Clinical Pregnancies 74 46 20 140
Loss < 20 weeks 10 6 5 21
Singleton gestation or birth 29 21 11 61
Twin gestation or birth 8 6 1 15
Outcome unknown 27 13 3 43
Multiple gestations/births (%)1 21.6 22.2 8.3 19.7
Early pregnancy loss rate (%)2 13.5 13 25 15
1. Calculated at all multiple gestations/births over all singleton plus multiple gestations/ births2. Calculated at all early loss over all clinical pregnancies.

23
EXTENDED DATA REPORTING
No. centres reporting: 8 tAbLe 12: fresH ooCYte DonAtion CYCLes bY AGe of reCiPient
< 35 YRS 35-39 YRS > 39 YRS TOTAL
Aspirations - - - 801
Fertilisation by ICSI (%) - - - 72.8
Embryo/blastocyst transfers 60 141 525 726
Average no. embryos/blastocysts transferred 2.05 1.95 1.97 1.97
Clinical pregnancies 26 72 235 333
CPR/aspiration - - - 41.6%
CPR/transfer 43.3% 51.1% 44.8% 45.9%
Pregnancy outcome
Loss < 20 weeks 5 11 45 61
Singleton gestation or birth 14 40 136 190
Twin gestation or birth 2 10 26 38
Triplet or higher gestation or birth 1 0 2 3
Unknown 4 11 26 41
Multiple gestations/births (%)1 17.6 20 17.1 17.7
Early pregnancy loss rate 19.2 15.3 19.1 18.3
1. Calculated at all multiple gestations/births over all singleton plus multiple gestations/births

24
EXTENDED DATA REPORTING
No. centres reporting: 6 tAbLe 13: froZen ooCYte DonAtion CYCLes bY AGe of reCiPient WitH Donors < 35y
< 35 YRS 35-39 YRS > 39 YRS TOTAL
Cycles with embryos/blastocysts thawed 17 19 118 154
Cycles with embryos/blastocyst transfers 16 18 116 150
Clinical pregnancies 5 10 30 45
CPR/thaw cycle 29.4 52.6 25.4 29.2
CPR/transfer 31.2 55.6 25.9 30
Comment: Outcome of frozen cycles with donors > 35y and pregnancy outcome following all frozen OD could not be reported because of invalid data.

25
SUMMARY
2009 2010 2011 2012
Total no. centres 12 14 15 13
Aspirations 4512 4923 5643 4991
Fresh embryo transfers 3872 4319 4802 4193
Clinical pregnancies 1303 1595 1794 1567
Clinical PR/ aspiration 28.9% 32.4% 31.8% 31.4%
Clinical PR/ aspiration IVF 31.9% 30.8% 30.2% 28.2%
Clinical PR/ aspiration ICSI 27.9% 32.3% 30.7% 27.8%
Clinical PR/ aspiration OD - - 42% 41.6%
ICSI: % of ETs 63.2% 68.3% 70.1% 71.3%
tAbLe 14: overvieW 2009 - 2012

26
NOTES

27
NOTES

28
The Southern African Society of Reproductive Medicine & Gynaecological EndoscopySecretariat: PO Box 1935, Durban 4000, South Africa.
Tel: +27 31 368 8000 Fax: +27 31 368 6623Email: [email protected] Website: www.fertilitysa.org.za