simulation of operation of a medium sized …scs-europe.net/services/ess2002/pdf/log-13.pdf ·...
TRANSCRIPT

SIMULATION OF OPERATION OF A MEDIUM SIZED SEAPORT. CASE STUDY: PORT OF GDANSK
Andrzej Dzieliński, Jerzy Sukiennik Krzysztof Amborski Artur Pawłowski
Przemysław Kowalczuk Port of Gdansk Authority Co. Institute of Control & Industrial Electronics Zamknięta 18, 80-955 Gdansk Warsaw University of Technology Poland Koszykowa 75, 00-662 Warszawa, Poland
KEYWORDS Maritime application, port operation, container terminal simulation ABSTRACT This is the description of the activities and results obtained while performing the task 4.2 in the BALTPORTS-IT EU FP 5 project. The aim of this task is to improve the logistics processes at the Port of Gdansk using the simulation-based approach. The simulation has been used as a support tool to analyze the existing container terminal (Gdansk Container Terminal). In the future the tool will be also used to support the design of a new container terminal. TOOLS AND METHODOLOGY The simulation-based approach has been divided into several steps. At first we had to make a selection of tools and build a methodology for further activities. After an introductory analysis it was decided to use a custom-built software tools for simulating the port activities. This was the only kind of tools that could possibly meet our requirements. The general- purpose simulation software was considered as not appropriate in this case. The research team composed of WUT and Port of Gdansk members was given a simulation application – port simulator, an analysis, simulation and visualization program. However, it lacked several important features from the point of view of achieving our goals and it had to be substantially improved. One such improvement was prepared by WUT team at the beginning of the project. We have developed a small, but very helpful application for translation of output files. Other improvements are still under construction by UU team. Our work within the task 4.2 of BALTPORTS-IT Project was concentrated on nine main steps explained below:
a) Get the knowledge of the tools and develop short manuals for simulation program,
b) Develop an example input data for first simulations, c) Make the example simulations, d) Process, analyze and visualize the results of above
simulations, e) Get the real input data (existing infrastructure of
Port Gdansk) for simulations, f) Make the simulations with real input data, g) Verify the simulation model by comparing the
simulation results with existing situation, h) Perform optional system calibration,
i) Run suitable ‘final’ simulation Port Simulator A port simulation application is a large and powerful analysis tool for port logistic processes. However, it is still under construction and needs a lot of care and attention when being used. Simulator gets input data about port, runs simulation and provides statistic output data. Input data is divided into two categories:
- global point of view data, global relations of complex port’s operation,
- local point of view data, more detailed, corresponding to particular port’s elements.
Every simulation run is divided into several sequences, performed one by one.
- Read-in port’s maps and calibrate them, - Locate the approaching paths, port’s
channels, basins, etc., - Enter types and numbers of cargoes, - Define port’s terminals and land
infrastructure, - Define vehicles, - Enter global data i.e. flexibility of terminal
personnel working hours, - Define the end time of simulation, - Run simulation, - Write simulation results to output files.
Examples of simulation sequences screens are presented below on Fig.1-4.
Figure 1. Calibration of Port’s map

Figure 2. Approaches view, Port’s seaside map
Figure 3. Direct output of the simulation data to console
window
Figure 4. A map of the infrastructure of small container
terminal. On Fig.4 one can see from the right hand side: store, yard, gate and from the left-hand side: basin, channel, etc.
MS Excel Application As a data analysis tool a MS Excel spreadsheet has been used. MS Excel is a powerful application, useful for making various kinds of calculations. With Excel we can do analysis of numerical data and view the results in wide range and number of charts. We have decided to use this application because it is widely used for similar purposes, it is easily available and the spreadsheet is a really universal tool. In the beginning of work, Excel capabilities were used in the following way. Output files from simulation, past preprocessing are imported directly to spreadsheet. This is the base for calculations of demanded factors, making charts, data regrouping in sets.
Figure 5. Formatted simulation results in Excel window
Figure 6. Changes of an example factor ‘variance of queue
length’ (as a function of time) MS PowerPoint Application Simulation results are compiled in sets of factors and various types of charts. To present this we convert these to the set of slides using the format of Microsoft PowerPoint presentation, a program that we are using to make slideshows. This solution reduces the costs, of preparing the presentations and also allows a simple distribution of presentation files, because of the widespread use of MS Office package.

Data Post-processing Application Output files from simulation application are obtained in a specific format. Direct input of these files to an Excel spreadsheet is not possible. This is why it was decided to make a file translation tool. This tool, an application called ‘Proper’ is a simple console program. It is compatible with any 32-bit version of MS Windows (including XP). At the moment application contains two main features:
- translation of text data, i.e. char ‘.’ to char ‘,’,
- formatting and sorting the translated data according to many criteria i.e. remove not wanted export data and sort import data by categories.
Figure 7. Post-processing data files with application Proper
Figure 8. Access to translator on the website
OUTPUT FILE BEFORE POST-PROCESSING BY APPLICATION PROPER sklad11!period!1.000000!60.000000!importCargoQ!0!0.000
000!0.000000!0.000000!0.000000!0.000000!0.000000!0.00
0000
sklad11!period!1.000000!60.000000!exportCargoQ!0!0.000
000!0.000000!0.000000!0.000000!0.000000!0.000000!0.00
0000
sklad11!period!1.000000!60.000000!IaccompaniedRoroQ!0
!0.000000!0.000000!0.000000!0.000000!0.000000!0.00000
0!0.000000
sklad11!period!1.000000!60.000000!IunAccompaniedRoro
Q!0!0.000000!0.000000!0.000000!0.000000!0.000000!0.00
0000!0.000000
sklad11!period!1.000000!60.000000!IcontainerQ!0!0.00000
0!0.000000!0.000000!0.000000!0.000000!0.000000!0.0000
00
Output file after post-processing sklad11!period!3,000000!180,000000!IcontainerQ!1!1,0000
00!0,000000!0,000000!0,144285!0,351378!0,123467!397,8
45654
sklad11!period!4,000000!240,000000!IcontainerQ!0!0,0000
00!0,000000!0,000000!1,000000!0,000000!0,000000!397,8
45654
sklad11!period!5,000000!300,000000!IcontainerQ!1!2,0000
00!0,000000!0,000000!1,037212!0,189281!0,035827!1110,
247851
sklad11!period!6,000000!360,000000!IcontainerQ!0!0,0000
00!0,000000!0,000000!2,000000!0,000000!0,000000!1110,
247851
sklad11!period!7,000000!420,000000!IcontainerQ!0!0,0000
00!0,000000!0,000000!2,000000!0,000000!0,000000!1110,
247851
Figure 9. Examples of raw output data and post-processed output data
Another feature of Proper application is its readiness to work in web environment. At the moment it is possible to use a translator via the Internet and any kind of web browser. It is an introduction to a further work to elaborate the specification of full web based simulation application. Actual concept will use an ASP technology and Internet Information Server from Microsoft.
WHAT PORT SIMULATOR CAN DO? A simulation program generates four output files. All of these files have standard ASCII text format:
1) file containing data of storage and yard usage, StorData.out,
2) file containing data of terminal equipment usage, ResData.out,
3) file containing data of simulated vehicles usage, Vehcall.out,
4) file containing some additional information, results.txt.
Files one to three contain more than ten specific factors. These factors are related to simulated parts of port (storage, crane, quay, etc.) at the constant time interval. Below we can see the list of the most important factors contained in the reports, in example week-reports. Set of output files factors a) file StorData.out factors in:
- number of shipments in - mean of number of shipments in - standard deviation of number of shipments
in - variance of number of shipments in - time weighted mean of number of
shipments in - time weighted standard deviation of
number of shipments in - time weighted variance of number of
shipments in
b) file ResData.out factors in:
- number of times number of units of resource allocated was updated
- mean of number of units of resource allocated
- variance of number of units of resource allocated
- standard deviation of number of units of resource allocated
- time weighted mean of number of units of resource allocated
- time weighted variance of number of units of resource allocated
- time weighted standard deviation of number of units of resource allocated
- number of customers, which had to wait - mean of queuelength - variance of queue length - standard deviation of queue length - time weighted mean of queue length.
c) file Vehcall.out
factors in:
- DWT - Draught on arrival at the port - Draught on departure from the port. - Arrival time at the pilot on the approaches - Anchoring times on the approaches if it
takes place - Arrival time off berth - Arrival time at the berth - Start of unberthing procedures - Departure time from the berth - Departure time after leaving the pilot on
the approaches - Time used for clearing of the vessel and
crew. - Vehicle turnaround time
As we can see all the usable output data are statistic data. On the basis of this data it is possible to make statistic analysis of port’s functionality (like a complex organization and separated parts). PRACTICAL CONCLUSION OF SIMULATIONS Using the port simulator plus above tools (in full functional versions), the methodology assumed and suitable (realistic) input data we can support re-engineering processes referred to infrastructure of Port Gdansk. We can give the answers to questions like: “what will happen when …” in statistic sense, i.e.:
- What would be the change in a ship waiting time to unload after an increase in the area of yard by 10%, 25%, 50%,
- What effect the reduction / increase of one gantry crane has on terminal functionality,
- How an additional road to the terminal improves the economic factors,
- What is the number of optimal front lift trucks in current container terminal.
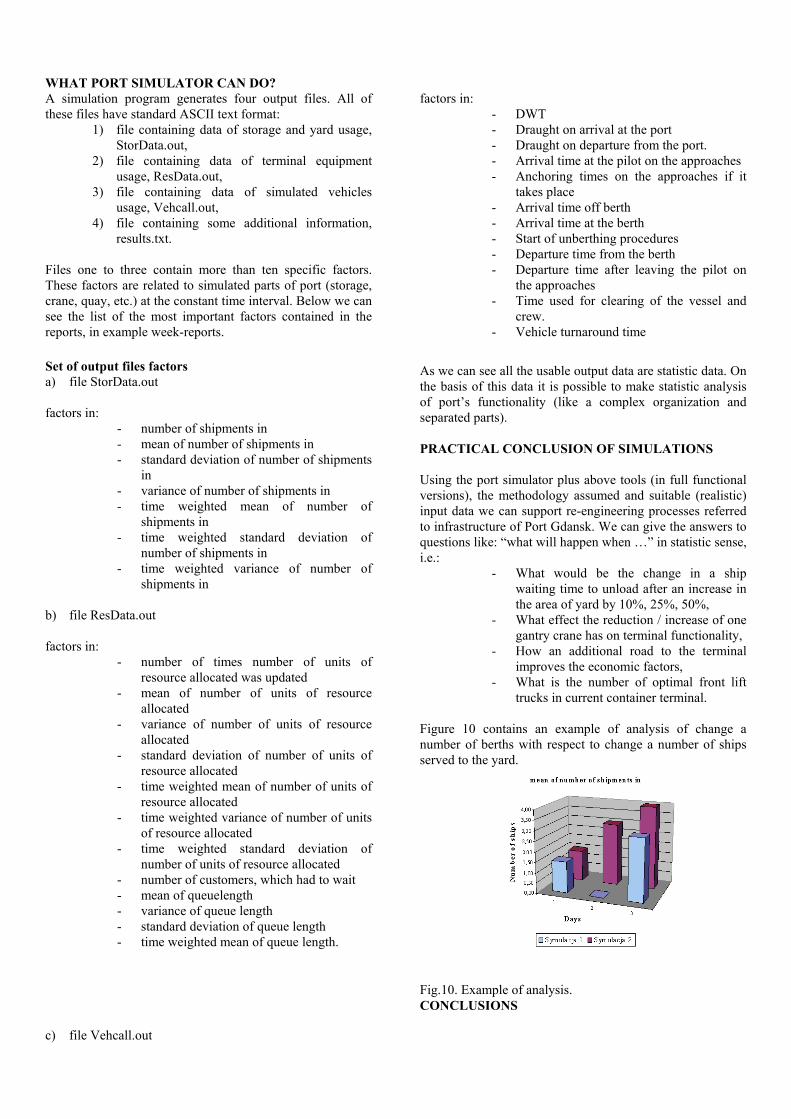
Figure 10 contains an example of analysis of change a number of berths with respect to change a number of ships served to the yard.
Fig.10. Example of analysis. CONCLUSIONS

The simulations performed give some guidelines as to how to proceed with port operation improvement. Several factors, like number of berths, number of port basins, number of gantry cranes etc. were taken into account and one may notice the influence of new investments in the port infrastructure, aquastructure and equipment on the operation capabilities. The results obtained are preliminary, but even they show clearly that some investments in the existing terminal equipment and setup can improve the situation significantly in terms of loading/unloading time, ship queue or number of shipments. The future work will be concentrated on the detailed simulation-based analysis of all the factors in question and their detailed effect on the port operation both in qualitative and quantitative terms. This will be possible when the new, improved version of the port simulator software is available. REFERENCES
Amborski, K., Jankowski, M., Kuszta, B. 1981 ‘‘Computer Assisted Modelling of Container Terminal Operation with its Region of Activity.” IASTED International Conference on Applied Modelling and Simulation, Lyon (France), Amborski, K., Kociecki, M. 1985 ‘‘Application of the Simulator GPSS-FORTRAN for Simulation of Container Terminal” (in German). Informatik-Fachberichte Simulationstechnik, Springer Verlag, Amborski, K. 1985 ‘‘Simulation of Container Terminal” (in German), Foerdern und Heben, Nr3. Amborski K., Dzielinski A. 2002 „Simulation of Container Terminal – a general approach”, European Simulation Multiconference ESM’02, June 3-5, 2002, Darmstadt (Germany). BIOGRAPHIES
Krzysztof Amborski is with Warsaw Technical University, Institute of Control and Industrial Electronics since 1964, when he received his M.Sc. in telecommunication specialising in Control Systems. 1971 he received M.A. in mathematics from University of Warsaw and 1972 Ph.D. from Warsaw Technical University. Since 1973 until now he is assistant professor there. Since 1998 he is parallel with the University of Applied Sciences in Darmstadt (Germany) as a professor at the Faculty of Computer Sciences. Andrzej Dzielinski is with Warsaw Technical University since 1983, when he received there his M.Sc. in electrical engineering specialising in Control Systems and receiving also Ph.D. in 1992 and D.Sc. in 2002. He is all the time with the Institute of Control and Industrial Electronics there, as an assistant professor. Jerzy Sukiennik is Chief of Computer Systems at the Gdansk Port Management.