system-wide issues for efficient use of...
TRANSCRIPT

SAMSUNG
System-wide Issues
for Efficient Use of E-SSD
김경호
Samsung Electronics

HBA Performance Improvement
By Chipset Driver Update
SAMSUNG
3 /16 2011.4.18
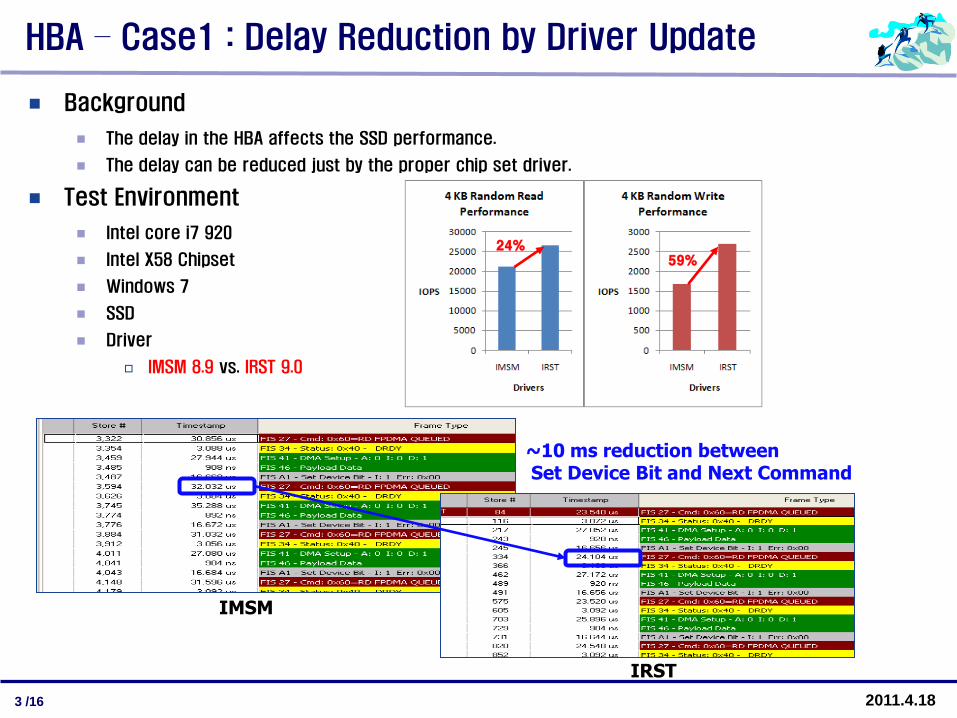
HBA – Case1 : Delay Reduction by Driver Update
Background
The delay in the HBA affects the SSD performance.
The delay can be reduced just by the proper chip set driver.
Test Environment
Intel core i7 920
Intel X58 Chipset
Windows 7
SSD
Driver
IMSM 8.9 vs. IRST 9.0
24%59%
IMSM
IRST
~10 ms reduction betweenSet Device Bit and Next Command

SAMSUNG
4 /16 2011.4.18
Background
System can get the full IOPS by Driver update.
Test Environment
Intel core i7 2600 @ 3.7 GHz (Quad-Core)
Intel P67 Express Chipset
Windows 7
Driver
Windows 7 Default Driver vs. IRST 9.0
HBA – Case2 : IOPS enhancement by Driver Update
Intel CoreI7 2600
Intel P67Express Chipset
SATAPorts
SSD
SSD
SSD
SSD
IRSTfor Intel Chipset
Windows 7
IOPS increased
For large requests (64 KB), the bandwidth scales up with SSDs.For small requests (4 KB), the IOPS is saturated at 80K for Windows 7 default driver.Just driver upgrade to IRST makes the IOPS scalable for the small requests.

SAMSUNG
5 /16 2011.4.18
Issues in RAID
SAMSUNG
6 /16 2011.4.18
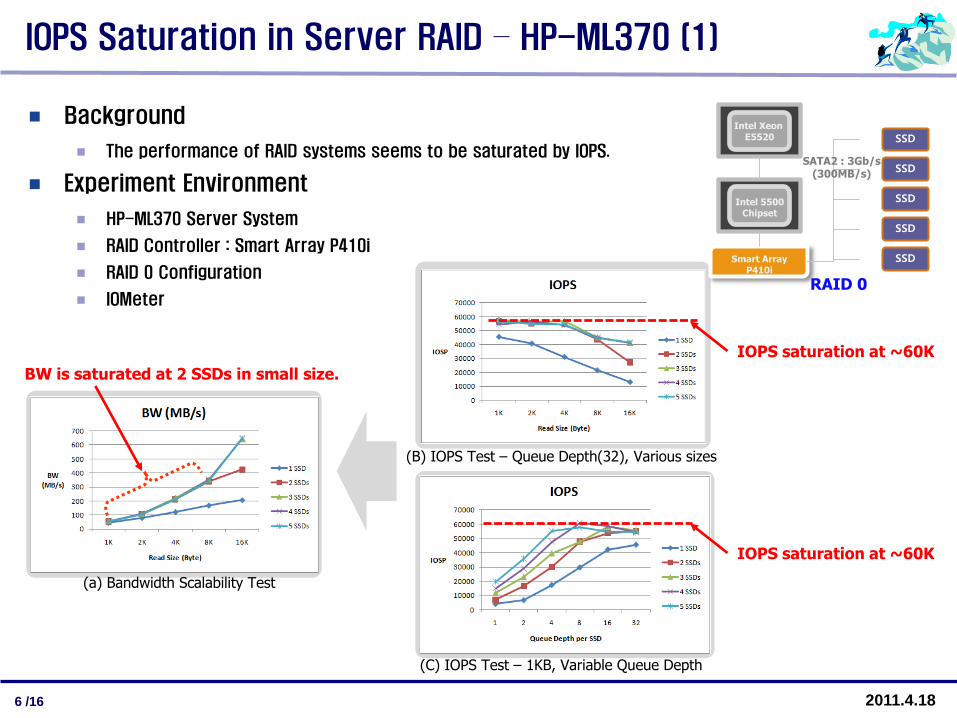
IOPS Saturation in Server RAID – HP-ML370 (1)
Background
The performance of RAID systems seems to be saturated by IOPS.
Experiment Environment
HP-ML370 Server System
RAID Controller : Smart Array P410i
RAID 0 Configuration
IOMeter
(a) Bandwidth Scalability Test
(C) IOPS Test – 1KB, Variable Queue Depth
Intel XeonE5520
Intel 5500Chipset
Smart Array P410i
SSD
SSD
SSD
SSD
SSD
RAID 0
IOPS saturation at ~60K
IOPS saturation at ~60K
BW is saturated at 2 SSDs in small size.
(B) IOPS Test – Queue Depth(32), Various sizes
SATA2 : 3Gb/s (300MB/s)

SAMSUNG
7 /16 2011.4.18
IOPS Saturation in Server RAID – Dell-T410 (2)
Background
The performance of RAID systems seems to be saturated by IOPS.
Experiment Environment
Dell-T410 Server System
RAID Controller : Dell PERC 6/I Adapter Raid Controller
RAID 0 Configuration
IOMeter
Intel XeonE5502
Intel 5500Chipset
PERC 6/I SAS RAID
Controller
SSD
SSD
SSD
SSD
SSD
RAID 0
PCIExpress
SATA2 : 3Gb/s (300MB/s)
Bandwidth is Scalable for Large Request,
but, not for Small Request.
IOPS seem to be saturated at ~30K.

SAMSUNG
8 /16 2011.4.18
Operating System Optimization

SAMSUNG
9 /16 2011.4.18
Problem : CPU Usage and SSD Bandwidth
Intel Corei3 530
Intel P55ExpressChipset
SSD
SSD
SSD
SSDSata Ports
SATA2 : 3Gb/s (300MB/s)
Background
Only I/O Treatment consumes the CPU resources.
This slide shows the capability of each CPU-Core.
Experiment Environment
Intel Core i3 530 @2.97 GHz, [Dual-Core]
Windows 7, Intel Driver is installed.
IOMeter : 4 KB Random Read
• When a core is used, the bandwidth is not scaled up with more than 2 SSDs.
Bandwidth saturation
Bandwidth reducesfor file system operations.
CPU Usage reaches 90 %.
HDD : Bandwidth and CPU Usage stay at very low level.

SAMSUNG
10 /16 2011.4.18
Background
Disk Interrupt Overhead are about 5 us ~ 35 us[1]
Interrupt handling can give burden to CPU for SSD of High IOPS.
Experiment
Windows 7
Measuring Tool : IOMeter
SSD (43K IOPS @ 4KB, Random Read, QD=32)
Read Latency @ 4KB, QD=1
220 us (SSD latency) + 60 us (Host latency : Intr. Handling + etc)
IOPS * Interrupt Service Time per IO
Assume that Interrupt handling overhead is 10 us,
Interrupt Handling Overhead per Second is 43K (IOPS) x 10 us = 0.43s.
Idea
Interrupt handling for group of commands[2]
Process/Processor-aware interrupt handling[3]
Improvement Point[1] : Interrupt Handling
5 us~ 35 us
[1] Branden Moore Thomas , En Moore , Thomas Slabach , Lambert Schaelicke, “Profiling Interrupt Handler Performance through Kernel Instrumentation”, Proceedings of the 21 st IEEE International
Conference on Computer Design, 2003
[3] Moore Thomas , En Moore , Thomas Slabach , Lambert Schaelicke, “Process-Aware Interrupt Scheduling and Accounting”, RTSS '06 Proceedings of the 27th IEEE International Real-Time Systems Symposium, 2006
[2] Salah, K., El-Badawi, K., and Haidari, F., “Performance Analysis and Comparison of Interrupt-Handling Schemes in Gigabit Networks”, International Journal of Computer Communications, Elsevier Science, Vol. 30(17) (2007), pp. 3425-3441.

SAMSUNG
11 /16 2011.4.18
Improvement Point[2] : Kernel Storage Stack
Background
Kernel Storage stack is designed based on the HDD rather than SSD. The characteristics are
changed like this:
Storage Kernel Stack Improvement Part
Disk Scheduler
Buffer Replacement
Lightening Block Device Driver Layer
Prefetching off
Swapping
* S Park, D Jung, J Kang, J Kim, “CFLRU: A Replacement Algorithm for Flash Memory”, Proceedings of the 2006 international conference on Compilers, architecture and synthesis for embedded systems
* J Kim, Y Oh, E Kim, J Choi, D Lee, “Disk Scheduler for Solid State Drives”, Proceedings of the seventh ACM international conference on Embedded software, 2009
* Matthew T. O’keefe , David J. Lilja , ” High performance solid state storage under linux“ in Proceedings of the 30th IEEE Symposium on Mass Storage Systems, 2010
* Mohit Saxena, Michael M. Swift, “FlashVM: revisiting the virtual memory hierarchy”, Proceedings of the 12th conference on Hot topics in operating systems, 2009
- Seek Time proportional to LBA distance
- Read/Write Symmetric
HDD
- Independent to LBA
SSD
- Read/Write Asymmetric
- Fast Read, Slow Write with Variation (GC)
- Even Faster than HDD
Ex1) SLC R/P/E : 25 us/200 us/1.5 msMLC R/P/E : 60 us/800 us/ 2.5 ms
Ex) Read : 0.28 msWrite (QD=1) : 0.1 msWrite (QD=32) : 1 ms
- Extremely Slow Access Time

SAMSUNG
12 /16 2011.4.18
TPC-C Analysis

SAMSUNG
13 /16 2011.4.18
Performance Comparison (SSD vs HDD)
Background
TPC-C data sizes are various.
In small data size (Small Warehouses), most read data can be hit by server-side cache.
In this case, SSD shows performance similar to that of HDD.
Experiment Environment
Client : Benchmark Factory
Server
DELL T710 (Intel XEON Quad), MySQL, Windows Server 2008
SSD, HDD(WD5000AAKS)
10 ~ 100 warehouses (700MB ~ 7 GB)
100 users, no delay
3 GB RAM (Size Fixed)
The performance ratio increasesas the number of warehouses increases.
The read load increasesas the number of warehouses increases.
SAMSUNG
14 /16 2011.4.18
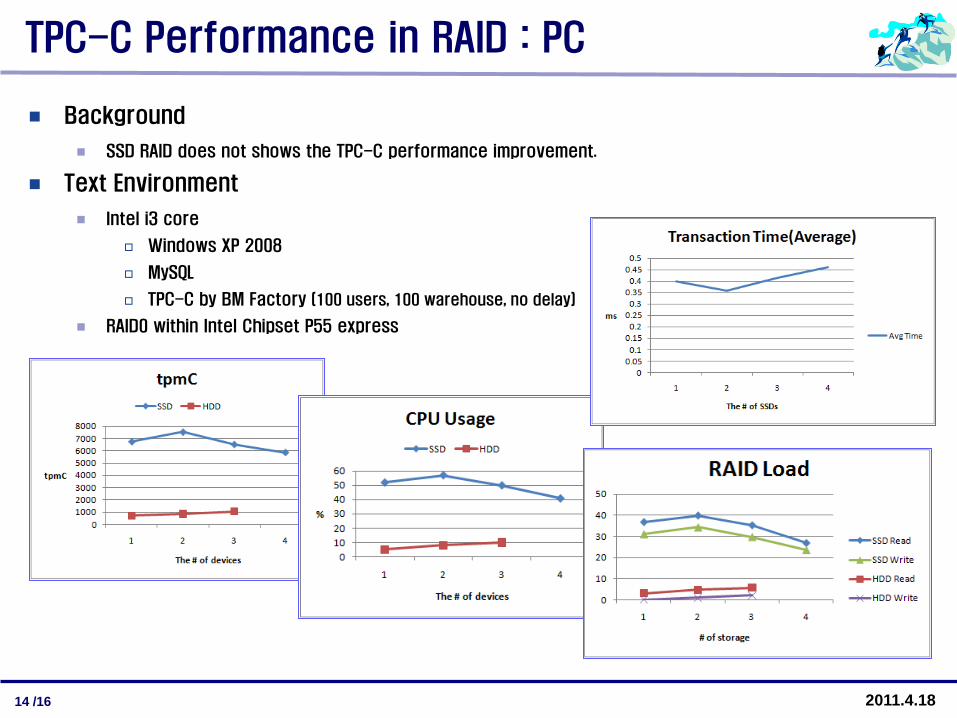
TPC-C Performance in RAID : PC
Background
SSD RAID does not shows the TPC-C performance improvement.
Text Environment
Intel i3 core
Windows XP 2008
MySQL
TPC-C by BM Factory (100 users, 100 warehouse, no delay)
RAID0 within Intel Chipset P55 express

SAMSUNG
15 /16 2011.4.18
TPC-C Performance in RAID : HPML370 G6
Background
SSD RAID does not shows the TPC-C performance improvement.
Text Environment
HP ML370 G6
Intel Xeon Quad Core, Windows Server 2008
MySQL
TPC-C by BM Factory (100 users, 100 warehouse, no delay)
RAID0 within SMART Array P410i
SAMSUNG
16 /16 2011.4.18
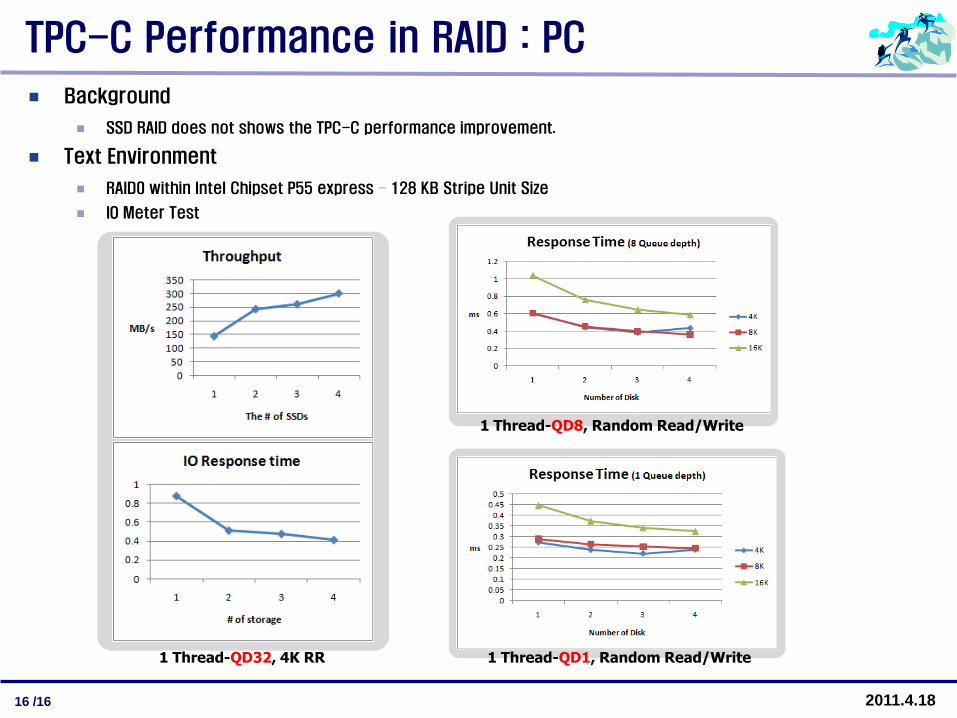
TPC-C Performance in RAID : PC
Background
SSD RAID does not shows the TPC-C performance improvement.
Text Environment
RAID0 within Intel Chipset P55 express – 128 KB Stripe Unit Size
IO Meter Test
1 Thread-QD32, 4K RR
1 Thread-QD8, Random Read/Write
1 Thread-QD1, Random Read/Write