the economic benefits of mainland tourists for … kong development institute occasional paper no....
TRANSCRIPT

The Economic Benefits of Mainland Tourists for Hong Kong:
The Individual Visit Scheme (IVS) and Multiple Entry Individual Visit
Endorsements (M-Permit)
Yun-Wing Sung
Alex C.Y. Ng, Yuhao Wu and Alex W.H. Yiu
Shanghai-Hong Kong Development Institute
滬港發展聯合研究所
September 2015

Shanghai-Hong Kong Development Institute
Occasional Paper No. 34
About the Authors
Dr. Yun-Wing Sung is Co-Director of the Shanghai-Hong Kong Development Institute,
Associate Director of the Hong Kong Institute of Asia-Pacific Studies, and Adjunct
Professor of the Department of Economics at The Chinese University of Hong Kong.
Alex C.Y. Ng is a former research assistant of the Hong Kong Institute of Asia-Pacific
Studies.
Yuhao Wu is a research assistant of the Shanghai-Hong Kong Development Institute.
Alex W.H. Yiu is a research assistant of the Hong Kong Institute of Asia-Pacific Studies.
Downloadable at: http://www.cuhk.edu.hk/shkdi/OP/OP34.pdf

1
The Economic Benefits of Mainland Tourists for Hong Kong:
The Individual Visit Scheme (IVS) and Multiple Entry Individual
Visit Endorsements (M-Permit)
內地旅客對香港的經濟貢獻︰自由行及一簽多行
Abstract
The inauguration of the Individual Visit Scheme (IVS) in 2003 liberalized Mainland tourist visits to Hong Kong. This led to an explosive growth of Mainland visitors and severe overcrowding in Hong Kong. The adoption of Multiple Entry Individual Visit Endorsements (M-Permit) for residents of Shenzhen in 2009 exacerbated the problem.
Analysis of the economic benefits of tourism is important for policy making in Hong Kong. Though official estimates of benefits (in value-added/employment) of all visitors are available every year since 2000, estimates for key sub-groups of visitors, namely Mainland and non-Mainland, IVS mainland and non-IVS mainland, and M-Permit IVS and non-M-Permit IVS, are largely unavailable. This paper fills the gaps in official estimates by disaggregating official estimates of the benefits of all visitors from 2007 to 2013 by the above sub-groups. For each sub-group, the benefits are further disaggregated by industry (hotels, restaurants, retail trade, cross-boundary transport, and others).
Main results are as follows. In 2013, the contributions to value-added (employment in 10-3 man-years) of each M-Permit visitor, non-M-Permit IVS visitor, non-IVS mainland visitor, and non-Mainland visitor were respectively $502 (1.67), $1,764 (5.33), $1,709 (4.96), and $2,449 (5.17). Per person, M-Permit visitors generated the least value-added and employment; non-Mainland visitors generated the most value-added while non-M-Permit IVS visitors generated the most employment. IVS includes two very different types of visitors: M-Permit (non-M-Permit) visitors with low (high) per capita benefits. The value-added (employment in 10-3 man-years) of IVS visitors, Mainland visitors, and all visitors (which were weighted averages of their sub-components) were respectively $1,205 (3.71), $1,370 (4.12), and 1,639 (4.38) in 2013. All visitors, Mainland visitors, IVS visitors, and M-Permit visitors respectively generated 4.2%, 2.6%, 1.6%, and 0.3% of GDP, and also generated 6.4%, 4.5%, 2.7%, and 0.5% of total employment in 2013. The patterns of results are similar for other years.

2
In 2013, though the per capita spending of IVS visitors was 13% higher than that of non-Mainland visitors, the per capita value-added (employment) generated by IVS visitors was only 49% (72%) of that of non-Mainland visitors. The spending of IVS visitors is weighted heavily towards Retail Trade (shopping), which generates little value-added or employment per dollar of spending as most of the goods sold are imported. Moreover, IVS visitors generate little value-added or employment in cross-boundary transport as most of them come from nearby areas. Per capita visitors’ spending can be a poor indicator of per capita value-added.
While the contributions of IVS visitors to total value-added and employment were not large (1.6% of GDP and 2.7 % of total employment in 2013), the contribution of IVS visitors to the growth of employment was large as tourism is labour intensive. From 2004 to 2013, the increase in all visitors (IVS visitors) accounted for 24.3% (18%) of the increase in total employment in Hong Kong. Among the four key industries of Hong Kong, tourism was number one contributor to the increase in employment. Increase in M-Permit visitors from 2010 to 2013 likewise contributed little to growth of GDP (1.1%), but contributed more to growth of employment (4.5%).
In April 2015, the Central Government tightened the restriction on Shenzhen residents to visit Hong Kong (one visit a week instead of unlimited multiple entries) in response to severe overcrowding. The economic impact should be small as the economic contributions of M-Permit visitors were small. However, the Hong Kong tourist industry was co-incidentally heading into a severe recession due to other factors. To stimulate tourism, there was a proposal to add more cities in China (e.g., Xian, Qingdao, and Harbin) to the present list of 49 cities under the IVS. The proposal is worth considering as the per capita benefits generated by non-M-Permit IVS visitors are much larger than those by M-Permit visitors. To optimize the limited capacity to receive tourists in Hong Kong, it is rational to substitute high value-added visitors for low value-added ones.
摘要
2003 年開始實施的「個人遊」計劃(又稱:自由行)放寬了內地遊客來港的限制,引致內地來港旅客數目急劇增長,造成過度擠逼。2009 年深圳常住居民可通過「一簽多行」訪港,問題更形惡化。
分析旅遊業的經濟貢獻對香港甚為重要,政府雖然提供了 2000 年以來所有旅客每年產生的經濟利益(增加值及就業)的估計,卻沒有提供旅客的

3
主要群組(內地與非內地、自由行與非自由行、及一簽多行與非一簽多行)經濟利益的完整估計。本文把 2007 年至 2013 年的官方估計按上述群組細分,彌補了官方估計的不足。本文亦把每一個群組產生的經濟利益按不同行業(酒店、餐飲、零售、跨境運輸及其他)進一步細分。
本文主要結果如下︰在 2013 年,每位一簽多行旅客、非一簽多行旅客、非自由行內地旅客及非內地旅客產生的增加值,依次為 502、1764、1709、及 2449 港元;而產生的就業(以 10
-3 人計算)依次為 1.67、5.33、4.96 及
5.17。按每位旅客計算,一簽多行產生的增加值及就業俱為最低,非內地旅客產生的增加值最高,而由非一簽多行旅客產生的就業則最多。自由行包括兩類截然不同的旅客︰低增值的一簽多行旅客,及高增值的非一簽多行旅客。自由行旅客、內地旅客及所有旅客產生之經濟利益為其群組內子組別的加權平均。在 2013 年,以上三個旅客群組產生的人均增加值依次為 1205、1370
及 1639港元。其產生的人均就業(以 10-3人計算)依次為 3.71、4.12及 4.38。
在同一年,所有旅客、內地旅客、自由行旅客及一簽多行旅客對增加值的貢獻依次為 4.2%、2.6%、1.6%及 0.3%,而其對總就業的貢獻依次為 6.4%、4.5%、2.7%及 0.5%。其他年份的結果亦相類似。
在 2013 年,自由行旅客的人均消費較非內地旅客高 13%,可是前者的人均增加值(就業)卻只有後者的 49%(72%)。自由行旅客的消費集中在零售業,以購買入口貨為主,於本地產生的經濟利益亦較低。此外,自由行旅客多數來自鄰近地區,在運輸行業產生的利益較低。因此,旅客的人均消費並非其人均增加值的可靠指標。
自由行旅客對增加值及就業的貢獻雖然不大(分別佔 2013 年 GDP 及就業的 1.6% 和 2.7%),可是旅遊業屬於勞工密集行業,其對就業增長的貢獻卻甚大。2004至 2013年間,香港就業增長有 24.3%(18%)源於所有旅客(自由行旅客)的增長。旅遊業對就業增長的貢獻位居香港四個主要行業之首。在 2010 至 2013 年間,香港 GDP(就業)的增長有 1.1%(4.5%)來自一簽多行旅客的增長。
為了減少旅客過度擠逼,中央政府在 2015 年 4 月把「一簽多行」改為「一周一行」。一簽多行產生的經濟利益不高,因此該政策對香港的經濟影響應該不大。不過,受其他因素影響,香港旅遊業卻於此時步入嚴重衰退。有論者建議中央開放更多城市(例如西安、青島和哈爾濱)參與自由行,來刺激旅遊業。因為非一簽多行產生的人均利益遠高於一簽多行,所以此建議值得考慮。香港旅客容量有限,需要以高增值旅客替代低增值旅客,來優化旅客結構。

4
1. Introduction
The explosive growth of Mainland visitors under the Individual Visit Scheme
(IVS) has led to overcrowding and escalating social tensions with the local
population in Hong Kong (Sung 2014: 4). Before the inauguration of IVS in mid-
2003, Mainland tourist visits to Hong Kong were restricted to group tours. The
flexibility of IVS facilitated visits to Hong Kong, and the number of IVS visitors rose
from less than 0.7 million in 2003 to over 31 million in 2014, accounting for 66%
of Mainland visitors and 51% of all visitors in 2014.
The rapid growth of IVS visitors has accelerated since April 2009, when the
Central Government allowed permanent residents in Shenzhen to visit Hong Kong
on one-year Multiple Entry Individual Visit Endorsements (M-Permit). M-Permit
visitors grew explosively from under 1.5 million in 2009 to nearly 15 million in
2014, accounting for over 47% of IVS visitors in 2014. Of the increase in IVS
visitors from 2009 to 2014, 65% were M-Permit visitors.1
As a result of severe social tensions in Hong Kong, the Central Government
announced that, starting April 13 2015, Shenzhen would stop issuing M-Permits,
which would be superseded by “one trip per week” Individual Visit Endorsements
(However, M-Permits already issued would still be effective till they expire in a
year after the original date of issue). The Hong Kong Special Administrative Region
Government (HKSAR Government) estimated that the change would reduce M-
Permit visitors by about 30% (or about 4.6 million) eventually (when all existing
M-Permits expire).
It is commonly believed that the economic contributions of M-Permit
visitors to Hong Kong are quite limited. Over 90% of M-Permit visitors are same-
day visitors (instead of overnight visitors). As a result, their per capita spending in
Hong Kong is quite low, around $2,300 in 2012 (Commerce and Economic
Development Bureau, 2013), which was less than half of the average for all
visitors.
To gauge the economic contribution of tourists, value-added is a better
measure than tourists’ spending. In Hong Kong, the value-added of tourism is
usually much less than tourists’ spending because visitors in Hong Kong spend
1 See Section 3 below for details.

5
heavily on shopping (Sung 2014:1). Most shopping items in Hong Kong are
imported and they do not directly generate value-added for Hong Kong. This is
especially true for M-Permit visitors as their spending is very heavily weighted
towards shopping.
In addition to value-added, employment generated is also an important
measure of the economic contribution of tourism. However, as stressed in the
author’s previous paper titled “Economic Benefits of the Independent Visitor
Scheme for Hong Kong: How Large are They?” (Sung 2014), official estimates of
value-added/employment by different types of tourists are very incomplete.
Though official estimates of value-added/employment of all visitors are available
every year since 2000, estimates for IVS visitors are only available for a few
selected years (2004 to 2009 and 2012). Estimates for M-Permit visitors and for
Mainland and non-Mainland visitors are not available at all.
Sung’s 2014 paper filled in some of the gaps in official estimates. The
official estimates of value-added/employment of all visitors in 2009 and 2012
were disaggregated into those generated by Mainland vs. non-Mainland visitors.
Value-added/employment of Mainland visitors were further disaggregated into
those generated by IVS vs. non-IVS visitors. Sung found that, in 2012, the per
capita value-added (employment) generated by IVS visitors was 49% (28%) lower
than that generated by non-Mainland visitors. In comparison with Non-Mainland
visitors, the spending of IVS visitors is much more (less) heavily weighted towards
Retail Trade (Hotels), which has a relatively low (high) rate of value-
added/employment generation.
This paper extends Sung’s 2014 paper in four ways. First, the value-
added/employment estimates for IVS visitors are further disaggregated into those
for M-Permit and for other (non-M-Permit) IVS visitors. Second, estimates are
done for five more years, namely, 2007, 2008, 2010, 2011, and 2013 in addition to
those of 2009 and 2012 (a complete time series from 2007 to 2013 is thus
presented in this paper). 2 Third, the method used to estimate value-
added/employment generated in cross-boundary transport (an important item in
2 Estimates for M-Permit visitors were done from 2009 to 2013, as M-Permit only started in 2009.

6
tourists’ expenditure) is further refined. 3 Fourth, better data are used in
estimation4.
A number of M-Permit visitors have acted as parallel traders and their
activities have generated a lot of conflicts with local residents who live near
border areas. While Hong Kong is a free port, the tariff differential between Hong
Kong and the Mainland encourages a number of M-Permit visitors and Hong Kong
residents carry consumer goods from Hong Kong to the Mainland for resale
through multiple trips in the same day. The prevalence of counterfeit consumer
goods in the Mainland market also strengthened Mainland consumers’
preference for goods in Hong Kong. The activities of parallel traders have led to
severe congestion and overcrowding in border areas. There were demonstrations
and even physical assaults on tourists suspected of taking part in parallel trading
in early 2015.
Since the curb on M-Permits in April, the agitation against parallel traders
has diminished. This cannot be attributed to the effectiveness of the curb as M-
Permits already issued would still be effective till a year after the date of issue.
Moreover, there is no curb on Hong Kong residents to take part in parallel trade,
and they can take up any slack from the curb on M-Permits. The decline in parallel
trade can be attributed to four factors. First, the Mainland has stiffened customs
inspection. Second, the Mainland has slashed tariffs on hot items in parallel trade
in May 2015.5 Third, Shenzhen has established large scale duty-free shopping
malls in its bonded areas.6 Fourth, as detailed below, tourist arrivals from the
Mainland have stagnated or even declined.
Ironically, even before the imposition of curbs on M-Permit visitors, Hong
Kong’s tourist industry was stagnating or even heading into a recession. The rate
of growth of tourist arrivals slowed down from double digit rates during 2009 to
2014, to 4.9% in the first quarter of 2015 and fell further to an anemic 0.5% in the
second quarter (over the same quarters in the previous year). Worse still, visitors
are spending less: Hong Kong’s export of travel services in the first and second
quarters of 2015 declined respectively by 4.1% and 3.7% over the same quarters
3 See Footnote 16 of Appendix 3 for details.
4 See Footnote 9 below.
5 Hong Kong Economic Journal, May 10, 2015.
6 Sing Tao Daily, June 8, 2015, p. A1.

7
in the previous year. Hong Kong’s retail sales suffered and fell respectively by
2.3% and 0.8% in the first and second quarters of 2015 (over the same quarters in
the previous year).
The recession in Hong Kong tourism can be attributed to three factors.
First, the appreciation of the Hong Kong dollar (which is linked to the strong US
dollar), played an important role. Second, as a result of the anti-corruption
campaign in China, Mainland tourists are spending less on items of conspicuous
consumption. Third, Mainland tourists are less attracted to Hong Kong, partly due
to overcrowding of tourist facilities in Hong Kong, and also partly due to the
hostility of local residents towards mainlanders. While the number of Mainland
tourists going to other destinations has been growing rapidly, IVS visitors to Hong
Kong fell by 7.5% in the second quarter of 2015 (over the same quarter in the
previous year), reversing a decade of double digit growth.
As Hong Kong tourism is heading into a recession, the public agitation
against M-Permit and IVS visitors may soon dissipate. Though the policy urgency
of curbs on M-Permit has faded, the estimation of the economic contributions of
M-Permit visitors and other types of visitors is nevertheless an important issue.
Policy making should be based on knowledge instead of ignorance.
This paper is organized as follows. Besides the introductory section, Section
2 discusses the conceptual issues involved in estimating the economic benefits of
tourism. Official estimates of value-added/employment of tourism are also
presented in the context of the major industries of the Hong Kong economy.
Section 3 reviews the growth of tourism in terms of visitor arrivals and spending.
Section 4 estimates the value-added/employment of different types of visitors
(Mainland vs. non-Mainland, IVS vs. non-IVS, and M-Permit vs non-M-Permit).
Section 5 estimates the shares of GDP (employment) growth from 2004 to 2013
accounted for by the growth of value-added (employment) of all visitors and of
IVS visitors. Section 6 covers the potential biases and limitations of our estimates.
Section 7 concludes.

8
2. Estimation of economic benefits of tourism: Official estimates and conceptual
issues
The definition of “tourist industry” is problematic because most “tourist enterprises” are available also to local residents, and many tourists purchase goods and services from enterprises which predominantly cater to the needs of local residents (e.g., shops or retail trade). In standard mainstream models, the tourist industry is defined from the viewpoint of tourists’ spending. Tourists spend on many different industries, e.g., hotels, taxis, and retail trade. The tourist industry is treated as a weighted average of outputs of these industries. The weights are the expenditures of tourists on each industry. The same methodology is used in official estimates and also in this paper.
2.1 Official estimates of value-added/employment of tourism
The HKSAR government has designated tourism as one of the four “key industries” of Hong Kong (namely, Financial Services, Tourism, Trading and Logistics, and Professional and Other Producer Services). Tables 1 and 2 show respectively the official estimates of the contributions to value-added and employment of the four key industries from 2004 to 2013.
In terms of value-added, Tourism is by far the smallest of the four key industries (5% of GDP in 2013). In terms of employment, Tourism is slightly bigger than Financial Services (7.2% vs. 6.2% in 2013), but still much smaller than Trading and Logistics (20.6%), and Professional Services and Other Producer Services (13.3%). It should be noted the share of tourism in employment is much higher than its share in GDP while the opposite is true for Financial Services. This shows that Tourism is much more labour intensive than Financial Services.
Tourism is disaggregated into outbound and inbound tourism. As expected, inbound tourism accounted for the major part of the GDP and employment generated by tourism. Inbound tourism is further disaggregated into 5 sub-sectors, namely, Retail Trade, Accommodation Services, Food and Beverage Services, Cross-Boundary Passenger Transport Services, and Others. Retail Trade is the largest sector in value-added as well as employment, showing that inbound tourists spend a lot on shopping.

9
Table 1 Direct value-added generated by inbound visitors in comparison with those of four key industries ($ billion), 2004-2013
Industries 2004 2007 2008 2009 2010 2011 2012 2013
(1) Financial Services 168.3 322.6 277.1 255.9 284.2 305.3 319.3 346.0
(13.1%) (20.1%) (17.1%) (16.2%) (16.4%) (16.1%) (15.9%) (16.5%)
(2) Tourism 38.7 54.0 44.7 51.0 74.6 86.2 94.6 105.9
(3%) (3.4%) (2.8%) (3.2%) (4.3%) (4.5%) (4.7%) (5.0%)
(A) Outbound 10.3 12.8 7.5 10.7 15.4 14.1 15.4 16.8
(0.8%) (0.8%) (0.5%) (0.7%) (0.9%) (0.7%) (0.8%) (0.8%)
(B) Inbound (all visitors) 28.4 41.3 37.1 40.3 59.2 72.1 79.1 89.0
(2.2%) (2.6%) (2.3%) (2.5%) (3.4%) (3.8%) (3.9%) (4.2%)
i. Retail Trade 6.6 11.1 12.5 13.3 16.9 22.7 26.4 32.0
(0.5%) (0.7%) (0.8%) (0.8%) (1.0%) (1.2%) (1.3%) (1.5%)
ii. Accommodation Services
7.5 12.4 12.9 9.8 16.1 23.2 25.0 25.6
(0.6%) (0.8%) (0.8%) (0.6%) (0.9%) (1.2%) (1.2%) (1.2%)
iii. Food and Beverage Services
3.5 4.5 5.0 4.5 6.3 7.9 9.1 10.0
(0.3%) (0.3%) (0.3%) (0.3%) (0.4%) (0.4%) (0.5%) (0.5%)
iv. Cross-Boundary Passenger Transport Services
7.5 9.2 2.5 8.0 13.8 10.5 10.0 11.7
(0.6%) (0.6%) (0.2%) (0.5%) (0.8%) (0.6%) (0.5%) (0.6%)
v. Others 3.3 4.1 4.3 4.7 6.1 7.7 8.6 9.7
(0.3%) (0.3%) (0.3%) (0.3%) (0.4%) (0.4%) (0.4%) (0.5%)
(3) Trading and Logistics 354.4 408.9 414.7 377.8 439.6 485.4 495.4 500.5
(27.6%) (25.5%) (25.6%) (23.9%) (25.3%) (25.5%) (24.6%) (23.9%)
(4) Professional Services and Other Producer Services
139.6 181.8 197.6 201.5 216.1 235.9 257.6 260.2
(10.9%) (11.3%) (12.2%) (12.7%) (12.4%) (12.4%) (12.8%) (12.4%)
Four Key Industries 701.0 967.3 934.1 886.2 1,014.5 1,112.8 1,166.8 1,212.5
(54.5%) (60.3%) (57.7%) (56.0%) (58.4%) (58.5%) (58%) (57.8%)
All Industries 1,285.3 1,605.2 1,620.0 1,581.8 1,737.7 1,901.0 2,013.1 2,097.5
(100%) (100%) (100%) (100%) (100%) (100%) (100%) (100%)
Figures in brackets represent percentage shares of GDP. Sources: Section on the four key industries at the website of the Census and Statistics Department.

10
Table 2 Direct employment generated by inbound visitors in comparison with those of four key industries (thousand)
Industries 2004 2007 2008 2009 2010 2011 2012 2013
(1) Financial Services 169.4 192.7 206.1 211.4 216.7 226.3 228.8 231.7
(5.2%) (5.5%) (5.9%) (6.1%) (6.2%) (6.3%) (6.3%) (6.2%)
(2) Tourism 154.4 191.4 194.8 192.2 215.1 235.9 250.9 269.7
(4.7%) (5.5%) (5.6%) (5.5%) (6.2%) (6.6%) (6.9%) (7.2%)
(A) Outbound 25.8 31.3 33.6 28.7 27.2 29.7 32.1 31.9
(0.8%) (0.9%) (1.0%) (0.8%) (0.8%) (0.8%) (0.9%) (0.9%)
(B) Inbound (all visitors) 128.6 160.0 161.2 163.6 187.8 206.3 218.8 237.8
(3.9%) (4.6%) (4.6%) (4.7%) (5.4%) (5.8%) (6.0%) (6.4%)
i. Retail Trade 52.0 74.0 75.9 82.2 88.8 91.3 100.2 112.6
(1.6%) (2.1%) (2.2%) (2.4%) (2.6%) (2.6%) (2.7%) (3.0%)
ii. Accommodation Services
23.6 29.6 28.5 27.1 34.5 39.0 39.4 39.8
(0.7%) (0.9%) (0.8%) (0.8%) (1.0%) (1.1%) (1.1%) (1.1%)
iii. Food and Beverage Services
32.5 31.2 31.3 27.9 37.3 42.8 45.9 48.8
(1.0%) (0.9%) (0.9%) (0.8%) (1.1%) (1.2%) (1.3%) (1.3%)
iv. Cross-Boundary Passenger Transport Services
8.3 11.1 11.3 11.6 11.7 13.4 13.6 14.0
(0.3%) (0.3%) (0.3%) (0.3%) (0.3%) (0.4%) (0.4%) (0.4%)
v. Others 12.1 14.1 14.2 14.8 15.5 19.7 19.7 22.5
(0.4%) (0.4%) (0.4%) (0.4%) (0.4%) (0.6%) (0.5%) (0.6%)
(3) Trading and Logistics 785.2 836.2 820.2 783.9 778.2 774.4 764.9 767.2
(23.9%) (24.0%) (23.4%) (22.6%) (22.4%) (21.6%) (20.9%) (20.6%)
(4) Professional Services and Other Producer Services
392.8 438.1 457.0 456.2 460.1 469.4 483.0 495.6
(12.0%) (12.6%) (13.0%) (13.1%) (13.2%) (13.1%) (13.2%) (13.3%)
Four Key Industries 1,501.7 1,658.3 1,678.1 1,643.8 1,670.1 1,706.0 1,727.6 1,764.2
(45.8%) (47.6%) (47.8%) (47.4%) (48.0%) (47.7%) (47.2%) (47.3%)
All Industries 3,279.1 3,480.5 3,509.8 3,470.3 3,478.6 3,579.5 3,657.1 3,728.5
(100%) (100%) (100%) (100%) (100%) (100%) (100%) (100%)
Figures in brackets represent percentage shares of total employment. Sources: Section on the four key industries at the website of the Census and Statistics Department.

11
As mentioned above, the HKSAR government has estimated the value-added/employment of IVS tourists for selected years, and these official estimates are shown in Table 3. The 2012 estimates were done by the Commerce and Economic Development Bureau (2013). The 2004 to 2009 estimates were done by the Economic Analysis and Business Facilitation Unit (EABF). It should be noted that the EABF estimated the benefits of IVS instead of the benefits of IVS visitors. The inauguration of IVS has spurred additional Mainlanders to visit Hong Kong by instituting a more flexible and convenient arrangement to visit Hong Kong than group tours. The incremental visitors (or additional visitors) spurred by IVS is less than the increase in total number of IVS visitors because some Mainland visitors would shift from group tours to IVS after the institution of IVS. In other words, there would be more Mainland visitors coming on group tours if IVS had not been instituted.7
It is known that the EABF has also estimated the value-added/employment of incremental IVS visitors in 2012, but the results were not released. For 2012, the only official estimates of value-added/employment on IVS visitors were released by the Commerce and Economic Bureau, which were estimates of value-added/employment of all IVS visitors instead of incremental IVS visitors. It appears that the government has chosen to release estimates for all IVS visitors instead of estimates for incremental IVS visitors.
This paper focuses on total IVS visitors instead of incremental IVS visitors because the number of incremental visitors spurred by IVS is very difficult to estimate. The EABF estimates rely on interviewees’ assessments of number of additional trips spurred by IVS. Such assessments are highly subjective. Moreover, the concept of benefits generated by IVS visitors is more intuitive than the concept of benefits generated by IVS.
7 Besides direct value-added/employment generated, the EABF has also estimated overall benefits which include
benefits from induced consumption and investment (see the paragraph on Short Run: Neo-Keynesian Models in the next section).

12
Table 3 Value-added and employment generated by tourism (official estimates), 2004-2013
Value-added ($billion)
Employment (thousand)
IVS visitors All inbound visitors
IVS visitors All inbound visitors
2004
2.7 28.4
18.9 128.6
(0.2%) (2.2%)
(0.6%) (3.8%)
2005
2.8 32.9
19.9 136.8
(0.2%) (2.4%)
(0.6%) (4.1%)
2006
4.3 36.2
31.5 144.9
(0.3%) (2.5%)
(0.9%) (4.2%)
2007
7.5 41.3
41.2 160.0
(0.5%) (2.6%)
(1.2%) (4.6%)
2008
8.0 37.1
44.5 161.2
(0.5%) (2.3%)
(1.3%) (4.6%)
2009
10.1 40.3
53.8 163.6
(0.6%) (2.5%)
(1.6%) (4.7%)
2010
- 59.2
- 187.8
- (3.4%)
- (5.4%)
2011
- 72.1
- 206.3
- (3.8%)
- (5.8%)
2012
26.1 79.1
114.3 218.8
(1.3%) (3.9%)
(3.1%) (6.0%)
2013
- 89.0
- 237.8
- (4.2%)
- (6.4%)
Figures in brackets represent percentage shares of GDP and total employment. Sources: For value-added and direct employment generated by IVS visitors, the 2004-09 figures are obtained from the EABF (Economic Analysis and Business Facilitation Unit), 2010; 2012 figures are from the CEDB (Commerce and Economic Development Bureau), 2013. For value-added and employment generated by all inbound visitors, figures are obtained from the website of the Census and Statistics Department.
For consistency, Table 3 gives the estimates of value-added/employment of all IVS visitors instead of incremental IVS visitors. From the results of the 2004-2009 EABF estimates, we first calculate the per capita value-added/employment generated by IVS visitors (by dividing the value-added/employment of incremental IVS visitors by the number of incremental IVS visitors). We then multiply the per capita results by the total number of IVS visitors. Table 3 shows that the value-added/employment of IVS visitors has grown rapidly since 2005. By 2012, the value-added (employment) of IVS visitors were around one-third (half) of that of all inbound visitors.

13
Our estimates of value-added and employment generated by IVS visitors (to be derived below) are somewhat different from official estimates as we have better data. Official estimates were done year by year once preliminary estimates of industrial data and of distribution of visitors spending were available. Our estimates should be more reliable as we rely on final official estimates. Appendix 1 compares official estimates with ours.
2.2 Measuring economic benefits of tourism: Conceptual issues
This paper focuses on the estimation of the direct value-added and direct
employment generated by tourism. However, the contribution of tourism to GDP
(employment) can be much bigger, or much smaller, than the direct value-added
(direct employment) generated by tourism.
2.2.1 Positive or negative externalities
If negative (positive) externalities exist, the economic contributions of tourism would be smaller (bigger) than our standard estimates. As noted in Sung (2014: 10), in the case of IVS visitors, negative externalities in congestion and overcrowding are highly visible. However, as noted by some economists, IVS can have important positive externalities for the development of financial services and other key industries.8 IVS facilitates the movement of personnel between the Mainland and Hong Kong and lower cross-boundary transaction costs. This promotes the economic integration of Hong Kong with the Mainland and may generate significant external economies in production and consumption. On the production or supply side, improved exchanges with the Mainland may allow HK firms to hire skilled personnel from the Mainland more easily. On the consumption or demand side, the lowering of cross-border transaction costs may stimulate the Mainland’s demand for Hong Kong services, including services not related to tourism, such as financial services and educational services. IVS may also generate external economies in cross-boundary investment as Mainland investors may understand the Hong Kong investment environment better through IVS visits.
Before institution of IVS, Mainland tourist visits were restricted to group tours that are highly inflexible. IVS removes a critical barrier in Mainland-Hong Kong integration and may generate significant external benefits. However, externalities are very difficult to quantify, and we cannot tell whether the positive
8 See “自由行撐起港四大支柱”, (Ta Kung Pao, March 3, 2014, A15”).

14
externalities are big enough to out-weight the negative ones. Though we cannot quantify externalities, we need to bear in mind that they can be important.
2.2.2 Economic models: The short, the medium, and the long run
Even if externalities do not exist, the economic benefits of tourism cannot be ascertained without a specific economic model. Standard macro models distinguish between the short, the medium, and the long run. In the short and the medium run, we abstract from economic growth (i.e., no change in stock of labour, capital, and technology). Short run models are neo-Keynesian as prices/wages may not adjust fast enough to ensure full employment. Medium run models are neo-classical as prices/wages have enough time to adjust to ensure full employment.
Short Run: Neo-Keynesian Models
In the short run, unemployment may exist. In this case, the contribution of tourism to GDP may exceed the direct value-added of tourism due to multiplier effects. A rise in tourists’ spending may induce extra consumption as well as extra investment. As Sung (2014: 24) noted, in the case of the econometric model on GDP forecasting of the HKSAR government, the overall value-added generated by IVS visitors (including induced consumption and investment) was estimated to be nearly 3 times as large as the direct value-added generated. For simplicity, our discussion here focuses largely on value-added generated by tourism, but the same reasoning also applies to employment generated by tourism.
Medium Run: Neo-Classical Models
The medium run assumes full employment but no economic growth. In this
case, the direct value-added generated by tourism overstates the contribution of
tourism to GDP because the resources used to produce tourist services can
generate income elsewhere. Conceptually, the benefit of tourism to GDP should
be the extra income generated in comparison with using the resources involved in
the next best alternative.
Long Run: Dynamic considerations
In the long run, it is difficult to know if tourism is good for economic
growth. Tourism is labour intensive instead of skill intensive, and it does not seem
obvious that tourism may be good for technical change or for skill accumulation.
However, as noted previously, IVS lowers cross-boundary transaction costs and

15
promotes economic exchanges with the Mainland in many areas. IVS can have a
positive impact on growth.
2.2.3 Input-Output models: Direct and indirect effects
As tourists spend on many different industries, it is customary to use an
input-output table, which shows the direct value-added across all industries of
the economy, to estimate the value-added of tourism. The value-added per dollar
of tourists’ spending is just the weighted average of value-added per dollar of
final demand across different industries, where the weights are given by the
shares of total tourists’ spending on each industry.
It is also customary to estimate direct and indirect value-added of tourism
with the help of input-output tables (Lin and Sung, 1983: 241). Indirect benefits
refer to the benefits generated by the intermediate inputs required to support
production in the tourist industry. For instance, a tourist agency uses electricity as
an intermediate input. Indirect benefits include the benefits generated by the
electricity produced for the use of the tourist agency.
The inclusion of indirect benefits highlights the linkages of tourism to other
industries. In Sung’s previous work on value-added of Hong Kong tourism in 1980,
indirect value-added was around 47% of direct value-added (Sung 2014: 22).
However, as noted in Sung (2014: 8-9), the inclusion of indirect effects is
problematic. First, in the context of comparing the economic contributions of
tourism to other industries, the inclusion of indirect effects will easily lead to
double counting. Second, indirect value-added is difficult to compute as the Hong
Kong government does not compile input-output tables for the Hong Kong
economy. Third, in comparison with direct and indirect value-added, the concept
of direct value-added is easier to understand as it is more intuitive. This paper
thus focuses on direct effects on value-added and employment as the preferred
measures of economic contributions of tourism.
2.3 Which model is appropriate?
Which model is appropriate depends on the context. For the purpose of our
paper, the short run Neo-Keynesian model is quite inappropriate for two reasons.
First, the Hong Kong economy has been close to full employment for most of the

16
period. Second, our focus is on medium or long run benefits of tourism rather
than short term changes in tourists’ spending.
However, if tourists’ spending were to fall instead of to rise (as may happen
in 2015), the neo-Keynesian model is relevant, at least in the short run. Full
employment will constrain a rise in output, but it will not restrict a fall in output.
In the short run, a fall in tourists’ spending may have multiplier effects, and the
overall decline in value-added/employment may well exceed the direct value-
added/employment generated.
It should be noted that this paper is mostly an accounting exercise
(disaggregating the total value-added/employment generated by all tourists into
those generated by different types of tourists) instead of a causal model.
Depending on the model chosen, the contribution of tourism to GDP
(employment) can be bigger or smaller than the direct value-added (direct
employment) generated. This paper nevertheless focuses on direct value-
added/employment generated. They are more intuitive and relatively easy to
estimate (unlike externalities and growth effects), thus they are very useful in
depicting the economic benefits of tourism.
3. Growth of tourism: Visitor arrivals and spending
Figure 1 shows the number of visitors, disaggregated into Mainland, IVS,
and M-Permit visitors from 2000 to 2014. The details of data for Figure 1 are
listed in Table 4. It should be noted that official data for M-Permit visitors are very
scanty. Official data on the number of M-Permit visitors are available, but official
data on their per capita spending and distribution of spending among different
industries have to be estimated as they are largely unavailable. The methods of
estimation are detailed in Appendix 2.
From 2000 to 2014, non-Mainland visitor arrivals grew slowly at 3.6%
annually on average and its share of total visitor arrivals fell from 71% to 22%.
Concurrently, Mainland visitor arrivals grew rapidly at 20.5% annually on average
and its share of total visitor arrivals rose from 29% to 78%.

17
Figure 1 Number of visitors from 2000 to 2014
Sources: See Table 4
The growth of IVS visitors is particularly rapid, growing annually at 22.3% on
average from 2004 to 2014, and its share in total tourist arrivals rose from 20% in
2004 to 51% in 2014. The rapid growth of IVS visitors has accelerated since April
2009, when the Central Government allowed permanent residents in Shenzhen to
visit Hong Kong on one-year M-Permit. From 2009 to 2014, M-Permit visitors
grew explosively from under 1.5 million to over 14 million, accounting for 47% of
IVS visitors in 2014.
Data on visitor arrivals are available up to 2014, but estimates of
contributions to value-added and employment are only available up to 2013 due
to the time lag in spending and industrial surveys, which provide data on value-
added and employment by industry. For this reason, our estimates of value-added
and employment can only be done up to 2013.
It should be noted that visitors’ spending includes expenditure in Hong
Kong as well as expenditure on cross-boundary transport (e.g., airfares for flights
to Hong Kong) which occurs outside Hong Kong. While visitors’ spending in Hong
Kong obviously benefits Hong Kong, the spending on cross-boundary transport
occurring outside Hong Kong benefits Hong Kong too (e.g., airlines need to pay
airport charges).
05
101520253035404550556065
2000 2001 2002 2003 2004 2005 2006 2007 2008 2009 2010 2011 2012 2013 2014
Number of visitors (in million)
M-Permit
All IVS
Mainland
All Visitors

18
Table 4 Number of different types of visitors (thousand), 2000 to 2014
Mainland Non-Mainland Total
IVS Non-IVS Subtotal
M-Permit Non-M-Permit All IVS
2000 - - - - 3,786 9,274 13,059
29.0% 71.0% 100.0%
2001 - - - - 4,449 9,277 13,725
32.4% 67.6% 100.0%
2002 - - - - 6,825 9,741 16,566
41.2% 58.8% 100.0%
2003 - - 667 7,800 8,467 7,070 15,537
4.3% 50.2% 54.5% 45.5% 100.0%
2004 - - 4,260 7,986 12,246 9,565 21,811
19.5% 36.6% 56.1% 43.9% 100.0%
2005 - - 5,550 6,991 12,541 10,818 23,359
23.8% 29.9% 53.7% 46.3% 100.0%
2006 - - 6,673 6,918 13,591 11,660 25,251
26.4% 27.4% 53.8% 46.2% 100.0%
2007 - - 8,593 6,893 15,486 12,684 28,169
30.5% 24.5% 55.0% 45.0% 100.0%
2008 - - 9,619 7,243 16,862 12,645 29,507
32.6% 24.5% 57.1% 42.9% 100.0%
2009 1,472 9,119 10,591 7,365 17,957 11,634 29,591
5.0% 30.8% 35.8% 24.9% 60.7% 39.3% 100.0%
2010 4,168 10,076 14,244 8,440 22,684 13,346 36,030
11.6% 28.0% 39.5% 23.4% 63.0% 37.0% 100.0%
2011 6,168 12,176 18,344 9,756 28,100 13,821 41,921
14.7% 29.0% 43.8% 23.3% 67.0% 33.0% 100.0%
2012 9,827 13,314 23,141 11,770 34,911 13,704 48,615
20.2% 27.4% 47.6% 24.2% 71.8% 28.2% 100.0%
2013 12,150 15,315 27,465 13,280 40,745 13,554 54,299
22.4% 28.2% 50.6% 24.5% 75.0% 25.0% 100.0%
2014 14,850 16,485 31,335 15,248 47,248 13,591 60,839
24.4% 27.1% 51.5% 25.1% 77.7% 22.3% 100.0%
Percentage figures indicate shares of total number of visitors. Sources: For figures of M-permit visitors, see Appendix 2. All other figures are obtained from the website of the HKTB (Hong Kong Tourism Board).

19
Statistics on visitors’ spending in Hong Kong are available from annual
sample surveys of visitors conducted by the Hong Kong Tourism Board (HKTB).
The data are available in considerable detail: It is classified by spending of visitors
from different countries and also by spending on different industries/sectors. The
Hong Kong government has also conducted surveys to obtain data on visitors’
spending on cross-boundary transport. The data are rough as they rely on visitors’
memory before they start their trips. For package tours, visitors usually do not
know the cost of cross-boundary transport and the government has to rely on
estimates obtained from tourist agencies or transportation companies (air, sea,
and land transport). Moreover, the government does not publish its estimates,
except for the value-added/employment generated by all visitors shown in Tables
1 and 2.
As there are no reliable data, this paper does not estimate visitors’
spending on cross-boundary transport. Instead, the government’s estimates of
value-added/employment generated by visitors’ spending on cross-boundary
transport are disaggregated into value-added/employment generated by different
types of tourists, with the method detailed later.
Table 5 shows per capita spendings of different types of visitors in Hong
Kong. From 2000 to 2004, the per capita spending of all visitors remained
depressed due to the unfavourable effects of the September 11 terrorist attack in
2001 and the Severe Acute Respiratory Syndrome (SARS) epidemic in 2003. Since
2004, growth of the per capita spending of all visitors has been substantial, rising
from $3,061 in 2004 to $5,092 in 2013. The per capita spending of Mainland
visitors has been consistently higher than that of non-Mainland visitors, mainly
because Mainland visitors spend a lot on shopping.
Among Mainland visitors, the per capita spending of non-IVS visitors has
generally been higher than that of IVS visitors (except in 2007 and 2009). This is
expected as non-IVS visitors tend to come from areas farther away and they tend
to stay longer. The growth of the per capita spending of IVS visitors has slowed
down markedly since 2009 due to the rise of M-Permit visitors. M-Permit visitors
come from Shenzhen nearby, and ninety percent of them are same-day visitors.
Their per capita spending tends to be lower as they do not stay overnight in Hong
Kong. As a result, the gap in per capita spending between non-IVS and IVS visitors

20
has widened since 2009. The per capita spending of IVS visitors has also fallen
beneath the overall average for all visitors since 2009. However, it should be
noted that the per capita spending of non-M-Permit IVS visitors are higher than
those of non-IVS Mainland visitors. This suggests that the per capita spending of
visitors on individual tours tends to be higher than that of those on group tours.
As a whole, the average per capita spending of IVS visitors remained higher than
that of non-Mainland visitors mainly because IVS visitors spend a lot on shopping.
Table 5 Per capita spending of different types of visitors, 2000-2014 ($)
Mainland Non- Mainland
All visitors
IVS Non-IVS All Mainland
M-Permit Non-M-Permit All IVS
2000 - - - - 3,818 3,131 3,331
2001 - - - - 3,918 2,859 3,202
2002 - - - - 4,110 2,808 3,344
2003 - - - - 3,942 2,850 3,445
2004 - - 2,846 3,313 3,151 2,945 3,061
2005 - - 3,048 3,616 3,365 3,108 3,246
2006 - - 3,348 3,651 3,503 3,248 3,385
2007 - - 3,871 3,723 3,805 3,355 3,603
2008 - - 4,106 4,106 4,106 3,415 3,810
2009 2,463 5,063 4,702 4,572 4,649 3,170 4,067
2010 2,425 5,808 4,818 5,254 4,980 3,861 4,565
2011 2,326 6,100 4,831 5,999 5,237 4,262 4,915
2012 2,307 6,407 4,666 6,008 5,119 4,360 4,905
2013 2,467 6,950 4,967 6,075 5,328 4,382 5,092
2014 N/A N/A N/A N/A 5,124 4,318 4,944
Sources: For figures on M-Permit visitors, see Appendix 2. Figures on IVS visitors are obtained from Finance Committee Meeting Documents 2014. Figures on Mainland visitors and all visitors are obtained from the website of the HKTB (Hong Kong Tourism Board). Figures on non-IVS and non-Mainland visitors are derived as residuals.

21
Table 6 shows visitors’ spending by different types of visitors. From 2004 to
2013, the share of IVS visitors’ spending in all visitors’ spending rose from 18% to
49%, while that of Mainland visitors rose from 58% to 79%. The share of non-
Mainland visitors’ spending in the total declined correspondingly from 42% to
22% in the period. In addition, the share of M-Permit visitors’ spending in all
visitors’ spending rose from 3% in 2009 to 11% in 2013. In 2013, M-Permit visitors
accounted for more than 24% of total visitor arrivals (Table 4), but they only
accounted for less than 11% of total visitors’ spending as the per capita spending
of M-Permit visitors is less than half of the overall average. The spending of non-
M-Permit IVS visitors accounts for the bulk of IVS visitors’ spending.
4. Estimation of value-added/employment of different types of visitors
This paper uses mainstream methodology to quantify the direct
contributions to GDP and employment of all types of visitors, namely, M-Permit,
IVS, non-IVS, Mainland, and non-Mainland visitors in 2007-2013. Mainstream
models focus on visitors’ spending. As mentioned before, the economic benefits
of visitors arise from two types of spending, including expenditure in Hong Kong
and expenditure on cross-boundary transport (e.g. flights to Hong Kong) before
their arrival in Hong Kong. The estimation of the value-added generated by
visitors’ spending in Hong Kong and outside Hong Kong (on cross-boundary
transport) is detailed below in Sections 4.1 and 4.2 respectively.
4.1 Estimation of benefits from visitors’ spending in Hong Kong
To estimate the direct value-added of visitors’ spending in Hong Kong, we
need data on the following:
1. Distribution of tourists’ spending by industry, and
2. Rate of direct value-added in each industry (i.e. direct value-added per
dollar spending on that industry)
For each industry, the direct value-added generated by visitors’ spending is
easily obtained by multiplying the rate of value-added by the amount of visitors’
spending on that industry. Summing across all industries gives the total direct
value-added generated by visitors’ spending.

22
Table 6 Total spending of different types of visitors ($ million), 2000-2014
Mainland Non-Mainland Total
IVS Non-IVS Subtotal
M-Permit Non-M-Permit All IVS
2000 - - - - 14,454 29,039 43,493
33.2% 66.8% 100.0%
2001 - - - - 17,432 26,520 43,953
39.7% 60.3% 100.0%
2002 - - - - 28,052 27,353 55,405
50.6% 49.4% 100.0%
2003 - - - - 33,378 20,148 53,526
62.4% 37.6% 100.0%
2004 - - 12,123 26,459 38,583 28,172 66,754
18.2% 39.6% 57.8% 42.2% 100.0%
2005 - - 16,914 25,282 42,196 33,626 75,823
22.3% 33.3% 55.7% 44.3% 100.0%
2006 - - 22,344 25,261 47,605 37,867 85,472
26.1% 29.6% 55.7% 44.3% 100.0%
2007 - - 33,262 25,665 58,927 42,556 101,483
32.8% 25.3% 58.1% 41.9% 100.0%
2008 - - 39,494 29,743 69,237 43,185 112,422
35.1% 26.5% 61.6% 38.4% 100.0%
2009 3,626 46,174 49,800 33,674 83,474 36,880 120,354
3.0% 38.4% 41.4% 28.0% 69.4% 30.6% 100.0%
2010 10,109 58,517 68,626 44,342 112,968 51,523 164,492
6.1% 35.6% 41.7% 27.0% 68.7% 31.3% 100.0%
2011 14,348 74,271 88,619 58,530 147,149 58,903 206,052
7.0% 36.0% 43.0% 28.4% 71.4% 28.6% 100.0%
2012 22,676 85,304 107,980 70,714 178,694 59,754 238,448
9.5% 35.8% 45.3% 29.7% 74.9% 25.1% 100.0%
2013 29,973 106,444 136,417 80,670 217,086 59,395 276,482
10.8% 38.5% 49.3% 29.2% 78.5% 21.5% 100.0%
2014 N/A N/A N/A N/A 242,103 58,689 300,792
80.5% 19.5% 100.0%
Percentage figures indicate shares of total visitors’ spending. Sources: Figures are obtained by multiplying figures in Table 3 with corresponding figures in Table 4.

23
Distribution of tourists’ expenditure by industry
The HKTB conducts annual sample surveys on distribution of tourists’
spending on different industries. As in official estimates, we group the different
industries into the following four sub-sectors:
1. Retail Trade,
2. Accommodation (hotels, boarding houses and accommodation services),
3. Food Services (food and beverage services),
4. Others (tour agents, ticketing agents, domestic transport, and miscellaneous
personal services).
In this paper, the four sub-sectors are referred to as sub-sectors of tourism.
Data on the distribution of visitors’ spending are available at the website of the
HKTB. The distribution of spending of Mainland visitors is available since 2007,
and the distribution of spending of IVS visitors is available since 2003 from a
different source (Finance Committee Meeting Documents, 2014).9 Due to data
availability, this paper estimates the value-added/employment generated by IVS
(Mainland) visitors starting 2004 (2007).
Table 7 shows the distribution of tourists’ spending by different types of
visitors from 2007 to 2013 on the four sub-sectors. In 2013, IVS visitors spent
much more on shopping (81% share) than on hotels (7% share), while non-
Mainland visitors spent more on hotels (36% share) than on shopping (34%
share). The contrast is even sharper for M-Permit visitors: They spent 90% of their
expenditure on shopping and just 1% on hotels.
9 The Finance Committee Meeting Documents gave the final estimates of distribution of IVS spending by the four
sub-sectors from 2004 to 2013. These final estimates are more reliable than the preliminary estimates of 2004 to 2009 used in the studies of the Economic Analysis and Business Facilitation Unit (EABF), and also used in Sung (2014) to estimate economic benefits generated in 2009. This paper relies on the best available data.

24
Table 7 Distribution of tourist expenditure, 2007 to 2014
Mainland Non- Mainland
All visitors
IVS Non-IVS All
Mainland M-Permit Non-M-Permit All IVS
2007 Retail Trade -
78% 73% 76% 40% 61%
Accommodation -
8% 10% 9% 35% 20%
Food Services -
8% 10% 9% 14% 11%
Others - 6% 8% 7% 11% 9%
2008 Retail Trade -
78% 73% 76% 41% 62%
Accommodation -
8% 10% 9% 33% 18%
Food Services -
8% 10% 8% 15% 11%
Others - 6% 8% 7% 12% 9%
2009 Retail Trade 88% 81% 82% 77% 80% 42% 68%
Accommodation 2% 6% 6% 8% 7% 29% 14%
Food Services 4% 7% 6% 8% 7% 15% 10%
Others 5% 6% 6% 7% 6% 14% 9%
2010 Retail Trade 88% 79% 80% 74% 78% 42% 67%
Accommodation 3% 8% 7% 10% 8% 31% 15%
Food Services 4% 7% 7% 9% 8% 14% 10%
Others 5% 6% 6% 7% 6% 13% 8%
2011 Retail Trade 86% 75% 77% 73% 75% 39% 65%
Accommodation 3% 10% 9% 11% 10% 34% 17%
Food Services 5% 8% 8% 9% 8% 14% 10%
Others 6% 6% 6% 7% 7% 13% 9%
2012 Retail Trade 88% 76% 79% 73% 77% 35% 66%
Accommodation 3% 10% 8% 11% 9% 36% 16%
Food Services 4% 8% 7% 9% 8% 15% 10%
Others 5% 6% 6% 7% 6% 14% 8%
2013 Retail Trade 90% 78% 81% 73% 78% 34% 68%
Accommodation 2% 9% 7% 10% 8% 36% 14%
Food Services 4% 7% 7% 9% 7% 16% 9%
Others 4% 6% 6% 8% 6% 14% 8%
2014 Retail Trade N/A N/A N/A N/A 78% 33% 69%
Accommodation N/A N/A N/A N/A 8% 36% 13%
Food Services N/A N/A N/A N/A 7% 16% 9%
Others N/A N/A N/A N/A 6% 15% 8%
Sources: Same as Table 5.

25
Rate of direct value-added by industry
The Census and Statistics Department, in its annual estimates on value-
added of tourism, gives the direct value-added generated by tourism in each of
the four sub-sectors of tourism (Table 1). For each sub-sector, dividing the direct
value-added by the actual spending gives its rate of direct value-added. The rates
are shown in Table 8.
Table 8 shows that, among the four sub-sectors in 2013, Accommodation
services have the highest rate of direct value-added (0.65), while retail trade has
the lowest rate of direct value-added (0.17). The results for 2007-2012 are similar.
The rate of direct value-added in retail trade is low because the goods sold are
mostly imported. Imported goods generate little value-added as they are not
manufactured in Hong Kong. Value-added in retail trade comes from the retail
margin or mark-up on imported goods, which covers the wages, rent, and profits
of retailing.
Direct value-added generated per dollar of spending by different types of
visitors
For each sub-sector, the rate of direct value-added is assumed to be the
same across different types of visitors. However, the distributions of spending of
different types of visitors on the four sub-sectors are not the same. For each type
of visitor, the direct value generated per dollar of spending is a weighted average
of the rates of direct value-added of the four sub-sectors, where the weights are
the shares of spending on the sub-sectors. Table 9 shows the direct value
generated per dollar of visitors’ spending by different types of visitors.
4.2 Estimation of benefits from visitors’ spending on cross-boundary transport
The direct value-added per dollar of spending in Table 9 only covers the
value-added generated by visitors’ spending in Hong Kong. To arrive in Hong
Kong, visitors may need to spend on cross-boundary transport. Such spending
takes place outside Hong Kong, but it generates value-added for Hong Kong.

26
Table 8 Rate of direct value-added of all visitors' spending by different types of visitors, 2004 to 2013
Retail Trade Accommodation Food Services Others
2004 0.17 0.61 0.41 0.47
2005 0.17 0.62 0.42 0.48
2006 0.18 0.64 0.42 0.48
2007 0.18 0.63 0.40 0.47
2008 0.18 0.63 0.41 0.44
2009 0.16 0.60 0.39 0.46
2010 0.15 0.64 0.39 0.45
2011 0.17 0.67 0.39 0.44
2012 0.17 0.66 0.40 0.44
2013 0.17 0.65 0.39 0.43
Sources: Value added generated by tourism in each industry is obtained from the data on the four key industries at the website of the Census and Statistics Department. Visitors' spending on each industry is obtained from Statistical Review of Hong Kong Tourism, various years, Hong Kong Tourism Board.
Table 9 Rate of direct value-added of visitors' spending by different types of visitors, 2004 to 2013
Mainland Non-Mainland All visitors
IVS Non-IVS All Mainland
M-Permit Non-M-Permit All IVS
2004 - - 0.26 - - - 0.31
2005 - - 0.26 - - - 0.33
2006 - - 0.26 - - - 0.33
2007 - - 0.25 0.27 0.26 0.40 0.32
2008 - - 0.25 0.27 0.26 0.39 0.31
2009 0.20 0.22 0.22 0.23 0.23 0.36 0.27
2010 0.19 0.23 0.22 0.24 0.23 0.38 0.28
2011 0.21 0.26 0.25 0.26 0.26 0.41 0.30
2012 0.20 0.25 0.24 0.26 0.25 0.42 0.29
2013 0.20 0.24 0.23 0.26 0.24 0.41 0.28
Sources: Estimation results of this paper.
In official estimates, contribution to value-added by tourists’ spending on
cross-boundary transport is based on data on the numbers of visitor arrivals by
land, sea, and air (available from surveys of the HKTB), and estimates of value-
added generated by each mode of transport (unpublished). The benefits of the

27
different modes of transport for Hong Kong are quite different. For visitors
arriving in Hong Kong through Lo Wu, there is no spending on cross-boundary
transport because they walk into Hong Kong. Thus, no benefit is generated for
Hong Kong in terms of cross-boundary transport.
For visitors who arrive on the through train from Guangzhou, a part of the
train fares accrues to Hong Kong. For visitors flying into Hong Kong, we need to
distinguish those who travel on Hong Kong airlines from those who travel on non-
Hong Kong airlines. The benefits of the former for Hong Kong is much higher than
the latter, though non-Hong Kong airlines still need to pay for using the Hong
Kong airport and related services. The benefits for Hong Kong in cross-boundary
transport of visitors arriving by air are much larger than those of visitors arriving
by land or by sea.
Table 10 shows the ratio (in percent) of visitors arriving by air for different
types of visitors. The ratio of M-Permit visitors flying to Hong Kong is close to zero
as Shenzhen is less than an hour’s drive from Hong Kong and there is no air link
between the two cities.10 The ratio of IVS visitors flying to Hong Kong is very low
(5.9% in 2013), while the ratio of non-IVS visitors flying to Hong Kong is higher
(22.1% in 2013). The ratio of non-Mainland visitors flying to HK is the highest (57%
in 2013). Non-Mainland visitors should generate the highest value-added in cross-
boundary transport, to be followed by non-IVS visitors, non-M-Permit IVS visitors,
and M-Permit visitors.
Estimates of benefits in cross-boundary transport can only be rough as
precise data needed in estimation may not be available. As the government has
not revealed the data used in its estimates, we have to do our own estimates
based on data of visitors’ arrivals by mode of transport. The procedure is tedious
and is detailed in Appendix 3. The estimation results are given in Table 11.
10
A very small proportion of M-Permit visitors may first travel from Shenzhen to other cities and then fly to Hong Kong.

28
Table 10 Percentages of visitors arriving by air
Mainland Non-Mainland All visitors
IVS Non-IVS All Mainland
M-Permit Non-M-Permit All IVS
2007 - - 7.9% 20.2% 13.4% 56.4% 32.7%
2008 - - 7.7% 18.9% 12.5% 55.4% 30.9%
2009 0.0% 7.9% 6.8% 19.4% 12.0% 55.7% 29.1%
2010 0.0% 9.1% 6.4% 21.6% 12.1% 55.8% 28.3%
2011 0.0% 9.8% 6.5% 21.4% 11.7% 56.0% 26.3%
2012 0.0% 10.0% 5.8% 21.0% 10.9% 56.5% 23.8%
2013 0.0% 10.6% 5.9% 22.1% 11.2% 57.4% 22.7%
Source: Statistical Review of Tourism, various years, Hong Kong Tourism Board.
4.3 Per capita value-added of different types of visitors
Table 11 shows the per capita value-added generated by visitors’ spending
of different types of visitors. Our analysis shifted from rate of value-added or
value-added per dollar of visitors’ spending (Tables 8 and 9) to value-added per
visitor. The reason for this shift is the lack of available data on visitors’ spending
on cross-boundary transport. Estimation of value-added per dollar of visitors’
spending on cross-boundary transport is thus impossible. We can nevertheless
estimate the per visitor value-added generated by spending on cross-boundary
transport by different types of visitors.
In Table 11, for each year, the first row shows the per capita value-added
generated by spending on cross-boundary transport from 2007 to 2013. In 2013,
the per capita value-added in cross-boundary transport of M-Permit visitors was
the lowest ($8); those of non-M-Permit IVS visitors and non-IVS visitors were
higher ($72 and $141 respectively); and that of non-Mainland visitors was the
highest ($637). The figures for all IVS visitors ($43), Mainland visitors ($75), and all
visitors ($215) were weighted averages of their sub-components. The results are
expected. Per capita value-added in cross-boundary transport is proportional to
the share of visitors arriving by air.

29
Table 11 Per capita direct value-added generated by visitors' spending by different types of visitors ($), 2007 to 2013
Value-added generated by
Mainland Non- Mainland
All visitors IVS Non-IVS All
Mainland M-Permit Non-M-Permit All IVS
2007 Spending on cross- boundary transport
- - 47 108 74 634 327
All spending in HK - - 967 994 979 1,335 1,140
Total - - 1,014 1,103 1,054 1,970 1,466
2008 Spending on cross- boundary transport
- - 53 120 82 89 85
All spending in HK - - 1,023 1,095 1,054 1,339 1,176
Total - - 1,076 1,215 1,136 1,427 1,261
2009 Spending on cross- boundary transport
8 22 20 43 30 642 270
All spending in HK 487 1,123 1,035 1,073 1,050 1,155 1,092
Total 495 1,145 1,055 1,117 1,080 1,797 1,362
2010 Spending on cross- boundary transport
8 83 61 188 108 850 383
All spending in HK 463 1,322 1,071 1,278 1,148 1,450 1,260
Total 471 1,406 1,132 1,466 1,256 2,300 1,643
2011 Spending on cross- boundary transport
8 65 46 133 76 605 250
All spending in HK 498 1,565 1,206 1,587 1,339 1,728 1,467
Total 506 1,630 1,252 1,720 1,415 2,333 1,718
2012 Spending on cross- boundary transport
8 62 39 121 66 560 206
All spending in HK 468 1,595 1,117 1,562 1,267 1,815 1,421
Total 475 1,657 1,156 1,683 1,333 2,376 1,627
2013 Spending on cross- boundary transport
8 72 43 141 75 637 215
All spending in HK 494 1,693 1,162 1,567 1,295 1,812 1,424
Total 502 1,764 1,205 1,709 1,370 2,449 1,639
Sources: Estimation results of this paper.

30
For each year, the second row of Table 11 shows the per capita value-
added generated by visitors’ spending in Hong Kong during 2007-2013. In 2013,
M-Permit visitors have the lowest per capita value-added ($494); non-M-Permit
IVS visitors and non-IVS visitors have higher per capita value-added ($1,693 and
$1,567 respectively); and non-Mainland visitors have the highest per capita value-
added ($1,812). The per capita value-added of IVS visitors ($1,162), Mainland
visitors ($1,295) and all visitors ($1,424) are weighted averages of their sub-
components.
It should be noted (in Table 5) that, in 2013, the per capita spending of IVS
visitors ($4,967) was 13% higher than that of non-Mainland visitors ($4,382) but
the per capita value-added of IVS visitors ($1,162) was only 64% of that of non-
Mainland visitors ($1,812). This is because IVS visitors spend heavily on shopping,
which has the lowest rate of value-added among the tourism sub-sectors. The
results for 2007-2012 were similar to those of 2013. This shows that spending can
be a poor indicator of value-added.
For each year, the third row of Table 11 shows the per capita value-added
generated by visitors’ total spending (all spending in Hong Kong plus spending on
cross-boundary transport taking place outside Hong Kong). In 2013, M-Permit
visitors have the lowest per capita value-added ($502); non-M-Permit IVS visitors
and non-IVS visitors have higher per capita value-added ($1,764 and $1,709)
respectively; and non-Mainland visitors have the highest per capita value-added
($2,449). The results are as expected. The patterns for earlier years were similar.
In 2013, the per capita value-added of M-Permit visitors was only 42% of
the average of IVS visitors and only 20% of that of non-Mainland visitors. In the
same year, the per capita value-added of IVS visitors was only 71% and 49% of
those of non-IVS visitors and non-Mainland visitors respectively. The results for
earlier years were similar. The per capita value-added of IVS visitors is relatively
lower due to two factors. First, IVS visitors spend heavily on shopping which has a
low rate of value-added. Second, a great majority of IVS visitors arrives in Hong
Kong by land, generating little value-added in cross-boundary transport. The per
capita value-added of M-Permit visitors is lower still due to a third factor: Their
per capita spending in Hong Kong is also low (Table 5).

31
4.4 Total direct value-added of different types of visitors by sub-sectors of
tourism
Table 12 shows the total direct value-added of different types of visitors by
sub-sectors of tourism from 2011 to 2013. Estimates for earlier years (2007 to
2010) take up too much space and they are relegated to Appendix 4. In 2013, M-
Permit visitors generated around $6 billion in direct value-added, which was
0.29% of GDP; IVS visitors generated $33.1 billion in direct value-added, which
was 1.55% of GDP. The 2013 value-added generated by Mainland visitors, non-
Mainland visitors and all visitors accounted for respectively 2.6%, 1.6%, and 4.2%
of GDP.
Tourism is important for three sub-sectors, namely, Retail Trade,
Accommodation, and Food Services. In 2013, the value-added generated by all
visitors accounted for 35% of the value-added of Retail Trade, 88% of the value-
added of Accommodation Services, and 22% of the value-added of Food Services.
In 2013, IVS visitors also generated substantial income for these three industries,
generating 20% of the value-added of Retail Trade, 23% of the value-added of
Accommodation Services, and 8% of the value-added of Food Services. However,
M-Permit visitors generated only 1% to 5% of the value-added of these three
industries.
4.5 Estimation of benefits to employment
Estimates of benefits to employment are analogous to those of value-
added. Table 13 shows the direct employment generated per million dollars of
spending in the sub-sectors of tourism. One unit of spending is chosen to be one
million dollars instead of one dollar because the employment generated by one
dollar spending is very small. Per unit of spending, Retail Trade generates the
least employment (0.59 man-years in 2013), and Food Services generates the
most employment (1.92 man-years in 2013). Retail Trade generates little
employment per unit of spending because the goods sold are mostly imported.
For each sub-sector, employment generation tend to fall over time due to rise in
labour productivity.

32
Table 12 Total direct value-added of different types of visitors' by sub-sectors of tourism ($ million), 2011-2013
Mainland Non-
Mainland All
visitors
IVS Non-IVS All Mainland
M-
Permit Non-M-Permit All IVS
2011 Retail Trade 2,087 9,486 11,575 7,254 18,828 3,872 22,700
2.8% 12.6% 15.4% 9.7% 25.1% 5.2% 30.2%
Accommodation 327 5,129 5,450 4,430 9,886 13,314 23,200
1.3% 20.5% 21.8% 17.7% 39.5% 53.2% 92.7%
Food Services 270 2,359 2,630 1,983 4,612 3,288 7,900
0.7% 5.7% 6.4% 4.8% 11.1% 7.9% 19.1%
Others 389 2,081 2,468 1,817 4,287 3,413 7,700
Cross-Boundary Transport 49 795 844 1,299 2,142 8,358 10,500
Total 3,121 19,851 22,967 16,784 39,756 32,245 72,000
0.16% 1.03% 1.19% 0.87% 2.06% 1.67% 3.72%
2012 Retail Trade 3,350 10,892 14,240 8,626 22,869 3,531 26,400
4.0% 13.1% 17.1% 10.4% 27.4% 4.2% 31.7%
Accommodation 409 5,404 5,819 4,940 10,753 14,247 25,000
1.5% 19.7% 21.2% 18.0% 39.1% 51.8% 91.0%
Food Services 373 2,665 3,036 2,509 5,547 3,553 9,100
0.8% 6.0% 6.8% 5.6% 12.4% 8.0% 20.4%
Others 463 2,279 2,746 2,312 5,053 3,547 8,600
Cross-Boundary Transport 78 822 900 1,421 2,321 7,680 10,000
Total 4,673 22,063 26,742 19,808 46,543 32,558 79,101
0.23% 1.08% 1.31% 0.97% 2.28% 1.60% 3.88%
2013 Retail Trade 4,536 14,020 18,562 9,988 28,535 3,456 32,000
5.0% 15.4% 20.4% 11.0% 31.3% 3.8% 35.1%
Accommodation 447 6,100 6,526 5,292 11,831 13,761 25,600
1.5% 21.0% 22.5% 18.3% 40.8% 47.5% 88.3%
Food Services 448 3,097 3,526 2,816 6,360 3,639 10,000
1.0% 6.7% 7.6% 6.1% 13.7% 7.8% 21.5%
Others 566 2,705 3,289 2,720 6,020 3,709 9,700
Cross-Boundary Transport 96 1,095 1,191 1,875 3,066 8,634 11,700
Total 6,093 27,017 33,095 22,691 55,813 33,200 89,001
0.29% 1.27% 1.55% 1.06% 2.62% 1.56% 4.17%
Percentage figures indicate shares of value-added in the respective sectors/in total GDP. Sources: Value-added of visitors are estimation results of this paper. The value-added of sub-sectors are taken from Table 16 in 2013 Gross Domestic Product, Census and Statistics Department, Feb 2014.

33
Table 13 Direct employment generated per million dollars of spending in 4 sub-sectors of tourism (man-year), 2004-2013
Retail Accommodation Food Services Others Total
2004 1.34 1.91 3.79 1.74 1.80
2005 1.29 1.53 3.61 1.65 1.69
2006 1.28 1.36 3.30 1.60 1.58
2007 1.20 1.49 2.76 1.61 1.47
2008 1.08 1.38 2.59 1.46 1.33
2009 1.00 1.65 2.42 1.43 1.26
2010 0.81 1.37 2.30 1.15 1.07
2011 0.68 1.12 2.12 1.12 0.94
2012 0.63 1.04 2.03 1.00 0.86
2013 0.59 1.01 1.92 1.00 0.81
Sources: Employment generated by tourism in each sector is obtained from Table 2. Visitors' spending on each sector is obtained from A statistical Review of Hong Kong Tourism, various years, Hong Kong Tourism Board.
Table 14 shows direct employment generated per million dollars of visitors’
spending in Hong Kong by different types of visitors. Visitors’ spending is
distributed over the four sub-sectors. The employment generated by visitors’
spending is a weighted average of the employment generated in the four sub-
sectors. Comparing the employment generated by per unit spending of different
types of visitors in 2013, M-Permit visitors generated the least employment (0.67
man-year), followed by IVS visitors (0.74 man-year), and non-Mainland visitors
generated the most employment (1.01 man-years). This is because M-Permit/IVS
visitors spent the most on shopping (which generated the least employment), and
non-Mainland visitors spent the least on shopping. Results for earlier years were
similar.
Table 15 shows direct employment generated per thousand visitors’
spending by different types of visitors. The unit chosen is per thousand visitors
instead of per visitor because the employment generated by the spending of one
visitor is very small. Comparing the employment generated in 2013 by spending of
different types of visitors on cross-boundary transport, M-Permit visitors

34
generated the least employment (0.01 man-years), and non-Mainland visitors
generated the most employment (0.75 man-years). This is because the share of
arrivals by air of M-Permit visitors is the lowest, and that of non-Mainland visitors
is the highest.
Table 14 Direct employment generated per million dollars of spending of different types of visitors in Hong Kong (man-year), 2004-2013
Mainland Non-Mainland All visitors
IVS Non-IVS All Mainland
M-Permit Non-M-Permit All IVS
2004 -
1.72 - - - 1.80
2005 -
1.61 - - - 1.69
2006 -
1.51 - - - 1.58
2007 -
1.37 1.41 1.39 1.57 1.47
2008 -
1.24 1.29 1.26 1.45 1.33
2009 1.10 1.16 1.16 1.20 1.17 1.46 1.26
2010 0.90 0.99 0.97 1.03 0.99 1.24 1.07
2011 0.79 0.87 0.86 0.89 0.87 1.10 0.94
2012 0.72 0.80 0.79 0.83 0.80 1.04 0.86
2013 0.67 0.75 0.74 0.79 0.75 1.01 0.81
Sources: Estimation results of this paper.

35
Table 15 Direct employment generated per thousand visitors' spending by different types of visitors (man-year), 2007-2013
Employment generated by
Mainland Non- Mainland
All visitors IVS Non-
IVS All
Mainland M-Permit
Non-M-Permit
All IVS
2007 Spending on cross- boundary transport
- - 0.06 0.13 0.09 0.76 0.39
All spending in HK - - 5.31 5.27 5.29 5.28 5.29
Total - - 5.37 5.40 5.38 6.04 5.68
2008 Spending on cross- boundary transport
- - 0.06 0.14 0.10 0.76 0.38
All spending in HK - - 5.11 5.29 5.19 4.94 5.08
Total - - 5.17 5.43 5.28 5.70 5.46
2009 Spending on cross- boundary transport
0.01 0.04 0.03 0.08 0.06 0.91 0.39
All spending in HK 3.15 5.88 5.44 5.48 5.46 4.64 5.14
Total 3.16 5.92 5.48 5.57 5.51 5.55 5.53
2010 Spending on cross- boundary transport
0.01 0.08 0.06 0.17 0.10 0.71 0.32
All spending in HK 2.19 5.72 4.69 5.39 4.95 4.79 4.89
Total 2.20 5.80 4.75 5.56 5.05 5.49 5.21
2011 Spending on cross- boundary transport
0.01 0.09 0.06 0.18 0.10 0.76 0.32
All spending in HK 1.85 5.33 4.16 5.33 4.57 4.67 4.60
Total 1.86 5.42 4.22 5.51 4.67 5.43 4.92
2012 Spending on cross- boundary transport
0.01 0.09 0.05 0.18 0.10 0.75 0.28
All spending in HK 1.66 5.15 3.67 4.97 4.10 4.52 4.22
Total 1.67 5.23 3.72 5.14 4.20 5.27 4.50
2013 Spending on cross- boundary transport
0.01 0.09 0.05 0.18 0.10 0.75 0.26
All spending in HK 1.66 5.24 3.65 4.78 4.02 4.42 4.12
Total 1.67 5.33 3.71 4.96 4.12 5.17 4.38
Sources: Estimation results of this paper.

36
Table 15 also shows employment generated per thousand visitors’
spending in Hong Kong (which excludes spending on cross-boundary transport),
and also employment generated per thousand visitors’ total spending (which
includes spending on cross-boundary transport). In 2013, though the per capita
spending of IVS visitors in Hong Kong was higher than that of non-Mainland
visitors, the employment generated per thousand visitors’ spending in Hong Kong
by IVS visitors (3.65 man-years) was only 83% of that by non-Mainland visitors
(4.42 man-years). This is because IVS visitors’ spending was heavily weighted
towards shopping, which generated the lowest employment per unit of spending,
while non-Mainland visitors’ spending was least weighted towards shopping. For
M-Permit visitors, their spending was most heavily weighted towards shopping,
and their per capita spending was low. As a result, the employment generated
(1.66 man-years) was the lowest. However, the employment generated by non-
M-Permit IVS visitors (5.24 man-years) was the highest as they have the highest
per capita spending ($6,950 in Table 5). Throughout 2009 to 2013, the
employment generated by non-M-Permit IVS visitors were even higher than those
of non-Mainland visitors.
As for employment generated per thousand visitors’ total spending (which
includes spending on cross boundary transport) in 2013, the employment
generated by M-Permit visitors (1.67 man-years) and IVS visitors (3.71 man-years)
were respectively only 32% and 72% of that generated by non-Mainland visitors
(5.17 man-years). The gap in employment generation between M-Permit visitors
and non-M-Permit IVS visitors was even bigger: In 2013, the employment
generated by the former was only 31% of that of the latter. IVS includes two very
different types of visitors: M-Permit (non-M-Permit) visitors with low (high)
employment generation. The patterns for 2007-2012 were similar to that of
2013: The employments generated per thousand visitors’ spending for M-Permit
visitors and IVS visitors were lower than those of non-Mainland visitors and non-
M-Permit IVS visitors.

37
Table 16 shows direct employment generated by different types of visitors
by sub-sectors of tourism from 2011 to 2013. Estimates for earlier years (2007 to
2010) are relegated to Appendix 5 as they take up too much space. In 2013, all
visitors, Mainland visitors, IVS visitors, and M-Permit visitors respectively
generated 6.4%, 4.5%, 2.7%, and 0.5% of total employment. Tourism is important
in the employment of the three industries, namely, Retail Trade, Accommodation,
and Food Services. In 2013, the spending of all visitors (IVS visitors) generated
34.7% (20.1%) of the employment in Retail Trade, 103% 11 (26.5%) of the
employment in Accommodation, and 20.9% (7.4%) of the employment in Food
Services.
5. Contributions of IVS to economic growth
IVS visitors have grown very rapidly. Though the value-added (employment)
generated by IVS visitors is not large as a percentage of GDP (employment), it is
possible that IVS has contributed significantly to the growth or the change of GDP
(employment). In the media, it is often asserted that IVS contributed to the rapid
recovery of the Hong Kong economy from the severe 2003 recession caused by
the SARS epidemic.
5.1 Contribution to growth of GDP
Table 17 shows the contributions of tourism and other key industries to the
growth of GDP from 2004 to 2013. We choose 2004 as the base year as it was the
first full year for implementation of IVS and was also the year that Hong Kong
recovered from the 2003 recession. The period 2004 to 2013 was divided into
two sub-periods, namely, 2004 to 2007, and 2007 to 2013. 2004 to 2007 was the
period of economic recovery with rapid growth. The unemployment rate fell from
the peak of 7.9% in 2003 to almost full employment level of 4% in 2007. As full
employment was reached in 2007, the rate of economic growth fell from 7% in
the first period to 2.5% in the second period. The 2008 global financial crisis also
contributed to the slowdown.
11
The employment generated by tourism in Accommodation was estimated from tourists’ spending, whereas the total employment in Accommodation was obtained from industry surveys. The former can be higher than the latter due to various reasons. One likely reason is that employment in unlicensed guesthouses is included in the former but not the latter. Estimation error is also possible.

38
Table 16 Direct employment generated by different types of visitors by sub-sectors of tourism, 2011-2013 (man-year)
Mainland Non-
Mainland All visitors
IVS Non-IVS All
Mainland
M-Permit Non-M-Permit All IVS
2011 Retail Trade 8,395 38,154 46,549 29,177 75,726 15,574 91,300
2.8% 12.5% 15.3% 9.6% 24.9% 5.1% 30.0%
Accommodation 550 8,622 9,172 7,447 16,619 22,381 39,000
1.6% 25.2% 26.8% 21.8% 48.6% 65.5% 114.1%
Food Services 1,460 12,779 14,239 10,746 24,985 17,815 42,800
0.6% 5.5% 6.1% 4.6% 10.8% 7.7% 18.4%
Others 994 5,325 6,320 4,648 10,968 8,732 19,700
Cross-Boundary Transport 49 1,071 1,119 1,780 2,900 10,500 13,400
Total 11,448 65,951 77,399 53,799 131,198 75,002 206,200
0.3% 1.8% 2.2% 1.5% 3.7% 2.1% 5.8%
2012 Retail Trade 12,715 41,342 54,056 32,740 86,797 13,403 100,200
4.0% 13.0% 17.0% 10.3% 27.3% 4.2% 31.5%
Accommodation 645 8,517 9,162 7,785 16,947 22,453 39,400
1.8% 23.2% 25.0% 21.2% 46.2% 61.2% 107.4%
Food Services 1,882 13,442 15,324 12,654 27,978 17,922 45,900
0.8% 5.8% 6.6% 5.5% 12.1% 7.7% 19.8%
Others 1,060 5,220 6,279 5,296 11,576 8,124 19,700
Cross-Boundary Transport 78 1,172 1,250 2,069 3,319 10,282 13,600
Total 16,379 69,692 86,071 60,545 146,616 72,184 218,800
0.4% 1.9% 2.4% 1.7% 4.0% 2.0% 6.0%
2013 Retail Trade 15,960 49,333 65,293 35,145 100,438 12,162 112,600
4.9% 15.2% 20.1% 10.8% 31.0% 3.8% 34.7%
Accommodation 696 9,484 10,180 8,227 18,407 21,393 39,800
1.8% 24.7% 26.5% 21.4% 47.9% 55.6% 103.5%
Food Services 2,185 15,111 17,296 13,743 31,039 17,761 48,800
0.9% 6.5% 7.4% 5.9% 13.3% 7.6% 20.9%
Others 1,314 6,274 7,588 6,310 13,898 8,602 22,500
Cross-Boundary Transport 96 1,385 1,481 2,402 3,884 10,108 14,000
Total 20,250 81,588 101,838 65,828 167,666 70,026 237,700
0.5% 2.2% 2.7% 1.8% 4.5% 1.9% 6.4%
Percentage figures indicate shares of employment in the respective sub-sectors/in total employment. Sources: Employment generated by visitors is estimation result of this paper. The employment of sub-sectors is Composite Employment Estimates obtained from the website of Census and Statistics Department.

39
Table 17 Contribution of tourism and other key industries to growth of GDP ($ million)
Increase in value-added in 2004-2007 2007-2013 2004-2013
1. Financial Services 154.3 23.4 177.7
48.2% 4.8% 21.9%
2. Tourism 15.3 51.9 67.2
4.8% 10.5% 8.3%
2.1 Inbound Tourism 12.9 47.7 60.6
4.0% 9.7% 7.5%
2.1.1. IVS Visitors 5.4 24.4 29.8
1.7% 5.0% 3.7%
3. Trading and Logistics 54.5 91.6 146.1
17.0% 18.6% 18.0%
4. Professional Services and Other Producer Services
42.2 78.4 120.6
13.2% 15.9% 14.9%
Four Key Industries = (1)+(2)+(3)+(4) 266.4 245.1 511.5
83.3% 49.8% 63.0%
All Industries 319.9 492.3 812.2
100.0% 100.0% 100.0%
Source: Estimation results of this paper.
The contribution of tourism to GDP in each period is obtained by dividing
the increase in GDP generated by tourism by the increase in overall GDP. The
contributions of other key industries are similarly obtained. From 2004 to 2007,
direct value-added generated by IVS visitors increased by $5.4 billion, while GDP
increased by $319.9 billion. IVS visitors only contributed 1.7% of the increase in
GDP. From 2007 to 2013, the contribution of IVS visitors to GDP growth rose to
5%, as IVS became popular with Mainland visitors, and the corresponding
contribution of all visitors (inbound tourism) was 9.7%. From 2004 to 2013, the
contribution of IVS visitors and all visitors to GDP growth were 3.7% and 7.5%
respectively. The contributions were significant, but still not very large.

40
As for the other key industries, Financial Services contributed 48.2% of the
growth of GDP from 2004 to 2007. It was the period of “irrational exuberance”
just before the sub-prime crisis. In comparison, the contributions of the other key
industries to GDP growth were much smaller. In the second period, Financial
Services contracted due to the global financial crisis, and its contribution to GDP
growth was only 4.8%; as a result, the contributions of the other three key
industries rose correspondingly. The contributions of IVS visitors (5%) and all
visitors (9.7%) were significant.
Combining the two periods (from 2004 to 2013), Financial Services was still
the number one contributor to GDP growth (21.9%), followed by Trading and
Logistics (18%), Professional Services and Other Producer Services (14.9%), and
Tourism (8.3%). Tourism still came last, but its contribution was significant.
5.2 Contribution to growth of total employment
Table 18 shows the contributions of tourism and other key industries to
growth of total employment. From 2004 to 2007, IVS and Inbound Tourism
contributed respectively 12.5% and 15.6% to the growth of total employment.
The contribution of all visitors (15.6%) exceeded that of Financial Services
(11.6%). This again shows that tourist industry is much more labour intensive than
the financial services sector.
From 2007 to 2013, the contributions of IVS and Inbound Tourism rose to
22.5% and 31.4% respectively. Among the four key industries, Tourism became
the number one contributor to growth of total employment. An important reason
for the prominence of tourism in employment was the rapid contraction in
employment of the trading and logistics sector, which has been the largest sector
in Hong Kong in terms of both GDP and employment. This sector has suffered
severely from the competition with Shanghai and Shenzhen. Shanghai surpassed
Hong Kong in container throughput in 2007 mainly due to cargo diversion from
Hong Kong to Shenzhen, and Shenzhen also surpassed Hong Kong in container
throughput in 2013.

41
Table 18 Contribution of tourism and other key industries to growth of employment (man-year)
Increase in employment in 2004-2007 2007-2013 2004-2013
1. Financial Services 23,300 39,000 62,300
11.6% 15.7% 13.9%
2. Tourism 37,000 78,300 115,300
18.4% 31.6% 25.7%
2.1. Inbound Tourism 31,400 77,800 109,200
15.6% 31.4% 24.3%
2.1.1. IVS Visitors 25,112 55,689 80,801
12.5% 22.5% 18.0%
3. Trading and Logistics 51,000 -69,000 -18,000
25.3% -27.8% -4.0%
4. Professional Services and Other Producer Services
45,300 57,500 102,800
22.5% 23.2% 22.9%
Four Key Industries = (1)+(2)+(3)+(4) 156,600 105,900 262,500
77.8% 42.7% 58.4%
All Industries 201,400 248,000 449,400
100.0% 100.0% 100.0%
Source: Estimation results of this paper.
The diversion of Hong Kong sea cargo to Shenzhen has been partly offset by
growth of air cargo. The slowdown of Hong Kong re-exports trade is partly
compensated by the growth of offshore trade. Although air transport and
offshore trade generate substantial value-added, they generate very little
employment. From 2007 to 2012, value-added in the trading and logistics sector
continued to grow, but the sector lost 71,300 workers. Given this large fall,
expansion of employment in tourism and the other key industries is crucial to
maintaining full employment in Hong Kong.

42
In terms of contribution to growth of employment from 2004 to 2013,
Tourism was again the number one contributor, followed by Professional Services
and Other Producer Services, and then by Financial Services. The contribution of
Trading and Logistics was negative due to the fall in employment. The prominence
of tourism in growth of employment can be attributed to three factors. First,
tourists’ spending has grown very rapidly. Second, tourism is the most labour
intensive industry among the four key industries. Third, the contraction of
employment in the trading and logistics sector raised the relative contributions of
the other key industries.
It should be stressed that, from 2007 to 2013, IVS accounted for the greater
part of the growth of employment in tourism. Employment generated by IVS rose
by 55,689, accounting for over 71% of the growth of employment in tourism of
78,300. Within tourism, most of the growth in employment came from inbound
tourism. Within inbound tourism, IVS was the fastest growing component. Non-
IVS visitors grew moderately because Mainland visitors shift from group tours to
IVS. Non-Mainland visitors grew slowly by comparison.
With regard to M-Permit visitors, the growth in GDP (employment)
contributed by the M-Permit Scheme was $4,130 million (11,079 man-years) or
1.2% (4.4%) of the increase in GDP (employment) between 2010 and 2013.12 The
contribution of the Scheme to the growth of GDP was small, but its contribution
to the growth of employment was not insignificant.
To conclude, while the contributions of IVS visitors’ spending to GDP and
employment were not large (1.6% of GDP and 2.7% of employment in 2013), the
growth of IVS visitors’ spending from 2007 to 2013 accounted for 22.5% of the
growth of total employment during this period. Given the fall in employment in
Trading and Logistics (the number one sector in total employment) since 2007,
unemployment in Hong Kong may be substantially higher were it not for the rapid
expansion of IVS.
It should be emphasized that our analysis of contribution of IVS to growth is
an accounting exercise and not a causal analysis of contributions of IVS to
12
The contributions of M-Permit visitors to GDP (employment) are not give in Table 17 (18) as the M-Permit Scheme was launched in 2009.

43
economic growth. However, this accounting exercise is highly suggestive. The
institution of IVS in 2003 is an exogenous event that led to rapid increase in
visitors’ spending and employment creation in tourism. The rise of Shenzhen
ports is also an exogenous event that led to fall in employment in Trading and
Logistics, the number one sector in employment. The large contributions of
tourism and IVS visitors to growth of employment are consistent with our
knowledge of the macro-trends in the economy.
6. Potential biases and limitations of the paper
The distribution of visitors’ spending comes from interviews with visitors, asking them to recall their spending on various items. This is subject to bias. The crucial question for our paper is whether the biases are more serious for IVS visitors than for other types of visitors.
There is some reasons to believe that the reported spending of IVS visitors is biased downwards more seriously than other types of visitors. From press reports, a number of IVS visitors are very big shoppers, spending hundreds of thousands on luxury items, e.g., buying scores of luxury watches on a single trip. The distribution of spending of IVS visitors is likely to be more highly skewed (with a long tail of big spenders) than non-Mainland visitors. In this case, the outliers on the long tail can have a significant effect on the average of the distribution. Interviews may not catch the big spenders because their opportunity cost of time is high and they are less likely to take interviews. For this reason, the spending estimated by the HKTB is likely to be biased downwards. However, we cannot gauge the size of the bias.
In this paper, we assume that the value-added or employment generated per dollar of spending in each sub-sector is the same for different types of visitors. This may not be the case. For example, IVS visitors may tend to stay in low-end hotels while non-Mainland visitors may tend to stay in luxury hotels. This will further widen the gap in per capita value-added between IVS visitors and non-Mainland visitors.
Our paper does not analyze the impact of IVS on income distribution. There is a popular belief that IVS is not favourable for income distribution. However, as mentioned in Sung (2014: 41), there are two opposing effects of IVS on income distribution. On the one hand, the growth of IVS visitors has vastly outstripped the increase in retailing space, and shop rentals have rose rapidly in premium tourist districts. This should lead to a worsening of income distribution at the

44
upper end. On the other hand, IVS is important for employment creation and lowering the unemployment rate, especially for low skilled workers. This should lead to an improvement in income distribution at the lower end. The overall effect of soaring shop rentals and lowering unemployment on income distribution is very difficult to judge without a detailed study.
7. Conclusion
This paper quantifies the direct benefits in value-added and employment of different types of visitors. Direct benefit is the best measure because the inclusion of indirect or induced effects may exaggerate benefits and also lead to double counting. In 2013, all visitors, Mainland visitors, IVS visitors, and M-Permit visitors respectively generated 4.2%, 2.6%, 1.6%, and 0.3% of GDP, and also generated 6.4%, 4.5%, 2.7%, and 0.5% of employment.
In 2013, though the per capita spending of IVS visitors was 13% higher than that of non-Mainland visitors, the per capita value-added (employment) generated by IVS visitors was only 49% (72%) of that of non-Mainland visitors. This is because the spending of IVS visitors is weighted heavily towards Retail Trade (shopping), which generates little value-added or employment per dollar of spending as most of the goods sold are imported. Moreover, IVS visitors generate little value-added or employment in cross-boundary transport as they mostly arrive in Hong Kong by land. Per capita visitor’s spending can be a poor indicator of per capita value-added. As a group, non-Mainland visitors generated more value-added than IVS visitors ($33,200 million vs. $33,095 million in 2013) though non-Mainland visitors were much less numerous (25% of tourist arrivals vs. 52% in 2013).
While the contributions of IVS visitors to total value-added and employment were not large (1.6% of GDP and 2.7 % of total employment in 2013), the contribution of IVS visitors to the growth of employment was large. This is due to rapid growth of employment generated by tourism and slow growth of total employment in Hong Kong. In the 2007-2013 (2004-2013) period, the increase in IVS visitors accounted for 22.5% (18%) of the increase in total employment in Hong Kong. Among the four key industries, tourism is number one contributor to increase in employment.

45
When the economy is close to full employment, an increase in tourists’ spending will not be able to generate much real gains. However, the losses in income and employment arising from a decrease in tourists’ spending can be large. Full employment will constrain a rise in output, but it will not restrict a fall in output. If IVS were to disappear, the overall fall in income and employment can be substantially larger than direct effects in the short run due to indirect and induced effects.
It may be argued that, in the long run, with falling wages and rentals, other industries will expand to take up the idle resources released by tourism. However, in the current Hong Kong context, the prospect of other industries is quite uncertain. Trade and Logistics, the number one industry in both value-added and employment, is under serious threat. Its employment is shrinking rapidly. Financial Services may have better prospects, but the industry will not be able to create a lot of employment as it is not labour intensive. The unemployment rate in Hong Kong may rise substantially were it not for IVS.
The estimates of this paper ignore negative or positive externalities, which can be substantial. Negative externalities of IVS in terms of congestion and overcrowding are highly visible. Positive externalities of IVS can be large, but they are often ignored in public discussion because they are less conspicuous. It should be noted that the size of negative externality of tourism is highly dependent on the capacity to receive tourists. If the government can expand the capacity to receive tourists significantly, the negative externalities of tourism will diminish. Overcrowding and congestion are obviously a result of capacity constraints. The undesirable impact of tourism on income distribution arising from soaring shop rentals is also a result of shortage of retail space. Inept government policy is responsible for most of the negative externalities of tourism. With effective government policies to relieve capacity constraints, positive externalities may out-weight negative ones.
However, expansion of supplies of land and labour and upgrading of infrastructure is a very time-consuming process. Even with aggressive policies to expand capacity, supply bottlenecks will not be relieved soon. Given the very rapid increase in tourist arrivals and the very severe shortage of land and labour in Hong Kong, demand is likely to outstrip supply for a long time to come. In addition to aggressive policies to expand supply, the government should also consider demand-side management to alleviate congestion and overcrowding. In this regard, the restriction on M-Permits in 2015 was justified. In 2013, the per

46
capita value-added (employment) generated by M-Permit visitors was only 20.5% (32%) of that of non-Mainland visitors. In the same year, the total value-added (employment) generated by M-Permit visitors was only 0.29% (0.5%) of GDP (total employment).
In 2015, the Hong Kong tourist industry is heading towards a severe recession, largely a result of a strong Hong Kong dollar (which is linked to the USD), and economic slowdown in China and in the world. The hostility of local residents towards Mainland visitors plays a contributory role. To stimulate tourism, there are proposals to widen the geographical coverage of IVS, adding more cities in China (e.g., Xian, Qingdao, and Harbin) to the present list of 49 cities under the IVS.13 The proposal is worth considering as the per capita value-added and the per capita employment generated by non-M-Permit IVS visitors were much higher than those of M-Permit visitors. In 2013, the per capita value-added (employment) of non-M-Permit IVS visitors was 3.5 times (3.2 times) of that of M-Permit visitors. Throughout 2009 to 2013, the employment effects of non-M-Permit IVS visitors were even higher than those of non-Mainland visitors. Widening the geographical coverage of IVS has been very unpopular, but the pains of unemployment may eventually swing public opinion. To optimize the limited capacity to receive tourists in Hong Kong, it is rational to substitute high value-added visitors for low value-added ones.
13
The Standard, 2015 April 13, http://www.thestandard.com.hk/news_detail.asp?art_id=156006&con_type=3.

47
Appendix 1 Estimated value added and employment generated by IVS visitors: Comparison of official estimates with ours
Value added ($ million)
Employment generated (man-year)
Official
Ours
Official
Ours
2004 2718.26
3274.49
18948.14
21036.76
(1.2)
(1.1)
2005 2771.67
4580.90
19878.95
27337.92
(1.7)
(1.4)
2006 4327.81
6128.49
31483.67
33952.08
(1.4)
(1.1)
2007 7461.82
8717.45
41157.09
46149.03
(1.2)
(1.1)
2008 7980.21
10350.10
44545.74
49777.95
(1.3)
(1.1)
2009 10091.84
11173.21
53841.76
57987.74
(1.1)
(1.1)
2010 N/A
16127.56
N/A
67591.17
2011 N/A
22966.96
N/A
77399.21
2012 26100
26741.54
114280
86071.15
(1.0)
(0.8)
2013 N/A
33094.77
N/A
101838.13
Sources: For official estimates, see Table 3. For our estimates on value added (employment), see Table 12 (16).

48
Appendix 2: Estimates for M-Permit visitors
The HKTB (Hong Kong Tourism Board) provides detailed statistics on various types of visitors (IVS, Mainland, and non-Mainland visitors) at its website. However, data on M-Permit visitors are scanty. This Appendix details the sources of our data for M-Permit visitors and the method used in our estimates when official data is not available.
Number of M-Permit visitors (Table 4 and Figure 1)
Data on same-day and overnight M-Permit visitors from 2009 to 2013 are required to estimate per capita spending:
2009 to 2012: The numbers of same-day and overnight M-Permit visitors are released in the CEDB report (Commerce and Economic Development Bureau 2013: 7).
2013: Statistics on same-day and total M-Permit visitor arrivals are respectively sourced from Research Brief of the Legislative Council Secretariat (2014 May) and Mingpao News (2015, January 19). The number of overnight visitors is obtained as a residual.
2014: Total M-Permit visitor arrivals are taken from Mingpao News (2015, January 19).
For brevity, the estimates of same-day and overnight visitors are not reported separately as this study focuses on the estimates for all visitors, which are reported in Table 4.
Per capita spending of M-Permit visitors (Table 5)
Per capita spendings of same-day and overnight M-Permit visitors are mostly not available, except for those in 2012 (Commerce and Economic Development Bureau 2013: 8), and also for same-day M-Permit visitors’ per capita spending (Oriental Daily 2014, June 26).
Whenever official data are not available, the official estimates of per capita spendings of same-day and overnight M-Permit visitors in 2012 are used to estimate the corresponding per capita spending in other years, by assuming that the proportional change of per capita spending over time (using 2012 as the base year) of same-day (overnight) M-Permit visitors is the same as that of same-day (overnight) IVS visitors. For each year, the estimate of per capita spending of all M-Permit visitors (Table 5) is then obtained as a weighted average of our estimates of same-day and overnight per capita spending, where the weights are given by the numbers of same-day and overnight M-Permit visitors. The total spending of M-Permit visitors (Table 6) is easily obtained as the product of per capita spending and number of visitors.

49
Distribution of spending of M-Permit visitors (Table 7)
The distribution of M-permit visitors’ spending is mostly not available except for official estimates for 2009 (EABF 2010). To gauge the distributions in various years, our estimates assume that the distributions of the expenditures of same-day and overnight M-Permit visitors are the same as those of corresponding IVS visitors. The distribution of the spending of all M-Permit visitors (reported in Table 7) is a weighted average of those of same-day and overnight M-Permit visitors, where the weights are the shares of their spending in the total. As can be seen in the table below, our estimates for 2009 are extremely close to those of the EABF, showing that our method of estimation is quite robust.
Table: Distribution of expenditure of M-permit visitors in 2009: comparison of the EABF estimates with
our own estimates
EABF estimates Our own estimates
Retail Trade 87.4% 88.1%
Accommodation 2.9% 2.5%
Food Services 4.4% 4.1%
Others 5.3% 5.3%

50
Appendix 3: Estimation of value added/employment in cross-boundary transport
To disaggregate the official estimates of value added/employment in cross-boundary transport generated by different types of visitors (shown in Table 1/2), we rely on data released by the HKTB on modes of transport (air, land, and sea) of arrival. As mentioned before, the per capita value added/employment in cross-boundary transport of visitors arriving by air14 is much higher than that of those arriving by land and by sea.
The HK government has estimated the value added/employment of IVS visitors for selected years, namely, 2004 to 2009, and 2012. The 2004 to 2009 estimates were done by the Economic Analysis and Business Facilitation Unit (EABF), and the 2012 estimates were done by the Commerce and Economic Development Bureau (CEDB). These studies have also estimated the value added/employment in cross-boundary transport generated by IVS visitors, providing valuable data for our estimates.
For brevity, Value Added (Employment) in Cross-Boundary Transport is abbreviated as VACBT (ECBT). We will first cover the method of estimation of VACBT. The method of estimating ECBT is analogous to that of VACBT, as will be seen later.
We assume that the per capita VACBT of visitors arriving by land, abbreviated L, is the same as those arriving by sea. The EABF studies on IVS made the same assumption (EABF 2005: Annex C). Furthermore, we assume L is the same for all types of visitors. This assumption is not unrealistic as visitors arriving by land or by sea mostly came from the areas near Hong Kong (the Pearl River Delta). The per capita VACBT of short-distance travels to Hong Kong should not be very different.
Estimate of L (per capita VACBT of visitors arriving by land and by sea)
The EABF, in its estimate of value added by IVS visitors, gives the VACBT of “M-permit” visitors in 2009 ($6 million in value added generated by 758,383 “M-permit” visitors) (EABF 2010). “M-permit” visitors are from Shenzhen and nearly all of them come to Hong Kong by land or by sea as there is no flight between Shenzhen and Hong Kong.15 From this information, we can easily compute L:
L = $6 million/758,383 = $7.91157
As expected, L is very small. We further assume that L is constant from 2007 to 2013. This assumption does not appear to be realistic as there would be inflation over time. However, as L is very small, adjusting L for inflation does not change our estimates significantly. As will be seen below, the VACBT of air travel plays a dominating role in our estimates.
For air travel, we distinguish between Mainland and Non-Mainland visitors. The per capita VACBT of Mainland visitors arriving by air (denoted M_At for year t) should be significantly lower than that of non-Mainland visitors arriving by air (denoted NM_At for year t) as the latter
14
See Table 10 for the proportions of various types of visitors arriving by air. 15
A very small proportion of M-Permit visitors may first travel to other cities and then fly to Hong Kong.

51
involves more long haul flights.16 Given L, M_At, and NM_At, the VACBT of all types of visitors can easily be computed.
We need to estimate M_At and NM_At from 2007 to 2013. Our estimates from 2007 to 2009 are based on the estimates of the studies of the EABF. Our estimates for 2012 are based on the estimates of the study of the CEDB. Our estimates for 2010, 2011, and 2013 are extrapolated from our 2012 estimates. Details are given below.
Our estimates for 2007, 2008, 2009, and 2012
For each year, M_At is easily solved from equation (1) below:
(L) (N_IVS_Lt) + (M_At) (N_IVS_At) = VACBT_IVSt
where N_IVS_Lt is the number of IVS arrivals by Land and by Sea in year t,
N_IVS_At is the number of IVS arrivals by Air in year t. and,
VACBT_IVSt is the VACBT of IVS visitors in year t (obtained from the EABF estimates in 2007, 2008, 2009, and from the CEDB estimate in 2012).
As M_At is assumed to be the same for all Mainland visitors, the VACBT of all types of Mainland visitors (IVS vs. non-IVS) are easily computed.
NM_At is easily solved from equation (2) below:
(L) (N_NM_Lt) + (NM_At) (N_NM_At) + VACBT_Mt = VACBT_ALLt
where N_NM_Lt is the number of Non-Mainland visitors arriving by Land and by Sea in year t,
N_NM_At is the number of Non-Mainland visitors arriving by Air in year t,
VACBT_Mt and VACBT_ALLt are respectively the VACBT of Mainland visitors and ALL visitors in year t.
Our estimates for 2010, 2011, and 2013
Our estimates for the three years of 2010, 2011, and 2013 are extrapolated from M_At and NM_At in 2012. Over time, the per capita VACBT of air travel is largely determined by airfares. For these three years, we assume that M_At and NM_At change by the same proportion, Kt , over those in 2012:
M_At = Kt (M_A2012), and
NM_At = Kt (NM_At2012)
16
This is a refinement over the method used In Sung (2014), which assumed that the VACBT of Mainland and non-Mainland visitors arriving by air was identical.

52
Kt is easily solved from equation (3) below:
Kt (M_A2012) (N_ALL_Lt) + Kt (NM_A2012) (N_ALL_At) = VACBT_ALLt
where N_ALL_Lt is Number of all visitors arriving by Land and by Sea in year t, and
N_ALL_At is the number of all visitors arriving by Air in year t.
Once Kt is computed, the VACBT of all types of visitors are easily obtained.
Estimation of ECBT (Employment generated in Cross-Boundary Transport)
For all types of visitors, the estimation of ECBT is exactly analogous to that of VACBT (Value Added in Cross-Boundary Transport). We distinguish between (1) the per capita ECBT of visitors arriving by land and by sea (assumed to be the same for all years and for all types of visitors), (2) the per capita ECBT of Mainland visitors, and (3) the per capita ECBT of non-Mainland visitors.
As in the case of VACBT, the per capita ECBT of visitors arriving by land and by sea is computed from the EABF estimates of ECBT generated by M-Permit visitors in 2009. The per capita ECBT of Mainland visitors arriving by air in the three years of 2007, 2008, and 2009 (in the year 2012) are computed from the EABF (CEDB) estimates of ECBT generated by IVS visitors in the corresponding years. To obtain the ECBT of non-Mainland visitors arriving by air, we just subtract the ECBT of Mainland visitors arriving by air, and that of all visitors arriving by land and by sea from the ECBT of all visitors.
As in the case of VACBT, the per capita ECBT’s of Mainland and non-Mainland visitors arriving by air in 2010, 2011, and 2013 are extrapolated from the corresponding estimates in 2012.

53
Appendix 4 Total direct value-added of different types of visitors' by sub-sectors of tourism ($ million), 2007-2010
Mainland Non-
mainland All
visitors
IVS Non-IVS All mainland
M-Permit Non-M-Permit All IVS
2007 Retail Trade - - 4,687 3,364 8,051 3,049 11,100
- - 11.0% 7.9% 18.9% 7.2% 26.1%
Accommodation - - 1,633 1,544 3,177 9,223 12,400
- - 9.7% 9.2% 18.9% 54.8% 73.7%
Food Services - - 1,050 1,001 2,052 2,448 4,500
- - 3.3% 3.1% 6.4% 7.7% 14.1%
Others - - 940 945 1,886 2,214 4,100
Cross-Boundary Transport - - 407 747 1,154 8,047 9,200
Total - - 8,718 7,601 16,319 24,982 41,300
- - 0.53% 0.46% 0.99% 1.51% 2.50%
2008 Retail Trade - - 5,516 3,851 9,367 3,133 12,500
- - 11.6% 8.1% 19.7% 6.6% 26.3%
Accommodation - - 2,053 1,870 3,922 8,978 12,900
- - 11.4% 10.4% 21.8% 49.9% 71.7%
Food Services - - 1,233 1,169 2,402 2,598 5,000
- - 3.5% 3.3% 6.7% 7.3% 14.0%
Others - - 1,035 1,045 2,080 2,220 4,300
Cross-Boundary Transport - - 513 866 1,379 1,121 2,500
Total - - 10,350 8,800 19,151 18,051 37,200
- - 0.61% 0.52% 1.12% 1.06% 2.18%
2009 Retail Trade 517 6,074 6,591 4,201 10,792 2,508 13,300
1.1% 12.9% 14.0% 8.9% 22.9% 5.3% 28.2%
Accommodation 53 1,753 1,806 1,517 3,324 6,476 9,800
0.4% 12.1% 12.5% 10.5% 23.0% 44.8% 67.8%
Food Services 59 1,194 1,253 1,090 2,343 2,157 4,500
0.2% 3.5% 3.6% 3.2% 6.8% 6.3% 13.1%
Others 87 1,221 1,308 1,097 2,405 2,295 4,700
Cross-Boundary Transport 12 203 214 318 533 7,467 8,000
Total 728 10,445 11,174 8,223 19,397 20,904 40,300
0.04% 0.63% 0.67% 0.50% 1.17% 1.26% 2.43%

54
Appendix 4 (Continued)
Mainland Non-
mainland All
visitors
IVS Non-IVS All mainland
M-Permit Non-M-Permit All IVS
2010 Retail Trade 1,380 7,113 8,492 5,068 13,560 3,340 16,900
2.5% 12.6% 15.1% 9.0% 24.1% 5.9% 30.0%
Accommodation 177 3,021 3,198 2,707 5,905 10,195 16,100
0.9% 15.8% 16.8% 14.2% 31.0% 53.5% 84.4%
Food Services 166 1,683 1,849 1,586 3,436 2,864 6,300
0.4% 4.5% 5.0% 4.2% 9.2% 7.7% 16.9%
Others 208 1,506 1,714 1,429 3,143 2,957 6,100
Cross-Boundary Transport 33 840 873 1,583 2,456 11,344 13,800
Total 1,963 14,165 16,128 12,374 28,501 30,700 59,200
0.11% 0.80% 0.91% 0.70% 1.60% 1.73% 3.33%
Percentage figures indicate shares of value-added in the respective sub-sectors/in total GDP. Sources: See Table 12.

55
Appendix 5 Direct employment generated by different types of visitors by sub-sectors of
tourism, 2007-2010 (man-year)
Mainland Non-
mainland All
visitors
IVS Non-IVS All mainland
M-Permit Non-M-Permit All IVS
2007 Retail Trade - - 31,249 22,424 53,673 20,327 74,000
- - 11.0% 7.9% 18.8% 7.1% 26.0%
Accommodation - - 3,898 3,685 7,583 22,017 29,600
- - 11.3% 10.7% 22.0% 63.8% 85.8%
Food Services - - 7,283 6,942 14,226 16,974 31,200
- - 3.2% 3.0% 6.2% 7.4% 13.7%
Others - - 3,234 3,251 6,485 7,615 14,100
Cross-Boundary Transport
- - 474 885 1359 9641 11100
Total - - 46,138 37,188 83,326 76,575 160,000
- - 1.3% 1.1% 2.4% 2.2% 4.6%
2008 Retail Trade - - 33,492 23,382 56,874 19,026 75,900
- - 11.5% 8.0% 19.6% 6.5% 26.1%
Accommodation - - 4,535 4,130 8,665 19,835 28,500
- - 13.0% 11.8% 24.8% 56.8% 81.6%
Food Services - - 7,720 7,318 15,038 16,262 31,300
- - 3.4% 3.2% 6.6% 7.1% 13.7%
Others - - 3,418 3,451 6,869 7,331 14,200
Cross-Boundary Transport
- - 612 1,049 1,661 9,639 11,300
Total - - 49,778 39,330 89,108 72,092 161,200
- - 1.4% 1.1% 2.5% 2.1% 4.6%
2009 Retail Trade 3,198 37,540 40,738 25,961 66,699 15,501 82,200
1.1% 12.8% 13.9% 8.8% 22.7% 5.3% 28.0%
Accommodation 147 4,849 4,996 4,195 9,191 17,909 27,100
0.4% 14.5% 14.9% 12.5% 27.5% 53.5% 81.0%
Food Services 364 7,404 7,768 6,760 14,528 13,372 27,900
0.2% 3.4% 3.5% 3.1% 6.6% 6.1% 12.6%
Others 275 2,684 4,119 3,454 7,573 7,227 14,800
Cross-Boundary Transport
12 356 368 623 991 10,609 11,600
Total 3,996 52,832 57,988 40,994 98,982 64,618 163,600
0.1% 1.5% 1.7% 1.2% 2.9% 1.9% 4.7%
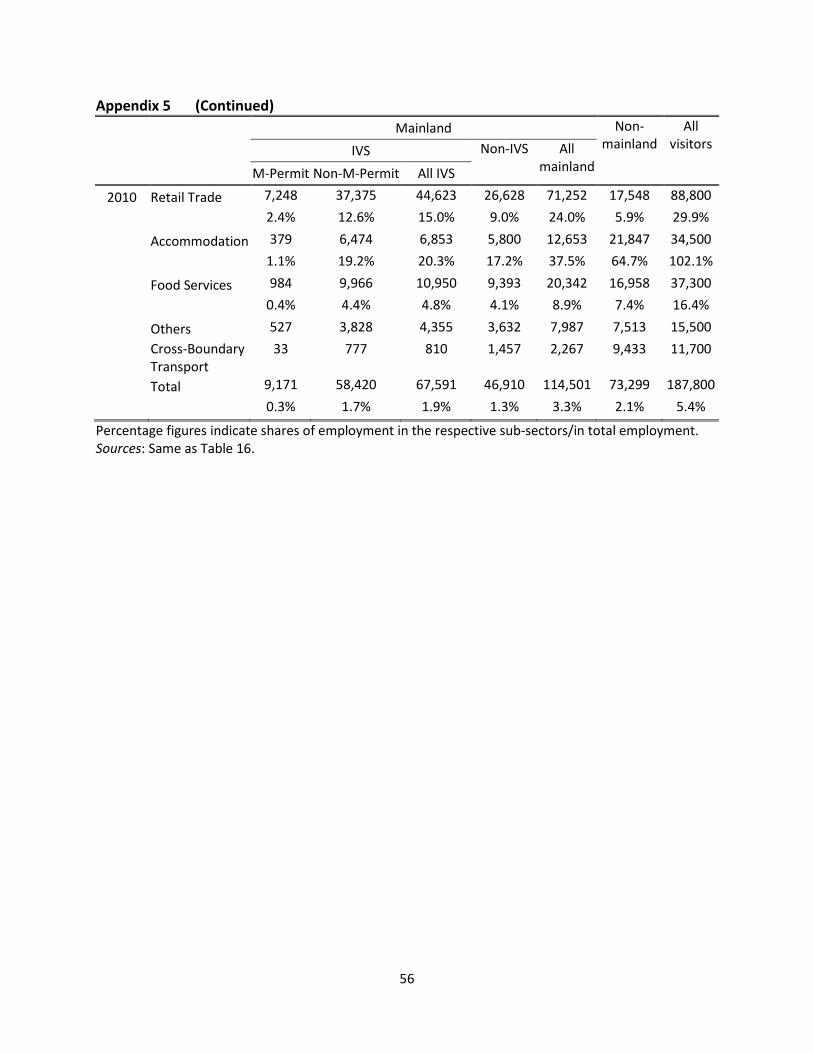
56
Appendix 5 (Continued)
Mainland Non-
mainland All
visitors
IVS Non-IVS All mainland
M-Permit Non-M-Permit All IVS
2010 Retail Trade 7,248 37,375 44,623 26,628 71,252 17,548 88,800
2.4% 12.6% 15.0% 9.0% 24.0% 5.9% 29.9%
Accommodation 379 6,474 6,853 5,800 12,653 21,847 34,500
1.1% 19.2% 20.3% 17.2% 37.5% 64.7% 102.1%
Food Services 984 9,966 10,950 9,393 20,342 16,958 37,300
0.4% 4.4% 4.8% 4.1% 8.9% 7.4% 16.4%
Others 527 3,828 4,355 3,632 7,987 7,513 15,500
Cross-Boundary Transport
33 777 810 1,457 2,267 9,433 11,700
Total 9,171 58,420 67,591 46,910 114,501 73,299 187,800
0.3% 1.7% 1.9% 1.3% 3.3% 2.1% 5.4%
Percentage figures indicate shares of employment in the respective sub-sectors/in total employment. Sources: Same as Table 16.

57
References
Commerce and Economic Development Bureau, 2013. “Assessment Report on Hong Kong’s Capacity to Receive Tourists”, December (http://www.tourism.gov.hk/resources/english/paperreport_doc/misc/2014-01-17/Assessment_Report_eng.pdf)
Economic Analysis and Business Facilitation Unit, Financial Secretary’s Office, 2005. “Impact of the first phase of CEPA on the Hong Kong Economy”, in Mainland and Hong Kong Closer Economic Partnership Arrangement (Cepa) - Impact on the Hong Kong Economy, Legco Paper Number CB(1)1259/04-05(03), website of Legislative Council, Hong Kong.
Economic Analysis and Business Facilitation Unit, Financial Secretary’s Office, 2010. “2010 Update of CEPA’s Impact on the Hong Kong Economy (Individual Visit Scheme)” in Mainland and Hong Kong Closer Economic Partnership Arrangement (CEPA) – Impact on the Hong Kong Economy, Legco Paper Number LC Paper No. CB(1)1849/06-07(04), website of Legislative Council, Hong Kong.
Finance Committee Meeting Document, 2014 (in Chinese), pp. 295-298 財務委員會審核二零
一四至一五年度開支預算, 管制人員的答覆, 商務及經濟發展局局長, 第 11 節會議, 綜合
檔案名稱:CEDB(CIT)-c1.doc (http://www.cedb.gov.hk/citb/doc/tc/legcomfc/CEDB_(CIT)_c1_2014.pdf)
Lin, Tzong-biau, and Sung, Yun-wing, 1984. “Tourism and Economic Diversification in Hong Kong”, Annuals of Tourism research, Vol 11, pp. 231-247.
Research Brief of Legislative Council Secretariat Research Office, 2014. “Individual Visit Scheme”, Issue no. 6, May 7, Paper number RB06/13-14 on homepage of Legislative Council, Hong Kong.
Sung, Yun-Wing, 2014. “Economic Benefits of the Independent Visitor Scheme for Hong Kong: How Large are They?”, Occasional Paper No. 32, Shanghai-Hong Kong Development Institute, Chinese University of Hong Kong, April (http://www.cuhk.edu.hk/shkdi/) .