valuation of recreational benefits of natural tourism ... · journal of economics 21/1 2017,...
TRANSCRIPT

J O U R N A L O F E C O N O M I C S 2 1 / 1
201
7,
JA
N.—
JU
N.
31
FACULTY OF ECONOMICS –- CMU
~ 31 ~
การประเมินมลูค่าประโยชน์ด้านนันทนาการของแหล่งท่องเท่ียวทางธรรมชาติ กรณี คณุภาพแหล่งท่องเท่ียวเส่ือมโทรม
ในอ าเภอแม่วาง เชียงใหม่ ประเทศไทย Valuation of Recreational Benefits of Natural Tourism Sites :
A Case Study of the Decline in Quality of Tourism Sites in Mae Wang District, Chiang Mai Province, Thailand1
Mathana Inchai2
Surachai Kungwon3 Waraporn Nunthasen4
Nuttiya Tantranont5
การวจิยัครัง้นี้มวีตัถุประสงค์ เพื่อศกึษาปัจจยัทีม่อีทิธพิลต่อการตัดสินใจของนักท่องเที่ยวในการเดินทางไปทอ่งเทีย่วเชงินนัทนาการในชมุชนแมว่าง จงัหวดัเชยีงใหม ่และเพื่อคาดการณ์การเปลี่ยนแปลงมูลค่าประโยชน์ด้านนันทนาการของแหล่งท่องเที่ยวในชุมชนแม่วาง จงัหวดั
เชยีงใหม่ กรณีสมมต ิคุณภาพแหล่งท่องเทีย่วเสื่อมโทรมลง โดยใชว้ธิกีารวเิคราะห์ต้ นทุ น ก า ร เ ดินทา งส่ ว นบุ คคล ( Individual Travel Cost Method, ITCM) ใ ช้แบบสอบถามในการเกบ็ขอ้มลูจากนักท่องเทีย่วชาวไทยทีม่ลีกัษณะการเดนิทางแบบ Single Purpose Visitors จ านวน 400 คน ผลการศกึษาพบว่า ปัจจยัที่มอีทิธิพลต่อการตดัสนิใจของนักท่องเที่ยวในการเดินทางไปท่องเที่ยวในชุมชนแม่วาง จงัหวดั
1 This article is part of dissertation of Community Economy and Technology Development
Curriculum, Asian Development College for Community Economy and Technology, Chiang Mai Rajabhat University.
2 Student in Doctor of Philosophy in Community Economy and Technology Development program, Chiang Mai Rajabhat University
3 Associate Professor in Faculty of Economics of Maejo University 4 Assistant Professor in Faculty of Economics of Maejo University. 5 Lecturer in Asian Development College for Community Economy and Technology of Chiang Mai
Rajabhat University.
บทคดัย่อ
JOURNAL OF ECONOMICS CHIANG MAI UNIVERSITY – 21/1
Eckles, D.L. and Narumon Saardchom. (2007, November). Technical and Scale
Efficiency in Thai Non-life Insurance Industry. Nida Business Journal,
105-124.
Hirofumi Fukuyama. (1997). Investigating Productivity Efficiency and Productivity
Changes of Japanese Life Insurance Companies. Pacific-Basin
Finance Journal, 5, 481-509.
Maria Rosa Borges, Milton Nektarios and Carlos Pestana Barros. (2008).
Analysing The Efficiency of The Geek Life Insurance Industry. European
Research Studies, 6(3).
Martin Eling and Micheal Luhnen. (2008). Frontier Efficiency Methodologies
to Measure Performance in the Insurance Industry: Overview and
New Empirical Evidence. University of St. Gallen Working Papers on
Risk Management and Insurance Paper No. 56.
Norma Md Saad and Nur Edzalina Haji Idris. (2011, March). Efficiency of Life
Insurance Companies in Malaysia and Brunei: A Comparative Analysis.
International Journal of Humanities and Social Science, 1(3), 111-
122.
R. Färe, S. Grosskopf, M. Norris and Z. Zhang. (1994). Productivity Growth,
Technical Progress and Efficiency Change in Industrialized Countries.
American Economic Review, 84(1), 66-83.
~ 30 ~
F A C U L T Y O F E C O N O M I C S C M U .21
/1
32
FACULTY OF ECONOMICS –- CMU
~ 33 ~
organizations to impose measures to develop tourism sites and protect them against the decline in quality. The measures must include tourism resource consumption control and visitor facility management in order to achieve maximum satisfaction from visitors and create positive attitude of visitors that destination they visit are worth visiting. Keywords: Individual Travel Cost Method (ITCM), Recreational benefit values, Mae
Wang District
The abundant tourism resources and the diversity of cultures are the important factors that make Thailand famous for its tourism throughout the world. Chiang Mai is an important tourism province in Thailand that hosts numerous visitors each year. In 2015, 8,665,502
persons visitors came to Chiang Mai, an 18.18% increase from 2014 (Department of Tourism, 2016), generating 2,570 million baht in income, up by 11.95% from 2014 (National Statistical Office, 2016). Chiang Mai has an important features include good climate, beautiful landscapes, and outstanding tourism resources, such as natural attractions, history, culture, a unique cultural identity, availability of tourist facilities, and accommodation are keys to success of Chiang Mai as the tourism hub in northern Thailand. Moreover, Chiang Mai has the highest number of natural tourism sites in the northern provinces of Thailand, holding a total of 24.11% of the total natural tourism sites in the northern provinces (Department of Tourism, 2014). One of those charming places with famous and popular natural tourism sites in Chiang Mai is Mae Wang District or Mae Wang River Basin, which are situated not far from Chiang Mai’s city center, are among the most famous and popular natural attractions in Chiang Mai Province. 81% the tourism sites are located in Mae Win sub-district (Chuchart, 2001b). Access to the tourism sites by main routes is convenient and inexpensive. Visitors can have a 1-day trip from the city center to the tourism sites. Main features of the tourism sites in Mae Wang District are their natural and cultural values. The landscape is mostly mountainous and 78.94% the local population is hill tribes, ethnic minorities who live on mountains
1 Introduction
JOURNAL OF ECONOMICS CHIANG MAI UNIVERSITY – 21/1
~ 32 ~
เชยีงใหม ่ไดแ้ก ่รายไดเ้ฉลีย่ของนกัทอ่งเทีย่ว ทศันคตขิองนกัท่องเทีย่ว ประสบการณ์ ตน้ทุนในการเดนิทางไปยงัแหล่งท่องเทีย่วในชุมชนแม่วาง และตน้ทุนในการเดนิทางไปยงัแหล่งท่องเที่ยวทดแทน ส่วนมูลค่าผลประโยชน์ด้านนันทนาการของแหล่งทอ่งเทีย่วในชมุชนแมว่างในปี 2558 มมีลูคา่เทา่กบั 181,194,840 บาท ในกรณี สมมติใหค้ณุภาพแหล่งทอ่งเทีย่วเสือ่มโทรมลง จะมผีลท าใหอ้ปุสงคน์นัทนาการส าหรบัแหล่งท่องเที่ยวแม่วางลดลง โดยนักท่องเที่ยวได้รบัส่วนเกนิผู้บรโิภคเฉลี่ยต่อครัง้ลดลง รอ้ยละ 31.37 และมูลค่าประโยชน์ด้านนันทนาการของแหล่งท่องเทีย่วลดลงรอ้ยละ 69.05 ผลการศกึษาทีไ่ดเ้ป็นประโยชน์ต่อหน่วยงานทีเ่กีย่วขอ้งในการน าไปเป็นขอ้มลูส าหรบัก าหนดแนวทางการพฒันาแหล่งท่องเที่ยว โดยเน้นการรกัษาคุณภาพของแหล่งท่องเทีย่วไม่ใหเ้สื่อมโทรม มมีาตรการควบคุมดูแลการใชท้รพัยากรท่องเที่ยว วางแผนจดัการสิง่อ านวยความสะดวกเพื่อรองรบันักท่องเที่ยวในแต่ละช่วงเวลาให้ไดร้บัความพงึพอใจสงูสุดเพื่อสรา้งทศันคตทิีด่จีากนักท่องเทีย่ว และรูส้กึคุม้ค่าในการเดนิทาง ค าส าคัญ: ต้นทุนการเดินทางส่วนบุคคล มูลค่าประโยชน์ด้านนันทนาการ
อ าเภอแมว่าง This research aims to determine factors that affect the visitors’ decision to travel to the natural tourism sites in Mae Wang District, Chiang Mai Province and to evaluate the change of recreational benefit value of the natural tourism sites in Mae Wang District, Chiang Mai Province,
Thailand based on scenario of the decline in quality of tourism sites. In this study, we collected information from 400 Thai visitors who were single purpose visitors by using questionnaires and analyzed the collected information with the Individual Travel Cost Method (ITCM). Our study indicated that average incomes, attitude, experience, travel cost to tourism sites in Mae Wang District, and travel cost to alternative tourism sites are significant factors that influence the visitors’ decision to visit tourism sites in Mae Wang District. We also found that in the scenarios of the decline in quality of tourism sites, recreational demand of visitors is expected to decrease corresponding with 31.37% decrease in consumer surplus per visit. Recreational values of tourism sites are also expected to decrease by 69.05% from the estimated value of 181,194,840 THB in the year 2015. In conclusion, the results of this study provide necessary information for relevant
Abstract Abstract
J O U R N A L O F E C O N O M I C S 2 1 / 1
201
7,
JA
N.—
JU
N.
33
FACULTY OF ECONOMICS –- CMU
~ 33 ~
organizations to impose measures to develop tourism sites and protect them against the decline in quality. The measures must include tourism resource consumption control and visitor facility management in order to achieve maximum satisfaction from visitors and create positive attitude of visitors that destination they visit are worth visiting. Keywords: Individual Travel Cost Method (ITCM), Recreational benefit values, Mae
Wang District
The abundant tourism resources and the diversity of cultures are the important factors that make Thailand famous for its tourism throughout the world. Chiang Mai is an important tourism province in Thailand that hosts numerous visitors each year. In 2015, 8,665,502
persons visitors came to Chiang Mai, an 18.18% increase from 2014 (Department of Tourism, 2016), generating 2,570 million baht in income, up by 11.95% from 2014 (National Statistical Office, 2016). Chiang Mai has an important features include good climate, beautiful landscapes, and outstanding tourism resources, such as natural attractions, history, culture, a unique cultural identity, availability of tourist facilities, and accommodation are keys to success of Chiang Mai as the tourism hub in northern Thailand. Moreover, Chiang Mai has the highest number of natural tourism sites in the northern provinces of Thailand, holding a total of 24.11% of the total natural tourism sites in the northern provinces (Department of Tourism, 2014). One of those charming places with famous and popular natural tourism sites in Chiang Mai is Mae Wang District or Mae Wang River Basin, which are situated not far from Chiang Mai’s city center, are among the most famous and popular natural attractions in Chiang Mai Province. 81% the tourism sites are located in Mae Win sub-district (Chuchart, 2001b). Access to the tourism sites by main routes is convenient and inexpensive. Visitors can have a 1-day trip from the city center to the tourism sites. Main features of the tourism sites in Mae Wang District are their natural and cultural values. The landscape is mostly mountainous and 78.94% the local population is hill tribes, ethnic minorities who live on mountains
1 Introduction
JOURNAL OF ECONOMICS CHIANG MAI UNIVERSITY – 21/1
~ 32 ~
เชยีงใหม ่ไดแ้ก ่รายไดเ้ฉลีย่ของนกัทอ่งเทีย่ว ทศันคตขิองนกัท่องเทีย่ว ประสบการณ์ ตน้ทุนในการเดนิทางไปยงัแหล่งท่องเทีย่วในชุมชนแม่วาง และตน้ทุนในการเดนิทางไปยงัแหล่งท่องเที่ยวทดแทน ส่วนมูลค่าผลประโยชน์ด้านนันทนาการของแหล่งทอ่งเทีย่วในชมุชนแมว่างในปี 2558 มมีลูคา่เทา่กบั 181,194,840 บาท ในกรณี สมมติใหค้ณุภาพแหล่งทอ่งเทีย่วเสือ่มโทรมลง จะมผีลท าใหอ้ปุสงคน์นัทนาการส าหรบัแหล่งท่องเที่ยวแม่วางลดลง โดยนักท่องเที่ยวได้รบัส่วนเกนิผู้บรโิภคเฉลี่ยต่อครัง้ลดลง รอ้ยละ 31.37 และมูลค่าประโยชน์ด้านนันทนาการของแหล่งท่องเทีย่วลดลงรอ้ยละ 69.05 ผลการศกึษาทีไ่ดเ้ป็นประโยชน์ต่อหน่วยงานทีเ่กีย่วขอ้งในการน าไปเป็นขอ้มลูส าหรบัก าหนดแนวทางการพฒันาแหล่งท่องเที่ยว โดยเน้นการรกัษาคุณภาพของแหล่งท่องเทีย่วไม่ใหเ้สื่อมโทรม มมีาตรการควบคุมดูแลการใชท้รพัยากรท่องเที่ยว วางแผนจดัการสิง่อ านวยความสะดวกเพื่อรองรบันักท่องเที่ยวในแต่ละช่วงเวลาให้ไดร้บัความพงึพอใจสงูสุดเพื่อสรา้งทศันคตทิีด่จีากนักท่องเทีย่ว และรูส้กึคุม้ค่าในการเดนิทาง ค าส าคัญ: ต้นทุนการเดินทางส่วนบุคคล มูลค่าประโยชน์ด้านนันทนาการ
อ าเภอแมว่าง This research aims to determine factors that affect the visitors’ decision to travel to the natural tourism sites in Mae Wang District, Chiang Mai Province and to evaluate the change of recreational benefit value of the natural tourism sites in Mae Wang District, Chiang Mai Province,
Thailand based on scenario of the decline in quality of tourism sites. In this study, we collected information from 400 Thai visitors who were single purpose visitors by using questionnaires and analyzed the collected information with the Individual Travel Cost Method (ITCM). Our study indicated that average incomes, attitude, experience, travel cost to tourism sites in Mae Wang District, and travel cost to alternative tourism sites are significant factors that influence the visitors’ decision to visit tourism sites in Mae Wang District. We also found that in the scenarios of the decline in quality of tourism sites, recreational demand of visitors is expected to decrease corresponding with 31.37% decrease in consumer surplus per visit. Recreational values of tourism sites are also expected to decrease by 69.05% from the estimated value of 181,194,840 THB in the year 2015. In conclusion, the results of this study provide necessary information for relevant
Abstract Abstract

F A C U L T Y O F E C O N O M I C S C M U .21
/1
34
FACULTY OF ECONOMICS –- CMU
~ 35 ~
As we recognized the importance of maximizing values from limited resources to satisfy visitors and create additional economic values to the communities, we investigated affect the visitors’ decision to travel to the natural tourism sites in Mae Wang District, Chiang Mai Province by using the Individual Travel Cost Method (ITCM) to create individual recreational demand models of visitors. The results of this study can be used as guidelines to design a tourism development plan that is consistent with the demands of visitors. We also studied recreational benefit values of tourism sites in Mae Wang District in the present and in the case of the decline in quality. We suggested that if there are no measures to improve quality of services and tourism resources that are worth spending in the eyes of visitors. The decrease in recreational benefit values will result in the loss of economic value of tourism in the communities.
1. To determine factors that affect the visitors’ decision to travel to the natural tourism sites in Mae Wang District, Chiang Mai Province, Thailand for recreational purposes. 2. To evaluate the change of recreational benefit value
of the natural tourism sites based on scenarios of the decline in quality of tourism sites in Mae Wang District, Chiang Mai Province, Thailand.
Recreational Demand Model. A recreational demand model is the relationship between numbers of visits and other related factors by considering travel cost as product price. The model is commonly used to estimate recreational values of environmental and natural resources (Kaosa-ard et al., 2013). In addition, Rattanataweesophon and Phetcharanon (2006)
have further explained that the theoretical background of using the Travel Cost Method (TCM) to create a recreational demand model is based on the concept of an individual utility function. A utility function is the function of the duration that visitors spent at recreation sites, the quality of recreational sites and number of visits to the recreational sites. Each individual visitor will seek to maximize their utility of recreational sites under
2 Objective
3 Theoretical
backgrounds
JOURNAL OF ECONOMICS CHIANG MAI UNIVERSITY – 21/1
~ 34 ~
(Mae Win Sub-district Administration Organization, 2014). Although there are a variety of ethnic groups, the local population lives together in harmony. These hill tribes have been able to preserve and maintain their tradition, culture, and unique livelihood. In addition, Mae Wang District is also known as a site of watershed forests, a location of the Royal Development Project and a wild Himalayan cherry blooming festival. The charm of tourism sites in Mae Wang District comes from large varieties of recreational activities, such as elephant riding, bamboo rafting, trekking, hiking, visiting hill tribes’ village, and staying at certified homestays in those villages. Songkran Srijan, the chief administrator of Mae Win Sub-district Administration Organization and the representative of public organizations in the area, said in an interview that tourism sites in Mae Win sub-district have abundant tourism resources, high potential of development. Moreover, members of the local communities also help protect and cherish their natural resources because tourism can create jobs and provide largest source of incomes to the communities. According to theories regarding tourism industry, a tourism site is the primary product of tourism and the destination of visitors. Therefore, a tourism site is the key contributor to the success of tourism, and it should be ready to provide services and recreational values in order to gain satisfaction from visitors. This theory is consistent with the consumer behavior concept that if visitors feel that it is worth spending or they expect to receive higher recreational values from tourism sites than what they pay for, they would be willing to pay and revisit in the future. Considering the current situation of tourism sites in Mae Wang District that although there are abundant tourism resources to attract visitors to visit throughout the year, recreational activities of visitors themselves began to affect quality of natural resources. Moreover, several tourism sites in Mae Wang District still lack readiness in tourist facilities, such as lack of clear signposts and connecting routes to tourism sites, congestion of visitors and garbage problems during festivals, inadequate supply of clean public toilets. If there is no improvement in the quality of services and the declining quality of tourism sites, these issues will inevitably affect satisfaction and decision of visitors to visit Mae Wang District in the future.

J O U R N A L O F E C O N O M I C S 2 1 / 1
201
7,
JA
N.—
JU
N.
35
FACULTY OF ECONOMICS –- CMU
~ 35 ~
As we recognized the importance of maximizing values from limited resources to satisfy visitors and create additional economic values to the communities, we investigated affect the visitors’ decision to travel to the natural tourism sites in Mae Wang District, Chiang Mai Province by using the Individual Travel Cost Method (ITCM) to create individual recreational demand models of visitors. The results of this study can be used as guidelines to design a tourism development plan that is consistent with the demands of visitors. We also studied recreational benefit values of tourism sites in Mae Wang District in the present and in the case of the decline in quality. We suggested that if there are no measures to improve quality of services and tourism resources that are worth spending in the eyes of visitors. The decrease in recreational benefit values will result in the loss of economic value of tourism in the communities.
1. To determine factors that affect the visitors’ decision to travel to the natural tourism sites in Mae Wang District, Chiang Mai Province, Thailand for recreational purposes. 2. To evaluate the change of recreational benefit value
of the natural tourism sites based on scenarios of the decline in quality of tourism sites in Mae Wang District, Chiang Mai Province, Thailand.
Recreational Demand Model. A recreational demand model is the relationship between numbers of visits and other related factors by considering travel cost as product price. The model is commonly used to estimate recreational values of environmental and natural resources (Kaosa-ard et al., 2013). In addition, Rattanataweesophon and Phetcharanon (2006)
have further explained that the theoretical background of using the Travel Cost Method (TCM) to create a recreational demand model is based on the concept of an individual utility function. A utility function is the function of the duration that visitors spent at recreation sites, the quality of recreational sites and number of visits to the recreational sites. Each individual visitor will seek to maximize their utility of recreational sites under
2 Objective
3 Theoretical
backgrounds
JOURNAL OF ECONOMICS CHIANG MAI UNIVERSITY – 21/1
~ 34 ~
(Mae Win Sub-district Administration Organization, 2014). Although there are a variety of ethnic groups, the local population lives together in harmony. These hill tribes have been able to preserve and maintain their tradition, culture, and unique livelihood. In addition, Mae Wang District is also known as a site of watershed forests, a location of the Royal Development Project and a wild Himalayan cherry blooming festival. The charm of tourism sites in Mae Wang District comes from large varieties of recreational activities, such as elephant riding, bamboo rafting, trekking, hiking, visiting hill tribes’ village, and staying at certified homestays in those villages. Songkran Srijan, the chief administrator of Mae Win Sub-district Administration Organization and the representative of public organizations in the area, said in an interview that tourism sites in Mae Win sub-district have abundant tourism resources, high potential of development. Moreover, members of the local communities also help protect and cherish their natural resources because tourism can create jobs and provide largest source of incomes to the communities. According to theories regarding tourism industry, a tourism site is the primary product of tourism and the destination of visitors. Therefore, a tourism site is the key contributor to the success of tourism, and it should be ready to provide services and recreational values in order to gain satisfaction from visitors. This theory is consistent with the consumer behavior concept that if visitors feel that it is worth spending or they expect to receive higher recreational values from tourism sites than what they pay for, they would be willing to pay and revisit in the future. Considering the current situation of tourism sites in Mae Wang District that although there are abundant tourism resources to attract visitors to visit throughout the year, recreational activities of visitors themselves began to affect quality of natural resources. Moreover, several tourism sites in Mae Wang District still lack readiness in tourist facilities, such as lack of clear signposts and connecting routes to tourism sites, congestion of visitors and garbage problems during festivals, inadequate supply of clean public toilets. If there is no improvement in the quality of services and the declining quality of tourism sites, these issues will inevitably affect satisfaction and decision of visitors to visit Mae Wang District in the future.
F A C U L T Y O F E C O N O M I C S C M U .21
/1
36
FACULTY OF ECONOMICS –- CMU
~ 37 ~
individual level, reflects traveling demand at the individual level, and reveal traveling behavior of individuals clearer than ZTCM. The statement is consistent with Pornpinetpong (2005), who said that ZTCM approach might be statistically inappropriate in dividing a large number of visitors to be in different zones and the assumption that visitors in zone have different tastes seems to be unrealistic. Moreover, application of ZTCM may encounter a problem regarding data collection when there are too few representatives of visitors from some zones. The collected data will not be sufficient for the analysis with ZTCM. A study that is a good example of this problem is the study of Masamae (2011) entitled Economic Valuation of Recreational Benefits of Sai Khao Waterfall, Sai Khao Sub-district, Kok Po District, Pattani.
Therefore, in this study, we decided to use ITCM as the method to evaluate behavior, preference and demand of visitors instead of ZTCM since the assumption of ZTCM that visitors from different geography or zone must have the same preference does not represent the reality. Moreover, using ZTCM is impractical because the sample size of visitors from different geography or zone who visit tourism sites in Mae Wang District is too small.
Population and sample - The research population includes all Thai visitors who visit tourism sites in Mae Wang District, Chiang Mai Province. In this study, we focused on recreational use values of the tourism sites for single purpose visitors. A single purpose visitor is a visitor who intends to visit only tourism sites in Mae Wang District both one day trip and
overnight. This single purpose visitors were screened by a question in the questionnaire. Since the population of all visitors to the community comprised approximately 108,000 people per year (Mae Win Sub-district Administration Organization, 2014), the sample of this study were 400 visitors. The questionnaires were separately circulated to each tourism site to collect data on both working days and holidays from April 2015 to December 2015. Questionnaire - The questionnaire that was used for collecting data contained items of questions that cover all issues in the research objectives. We performed a validity test by requiring that each question has to have the Index of Concurrence (IOC)
4 Research
Methodology
JOURNAL OF ECONOMICS CHIANG MAI UNIVERSITY – 21/1
~ 36 ~
constraints of budget and time. Therefore, to create a recreational demand curve based on a recreational demand model, we have to take into accounts 1) Product price, a combination of travel cost and opportunity cost and 2) Number of visits (Silapararachawong, 2013). Recreational values of a recreation sites can be calculated from the area under curve of a recreational demand curve. Moreover, consumer surplus which is an economic measure of consumer benefit that gains from recreational sites can be calculated from the area under the recreational demand curve subtracted by travel cost (Na Bangchang and Srisaowaluck, 2009). In conclusion, the quality of recreational sites is the major component of attractive power; therefore, change in the quality of recreational sites can increase or decrease the level of a recreational demand curve. The difference in recreational values between two scenarios can be calculated from the area between the new and the original recreational demand curves (Pornpinatepong, 2005).
Travel Cost Method (TCM). In order to evaluate economic values of certain resources, we have to consider types of use values contained in those resources and then apply the most suitable valuation method to each specific type of use values. TCM is the method commonly used to estimate direct use values of natural and environmental resources or to estimate recreational values of tourism sites. There are several works in literature, from Thailand and abroad, that use TCM as the method to evaluate recreational values of tourism sites (Himayatullah, 2003; Chaiprasit and Maneenet, 2010; Na - Bangchang et al., 2010; Thamapitak and Anthong, 2011 and Boonwong, 2013).
There are two types of TCM: 1) Zonal Travel Cost Method (ZTCM), a traditional method, classifies visitors into categories according to distance from their origins to tourism sites or geography. In this method, an overall recreational demand model of visitors is produced from behaviors of visitors from each geography or zone and 2) Individual Travel Cost Method (ITCM) is the modern method that collects information of individual visitors and then creates a recreational demand curve for each visitor. This method generally applies to visitors who visit a tourism site in study more than one time within the duration of study.
Petcharanon (2000) stated that ITCM uses higher variation data, while ZTCM uses all data that belong to each zone. Therefore, ITCM, which represents data at the

J O U R N A L O F E C O N O M I C S 2 1 / 1
201
7,
JA
N.—
JU
N.
37
FACULTY OF ECONOMICS –- CMU
~ 37 ~
individual level, reflects traveling demand at the individual level, and reveal traveling behavior of individuals clearer than ZTCM. The statement is consistent with Pornpinetpong (2005), who said that ZTCM approach might be statistically inappropriate in dividing a large number of visitors to be in different zones and the assumption that visitors in zone have different tastes seems to be unrealistic. Moreover, application of ZTCM may encounter a problem regarding data collection when there are too few representatives of visitors from some zones. The collected data will not be sufficient for the analysis with ZTCM. A study that is a good example of this problem is the study of Masamae (2011) entitled Economic Valuation of Recreational Benefits of Sai Khao Waterfall, Sai Khao Sub-district, Kok Po District, Pattani.
Therefore, in this study, we decided to use ITCM as the method to evaluate behavior, preference and demand of visitors instead of ZTCM since the assumption of ZTCM that visitors from different geography or zone must have the same preference does not represent the reality. Moreover, using ZTCM is impractical because the sample size of visitors from different geography or zone who visit tourism sites in Mae Wang District is too small.
Population and sample - The research population includes all Thai visitors who visit tourism sites in Mae Wang District, Chiang Mai Province. In this study, we focused on recreational use values of the tourism sites for single purpose visitors. A single purpose visitor is a visitor who intends to visit only tourism sites in Mae Wang District both one day trip and
overnight. This single purpose visitors were screened by a question in the questionnaire. Since the population of all visitors to the community comprised approximately 108,000 people per year (Mae Win Sub-district Administration Organization, 2014), the sample of this study were 400 visitors. The questionnaires were separately circulated to each tourism site to collect data on both working days and holidays from April 2015 to December 2015. Questionnaire - The questionnaire that was used for collecting data contained items of questions that cover all issues in the research objectives. We performed a validity test by requiring that each question has to have the Index of Concurrence (IOC)
4 Research
Methodology
JOURNAL OF ECONOMICS CHIANG MAI UNIVERSITY – 21/1
~ 36 ~
constraints of budget and time. Therefore, to create a recreational demand curve based on a recreational demand model, we have to take into accounts 1) Product price, a combination of travel cost and opportunity cost and 2) Number of visits (Silapararachawong, 2013). Recreational values of a recreation sites can be calculated from the area under curve of a recreational demand curve. Moreover, consumer surplus which is an economic measure of consumer benefit that gains from recreational sites can be calculated from the area under the recreational demand curve subtracted by travel cost (Na Bangchang and Srisaowaluck, 2009). In conclusion, the quality of recreational sites is the major component of attractive power; therefore, change in the quality of recreational sites can increase or decrease the level of a recreational demand curve. The difference in recreational values between two scenarios can be calculated from the area between the new and the original recreational demand curves (Pornpinatepong, 2005).
Travel Cost Method (TCM). In order to evaluate economic values of certain resources, we have to consider types of use values contained in those resources and then apply the most suitable valuation method to each specific type of use values. TCM is the method commonly used to estimate direct use values of natural and environmental resources or to estimate recreational values of tourism sites. There are several works in literature, from Thailand and abroad, that use TCM as the method to evaluate recreational values of tourism sites (Himayatullah, 2003; Chaiprasit and Maneenet, 2010; Na - Bangchang et al., 2010; Thamapitak and Anthong, 2011 and Boonwong, 2013).
There are two types of TCM: 1) Zonal Travel Cost Method (ZTCM), a traditional method, classifies visitors into categories according to distance from their origins to tourism sites or geography. In this method, an overall recreational demand model of visitors is produced from behaviors of visitors from each geography or zone and 2) Individual Travel Cost Method (ITCM) is the modern method that collects information of individual visitors and then creates a recreational demand curve for each visitor. This method generally applies to visitors who visit a tourism site in study more than one time within the duration of study.
Petcharanon (2000) stated that ITCM uses higher variation data, while ZTCM uses all data that belong to each zone. Therefore, ITCM, which represents data at the

F A C U L T Y O F E C O N O M I C S C M U .21
/1
38
FACULTY OF ECONOMICS –- CMU
~ 39 ~
at about 66.79% following by 16.77% on service charge for activities such as elephant riding, bamboo rafting 8.48% on souvenir or gift, 4.72% for accommodation and 3.24% on others expenses such as elephant food, money tip. Table 1 Study variables
Variable Definition Dependent Variable
V1i the number of visits within the duration of 12 months in the present time.
V2i the number of visits within the duration of 12 months in case of the quality of tourism sites have assumed to be deteriorated.
Independent Variable TCi Travel cost to the tourism sites in Mae Wang District (Baht/Visit) TSi Travel cost to an alternative tourism sites (Baht/Visit) Geni Gender (0 = Male, 1 = Female) Agei Age (years) Cri Career (0 = Government officer, 1 = Other careers ) Stti Marital Status (0 = Married, divorced, widow, 1 = Single) Inci Average income of tourist (Baht/Month) Exi Experience of traveling to natural tourism sites (number of visit/ year ) Edui The highest years of education (6 = Primary School, 9 = Junior High
School, 12= Senior High School/ Vocational Certificate, 14 = Diploma/ High Vocational Certificate, 16 = Graduate, 18 = Higher than graduate)
Atti Visitor attitudes 0 = Quality and services of the tourism site are at a poor level 1 = Quality and services of the tourism site are at a good level
β0, β1, β2,… β10 are parameters i is each individual visitor i, where i = 1, 2, 3…n
JOURNAL OF ECONOMICS CHIANG MAI UNIVERSITY – 21/1
~ 38 ~
more than 0.50 (Petchrote & Chamniprasart, 2002), and performed a reliability test with the Cronbach’s coefficient of 0.968.
Analysis of factors that affecting the decision of visitors in traveling to natural tourism sites in Mae Wang District, Chiang Mai Province - Since, there are several studies in literature that use multiple linear regression method to evaluate recreational values of tourism sites (Wunsiri et al., 1999; Himayatullah, 2003; Rattanaphan, 2005; Boonwong, 2013; Rattanataweesopon & Petcharanon, 2006; Preechachon, 2013; Na-Bangchang et al., 2010 and Nakaworaphan, 2016). Thus, in this study we used ITCM with the single site model to find the relationship between independent and dependent variables in order to create recreational demand models of individual visitors both in the present (V1) and in the case of the decline in quality of tourism sites (V2) by using multiple linear regression analysis and the model may be specified as follows;
V1i = β0 + β1TCi+ β2TSi + β3Geni + β4Agei+ β5Cri+ β6Atti (1)
+β7Edui+β8Inci+β9Atti+β10Exi+ei
V2i = β0 + β1TCi+ β2TSi + β3Geni + β4Agei+ β5Cri+ β6Atti (2) +β7Edui+β8Inci+β9Atti+β10Exi+ei
Travel cost to tourism sites in Mae Wang District, Chiang Mai Province and travel cost to an alternative tourism sites, according to ITCM, is the summation of explicit cost and opportunity cost of time that visitors spent for travel and recreational activities. We found that the average travel cost of each visitor is 1,147.41 THB per visit. The average travel cost composes of the explicit cost of 901.01 THB per visit and the opportunity cost of 246.40 THB per visit. The opportunity cost is equivalent to 0.33 or 1/3 of hourly wage multiplied by time that visitors spent for travel and recreational activities based on the conditions that working days are 20 days a month and 8 hours a day Cesairo (1976) as referenced by Preechachon (2013). The structure of average spending of each visitor during the time they visit tourism sites in Mae Wang District is shown in the Figure 1. It is indicated that visitors spend most budget on food and drink

J O U R N A L O F E C O N O M I C S 2 1 / 1
201
7,
JA
N.—
JU
N.
39
FACULTY OF ECONOMICS –- CMU
~ 39 ~
at about 66.79% following by 16.77% on service charge for activities such as elephant riding, bamboo rafting 8.48% on souvenir or gift, 4.72% for accommodation and 3.24% on others expenses such as elephant food, money tip. Table 1 Study variables
Variable Definition Dependent Variable
V1i the number of visits within the duration of 12 months in the present time.
V2i the number of visits within the duration of 12 months in case of the quality of tourism sites have assumed to be deteriorated.
Independent Variable TCi Travel cost to the tourism sites in Mae Wang District (Baht/Visit) TSi Travel cost to an alternative tourism sites (Baht/Visit) Geni Gender (0 = Male, 1 = Female) Agei Age (years) Cri Career (0 = Government officer, 1 = Other careers ) Stti Marital Status (0 = Married, divorced, widow, 1 = Single) Inci Average income of tourist (Baht/Month) Exi Experience of traveling to natural tourism sites (number of visit/ year ) Edui The highest years of education (6 = Primary School, 9 = Junior High
School, 12= Senior High School/ Vocational Certificate, 14 = Diploma/ High Vocational Certificate, 16 = Graduate, 18 = Higher than graduate)
Atti Visitor attitudes 0 = Quality and services of the tourism site are at a poor level 1 = Quality and services of the tourism site are at a good level
β0, β1, β2,… β10 are parameters i is each individual visitor i, where i = 1, 2, 3…n
JOURNAL OF ECONOMICS CHIANG MAI UNIVERSITY – 21/1
~ 38 ~
more than 0.50 (Petchrote & Chamniprasart, 2002), and performed a reliability test with the Cronbach’s coefficient of 0.968.
Analysis of factors that affecting the decision of visitors in traveling to natural tourism sites in Mae Wang District, Chiang Mai Province - Since, there are several studies in literature that use multiple linear regression method to evaluate recreational values of tourism sites (Wunsiri et al., 1999; Himayatullah, 2003; Rattanaphan, 2005; Boonwong, 2013; Rattanataweesopon & Petcharanon, 2006; Preechachon, 2013; Na-Bangchang et al., 2010 and Nakaworaphan, 2016). Thus, in this study we used ITCM with the single site model to find the relationship between independent and dependent variables in order to create recreational demand models of individual visitors both in the present (V1) and in the case of the decline in quality of tourism sites (V2) by using multiple linear regression analysis and the model may be specified as follows;
V1i = β0 + β1TCi+ β2TSi + β3Geni + β4Agei+ β5Cri+ β6Atti (1)
+β7Edui+β8Inci+β9Atti+β10Exi+ei
V2i = β0 + β1TCi+ β2TSi + β3Geni + β4Agei+ β5Cri+ β6Atti (2) +β7Edui+β8Inci+β9Atti+β10Exi+ei
Travel cost to tourism sites in Mae Wang District, Chiang Mai Province and travel cost to an alternative tourism sites, according to ITCM, is the summation of explicit cost and opportunity cost of time that visitors spent for travel and recreational activities. We found that the average travel cost of each visitor is 1,147.41 THB per visit. The average travel cost composes of the explicit cost of 901.01 THB per visit and the opportunity cost of 246.40 THB per visit. The opportunity cost is equivalent to 0.33 or 1/3 of hourly wage multiplied by time that visitors spent for travel and recreational activities based on the conditions that working days are 20 days a month and 8 hours a day Cesairo (1976) as referenced by Preechachon (2013). The structure of average spending of each visitor during the time they visit tourism sites in Mae Wang District is shown in the Figure 1. It is indicated that visitors spend most budget on food and drink

F A C U L T Y O F E C O N O M I C S C M U .21
/1
40
FACULTY OF ECONOMICS –- CMU
~ 41 ~
From the obtained survey data of 400 samples of Thai visitors, the descriptive statistics of each independent variables used in the analysis are presented in Table 2 as follow.
Table 2 Descriptive statistics of each variable used in the analysis Independent variable Descriptive statistics
Gender (Gen) Most of the visitors are male (50.75%). Age (Age) Maximum = 70, Minimum = 16, X̅ = 30.25, S.D. = 9.70 Career (Cr) Most visitors do not work for government (83.50%). Marital status (Stt) Most visitors are single (55.00%)
Education (Edu) Most visitors have a bachelor degree (45.50%), X̅ =13.69, S.D.= 3.20
Average income (Inc) Maximum = 55,000, Minimum = 3,000, X̅ = 11,739.80, S.D.= 6,617.22
Attitudes (Att) Most visitors have good attitude on the quality (84.25%) Experience (Ex) Maximum = 40, Minimum = 1, X̅ = 8.72, S.D. = 4.58 Travel cost to the tourism sites (TC)
Maximum = 4,704.53, Minimum = 214.36, X̅ = 1,147.41, S.D.= 635.20
Travel cost to an alternative tourism sites (TS)
Maximum = 3,366.25, Minimum = 283, X̅= 1,049.89, S.D = 392.51
Factors that affect the visitors’ decision to travel to the natural tourism sites in Mae Wang District, Chiang Mai Province, Thailand for recreational purposes. Silaprachawong (2013) stated that the choosing in trip generating functions (TGF) is a key issue because the theory does not specify the appropriate format and the study of Hanley in 1989 found that the value of consumer surplus in the various function have a completely different value. Thus, in selecting any trip generating functions, it should be compared with the coefficient of determination (R2), but if the dependent variable is different, the F statistic should be used for comparison. In either
5 Results
JOURNAL OF ECONOMICS CHIANG MAI UNIVERSITY – 21/1
~ 40 ~
Figure 1 The structure of average spending of each visitor during the time they visit
tourism sites in Mae Wang District Valuation of Recreational Benefits of Natural Tourism Sites. The individual consumer surplus (CSi) of each visitor can be interpreted as the recreational values of tourism sites. CSi can be estimated from an area under a recreational demand curve by performing integration from the average travel cost (TCA) to the maximum cost or Choke Price (TCMAX) at the 99th percentile of travel cost (Na - Bangchang et al., 2010) as shown in the equation (3). The average consumer surplus (ACS) can be calculated from the equation (4) and the recreational values of tourism sites or the consumer surplus of visitors in the study year can be calculated from the equation (5).
CSi = ∫ (V)dTCTCMAX TCA (3)
Where ACS = CSi
V̅ (4)
And CS = ACS x N (5)
Where V̅ is the average number of visits and N is the population of visitors who visit the tourism sites during the time of study.
Food and drink ,66.79
Accommodation, 4.72
Service charge for activities, 16.77
Souvenir or gift, 8.48 Others expenses , 3.24
Unit: Percent

J O U R N A L O F E C O N O M I C S 2 1 / 1
201
7,
JA
N.—
JU
N.
41
FACULTY OF ECONOMICS –- CMU
~ 41 ~
From the obtained survey data of 400 samples of Thai visitors, the descriptive statistics of each independent variables used in the analysis are presented in Table 2 as follow.
Table 2 Descriptive statistics of each variable used in the analysis Independent variable Descriptive statistics
Gender (Gen) Most of the visitors are male (50.75%). Age (Age) Maximum = 70, Minimum = 16, X̅ = 30.25, S.D. = 9.70 Career (Cr) Most visitors do not work for government (83.50%). Marital status (Stt) Most visitors are single (55.00%)
Education (Edu) Most visitors have a bachelor degree (45.50%), X̅ =13.69, S.D.= 3.20
Average income (Inc) Maximum = 55,000, Minimum = 3,000, X̅ = 11,739.80, S.D.= 6,617.22
Attitudes (Att) Most visitors have good attitude on the quality (84.25%) Experience (Ex) Maximum = 40, Minimum = 1, X̅ = 8.72, S.D. = 4.58 Travel cost to the tourism sites (TC)
Maximum = 4,704.53, Minimum = 214.36, X̅ = 1,147.41, S.D.= 635.20
Travel cost to an alternative tourism sites (TS)
Maximum = 3,366.25, Minimum = 283, X̅= 1,049.89, S.D = 392.51
Factors that affect the visitors’ decision to travel to the natural tourism sites in Mae Wang District, Chiang Mai Province, Thailand for recreational purposes. Silaprachawong (2013) stated that the choosing in trip generating functions (TGF) is a key issue because the theory does not specify the appropriate format and the study of Hanley in 1989 found that the value of consumer surplus in the various function have a completely different value. Thus, in selecting any trip generating functions, it should be compared with the coefficient of determination (R2), but if the dependent variable is different, the F statistic should be used for comparison. In either
5 Results
JOURNAL OF ECONOMICS CHIANG MAI UNIVERSITY – 21/1
~ 40 ~
Figure 1 The structure of average spending of each visitor during the time they visit
tourism sites in Mae Wang District Valuation of Recreational Benefits of Natural Tourism Sites. The individual consumer surplus (CSi) of each visitor can be interpreted as the recreational values of tourism sites. CSi can be estimated from an area under a recreational demand curve by performing integration from the average travel cost (TCA) to the maximum cost or Choke Price (TCMAX) at the 99th percentile of travel cost (Na - Bangchang et al., 2010) as shown in the equation (3). The average consumer surplus (ACS) can be calculated from the equation (4) and the recreational values of tourism sites or the consumer surplus of visitors in the study year can be calculated from the equation (5).
CSi = ∫ (V)dTCTCMAX TCA (3)
Where ACS = CSi
V̅ (4)
And CS = ACS x N (5)
Where V̅ is the average number of visits and N is the population of visitors who visit the tourism sites during the time of study.
Food and drink ,66.79
Accommodation, 4.72
Service charge for activities, 16.77
Souvenir or gift, 8.48 Others expenses , 3.24
Unit: Percent

F A C U L T Y O F E C O N O M I C S C M U .21
/1
42
FACULTY OF ECONOMICS –- CMU
~ 43 ~
The obtained results in table 3 indicated that average income (Inc) is the parameter that influences visitors’ decision in traveling to tourism sites in Mae Wang District with a statistical significance of 95%, while attitude (Att), experience (Ex), travel cost to tourism site in Mae Wang District (TC), and travel cost to alternative tourism sites (TS) are parameters that influence visitors’ decision in traveling to tourism sites in Mae Wang District with a statistical significance of 99% . We also found that the average income of visitors and travel cost have a negative relation, while other parameters have a positive relation. A recreational demand equation of an individual visitor that represents relations between parameters can be expressed as follows; ln V1 = 0.7119*** - 0.0928 ln (Inc)** + 0.2889 Att*** + 0.705 ln (Ex)*** (6) - 0.3985 ln (TC)*** + 0.3528 ln (TS) ***
From the equation (6), When other independent variables are considered to be a constant, replace the value of attitude with 1, and replace the value of all 3 influential independent variables with their respective average values except only TCi, the relationship between number of trips that visitors visit Mae Wang tourism sites and individual travel cost of visitors will be obtained based on Vi =f(TCi), as shown in Equation (7) and (8) ln V1 = 4.112 - 0.3985 ln (TC) or (7) V1 = e 4.112- 0.3985 ln (TC), R2= 0.7966 (8) In the scenario of decline in quality of tourism sites (V2), when collecting data, the questionnaire contains images showing deteriorated conditions of tourism sites in Mae Wang under the item asking that: “If condition of the tourism sites is deteriorated (as shown in these photos, which represent problems of deteriorated resources, crowdedness, unorganized area, and garbage, etc.). How many trips do you think you will visit here within one year?” Therefore, the factors affecting decision of visitors in visiting Mae Wang in the case of the decline in quality of tourism sites are considered
JOURNAL OF ECONOMICS CHIANG MAI UNIVERSITY – 21/1
~ 42 ~
case, it should be select the format with the highest R2 or F value. More over Silaprachawong, (2015) stated that the TGF in the ITCM that show the relationship between the dependent variable (number of trip) and the independent variables (travel cost and socioeconomic factors) can be set in linear function or double log function but the suitable function is function which can describe the relationship between the variables best.
In this study, after we created a recreational demand model of individual visitors based on ITCM, we performed analysis the relationship between variables in 4 model patterns that were linear, log-linear, linear-log and double log equations in order to identify the most suitable demand function. We found that double log is the most suitable equation for our data because it has the highest R-squared with the F-value in the confident interval of 99%. Therefore, the factors affecting decision of visitors in visiting Mae Wang in the case of current condition of the tourism sites are considered from the independent variables that have statistically significant relationship with the dependent variable at the confidence level of 95% or higher, as shown in Table 3. Table 3 The analyzing on factors affecting visitors’ decision in traveling to natural
tourism sites in Mae Wang District in the case of the current condition
Variable coefficient t- ratio p-value Dependent Variable : number of visit (lnV1) Constant 0.7119** 2.1080 0.0356 Independent Variable ln (Inci) - 0.0928** -2.0090 0.0453 Atti 0.2889*** 6.8840 0.0000 ln (Exi) 0.7050*** 20.8660 0.0000 ln (TCi) - 0.3985*** - 9.3180 0.0000 ln (TSi) 0.3528*** 6.4820 0.0000 F-Stat =308.57*** R-squared = 0.7966 Adjusted-R-squared = 0.7940
Remark: *, ** and *** represent statistical significances at α = 0.1, 0.05 and 0.01 respectively.

J O U R N A L O F E C O N O M I C S 2 1 / 1
201
7,
JA
N.—
JU
N.
43
FACULTY OF ECONOMICS –- CMU
~ 43 ~
The obtained results in table 3 indicated that average income (Inc) is the parameter that influences visitors’ decision in traveling to tourism sites in Mae Wang District with a statistical significance of 95%, while attitude (Att), experience (Ex), travel cost to tourism site in Mae Wang District (TC), and travel cost to alternative tourism sites (TS) are parameters that influence visitors’ decision in traveling to tourism sites in Mae Wang District with a statistical significance of 99% . We also found that the average income of visitors and travel cost have a negative relation, while other parameters have a positive relation. A recreational demand equation of an individual visitor that represents relations between parameters can be expressed as follows; ln V1 = 0.7119*** - 0.0928 ln (Inc)** + 0.2889 Att*** + 0.705 ln (Ex)*** (6) - 0.3985 ln (TC)*** + 0.3528 ln (TS) ***
From the equation (6), When other independent variables are considered to be a constant, replace the value of attitude with 1, and replace the value of all 3 influential independent variables with their respective average values except only TCi, the relationship between number of trips that visitors visit Mae Wang tourism sites and individual travel cost of visitors will be obtained based on Vi =f(TCi), as shown in Equation (7) and (8) ln V1 = 4.112 - 0.3985 ln (TC) or (7) V1 = e 4.112- 0.3985 ln (TC), R2= 0.7966 (8) In the scenario of decline in quality of tourism sites (V2), when collecting data, the questionnaire contains images showing deteriorated conditions of tourism sites in Mae Wang under the item asking that: “If condition of the tourism sites is deteriorated (as shown in these photos, which represent problems of deteriorated resources, crowdedness, unorganized area, and garbage, etc.). How many trips do you think you will visit here within one year?” Therefore, the factors affecting decision of visitors in visiting Mae Wang in the case of the decline in quality of tourism sites are considered
JOURNAL OF ECONOMICS CHIANG MAI UNIVERSITY – 21/1
~ 42 ~
case, it should be select the format with the highest R2 or F value. More over Silaprachawong, (2015) stated that the TGF in the ITCM that show the relationship between the dependent variable (number of trip) and the independent variables (travel cost and socioeconomic factors) can be set in linear function or double log function but the suitable function is function which can describe the relationship between the variables best.
In this study, after we created a recreational demand model of individual visitors based on ITCM, we performed analysis the relationship between variables in 4 model patterns that were linear, log-linear, linear-log and double log equations in order to identify the most suitable demand function. We found that double log is the most suitable equation for our data because it has the highest R-squared with the F-value in the confident interval of 99%. Therefore, the factors affecting decision of visitors in visiting Mae Wang in the case of current condition of the tourism sites are considered from the independent variables that have statistically significant relationship with the dependent variable at the confidence level of 95% or higher, as shown in Table 3. Table 3 The analyzing on factors affecting visitors’ decision in traveling to natural
tourism sites in Mae Wang District in the case of the current condition
Variable coefficient t- ratio p-value Dependent Variable : number of visit (lnV1) Constant 0.7119** 2.1080 0.0356 Independent Variable ln (Inci) - 0.0928** -2.0090 0.0453 Atti 0.2889*** 6.8840 0.0000 ln (Exi) 0.7050*** 20.8660 0.0000 ln (TCi) - 0.3985*** - 9.3180 0.0000 ln (TSi) 0.3528*** 6.4820 0.0000 F-Stat =308.57*** R-squared = 0.7966 Adjusted-R-squared = 0.7940
Remark: *, ** and *** represent statistical significances at α = 0.1, 0.05 and 0.01 respectively.
F A C U L T Y O F E C O N O M I C S C M U .21
/1
44
FACULTY OF ECONOMICS –- CMU
~ 45 ~
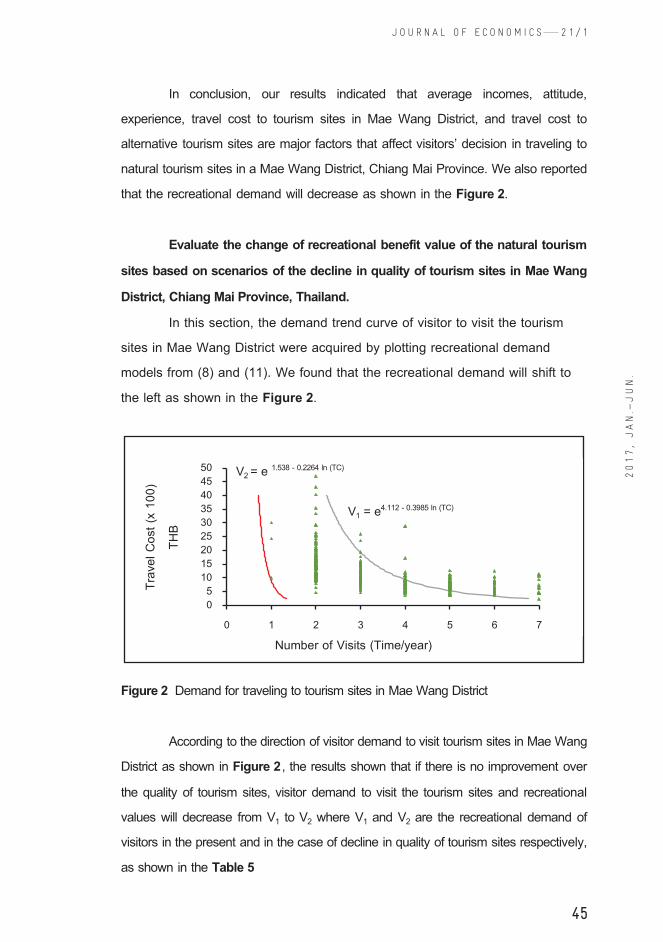
In conclusion, our results indicated that average incomes, attitude, experience, travel cost to tourism sites in Mae Wang District, and travel cost to alternative tourism sites are major factors that affect visitors’ decision in traveling to natural tourism sites in a Mae Wang District, Chiang Mai Province. We also reported that the recreational demand will decrease as shown in the Figure 2. Evaluate the change of recreational benefit value of the natural tourism sites based on scenarios of the decline in quality of tourism sites in Mae Wang District, Chiang Mai Province, Thailand.
In this section, the demand trend curve of visitor to visit the tourism sites in Mae Wang District were acquired by plotting recreational demand models from (8) and (11). We found that the recreational demand will shift to the left as shown in the Figure 2.
Figure 2 Demand for traveling to tourism sites in Mae Wang District According to the direction of visitor demand to visit tourism sites in Mae Wang District as shown in Figure 2, the results shown that if there is no improvement over the quality of tourism sites, visitor demand to visit the tourism sites and recreational values will decrease from V1 to V2 where V1 and V2 are the recreational demand of visitors in the present and in the case of decline in quality of tourism sites respectively, as shown in the Table 5
Number of Visits (Time/year)
05
101520253035404550
0 1 2 3 4 5 6 7
V1 = e4.112 - 0.3985 ln (TC)
Trave
l Cos
t (x 10
0) TH
B
V2 = e 1.538 - 0.2264 ln (TC)
JOURNAL OF ECONOMICS CHIANG MAI UNIVERSITY – 21/1
~ 44 ~
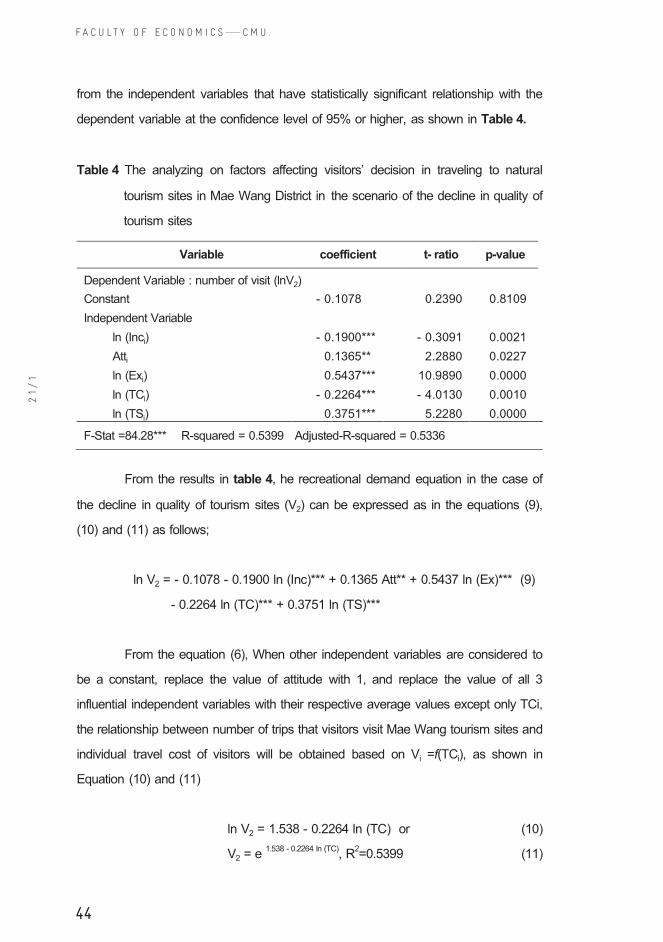
from the independent variables that have statistically significant relationship with the dependent variable at the confidence level of 95% or higher, as shown in Table 4. Table 4 The analyzing on factors affecting visitors’ decision in traveling to natural
tourism sites in Mae Wang District in the scenario of the decline in quality of tourism sites
Variable coefficient t- ratio p-value Dependent Variable : number of visit (lnV2) Constant - 0.1078 0.2390 0.8109 Independent Variable ln (Inci) - 0.1900*** - 0.3091 0.0021 Atti 0.1365** 2.2880 0.0227 ln (Exi) 0.5437*** 10.9890 0.0000 ln (TCi) - 0.2264*** - 4.0130 0.0010 ln (TSi) 0.3751*** 5.2280 0.0000 F-Stat =84.28*** R-squared = 0.5399 Adjusted-R-squared = 0.5336
From the results in table 4, he recreational demand equation in the case of the decline in quality of tourism sites (V2) can be expressed as in the equations (9), (10) and (11) as follows; ln V2 = - 0.1078 - 0.1900 ln (Inc)*** + 0.1365 Att** + 0.5437 ln (Ex)*** (9) - 0.2264 ln (TC)*** + 0.3751 ln (TS)***
From the equation (6), When other independent variables are considered to be a constant, replace the value of attitude with 1, and replace the value of all 3 influential independent variables with their respective average values except only TCi, the relationship between number of trips that visitors visit Mae Wang tourism sites and individual travel cost of visitors will be obtained based on Vi =f(TCi), as shown in Equation (10) and (11) ln V2 = 1.538 - 0.2264 ln (TC) or (10) V2 = e 1.538 - 0.2264 ln (TC), R2=0.5399 (11)
J O U R N A L O F E C O N O M I C S 2 1 / 1
201
7,
JA
N.—
JU
N.
45
FACULTY OF ECONOMICS –- CMU
~ 45 ~
In conclusion, our results indicated that average incomes, attitude, experience, travel cost to tourism sites in Mae Wang District, and travel cost to alternative tourism sites are major factors that affect visitors’ decision in traveling to natural tourism sites in a Mae Wang District, Chiang Mai Province. We also reported that the recreational demand will decrease as shown in the Figure 2. Evaluate the change of recreational benefit value of the natural tourism sites based on scenarios of the decline in quality of tourism sites in Mae Wang District, Chiang Mai Province, Thailand.
In this section, the demand trend curve of visitor to visit the tourism sites in Mae Wang District were acquired by plotting recreational demand models from (8) and (11). We found that the recreational demand will shift to the left as shown in the Figure 2.
Figure 2 Demand for traveling to tourism sites in Mae Wang District According to the direction of visitor demand to visit tourism sites in Mae Wang District as shown in Figure 2, the results shown that if there is no improvement over the quality of tourism sites, visitor demand to visit the tourism sites and recreational values will decrease from V1 to V2 where V1 and V2 are the recreational demand of visitors in the present and in the case of decline in quality of tourism sites respectively, as shown in the Table 5
Number of Visits (Time/year)
05
101520253035404550
0 1 2 3 4 5 6 7
V1 = e4.112 - 0.3985 ln (TC)
Trave
l Cos
t (x 10
0) TH
B
V2 = e 1.538 - 0.2264 ln (TC)
JOURNAL OF ECONOMICS CHIANG MAI UNIVERSITY – 21/1
~ 44 ~
from the independent variables that have statistically significant relationship with the dependent variable at the confidence level of 95% or higher, as shown in Table 4. Table 4 The analyzing on factors affecting visitors’ decision in traveling to natural
tourism sites in Mae Wang District in the scenario of the decline in quality of tourism sites
Variable coefficient t- ratio p-value Dependent Variable : number of visit (lnV2) Constant - 0.1078 0.2390 0.8109 Independent Variable ln (Inci) - 0.1900*** - 0.3091 0.0021 Atti 0.1365** 2.2880 0.0227 ln (Exi) 0.5437*** 10.9890 0.0000 ln (TCi) - 0.2264*** - 4.0130 0.0010 ln (TSi) 0.3751*** 5.2280 0.0000 F-Stat =84.28*** R-squared = 0.5399 Adjusted-R-squared = 0.5336
From the results in table 4, he recreational demand equation in the case of the decline in quality of tourism sites (V2) can be expressed as in the equations (9), (10) and (11) as follows; ln V2 = - 0.1078 - 0.1900 ln (Inc)*** + 0.1365 Att** + 0.5437 ln (Ex)*** (9) - 0.2264 ln (TC)*** + 0.3751 ln (TS)***
From the equation (6), When other independent variables are considered to be a constant, replace the value of attitude with 1, and replace the value of all 3 influential independent variables with their respective average values except only TCi, the relationship between number of trips that visitors visit Mae Wang tourism sites and individual travel cost of visitors will be obtained based on Vi =f(TCi), as shown in Equation (10) and (11) ln V2 = 1.538 - 0.2264 ln (TC) or (10) V2 = e 1.538 - 0.2264 ln (TC), R2=0.5399 (11)
F A C U L T Y O F E C O N O M I C S C M U .21
/1
46
FACULTY OF ECONOMICS –- CMU
~ 47 ~
that these factors be considered in decision making and designing measures to maintain and promote visitor demand. They should also be used for designing tourism sites development plans that reflect the demand of visitors as suggested by Kaosa-ard et al., (2013) who explained that the expected visitor demand reflects expected income of the communities and provides necessary information to handle supply that reflects visitor demand. Our results also indicated that the numbers of visits are positive relation with the attitude of visitors towards the quality of tourism sites. This result indicated that if visitors have positive attitude towards quality and services, the number of visits will increase. This result is consistent with the study of Himayatullah (2003). Rojrungsat (2010) reported that the attitude of members of local communities play an important role in tourism development because good reception from locals will provide satisfaction and positive attitude to visitors who will likely to tell stories about their impression to others and expect to visit again in the future. The result is also consistent with Chuchart (2001a) who suggested that hospitality and good reception from locals and staff can make a positive impression to visitors and increase the chance that the visitors will revisit in the future. We found that average income of visitors has negative relation to the number of visits to Mae Wang tourism sites. This result is consistent with the theory on income demand that visitors with higher incomes will have lower chance to visit tourism sites that can be considered as inferior goods. Problems, such as untidy landscapes, lack of readiness in visitor facilities and the decline in quality of tourism sites are major causes that make a tourism sites become inferior goods. However, visitor demand will not suffer much from economic problems that result in lower income of visitors because most of the visitors about 75% were locals and people who lives in nearby area (from the survey). The reason that most of the visitors were locals is that people who live near recreation sites will gain more consumer surplus than people who requires a long journey. This result is consistent with the study of Na-Bangchang et al., (2010) who suggested that the same situation occurred at Mae Rampeung Beach which had problems such as congestion of visitors, garbage overflow, beach and coastal erosion because Mae Rampeung beach is classified as an inferior tourism sites. This is also consistent with the study of Thampitak and
JOURNAL OF ECONOMICS CHIANG MAI UNIVERSITY – 21/1
~ 46 ~
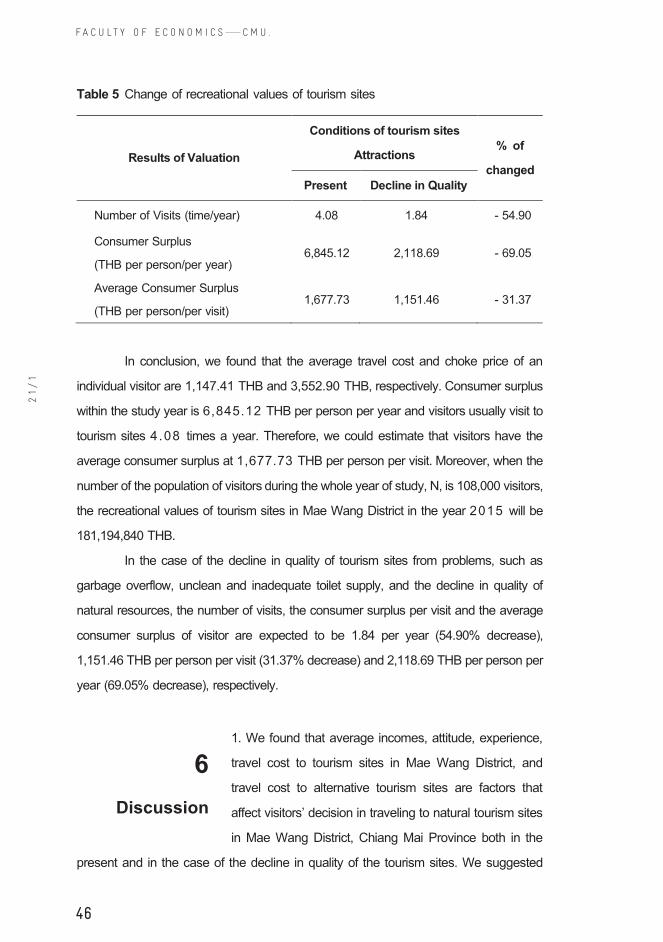
Table 5 Change of recreational values of tourism sites
Results of Valuation Conditions of tourism sites
Attractions % of changed
Present Decline in Quality Number of Visits (time/year) 4.08 1.84 - 54.90 Consumer Surplus (THB per person/per year) 6,845.12 2,118.69 - 69.05
Average Consumer Surplus (THB per person/per visit) 1,677.73 1,151.46 - 31.37
In conclusion, we found that the average travel cost and choke price of an individual visitor are 1,147.41 THB and 3,552.90 THB, respectively. Consumer surplus within the study year is 6,845.12 THB per person per year and visitors usually visit to tourism sites 4.08 times a year. Therefore, we could estimate that visitors have the average consumer surplus at 1,677.73 THB per person per visit. Moreover, when the number of the population of visitors during the whole year of study, N, is 108,000 visitors, the recreational values of tourism sites in Mae Wang District in the year 2015 will be 181,194,840 THB. In the case of the decline in quality of tourism sites from problems, such as garbage overflow, unclean and inadequate toilet supply, and the decline in quality of natural resources, the number of visits, the consumer surplus per visit and the average consumer surplus of visitor are expected to be 1.84 per year (54.90% decrease), 1,151.46 THB per person per visit (31.37% decrease) and 2,118.69 THB per person per year (69.05% decrease), respectively.
1. We found that average incomes, attitude, experience, travel cost to tourism sites in Mae Wang District, and travel cost to alternative tourism sites are factors that affect visitors’ decision in traveling to natural tourism sites in Mae Wang District, Chiang Mai Province both in the
present and in the case of the decline in quality of the tourism sites. We suggested
6 Discussion

J O U R N A L O F E C O N O M I C S 2 1 / 1
201
7,
JA
N.—
JU
N.
47
FACULTY OF ECONOMICS –- CMU
~ 47 ~
that these factors be considered in decision making and designing measures to maintain and promote visitor demand. They should also be used for designing tourism sites development plans that reflect the demand of visitors as suggested by Kaosa-ard et al., (2013) who explained that the expected visitor demand reflects expected income of the communities and provides necessary information to handle supply that reflects visitor demand. Our results also indicated that the numbers of visits are positive relation with the attitude of visitors towards the quality of tourism sites. This result indicated that if visitors have positive attitude towards quality and services, the number of visits will increase. This result is consistent with the study of Himayatullah (2003). Rojrungsat (2010) reported that the attitude of members of local communities play an important role in tourism development because good reception from locals will provide satisfaction and positive attitude to visitors who will likely to tell stories about their impression to others and expect to visit again in the future. The result is also consistent with Chuchart (2001a) who suggested that hospitality and good reception from locals and staff can make a positive impression to visitors and increase the chance that the visitors will revisit in the future. We found that average income of visitors has negative relation to the number of visits to Mae Wang tourism sites. This result is consistent with the theory on income demand that visitors with higher incomes will have lower chance to visit tourism sites that can be considered as inferior goods. Problems, such as untidy landscapes, lack of readiness in visitor facilities and the decline in quality of tourism sites are major causes that make a tourism sites become inferior goods. However, visitor demand will not suffer much from economic problems that result in lower income of visitors because most of the visitors about 75% were locals and people who lives in nearby area (from the survey). The reason that most of the visitors were locals is that people who live near recreation sites will gain more consumer surplus than people who requires a long journey. This result is consistent with the study of Na-Bangchang et al., (2010) who suggested that the same situation occurred at Mae Rampeung Beach which had problems such as congestion of visitors, garbage overflow, beach and coastal erosion because Mae Rampeung beach is classified as an inferior tourism sites. This is also consistent with the study of Thampitak and
JOURNAL OF ECONOMICS CHIANG MAI UNIVERSITY – 21/1
~ 46 ~
Table 5 Change of recreational values of tourism sites
Results of Valuation Conditions of tourism sites
Attractions % of changed
Present Decline in Quality Number of Visits (time/year) 4.08 1.84 - 54.90 Consumer Surplus (THB per person/per year) 6,845.12 2,118.69 - 69.05
Average Consumer Surplus (THB per person/per visit) 1,677.73 1,151.46 - 31.37
In conclusion, we found that the average travel cost and choke price of an individual visitor are 1,147.41 THB and 3,552.90 THB, respectively. Consumer surplus within the study year is 6,845.12 THB per person per year and visitors usually visit to tourism sites 4.08 times a year. Therefore, we could estimate that visitors have the average consumer surplus at 1,677.73 THB per person per visit. Moreover, when the number of the population of visitors during the whole year of study, N, is 108,000 visitors, the recreational values of tourism sites in Mae Wang District in the year 2015 will be 181,194,840 THB. In the case of the decline in quality of tourism sites from problems, such as garbage overflow, unclean and inadequate toilet supply, and the decline in quality of natural resources, the number of visits, the consumer surplus per visit and the average consumer surplus of visitor are expected to be 1.84 per year (54.90% decrease), 1,151.46 THB per person per visit (31.37% decrease) and 2,118.69 THB per person per year (69.05% decrease), respectively.
1. We found that average incomes, attitude, experience, travel cost to tourism sites in Mae Wang District, and travel cost to alternative tourism sites are factors that affect visitors’ decision in traveling to natural tourism sites in Mae Wang District, Chiang Mai Province both in the
present and in the case of the decline in quality of the tourism sites. We suggested
6 Discussion

F A C U L T Y O F E C O N O M I C S C M U .21
/1
48
FACULTY OF ECONOMICS –- CMU
~ 49 ~
communities should consider factors suggested in this study as a part of their decision making process. The development measures should emphasize the improvement of the quality of tourism sites, providing adequate supply of visitor facilities in order to create positive attitude of visitors and sense of willing to pay in the eyes of visitors. The communities should also improve their publicity on strong points, such as the natural beauty of the tourism sites. Natural resources should be conserved and maintained instead of leaving them to decline in quality. 2. We also found that if the quality of tourism sites declines this situation will affect tourism economy of the local communities. In order to maintain the economic values of tourism, the authorities should impose measures that are able to manage visitor resources, and local organizations that are responsible for tourism promotion should ensure that their facilities are on good conditions in order to achieve maximum satisfaction of visitors. The organization should impose measures to control tourism resource utilization and prevent impacts on natural resources. Measures related to stores located in tourism sites are also required such as, improving store management, maintaining clean and tidiness landscapes, conserving beautiful landscapes, managing garbage problems and restoring natural resources and prevent them to decline.
1. In this study, we used ITCM to develop the recreational demand models of individual visitors, and we found that average incomes, attitude towards quality of tourism sites, experience of visitors, travel cost to tourism sites in Mae Wang District, and travel cost to
alternative tourism site are major factors that influence the visitors’ decision in traveling to natural tourism sites in Mae Wang District, Chiang Mai Province, with a statistical significance of 95%. 2. We estimated that the recreational values of tourism sites in Mae Wang District in the year 2015 was 181,194,840 THB. Visitors usually visit 4.08 times a year with recreational demand of 6,845.12 THB. Each visitor has consumer surplus of 1,677.73 THB per visit. However, if there is the decline in quality of tourism sites, such as the decline of tourism resources, garbage problems, dirty and inadequate toilet supply, we found that the number of visits, consumer surplus per visit, and average consumer
8 Conclusion
JOURNAL OF ECONOMICS CHIANG MAI UNIVERSITY – 21/1
~ 48 ~
Antong (2011) who reported that although Nong Leng Sai wetland of Phayao province is classified as an inferior tourism sites, it is a recreation site for locals and people from nearby area who visit the place during vacation. 2. Our estimated recreational benefit values of tourism sites in Mae Wang District in the year 2015 is 181,194,840 THB. The value reflects willingness to pay of visitors who receive recreational values from tourism sites in Mae Wang District. The recreational benefit values come in a form of satisfaction towards attractiveness of tourism sites or beauty of natural attractions. Tourism sites in Mae Wang District also offer a variety of recreational activities that can convince visitors to visit in the future. Our study, however, also predicted that Mae Wang District cannot provide visitor facilities to visitors sufficiently during festivals. According to the complete lack of regulations and control in the present, we suggested that if the tourism sites do not improve their management and quality but still allow the quality of the tourism sites to decline, the recreational demand of visitors and the recreational benefit values of tourism sites will decrease. This result is consistent with the study of Boonwong (2013) who found that recreational values of Plao beach decreased by 11.72% and 14.30% due to garbage problem and coastal erosion, respectively. Na-Bangchang et al., (2010) reported that recreational values of Mae Rampeung beach decreased due to problems related to visitor congestion, garbage problems and erosion of beaches and coastal area. Moreover, we also found that tourism is a major source of income of the Mae Wang community according to the structure of spending of visitors as shown in the Figure 1. And our information that most of the stores located in Mae Wang tourism site are owned by locals. Therefore, the decline in quality of tourism sites will result in economic disadvantage of local communities.
1 . According to our study, we found major factors that influence the visitors’ decision in traveling to natural tourism sites in Mae Wang District, Chiang Mai Province. Therefore, in order to design measures to develop tourism sites in Mae Wang District that reflects the demand of visitors, the local
7 Suggestions

J O U R N A L O F E C O N O M I C S 2 1 / 1
201
7,
JA
N.—
JU
N.
49
FACULTY OF ECONOMICS –- CMU
~ 49 ~
communities should consider factors suggested in this study as a part of their decision making process. The development measures should emphasize the improvement of the quality of tourism sites, providing adequate supply of visitor facilities in order to create positive attitude of visitors and sense of willing to pay in the eyes of visitors. The communities should also improve their publicity on strong points, such as the natural beauty of the tourism sites. Natural resources should be conserved and maintained instead of leaving them to decline in quality. 2. We also found that if the quality of tourism sites declines this situation will affect tourism economy of the local communities. In order to maintain the economic values of tourism, the authorities should impose measures that are able to manage visitor resources, and local organizations that are responsible for tourism promotion should ensure that their facilities are on good conditions in order to achieve maximum satisfaction of visitors. The organization should impose measures to control tourism resource utilization and prevent impacts on natural resources. Measures related to stores located in tourism sites are also required such as, improving store management, maintaining clean and tidiness landscapes, conserving beautiful landscapes, managing garbage problems and restoring natural resources and prevent them to decline.
1. In this study, we used ITCM to develop the recreational demand models of individual visitors, and we found that average incomes, attitude towards quality of tourism sites, experience of visitors, travel cost to tourism sites in Mae Wang District, and travel cost to
alternative tourism site are major factors that influence the visitors’ decision in traveling to natural tourism sites in Mae Wang District, Chiang Mai Province, with a statistical significance of 95%. 2. We estimated that the recreational values of tourism sites in Mae Wang District in the year 2015 was 181,194,840 THB. Visitors usually visit 4.08 times a year with recreational demand of 6,845.12 THB. Each visitor has consumer surplus of 1,677.73 THB per visit. However, if there is the decline in quality of tourism sites, such as the decline of tourism resources, garbage problems, dirty and inadequate toilet supply, we found that the number of visits, consumer surplus per visit, and average consumer
8 Conclusion
JOURNAL OF ECONOMICS CHIANG MAI UNIVERSITY – 21/1
~ 48 ~
Antong (2011) who reported that although Nong Leng Sai wetland of Phayao province is classified as an inferior tourism sites, it is a recreation site for locals and people from nearby area who visit the place during vacation. 2. Our estimated recreational benefit values of tourism sites in Mae Wang District in the year 2015 is 181,194,840 THB. The value reflects willingness to pay of visitors who receive recreational values from tourism sites in Mae Wang District. The recreational benefit values come in a form of satisfaction towards attractiveness of tourism sites or beauty of natural attractions. Tourism sites in Mae Wang District also offer a variety of recreational activities that can convince visitors to visit in the future. Our study, however, also predicted that Mae Wang District cannot provide visitor facilities to visitors sufficiently during festivals. According to the complete lack of regulations and control in the present, we suggested that if the tourism sites do not improve their management and quality but still allow the quality of the tourism sites to decline, the recreational demand of visitors and the recreational benefit values of tourism sites will decrease. This result is consistent with the study of Boonwong (2013) who found that recreational values of Plao beach decreased by 11.72% and 14.30% due to garbage problem and coastal erosion, respectively. Na-Bangchang et al., (2010) reported that recreational values of Mae Rampeung beach decreased due to problems related to visitor congestion, garbage problems and erosion of beaches and coastal area. Moreover, we also found that tourism is a major source of income of the Mae Wang community according to the structure of spending of visitors as shown in the Figure 1. And our information that most of the stores located in Mae Wang tourism site are owned by locals. Therefore, the decline in quality of tourism sites will result in economic disadvantage of local communities.
1 . According to our study, we found major factors that influence the visitors’ decision in traveling to natural tourism sites in Mae Wang District, Chiang Mai Province. Therefore, in order to design measures to develop tourism sites in Mae Wang District that reflects the demand of visitors, the local
7 Suggestions

F A C U L T Y O F E C O N O M I C S C M U .21
/1
50
FACULTY OF ECONOMICS –- CMU
~ 51 ~
Masamae, R. (2011). Economic Evaluation of Recreational Benefits of Sai Khao Waterfall, Sai Khao Sub-district, Kok Po District, Pattani. (Master’s thesis). Prince of Songkla University.
Na-Bangchang, O. & Srisaowaluck, I., 2009. Economic Valuing relevant to Influence on Environment for Supporting Legal Process. Bangkok: Vithunkarnpok Printing.
Na-Bangchang, O., Pornpinatepong, K., Thongsopin, R., Sutat, K., Jaroongrattanapong, R., Manusboonpermpoon, A., ChernchooJai, N. (2010). The Study of Economic Value of Marine and Coastal Resources (Beach)., Department of Marine and Coastal Resources.
Nakaworaphan, P. (2016). The economic valuation of coral reef Samed Island, Thailand (Research report). National Institute of Development Administration (NIDA).
National Statistical Office. (2016). Statistics of Tourist Numbers. Retrieved March, 31, 2014, form http://www.nso.go.th/.
National Statistical Office. (2016). Statistics of Tourist Numbers. Retrieved March, 30, 2016, form http://www.nso.go.th/.
Petcharanon, S., (2000). Environmental Economics Units 1-7. Bangkok: Sukhothai Thammathirat Open University.
Petcharanon, S. (2010). Environmental Economics. Bangkok: Kasetsart University. Petchrote, L & Chamniprasart, A., (2002). Studying subjects Research
methodology Lecturenotes. Uttaradit: Uttaradit Rajabhat University. Pornpinatepong, K. (2005, May). Economic valuation of recreational site: single site
model case.Thai. Journal of Public Administration, 3(2), 13-32. Preechachon, P. (2013). Valuing Recreation Benefit of PhuWiang National Park,
KhonKaen Province. (Master’s thesis). Bangkok: Kasetsart University. Rattanaphan, W. (2005, January). Recreational evaluation and management of Tham
Le Khao Kob Cave, Trang Province. Applied Economics Magazine, 11(1), 49-59.
JOURNAL OF ECONOMICS CHIANG MAI UNIVERSITY – 21/1
~ 50 ~
surplus of each visitor are expected to be 1.84 times a year (54.90% decrease), 1,151.46 THB per person (31.37% decrease) and 2,118.69 THB per year (69.5% decrease). In order to maintain economic values of tourism in Mae Wang District, authorities should impose measures to control quality of tourism sites, provide adequate supply of facilities for visitors, conserve and maintain natural resources, and maintain good conditions of tourism sites to create positive attitude and sense of willingness to pay for visitors. References Boonwong, N. (2013). Valuation the change recreation value from change
environment. Nai Plao Beach, Khanom , Nakhon Si Thammarat (Master’s thesis). National Institute of Development Administration (NIDA).
Chaiprasit, N., & Maneenet, T. (2010, January). Recreational evaluation of tourist attractions in Phu Wiang National Park, Khon Kaen Province, with overseas tourists from Asia Pacific Region. Isan Study Magazine, Cultural Diversity, 7(16), 166-175.
Chuchat, C. (2001a). Tourism Industry. Chiang Mai: Chiang Mai Lanna Publishing. Chuchat, C. (2001b). The form of ecotourism in Wang River Basin. Chiang Mai:
Cultural Ecotourism Project. Department of Tourism. (2014) . Tourism Database System. Retrieved March 31,
2014, from http://61.19.236.136:8090/dotr/ Department of Tourism. (2016). Tourism Database System. Retrieved March 30 ,
2016, from http://61.19.236.136:8090/dotr/ Himayatullah. (2003 winter). Economic valuation of the environment and the travel cost
approach: The case of Ayubia National Park, The Pakistan Development Review, 42(4), 537-551.
Kaosa-ard, M., Anthong, A., Tianteerawit, P., Petchwarun, K., & Kruafu, N. (2013). Tourism Economics, Chiang Mai: Login Design Work.
Mae Win Sub-district Administration Organization. (2014). 3-Year Period Development Plan of Mae Win Sub-district Administration Organization, B.E. 2557-2559 (A.D. 2014-2016) (Copy).

J O U R N A L O F E C O N O M I C S 2 1 / 1
201
7,
JA
N.—
JU
N.
51
FACULTY OF ECONOMICS –- CMU
~ 51 ~
Masamae, R. (2011). Economic Evaluation of Recreational Benefits of Sai Khao Waterfall, Sai Khao Sub-district, Kok Po District, Pattani. (Master’s thesis). Prince of Songkla University.
Na-Bangchang, O. & Srisaowaluck, I., 2009. Economic Valuing relevant to Influence on Environment for Supporting Legal Process. Bangkok: Vithunkarnpok Printing.
Na-Bangchang, O., Pornpinatepong, K., Thongsopin, R., Sutat, K., Jaroongrattanapong, R., Manusboonpermpoon, A., ChernchooJai, N. (2010). The Study of Economic Value of Marine and Coastal Resources (Beach)., Department of Marine and Coastal Resources.
Nakaworaphan, P. (2016). The economic valuation of coral reef Samed Island, Thailand (Research report). National Institute of Development Administration (NIDA).
National Statistical Office. (2016). Statistics of Tourist Numbers. Retrieved March, 31, 2014, form http://www.nso.go.th/.
National Statistical Office. (2016). Statistics of Tourist Numbers. Retrieved March, 30, 2016, form http://www.nso.go.th/.
Petcharanon, S., (2000). Environmental Economics Units 1-7. Bangkok: Sukhothai Thammathirat Open University.
Petcharanon, S. (2010). Environmental Economics. Bangkok: Kasetsart University. Petchrote, L & Chamniprasart, A., (2002). Studying subjects Research
methodology Lecturenotes. Uttaradit: Uttaradit Rajabhat University. Pornpinatepong, K. (2005, May). Economic valuation of recreational site: single site
model case.Thai. Journal of Public Administration, 3(2), 13-32. Preechachon, P. (2013). Valuing Recreation Benefit of PhuWiang National Park,
KhonKaen Province. (Master’s thesis). Bangkok: Kasetsart University. Rattanaphan, W. (2005, January). Recreational evaluation and management of Tham
Le Khao Kob Cave, Trang Province. Applied Economics Magazine, 11(1), 49-59.
JOURNAL OF ECONOMICS CHIANG MAI UNIVERSITY – 21/1
~ 50 ~
surplus of each visitor are expected to be 1.84 times a year (54.90% decrease), 1,151.46 THB per person (31.37% decrease) and 2,118.69 THB per year (69.5% decrease). In order to maintain economic values of tourism in Mae Wang District, authorities should impose measures to control quality of tourism sites, provide adequate supply of facilities for visitors, conserve and maintain natural resources, and maintain good conditions of tourism sites to create positive attitude and sense of willingness to pay for visitors. References Boonwong, N. (2013). Valuation the change recreation value from change
environment. Nai Plao Beach, Khanom , Nakhon Si Thammarat (Master’s thesis). National Institute of Development Administration (NIDA).
Chaiprasit, N., & Maneenet, T. (2010, January). Recreational evaluation of tourist attractions in Phu Wiang National Park, Khon Kaen Province, with overseas tourists from Asia Pacific Region. Isan Study Magazine, Cultural Diversity, 7(16), 166-175.
Chuchat, C. (2001a). Tourism Industry. Chiang Mai: Chiang Mai Lanna Publishing. Chuchat, C. (2001b). The form of ecotourism in Wang River Basin. Chiang Mai:
Cultural Ecotourism Project. Department of Tourism. (2014) . Tourism Database System. Retrieved March 31,
2014, from http://61.19.236.136:8090/dotr/ Department of Tourism. (2016). Tourism Database System. Retrieved March 30 ,
2016, from http://61.19.236.136:8090/dotr/ Himayatullah. (2003 winter). Economic valuation of the environment and the travel cost
approach: The case of Ayubia National Park, The Pakistan Development Review, 42(4), 537-551.
Kaosa-ard, M., Anthong, A., Tianteerawit, P., Petchwarun, K., & Kruafu, N. (2013). Tourism Economics, Chiang Mai: Login Design Work.
Mae Win Sub-district Administration Organization. (2014). 3-Year Period Development Plan of Mae Win Sub-district Administration Organization, B.E. 2557-2559 (A.D. 2014-2016) (Copy).

F A C U L T Y O F E C O N O M I C S C M U .21
/1
52
FACULTY OF ECONOMICS –- CMU
Innovative Entrepreneurship in the Tourism Sector:
New Insights on the Role of the Development Context
Isabel Pereira Rodrigues1
This paper is an empirical study on the drivers of
innovative entrepreneurship for the tourism sector, in
particular the role of the development context. Using
cross-country data from the Global Entrepreneurship
Monitor (GEM) project and the Human Development Index (HDI) of the United
Nations Development Programme, this study finds evidence that innovative
entrepreneurship is negatively related to human development. Although more
developed societies have more resources available and higher levels of
education development, the tourism entrepreneurs have lower probability of
being innovative. More developed societies are established tourism destinations,
and facing such high demand, it is possible that tourism entrepreneurs have
lower incentives to innovate.
Keywords: Entrepreneurship, innovation, human development, tourism, GEM
This paper addresses the issue of the drivers of
innovative entrepreneurship in the tourism sector, in
particular the role of the development context in
which the entrepreneurial activities take place.
Entrepreneurship has received attention from
policymakers and academics for long. From the policy perspective, it is seem as
a way to boost growth, create jobs and improve well-being (e.g. ASEAN, 2015;
1 Mahidol University International College, Mahidol University, Thailand.
Email: [email protected]
Abstract
1 Introduction
~ 53 ~
JOURNAL OF ECONOMICS CHIANG MAI UNIVERSITY – 21/1
~ 52 ~
Rattanataweesopon, S. & Petcharanon, S., (2006, July). An evaluation of recreational benefits of Phu Kradueng National Park. Applied Economics Magazine, 13(2), 60 -78.
Rotrungsat, P. (2010). Community Tourism. Bangkok: OS Printing House. Silapararachawong, U. (2013). Valuing Economics Environmental Resources, P.A.
Living, Ltd, Bangkok, Thailand. Silaprachawong, U. (2015). Natural Resource and Environmental Economics Units 8-
15. Bangkok: Sukhothai Thammathirat Open University. Srijan, S., the chief administrator of Mae Win Sub-district. (10 February 2014). inteview
Tammapitak, K., & Anthong, A. (2011, July). An Evaluation of Recreational Benefits of Nong Leng Sai Wetland. Journal of Economics Chiang Mai University, 15(2), 69-90.
Wunsiri, R., Thongrak. S., Chareonjiratrakul. S., & Kiripat, S. ( 1999, January) . Evaluating recreational benefits in Ton Nga Chang Wildlife Sanctuary, Songkhla and Satun Provinces. Applied Economics Magazine, 7(1), 1-16.