worldwide trends in energy use and efficiencyeneken.ieej.or.jp/data/pdf/1707.pdfunderstanding energy...
TRANSCRIPT
INTERNATIONALENERGY AGENCY
Worldwide Trendsin Energy Use and Efficiency
Key Insights fromIEA Indicator Analysis
ENERGYINDICATORS
© OECD/IEA - 2008
Worldwide Trends in Energy Use and Efficiency
Key Insights from IEA Indicator Analysis
Peter TaylorActing Head, Energy Technology Policy Division
IEEJ Workshop, 7 July 2008, Tokyo
IEEJ:2008年7月掲載

INTERNATIONALENERGY AGENCY
Worldwide Trendsin Energy Use and Efficiency
Key Insights fromIEA Indicator Analysis
ENERGYINDICATORS
© OECD/IEA - 2008
Overview
IEA indicators work
Global patterns of energy use and CO2emissions
Understanding energy and CO2 trends in the IEA
Energy and CO2 reduction potentials
Conclusions
IEEJ:2008年7月掲載
INTERNATIONALENERGY AGENCY
Worldwide Trendsin Energy Use and Efficiency
Key Insights fromIEA Indicator Analysis
ENERGYINDICATORS
© OECD/IEA - 2008
IEA Indicators Work
Establish a harmonised framework for analysisHarmonisation => ComparabilityComparability => Understanding of global trends and drivers
Produce meaningful cross-country analysis to provide guidance to policy-makers on:
Underlying drivers (economic activity & structure, income, prices...)Trends in energy use and CO2 emissionsEnergy efficiency opportunities and progressPolicy effectiveness
IEEJ:2008年7月掲載

INTERNATIONALENERGY AGENCY
Worldwide Trendsin Energy Use and Efficiency
Key Insights fromIEA Indicator Analysis
ENERGYINDICATORS
© OECD/IEA - 2008
Key Outputs – Published Reports
2007In support of the G8 Plan of Action
2008
IEEJ:2008年7月掲載
INTERNATIONALENERGY AGENCY
Worldwide Trendsin Energy Use and Efficiency
Key Insights fromIEA Indicator Analysis
ENERGYINDICATORS
© OECD/IEA - 2008
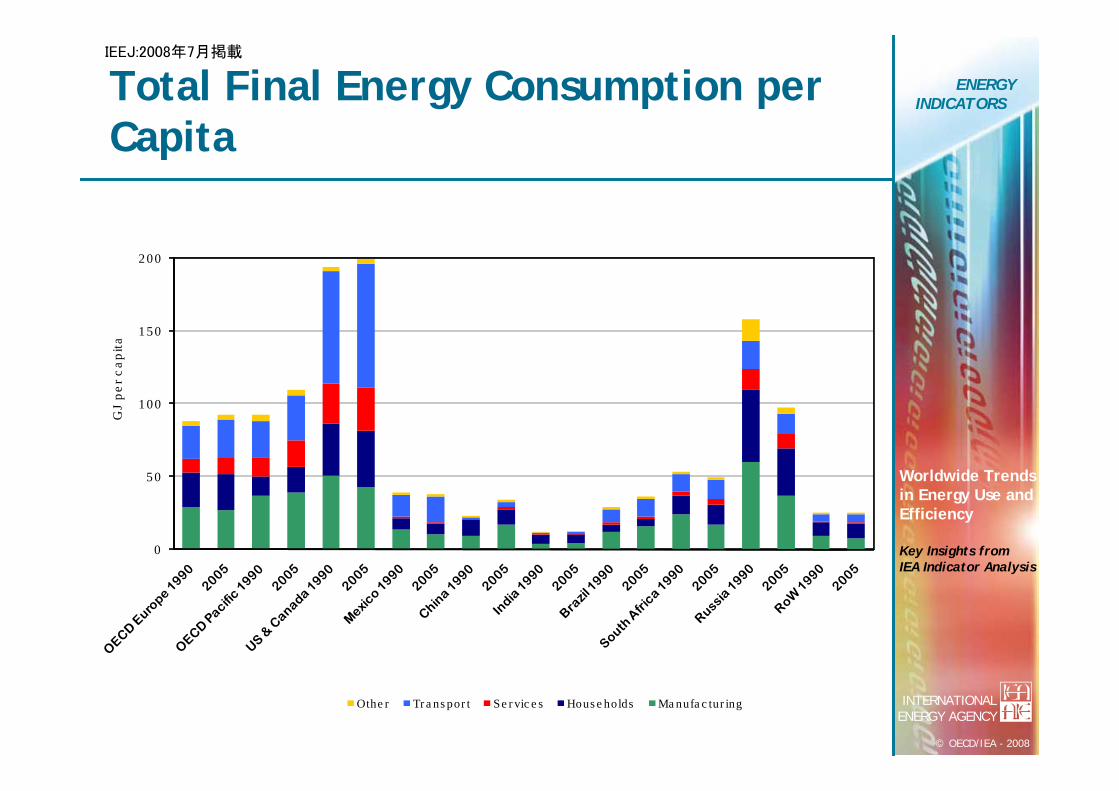
Total Final Energy Consumption per Capita
0
5 0
1 00
1 50
2 00
GJ
per c
apita
Othe r Tr a ns por t Se r vic e s Hous e holds Ma nufa c tur ing
IEEJ:2008年7月掲載
INTERNATIONALENERGY AGENCY
Worldwide Trendsin Energy Use and Efficiency
Key Insights fromIEA Indicator Analysis
ENERGYINDICATORS
© OECD/IEA - 2008
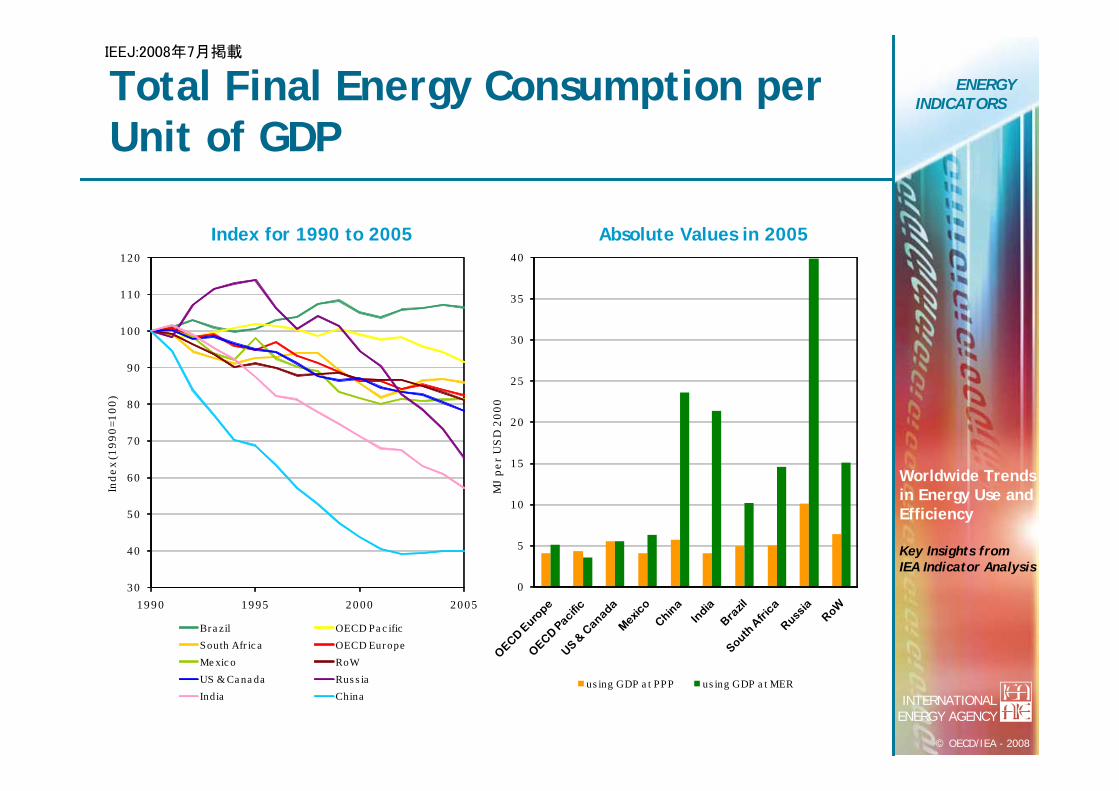
Total Final Energy Consumption per Unit of GDP
Index for 1990 to 2005 Absolute Values in 2005
30
40
50
60
70
80
90
1 00
1 10
1 20
19 9 0 1 9 95 2 0 00 2 0 05
Inde
x (1
990=
100)
Br a zil OECD Pa c ificSouth Afr ic a OECD Eur opeMe xic o RoWUS & Ca na da Rus s iaIndia China
0
5
1 0
1 5
2 0
2 5
3 0
3 5
4 0
MJ
per
US
D 2
000
u s ing GDP a t PPP us ing GDP a t MER
IEEJ:2008年7月掲載

INTERNATIONALENERGY AGENCY
Worldwide Trendsin Energy Use and Efficiency
Key Insights fromIEA Indicator Analysis
ENERGYINDICATORS
© OECD/IEA - 2008
End-Use Coverage for Indicators
IEEJ:2008年7月掲載

INTERNATIONALENERGY AGENCY
Worldwide Trendsin Energy Use and Efficiency
Key Insights fromIEA Indicator Analysis
ENERGYINDICATORS
© OECD/IEA - 2008
Factors Affecting Energy Use and CO2 Emissions
Households, services and transport -decomposition approach:
Energy UseActivityStructure (mix of activities)Energy intensity of each activity
CO2 EmissionsEnergy useFuel mixCarbon intensity of each fuel
IEEJ:2008年7月掲載

INTERNATIONALENERGY AGENCY
Worldwide Trendsin Energy Use and Efficiency
Key Insights fromIEA Indicator Analysis
ENERGYINDICATORS
© OECD/IEA - 2008
Household Energy Use by End-Use, IEA19
0
2
4
6
8
1 0
1 2
1 4
1 6
19 90 1 99 5 20 00 2 00 5
EJ
Spa c e he a ting
Applia nc e s
Wa te r he a ting
Lighting
Cooking
5 % 5 %4 % 5 %
1 7% 1 6%
1 6%2 1%
5 8%5 3%
0 %
2 0%
4 0%
6 0%
8 0%
1 00 %
19 90 20 05
IEEJ:2008年7月掲載

INTERNATIONALENERGY AGENCY
Worldwide Trendsin Energy Use and Efficiency
Key Insights fromIEA Indicator Analysis
ENERGYINDICATORS
© OECD/IEA - 2008
Decomposition of Changes in Space Heating per Capita, 1990-2005
-2 .0 %
-1 .5 %
-1 .0 %
-0 .5 %
0 .0 %
0 .5 %
1 .0 %
1 .5 %
Ave
rage
ann
ual p
erce
nt c
hang
e
Ac tua l s pa c e h e a tin g p e r c a p ita Dwe llin g s ize e ffe c t Oc c up a n c y e ffe c tEffic ie n c y o f c o nve rs io n e ffe c t Us e fu l in te n s ity e ffe c t
IEEJ:2008年7月掲載

INTERNATIONALENERGY AGENCY
Worldwide Trendsin Energy Use and Efficiency
Key Insights fromIEA Indicator Analysis
ENERGYINDICATORS
© OECD/IEA - 2008
Energy consumption of Appliances, EU15
0
1 0 0
2 0 0
3 0 0
4 0 0
5 0 0
kWh
per y
ear
1 9 9 0 1 9 95 2 00 0 20 0 5
3 5 %
4 0 %
4 5 %
5 0 %
5 5 %
6 0 %
6 5 %
19 9 0 1 9 95 2 0 0 0 20 0 5
Sha
re in
tota
l app
lianc
es e
nerg
y us
e
La r ge a pplia nc e s Othe r a pplia nc e s
Average Unit Energy Consumption Share of Large and Small Appliances
Source: ODYSSEE
IEEJ:2008年7月掲載

INTERNATIONALENERGY AGENCY
Worldwide Trendsin Energy Use and Efficiency
Key Insights fromIEA Indicator Analysis
ENERGYINDICATORS
© OECD/IEA - 2008
Measures of Energy Intensity in the Service Sector, 2005
0 .0
0 .2
0 .4
0 .6
0 .8
1 .0
1 .2
1 .4
1 .6
1 .8
GJ
per m
2
Ele c tr ic ity Fue ls
0 .0
0 .2
0 .4
0 .6
0 .8
1 .0
1 .2
1 .4
1 .6
1 .8
2 .0
MJ
per
US
D P
PP
200
0
Ele c tr ic ity Fue ls
Energy Use per Unit of Floor Area Energy Use per Value-Added
IEEJ:2008年7月掲載

INTERNATIONALENERGY AGENCY
Worldwide Trendsin Energy Use and Efficiency
Key Insights fromIEA Indicator Analysis
ENERGYINDICATORS
© OECD/IEA - 2008
Impact of Structure on Service Sector Energy Use
Factors Affecting Service Sector Energy Use Share of Floor Space by Sub-Sector
-0 .5%
0 .0 %
0.5 %
1.0 %
1.5 %
2.0 %
2.5 %
Ca n a d a J a p a n US
Ave
rage
ann
ual p
erce
nt c
hang
e
Ac tua l e ne r gy us e Ac tivity Str uc tur e Inte ns ity
0%
20 %
40 %
60 %
80 %
10 0%
Educ a tion He a lth
Re ta il Food & lodging
Offic e s Othe r
IEEJ:2008年7月掲載
INTERNATIONALENERGY AGENCY
Worldwide Trendsin Energy Use and Efficiency
Key Insights fromIEA Indicator Analysis
ENERGYINDICATORS
© OECD/IEA - 2008
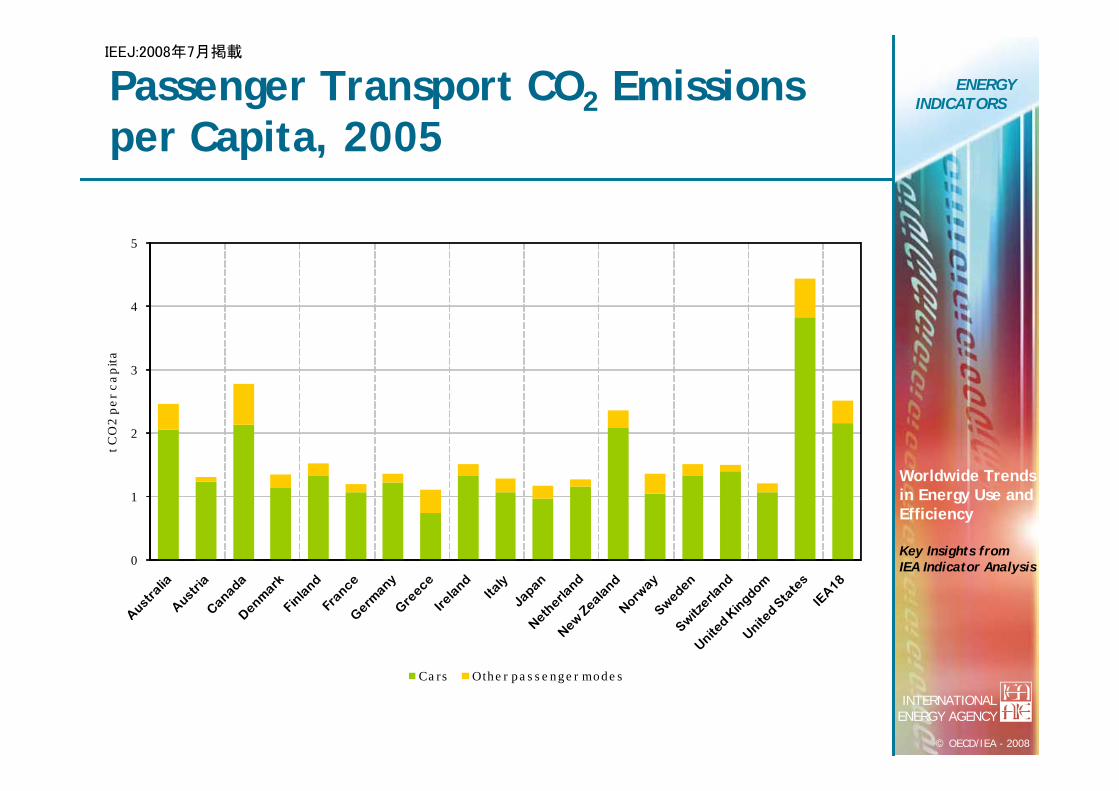
Passenger Transport CO2 Emissions per Capita, 2005
0
1
2
3
4
5
t CO
2 pe
r cap
ita
Ca rs Othe r p a s s e ng e r mo de s
IEEJ:2008年7月掲載

INTERNATIONALENERGY AGENCY
Worldwide Trendsin Energy Use and Efficiency
Key Insights fromIEA Indicator Analysis
ENERGYINDICATORS
© OECD/IEA - 2008
Energy Use per Passenger-Kilometre (All Modes)
0 .0
0 .5
1 .0
1 .5
2 .0
2 .5
MJ
per
pkm
1 99 0 20 05
IEEJ:2008年7月掲載

INTERNATIONALENERGY AGENCY
Worldwide Trendsin Energy Use and Efficiency
Key Insights fromIEA Indicator Analysis
ENERGYINDICATORS
© OECD/IEA - 2008
Share of Total Passenger Transport by Mode, 2005
0 %
1 0%
2 0%
3 0%
4 0%
5 0%
6 0%
7 0%
8 0%
9 0%
1 00 %
Ca rs Bu s e s Ra il Air Wa te r
IEEJ:2008年7月掲載

INTERNATIONALENERGY AGENCY
Worldwide Trendsin Energy Use and Efficiency
Key Insights fromIEA Indicator Analysis
ENERGYINDICATORS
© OECD/IEA - 2008
Average Fuel Intensity of the Car Stock
6
7
8
9
10
11
12
13
1 99 0 19 95 2 000 2 00 5
Litr
es o
f gas
olin
e eq
uiva
lent
per
100
veh
icle
-km
USAus tr a lia J a pa n Ne w Ze a la nd Ca na da Switze r la nd Swe de n Ir e la nd Ge r ma ny Ne the r la nds Nor wa y Aus tr ia Fr a nc e UKFinla nd De nma r k Ita ly Gr e e c e
IEEJ:2008年7月掲載

INTERNATIONALENERGY AGENCY
Worldwide Trendsin Energy Use and Efficiency
Key Insights fromIEA Indicator Analysis
ENERGYINDICATORS
© OECD/IEA - 2008
Decomposition of Car Energy Use per Capita, 1990 – 2005
-2%
-1%
0 %
1 %
2 %
3 %
4 %
Ave
rage
ann
ual p
erce
nt c
hang
e
Ca r e ne rgy u s e pe r c a p ita Own e rs h ip e ffe c t Us a g e e ffe c t Fue l in te ns ity e ffe c t
IEEJ:2008年7月掲載

INTERNATIONALENERGY AGENCY
Worldwide Trendsin Energy Use and Efficiency
Key Insights fromIEA Indicator Analysis
ENERGYINDICATORS
© OECD/IEA - 2008
Freight CO2 Emissions per Unit of GDP, 2005
0 .0 0
0 .0 1
0 .0 2
0 .0 3
0 .0 4
0 .0 5
0 .0 6
0 .0 7
0 .0 8
kg C
O2
per U
SD
PP
P 2
000
Tr uc ks Othe r fr e ight mode s
IEEJ:2008年7月掲載

INTERNATIONALENERGY AGENCY
Worldwide Trendsin Energy Use and Efficiency
Key Insights fromIEA Indicator Analysis
ENERGYINDICATORS
© OECD/IEA - 2008
Freight Transport Energy Use perTonne-Kilometre by Mode, 2005
0
1
2
3
4
5
6
MJ
per
tkm
Tr uc ks Ra il Ships
IEEJ:2008年7月掲載

INTERNATIONALENERGY AGENCY
Worldwide Trendsin Energy Use and Efficiency
Key Insights fromIEA Indicator Analysis
ENERGYINDICATORS
© OECD/IEA - 2008
Decomposition of Changes in Truck Energy Intensity, 1990-2005
-4%
-3%
-2%
-1%
0%
1%
2%
3%
4%
Ave
rage
ann
ual p
erce
nt c
hang
e
Tr uc k e ne r gy pe r tkm Tr uc k-km pe r tkm Tr uc k e ne r gy pe r tr uc k-km
IEEJ:2008年7月掲載

INTERNATIONALENERGY AGENCY
Worldwide Trendsin Energy Use and Efficiency
Key Insights fromIEA Indicator Analysis
ENERGYINDICATORS
© OECD/IEA - 2008
Industry – New Approach
Indicators based physical production:Not influenced by price variationsCan be directly related to technology choicesAllow assessment of efficiency potentials
Potentials calculation:Uses comparison of actual performance vsBAT/BPTShows where the potential liesBut “instantaneous” potential, not suitable for short-term target setting
IEEJ:2008年7月掲載

INTERNATIONALENERGY AGENCY
Worldwide Trendsin Energy Use and Efficiency
Key Insights fromIEA Indicator Analysis
ENERGYINDICATORS
© OECD/IEA - 2008
Energy Requirement per Tonne of Clinker by Country, Including Alternative Fuels
2 .0
2 .5
3 .0
3 .5
4 .0
4 .5
5 .0
5 .5
6 .0
1 99 0 19 91 19 92 19 93 19 94 1 99 5 1 99 6 1 99 7 1 99 8 19 99 20 00 20 01 20 02 2 00 3 2 00 4
GJ
per t
onne
of c
linke
r
USChinaWe ighte d a ve r a geCa na daKor e aIndiaBr a zilSpa inIta lyGe r ma nyTha ila ndMe xic oJ a pa n
IEEJ:2008年7月掲載
INTERNATIONALENERGY AGENCY
Worldwide Trendsin Energy Use and Efficiency
Key Insights fromIEA Indicator Analysis
ENERGYINDICATORS
© OECD/IEA - 2008
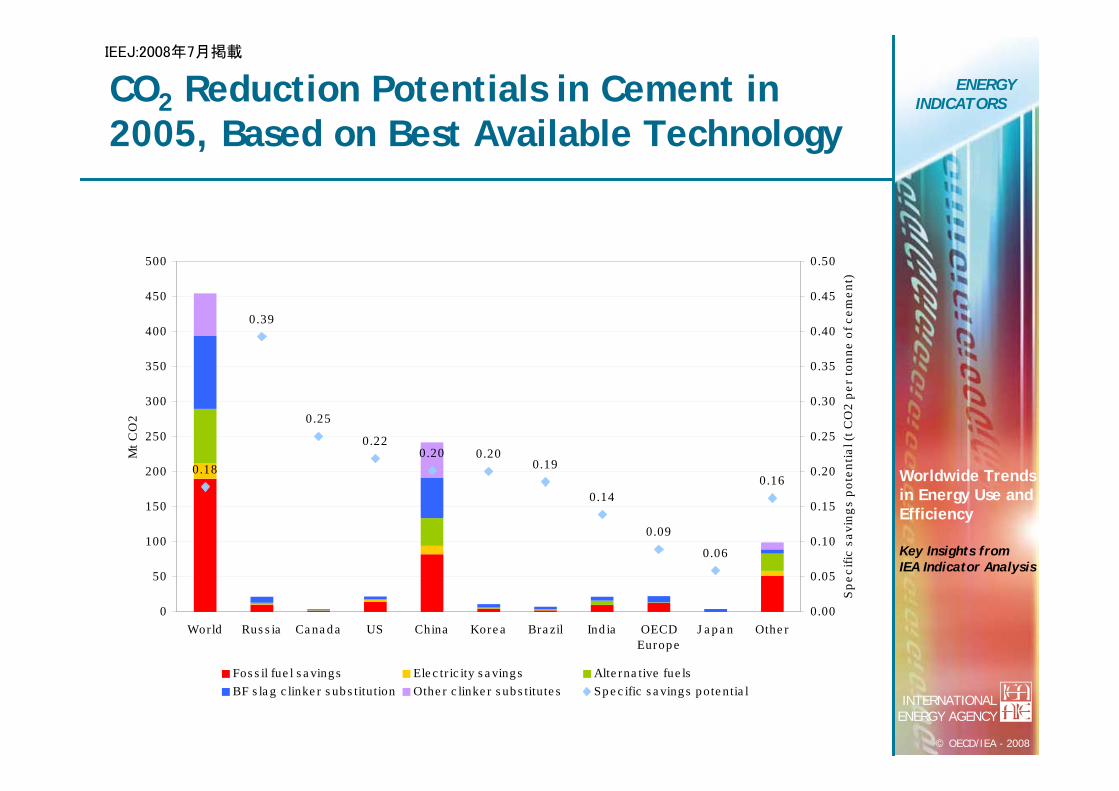
CO2 Reduction Potentials in Cement in 2005, Based on Best Available Technology
0.18
0.39
0.25
0.220.20 0.20
0.19
0.14
0.09
0.06
0.16
0
50
100
150
200
250
300
350
400
450
500
World Rus s ia Ca na d a US China Kore a Bra zil Ind ia OECDEurop e
J a p a n Othe r
Mt C
O2
0 .00
0.05
0.10
0.15
0.20
0.25
0.30
0.35
0.40
0.45
0.50
Spe
cific
sav
ings
pot
entia
l (t C
O2
per
tonn
e of
cem
ent)
Fos s il fue l s a ving s Ele c tr ic ity s a ving s Alte rna tive fue lsBF s la g c linke r s ub s titution Othe r c linke r s ub s titute s Sp e c ific s a ving s p ote ntia l
IEEJ:2008年7月掲載

INTERNATIONALENERGY AGENCY
Worldwide Trendsin Energy Use and Efficiency
Key Insights fromIEA Indicator Analysis
ENERGYINDICATORS
© OECD/IEA - 2008
Heat Consumption in Pulp and Paper Production versus Best Available Technology
4 0
6 0
8 0
1 00
1 20
1 40
1 60
19 90 1 99 5 20 00 20 05
Eff
icie
ncy
inde
x (B
AT=
100)
J a pa nSwe de nGe r ma nyFinla ndKor e aFr a nc eWe ighte d a ve r a geBr a zilSpa inIta lyUSUKCa na da
IEEJ:2008年7月掲載

INTERNATIONALENERGY AGENCY
Worldwide Trendsin Energy Use and Efficiency
Key Insights fromIEA Indicator Analysis
ENERGYINDICATORS
© OECD/IEA - 2008
CO2 Emissions per Tonne of Pulp Exported and Paper Produced
0 .0
0 .1
0 .2
0 .3
0 .4
0 .5
0 .6
0 .7
0 .8
0 .9
1 .0
1 99 0 19 95 20 00 20 05
t CO
2 pe
r ton
ne o
f pul
p ex
port
ed a
nd p
aper
pro
duce
d
USSpa inUKWe ighte d a ve r a geIta lyJ a pa nKor e aFr a nc eGe r ma nyBr a zilCa na daFinla ndSwe de n
IEEJ:2008年7月掲載

INTERNATIONALENERGY AGENCY
Worldwide Trendsin Energy Use and Efficiency
Key Insights fromIEA Indicator Analysis
ENERGYINDICATORS
© OECD/IEA - 2008
Specific Power Consumption inAluminium Smelting
1 4 00 0
1 4 50 0
1 5 00 0
1 5 50 0
1 6 00 0
1 6 50 0
1 99 0 19 95 20 00 20 05
kWh
per t
onne
of p
rim
ary
alum
iniu
m
Nor th Ame r ic aEur opeWe ighte d a ve r a geEa s t As iaLa tin Ame r ic aOc e a niaAfr ic a
IEEJ:2008年7月掲載
INTERNATIONALENERGY AGENCY
Worldwide Trendsin Energy Use and Efficiency
Key Insights fromIEA Indicator Analysis
ENERGYINDICATORS
© OECD/IEA - 2008
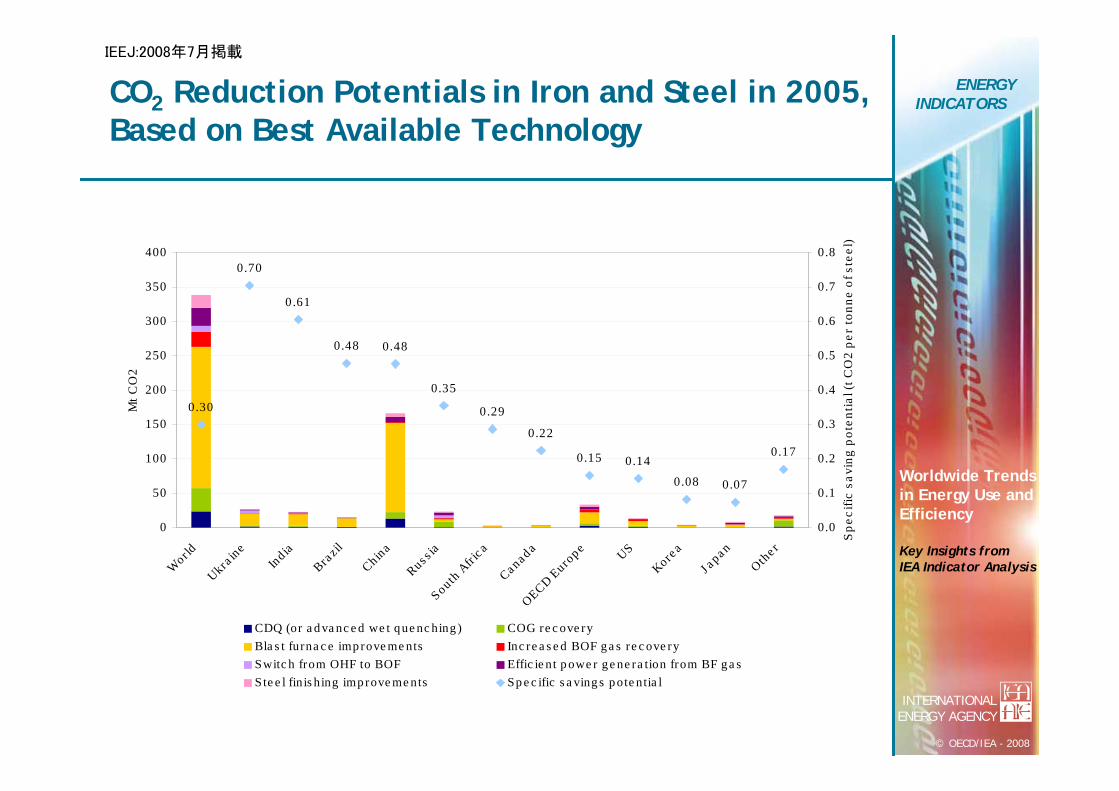
CO2 Reduction Potentials in Iron and Steel in 2005, Based on Best Available Technology
0.30
0.70
0.61
0.48 0.48
0.35
0.29
0.22
0.15 0.14
0.08 0.07
0.17
0
50
100
150
200
250
300
350
400
World
Ukraine
Ind ia
Brazil
China
Rus s iaSouth
Afr i
c a
CanadaOECD Euro
pe US
Korea
J a pa n
Othe r
Mt C
O2
0 .0
0.1
0.2
0.3
0.4
0.5
0.6
0.7
0.8
Spe
cific
sav
ing
pote
ntia
l (t C
O2
per
tonn
e of
ste
el)
CDQ (or a d va nc e d we t q ue nc hing ) COG re c ove ryBla s t furna c e imp rove me nts Inc re a s e d BOF g a s re c ove rySwitc h from OHF to BOF Effic ie nt p owe r g e ne ra tion from BF g a sS te e l fin is hing imp rove me nts Sp e c ific s a ving s p ote ntia l
IEEJ:2008年7月掲載
INTERNATIONALENERGY AGENCY
Worldwide Trendsin Energy Use and Efficiency
Key Insights fromIEA Indicator Analysis
ENERGYINDICATORS
© OECD/IEA - 2008
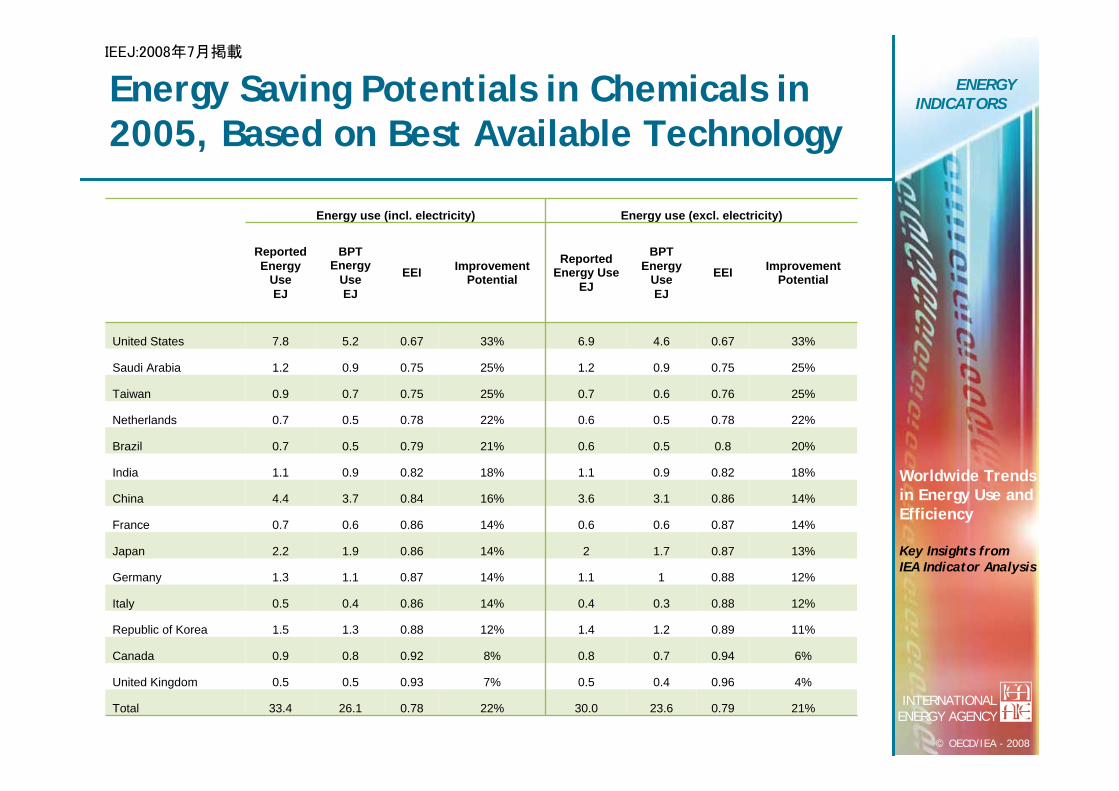
Energy Saving Potentials in Chemicals in 2005, Based on Best Available Technology
Energy use (incl. electricity) Energy use (excl. electricity)
Reported Energy
UseEJ
BPT Energy
Use EJ
EEI Improvement Potential
Reported Energy Use
EJ
BPT Energy
UseEJ
EEI Improvement Potential
United States 7.8 5.2 0.67 33% 6.9 4.6 0.67 33%
Saudi Arabia 1.2 0.9 0.75 25% 1.2 0.9 0.75 25%
Taiwan 0.9 0.7 0.75 25% 0.7 0.6 0.76 25%
Netherlands 0.7 0.5 0.78 22% 0.6 0.5 0.78 22%
Brazil 0.7 0.5 0.79 21% 0.6 0.5 0.8 20%
India 1.1 0.9 0.82 18% 1.1 0.9 0.82 18%
China 4.4 3.7 0.84 16% 3.6 3.1 0.86 14%
France 0.7 0.6 0.86 14% 0.6 0.6 0.87 14%
Japan 2.2 1.9 0.86 14% 2 1.7 0.87 13%
Germany 1.3 1.1 0.87 14% 1.1 1 0.88 12%
Italy 0.5 0.4 0.86 14% 0.4 0.3 0.88 12%
Republic of Korea 1.5 1.3 0.88 12% 1.4 1.2 0.89 11%
Canada 0.9 0.8 0.92 8% 0.8 0.7 0.94 6%
United Kingdom 0.5 0.5 0.93 7% 0.5 0.4 0.96 4%
Total 33.4 26.1 0.78 22% 30.0 23.6 0.79 21%
IEEJ:2008年7月掲載
INTERNATIONALENERGY AGENCY
Worldwide Trendsin Energy Use and Efficiency
Key Insights fromIEA Indicator Analysis
ENERGYINDICATORS
© OECD/IEA - 2008
Power Generation – New indicators
Look at supply-side efficiencyGood IEA statistics availableCalculate efficiencies by fossil fuel and aggregate for key countries / regionsIssues around the treatment of CHPCalculate savings potentials based on
Best country average by fuel (low case)Best practice for new plant (high case)
IEEJ:2008年7月掲載

INTERNATIONALENERGY AGENCY
Worldwide Trendsin Energy Use and Efficiency
Key Insights fromIEA Indicator Analysis
ENERGYINDICATORS
© OECD/IEA - 2008
Efficiency of Power Production from Fossil Fuels in Public Electricity and CHP Plants
0%
5%
10 %
15 %
20 %
25 %
30 %
35 %
40 %
45 %
Eff
icie
ncy
of e
lect
rici
ty p
rodu
ctio
n
Ave r a ge 2001-2005 1990
IEEJ:2008年7月掲載

INTERNATIONALENERGY AGENCY
Worldwide Trendsin Energy Use and Efficiency
Key Insights fromIEA Indicator Analysis
ENERGYINDICATORS
© OECD/IEA - 2008
Technical Fuel and CO2 Savings Potentials in 2005 from Improved Efficiency
0
5
10
15
20
25
30
Low Hig h Low Hig h Low Hig h Low Hig h Low Hig h Low Hig h
OECD Non-OECD World OECD Non-OECD World
EJ
0 .0
0.5
1.0
1.5
2.0
2.5
3.0
Gt C
O2
Coa l Oil Na tura l g a s
Fue l Sa ving s CO2 Sa ving s
IEEJ:2008年7月掲載
INTERNATIONALENERGY AGENCY
Worldwide Trendsin Energy Use and Efficiency
Key Insights fromIEA Indicator Analysis
ENERGYINDICATORS
© OECD/IEA - 2008
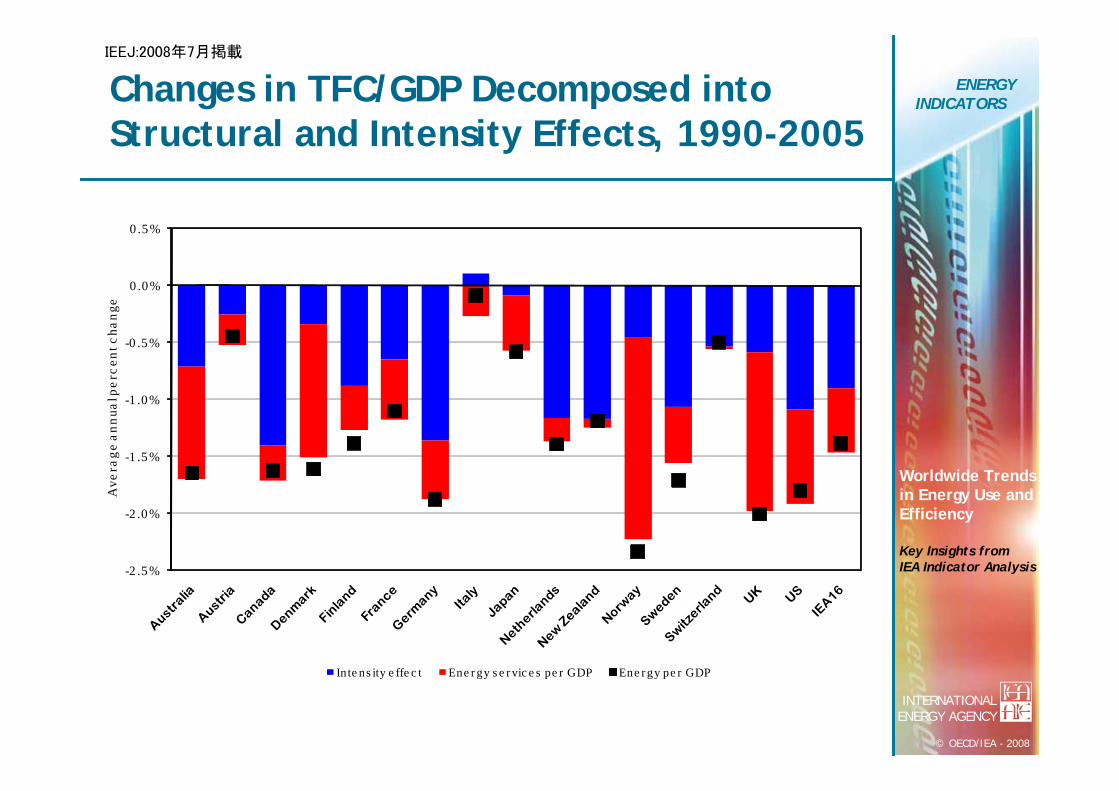
Changes in TFC/GDP Decomposed into Structural and Intensity Effects, 1990-2005
-2 .5%
-2 .0%
-1 .5%
-1 .0%
-0 .5%
0.0%
0.5%
Ave
rage
ann
ual p
erce
nt c
hang
e
In te ns ity e ffe c t Ene r gy s e r vic e s pe r GDP Ene r gy pe r GDP
IEEJ:2008年7月掲載

INTERNATIONALENERGY AGENCY
Worldwide Trendsin Energy Use and Efficiency
Key Insights fromIEA Indicator Analysis
ENERGYINDICATORS
© OECD/IEA - 2008
Long-Term Energy Savings from Improvements in Energy Efficiency, IEA11
0.5%
0.9%
2.0%
0.8%
0%
1%
2%
1973-1990 1990-2005
Ave
rage
ann
ual p
erce
nt c
hang
e
0
20
40
60
80
100
120
140
160
180
1973 2005
EJ
Ac tua l e ne rgy us e Ene rg y s a vings d ue to e ne rg y e ffic ie nc y imp rove me nts Ene rg y e ffic ie nc y imp rove me nts
58%
Ac tua l e ne rg y us e
Hyp othe tic a l e ne rg y us e without e ne rg y e ffic ie nc y improve me nts
Sa ving s
1980 1990 2000
IEEJ:2008年7月掲載

INTERNATIONALENERGY AGENCY
Worldwide Trendsin Energy Use and Efficiency
Key Insights fromIEA Indicator Analysis
ENERGYINDICATORS
© OECD/IEA - 2008
Key Conclusions and Policy Messages
Indicators are a powerful tool for analysing trends in energy use and CO2 emissions, and calculating potentials for further savingsResults show the important role of energy efficiency in shaping patterns of energy use and CO2 emissions in IEA countries, but gains are often offset by other factorsLarge potential for further energy and CO2 savings in many industries and power generation (and other sectors)CO2 emissions growth can and must be decoupled from economic growth, but will require strong policy-action from GovernmentsUrgent need for governments to enhance framework for monitoring end-use energy consumption and address the gaps in available statistical data
IEEJ:2008年7月掲載
INTERNATIONALENERGY AGENCY
Worldwide Trendsin Energy Use and Efficiency
Key Insights fromIEA Indicator Analysis
ENERGYINDICATORS
© OECD/IEA - 2008
Thank you !
www.iea.org/Textbase/Papers/2008/Indicators_2008.pdf
IEEJ:2008年7月掲載