yum cha 飲 茶 - 中國銀河國際金融控股有限公司 · yum cha 飲 茶 november 13, ......
TRANSCRIPT

1
Yum Cha 飲 茶 November 13, 2017
TALKING POINT - HSI QUARTERLY RESUFFLE
Source: Bloomberg
INDICES Closing DoD%
Hang Seng Index 29,120.9 (0.1)
HSCEI 11,745.8 0.0
Shanghai COMP 3,423.7 0.1
Shenzhen COMP 2,039.2 0.5
Gold 1,275.5 (0.8)
BDIY 1,464.0 (1.1)
Crude Oil, WTI(US$/BBL) 56.7 (0.8)
Crude Oil, BRENT(US$/BBL) 63.7 0.3
HIBOR, 3-M 1.0 (1.6)
SHIBOR, 3-M 4.5 0.4
RMB/USD 6.6 0.0
Last Friday, Hang Seng Indexes Company Limited announced that Country Garden (2007.HK)
and Sunny Optical (2382.HK) will be included in the Hang Seng Index while Cathay Pacific
(0293.HK) and Kunlun Energy (0135.HK) will be removed. The changes will become effective on
December 4. Sunny Optical and Country Garden will have a weighting of 1.01% and 0.99%,
respectively. Based on the scale of index funds and MPFs tracking HSI, we estimate there will
be fund inflow of HK$4.04bn and HK$3.96bn flowing into Sunny Optical and Country Garden,
respectively. The potential fund inflow represents 4.2x and 6.6x of their 3-month average daily
turnover. Regarding Cathay Pacific and Kunlun Energy, we estimate the potential disposal is
equivalent to 6.3x and 10.4x of their 3-month average daily turnover, respectively.
In addition, FIT Hong Teng (6088.HK) will be included in the Stock Connect eligible list while
ZhongAn Insurance (6060.HK) will be included in the Hang Seng Mid-Cap Index. It suggests the
latter will also be included into the Stock Connect universe in a foreseeable future.
DATA RELEASES DUE THIS WEEK
Nov 13 Retail Sales YoY
Nov 13 Fixed Assets Ex Rural YTD YoY
Nov 13 Industrial Production YoY
Nov 17 China October Property Prices
RESEARCH NOTES
AAC [2018.HK; HK$169.4; NOT-RATED] - Despite slightly lower-than-expected Q3 results, we
remain optimistic about AAC, as we believe that concerns about the impact of lower-than-
expected sales of iPhone 8 & iPhone 8 plus and the growth outlook are fading, and that the
market is focusing more on AAC’s development of the optics business. We believe the market is
likely to re-rate AAC if the Company has a major breakthrough in lens technology, which has
advantages over traditional technology. We maintain the view that for handset component
makers, investors are sticking with leading high-end component manufacturers due to a) more
stable performance in terms of profitability, b) smartphone specification upgrades by both Apple
and Chinese brands, and c) strong R&D capability. Based on our estimation, AAC is now trading
at 34.9X 2017 PER and 26.2x 2018 PER, which doesn’t look particularly expensive compared
with other leading handset component makers, especially optical names trading at higher
valuations. AAC shares are expected to perform well given increasing attention to WLG and the
continuous growth of its non-optics business.
RAZER [1337.HK; NOT-RATED] - Razer Inc. (Razer) is a global eSport equipment provider,
which offers an integrated portfolio of gaming hardware, software and services. Razer’s IPO
price has been set at HK$3.88, which is close to the high end of the range. Based on the IPO
price, Razer’s market cap will be US$4,409m, making it a sizable name in the hardware TMT
segment. The response to Razer’s IPO is hot and the trading of shares of Razer will start today.
Razer’s post-IPO share price performance is expected to be strong, as the market should treat
Razer as a proxy for the fast-growing eSports industry. However, hardware is just part of the
ecosystem, and it will take time for Razer to build up an ecosystem under its own brand. Razer
has sufficient financial resources to expand its business, but it will take time to realize the
benefits. Before comparing Razer to its peers in the ecosystem, we suggest investors take a
wait-and-see approach and evaluate Razer’s transformation.
WEEKLY SHORT SELLING ANALYSIS - Last Friday the HKSFC released the aggregate short
positions data for November 3. We analysed which companies may be vulnerable to short-
selling activity, based on the following three criteria: (i) the net change in short positions between
October 27 and November 3; (ii) short positions as a percentage of free float; and (iii) the
absolute amount of short positions. We must emphasize this is only an objective quantitative
analysis based on official data; the analysis does NOT imply that we feel uncomfortable with the
corporate governance or fundamentals of some companies. According to the results of our
analysis, we believe CPMC (0906.HK), Cowell (1415.HK) and Shanghai Pharm (2607.HK)
require close monitoring, based on their latest short positions outstanding. On the other hand,
we note that short positions in ASM Pacific (0522.HK) have dropped significantly.
Analyst: Wong Chi-man, CFA

2
RESEARCH NOTES
CHINA CEMENT WEEKLY - TCCI (1136.HK) announced that the Company will be delisted from the HKEx on November
20, which suggests the privatization plan is close to completion. As SINOMA (1893.HK) will be merged with CNBM soon,
there are a limited number of potential M&A targets on the main board. Currently, Asia Cement (0743.HK) is still trading at a
very low valuation of 0.37x PBR. Meanwhile, West China Cement (2233.HK) may not look very cheap at 0.86x PBR, but
since the current price of HK$1.18 is still far below the previous offer price of HK$1.69 from Conch Cement (0914.HK), we
believe investors will continue monitor the Company closely.
SNIPPETS
China Battery Makers. CATL, a leading li-ion battery maker in China, posted its draft prospectus on the CSRC website last
week (link: http://www.csrc.gov.cn/pub/zjhpublic/G00306202/201711/t20171110_326814.htm). In our view, this is one of the
long-awaited IPOs in the A-share market, given the Company’s size and position in China’s li-ion battery and EV supply
chain. According to industry news flow, CATL plans to raise RMB13.12bn from the IPO and the market cap will be
RMB130bn. CATL achieved turnover of RMB867m, RMB5,703m and RMB14,879m in 2014, 2015 and 2016, respectively.
Its net profit in 2014, 2015 and 2016 was RMB55.6m, RMB951m and RMB3,089m, respectively. According to the draft
prospectus, CATL also has projects with overseas automakers such as BMW and VW. CATL achieved sales volume of
2.19GWh and 6.8GWh in 2015 and 2016. We believe that it may take sometime for CATL to complete the IPO process.
However, its listing is a major event in the industry, and it may attract market attention to the sector, including its HK-listed
peers, such as BYD [1211.HK], Tianneng Power [0819.HK], Xinyi HK [8328.HK] and Coslight [1043.HK].
CHINA RAILWAY SECTOR - Based on the latest news flow, the China Railway Corporation (CRC) made tenders for 50 16-
car high-speed train sets, the“ Fuxing Hao" on 10 November. The week before, the CRC made tenders for 75 8-car high-
speed train sets. In total, it made tenders for 200 8-car equivalent high-speed train sets in November, which was above
market expectations of CRC issuing tenders for 104 sets of high-speed trains in Q4 2017. This is another position news to
the railway equipment sector, especially to CRRC (1766 HK) after its strong Q3 2017 results. We think this news should be
positive to the railway equipment sector. As we highlighted in our latest CRRC (1766 HK; BUY) company report, the MU
demand growth is to recover from 2018 onwards, led by both accelerated railway reform and increases in new line additions
in 2018. The share prices of CRRC (1766 HK), CRRC Times Electric (3898 HK; HOLD) and CRSC (3969 HK; BUY) should
react positively to this news in the near term.

COMPANY NEWS
Analyst: Mark Po
AAC Technologies Holdings Inc. [2018.HK; HK$169.4; Not Rated] -
Q3 results and management guidance to clear up market concerns. Optics business development will trigger a further re-rating.
Market Cap: US$26,532m; Free Float: 59.4%; 3-months Average Daily Turnover: US$87.8m
The Company. AAC Technologies Holdings Inc. (AAC) designs, develops and
manufactures a broad range of miniaturized components, including speakers,
receivers and microphones in the acoustics segment, for mobile devices, such as
smartphones, tablets, wearables, ultrabooks, notebooks and electronic book-
readers.
AAC’s Q3 2017 turnover rose 26.6% YoY or 20.2% QoQ to RMB5,323.6m, from
RMB4,205.7m in Q3 2016 and RMB4,429.2m in Q2 2017. The Company’s net
profit increased 24.1% YoY and 28.2% QoQ, from RMB1,100.3m in Q3 2016 and
RMB1,065.3m in Q2 2017 to RMB1,365.7m in Q3 2017. AAC’s acoustic sales
grew 17% YoY to RMB2,522.5m in Q3 2017 and accounted for 47% of total sales.
Non-acoustic sales reported YoY growth of 29% to RMB2,395.6m in Q3 2017,
accounting for over 45% of total turnover in Q3 2017. AAC achieved gross and net
margins of 41.3% and 25.7%, increasing 1.0ppt QoQ and 1.6ppt QoQ,
respectively. AAC’s plastics lens shipments reached its planned capacity of 10m
per month, and the Company’s hybrid lens solutions were welcomed by the
market. Q3 is traditionally the high season, and AAC’s Q3 2017 was packed with
new flagship smartphone launches across different major brand names. Due to
product mix improvement and strong growth in shipments of its major products,
AAC has largely outperformed the overall smartphone market.
During the Q3 2017 results conference call, the most discussed topic was the
optics business. AAC management explained further its lens business roadmap,
strategy and capacity plan, which in our view, should deliver a very clear picture to
the market. AAC’s lens operations will focus mainly on hybrid lens solution (5P+1G
at this stage), which is based on wafer level glass (WLG) and is different from
wafer level optics (WLO). The aspheric surfaces for WLO and WLG are processed
by epoxy and molding, respectively. WLO uses special glue to reverse print onto
glass using a mask. WLG uses molding techniques to get the aspheric surface on
2”/4” wafer glass. A 2” wafer glass can produce 30-40 lenses and a 4” wafer glass
can produce at least 100 lenses, so WLO is easier to scale up production and to
maintain a high yield rate. AAC invested in both Kaleido and Haptegon (sold to
ams later), so the Company has good knowledge/understanding of both WLG and
WLO. According to AAC management, WLG can replace WLO in 3D sensing
transceivers, given its high heat resistance. AAC management highlighted that two
reasons for the slow adoption of hybrid lens solution as glass lens by molding
glass process are that it is expensive and requires a long processing time. For
WLG, in the mass production process, one machine can produce 45 lenses and
AAC now has 10 machines. AAC’s WLG tooling production is based in Europe and
AAC will establish a center in Singapore for WLG tooling mass production. The
center in Singapore will be managed by Kaleido’s European management team.
AAC’s plastic lens monthly capacity is 10m units at this stage and 90% are 5P; 4P
& 6P account for a small portion. AAC management mentioned that the Company
will have plastic lens capacity of 20m and 30m units by Q1 2018 and 1H 2018,
respectively. Regarding hybrid lens sets (WLG + plastic lenses), AAC aims to
achieve monthly capacity of 5-10m in 2H 2018 vs 3-5m units/month in 1H 2018.
AAC’s hybrid lens sets will used for 3D sensing collimator lenses and front and
rear imaging camera lenses. According to AAC management, the Company’s
hybrid lens solution will have advantages such as higher temperature resistance,
larger aperture, and colour adjustment at a reasonable cost. AAC is working with a
customer on a 5G + 1P hybrid lens solution. The Company has a strong patent
portfolio and has no concerns about any patent infringement issues. The ASP of
hybrid lens sets will be least US$2, in line with previous guidance, and the optics
operations will account for a single digit of total turnover in 2018. But as discussed
in the Q2 2017 results conference call, given the industry development trend, the
optics business is expected to become the largest business segment among its
product offerings in the longer term (7-8 years).
AAC management reiterated that the Company’s turnover growth is expected to be
over 25% YoY in 2018. Capex for 2017 has been raised by 17.8% to RMB5.3bn,
of which 45% will be used for non-acoustics (mainly optical lenses), 35% for
November 13, 2017
Source: Bloomberg, Company Data, CGIS Research
[AAC Technologies Holdings Inc. ]
acoustics and 25% for infrastructure investment.
Regarding the RF mechanics segment, casing capacity is 4m units per
month, which will be stable. AAC has completed monthly capacity of 1m
units of 3D glass and aims to build monthly capacity of 2-2.5m units by Q1
2018. AAC expects stable orders in casing and 3D glass casing shipments
to ramp up by Apr or May 2018. AAC’s speaker box products will penetrate
the mid-end Android market. Adoption of its stereo and waterproof design is
better than expected. The Company’s “New structure” shipments are
welcomed by customers, and shipments are expected to increase from
100m units to 150m in 2018.
Our view. Despite slightly lower-than-expected Q3 results, we remain
optimistic about AAC, as we believe that concerns about the impact of lower
-than-expected sales of iPhone 8 & iPhone 8 plus and the growth outlook
are fading, and that the market is focusing more on AAC’s development of
the optics business. We believe the market is likely to re-rate AAC if the
Company has a major breakthrough in lens technology, which has
advantages over traditional technology. We maintain the view that for
handset component makers, investors are sticking with leading high-end
component manufacturers due to a) more stable performance in terms of
profitability, b) smartphone specification upgrades by both Apple and
Chinese brands, and c) strong R&D capability. Based on our estimation,
AAC is now trading at 34.9X 2017 PER and 26.2x 2018 PER, which doesn’t
look particularly expensive compared with other leading handset component
makers, especially optical names trading at higher valuations. AAC shares
are expected to perform well given increasing attention to WLG and the
continuous growth of its non-optics business.
Catalysts. Q4 2017 results; securing orders for hybrid lens solution from a
leading Chinese customer; higher-than-expected iPhone shipments; and
more details on its optics business development.
0
1000
2000
3000
4000
5000
6000
0
50
100
150
200
Nov16 Jan17 Mar17 May17 Jul17 Sep17
(HK$ million)(HK$)
Turnover (RHS) Price (LHS)
Key Financials
(in RMB m)2014 2015 2016 2017E 2018E
Revenue 8,879.3 11,738.9 15,506.8 20,499.6 27,067.4
Change (yoy %) 9.7 32.2 32.1 32.2 32.0
Gross Profit 3,678.0 4,872.1 6,442.5 8,449.7 10,968.1
Gross Margin % 41.4 41.5 41.5 41.2 40.5
Net Profit 2,317.7 3,106.9 4,025.7 5,294.9 7,044.4
Net Margin % 26.1 26.5 26.0 25.8 26.0
EPS (Basic) 1.89 2.53 3.28 4.31 5.74
DPS $0.962 $1.200 $1.470 $1.694 $2.149
ROE (%) 27.2 30.4 31.6 32.9 34.1
Dividend Yield (%) 0.64 0.80 0.98 1.13 1.43
PER (x) 79.7 59.5 45.9 34.9 26.2
PBR (x) 20.2 16.3 13.0 10.3 7.9
FCF Yield (%) 0.05% 0.73% 0.97% 0.57% 1.88%
Capex (m) 373.4 833.6 1,059.0 1,412.4 1,712.4
Free cash flow per share 0.1 1.2 1.6 1.0 3.2
Net Gearing (%) Net Cash Net Cash 0.8 8.6 2.5

Figure 1: AAC’s PER trend
Sources: Bloomberg, CGIS Research estimates
Figure 2: AAC’s turnover breakdown
Sources: Bloomberg, CGIS Research estimates
0
20
40
60
80
100
120
140
160
180
200
Oct-09
Feb-10
May-10
Aug-10
Nov-10
Mar-11
Jun-11
Sep-11
Dec-11
Apr-12
Jul-12
Oct-12
Jan-13
May-13
Aug-13
Nov-13
Mar-14
Jun-14
Sep-14
Dec-14
Apr-15
Jul-15
Oct-15
Jan-16
May-16
Aug-16
Nov-16
Feb-17
Jun-17
Sep-17
HKD
28x
23x
17x
12x
7x
2008 2009 2010 2011 2013 2014 2015 2016 2017F 2018F
Turnover (Rmbm)
Dynamic components 1,815.7 2,849.1 3,687.5 5,826.1 7,582.1 6,858.5 7,159.1 8,491.1 10,506.9 12,512.7
Non-accoustic 0.0 0.0 0.0 0.0 0.0 1,834.0 4,447.5 6,940.2 9,762.0 13,375.0
Others 165.7 267.0 252.8 387.0 446.6 186.9 132.3 75.4 86.8 99.8
Optics 0.0 0.0 0.0 0.0 0.0 0.0 0.0 0.0 144.0 1,080.0
YoY Change (%)
Dynamic components 56.9 29.4 58.0 30.1 (9.5) 4.4 18.6 23.7 19.1
Non-accoustic n.a. n.a. n.a. n.a. n.a. 142.5 56.0 40.7 37.0
Others 61.2 (5.3) 53.0 15.4 (58.2) (29.2) (43.0) 15.1 14.9
Optics n.a. n.a. n.a. n.a. n.a. n.a. n.a. n.a. 650.0
Gross margin (%) 41.7 44.9 45.1 44.2 42.7 41.4 41.5 41.5 41.2 40.5
Net margin (%) 38.3 35.0 32.0 29.6 29.6 26.1 26.5 26.0 25.8 26.0
Cost (Rmbm)
S,G&A (99.9) (184.1) (236.9) (464.2) (530.7) (536.6) (803.2) (763.3) (988.2) (1,087.9)
R&D Expenses (123.42) (159.11) (213.64) (358.24) (461.57) (552.64) (656.18) (858.97) (1,165.67) (1,540.99)
Financial Expenses (0.1) (0.8) (8.7) (19.2) (16.9) (16.5) (13.7) (22.0) (66.8) (173.9)
YoY Change (%)
S,G&A 84.4 28.7 95.9 14.3 1.1 49.7 (5.0) 29.5 10.1
R&D Expenses 28.9 34.3 67.7 28.8 19.7 18.7 30.9 35.7 32.2
Financial Expenses 684.5 1,040.9 120.8 (11.7) (2.7) (16.9) 60.3 204.4 160.3

Figure 3: Peer comparison
Sources: Bloomberg, CGIS Research estimates
Ticker Company
Price Market Cap 2017F 2018F 2019F 2017F 2018F 2019F 2016 2017F 2016 2017F 2016 2017F 2016 2017F 1M 3M 6M 12M YTD 1D
Lcy US$m x x x x x x x x % % % % % % % % % % % %
HK listed names
2878 HK Solomon Systech (Intl) Ltd 0.41 130 n.a. n.a. n.a. n.a. n.a. n.a. 1.4 n.a. -6.6 n.a. -5.3 n.a. 0.0 n.a. 3.8 22.4 12.3 18.8 22.4 -4.7
1385 HK Shanghai Fudan Microelect-H 8.09 684 n.a. n.a. n.a. n.a. n.a. n.a. 3.2 n.a. 19.1 n.a. 13.7 n.a. 0.0 n.a. 28.4 57.1 36.0 24.5 38.3 -1.2
85 HK China Electronics Huada Tech 1.73 450 n.a. n.a. n.a. n.a. n.a. n.a. 2.0 n.a. 68.4 n.a. 3.1 n.a. 1.7 n.a. 13.1 57.3 20.1 -5.5 10.9 4.2
1679 HK Risecomm Group Holdings Ltd 3.11 323 n.a. n.a. n.a. n.a. n.a. n.a. n.a. n.a. 24.9 n.a. 15.1 n.a. n.a. n.a. 37.0 -0.3 n.a. n.a. n.a. -1.6
981 HK Semiconductor Manufacturing 13.84 8,269 47.9 34.8 14.8 9.9 8.1 7.0 1.8 1.9 9.6 3.9 3.3 1.6 0.0 0.0 39.4 86.3 47.7 23.6 13.6 -2.3
3355 HK Advanced Semiconductor Man-H 1.23 242 n.a. n.a. n.a. n.a. n.a. n.a. 1.6 n.a. 3.4 n.a. 6.0 n.a. 0.0 n.a. -2.4 41.4 51.9 98.4 92.2 -3.1
1347 HK Hua Hong Semiconductor Ltd 15.86 2,104 15.3 13.6 12.3 7.6 6.4 5.8 1.3 1.2 8.6 8.7 7.3 7.1 0.0 1.8 42.4 51.0 46.9 71.5 83.1 6.6
522 HK Asm Pacific Technology 124.90 6,532 18.9 18.7 16.9 13.3 12.7 11.5 4.9 4.7 17.2 27.8 15.0 17.2 1.8 2.3 8.9 27.0 2.1 64.8 52.0 5.8
2018 HK Aac Technologies Holdings In 169.40 26,533 34.9 26.2 n.a. 25.0 19.1 n.a. 13.0 10.3 31.6 32.9 22.7 20.8 1.0 1.1 26.2 52.8 52.6 133.8 140.5 3.9
2382 HK Sunny Optical Tech 140.60 19,769 49.6 34.6 25.9 38.0 26.4 20.6 23.0 18.6 29.1 42.8 18.8 19.4 0.5 0.5 9.3 39.2 109.9 256.4 314.1 0.8
1415 HK Cowell E Holdings Inc 3.71 395 8.1 6.6 6.3 4.5 3.9 3.8 1.3 1.1 9.8 15.3 8.7 8.7 2.6 2.9 3.1 -2.1 53.3 62.7 90.3 -1.6
1478 HK Q Technology Group Co Ltd 18.30 2,570 34.1 22.8 17.7 23.5 16.4 13.1 9.8 8.4 13.7 27.0 9.1 9.6 0.2 0.5 11.0 39.3 167.9 354.1 357.5 -3.1
732 HK Truly International Holdings 3.85 1,540 35.3 13.1 9.1 8.3 6.2 5.1 1.6 1.6 8.4 4.5 -0.2 0.8 1.3 1.2 19.2 54.0 48.6 18.5 27.5 0.0
710 HK Varitronix International Ltd 6.78 639 n.a. n.a. n.a. n.a. n.a. n.a. 1.8 n.a. 2.2 n.a. 2.0 n.a. 0.4 n.a. 54.1 67.0 55.1 118.0 109.3 -3.8
334 HK Tcl Display Technology Holdi 1.25 334 14.5 10.6 9.4 10.7 7.9 6.5 5.4 4.5 38.5 31.4 8.6 5.9 0.0 2.2 17.9 17.9 10.6 66.7 73.6 -1.6
877 HK O-Net Technologies Group Ltd 5.56 569 20.3 14.7 11.6 12.4 10.0 n.a. 2.5 2.4 9.5 13.2 6.6 8.2 0.0 0.4 -11.6 14.9 10.8 30.5 53.6 0.4
259 HK Yeebo International Hldgs 3.73 478 n.a. n.a. n.a. n.a. n.a. n.a. 2.4 n.a. 16.1 n.a. 24.3 n.a. 1.6 n.a. -3.4 -9.0 -6.0 28.6 -17.5 -4.4
1979 HK Ten Pao Group Holdings Ltd 1.82 233 8.4 6.4 5.2 5.3 4.1 3.5 4.0 2.9 49.8 42.1 13.6 14.9 3.0 3.6 -35.0 -24.8 -4.7 11.7 29.1 -0.5
3336 HK Ju Teng International Hldgs 2.63 387 6.1 5.7 4.9 4.2 3.8 3.5 0.4 0.4 7.8 7.6 2.5 2.8 3.8 3.7 -11.7 -16.0 -9.9 8.2 9.6 1.2
285 HK Byd Electronic Intl Co Ltd 22.95 6,628 16.3 13.6 12.0 8.8 7.7 7.0 3.4 3.1 11.1 20.1 9.1 10.7 3.4 1.1 -8.2 15.3 70.8 217.9 276.2 3.6
698 HK Tongda Group Holdings Ltd 2.19 1,699 12.2 9.4 7.7 9.0 7.2 5.9 2.7 2.4 23.0 20.9 8.8 10.1 2.2 2.5 -0.9 8.4 -28.9 0.0 9.5 0.9
6088 HK Fit Hon Teng Ltd 4.79 4,134 19.2 15.0 13.1 8.9 7.6 6.9 n.a. 2.1 13.6 13.8 6.9 7.1 n.a. 2.0 -16.7 3.7 n.a. n.a. n.a. -3.8
Average 22.6 16.3 12.5 12.6 9.8 8.3 4.3 4.3 18.6 20.8 9.1 9.7 1.2 1.7 10.2 27.4 37.4 80.2 89.3 -0.2
A share listed names
300433 CH Lens Technology Co Ltd-A 38.11 15,026 46.1 30.2 24.0 26.9 20.1 17.1 6.8 6.0 9.9 14.1 4.8 8.7 n.a. 0.3 34.2 21.3 32.4 66.1 65.6 5.6
300136 CH Shenzhen Sunway Communicat-A 55.26 8,180 53.2 34.2 25.2 48.7 30.3 21.9 20.7 18.4 32.1 38.0 24.0 27.6 n.a. 0.1 32.2 52.2 56.2 121.9 93.9 2.9
300408 CH Chaozhou Three-Circle Grou-A 22.28 5,798 30.7 22.7 16.3 25.4 16.6 11.1 7.0 6.6 22.6 20.5 16.2 18.5 n.a. 1.0 -10.5 7.9 3.8 25.2 40.3 -0.9
300115 CH Shenzhen Everwin Precision-A 30.14 4,100 30.3 20.1 14.5 19.0 14.0 10.1 6.2 5.8 18.7 19.6 8.8 12.5 n.a. 0.6 -6.3 -7.9 5.4 6.2 15.7 3.1
002456 CH Shenzhen O-Film Tech Co-A 24.41 9,982 44.5 29.8 23.4 29.8 21.7 18.0 7.4 6.7 10.2 16.1 4.4 5.4 n.a. 0.3 13.4 28.5 57.1 54.1 78.0 2.1
002241 CH Goertek Inc -A 22.05 10,777 30.9 24.6 21.2 19.9 16.0 14.0 5.0 5.4 16.3 18.8 8.1 10.3 n.a. 0.5 11.6 11.9 25.7 45.3 66.3 4.7
002273 CH Zhejiang Crystal-Optech -A 30.51 3,046 52.2 35.1 24.6 n.a. n.a. n.a. 6.4 6.2 9.1 11.8 10.3 9.9 n.a. 0.3 16.9 32.7 43.7 32.1 53.3 7.1
300083 CH Janus Dongguan Precision-A 8.96 1,932 19.9 13.7 10.6 14.6 9.9 7.6 2.4 2.2 2.6 11.4 3.9 6.6 n.a. 0.7 -0.8 -1.9 4.7 6.7 21.9 -0.1
002475 CH Luxshare Precision Industr-A 25.77 12,315 44.5 31.9 25.2 31.2 23.6 18.5 6.7 6.2 13.8 14.6 7.0 8.2 n.a. 0.4 27.3 27.1 39.0 80.6 86.3 2.8
300207 CH Sunwoda Electronic Co Ltd-A 12.51 2,434 26.4 20.0 16.6 21.8 17.1 13.6 6.1 5.4 22.1 22.9 5.3 6.3 n.a. 1.2 1.1 11.0 2.4 -14.3 -10.0 1.1
000725 CH Boe Technology Group Co Lt-A 6.50 33,866 27.7 23.1 19.1 10.6 9.1 7.8 2.7 2.6 2.4 10.0 4.0 4.9 n.a. 0.6 35.1 76.2 70.6 134.7 127.3 -0.3
300207 CH Sunwoda Electronic Co Ltd-A 12.51 2,434 26.4 20.0 16.6 21.8 17.1 13.6 6.1 5.4 22.1 22.9 5.3 6.3 n.a. 1.2 1.1 11.0 2.4 -14.3 -10.0 1.1
603160 CH Shenzhen Huiding Technolog-A 110.57 7,565 51.0 45.6 39.2 45.5 40.7 35.0 18.0 13.9 43.9 30.9 37.2 31.4 0.4 0.5 16.6 24.0 20.2 -28.9 7.6 -3.8
002008 CH Han'S Laser Technology In-A 57.19 9,191 36.7 30.9 25.1 28.7 25.8 21.0 8.9 9.3 15.0 27.1 12.9 13.8 n.a. 0.8 33.6 62.5 84.1 141.8 153.1 3.2
002185 CH Tianshui Huatian Technolog-A 9.05 2,905 36.8 28.4 21.9 16.3 12.6 10.2 3.7 3.5 8.2 10.1 6.0 7.1 n.a. 0.4 5.6 32.5 41.1 42.0 49.8 1.3
603690 CH Pnc Process Systems Co Ltd-A 26.66 845 90.4 58.6 40.8 58.7 38.1 25.4 14.2 10.3 16.7 12.3 8.1 6.3 n.a. 0.1 21.3 78.6 49.9 n.a. n.a. 10.0
300162 CH Ledman Optoelectronic Co-A 9.11 480 n.a. n.a. n.a. n.a. n.a. n.a. 3.3 n.a. 2.6 n.a. 0.9 n.a. n.a. n.a. -12.9 -5.8 -21.9 -47.2 -36.3 -1.1
600584 CH Jiangsu Changjiang Electro-A 24.38 4,993 73.7 40.6 27.3 12.1 9.9 8.7 3.6 3.9 2.4 4.8 0.7 1.8 n.a. 0.2 20.8 61.8 47.2 23.8 38.1 5.3
002808 CH Suzhou Goldengreen Technol-A 15.73 455 n.a. n.a. n.a. n.a. n.a. n.a. 5.8 n.a. 10.0 n.a. 8.9 n.a. 0.4 n.a. -8.5 -7.2 -28.3 -58.7 -38.4 -0.2
300604 CH Hangzhou Chang Chuan Techn-A 71.40 819 96.2 69.5 55.7 n.a. n.a. n.a. 18.2 18.2 20.4 18.7 16.7 15.2 0.2 n.a. 38.6 125.9 47.3 n.a. n.a. 3.3
300493 CH Shanghai Fortune Techgroup-A 16.70 755 n.a. n.a. n.a. n.a. n.a. n.a. 10.4 n.a. 10.6 n.a. 6.3 n.a. 0.4 n.a. -2.7 41.0 21.0 -29.1 -13.8 -1.9
603986 CH Gigadevice Semiconductor B-A 163.12 4,980 66.4 44.7 38.5 53.3 34.3 24.0 25.5 18.5 19.1 29.2 13.7 24.2 0.0 0.4 20.0 128.7 61.8 83.3 83.3 0.0
300346 CH Jiangsu Nata Opto-Electron-A 29.31 710 293.1 97.7 58.6 n.a. n.a. n.a. 3.9 n.a. 0.6 n.a. 1.8 n.a. n.a. n.a. -3.3 25.4 8.8 -16.8 -3.7 0.3
Average 53.9 33.3 25.6 25.5 19.2 15.2 8.1 7.5 14.4 18.4 9.5 11.7 0.3 0.6 7.3 24.0 21.8 28.8 33.9 1.0
Taiwan listed names
2330 TT Taiwan Semiconductor Manufac 240.50 206,629 18.2 16.3 14.4 9.2 8.2 7.4 4.4 4.1 25.6 23.3 19.3 17.5 n.a. 3.0 7.1 12.4 17.0 29.6 32.5 -0.2
2303 TT United Microelectronics Corp 15.85 6,630 22.2 22.2 19.1 4.0 3.8 3.8 0.9 0.9 3.8 4.0 2.7 2.1 n.a. 3.2 1.9 13.2 29.4 36.6 39.0 1.0
3034 TT Novatek Microelectronics Cor 118.50 2,389 14.6 13.1 12.2 9.5 8.5 8.0 2.6 2.5 17.7 17.5 12.6 11.8 n.a. 5.9 4.4 7.7 -1.3 9.7 11.3 1.3
5347 TT Vanguard International Semi 59.20 3,215 21.6 18.6 16.7 11.3 10.2 9.4 3.6 3.4 19.7 15.9 14.2 13.2 n.a. 4.8 9.6 10.7 7.8 -1.7 5.3 -0.8
2311 TT Advanced Semiconductor Engr 37.15 10,739 13.5 12.6 11.1 7.0 6.4 6.1 1.7 1.8 13.8 13.4 6.7 6.3 n.a. 4.1 -1.1 -1.8 0.4 3.5 12.7 0.1
2379 TT Realtek Semiconductor Corp 115.50 1,938 16.7 15.1 13.7 8.3 8.0 7.4 2.9 2.5 13.5 15.2 5.5 6.0 n.a. 4.7 6.0 5.0 14.8 11.0 14.3 -0.4
6462 TT Egis Technology Inc 230.50 533 22.9 9.8 7.2 16.9 7.0 5.6 8.7 7.5 7.8 37.2 20.8 22.3 n.a. 1.4 -11.3 -4.0 24.6 -3.2 -13.0 -5.7
3105 TT Win Semiconductors Corp 265.00 3,536 29.9 22.2 19.5 16.2 12.9 11.1 6.2 5.7 17.9 18.6 10.4 12.7 n.a. 1.7 25.9 59.2 113.7 217.4 191.5 1.5
3152 TT Advanced Ceramic X Corp 358.00 819 27.6 22.6 16.7 19.2 15.6 11.8 7.9 7.4 25.6 26.7 25.1 23.2 n.a. 3.1 -7.5 -5.8 15.1 42.9 50.7 5.1
5264 TT Casetek Holdings Ltd 120.00 1,357 17.7 12.9 10.3 5.4 4.3 3.6 1.5 1.4 9.4 7.7 5.2 4.7 n.a. 2.6 20.0 22.1 47.1 46.9 39.7 2.6
2474 TT Catcher Technology Co Ltd 337.50 8,615 11.4 9.2 8.2 4.5 4.1 3.6 2.1 1.9 18.5 17.7 12.3 11.8 n.a. 3.1 2.9 -9.6 2.6 48.7 50.7 2.4
3008 TT Largan Precision Co Ltd 5740.00 25,512 27.5 18.9 15.7 19.6 13.8 11.7 9.1 8.3 32.4 32.9 27.2 26.7 n.a. 1.3 4.6 6.7 16.1 61.9 51.5 -0.3
3673 TT Tpk Holding Co Ltd 86.10 1,160 12.2 10.6 10.3 4.0 4.0 4.1 1.0 1.0 -4.9 8.1 2.3 3.1 n.a. 1.9 -17.2 -27.3 -16.4 69.5 44.7 -3.9
2360 TT Chroma Ate Inc 160.00 2,149 27.1 22.9 20.3 20.6 17.4 15.1 5.8 5.2 17.2 20.6 9.6 12.6 n.a. 2.5 30.1 64.3 66.8 105.1 112.2 0.6
2317 TT Hon Hai Precision Industry 107.50 61,722 12.4 10.5 9.7 7.1 6.2 5.8 1.8 1.6 14.3 13.0 6.5 5.6 n.a. 4.2 0.9 -7.3 3.4 31.9 27.7 -0.9
2454 TT Mediatek Inc 326.00 17,084 28.3 18.9 15.9 22.5 13.3 10.5 2.1 2.0 9.8 7.3 5.6 4.6 n.a. 2.6 12.0 16.4 56.9 47.7 51.5 -1.5
Average 20.2 16.0 13.8 11.6 9.0 7.8 3.9 3.6 15.1 17.4 11.6 11.5 n.a. 3.1 5.5 10.1 24.9 47.4 45.1 0.1
Korean listed names
066570 KS Lg Electronics Inc 94400.00 13,808 9.3 9.6 8.7 5.1 4.7 4.4 1.2 1.2 0.6 13.9 2.4 4.8 n.a. 0.5 16.8 28.1 23.7 102.1 82.9 -1.7
011070 KS Lg Innotek Co Ltd 171000.00 3,617 20.3 12.1 11.1 7.2 5.3 5.0 2.2 2.1 0.3 10.5 2.6 4.5 n.a. 0.2 10.3 4.3 27.1 116.5 93.4 0.6
009150 KS Samsung Electro-Mechanics Co 104500.00 6,977 43.2 20.5 17.4 9.2 6.8 6.2 1.8 1.8 0.3 4.2 0.0 2.7 n.a. 0.5 -2.3 12.9 37.7 117.9 105.7 1.0
005930 KS Samsung Electronics Co Ltd 2820000.00 325,403 9.5 7.9 7.7 4.0 3.4 3.3 1.8 1.8 10.9 20.5 11.4 15.0 n.a. 1.2 6.8 22.9 23.7 71.0 56.5 0.1
000660 KS Sk Hynix Inc 82000.00 53,358 5.5 5.0 5.7 3.1 2.7 2.9 2.1 1.8 13.0 37.1 19.7 29.2 n.a. 1.3 -7.6 27.3 47.5 100.0 83.4 -0.5
091700 KS Partron Co Ltd 8930.00 432 59.7 12.8 10.3 8.8 5.7 5.1 1.5 1.4 6.6 2.5 0.5 2.0 n.a. 2.2 -0.6 3.0 -15.4 -1.5 -13.7 1.5
Average 24.6 11.3 10.1 6.2 4.8 4.5 1.8 1.7 5.3 14.8 6.1 9.7 n.a. 1.0 3.9 16.4 24.1 84.3 68.1 0.2
US & Europe listed names
LITE US Lumentum Holdings Inc 55.45 3,438 16.5 14.3 14.5 11.3 9.1 9.3 5.4 6.1 -0.7 23.3 -9.3 9.5 0.0 n.a. -4.1 4.5 5.0 59.8 43.5 -3.3
OLED US Universal Display Corp 169.60 7,978 73.6 54.8 38.2 48.4 39.2 26.7 12.9 12.0 9.7 18.3 14.8 15.3 0.1 0.1 32.0 53.6 47.5 201.5 201.2 0.5
FNSR US Finisar Corporation 18.28 2,082 12.8 9.7 9.2 5.5 4.7 4.5 1.3 1.2 3.1 9.4 11.5 2.9 0.0 n.a. -16.7 -22.0 -26.9 -37.9 -39.6 -2.4
STM FP Stmicroelectronics Nv 20.20 21,445 26.3 20.3 18.4 13.0 10.5 10.0 4.1 4.1 3.6 15.8 6.2 9.1 3.3 1.0 21.2 40.7 31.2 143.1 87.5 1.1
SOI FP S.O.I.T.E.C. 64.76 2,385 50.9 31.9 23.3 26.7 18.2 14.5 13.2 10.1 n.a. 18.5 2.3 n.a. n.a. 0.0 16.9 29.0 52.3 255.8 120.3 -0.4
VIAV US Viavi Solutions Inc 8.42 1,915 21.7 17.1 18.3 10.3 8.3 n.a. 2.5 2.3 -11.1 6.6 4.5 0.7 0.0 n.a. -11.2 -20.0 -27.0 8.6 2.9 -2.4
AMS SW Ams Ag 96.60 8,211 58.6 23.7 16.6 33.8 15.4 11.4 8.8 7.6 15.3 10.9 0.0 n.a. n.a. 0.3 33.2 42.0 52.1 257.7 236.0 1.1
ASML NA Asml Holding Nv 152.75 76,794 33.7 27.5 22.2 24.5 21.0 18.0 6.4 6.1 16.2 19.3 12.4 n.a. n.a. 0.8 5.9 18.3 24.2 64.1 43.2 -0.5
ASM NA Asm International Nv 60.01 4,356 19.8 16.4 14.0 20.1 17.3 15.2 1.8 1.8 6.8 9.2 13.1 n.a. n.a. 1.2 9.8 20.7 8.2 53.0 40.8 0.5
KLAC US Kla-Tencor Corp 102.40 16,047 14.4 13.8 13.6 10.2 9.5 9.1 11.0 7.8 126.9 65.7 19.3 n.a. 2.2 2.3 -2.0 16.2 1.6 37.4 30.1 -4.4
Average 32.8 22.9 18.8 20.4 15.3 13.2 6.7 5.9 18.9 19.7 7.5 7.5 0.9 0.8 8.5 18.3 16.8 104.3 76.6 -1.0
HSI Index Hang Seng Index 2.2 6.1 16.4 27.5 32.4 -0.1
HSCEI Index Hang Seng China Ent Indx 2.9 8.9 14.8 23.0 25.0 0.0
SHCOMP Index Shanghai Se Composite 1.5 5.2 12.4 8.2 10.6 0.1
MXCN Index Msci China 2.8 12.5 28.6 46.1 52.2 0.7
Share Price PerformancePE EV/EBITDA P/B ROE ROA Div yield
COMPANY NEWS
Analyst: Mark Po, CFA; Tel: (852) 3698 6318; [email protected]; Mark Jiang;Tel:(852)3698 6321; [email protected]
Razer Inc. [1337.HK; HK$3.88; Not Rated] — Metamorphism is a long term process
Market Cap: US$4,409m*; Free Float: 34.5%; 3-month Average Daily Turnover: n.a.
The Company. Razer Inc. (Razer) is a global eSport equipment provider, which offers
an integrated portfolio of gaming hardware, software and services. According to
Newzoo, the number of globally active gamers is expected to increase from 2.1bn in
2016 to 2.7bn in 2021. Currently, no single brand has a dominate market share, but in
line with the global PC market share, the brands with the largest market share in terms
of volume (units) are Lenovo, HP and Dell, followed by ASUS and Acer. The Company
had losses of US$20.4m in 2015, US$59.6m in 2016 and US$52.3M in 1H 2017. The
Company’s ecosystem consists of gaming hardware, software and services and has
been developed to integrate seamlessly and enhance personalized user experiences
across different entertainment genres.
Razer’s IPO price has been set at HK$3.88, which is close to the high end of the range.
Based on the IPO price of HK$3.88 per share, Razer’s market cap will be US$4,409m,
making it a sizable name in the hardware TMT segment. The response to Razer’s IPO
is hot and the trading of shares of Razer will start today. Razer’s post-IPO share price
performance is expected to be strong, as the market should treat Razer as a proxy for
the fast-growing eSports industry. However, hardware is just part of the ecosystem, and
it will take time for Razer to build up an ecosystem under its own brand. Razer has
sufficient financial resources to expand its business, but it will take time to realize the
benefits. Before comparing Razer to its peers in the ecosystem, we suggest investors
take a wait-and-see approach and evaluate Razer’s transformation.
Business Overview
The Razer ecosystem consists of hardware, software and services, designed and developed to integrated seamlessly and enhance personalized user experiences across different entertainment genres. The Company’s products are sold in 65 countries through 99 online platforms and through more than 24,000 offline retail outlets.
Hardware business: Razer’s hardware includes mainly premium gaming
peripherals and systems and allows users to play different game genres on multiple platform with other gamers in an advanced and customizable environment. Revenue from the hardware segment was approximately US$315m,
US$319m, US$389m, and US$195m in 2014, 2015, 2016 and 1H 2017,
respectively; and represents about 100.0%, 99.9%, 99.3%, and 98.3% of total revenue. The Company’s gaming peripherals offer gamers the highest level of performance; they include high-precision mice, fully customizable keyboards, audio devices, mouse mats and gaming console controllers. The Company’s systems consist mainly of gaming laptops. Razer laptops have three main product lines: a) Razer Blade Stealth, an ultrabook, which combines ultra-portability and performance; b) Razer Blade, which provides a balance between power and portability; and c) Raze Blade Pro, which is the Company’s premium offering, providing a comprehensive gaming experience as a compelling performance-focused “desktop replacement”. It is the world’s first THX-certified laptop device. Most of the Company’s hardware products are “connected devices”, which can be connected through software to Razer’s ecosystem, including other devices, and to the whole spectrum of software and services the Company offers. Razer is the leading global brand in terms of ownership across each peripherals category, based on an aggregate of China, Europe and the United States, according to Newzoo.
Software Business: The Company’s cloud-based “Razer Software Platform” is
the core of its ecosystem. The platform had over 35m registered users in 1H 2017. The Company also provides an IoT (Internet of Things) platform called “Razer Synapse”, which allows gamers to access the software platform via the Company’s hardware devices. The Company also provides some other software on its platform, such as “Razer Chroma”, an RGB lighting technology system, and “Razer Cortex”, which is an all-in-one game launcher. The “Razer Software Platform” allows the Company to collect and analyze user data and make recommendations to improve the user experience.
Services business: Early this year, the Company launched its zGold virtual
currency service, which allows users to purchase zGold and exchange it for digital content and items from various content providers. By using zGold, gamers can have an easy, convenient and secure method of accessing over 2,500 online
November 13, 2017
Source: Bloomberg, Company Data, CSIS Research; *: IPO price .
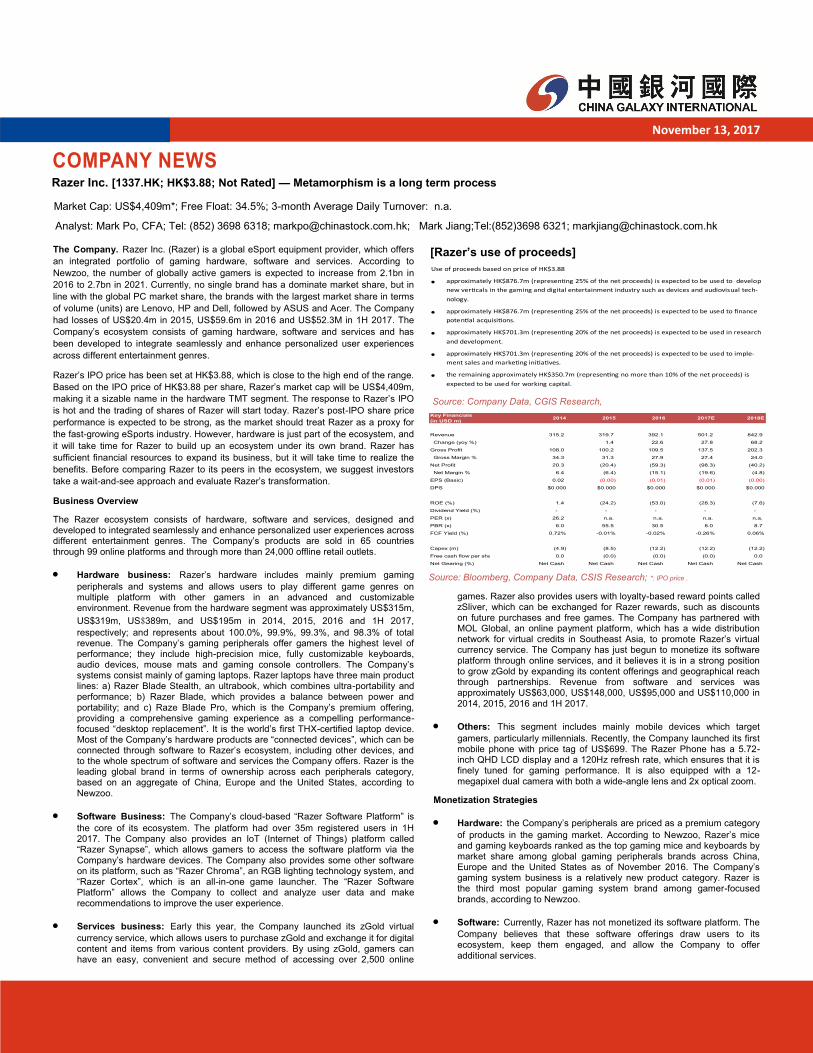
[Razer’s use of proceeds]
games. Razer also provides users with loyalty-based reward points called zSliver, which can be exchanged for Razer rewards, such as discounts on future purchases and free games. The Company has partnered with MOL Global, an online payment platform, which has a wide distribution network for virtual credits in Southeast Asia, to promote Razer’s virtual currency service. The Company has just begun to monetize its software platform through online services, and it believes it is in a strong position to grow zGold by expanding its content offerings and geographical reach through partnerships. Revenue from software and services was approximately US$63,000, US$148,000, US$95,000 and US$110,000 in 2014, 2015, 2016 and 1H 2017.
Others: This segment includes mainly mobile devices which target
gamers, particularly millennials. Recently, the Company launched its first mobile phone with price tag of US$699. The Razer Phone has a 5.72-inch QHD LCD display and a 120Hz refresh rate, which ensures that it is finely tuned for gaming performance. It is also equipped with a 12-megapixel dual camera with both a wide-angle lens and 2x optical zoom.
Monetization Strategies
Hardware: the Company’s peripherals are priced as a premium category
of products in the gaming market. According to Newzoo, Razer’s mice and gaming keyboards ranked as the top gaming mice and keyboards by market share among global gaming peripherals brands across China, Europe and the United States as of November 2016. The Company’s gaming system business is a relatively new product category. Razer is the third most popular gaming system brand among gamer-focused brands, according to Newzoo.
Software: Currently, Razer has not monetized its software platform. The
Company believes that these software offerings draw users to its ecosystem, keep them engaged, and allow the Company to offer additional services.
Source: Company Data, CGIS Research,
●
●
●
●
●
Key Financials
(in USD m)2014 2015 2016 2017E 2018E
Revenue 315.2 319.7 392.1 501.2 842.9
Change (yoy %) 1.4 22.6 27.8 68.2
Gross Profit 108.0 100.2 109.5 137.5 202.3
Gross Margin % 34.3 31.3 27.9 27.4 24.0
Net Profit 20.3 (20.4) (59.3) (98.3) (40.2)
Net Margin % 6.4 (6.4) (15.1) (19.6) (4.8)
EPS (Basic) 0.02 (0.00) (0.01) (0.01) (0.00)
DPS $0.000 $0.000 $0.000 $0.000 $0.000
ROE (%) 1.4 (24.2) (53.0) (28.3) (7.6)
Dividend Yield (%) - - - - -
PER (x) 26.2 n.a. n.a. n.a. n.a.
PBR (x) 6.0 55.5 30.5 8.0 8.7
FCF Yield (%) 0.72% -0.01% -0.02% -0.26% 0.06%
Capex (m) (4.9) (8.5) (12.2) (12.2) (12.2)
Free cash flow per share 0.0 (0.0) (0.0) (0.0) 0.0
Net Gearing (%) Net Cash Net Cash Net Cash Net Cash Net Cash

Services: The Company’s virtual currency, zGold, is monetized by charging a percentage of the price of digital content as a service fee retained by Razer, which is
included in the purchase price, with the remainder of the price returned to the content partner as a product fee, which is generally settled at the end of each month.
Financial Highlights
Razer’s revenue increased from US$315m in 2014 to US$392m in 2016, representing a CAGR of 11.5%. From 2014 to 2016, the Company’s revenue increased from US$135m to US$196.7m in the Americas, from US$98m to US$106m in EMEA, and from US$84m to US$90m in Asia Pacific, including China. Most of the Company’s revenue is generated from its hardware business. In 2016 and 1H 2017, Razer generated 76.2% and 66.9% of its total revenue from gaming peripherals, respectively, and 23.1% and 31.4% from gaming systems, respectively. The Company made a profit of US$20m in 2014; its losses were approximately US$20m, US$60m and US$53m in 2015, 2016 and 1H 2017. The Company expects to remain loss-making in 2017 and 2018.
Industry Overview
According to Frost & Sullivan, the global games market is the fastest-growing segment in the global entertainment industry, with a CAGR of approximately 8.8% from 2012 to 2016, and a CAGR of 5.1% from 2017 to 2021. In 2016, there were approximately 2b active gamers in the world, according to Newzoo. With the number of active gamers set to increase by a 5.4% CAGR from 2017, this number is expected to reach approximately 2.7b by 2021. Due to its rapid growth in recent years, Asia Pacific (ex-China) had the largest gaming population globally, with 536m active gamers in 2016. Active gamer numbers in this region are forecast to increase with a 7.6% CAGR from 2017 and are expected to reach over 778m in 2021. Also, according to Newzoo, 71.2% of millennials (aged 12 to 35) and 54.7% of non-millennials (aged 36 to 65) play games. According to the U.S. Department of Commerce, U.S. millennials spend 30 hours per month on gaming on average, 20 hours longer than Generation X and
Baby Boomers.
Our view: We can simply classify the eSports ecosystem into several sub-segments: infrastructure, equipment & systems, operators, platforms, game developers, agencies, media and marketing. Newzoo estimates that eSports revenue sources include advertising/sponsorships (77%), betting (7%), prize pools (7%), amateur micro-tournaments (4%) and merchandizing/ticket sales. We share the view that Razer is one of the few HK-listed eSports-related names, and investors may treat Razer as a proxy for the fast-growing eSports industry. However, hardware is just part of the ecosystem. It will take time for Razer to build up an ecosystem under its own brand. Razer has sufficient financial resources to expand its business, but it will take time to realize the benefits. Before comparing Razer to its peers in the ecosystem, such as Activision Blizzard, Electronic Arts, Take-Two Interactive Software, MSI and Logitech, we suggest investors take a wait-and-see approach and evaluate Razer’s transformation.
November 13, 2017

COMPANY NEWS
Figure 1: Razer’s turnover breakdown
Sources: Bloomberg, CGIS Research
Figure 2: Assumptions for Razer Inc.
Sources: Company data, CGIS Research
0.0
100.0
200.0
300.0
400.0
500.0
600.0
700.0
800.0
900.0
2014 2015 2016 2017F 2018F
Hardware Software & Services OthersUSD m
2014 2015 2016 2017F 2018F
Turnover (USDm)
Peripherals 274.6 282.4 298.6 322.5 348.3
System 40.6 37.1 90.7 154.2 385.5
Mobile 0.0 0.0 0.0 0.0 60.0
Software & Services 0.1 0.1 0.1 12.0 24.0
Others 0.0 0.1 2.7 12.5 25.1
YoY Change (%)
Peripherals n.a. 2.9 5.7 8.0 8.0
System n.a. (8.7) 144.6 70.0 150.0
Mobile n.a. n.a. n.a. n.a. n.a.
Software & Services n.a. 134.9 (35.8) 12,531.6 100.0
Others n.a. n.a. 3,209.9 367.6 100.0
Gross margin (%) 34.3 31.3 27.9 27.4 24.0
Net margin (%) 6.4 (6.4) (15.1) (19.6) (4.8)
Cost (USDm)
S,G&A (62.4) (88.5) (121.1) (167.9) (168.7)
R&D Expenses (23.64) (29.82) (52.18) (76.72) (78.44)
Financial Expenses (6.6) (0.1) (0.0) (0.0) (0.0)
YoY Change (%)
S,G&A n.a. 41.7 36.9 38.7 0.4
R&D Expenses n.a. 26.1 75.0 47.0 2.2
Financial Expenses n.a. (98.9) (86.5) 40.0 -
Geographical Region (USDm)
Amercias 135.2 135.4 196.7
EMEA 96.6 102.2 105.7
AP ex-China 38.9 37.2 40.0
China 44.5 45.0 49.7
Sales Channel (USDm)
Distributors 187.2 192.7 197.5
Retailers 96.1 85.5 109.3
Direct Sales 32.0 41.5 85.3
Number of retailers at beginning 49.0 47.0 47.0
Addition 9.0 16.0 17.0
Number of retailers during period 58.0 63.0 64.0
Number of retailers terminated during the period 11.0 16.0 21.0
Number of retailers at end of the period 47.0 47.0 43.0
Turnover rate of retailers 22.0 34.0 45.0

COMPANY NEWS
Figure 3: Revenue of the global entertainment industry
Sources: Frost & Sullivan, CGIS Research
Figure 4: Growth of active gamers (unit: millions)
Sources: Frost & Sullivan, CGIS Research
0
500
1000
1500
2000
2500
3000
3500
2014 2015 2016 2017 2018 2019 2020 2021
number of active gamers
7.1% 5.4%
Figure 5: Mercury & Gunmetal Razer gaming suite
Sources: Company data, CGIS Research
0
100
200
300
400
500
600
700
800
900
1000
2012 2013 2014 2015 2016 2017 2018 2019 2020 2021
Braodcast Music Publishing TV & Video Cinema GameUS$ b
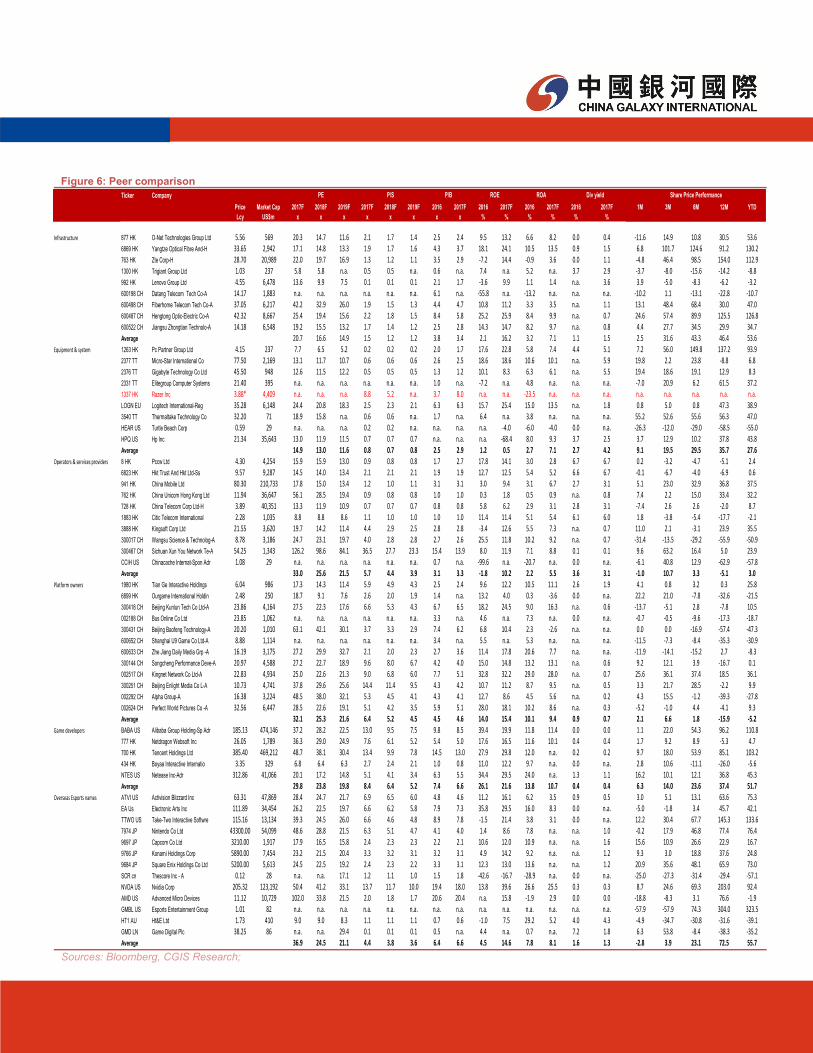
Figure 6: Peer comparison
Sources: Bloomberg, CGIS Research;
Ticker Company
Price Market Cap 2017F 2018F 2019F 2017F 2018F 2019F 2016 2017F 2016 2017F 2016 2017F 2016 2017F 1M 3M 6M 12M YTD
Lcy US$m x x x x x x x x % % % % % %
Infrastructure 877 HK O-Net Technologies Group Ltd 5.56 569 20.3 14.7 11.6 2.1 1.7 1.4 2.5 2.4 9.5 13.2 6.6 8.2 0.0 0.4 -11.6 14.9 10.8 30.5 53.66869 HK Yangtze Optical Fibre And-H 33.65 2,942 17.1 14.8 13.3 1.9 1.7 1.6 4.3 3.7 18.1 24.1 10.5 13.5 0.9 1.5 6.8 101.7 124.6 91.2 130.2763 HK Zte Corp-H 28.70 20,989 22.0 19.7 16.9 1.3 1.2 1.1 3.5 2.9 -7.2 14.4 -0.9 3.6 0.0 1.1 -4.8 46.4 98.5 154.0 112.91300 HK Trigiant Group Ltd 1.03 237 5.8 5.8 n.a. 0.5 0.5 n.a. 0.6 n.a. 7.4 n.a. 5.2 n.a. 3.7 2.9 -3.7 -8.0 -15.6 -14.2 -8.8992 HK Lenovo Group Ltd 4.55 6,478 13.6 9.9 7.5 0.1 0.1 0.1 2.1 1.7 -3.6 9.9 1.1 1.4 n.a. 3.6 3.9 -5.0 -8.3 -6.2 -3.2600198 CH Datang Telecom Tech Co-A 14.17 1,883 n.a. n.a. n.a. n.a. n.a. n.a. 6.1 n.a. -55.8 n.a. -13.2 n.a. n.a. n.a. -10.2 1.1 -13.1 -22.8 -10.7600498 CH Fiberhome Telecom Tech Co-A 37.05 6,217 42.2 32.9 26.0 1.9 1.5 1.3 4.4 4.7 10.8 11.2 3.3 3.5 n.a. 1.1 13.1 48.4 68.4 30.0 47.0600487 CH Hengtong Optic-Electric Co-A 42.32 8,667 25.4 19.4 15.6 2.2 1.8 1.5 8.4 5.8 25.2 25.9 8.4 9.9 n.a. 0.7 24.6 57.4 89.9 125.5 126.8600522 CH Jiangsu Zhongtian Technolo-A 14.18 6,548 19.2 15.5 13.2 1.7 1.4 1.2 2.5 2.8 14.3 14.7 8.2 9.7 n.a. 0.8 4.4 27.7 34.5 29.9 34.7Average 20.7 16.6 14.9 1.5 1.2 1.2 3.8 3.4 2.1 16.2 3.2 7.1 1.1 1.5 2.5 31.6 43.3 46.4 53.6
Equipment & system 1263 HK Pc Partner Group Ltd 4.15 237 7.7 6.5 5.2 0.2 0.2 0.2 2.0 1.7 17.6 22.8 5.8 7.4 4.4 5.1 7.2 56.0 149.8 137.2 93.92377 TT Micro-Star International Co 77.50 2,169 13.1 11.7 10.7 0.6 0.6 0.6 2.6 2.5 18.6 18.6 10.6 10.1 n.a. 5.9 19.8 2.2 23.8 -8.8 6.82376 TT Gigabyte Technology Co Ltd 45.50 948 12.6 11.5 12.2 0.5 0.5 0.5 1.3 1.2 10.1 8.3 6.3 6.1 n.a. 5.5 19.4 18.6 19.1 12.9 8.32331 TT Elitegroup Computer Systems 21.40 395 n.a. n.a. n.a. n.a. n.a. n.a. 1.0 n.a. -7.2 n.a. 4.8 n.a. n.a. n.a. -7.0 20.9 6.2 61.5 37.21337 HK Razer Inc 3.88* 4,409 n.a. n.a. n.a. 8.8 5.2 n.a. 3.7 8.0 n.a. n.a. -23.5 n.a. n.a. n.a. n.a. n.a. n.a. n.a. n.a.LOGN EU Logitech International-Reg 35.28 6,148 24.4 20.8 18.3 2.5 2.3 2.1 6.3 6.3 15.7 25.4 15.0 13.5 n.a. 1.8 0.8 5.0 0.8 47.3 38.93540 TT Thermaltake Technology Co 32.20 71 18.9 15.8 n.a. 0.6 0.6 n.a. 1.7 n.a. 6.4 n.a. 3.8 n.a. n.a. n.a. 55.2 52.6 55.6 56.3 47.0HEAR US Turtle Beach Corp 0.59 29 n.a. n.a. n.a. 0.2 0.2 n.a. n.a. n.a. n.a. -4.0 -6.0 -4.0 0.0 n.a. -26.3 -12.0 -29.0 -58.5 -55.0HPQ US Hp Inc 21.34 35,643 13.0 11.9 11.5 0.7 0.7 0.7 n.a. n.a. n.a. -68.4 8.0 9.3 3.7 2.5 3.7 12.9 10.2 37.8 43.8Average 14.9 13.0 11.6 0.8 0.7 0.8 2.5 2.9 1.2 0.5 2.7 7.1 2.7 4.2 9.1 19.5 29.5 35.7 27.6
Operators & services providers 8 HK Pccw Ltd 4.30 4,254 15.9 15.9 13.0 0.9 0.8 0.8 1.7 2.7 17.8 14.1 3.0 2.8 6.7 6.7 0.2 -3.2 -4.7 -5.1 2.46823 HK Hkt Trust And Hkt Ltd-Ss 9.57 9,287 14.5 14.0 13.4 2.1 2.1 2.1 1.9 1.9 12.7 12.5 5.4 5.2 6.6 6.7 -0.1 -6.7 -4.0 -6.9 0.6941 HK China Mobile Ltd 80.30 210,733 17.8 15.0 13.4 1.2 1.0 1.1 3.1 3.1 3.0 9.4 3.1 6.7 2.7 3.1 5.1 23.0 32.9 36.8 37.5762 HK China Unicom Hong Kong Ltd 11.94 36,647 56.1 28.5 19.4 0.9 0.8 0.8 1.0 1.0 0.3 1.8 0.5 0.9 n.a. 0.8 7.4 2.2 15.0 33.4 32.2728 HK China Telecom Corp Ltd-H 3.89 40,351 13.3 11.9 10.9 0.7 0.7 0.7 0.8 0.8 5.8 6.2 2.9 3.1 2.8 3.1 -7.4 2.6 2.6 -2.0 8.71883 HK Citic Telecom International 2.28 1,035 8.8 8.8 8.6 1.1 1.0 1.0 1.0 1.0 11.4 11.4 5.1 5.4 6.1 6.0 1.8 -3.8 -5.4 -17.7 -2.13888 HK Kingsoft Corp Ltd 21.55 3,620 19.7 14.2 11.4 4.4 2.9 2.5 2.8 2.8 -3.4 12.6 5.5 7.3 n.a. 0.7 11.0 2.1 -3.1 23.9 35.5300017 CH Wangsu Science & Technolog-A 8.78 3,186 24.7 23.1 19.7 4.0 2.8 2.8 2.7 2.6 25.5 11.8 10.2 9.2 n.a. 0.7 -31.4 -13.5 -29.2 -55.9 -50.9300467 CH Sichuan Xun You Network Te-A 54.25 1,343 126.2 98.6 84.1 36.5 27.7 23.3 15.4 13.9 8.0 11.9 7.1 8.8 0.1 0.1 9.6 63.2 16.4 5.0 23.9CCIH US Chinacache Internat-Spon Adr 1.08 29 n.a. n.a. n.a. n.a. n.a. n.a. 0.7 n.a. -99.6 n.a. -20.7 n.a. 0.0 n.a. -6.1 40.8 12.9 -62.9 -57.8Average 33.0 25.6 21.5 5.7 4.4 3.9 3.1 3.3 -1.8 10.2 2.2 5.5 3.6 3.1 -1.0 10.7 3.3 -5.1 3.0
Platform owners 1980 HK Tian Ge Interactive Holdings 6.04 986 17.3 14.3 11.4 5.9 4.9 4.3 2.5 2.4 9.6 12.2 10.5 11.1 2.6 1.9 4.1 0.8 3.2 0.3 25.86899 HK Ourgame International Holdin 2.48 250 18.7 9.1 7.6 2.6 2.0 1.9 1.4 n.a. 13.2 4.0 0.3 -3.6 0.0 n.a. 22.2 21.0 -7.8 -32.6 -21.5300418 CH Beijing Kunlun Tech Co Ltd-A 23.86 4,164 27.5 22.3 17.6 6.6 5.3 4.3 6.7 6.5 18.2 24.5 9.0 16.3 n.a. 0.6 -13.7 -5.1 2.8 -7.8 10.5002188 CH Bus Online Co Ltd 23.85 1,062 n.a. n.a. n.a. n.a. n.a. n.a. 3.3 n.a. 4.6 n.a. 7.3 n.a. 0.0 n.a. -0.7 -0.5 -9.6 -17.3 -18.7300431 CH Beijing Baofeng Technology-A 20.20 1,010 63.1 42.1 30.1 3.7 3.3 2.9 7.4 6.2 6.8 10.4 2.3 -2.6 n.a. n.a. 0.0 0.0 -16.9 -57.4 -47.3600652 CH Shanghai U9 Game Co Ltd-A 8.88 1,114 n.a. n.a. n.a. n.a. n.a. n.a. 3.4 n.a. 5.5 n.a. 5.3 n.a. n.a. n.a. -11.5 -7.3 -8.4 -35.3 -30.9600633 CH Zhe Jiang Daily Media Grp -A 16.19 3,175 27.2 29.9 32.7 2.1 2.0 2.3 2.7 3.6 11.4 17.8 20.6 7.7 n.a. n.a. -11.9 -14.1 -15.2 2.7 -8.3300144 CH Songcheng Performance Deve-A 20.97 4,588 27.2 22.7 18.9 9.6 8.0 6.7 4.2 4.0 15.0 14.8 13.2 13.1 n.a. 0.6 9.2 12.1 3.9 -16.7 0.1002517 CH Kingnet Network Co Ltd-A 22.83 4,934 25.0 22.6 21.3 9.0 6.8 6.0 7.7 5.1 32.8 32.2 29.0 28.0 n.a. 0.7 25.6 36.1 37.4 18.5 36.1300251 CH Beijing Enlight Media Co L-A 10.73 4,741 37.8 29.6 25.6 14.4 11.4 9.5 4.3 4.2 10.7 11.2 8.7 9.5 n.a. 0.5 3.3 21.7 28.5 -2.2 9.9002292 CH Alpha Group-A 16.38 3,224 48.5 38.0 32.1 5.3 4.5 4.1 4.3 4.1 12.7 8.6 4.5 5.6 n.a. 0.2 4.3 15.5 -1.2 -39.3 -27.8002624 CH Perfect World Pictures Co -A 32.56 6,447 28.5 22.6 19.1 5.1 4.2 3.5 5.9 5.1 28.0 18.1 10.2 8.6 n.a. 0.3 -5.2 -1.0 4.4 -4.1 9.3Average 32.1 25.3 21.6 6.4 5.2 4.5 4.5 4.6 14.0 15.4 10.1 9.4 0.9 0.7 2.1 6.6 1.8 -15.9 -5.2
Game developers BABA US Alibaba Group Holding-Sp Adr 185.13 474,146 37.2 28.2 22.5 13.0 9.5 7.5 9.8 8.5 39.4 19.9 11.8 11.4 0.0 0.0 1.1 22.0 54.3 96.2 110.8777 HK Netdragon Websoft Inc 26.05 1,789 36.3 29.0 24.9 7.6 6.1 5.2 5.4 5.0 17.6 16.5 11.6 10.1 0.4 0.4 1.7 9.2 8.9 -5.3 4.7700 HK Tencent Holdings Ltd 385.40 469,212 48.7 38.1 30.4 13.4 9.9 7.8 14.5 13.0 27.9 29.8 12.0 n.a. 0.2 0.2 9.7 18.0 53.9 85.1 103.2434 HK Boyaa Interactive Internatio 3.35 329 6.8 6.4 6.3 2.7 2.4 2.1 1.0 0.8 11.0 12.2 9.7 n.a. 0.0 n.a. 2.8 10.6 -11.1 -26.0 -5.6NTES US Netease Inc-Adr 312.86 41,066 20.1 17.2 14.8 5.1 4.1 3.4 6.3 5.5 34.4 29.5 24.0 n.a. 1.3 1.1 16.2 10.1 12.1 36.8 45.3Average 29.8 23.8 19.8 8.4 6.4 5.2 7.4 6.6 26.1 21.6 13.8 10.7 0.4 0.4 6.3 14.0 23.6 37.4 51.7
Overseas Esports names ATVI US Activision Blizzard Inc 63.31 47,869 28.4 24.7 21.7 6.9 6.5 6.0 4.8 4.6 11.2 16.1 6.2 3.5 0.9 0.5 3.0 5.1 13.1 63.6 75.3EA Us Electronic Arts Inc 111.89 34,454 26.2 22.5 19.7 6.6 6.2 5.8 7.9 7.3 35.8 29.5 16.0 8.3 0.0 n.a. -5.0 -1.8 3.4 45.7 42.1TTWO US Take-Two Interactive Softwre 115.16 13,134 39.3 24.5 26.0 6.6 4.6 4.8 8.9 7.8 -1.5 21.4 3.8 3.1 0.0 n.a. 12.2 30.4 67.7 145.3 133.67974 JP Nintendo Co Ltd 43300.00 54,099 48.6 28.8 21.5 6.3 5.1 4.7 4.1 4.0 1.4 8.6 7.8 n.a. n.a. 1.0 -0.2 17.9 46.8 77.4 76.49697 JP Capcom Co Ltd 3210.00 1,917 17.9 16.5 15.8 2.4 2.3 2.3 2.2 2.1 10.6 12.0 10.9 n.a. n.a. 1.6 15.6 10.9 26.6 22.9 16.79766 JP Konami Holdings Corp 5890.00 7,454 23.2 21.5 20.4 3.3 3.2 3.1 3.2 3.1 4.9 14.2 9.2 n.a. n.a. 1.2 9.3 3.0 18.8 37.6 24.89684 JP Square Enix Holdings Co Ltd 5200.00 5,613 24.5 22.5 19.2 2.4 2.3 2.2 3.3 3.1 12.3 13.0 13.6 n.a. n.a. 1.2 20.9 35.6 48.1 65.9 73.0SCR cn Thescore Inc - A 0.12 28 n.a. n.a. 17.1 1.2 1.1 1.0 1.5 1.8 -42.6 -16.7 -28.9 n.a. 0.0 n.a. -25.0 -27.3 -31.4 -29.4 -57.1NVDA US Nvidia Corp 205.32 123,192 50.4 41.2 33.1 13.7 11.7 10.0 19.4 18.0 13.8 39.6 26.6 25.5 0.3 0.3 8.7 24.6 69.3 203.0 92.4AMD US Advanced Micro Devices 11.12 10,729 102.0 33.8 21.5 2.0 1.8 1.7 20.6 20.4 n.a. 15.8 -1.9 2.9 0.0 0.0 -18.8 -8.3 3.1 76.6 -1.9GMBL US Esports Entertainment Group 1.01 82 n.a. n.a. n.a. n.a. n.a. n.a. n.a. n.a. n.a. n.a. n.a. n.a. n.a. n.a. -57.9 -57.9 74.3 304.0 323.5HT1 AU Ht&E Ltd 1.73 410 9.0 9.0 8.3 1.1 1.1 1.1 0.7 0.6 -1.0 7.5 29.2 5.2 4.0 4.3 -4.9 -34.7 -30.8 -31.6 -39.1GMD LN Game Digital Plc 38.25 86 n.a. n.a. 29.4 0.1 0.1 0.1 0.5 n.a. 4.4 n.a. 0.7 n.a. 7.2 1.8 6.3 53.8 -8.4 -38.3 -35.2Average 36.9 24.5 21.1 4.4 3.8 3.6 6.4 6.6 4.5 14.6 7.8 8.1 1.6 1.3 -2.8 3.9 23.1 72.5 55.7
PE P/S ROE ROA Div yieldP/B Share Price Performance

1
Strategy
November 13, 2017
Wong Chi Man—Head of Research
(852) 3698-6317
Short Selling Analysis for November 3 Last Friday the HKSFC released the aggregate short positions data for November 3. We
analysed which companies may be vulnerable to short-selling activity, based on the follow-
ing three criteria: (i) the net change in short positions between October 27 and November 3;
(ii) short positions as a percentage of free float; and (iii) the absolute amount of short posi-
tions. We must emphasize this is only an objective quantitative analysis based on offi-
cial data; the analysis does NOT imply that we feel uncomfortable with the corporate
governance or fundamentals of some companies. According to the results of our analy-
sis, we believe CPMC (0906.HK), Cowell (1415.HK) and Shanghai Pharm (2607.HK) require
close monitoring, based on their latest short positions outstanding. On the other hand, we
note that short positions in ASM Pacific (0522.HK) have dropped significantly.
Short positions in CPMC, Cowell and Shanghai Pharm increased significantly. As Fig-
ure 2 shows, the short positions in CPMC rose 51% during the week ended November 3.
The outstanding short positions were equivalent to 2.6% of the free float. The stock jumped
a maximum of 22% after announcing its proposed investment in JDB, but we saw a correc-
tion in the past few days. Figure 2 also shows that the short positions in Cowell jumped from
zero to 2.6% of its free float within a week. Some investors may believe the stock will not
have major catalysts in the near term after the release of iPhone X, in our view. Meanwhile,
short positions in Shanghai Pharm increased 87.6% during the week ended November 3,
with the outstanding positions equivalent to 2.9% of its H-share free float. Its stock price has
lost momentum since late October and has kept falling gradually.
Significant decline in the short positions in ASM Pacific. The outstanding short posi-
tions in ASM Pacific dropped 15% during the week ended November 3. The stock remained
stable after a major shareholder sold its 9% stake in the market in early November, and the
share price jumped 5.76% last Friday. Short positions in United Lab (3933.HK) declined
19.6% during the week ended November 3. We don’t rule out the possibility that the decline
in short positions is simply related to the CBs issued in November 2016. Meanwhile, short
positions in China Hongqiao (1378.HK) declined 28.2% during the week ended November 3.
The decline in short positions should be largely related the resumption of trading in late Oc-
tober. However, we remain cautious, as the share price has come under pressure in the
past few days after a sudden jump of 80% when trading resumed.
Recap: Source of data. The HKSFC releases the aggregate short positions in all eligible
stocks every Friday with a delay of one week. The HKEx releases the data on short-selling
activity on a daily basis (without a one-week delay), but investors do not know whether the
short positions are covered or not later. Therefore, the usefulness of the HKSFC data is that
it provides the outstanding short positions in each stock, and investors can trace the net
change on a weekly basis. However, there are still some limitations, as this data set cannot
cover short-selling activity using OTC derivative products.
Three angles to analyzing the data. (i) The net change in short positions between October
27 and November 3; (ii) short positions as a percentage of free float; and (iii) the absolute
amount of the short positions.

2
Sources: HKSFC, Bloomberg, CGIS Research
Figure 1: Review of ideas last week
Figure 2: Top 50 short selling stocks (ranked by net change between October 27 and November 3, descending order)
Sources: Bloomberg, CGIS Research
Ticker Company nameMarket cap
(HK$m)
2017E PER
(x)
2018E PER
(x)PBR (x)
2017E Dividend
yield (%)
Price on Nov 3
(HK$)
Price on Nov 10
(HK$)Change
Short positions increased significantly during the week ended Oct 27
751 HK Equity Skyworth Digital Holdings Ltd 11,234 36.34 6.23 0.72 2.45 3.67 3.73 -1.6%
323 HK Equity Maanshan Iron & Steel Co Ltd 35,706 6.51 6.76 1.09 1.73 3.74 3.67 1.9%
3836 HK Equity China Harmony New Energy Auto Holding Ltd 7,585 6.71 8.22 1.13 2.79 4.93 4.57 7.9%
1293 HK Equity Grand Baoxin Auto Group Ltd 12,569 11.03 8.48 1.70 1.03 4.43 4.11 7.8%
Short positions dropped significantly during the week ended Oct 27
902 HK Equity Huaneng Power International Inc 109,102 28.90 9.87 0.87 1.83 5.53 5.19 6.6%
2280 HK Equity HC International Inc 6,575 19.35 14.39 2.05 - 6.59 6.65 -0.9%
3393 HK Equity Wasion Group Holdings Ltd 3,979 11.24 11.02 0.84 5.51 3.96 3.97 -0.3%
Ticker Company name
Aggregated
reportable
short positions
on Nov 3
(shares)
Aggregated
reportable short
positions on Nov
3 (HK$)
% of
free
float
Change in short
positions
compared with
Oct 27
Price on
Nov 3
(HK$)
Price on
Nov 10
(HK$)
Price
change
during
the
period
Market cap
(HK$m)
2017E
PER (x)
2018E
PER (x) PBR (x)
2017E
Dividend
yield (%)
Aggregated
reportable
short
positions
on Nov 3/ 3-
month
average
daily
turnover
1415 Cowell e Holdings Inc 11,608,000 43,413,920 2.6% Increase from nil 3.74 3.71 -0.8% 3,085 8.06 6.60 1.29 2.94 0.31
520 Xiabuxiabu Catering Management China Holdings Co Ltd 808,500 9,702,000 0.3% Increase from nil 12.00 12.14 1.2% 13,019 25.40 20.39 6.10 1.43 0.32
2099 China Gold International Resources Corp Ltd 365,300 4,595,474 0.2% Increase from nil 12.58 12.7 1.0% 5,034 16.28 12.52 0.45 n.a. 0.25
1963 Bank of Chongqing Co Ltd 343,000 2,184,910 0.0% Increase from nil 6.37 6.31 -0.9% 19,732 4.39 4.08 0.68 6.01 0.27
798 China Electronics Optics Valley Union Holding Co Ltd 2,116,000 1,587,000 0.1% Increase from nil 0.75 0.74 -1.3% 5,872 n.a. n.a. 0.88 n.a. 0.13
6826 Shanghai Haohai Biological Technology Co Ltd 9,100 341,705 0.0% Increase from nil 37.55 37.95 1.1% 6,074 13.75 11.57 1.73 1.83 0.11
1622 Redco Properties Group Ltd 5,062,000 20,804,820 0.6% 308.2% 4.11 3.88 -5.6% 13,780 n.a. n.a. 3.62 n.a. 0.97
2314 Lee & Man Paper Manufacturing Ltd 6,539,395 63,301,344 0.5% 129.1% 9.68 9.44 -2.5% 42,637 9.08 8.39 2.27 3.76 0.53
3988 Bank of China Ltd 170,682,394 655,420,393 0.2% 124.6% 3.84 3.83 -0.3% 1,278,149 5.56 5.22 0.69 5.40 0.44
1250 Beijing Enterprises Clean Energy Group Ltd 26,198,848 6,680,706 0.1% 104.2% 0.26 0.275 7.8% 17,469 13.78 9.37 2.63 n.a. 0.14
973 L'Occitane International SA 1,728,249 25,370,695 0.4% 99.4% 14.68 14.98 2.0% 22,125 19.37 17.52 2.62 1.82 3.09
2607 Shanghai Pharmaceuticals Holding Co Ltd 18,395,849 360,558,640 2.9% 87.6% 19.60 19.48 -0.6% 70,948 12.71 11.18 1.37 2.43 5.30
1893 China National Materials Co Ltd 4,906,749 25,809,500 0.4% 84.9% 5.26 5.42 3.0% 19,357 11.54 10.30 0.92 1.56 0.50
581 China Oriental Group Co Ltd 13,272,000 78,039,360 1.4% 73.5% 5.88 6.08 3.4% 21,464 3.98 5.42 1.56 7.34 1.16
64 Get Nice Holdings Ltd 4,510,000 1,465,750 0.1% 62.6% 0.33 0.31 -4.6% 2,995 n.a. n.a. 0.51 n.a. 0.13
2888 Standard Chartered PLC 7,202,534 536,948,910 0.2% 60.2% 74.55 74.85 0.4% 246,708 17.90 13.05 0.62 1.36 4.09
906 CPMC Holdings Ltd 8,715,338 55,168,090 2.6% 51.0% 6.33 6.05 -4.4% 7,106 16.62 13.74 1.06 2.91 2.71
1339 People's Insurance Co Group of China Ltd/The 50,252,276 202,516,672 0.7% 50.1% 4.03 4.19 4.0% 177,757 8.92 8.54 1.14 0.92 1.28
1347 Hua Hong Semiconductor Ltd 3,544,000 54,577,600 1.0% 49.5% 15.40 15.86 3.0% 16,417 15.17 13.55 1.30 1.77 1.04
337 Greenland Hong Kong Holdings Ltd 6,578,003 23,943,931 1.5% 49.1% 3.64 3.38 -7.1% 9,443 5.36 5.05 1.00 4.03 0.84
69 Shangri-La Asia Ltd 22,782,629 365,889,022 1.2% 47.4% 16.06 16.8 4.6% 60,179 43.06 34.17 1.24 0.93 8.28
1030 Future Land Development Holdings Ltd 26,542,875 108,294,930 1.7% 47.2% 4.08 4.2 2.9% 23,764 9.75 7.69 2.17 2.74 1.45
127 Chinese Estates Holdings Ltd 1,688,000 22,146,560 0.3% 42.6% 13.12 13.68 4.3% 26,096 n.a. n.a. 0.98 n.a. 0.41
1579 Yihai International Holding Ltd 346,000 2,574,240 0.1% 41.2% 7.44 7.05 -5.2% 7,381 25.55 20.35 4.96 0.83 0.36
10 Hang Lung Group Ltd 4,195,015 114,733,660 0.4% 41.1% 27.35 26.45 -3.3% 36,015 n.a. n.a. 0.46 n.a. 5.65
1478 Q Technology Group Co Ltd 7,964,000 134,750,880 2.2% 40.8% 16.92 18.3 8.2% 20,049 34.11 22.85 9.84 0.51 0.33
1800 China Communications Construction Co Ltd 71,804,706 675,682,283 1.7% 40.1% 9.41 9.21 -2.1% 244,811 6.83 6.10 0.76 2.87 2.93
486 United Co RUSAL PLC 4,527,000 24,536,340 0.2% 39.4% 5.42 5.46 0.7% 82,954 7.77 6.19 2.76 3.14 0.19
552 China Communications Services Corp Ltd 11,150,000 53,074,000 0.5% 37.8% 4.76 4.8 0.8% 33,245 10.27 9.42 1.04 3.42 1.21
2331 Li Ning Co Ltd 45,569,074 320,806,281 2.7% 35.1% 7.04 6.88 -2.3% 14,985 27.38 18.60 2.67 0.41 5.29
2005 SSY Group Ltd 4,576,000 17,434,560 0.5% 34.3% 3.81 3.9 2.4% 11,101 18.06 14.77 3.77 1.62 1.59
728 China Telecom Corp Ltd 71,276,896 278,692,663 0.5% 33.9% 3.91 3.89 -0.5% 314,827 13.31 11.92 0.84 3.08 1.22
390 China Railway Group Ltd 84,803,056 528,323,039 2.2% 33.1% 6.23 6.06 -2.7% 218,096 8.14 7.30 0.87 2.02 3.77
3328 Bank of Communications Co Ltd 157,058,061 915,648,496 2.2% 30.8% 5.83 5.82 -0.2% 485,406 5.48 5.26 0.62 5.39 4.82
763 ZTE Corp 50,647,126 1,367,472,402 6.4% 30.7% 27.00 28.7 6.3% 163,675 22.02 19.74 3.53 1.11 3.18
1099 Sinopharm Group Co Ltd 39,721,906 1,342,600,423 3.4% 28.6% 33.80 32.85 -2.8% 90,899 15.42 13.63 2.35 1.95 7.03
3908 China International Capital Corp Ltd 13,735,391 228,556,906 1.2% 26.8% 16.64 17.06 2.5% 67,986 16.16 14.56 1.63 1.53 1.05
12 Henderson Land Development Co Ltd 10,624,510 562,036,579 1.0% 26.1% 52.90 53.2 0.6% 212,861 14.48 16.47 0.77 3.12 2.34
1288 Agricultural Bank of China Ltd 82,542,846 302,106,816 0.3% 25.7% 3.66 3.64 -0.5% 1,365,419 5.31 4.98 0.76 5.68 0.62
8207 Chong Sing Holdings FinTech Gr 63,544,000 66,085,760 0.4% 24.3% 1.04 1.03 -1.0% 22,987 48.74 48.74 3.85 n.a. 1.86
874 Guangzhou Baiyunshan Pharmaceutical Holdings Co Ltd 1,976,400 51,880,500 0.9% 23.3% 26.25 26.65 1.5% 58,924 19.93 18.00 2.01 1.43 1.06
5 HSBC Holdings PLC 62,377,653 4,715,750,567 0.3% 22.6% 75.60 75.95 0.5% 1,518,049 14.59 13.83 1.02 5.24 2.92
1177 Sino Biopharmaceutical Ltd 80,620,090 793,301,686 1.6% 22.5% 9.84 11.42 16.1% 84,647 36.70 32.10 7.88 0.56 5.61
3339 Lonking Holdings Ltd 43,212,700 149,948,069 2.4% 22.4% 3.47 3.33 -4.0% 14,253 15.33 12.61 1.71 3.24 3.26
1072 Dongfang Electric Corp Ltd 4,478,510 35,514,584 1.3% 22.2% 7.93 7.97 0.5% 30,077 32.79 24.42 0.73 0.72 3.22
303 VTech Holdings Ltd 2,005,055 225,568,688 1.2% 21.6% 112.50 114.3 1.6% 28,732 16.76 15.62 6.51 5.76 9.37
1966 China SCE Property Holdings Ltd 13,420,000 47,238,400 0.9% 21.4% 3.52 3.41 -3.1% 13,039 5.81 4.05 1.09 5.27 0.49
6068 Wisdom Education International Holdings Co Ltd 922,000 3,927,720 0.2% 21.3% 4.26 4.52 6.1% 9,217 31.55 24.21 n.a. 1.09 0.14
832 Central China Real Estate Ltd 7,122,052 25,283,285 1.1% 21.0% 3.55 3.54 -0.3% 8,668 6.46 5.11 1.06 4.64 1.24
606 China Agri-Industries Holdings Ltd 1,770,000 6,672,900 0.1% 20.5% 3.77 3.76 -0.3% 19,740 10.74 10.16 0.71 2.15 0.18
3
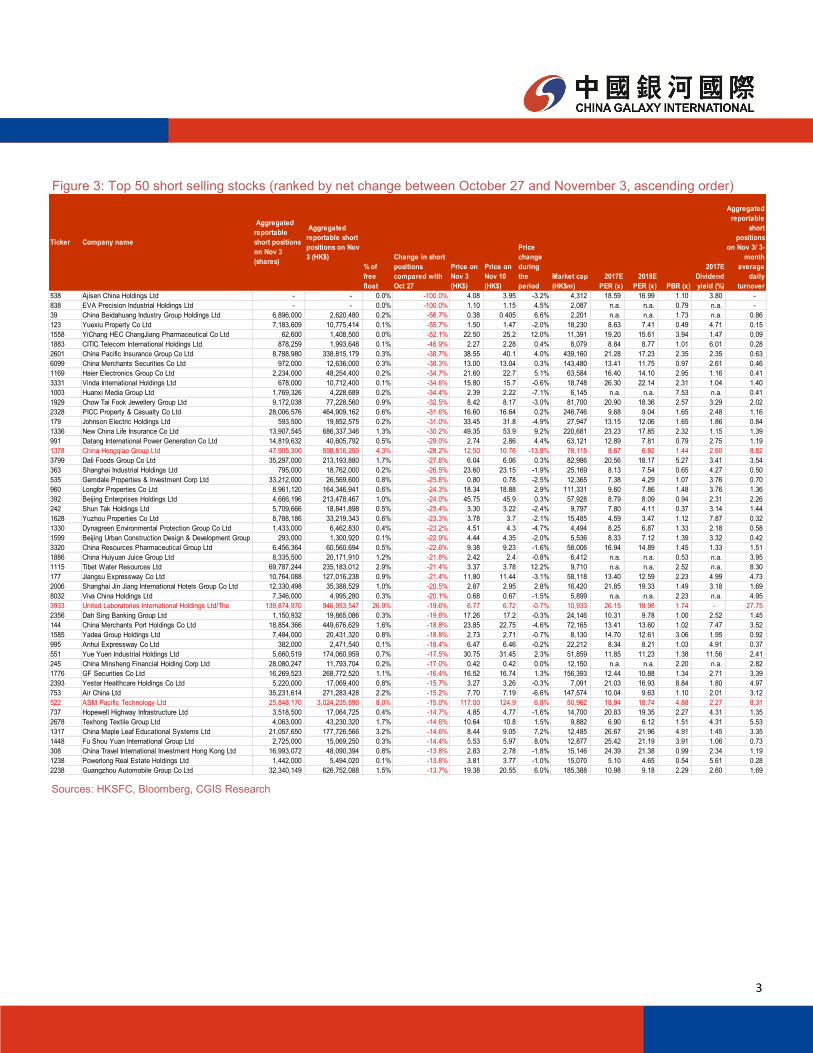
Figure 3: Top 50 short selling stocks (ranked by net change between October 27 and November 3, ascending order)
Sources: HKSFC, Bloomberg, CGIS Research
Ticker Company name
Aggregated
reportable
short positions
on Nov 3
(shares)
Aggregated
reportable short
positions on Nov
3 (HK$)
% of
free
float
Change in short
positions
compared with
Oct 27
Price on
Nov 3
(HK$)
Price on
Nov 10
(HK$)
Price
change
during
the
period
Market cap
(HK$m)
2017E
PER (x)
2018E
PER (x) PBR (x)
2017E
Dividend
yield (%)
Aggregated
reportable
short
positions
on Nov 3/ 3-
month
average
daily
turnover
538 Ajisen China Holdings Ltd - - 0.0% -100.0% 4.08 3.95 -3.2% 4,312 18.59 16.99 1.10 3.80 -
838 EVA Precision Industrial Holdings Ltd - - 0.0% -100.0% 1.10 1.15 4.5% 2,087 n.a. n.a. 0.79 n.a. -
39 China Beidahuang Industry Group Holdings Ltd 6,896,000 2,620,480 0.2% -56.7% 0.38 0.405 6.6% 2,201 n.a. n.a. 1.73 n.a. 0.86
123 Yuexiu Property Co Ltd 7,183,609 10,775,414 0.1% -55.7% 1.50 1.47 -2.0% 18,230 8.63 7.41 0.49 4.71 0.15
1558 YiChang HEC ChangJiang Pharmaceutical Co Ltd 62,600 1,408,500 0.0% -52.1% 22.50 25.2 12.0% 11,391 19.20 15.61 3.94 1.47 0.09
1883 CITIC Telecom International Holdings Ltd 878,259 1,993,648 0.1% -46.9% 2.27 2.28 0.4% 8,079 8.84 8.77 1.01 6.01 0.28
2601 China Pacific Insurance Group Co Ltd 8,788,980 338,815,179 0.3% -38.7% 38.55 40.1 4.0% 439,160 21.28 17.23 2.35 2.35 0.63
6099 China Merchants Securities Co Ltd 972,000 12,636,000 0.3% -38.3% 13.00 13.04 0.3% 143,480 13.41 11.75 0.97 2.61 0.46
1169 Haier Electronics Group Co Ltd 2,234,000 48,254,400 0.2% -34.7% 21.60 22.7 5.1% 63,584 16.40 14.10 2.95 1.16 0.41
3331 Vinda International Holdings Ltd 678,000 10,712,400 0.1% -34.6% 15.80 15.7 -0.6% 18,748 26.30 22.14 2.31 1.04 1.40
1003 Huanxi Media Group Ltd 1,769,326 4,228,689 0.2% -34.4% 2.39 2.22 -7.1% 6,145 n.a. n.a. 7.53 n.a. 0.41
1929 Chow Tai Fook Jewellery Group Ltd 9,172,038 77,228,560 0.9% -32.5% 8.42 8.17 -3.0% 81,700 20.90 18.36 2.57 3.29 2.02
2328 PICC Property & Casualty Co Ltd 28,006,576 464,909,162 0.6% -31.6% 16.60 16.64 0.2% 246,746 9.68 9.04 1.65 2.48 1.16
179 Johnson Electric Holdings Ltd 593,500 19,852,575 0.2% -31.0% 33.45 31.8 -4.9% 27,947 13.15 12.06 1.65 1.86 0.84
1336 New China Life Insurance Co Ltd 13,907,545 686,337,346 1.3% -30.2% 49.35 53.9 9.2% 220,681 23.23 17.85 2.32 1.15 1.39
991 Datang International Power Generation Co Ltd 14,819,632 40,605,792 0.5% -29.0% 2.74 2.86 4.4% 63,121 12.89 7.81 0.79 2.75 1.19
1378 China Hongqiao Group Ltd 47,905,300 598,816,250 4.3% -28.2% 12.50 10.76 -13.9% 78,115 8.67 6.92 1.44 2.60 8.82
3799 Dali Foods Group Co Ltd 35,297,000 213,193,880 1.7% -27.8% 6.04 6.06 0.3% 82,986 20.56 18.17 5.27 3.41 3.54
363 Shanghai Industrial Holdings Ltd 795,000 18,762,000 0.2% -26.5% 23.60 23.15 -1.9% 25,169 8.13 7.54 0.65 4.27 0.50
535 Gemdale Properties & Investment Corp Ltd 33,212,000 26,569,600 0.8% -25.8% 0.80 0.78 -2.5% 12,365 7.38 4.29 1.07 3.76 0.70
960 Longfor Properties Co Ltd 8,961,120 164,346,941 0.6% -24.3% 18.34 18.88 2.9% 111,331 9.60 7.86 1.48 3.76 1.36
392 Beijing Enterprises Holdings Ltd 4,666,196 213,478,467 1.0% -24.0% 45.75 45.9 0.3% 57,928 8.79 8.09 0.94 2.31 2.26
242 Shun Tak Holdings Ltd 5,709,666 18,841,898 0.5% -23.4% 3.30 3.22 -2.4% 9,797 7.80 4.11 0.37 3.14 1.44
1628 Yuzhou Properties Co Ltd 8,788,186 33,219,343 0.6% -23.3% 3.78 3.7 -2.1% 15,485 4.59 3.47 1.12 7.87 0.32
1330 Dynagreen Environmental Protection Group Co Ltd 1,433,000 6,462,830 0.4% -23.2% 4.51 4.3 -4.7% 4,494 8.25 6.87 1.33 2.18 0.58
1599 Beijing Urban Construction Design & Development Group Co Ltd 293,000 1,300,920 0.1% -22.9% 4.44 4.35 -2.0% 5,536 8.33 7.12 1.39 3.32 0.42
3320 China Resources Pharmaceutical Group Ltd 6,456,364 60,560,694 0.5% -22.6% 9.38 9.23 -1.6% 58,006 16.94 14.89 1.45 1.33 1.51
1886 China Huiyuan Juice Group Ltd 8,335,500 20,171,910 1.2% -21.6% 2.42 2.4 -0.8% 6,412 n.a. n.a. 0.53 n.a. 3.95
1115 Tibet Water Resources Ltd 69,787,244 235,183,012 2.9% -21.4% 3.37 3.78 12.2% 9,710 n.a. n.a. 2.52 n.a. 8.30
177 Jiangsu Expressway Co Ltd 10,764,088 127,016,238 0.9% -21.4% 11.80 11.44 -3.1% 58,118 13.40 12.59 2.23 4.99 4.73
2006 Shanghai Jin Jiang International Hotels Group Co Ltd 12,330,498 35,388,529 1.0% -20.5% 2.87 2.95 2.8% 16,420 21.85 19.33 1.49 3.18 1.69
8032 Viva China Holdings Ltd 7,346,000 4,995,280 0.3% -20.1% 0.68 0.67 -1.5% 5,899 n.a. n.a. 2.23 n.a. 4.95
3933 United Laboratories International Holdings Ltd/The 139,874,970 946,953,547 26.9% -19.6% 6.77 6.72 -0.7% 10,933 26.15 18.98 1.74 - 27.75
2356 Dah Sing Banking Group Ltd 1,150,932 19,865,086 0.3% -19.6% 17.26 17.2 -0.3% 24,146 10.31 9.78 1.00 2.52 1.45
144 China Merchants Port Holdings Co Ltd 18,854,366 449,676,629 1.6% -18.8% 23.85 22.75 -4.6% 72,165 13.41 13.60 1.02 7.47 3.52
1585 Yadea Group Holdings Ltd 7,484,000 20,431,320 0.8% -18.8% 2.73 2.71 -0.7% 8,130 14.70 12.61 3.06 1.95 0.92
995 Anhui Expressway Co Ltd 382,000 2,471,540 0.1% -18.4% 6.47 6.46 -0.2% 22,212 8.34 8.21 1.03 4.91 0.37
551 Yue Yuen Industrial Holdings Ltd 5,660,519 174,060,959 0.7% -17.5% 30.75 31.45 2.3% 51,859 11.85 11.23 1.38 11.56 2.41
245 China Minsheng Financial Holding Corp Ltd 28,080,247 11,793,704 0.2% -17.0% 0.42 0.42 0.0% 12,150 n.a. n.a. 2.20 n.a. 2.82
1776 GF Securities Co Ltd 16,269,523 268,772,520 1.1% -16.4% 16.52 16.74 1.3% 156,393 12.44 10.88 1.34 2.71 3.39
2393 Yestar Healthcare Holdings Co Ltd 5,220,000 17,069,400 0.8% -15.7% 3.27 3.26 -0.3% 7,091 21.03 16.93 8.84 1.80 4.97
753 Air China Ltd 35,231,614 271,283,428 2.2% -15.2% 7.70 7.19 -6.6% 147,574 10.04 9.63 1.10 2.01 3.12
522 ASM Pacific Technology Ltd 25,848,170 3,024,235,890 8.0% -15.0% 117.00 124.9 6.8% 50,962 18.94 18.74 4.88 2.27 8.31
737 Hopewell Highway Infrastructure Ltd 3,518,500 17,064,725 0.4% -14.7% 4.85 4.77 -1.6% 14,700 20.83 19.35 2.27 4.31 1.35
2678 Texhong Textile Group Ltd 4,063,000 43,230,320 1.7% -14.6% 10.64 10.8 1.5% 9,882 6.90 6.12 1.51 4.31 5.53
1317 China Maple Leaf Educational Systems Ltd 21,057,650 177,726,566 3.2% -14.6% 8.44 9.05 7.2% 12,485 26.67 21.96 4.91 1.45 3.35
1448 Fu Shou Yuan International Group Ltd 2,725,000 15,069,250 0.3% -14.4% 5.53 5.97 8.0% 12,877 25.42 21.19 3.91 1.06 0.73
308 China Travel International Investment Hong Kong Ltd 16,993,072 48,090,394 0.8% -13.8% 2.83 2.78 -1.8% 15,146 24.39 21.38 0.99 2.34 1.19
1238 Powerlong Real Estate Holdings Ltd 1,442,000 5,494,020 0.1% -13.8% 3.81 3.77 -1.0% 15,070 5.10 4.65 0.54 5.61 0.28
2238 Guangzhou Automobile Group Co Ltd 32,340,149 626,752,088 1.5% -13.7% 19.38 20.55 6.0% 185,388 10.98 9.18 2.29 2.60 1.69

4
Figure 4: Top 50 short selling stocks (ranked by percentage of free float)
Sources: HKSFC, Bloomberg, CGIS Research
Ticker Company name
Aggregated
reportable
short positions
on Nov 3
(shares)
Aggregated
reportable short
positions on Nov
3 (HK$)
% of
free
float
Change in short
positions
compared with
Oct 27
Price on
Nov 3
(HK$)
Price on
Nov 10
(HK$)
Price
change
during
the
period
Market cap
(HK$m)
2017E
PER (x)
2018E
PER (x) PBR (x)
2017E
Dividend
yield (%)
Aggregated
reportable
short
positions
on Nov 3/ 3-
month
average
daily
turnover
3933 United Laboratories International Holdings Ltd/The 139,874,970 946,953,547 26.9% -19.6% 6.77 6.72 -0.7% 10,933 26.15 18.98 1.74 - 27.75
2318 Ping An Insurance Group Co of China Ltd 1,402,610,896 99,164,590,347 26.1% -0.7% 70.70 75.8 7.2% 1,453,623 16.04 13.63 2.63 1.56 36.96
493 GOME Retail Holdings Ltd 1,941,020,256 1,902,199,851 18.2% -0.5% 0.98 0.99 1.0% 21,342 36.66 22.19 0.88 1.19 17.20
992 Lenovo Group Ltd 1,041,257,639 4,737,722,257 17.4% -2.1% 4.55 4.55 0.0% 50,544 14.58 10.05 2.05 3.77 18.51
698 Tongda Group Holdings Ltd 597,680,490 1,279,036,249 16.8% -10.8% 2.14 2.19 2.3% 13,253 12.23 9.36 2.65 2.47 9.89
2282 MGM China Holdings Ltd 142,179,796 2,587,672,287 16.2% 3.0% 18.20 19.5 7.1% 74,101 32.18 26.10 9.37 1.22 19.97
1211 BYD Co Ltd 116,878,771 7,947,756,428 16.0% 2.1% 68.00 71.85 5.7% 209,788 37.02 24.65 3.32 0.51 9.89
2333 Great Wall Motor Co Ltd 474,891,633 4,592,202,091 16.0% 12.8% 9.67 9.26 -4.2% 109,823 12.46 8.73 1.55 2.50 8.90
2600 Aluminum Corp of China Ltd 535,609,386 3,224,368,504 14.8% 0.5% 6.02 5.81 -3.5% 86,591 28.94 13.56 1.97 - 8.69
1970 IMAX China Holding Inc 17,146,960 389,235,992 14.8% 0.0% 22.70 23.2 2.2% 8,274 27.03 22.87 5.61 0.17 14.31
151 Want Want China Holdings Ltd 727,373,902 4,786,120,275 14.5% -0.8% 6.58 6.73 2.3% 84,177 22.66 21.63 5.59 2.01 49.63
981 Semiconductor Manufacturing International Corp 550,981,677 7,636,606,043 14.3% 0.1% 13.86 13.84 -0.1% 64,515 47.94 34.78 1.76 - 12.09
327 PAX Global Technology Ltd 101,868,883 404,419,466 14.0% -2.9% 3.97 3.98 0.3% 4,399 8.77 7.91 1.18 1.71 15.88
3800 GCL-Poly Energy Holdings Ltd 1,828,970,671 2,450,820,699 14.0% -1.6% 1.34 1.44 7.5% 26,767 10.48 10.05 1.04 - 9.05
3900 Greentown China Holdings Ltd 80,368,524 784,396,794 13.7% 3.0% 9.76 9.58 -1.8% 20,744 9.19 8.50 0.69 1.79 10.62
293 Cathay Pacific Airways Ltd 76,470,747 1,009,413,860 13.5% -2.0% 13.20 12.34 -6.5% 48,544 n.a. 70.51 0.91 0.11 14.35
951 Chaowei Power Holdings Ltd 76,391,336 323,135,351 12.7% 6.3% 4.23 4.11 -2.8% 4,554 6.16 5.17 1.11 3.11 11.84
750 China Singyes Solar Technologies Holdings Ltd 66,601,277 178,491,422 12.5% -2.2% 2.68 2.73 1.9% 2,277 5.43 4.76 0.46 1.55 18.28
315 SmarTone Telecommunications Holdings Ltd 39,497,928 385,499,777 12.3% -2.9% 9.76 9.33 -4.4% 10,217 14.90 15.15 2.25 5.73 21.13
2638 HK Electric Investments & HK Electric Investments Ltd 275,355,622 1,979,806,922 12.2% 1.1% 7.19 7.18 -0.1% 63,444 18.51 18.46 1.31 5.46 64.69
799 IGG Inc 94,785,862 963,024,358 11.7% 0.1% 10.16 10.36 2.0% 13,984 9.98 8.05 7.43 4.37 5.29
1898 China Coal Energy Co Ltd 236,894,159 831,498,498 11.1% 1.0% 3.51 3.57 1.7% 77,320 9.44 10.78 0.46 3.03 12.43
607 Fullshare Holdings Ltd 764,769,847 2,569,626,686 11.1% -6.1% 3.36 3.3 -1.8% 65,106 n.a. n.a. 2.58 n.a. 28.15
285 BYD Electronic International Co Ltd 76,159,924 1,553,662,450 11.0% 8.9% 20.40 22.95 12.5% 51,711 16.29 13.63 3.41 1.08 5.94
3888 Kingsoft Corp Ltd 80,619,584 1,652,701,472 11.0% 7.6% 20.50 21.55 5.1% 28,243 19.74 14.24 2.75 0.71 8.69
3808 Sinotruk Hong Kong Ltd 74,202,500 701,955,650 10.8% 18.3% 9.46 9.79 3.5% 27,030 10.77 10.36 1.09 2.76 12.96
1060 Alibaba Pictures Group Ltd 1,221,194,385 1,550,916,869 10.6% 0.6% 1.27 1.26 -0.8% 31,996 n.a. n.a. 1.65 n.a. 27.00
2186 Luye Pharma Group Ltd 198,279,265 1,035,017,763 10.5% -0.5% 5.22 5.48 5.0% 18,199 16.04 14.14 2.38 1.16 12.61
3333 China Evergrande Group 216,154,617 6,311,714,816 9.7% 1.0% 29.20 31.35 7.4% 412,382 11.78 9.88 3.46 2.50 5.57
877 O-Net Technologies Group Ltd 38,313,311 205,742,480 9.7% -9.0% 5.37 5.56 3.5% 4,436 20.29 14.71 2.50 0.41 5.67
1788 Guotai Junan International Holdings Ltd 228,900,013 574,539,033 9.3% 2.4% 2.51 2.59 3.2% 18,134 14.39 13.15 2.18 3.40 9.91
241 Alibaba Health Information Technology Ltd 354,451,915 1,449,708,332 9.1% 0.2% 4.09 4.22 3.2% 39,595 n.a. n.a. 25.98 n.a. 19.57
1515 China Resources Phoenix Healthcare Holdings Co Ltd 38,604,882 392,997,699 9.0% -4.5% 10.18 10.06 -1.2% 13,045 23.93 22.73 2.06 0.83 9.12
3323 China National Building Material Co Ltd 264,211,170 1,717,372,605 9.0% -2.3% 6.50 6.64 2.2% 35,850 11.18 10.65 0.72 1.89 6.65
322 Tingyi Cayman Islands Holding Corp 161,353,374 2,020,144,242 8.9% -2.2% 12.52 12.36 -1.3% 69,295 36.68 29.99 4.10 1.29 24.95
1363 CT Environmental Group Ltd 254,429,678 297,682,723 8.9% 4.9% 1.17 1.29 10.3% 8,149 11.21 9.55 1.98 2.00 6.99
1157 Zoomlion Heavy Industry Science and Technology Co Ltd 117,200,460 446,533,753 8.8% 4.6% 3.81 3.64 -4.5% 38,956 18.45 20.00 0.63 3.35 9.59
1333 China Zhongwang Holdings Ltd 114,900,668 481,433,799 8.7% 0.8% 4.19 3.94 -6.0% 21,471 6.99 5.01 0.64 4.17 11.69
135 Kunlun Energy Co Ltd 264,187,553 1,891,582,879 8.7% -3.7% 7.16 7.12 -0.6% 57,475 11.27 10.26 1.28 2.28 18.81
2338 Weichai Power Co Ltd 168,904,238 1,618,102,600 8.4% 6.5% 9.58 9.88 3.1% 83,114 12.36 12.77 1.03 3.89 14.09
806 Value Partners Group Ltd 81,372,906 656,679,351 8.4% 2.0% 8.07 8.09 0.2% 14,980 18.39 19.88 4.02 2.37 10.24
268 Kingdee International Software Group Co Ltd 181,715,229 770,472,571 8.4% -2.6% 4.24 4.35 2.6% 12,624 46.90 35.62 3.09 0.08 8.20
2380 China Power International Development Ltd 273,854,154 676,419,760 8.4% -0.2% 2.47 2.48 0.4% 18,241 11.93 6.79 0.59 3.88 13.21
330 Esprit Holdings Ltd 121,320,479 570,206,251 8.1% 0.7% 4.70 4.26 -9.4% 8,145 37.37 20.00 0.72 1.13 13.46
522 ASM Pacific Technology Ltd 25,848,170 3,024,235,890 8.0% -15.0% 117.00 124.9 6.8% 50,962 18.94 18.74 4.88 2.27 8.31
2009 BBMG Corp 182,089,863 699,225,074 8.0% 15.0% 3.84 3.76 -2.1% 65,005 10.30 7.59 0.75 1.66 5.62
665 Haitong International Securities Group Ltd 174,300,297 768,664,310 7.9% 1.2% 4.41 4.58 3.9% 24,817 11.45 9.64 1.05 4.32 9.35
257 China Everbright International Ltd 185,746,967 2,043,216,637 7.8% -1.5% 11.00 10.8 -1.8% 48,413 13.65 11.40 2.40 2.43 16.42
3898 Zhuzhou CRRC Times Electric Co Ltd 40,602,179 1,875,820,670 7.7% 0.6% 46.20 44.65 -3.4% 52,485 15.46 13.39 2.66 1.27 15.15
2298 Cosmo Lady China Holdings Co Ltd 63,847,664 192,819,945 7.6% 0.9% 3.02 3.08 2.0% 6,611 17.49 14.18 1.74 2.06 46.62

5
Figure 5: Top 50 short selling stocks (ranked by absolute amount)
Sources: HKSFC, Bloomberg, CGIS Research
Ticker Company name
Aggregated
reportable
short positions
on Nov 3
(shares)
Aggregated
reportable short
positions on Nov
3 (HK$)
% of
free
float
Change in
short
positions
compared
with Oct 27
Price on
Nov 3
(HK$)
Price on
Nov 10
(HK$)
Price
change
during
the
period
Market cap
(HK$m)
2017E
PER (x)
2018E
PER (x) PBR (x)
2017E
Dividend
yield (%)
Aggregated
reportable
short
positions
on Nov 3/ 3-
month
average
daily
turnover
2318 Ping An Insurance Group Co of China Ltd 1,402,610,896 99,164,590,347 26.1% -0.7% 70.70 75.8 7.2% 1,453,623 16.04 13.63 2.63 1.56 36.96
700 Tencent Holdings Ltd 112,526,971 41,409,925,328 2.0% -1.0% 368.00 385.4 4.7% 3,660,885 48.78 38.09 14.49 0.22 6.17
1211 BYD Co Ltd 116,878,771 7,947,756,428 16.0% 2.1% 68.00 71.85 5.7% 209,788 37.02 24.65 3.32 0.51 9.89
981 Semiconductor Manufacturing International Corp 550,981,677 7,636,606,043 14.3% 0.1% 13.86 13.84 -0.1% 64,515 47.94 34.78 1.76 - 12.09
939 China Construction Bank Corp 999,225,723 6,844,696,203 1.1% -1.2% 6.85 6.83 -0.3% 1,718,661 6.06 5.65 0.87 4.93 3.39
3333 China Evergrande Group 216,154,617 6,311,714,816 9.7% 1.0% 29.20 31.35 7.4% 412,382 11.78 9.88 3.46 2.50 5.57
388 Hong Kong Exchanges & Clearing Ltd 26,858,433 6,021,660,679 2.2% 0.9% 224.20 229.6 2.4% 284,660 39.37 34.77 8.01 2.29 4.20
1918 Sunac China Holdings Ltd 143,546,251 5,325,565,912 7.3% 2.5% 37.10 36.9 -0.5% 152,895 31.94 13.75 5.25 1.06 5.48
151 Want Want China Holdings Ltd 727,373,902 4,786,120,275 14.5% -0.8% 6.58 6.73 2.3% 84,177 22.66 21.63 5.59 2.01 49.63
992 Lenovo Group Ltd 1,041,257,639 4,737,722,257 17.4% -2.1% 4.55 4.55 0.0% 50,544 14.58 10.05 2.05 3.77 18.51
5 HSBC Holdings PLC 62,377,653 4,715,750,567 0.3% 22.6% 75.60 75.95 0.5% 1,518,049 14.59 13.83 1.02 5.24 2.92
2333 Great Wall Motor Co Ltd 474,891,633 4,592,202,091 16.0% 12.8% 9.67 9.26 -4.2% 109,823 12.46 8.73 1.55 2.50 8.90
3968 China Merchants Bank Co Ltd 148,830,980 4,412,838,557 3.5% 7.2% 29.65 30.65 3.4% 796,500 9.50 8.42 1.50 3.11 6.73
1398 Industrial & Commercial Bank of China Ltd 627,666,468 3,922,915,425 0.8% -7.8% 6.25 6.2 -0.8% 2,380,852 6.67 6.26 0.94 4.49 1.96
2018 AAC Technologies Holdings Inc 27,366,427 3,823,089,852 3.1% -10.3% 139.70 169.4 21.3% 207,007 32.62 25.29 11.82 1.15 5.39
762 China Unicom Hong Kong Ltd 313,317,112 3,690,875,579 5.2% 14.5% 11.78 11.94 1.4% 285,928 56.18 28.49 1.05 0.82 6.14
1928 Sands China Ltd 97,309,953 3,683,181,721 4.1% -1.6% 37.85 37.6 -0.7% 303,565 24.97 21.90 10.79 5.40 7.31
1299 AIA Group Ltd 57,360,328 3,455,959,762 0.5% 2.3% 60.25 61.6 2.2% 743,773 18.49 17.78 2.49 1.66 3.27
2007 Country Garden Holdings Co Ltd 282,716,993 3,437,838,635 3.8% -5.9% 12.16 12.28 1.0% 261,481 13.29 9.47 2.85 2.48 5.65
3 Hong Kong & China Gas Co Ltd 224,418,844 3,321,398,891 2.8% 3.3% 14.80 14.8 0.0% 207,017 26.52 25.30 3.66 2.36 25.14
2600 Aluminum Corp of China Ltd 535,609,386 3,224,368,504 14.8% 0.5% 6.02 5.81 -3.5% 86,591 28.94 13.56 1.97 - 8.69
1038 CK Infrastructure Holdings Ltd 46,368,567 3,153,062,556 7.6% 1.4% 68.00 68 0.0% 180,246 16.19 15.01 1.82 3.52 30.98
522 ASM Pacific Technology Ltd 25,848,170 3,024,235,890 8.0% -15.0% 117.00 124.9 6.8% 50,962 18.94 18.74 4.88 2.27 8.31
66 MTR Corp Ltd 66,198,998 2,969,025,060 4.2% 3.7% 44.85 45 0.3% 270,269 27.06 27.86 1.74 6.83 20.02
1044 Hengan International Group Co Ltd 38,446,828 2,923,881,269 5.5% -0.8% 76.05 78.9 3.7% 95,066 21.36 19.99 5.30 3.04 11.67
2688 ENN Energy Holdings Ltd 49,588,018 2,868,666,841 6.6% 3.9% 57.85 57.5 -0.6% 62,251 15.35 13.48 3.34 1.98 23.52
914 Anhui Conch Cement Co Ltd 86,708,651 2,783,347,697 7.4% 1.7% 32.10 31.6 -1.6% 158,494 10.67 10.28 1.78 3.31 8.53
1988 China Minsheng Banking Corp Ltd 355,333,599 2,665,001,993 5.9% 2.9% 7.50 7.47 -0.4% 343,656 4.82 4.66 0.64 4.12 6.71
2382 Sunny Optical Technology Group Co Ltd 22,010,595 2,606,054,448 2.8% 9.6% 118.40 140.6 18.8% 154,238 49.50 34.44 22.99 0.48 2.71
2282 MGM China Holdings Ltd 142,179,796 2,587,672,287 16.2% 3.0% 18.20 19.5 7.1% 74,101 32.18 26.10 9.37 1.22 19.97
607 Fullshare Holdings Ltd 764,769,847 2,569,626,686 11.1% -6.1% 3.36 3.3 -1.8% 65,106 n.a. n.a. 2.58 n.a. 28.15
175 Geely Automobile Holdings Ltd 102,346,547 2,476,786,437 1.9% 2.4% 24.20 26.25 8.5% 235,394 21.85 16.27 7.13 0.91 2.04
2 CLP Holdings Ltd 31,052,599 2,462,471,101 1.7% 0.9% 79.30 79.35 0.1% 200,474 15.64 15.08 1.97 3.64 14.47
3800 GCL-Poly Energy Holdings Ltd 1,828,970,671 2,450,820,699 14.0% -1.6% 1.34 1.44 7.5% 26,767 10.48 10.05 1.04 - 9.05
941 China Mobile Ltd 31,068,693 2,449,766,443 0.5% -5.0% 78.85 80.3 1.8% 1,644,181 12.29 11.53 1.37 8.15 1.75
27 Galaxy Entertainment Group Ltd 45,018,635 2,428,755,358 1.9% 3.6% 53.95 57.1 5.8% 245,852 26.55 24.12 4.85 1.08 3.88
1114 Brilliance China Automotive Holdings Ltd 108,070,963 2,135,482,229 3.5% -3.2% 19.76 20.95 6.0% 105,698 17.75 11.75 3.34 0.63 5.64
257 China Everbright International Ltd 185,746,967 2,043,216,637 7.8% -1.5% 11.00 10.8 -1.8% 48,413 13.65 11.40 2.40 2.43 16.42
322 Tingyi Cayman Islands Holding Corp 161,353,374 2,020,144,242 8.9% -2.2% 12.52 12.36 -1.3% 69,295 36.68 29.99 4.10 1.29 24.95
2638 HK Electric Investments & HK Electric Investments Ltd 275,355,622 1,979,806,922 12.2% 1.1% 7.19 7.18 -0.1% 63,444 18.51 18.46 1.31 5.46 64.69
493 GOME Retail Holdings Ltd 1,941,020,256 1,902,199,851 18.2% -0.5% 0.98 0.99 1.0% 21,342 36.66 22.19 0.88 1.19 17.20
135 Kunlun Energy Co Ltd 264,187,553 1,891,582,879 8.7% -3.7% 7.16 7.12 -0.6% 57,475 11.27 10.26 1.28 2.28 18.81
656 Fosun International Ltd 98,649,243 1,876,308,602 4.3% -9.4% 19.02 18.34 -3.6% 157,414 10.93 9.47 1.36 1.43 5.66
3898 Zhuzhou CRRC Times Electric Co Ltd 40,602,179 1,875,820,670 7.7% 0.6% 46.20 44.65 -3.4% 52,485 15.46 13.39 2.66 1.27 15.15
2628 China Life Insurance Co Ltd 68,396,317 1,863,799,638 0.9% -4.0% 27.25 27.7 1.7% 1,038,296 22.45 19.59 2.16 1.60 1.42
857 PetroChina Co Ltd 328,700,925 1,735,540,884 1.5% -4.8% 5.28 5.57 5.5% 1,712,911 32.49 22.17 0.73 2.36 2.89
3323 China National Building Material Co Ltd 264,211,170 1,717,372,605 9.0% -2.3% 6.50 6.64 2.2% 35,850 11.18 10.65 0.72 1.89 6.65
6030 CITIC Securities Co Ltd 98,116,506 1,707,227,204 4.4% -0.9% 17.40 17.58 1.0% 252,531 16.44 14.27 1.23 2.01 5.64
384 China Gas Holdings Ltd 73,080,762 1,706,435,793 4.0% -1.6% 23.35 24.3 4.1% 120,735 20.91 17.67 5.88 1.42 16.67
11 Hang Seng Bank Ltd 9,222,532 1,696,945,888 1.3% -0.3% 184.00 185.7 0.9% 355,029 18.83 17.27 2.58 3.59 9.94
1
China Cement Weekly November 13, 2017
Wong Chi Man—Head of Research
(852) 3698-6317
TCCI to Complete Privatization Soon; North China to Start Large Scale Production Suspension
The national cement price maintained its upward trend last week. The average cement price (nationwide) increased 0.9% week on week to RMB348/tonne last week. Cement prices in some parts of Hebei, Henan, Jiangxi, Hubei, Guangdong, Yunan and Guizhou went up by RMB15-30/tonne; no major regions recorded a decline. Overall, the demand-supply balance remained healthy in early November. Meanwhile, many regions in North China will begin an off-peak production suspension in mid-November. The average inventory level (nationwide) was down to 58.31%.
Coal prices continued to drop slightly. The comprehensive average price index for Bohai-Rim Steam Coal (Q5500K) dropped RMB3/tonne to RMB578/tonne last week. The index was down 4.6% on a year-on-year (YoY) basis.
TCCI to be delisted on November 20. TCCI (1136.HK) announced that the Company will be delisted from the HKEx on November 20, which suggests the privatization plan is close to completion. As SINOMA (1893.HK) will be merged with CNBM soon, there are a limited number of potential M&A targets on the main board. Currently, Asia Cement (0743.HK) is still trading at a very low valuation of 0.37x PBR. Meanwhile, West China Cement (2233.HK) may not look very cheap at 0.86x PBR, but since the current price of HK$1.18 is still far below the previous offer price of HK$1.69 from Conch Cement (0914.HK), we believe investors will continue monitor the Company closely.
Cement stocks under coverage dropped 0.9% on average. The sector was relatively stable last week. Best performer CNBM [3323.HK; BUY] was up 2.2%. CR Cement [1313.HK; BUY], the weakest among our coverage stocks, dropped 2.2% week on week.
China Cement Sector
Sources: Company, Bloomberg, CGIS Research estimates
Valuation Table
Net debt/equity (%)
Company Ticker Rating Price (HK$) Market cap (US$m) 2016 2017E 2018E 2016 2017E 2018E 2016 2017E 2018E 2017EConch Cement 914 HK Equity HOLD 31.60 20,320 17.3 11.1 10.3 1.91 1.62 1.50 9.2 6.8 6.2 Net cashCNBM 3323 HK Equity BUY 6.64 4,596 33.5 10.6 9.0 0.74 0.67 0.64 10.9 8.8 8.2 212 BBMG 2009 HK Equity HOLD 3.76 8,334 15.1 11.8 9.8 0.79 0.77 0.71 15.2 10.0 8.5 84 CR Cement 1313 HK Equity BUY 4.93 4,129 17.2 9.1 8.9 1.24 1.15 1.08 9.6 6.8 6.7 43
Simple average 20.8 10.6 9.5 1.17 1.05 0.98 11.2 8.1 7.4 113 Weighted average 18.8 11.0 9.9 1.44 1.26 1.17 10.8 7.7 7.0 49
PER (x) PBR (x) EV/EBITDA(x)
2016 -2018E PEG(x)
Company Ticker 2017E 2018E CAGR (%) 2017E 2016 2017E 2018E 2016 2017E 2018EConch Cement 914 HK Equity 51.8 10.8 29.7 0.4 11.48 15.55 15.30 1.8 3.5 3.4 CNBM 3323 HK Equity 202.9 19.9 90.6 0.1 2.22 6.52 7.35 0.7 2.0 2.2 CR Cement 1313 HK Equity 93.4 1.8 40.3 0.3 7.14 13.32 12.53 1.8 5.2 5.1 BBMG 2009 HK Equity 27.2 23.7 25.5 0.4 5.64 6.48 7.54 1.6 1.6 1.8
Simple average 93.8 14.1 46.5 0.3 6.62 10.47 10.68 1.5 3.1 3.1 Weighted average 69.5 13.8 37.4 0.3 8.56 12.17 12.28 1.6 3.1 3.1
EPS Growth (%) ROE (%) Dividend yield (%)
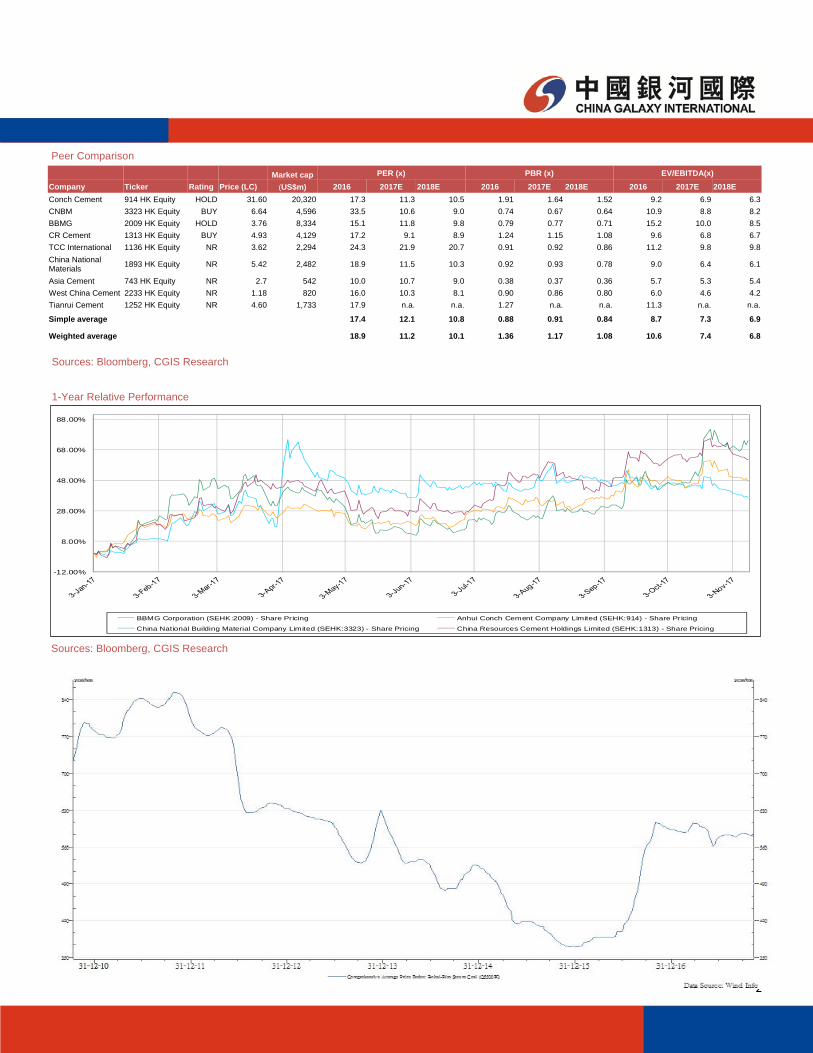
2
1-Year Relative Performance
Sources: Bloomberg, CGIS Research
Peer Comparison
Sources: Bloomberg, CGIS Research
Market cap PER (x) PBR (x) EV/EBITDA(x)
Company Ticker Rating Price (LC) (US$m) 2016 2017E 2018E 2016 2017E 2018E 2016 2017E 2018E
Conch Cement 914 HK Equity HOLD 31.60 20,320 17.3 11.3 10.5 1.91 1.64 1.52 9.2 6.9 6.3
CNBM 3323 HK Equity BUY 6.64 4,596 33.5 10.6 9.0 0.74 0.67 0.64 10.9 8.8 8.2
BBMG 2009 HK Equity HOLD 3.76 8,334 15.1 11.8 9.8 0.79 0.77 0.71 15.2 10.0 8.5
CR Cement 1313 HK Equity BUY 4.93 4,129 17.2 9.1 8.9 1.24 1.15 1.08 9.6 6.8 6.7
TCC International 1136 HK Equity NR 3.62 2,294 24.3 21.9 20.7 0.91 0.92 0.86 11.2 9.8 9.8
China National Materials
1893 HK Equity NR 5.42 2,482 18.9 11.5 10.3 0.92 0.93 0.78 9.0 6.4 6.1
Asia Cement 743 HK Equity NR 2.7 542 10.0 10.7 9.0 0.38 0.37 0.36 5.7 5.3 5.4
West China Cement 2233 HK Equity NR 1.18 820 16.0 10.3 8.1 0.90 0.86 0.80 6.0 4.6 4.2
Tianrui Cement 1252 HK Equity NR 4.60 1,733 17.9 n.a. n.a. 1.27 n.a. n.a. 11.3 n.a. n.a.
Simple average 17.4 12.1 10.8 0.88 0.91 0.84 8.7 7.3 6.9
Weighted average 18.9 11.2 10.1 1.36 1.17 1.08 10.6 7.4 6.8
-12.00%
8.00%
28.00%
48.00%
68.00%
88.00%
BBMG Corporation (SEHK:2009) - Share Pricing Anhui Conch Cement Company Limited (SEHK:914) - Share Pricing
China National Building Material Company Limited (SEHK:3323) - Share Pricing China Resources Cement Holdings Limited (SEHK:1313) - Share Pricing

3
Figure 1: Regional Cement Price
Sources: Digital Cement, CGIS Research

12
Disclaimer
This research report is not directed at, or intended for distribu on to or used by, any person or en ty who is a ci zen or resident of or located in any jurisdic on where such distribu on, publica on, availability or use would be contrary to applicable law or regula on or which would subject China Galaxy Interna onal Securi es (Hong Kong) Co., Limited (“Galaxy Interna onal Securi es”) and/or its group companies to any registra on or licensing requirement within such jurisdic on.
This report (including any informa on a ached) is issued by Galaxy Interna onal Securi es, one of the subsidiaries of the China Galaxy Interna onal Financial Holdings Limited, to the ins tu onal clients from the informa on sources believed to be reliable, but no representa on or warranty (expressly or implied) is made as to their accuracy, correctness and/or completeness.
This report shall not be construed as an offer, invita on or solicita on to buy or sell any securi es of the company(ies) referred to herein. Past perfor‐mance should not be taken as an indica on or guarantee of future performance, and no representa on or warranty, express or implied, is made regard‐ing future performance. The recipient of this report should understand and comprehend the investment objec ves and its related risks, and where necessary consult their own independent financial advisers prior to any investment decision.
Where any part of the informa on, opinions or es mates contained herein reflects the personal views and opinions of the analyst who prepared this report, such views and opinions may not correspond to the published views or investment decisions of China Galaxy Interna onal Financial Holdings Limited and any of its subsidiaries (“China Galaxy Interna onal”), directors, officers, agents and employees (“the Relevant Par es”).
All opinions and es mates reflect the judgment of the analyst on the date of this report and are subject to change without no ce. China Galaxy Interna‐onal and/or the Relevant Par es hereby disclaim any of their liabili es arising from the inaccuracy, incorrectness and incompleteness of this report
and its a achment/s and/or any ac on or omission made in reliance thereof. Accordingly, this report must be read in conjunc on with this disclaimer.
Disclosure of Interests
China Galaxy Securi es Co., Ltd. (6881.HK; 601881.CH) is the direct and/or indirect holding company of the group of companies under China Galaxy Interna onal.
China Galaxy Interna onal may have financial interests in rela on to the subjected company(ies) the securi es in respect of which are reviewed in this report, and such interests aggregate to an amount may equal to or more than 1 % of the subjected company(ies)’ market capitaliza on.
One or more directors, officers and/or employees of China Galaxy Interna onal may be a director or officer of the securi es of the company(ies) men‐oned in this report.
China Galaxy Interna onal and the Relevant Par es may, to the extent permi ed by law, from me to me par cipate or invest in financing transac‐ons with the securi es of the company(ies) men oned in this report, perform services for or solicit business from such company(ies), and/or have a
posi on or holding, or other material interest, or effect transac ons, in such securi es or op ons thereon, or other investments related thereto.
China Galaxy Interna onal may have served as manager or co‐manager of a public offering of securi es for, or currently may make a primary market in issues of, any or all of the en es men oned in this report or may be providing, or have provided within the last 12 months, significant advice or invest‐ment services in rela on to the investment concerned or a related investment or investment banking services to the company(ies) men oned in this report.
Furthermore, China Galaxy Interna onal may have received compensa on for investment banking services from the company(ies) men oned in this report within the preceding 12 months and may currently seeking investment banking mandate from the subject company(ies).
Analyst Cer fica on
The analyst who is primarily responsible for the content of this report, in whole or in part, cer fies that with respect to the securi es or issuer covered in this report: (1) all of the views expressed accurately reflect his or her personal views about the subject, securi es or issuer; and (2) no part of his or her compensa on was, is, or will be, directly or indirectly, related to the specific views expressed by the analyst in this report.
Besides, the analyst confirms that neither the analyst nor his/her associates (as defined in the code of conduct issued by The Hong Kong Securi es and Futures Commission) (1) have dealt in or traded in the securi es covered in this research report within 30 calendar days prior to the date of issue of this report; (2) will deal in or trade in the securi es covered in this research report three business days a er the date of issue of this report; (3) serve as an officer of any of the Hong Kong‐listed companies covered in this report; and (4) have any financial interests in the Hong Kong‐listed companies cov‐ered in this report.
Explana on on Equity Ra ngs
Copyright Reserved
No part of this material may be reproduced or redistributed without the prior wri en consent of China Galaxy Interna onal Securi es (Hong Kong) Co., Limited.
China Galaxy Interna onal Securi es (Hong Kong) Co. Limited, CE No.AXM459
20/F, Wing On Centre, 111 Connaught Road Central, Sheung Wan, Hong Kong. General line: 3698‐6888.
BUY share price will increase by >20% within 12 months in absolute termsSELL share price will decrease by >20% within 12 months in absolute termsHOLD no clear catalyst, and downgraded from BUY pending clearer signal to reinstate BUY or further downgrade to outright SELL
:
:
: