健康照護相關研究論文方向和主題 美和技術學院健管所 邱亨嘉 [email protected]...
DESCRIPTION
健康照護相關研究論文方向和主題 美和技術學院健管所 邱亨嘉 [email protected] 2009/11/11. Health services research is inquiry to produce knowledge (evidence) about the structure, process or effects of personal health services (Institute of Medicine, IOM, 1979). Key roles: Who are they?. - PowerPoint PPT PresentationTRANSCRIPT


Health services research is inquiryto produce knowledge (evidence)
about the structure, process or effects of personal health services
(Institute of Medicine, IOM, 1979)

Key roles: Who are they? Health research is inherently interdisciplinary
in focus: Require professionals and theories to work
together 主角 : Health care clinicians and practitioners 配角 : Sociologist epidemiologist,
demographist, economist 裁判者 / 觀察者 : Policy makers
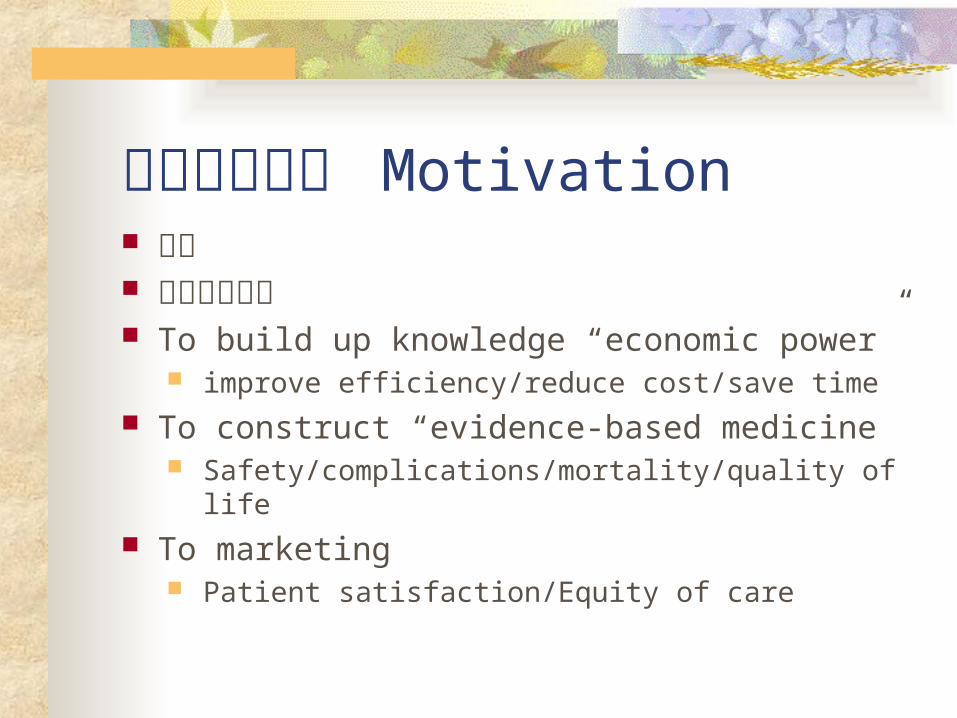
寫作研究論文 Motivation 畢業 發表科學文章 To build up knowledge “economic power”
improve efficiency/reduce cost/save time To construct “evidence-based medicine
Safety/complications/mortality/quality of life To marketing
Patient satisfaction/Equity of care

研究主題激發 : Topics Attract YOU
My curiosity ( 好奇 ) My specialty My interest My boss want me to do!!

Topics selection Added-value
Work Publications Or both of above
Time to finish (2010/7/31 or 2010/12/31) Budget ($$$)

Framework for Classifying Topics and Issues in Health Services Research(2)
Health Policy
Characteristics ofDelivery System- Availability
- Organization - Financing
Characteristics ofPopulation at Risk - Predisposing
- Enabling - Need
Delivery of Medical Care
Equity
Efficiency Effectiveness
Well-Being( Quality of Lif
e )
Structure
Process
Outcome( intermediate 3E)
Outcome( ultimate)
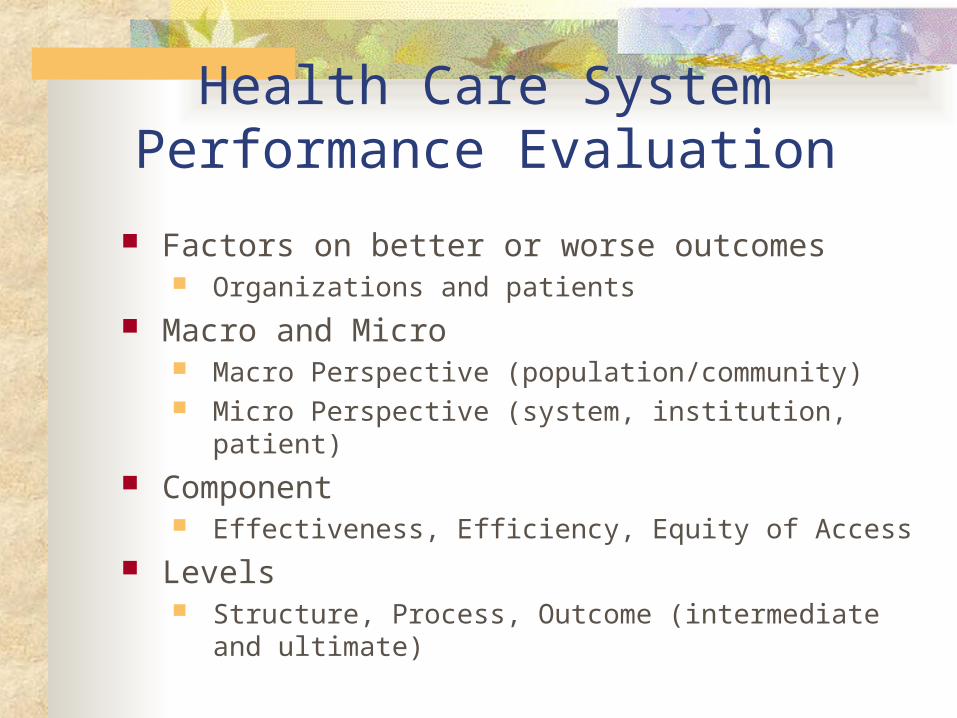
Health Care System Performance Evaluation
Factors on better or worse outcomes Organizations and patients
Macro and Micro Macro Perspective (population/community) Micro Perspective (system, institution, patient)
Component Effectiveness, Efficiency, Equity of Access
Levels Structure, Process, Outcome (intermediate and
ultimate)

Effectiveness: Concept、Methods and Topics
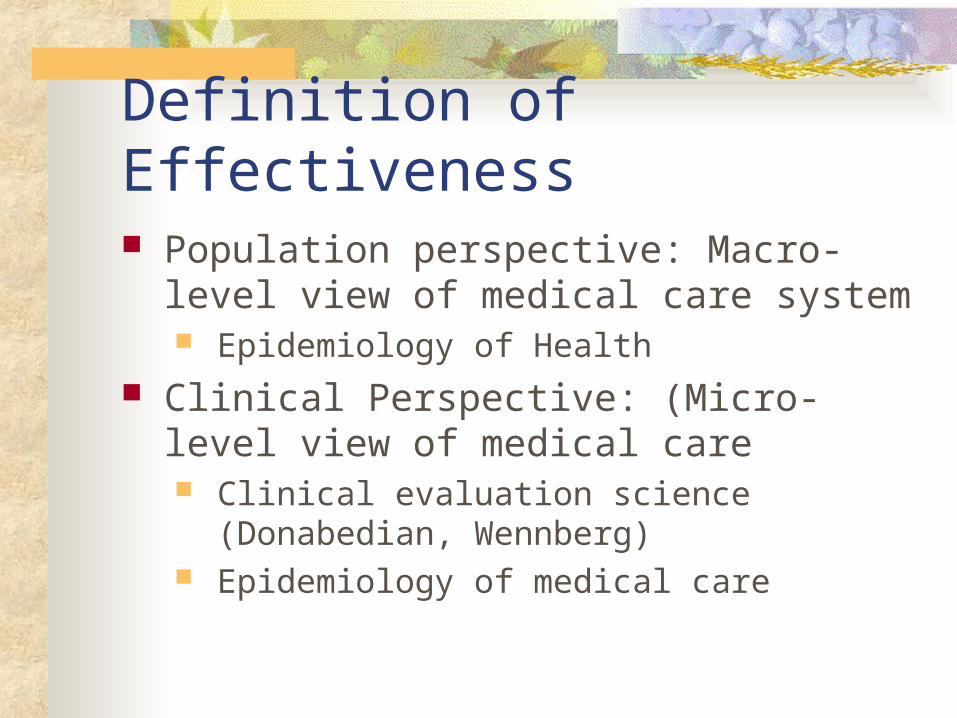
Definition of Effectiveness Population perspective: Macro-level view
of medical care system Epidemiology of Health
Clinical Perspective: (Micro-level view of medical care Clinical evaluation science (Donabedian,
Wennberg) Epidemiology of medical care

Effectiveness: Conceptual framework
Quantity
Efficacy
Variations in Use
- Quantity
- Quality
- Appropriateness
Effectiveness
- Mortality
- Clinical outcomes
- Functional
STRUCTURE PROCESS OUTCOMES
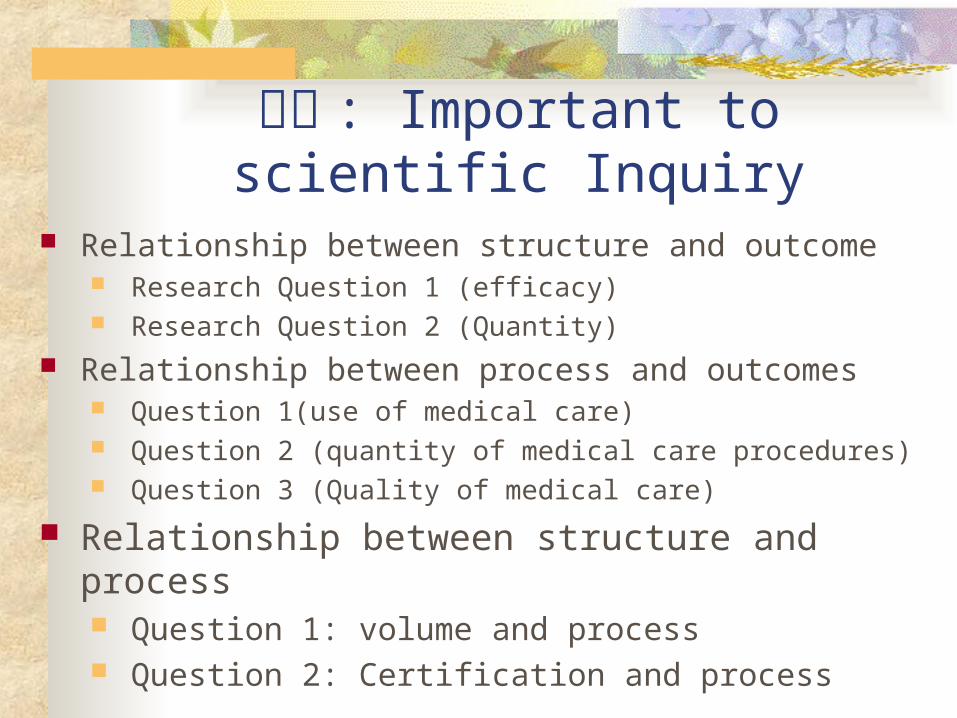
假說 : Important to scientific Inquiry Relationship between structure and outcome
Research Question 1 (efficacy) Research Question 2 (Quantity)
Relationship between process and outcomes Question 1(use of medical care) Question 2 (quantity of medical care procedures) Question 3 (Quality of medical care)
Relationship between structure and process Question 1: volume and process Question 2: Certification and process
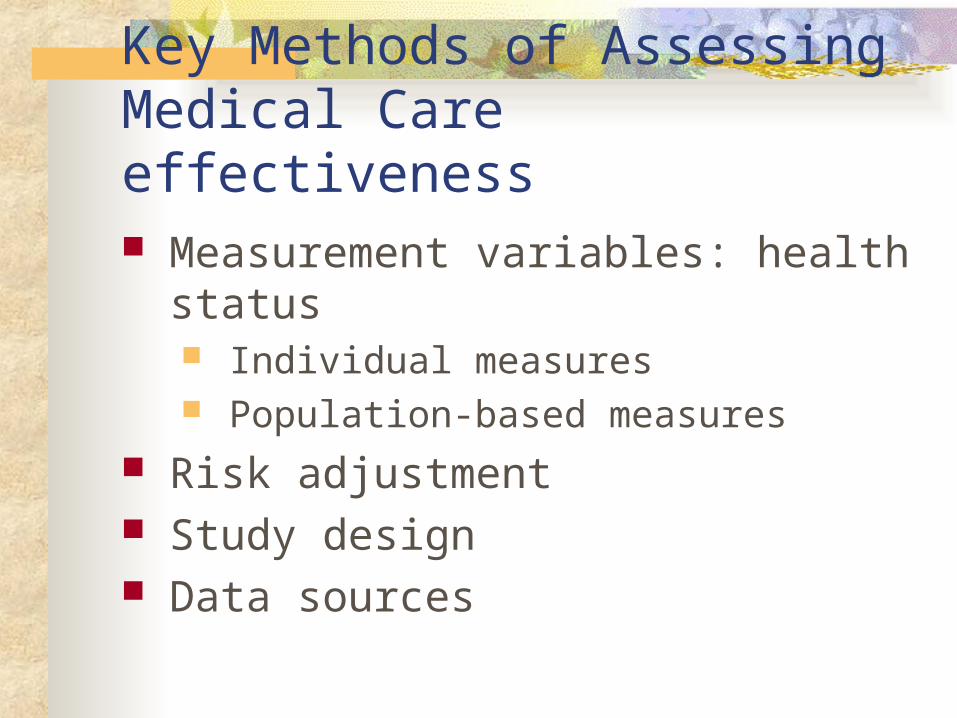
Key Methods of Assessing Medical Care effectiveness Measurement variables: health status
Individual measures Population-based measures
Risk adjustment Study design Data sources
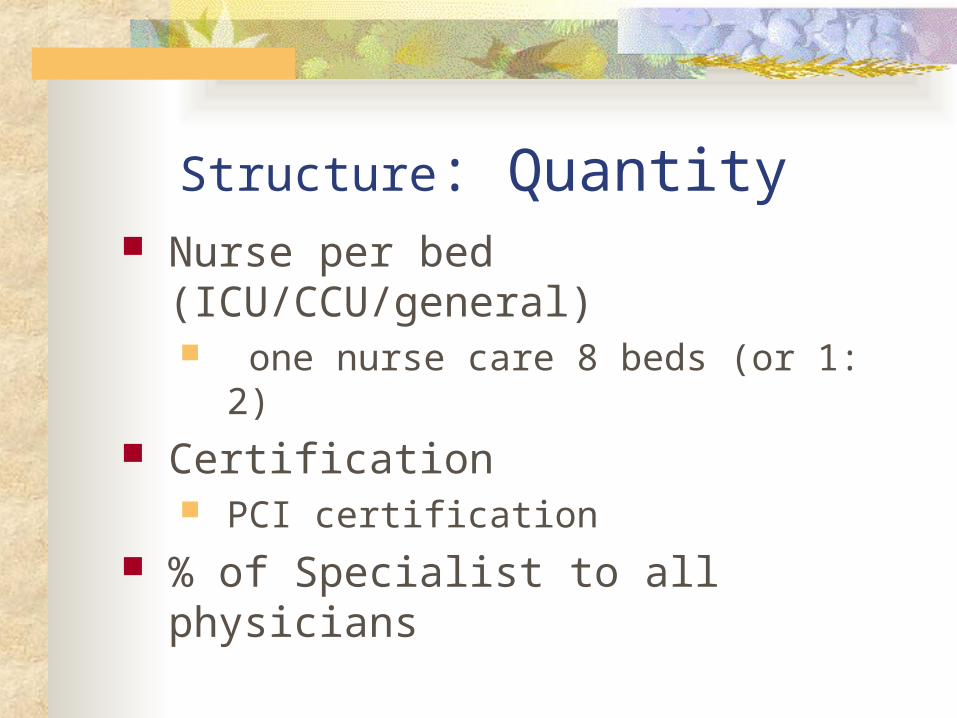
Structure: Quantity Nurse per bed (ICU/CCU/general)
one nurse care 8 beds (or 1: 2) Certification
PCI certification % of Specialist to all physicians

Structure: Efficacy (benefit of (not harm) individual or society)
Golden standard Antibiotic use for Clean wound or infected
wound Supplier for age and disease patterns
Practice Indications for surgical procedures Indications of ESRD Indications of implant/transplant Transfusion appropriateness
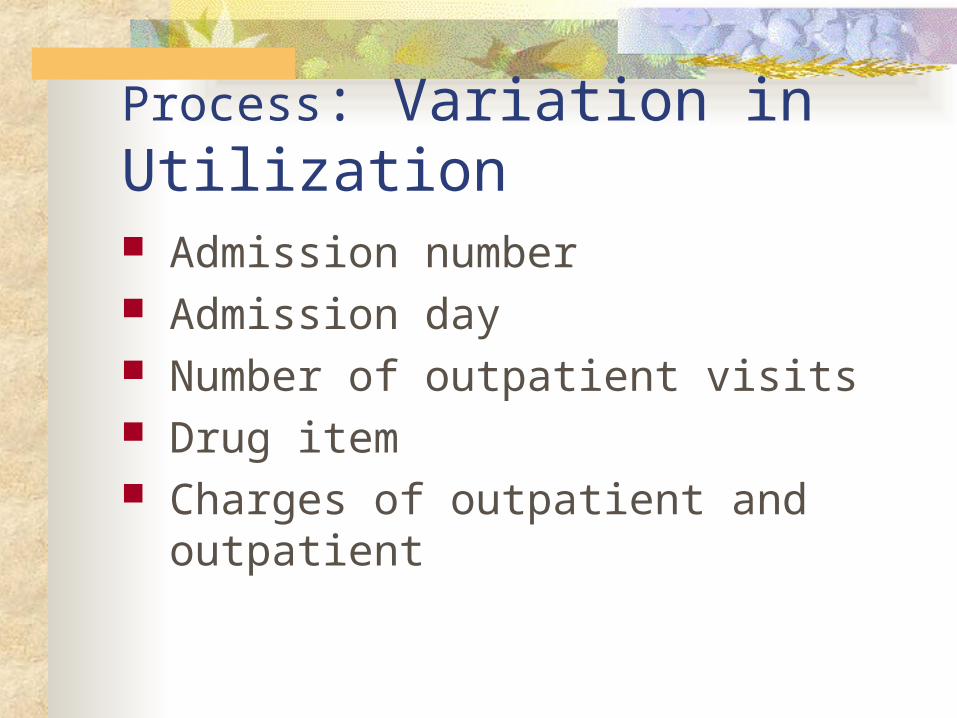
Process: Variation in Utilization Admission number Admission day Number of outpatient visits Drug item Charges of outpatient and outpatient
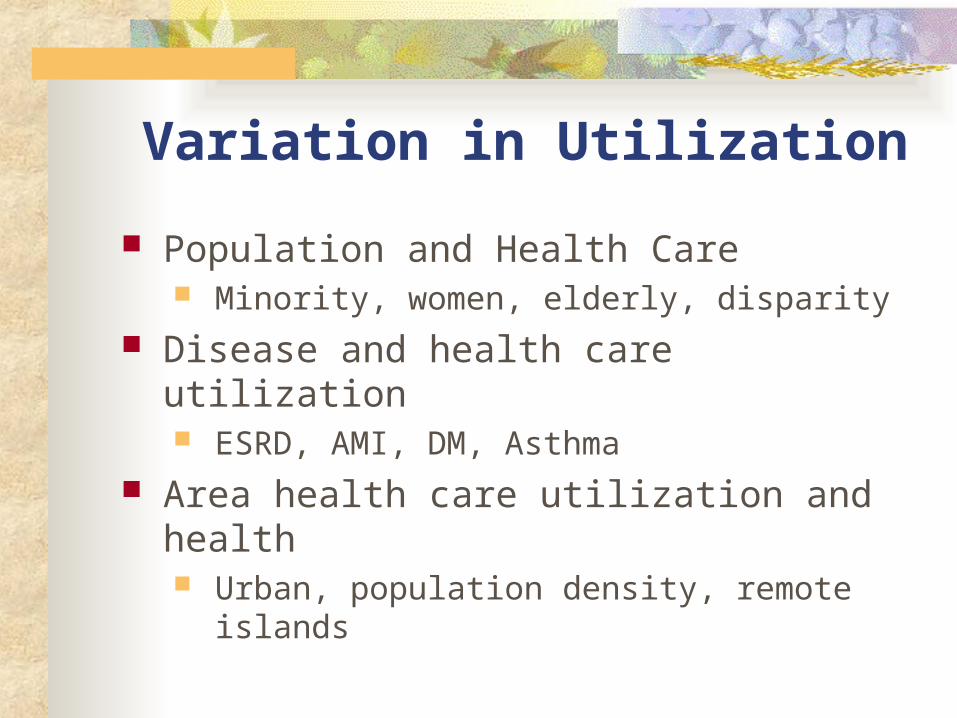
Variation in Utilization
Population and Health Care Minority, women, elderly, disparity
Disease and health care utilization ESRD, AMI, DM, Asthma
Area health care utilization and health Urban, population density, remote islands

Process: Appropriateness
Overuse, under-use or right use? Number? Who provided? Who received?
Medication, antibiotics Percentage/number follow the guidelines

Process: Appropriateness
Treatment or not treatment The thresholds Vs gold standard CS VS NSD
Expensive or inexpensive treatment Transplantation or “tomy” 體外碎石機 Vs. medication Vs. water or
BEER… PTCA, PTCA with stent, drug eluting stent. Cancer patient and treatments
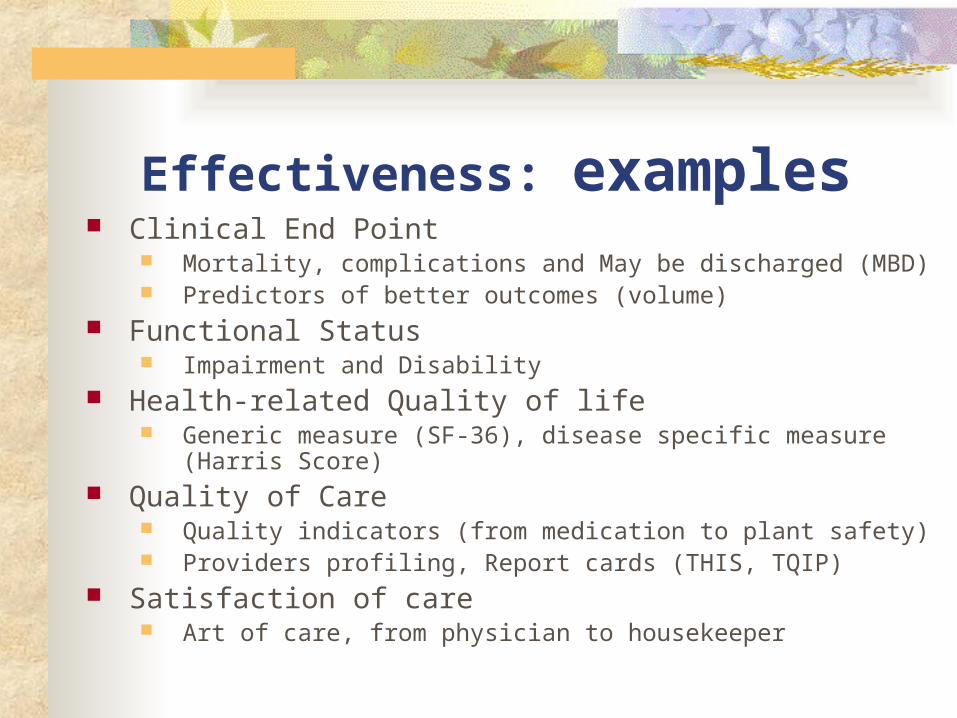
Effectiveness: examples Clinical End Point
Mortality, complications and May be discharged (MBD) Predictors of better outcomes (volume)
Functional Status Impairment and Disability
Health-related Quality of life Generic measure (SF-36), disease specific measure (Harris Score)
Quality of Care Quality indicators (from medication to plant safety) Providers profiling, Report cards (THIS, TQIP)
Satisfaction of care Art of care, from physician to housekeeper

Example: OA patients 關節內注射
關節內注射劑使用
Yes/no
量
Variations in Use
- 不同劑型療程- 施打醫院層級別- 施打科別
- 是否遵照健保局規定流程施打 ( 打完一個療程後半年內不可施打 )
Effectiveness
- 緩解疼痛- 延緩執行 TKR
- 提升健康相關生活品質
STRUCTURE PROCESS OUTCOMES

假說 : Example Relationship between structure and outcome
施打關節內注射劑之 OA 病患,施打三劑與施打五劑者其療效相同
施打關節內注射劑型是否延緩人工膝關節之置換 完整性療程和未完整性療程 關節內注射劑治療較傳統口服止痛藥治療具成本效果
Relationship between process and outcomes 不同科別 ( 骨科 / 復健科 ) 施打關節內注射劑療效是否
相同 少或多

Efficiency: Concept、Methods and Topics

Efficiency: the Concepts Allocation efficiency
Attainment of “right” or most value or mixed of outputs
Production efficiency Produce a given level of output at minimum cost
Dynamic efficiency technological and organizational advances
• Economic efficiency• cost per service (per admission)
• Response efficiency• manpower and hardware
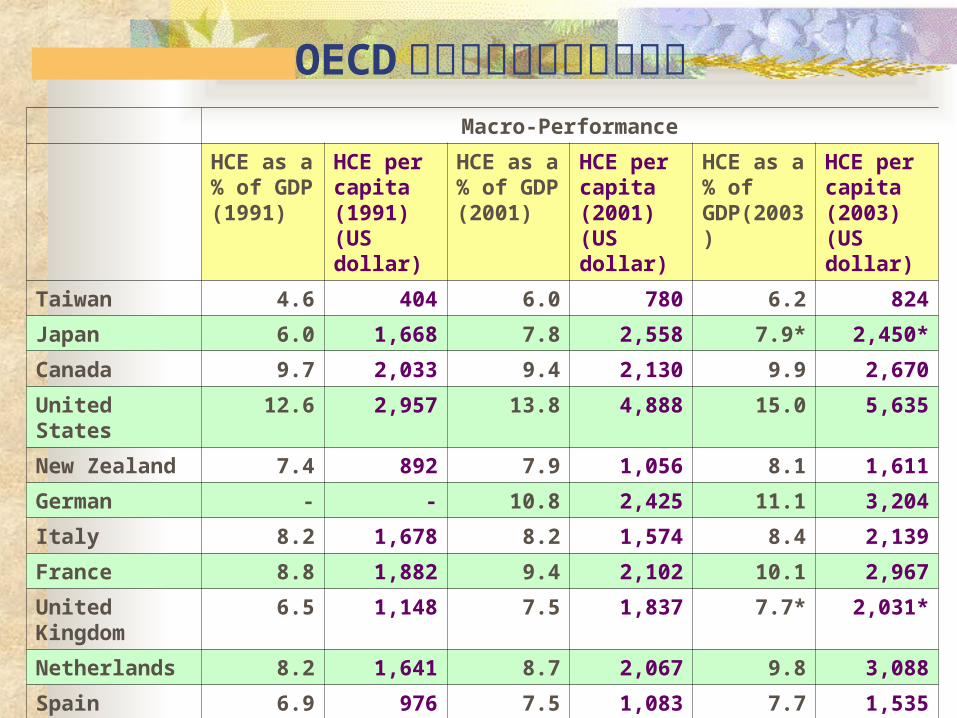
OECD 國家和台灣醫療保健支出Macro-Performance
HCE as a % of GDP (1991)
HCE per capita (1991) (US dollar)
HCE as a % of GDP (2001)
HCE per capita (2001) (US dollar)
HCE as a % of GDP(2003)
HCE per capita (2003)(US dollar)
Taiwan 4.6 404 6.0 780 6.2 824
Japan 6.0 1,668 7.8 2,558 7.9* 2,450*
Canada 9.7 2,033 9.4 2,130 9.9 2,670
United States 12.6 2,957 13.8 4,888 15.0 5,635
New Zealand 7.4 892 7.9 1,056 8.1 1,611
German - - 10.8 2,425 11.1 3,204
Italy 8.2 1,678 8.2 1,574 8.4 2,139
France 8.8 1,882 9.4 2,102 10.1 2,967
United Kingdom 6.5 1,148 7.5 1,837 7.7* 2,031*
Netherlands 8.2 1,641 8.7 2,067 9.8 3,088
Spain 6.9 976 7.5 1,083 7.7 1,535
Sweden 8.2 2,402 8.8 2,172 9.2* 2,494*
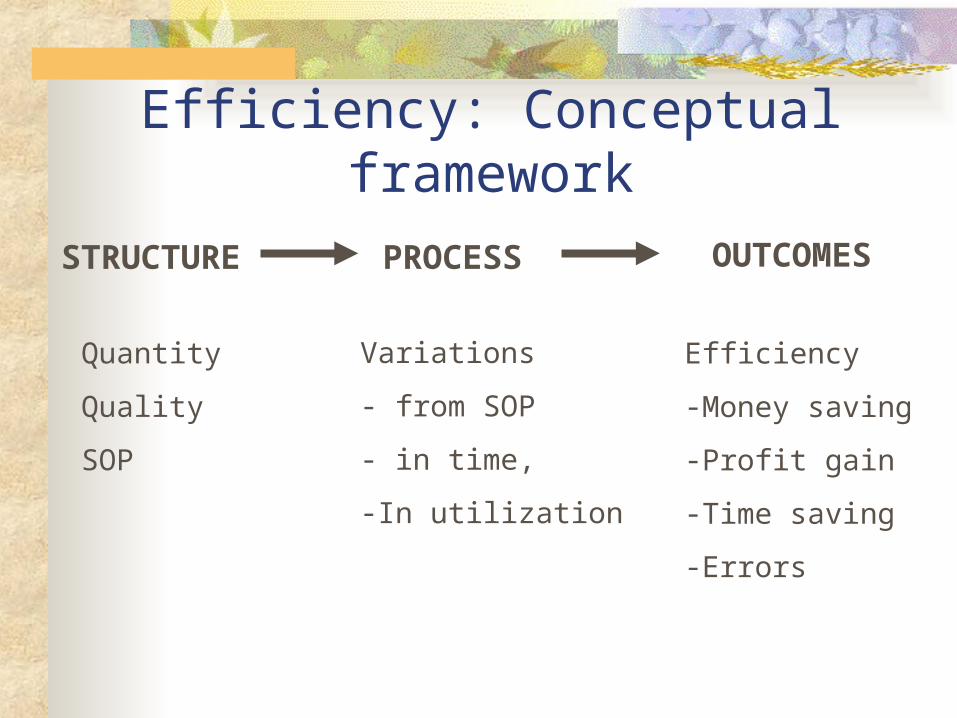
Efficiency: Conceptual framework
Quantity
Quality
SOP
Variations
- from SOP
- in time,
-In utilization
Efficiency
-Money saving
-Profit gain
-Time saving
-Errors
STRUCTURE PROCESS OUTCOMES

Efficiency: Example
- 專業人力
- 人力素質
-SOP/PDCA
-IT 程度
- 設備及設施
- 總額分配設定
Variations In
- deviation from…..
Efficiency
- Less cost
-Less Time
-Less errors
-High satisfaction
STRUCTURE PROCESS OUTCOMES
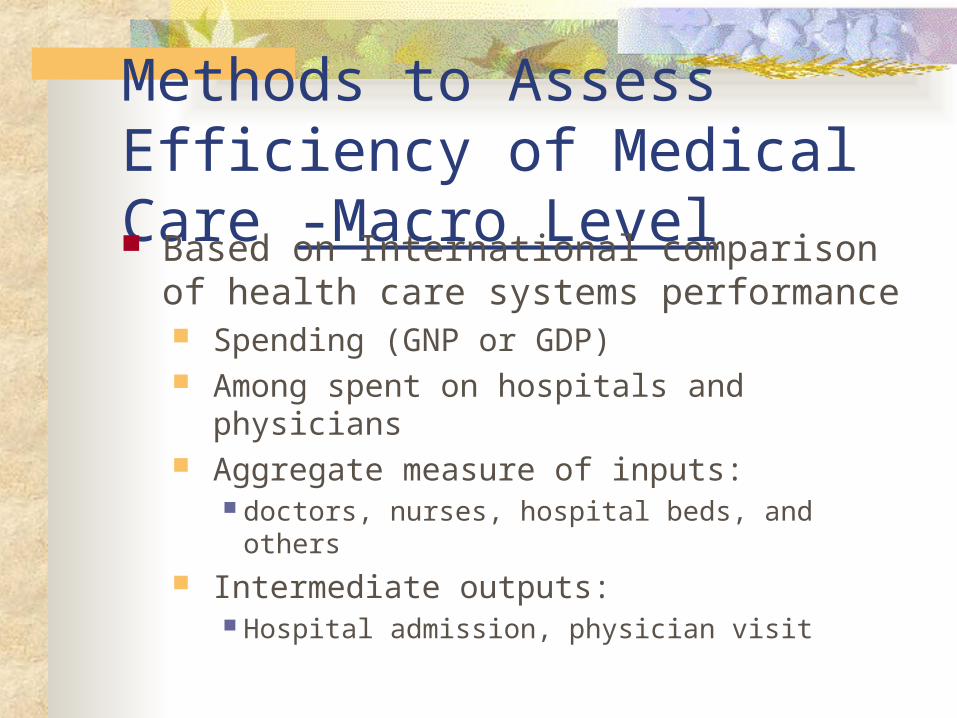
Methods to Assess Efficiency of Medical Care -Macro Level Based on International comparison of
health care systems performance Spending (GNP or GDP) Among spent on hospitals and physicians Aggregate measure of inputs:
doctors, nurses, hospital beds, and others
Intermediate outputs: Hospital admission, physician visit

Efficiency :Outcome measure Hospital Efficiency Comparison
Between hospital and ownership Operating costs (department)
Personnel costs, materials Products
Total hip replacement, CABG, PTCA service line costs
Operating room cost, laboratory cost Errors (repeated errors) Time

Equity Concept、Methods and Topics
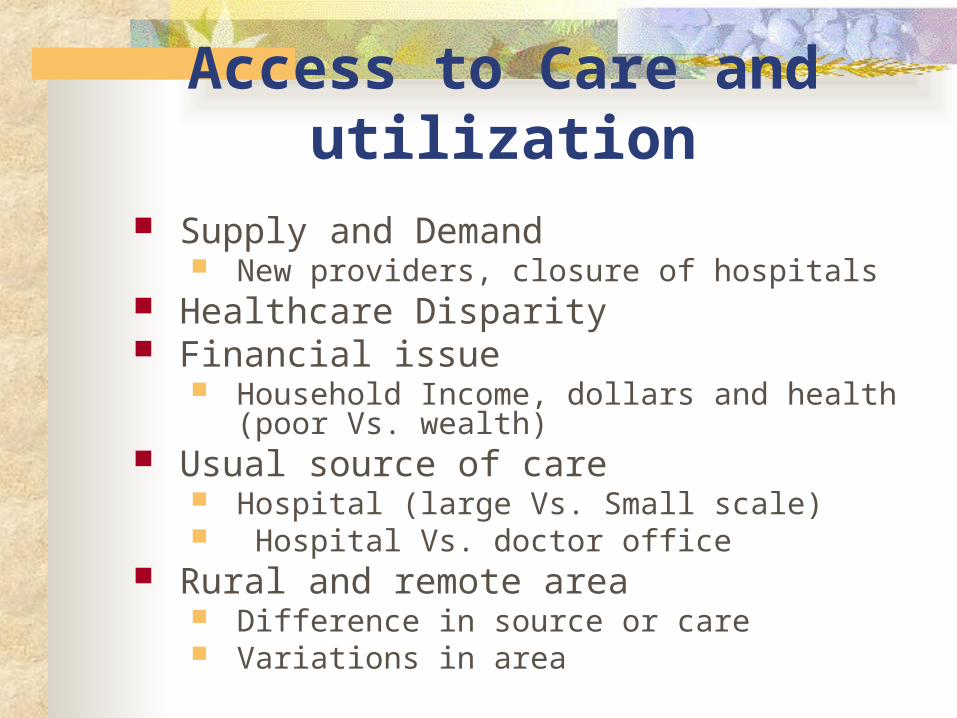
Access to Care and utilization Supply and Demand
New providers, closure of hospitals Healthcare Disparity Financial issue
Household Income, dollars and health (poor Vs. wealth)
Usual source of care Hospital (large Vs. Small scale) Hospital Vs. doctor office
Rural and remote area Difference in source or care Variations in area

Well-Being (Health)Concept、Methods and Topics

Ultimate outcomes Cause and effect
Effectiveness lead to Quality of Life Efficiency lead to Satisfaction,
effectiveness and quality of life Equity lead to effectiveness and
satisfaction
Characteristics of Delivery system:Independent variables
Organization
Availability
Financing
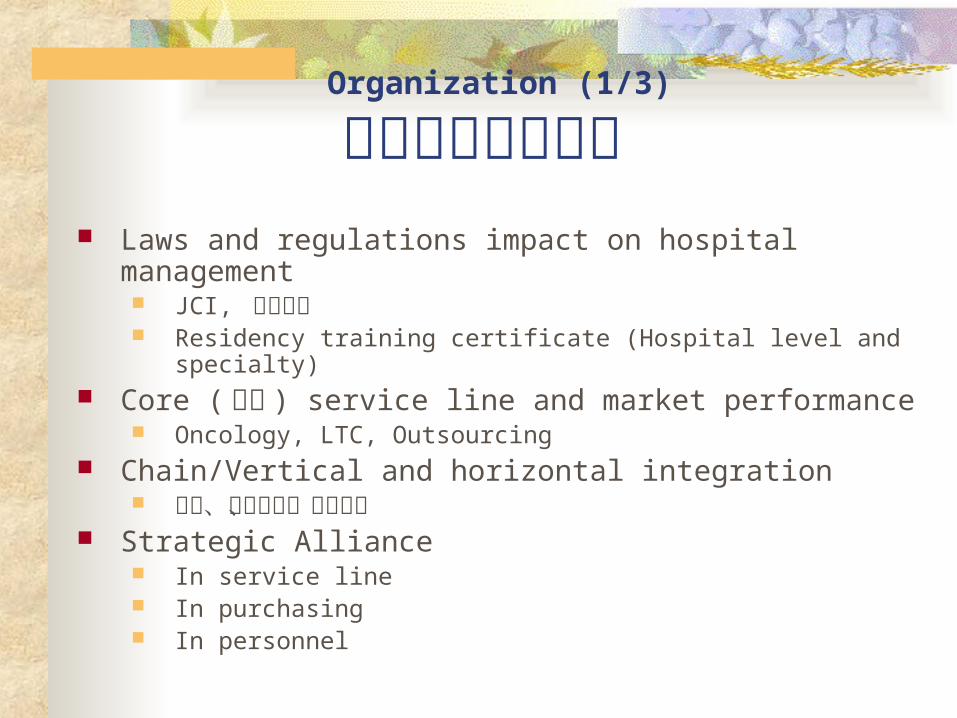
Organization (1/3)
組織策略相關研究
Laws and regulations impact on hospital management JCI, 評鑑等級 Residency training certificate (Hospital level and specialty)
Core ( 核心 ) service line and market performance Oncology, LTC, Outsourcing
Chain/Vertical and horizontal integration 併購、委托經營、組織再照
Strategic Alliance In service line In purchasing In personnel

Organization (2/3)
組織行為相關研究 Work stress and performance
By professions, work design, work hours.. Job Satisfaction, 士氣 and performance
Leadership Burn out and 離職率
Motivation and performance Money VS 非財務報酬 Incentive program and performance Decentralization VS centralization
In personnel, materials
組織文化 正向 VS 負向文化 Patient safety, learning, participation cuture
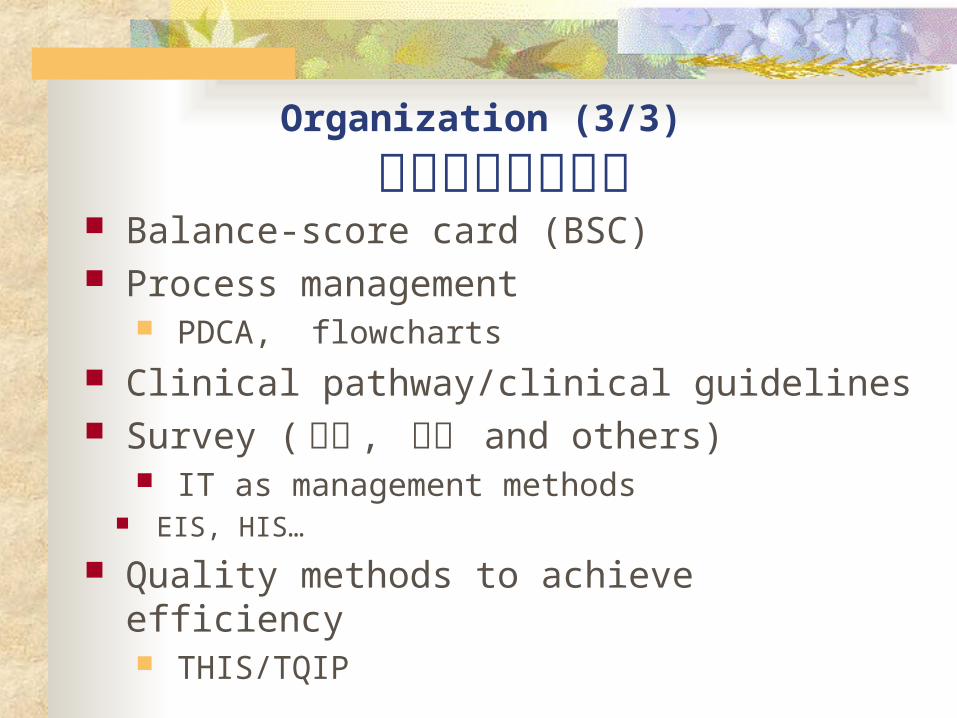
Organization (3/3)
管理方法相關研究 Balance-score card (BSC) Process management
PDCA, flowcharts Clinical pathway/clinical guidelines Survey ( 病人 , 員工 and others)
IT as management methods EIS, HIS…
Quality methods to achieve efficiency THIS/TQIP

流程管理 Medication management and use Lab and examination process Infection control process Fire ( 內部 ) or disaster ( 外部 ) Medical information 醫療儀器維護流程 設施和設備維護流程 食物準備及遞送之流程 Outpatient process Admission process 人員進用和訓練 / 教育 Communication ( 會議前 /後 )
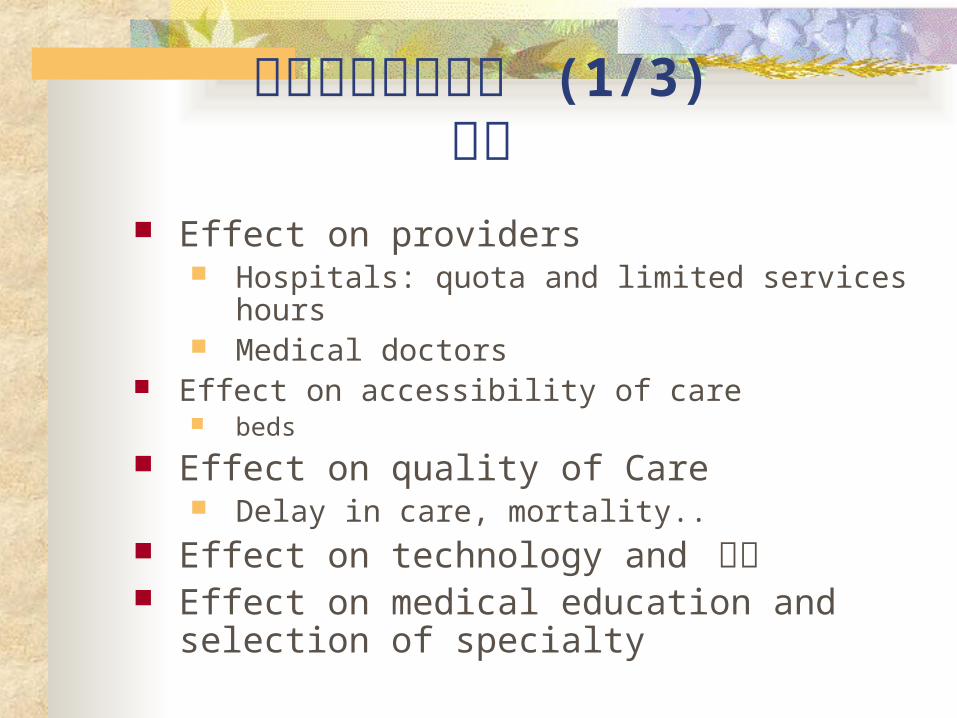
建保給付相關研究 (1/3)總額
Effect on providers Hospitals: quota and limited services hours Medical doctors
Effect on accessibility of care beds
Effect on quality of Care Delay in care, mortality..
Effect on technology and 藥品 Effect on medical education and selection of
specialty

建保給付相關研究 (2/3)
Co-payment Medication Level of hospitals, Procedures
Payment items and services lines ICU to RCW
Technology (PET) Procedures Case management (DM, CKD)

建保給付相關研究 (3/3)DRG
Restructure the service line DRG and Non-DRG service line Win/loss at each individual DRG
Quantity and efficiency Who is qualified for performing which DRG
Quantity and quality Quality as methods to achieve efficiency
Characteristics of Population at risk
Predisposing
Enabling
Need
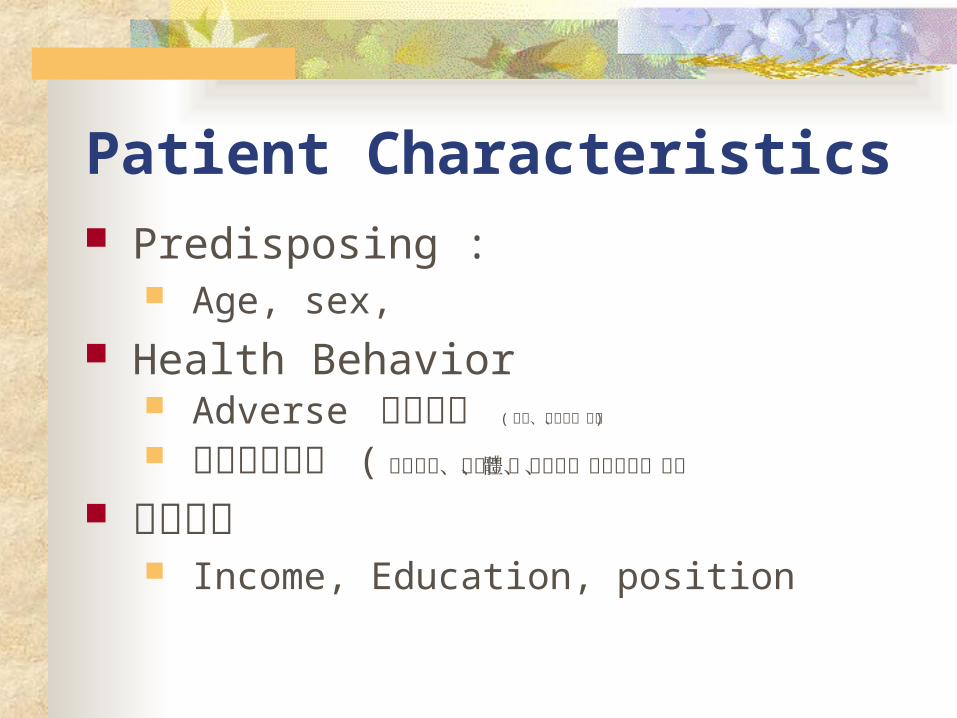
Patient Characteristics Predisposing :
Age, sex, Health Behavior
Adverse 健康行為 ( 抽菸、嚼槟榔、喝酒 )
正向健康行為 ( 交通安全、運動、體重控制、飲食型態、潔牙
社經地位 Income, Education, position
All things consider
Cost Effectiveness Analysis (CEA) Cost-benefit analysis (CBA) Cost Utility Analysis (CUA)
研究可行性 Time Money Knowledge Independent or in group and Materials

46
使用原始或次級資料 原始資料 (primary data)
研究者為特殊目的而收集的資料 直接獲得的第一手情報資料,例如經由問
卷與訪問所蒐集的資料…等 次級資料 (secondary data)
他人所蒐集並經過整理的資料,例如健保資料庫、戶口調查、國民健康訪問調查 等

47
次級資料的來源 政府機構
Health survey Mortality Cancer registry
半官方機構 Claim data 醫院所有之資料
定期 醫院、部門、和個人層次


台灣下背痛患者其健康生活品質及中西醫醫療資源使用
國民健康訪問調查資料庫 + 健保資料
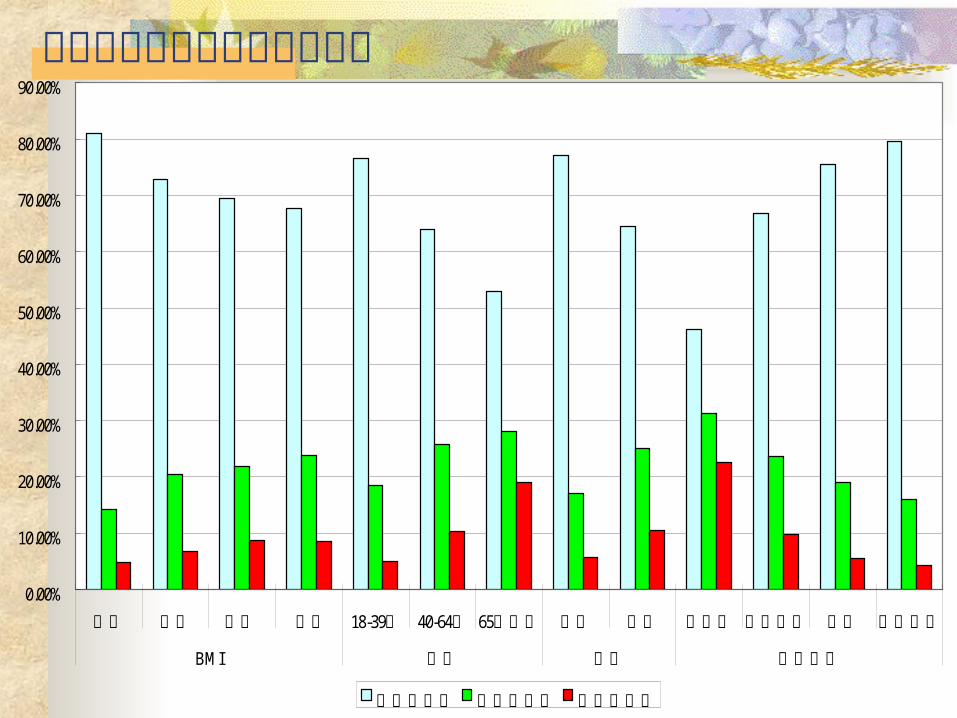
不同程度下背痛的人口學特質
0.00%
10.00%
20.00%
30.00%
40.00%
50.00%
60.00%
70.00%
80.00%
90.00%
過輕 正常 過重 肥胖 18-39歲 40-64歲 65歲以上 男性 女性 不識字 基礎教育 高中 大學以上
BMI 年齡 性別 教育程度
無任何疼痛 偶爾下背痛 常常下背痛

不同程度下背痛的健康相關生活品質【 SF-36八大構面】
0
50
100
Mean無任何疼痛 94.60 88.54 87.54 74.28 71.33 88.50 83.47 74.71
Mean偶爾下背痛 88.59 76.60 72.61 62.91 62.94 83.40 72.83 70.04
Mean常常下背痛 74.74 52.64 55.58 47.65 51.07 74.50 60.65 62.24
身體功能因身體功能問題而角色受限
身體疼痛 一般健康狀況 活力狀況 社會功能因情緒問題而角色受限
心理健康

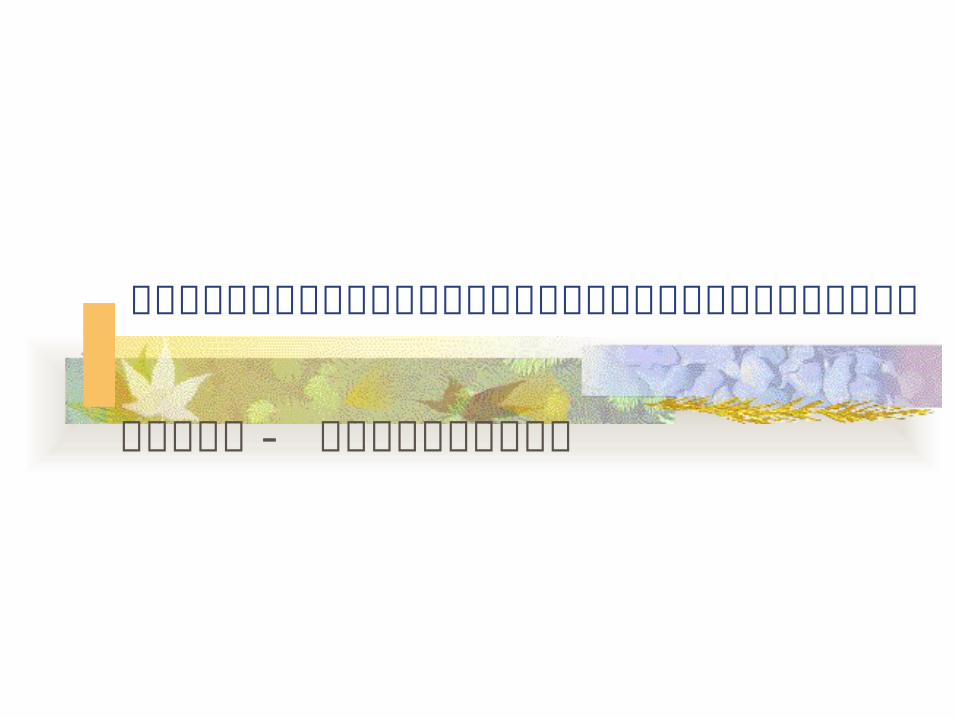
全國施行冠狀動脈繞道術及冠狀動脈介入性治療之醫療品質與資源利用探討
健保資料庫 - 相同疾病探討不同處置
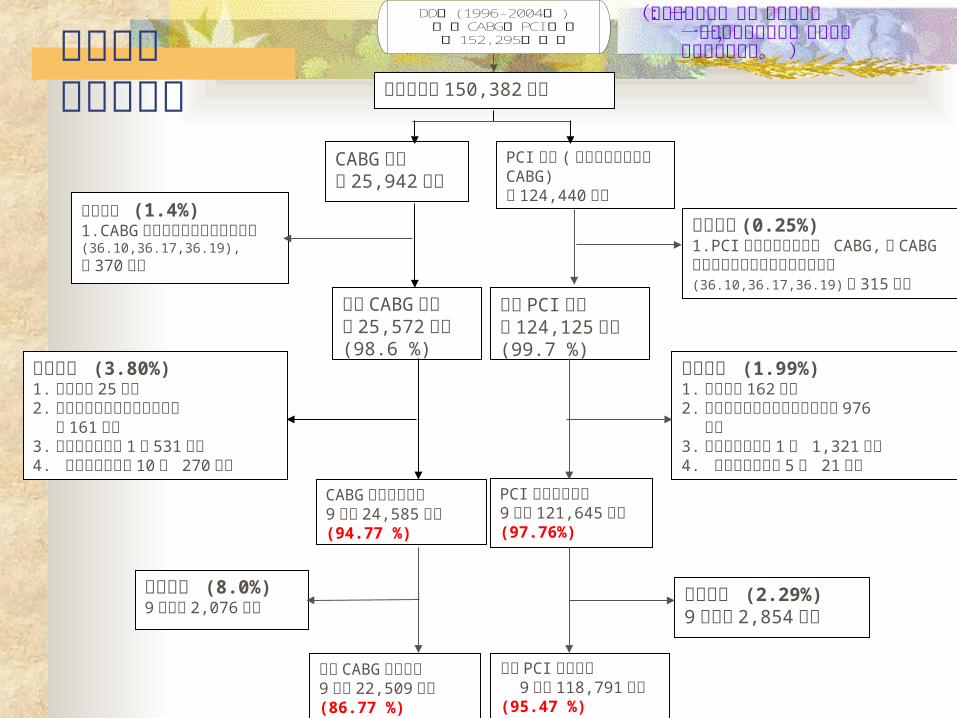
排除個案 (3.80%)1.性別不明 25人次2.非心臟科或外科及醫師資料遺 漏 161人次3.每年醫師數小於 1 例 531人次4. 每年醫院數小於 10例 270人次
排除個案 (1.99%)1.性別不明 162人次2.非心臟科或內科及醫師資料遺漏976 人次3.每年醫師數小於 1 例 1,321人次4. 每年醫院數小於 5 例 21人次
施行 CABG病患共 25,572人次(98.6 %)
施行 PCI病患共 124,125人次(99.7 %)
資料整理後 150,382人次
CABG病患共 25,942人次
PCI病患 ( 包含當次住院併行 CABG)共 124,440人次
排除個案 (1.4%)1.CABG無法分類處置條數之診斷碼(36.10,36.17,36.19),共 370人次
排除個案 (0.25%)1.PCI包含當次住院併行 CABG,故 CABG無法分類處置條數之診斷碼也排除 (36.10,36.17,36.19)共 315人次
CABG醫療品質分析9 年共 24,585人次(94.77 %)
分析 CABG資源利用9 年共 22,509人次(86.77 %)
排除個案 (8.0%)9 年死亡 2,076人次
PCI醫療品質分析9 年共 121,645人次(97.76%)
排除個案 (2.29%)9 年死亡 2,854人次
分析 PCI資源利用 9 年共 118,791人次(95.47 %)
DD檔(1996-2004年) 選取CABG及PCI病患 共152, 295筆資料資料處理
與樣本篩選
(切帳資料處理:同一位病患在同 一次住院中只會留有一筆資料, 並校正住院天數。 )

全國施行 CABG之趨勢變化
15012001 2080
24332862
32033514 3374
3617
2.412.252.342.13
1.911.621.39
11.33
0500
1000150020002500300035004000
1996 1997 1998 1999 2000 2001 2002 2003 2004年份
手術次數
0.0
0.5
1.0
1.5
2.0
2.5
3.0
成長倍數
CABG手術人次 ( 1996 )成長倍數 與 年比
圖 4-1 全國施行 CABG 之逐年概況及成長率 (N=25,572)

全國施行 PCI之趨勢變化
45337032
928411831
1357215780
18170 18637
22806
1 1.55 2.052.61
2.993.48
4.01 4.115.03
0
5000
10000
15000
20000
25000
1996 1997 1998 1999 2000 2001 2002 2003 2004年份
手術次數
0.0
1.0
2.0
3.0
4.0
5.0
6.0
成長倍數
PCI手術人次 ( 1996 )成長倍數 與 年比
圖 4-2 全國施行 PCI 之逐年概況及成長率 (N=124,125)

2006 年 OECD 會員國與我國平均每人 NHE 與平均每人 GDP 比較
0
500
1,000
1,500
2,000
2,500
3,000
3,500
4,000
4,500
5,000
5,500
6,000
6,500
7,000
0 10,000 20,000 30,000 40,000 50,000 60,000 70,000 80,000
平均每人NHE(美元 )
平均每人GDP(美元 )
Taiwan
Norway
Japan2005
Iceland
Denmark
SwedenIreland
Finland
United Kingdom
AustriaCanada
Belgium
Australia2005Italy
Greece
France
New Zealand
Spain
Korea
Czech Republic
Hungary
Slovak Republic2005
Portugal
Turkey2005
Poland
Germany
Mexico
Netherlands
出處 :衛生署統計室資料來源: OECD Health Data 2008附註: 1. 刪除美國 United States 、瑞士 Switzerland 、盧森堡 Luxembourg 3 個國家,其 NHE/GDP 分別為 15.3% 、 11.3% 、 7.3% ,平均每人 GDP 分別為 43,864 美元、 51,970 美元及 67,795 美元。 2. 估計迴歸模式為:平均每人 NHE = 0.0942×平均每人 GDP – 157.8, R2 = 0.953

Hope the lecture inspire your research interest and
bring potential research topics?
Thanks