&kulv 6whoohu - minnesota
TRANSCRIPT

1
Chris Steller
From: Hendrickson, Chris (OHE) <[email protected]>Sent: Wednesday, February 13, 2019 12:23 PMTo: Rep.Connie Bernardy; Rep.Laurie Pryor; Rep.Bud Nornes; Rep.Brian Daniels; Rep.Mary
Franson; Rep.Aisha Gomez; Rep.Ginny Klevorn; Rep.Sandy Layman; Rep.Ben Lien; Rep.Leon Lillie; Rep.Eric Lucero; Rep.Jeanne Poppe; Rep.Duane Quam; Rep.Linda Runbeck; Rep.Samantha Vang; Rep.Dan Wolgamott; Rep.Tou Xiong; Rep.Lyndon Carlson; Chris Steller; Ken Savary; Nathan Hopkins; Sean Herring
Cc: Connolly, Sandy (OHE); DeSalvo, Alaina (OHE); Oliver, Nekey (OHE); Grimes, Tricia (OHE)Subject: 2019 ICAP Legislative ReportAttachments: Preliminary January 2019 ICAP Legislative Report.pdf
Good afternoon, 2018 Minnesota Statutes 136A.861 gives the Minnesota Office of Higher Education the authority to grant awards to postsecondary institutions, school districts, and nonprofit organizations for college preparation services specifically targeting students of color, students from low-income families, and first generation college students in Minnesota. The grant program is called the Intervention for College Attendance Program. The statute also states that a report is required on every odd-numbered year to the legislature outlining outcomes for and impact of the grant program. Attached you will find a report on the 2017 and 2018 Intervention for College Attendance Program outcomes and impact on college readiness for these target groups in Minnesota. You may also access the report here: https://www.ohe.state.mn.us/pdf/ICAP_Report_2-12.pdf. Please let our office know if there are questions. Chris Hendrickson Executive Assistant | Commissioner’s Office
Minnesota Office of Higher Education 1450 Energy Park Drive, Suite 350 St. Paul, MN 55108 O:651-259-3901 C: 612-718-4312 ohe.state.mn.us
This document is made available electronically by the Minnesota Legislative Reference Library as part of an ongoing digital archiving project. http://www.leg.state.mn.us/lrl/lrl.asp

Intervention for College Attendance Program:
2017-2018 Report February 15, 2019

Author
Alaina DeSalvo Competitive Grants Administrator Tel: 651-259-3988 [email protected] Maya BeechamTitle Grants CoordinatorTel: 651-259-xxxx Tel: [email protected]
Author 3
Title Tel: 651-259-xxxx [email protected]
Minnesota Office of Higher Education
1450 Energy Park Drive, Suite 350 Saint Paul, MN 55108-5227 Tel: 651.642.0567 or 800.657.3866 TTY Relay: 800.627.3529 Fax: 651.642.0675 Email: [email protected]
About the Minnesota Office of Higher Education
The Minnesota Office of Higher Education is a cabinet-level state agency providing students with financial aid programs and information to help them gain access to postsecondary education. The agency also serves as the state’s clearinghouse for data, research and analysis on postsecondary enrollment, financial aid, finance and trends.
The Minnesota State Grant Program is the largest financial aid program administered by the Office of Higher Education, awarding more than $198 million in need-based grants to Minnesota residents attending accredited institutions in Minnesota. The agency oversees tuition reciprocity programs, a student loan program, Minnesota’s 529 College Savings Plan, licensing and early college awareness programs for youth.

2
Contents Executive Summary 3
Introduction 4
Educational Attainment Gap and the Economic Need for Equitable Postsecondary Attainment in MN 4
Figure 1: Age 25-44, Percentage with a Certificate or Higher Degree, Minnesota, 2014 6
Minnesota Student Postsecondary Readiness 6
Figure 2: College Readiness* Based on Average ACT Test-Takers Proficient in Three Core… 8
Figure 3: New College Student Enrollment in Minnesota by Race/Ethnicity, 2017 9
Figure 4: Percent of Students who enroll in Developmental Education within their first… 10
Intervention for College Attendance Grant Program: A Response to the Attainment Gap 10
Funding History 12
Table 1: Funding and Grant Award History, 2000-2018 13
Figure 5: Total ICAP Appropriation per Biennium, 2000-2018 13
Fiscal Year 2017 Funded Programs 14
Fiscal Year 2018 Funded Programs 16
Fiscal Years 2017 and 2018 Project Reports 19
Program Impact 19
Figure 6: Percentage of Graduates among High School Seniors in ICAP-funded Programs vs…. 20
Figure 7: Percentage of College Applicants among Graduating High School Seniors in ICAP… 22
Table 2: Postsecondary Credentials Awarded to ICAP Participants as Reported from 13… 22
ICAP Grant Matching Support 22
Figure 8: Total Amount of ICAP Matching Support per Year, 2005-2018 23
Figure 9: Sources of Matching Support for FY 2017 23
Figure 10: Sources of Matching Support for FY 2018 24
Appendix A: Fiscal Year 2019 Project Summaries 25
Appendix B: Map of ICAP Grantees 34
Appendix C: Grantee Reporting Requirements 36
Appendix D: Student Participation in Other College Access Programs 46

3
Executive Summary Statewide, the need to increase high school graduation rates and college and career readiness for Minnesota’s low-income students and students of color continues. The 2017 four-year high school graduation rate for all Minnesota public high schools was 82.7 percent, while the graduation rate for students eligible for free/reduced price lunch was 68.95 percent and the average graduation rate for students of color was 61 percent. Minnesota students of color and students from families with low incomes (low-income students) were less college-ready overall than White, affluent students for college. The Intervention for College Attendance Program (ICAP) seeks to address these discrepancies in high school completion and academic achievement by providing funds to strengthen preparation for success of students traditionally underrepresented in postsecondary programs.
There is a pressing economic need for all Minnesota students to be prepared for higher education and employment in occupations that require postsecondary training that ranges from sub-baccalaureate credentials—associate degrees and high-quality certificates—to higher level postsecondary degrees. This report provides information on the outcomes of ICAP funding for fiscal years 2017 and 2018. Key findings from the report show that:
• Program focus on enhancing success in high school core curriculum by strengthening academic preparation was a determinant in postsecondary enrollment and success for ICAP students.
• Rigorous academic coursework (i.e. honors, dual enrollment, Advanced Placement, International Baccalaureate, Concurrent Enrollment) beyond the high school core requirements, enhanced college readiness/mastery of college level content for ICAP students.
• ICAP programs that targeted strengthening postsecondary enrollment through ACT preparation and assessment showed overall improvement in students’ ACT scores. The average ACT score increase for these types of ICAP programs ranged from 0.20 to 4.8.
• The high school graduation rate for ICAP seniors (92% in 2017 and 89% in 2018) continues to be higher than the state’s four-year graduation rate for public school students.
• The college application rate for 2017 ICAP seniors was 88% and 90% for 2018 seniors.
• Historical data on postsecondary graduation of ICAP participants is not complete, but 12 ICAP projects with some information on enrollment outcomes document that 431 students have received postsecondary certificates, 504 students have received Associate of Arts degrees, and 325 students have received Bachelor of Arts degrees.
There is considerable local and national focus on improving secondary and postsecondary outcomes for students underrepresented in the education attainment pipeline. The targeted ICAP funding has enhanced academic attainment to allow postsecondary participation and workforce preparation for students supported by ICAP.
4
Introduction The Intervention for College Attendance Program (ICAP) is a program of competitive grants awarded to postsecondary institutions, professional organizations, and community-based organizations. Funded programs focus on increasing the access and success of groups traditionally underrepresented in higher education by strengthening their preparation and aptitude for postsecondary success. The governing state statute indicates the program is to:
“. . . award grants to foster postsecondary attendance and retention by providing outreach services to historically underserved students in grades six through 12 and historically underrepresented college students. Grants must be awarded to programs that provide precollege services, including, but not limited to: (1) academic counseling; (2) mentoring; (3) fostering and improving parental involvement in planning for and facilitating a college education; (4) services for students with English as a second language; (5) academic enrichment activities; (6) tutoring; (7) career awareness and exploration; (8) orientation to college life; (9) assistance with high school course selection and information about college admission requirements; and (10) financial aid counseling.” (2017 Minnesota Statutes 136A.861)
Appendix B shows the location of ICAP projects continuing through June 2019.
The statute indicates that by January 15 of each odd-numbered year, the Minnesota Office of Higher Education (OHE) shall submit a report to the committees in the Legislature with jurisdiction over higher education finance regarding the grant recipients and their activities. This report provides the requested information on ICAP activity from the 2017 and 2018 fiscal years.
Educational Attainment Gap and the Economic Need for Equitable Postsecondary Attainment in Minnesota Minnesota’s need to have students prepared for postsecondary education and the workforce was highlighted by Carnavale, Smith, and Strohl’s 2010 report from the Georgetown University Center on Education and the Workforce. This report, Help Wanted: Projections of Jobs and Education Requirements through 20181 indicated that Minnesota, Massachusetts, Colorado, Washington and the District of Columbia will lead the nation in job openings requiring postsecondary education. The report predicted that by 2018, the United States postsecondary system would have produced 3 million fewer college
1 Carnavale, A.P., Smith, N., & Strohl, J. (2010). Help wanted: Projections of jobs and education requirements through 2018 Georgetown University Center on Education and the Workforce. Retrieved from http://www.georgetown.edu/grad/gppi/hpi/cew/pdfs/FullReport.pdf

5
graduates than demanded by the labor market. Employment projections for Minnesota by the Department of Employment and Economic Development indicate employment growth will occur through 2019 in the areas of education and health services, professional and businesses services, construction, leisure and hospitality and financial activities. Employment in many of the occupations in these varied industries require postsecondary training that ranges from sub-baccalaureate credentials—associate degrees and high-quality certificates—to higher level postsecondary degrees.
In outlining the path for economic and social mobility, Carnavale and Rose in the Georgetown 2011 report, The Undereducated American2, indicated that dropouts, high school graduates, and people with some college but no degree are on the down escalator of social mobility. To counter this trajectory, postsecondary education has become the threshold requirement for a middle-class family income, and access to postsecondary education serves as an “arbiter of economic success and upward mobility.” This report advised that if the goal is to increase the number of college graduates, then barriers to degree completion must be removed for qualified students, and the quality of graduating high school seniors must improve.
Minnesota’s citizens are some of the most educated in the country, with the state ranking third nationally at 61 percent of Minnesotans age 25-44 with some level of postsecondary attainment (certificate, associates degree, bachelor’s degree, etc.). Despite Minnesota’s high educational attainment rates, the Stronger Nation (2018)3, a Lumina Foundation report, highlights significant attainment gaps that exist for key Minnesota communities including Black (29.1 percent), American Indian (19.4 percent) and Asian and Pacific Islander (53.7 percent) communities. These three racial/ethnic groups have attainment rates which are lower than the national average (30 percent, 24 percent, and 61.7 percent respectively), Hispanic/Latino (23 percent), and White (52.4 percent).
In 2014, 72 percent of all Minnesotans age 25 to 64 had at least some college or higher. However, the state’s overall high rate masks severe disparities in attainment between racial and ethnic groups:
• Low-income students and students of color graduate from high school within four years at a rate lower than White students.
• Students of color enroll in college at a rate lower than White students.
• Undergraduates of color have lower college graduation rates.
Minnesotans of color comprise a larger share of the state’s population each year. The state’s changing demographic profile requires the state to begin reducing educational attainment gaps or the state’s economic future is threatened. In order to address the racial and economic educational disparities in Minnesota, the 2015 Minnesota Legislature enacted a state postsecondary educational attainment goal
2 Carnavale, A.P. & Rose, S. (2011). The undereducated American. Georgetown University Center on Education and the Workforce. Retrieved from http://www.georgetown.edu/grad/gppi/hpi/cew/pdfs/undereducatedamerican.pdf.
3 Lumina includes high-quality credentials in their educational attainment figures. High-quality credentials are most certificates, associates, bachelors, masters, and doctoral or professional degrees.
6
that 70 percent of Minnesota adults (age 25 to 44) will have attained a postsecondary certificate or degree by 2025 (Minn. Laws 2015, Chapter 69 ,Article 3, Sec. 6). Most importantly, the law also sets 30 and 50 percent educational attainment benchmarks for all races and ethnicities. Data collected by OHE, Minnesota State Colleges and Universities, and the Minnesota Demographic Center combine to provide estimates of postsecondary attainment.
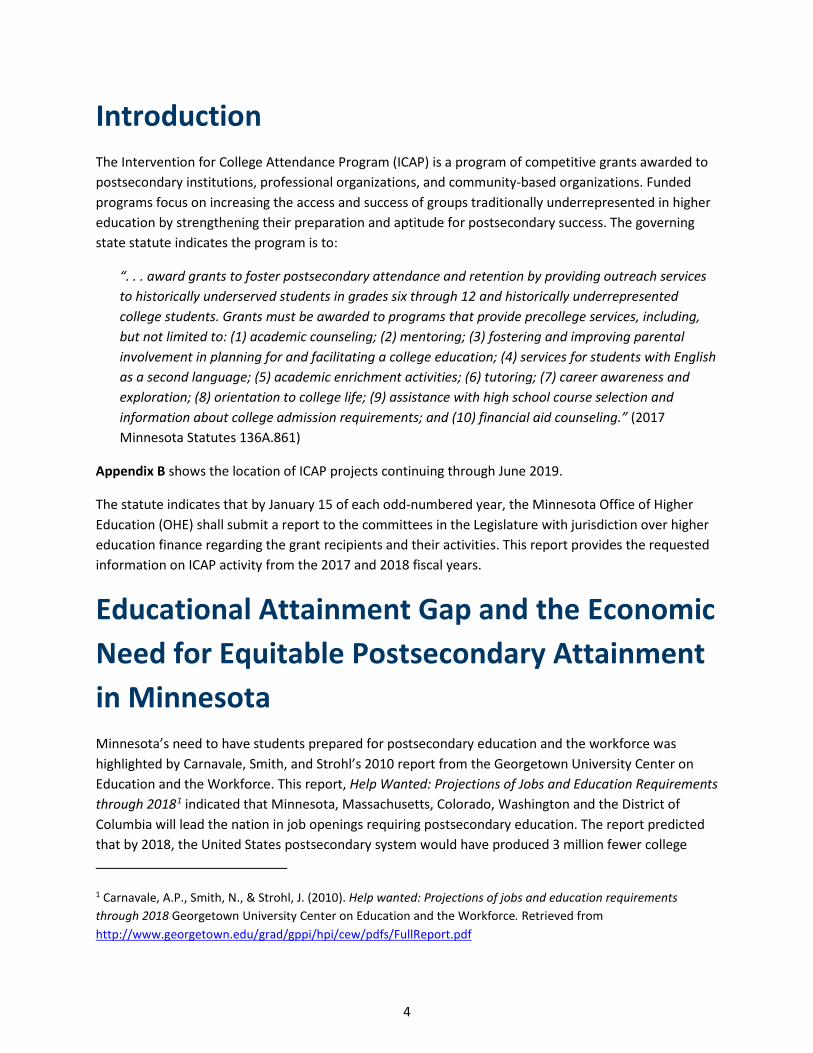
Figure 1: Age 25-44, Percentage with a Certificate or Higher Degree, Minnesota, 2014, Basic Race Groups, Sorted
Source: IPUMS microdata version of U.S. Census Bureau 2012-2016 American Community Survey, with tabulations and additional analysis by the Minnesota Demographic Center
Alternative Text: Percentage with a certificate or higher degree in Minnesota in 2014 by basic race groups is as follows: American Indian 22%-26%, Latinx 26%-29%, Black 32%-35%, multiracial 55%-60%, all 60%-61%, Asian 63%-66%, White 65%-66%.
With the recognition that improving high school graduation and college completion is essential to Minnesota’s future and the nation’s future, the need to assure that low-income and underrepresented students are prepared for success in college continues. Pre-college indicators of effectiveness in increasing college readiness and success have been identified and are the structural core of projects funded under ICAP. Identified indicators of postsecondary success include success in core curriculum, academic preparation and success, test preparation and assessment, career exploration, college exploration, mentoring and guidance, and obtaining financial assistance for attending college.
Minnesota Student Postsecondary Readiness The need to strengthen high school graduation rates and college preparation for some Minnesota students guided the development of ICAP, and that need continues. The 2017 four-year high school graduation rate for Minnesota public high schools was 82.7 percent (58,374 students) which increased from 82.52 percent in 2016. While Minnesota high school graduation rates have increased for all racial groups overall, high school graduation rates for students of color are much lower than that of White students (with the exception of Asian and Pacific Islanders, which show a less drastic attainment gap). In 2017, students of color graduated at rates over 20 percentage points below the state rate of their White
22%-26%
26%-29%
32%-35%%
55%-60%
60%-61%
63%-66%
65%-66%
0% 10% 20% 30% 40% 50% 60% 70% 80%
AMERICAN INDIAN
LATINX
BLACK
MULTIRACIAL
ALL
ASIAN
WHITE
Certificate and Above Percentage
Race
/Eth
nici
ty
7
counterparts (88 percent). For other key populations, the four-year high school graduation rates in 2017 were:
• 64.69% (3,336 students) for English language learners;
• 61.18% (6,120) for students receiving special education services;
• 68.95% (19,768 students) for students eligible for free/reduced price lunch;
• 64.75% (4,364 students) for Black, not Hispanic origin;
• 66.27% (3,436 students) for Latinx/Hispanic;
• 50.61% (583 students) for American Indian/Alaskan Native; and
• 85.1% (3,359 students) for Asian Students
• 62.75% (32 students) for Pacific Islander/Native Hawaiian Students.
Results from the ACT college entrance exam provide another indicator of Minnesota high school students’ college and workforce readiness. It is recognized that the knowledge and skills needed for college are equivalent to those needed in the workplace.4 An estimated 99 percent of Minnesota’s 2018 high school graduates took the ACT exam. Minnesota’s average composite score of 21.3 (out of a total of 36) was higher than the national average composite score of 20.8.
In 2018, Minnesota had the fourth highest average composite score in the nation (after South Dakota at 21.9, Iowa at 21.8, and Kansas at 21.6) among states in which at least half of the graduates took the test. Even so, a significant proportion of high school graduates were not prepared for college-level work according to the ACT. ACT developed college readiness benchmarks in each of the four testing areas, and these benchmarks define the score needed to have a 75 percent chance of earning a grade of “C” or better in related college-level courses. While 60% of students who took the ACT in 2018 met the English benchmark, only 48% met the reading benchmark, 47% met the math benchmark, and 42% met the science benchmark.
Minnesota students of color were less college-ready overall than White students, which echoes the achievement gaps seen in high school graduation rates and Minnesota Comprehensive Assessment (MCA) scores. See Figure 2 for information on college readiness by Minnesota high school students in 2017.
4 ACT. (2006). Reading Between the Lines: What the ACT Reveals About College Readiness in Reading. Retrieved from http://www.act.org/research/policymakers/pdf/reading_report.pdf.

8
Figure 2: College Readiness* Based on Average ACT Test-Takers Proficient in Three Core Subjects in Minnesota, by Race/Ethnicity, 2017
* Average proficiency level across three ACT subjects: Reading, Math, and Science
Alternative text: College readiness based on average ACT test-takers proficient in three core subject areas (reading, math, and science) in Minnesota by race/ethnicity is as follows: all students-56%, American Indian/Alaska Native-36%, Asian/Pacific Islander-52%, Black/African American-29%, Hispanic-34%, White-62%.
Educational disparities between White students and students of color continue after high school graduation. Minnesota college enrollment trends mirror the gaps found in high school graduation and testing by race and ethnicity. In 2017, the vast majority of students who entered college in Minnesota were White (66%); Black students were the second largest population entering Minnesota colleges at 10%. See Figure 3 for new student college enrollment data by race/ethnicity in Minnesota.
0%
20%
40%
60%
80%
100%
All Students AmericanIndian/Alaska
Native
Asian/PacificIslander
Black Hispanic White
9
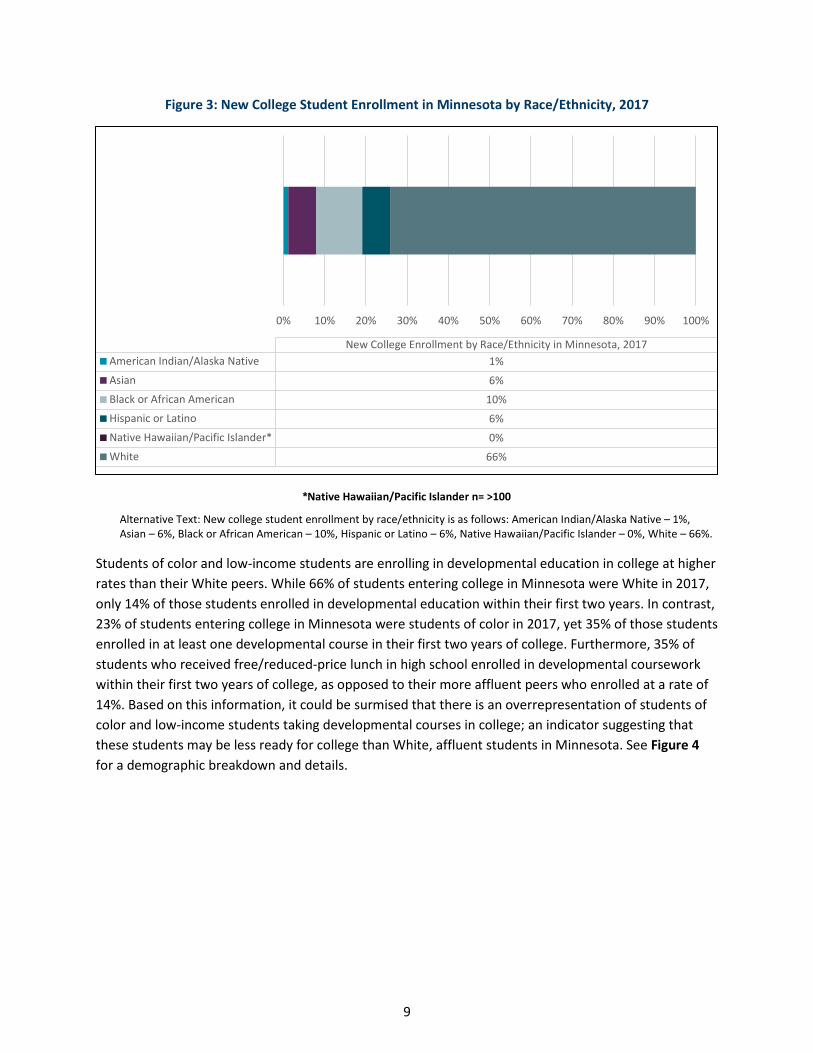
Figure 3: New College Student Enrollment in Minnesota by Race/Ethnicity, 2017
*Native Hawaiian/Pacific Islander n= >100
Alternative Text: New college student enrollment by race/ethnicity is as follows: American Indian/Alaska Native – 1%, Asian – 6%, Black or African American – 10%, Hispanic or Latino – 6%, Native Hawaiian/Pacific Islander – 0%, White – 66%.
Students of color and low-income students are enrolling in developmental education in college at higher rates than their White peers. While 66% of students entering college in Minnesota were White in 2017, only 14% of those students enrolled in developmental education within their first two years. In contrast, 23% of students entering college in Minnesota were students of color in 2017, yet 35% of those students enrolled in at least one developmental course in their first two years of college. Furthermore, 35% of students who received free/reduced-price lunch in high school enrolled in developmental coursework within their first two years of college, as opposed to their more affluent peers who enrolled at a rate of 14%. Based on this information, it could be surmised that there is an overrepresentation of students of color and low-income students taking developmental courses in college; an indicator suggesting that these students may be less ready for college than White, affluent students in Minnesota. See Figure 4 for a demographic breakdown and details.
0% 10% 20% 30% 40% 50% 60% 70% 80% 90% 100%
New College Enrollment by Race/Ethnicity in Minnesota, 2017American Indian/Alaska Native 1%Asian 6%Black or African American 10%Hispanic or Latino 6%Native Hawaiian/Pacific Islander* 0%White 66%

10
Figure 4: Percent of Students who enroll in Developmental Education within their first Two Years of College, by Race/Ethnicity and Income
*Received free/reduced-price lunch in high school, indicating low-income status
Alternative Text: Percent of Students who enroll in developmental education within their first two years of college by race/ethnicity and income is as follows: All Students- 19%, White-14%, American Indian/Alaskan Native-31%, Asian/Pacific Islander-26%, Hispanic-35%, Black/African American-42%, free/reduced price lunch- 35%, not free/reduced-price lunch-14%.
Intervention for College Attendance Grant Program: A Response to the Attainment Gap Preparation for college begins well before high school and is influenced by a number of factors outside of formal education. However, within the context of higher education, the first factor contributing to postsecondary attainment is high school preparation and completion. The Intervention for College Attendance Grant Program (ICAP) was created by the 2000 Minnesota Legislature to support equity in educational outcomes for students of color, low-income students, students who will be the first in their families to go to college, and English language learners in middle and high school. The program intends to create a college and career pipeline for students who may not have the resources in their families and communities to adequately prepare them for college.
19%
14%
31%
26%
35%
42%
35%
14%
0%
5%
10%
15%
20%
25%
30%
35%
40%
45%
11
ICAP grants are awarded to nonprofit organizations, postsecondary institutions, and school districts that work directly with students to provide supplemental academic and psychosocial support and prepare them for high school graduation, college, and a successful career. Often, funded projects utilize college students, mentors, and instructors that reflect the youth they serve in terms of race/ethnicity, age, and socio-economic status. This is particularly important for students of color, as nearly 96% of Minnesota’s licensed teachers identify as White5 . In addition, many of the projects funded through ICAP retain and incorporate culturally-specific pedagogies and activities into the curriculum, which aid in giving students a positive sense of self and strong sense of community while advancing toward college.
Academic Supports
ICAP programs utilize a number of different techniques and overall approaches in order to best serve the students they work with. Student needs vary immensely throughout the state, and each project tailors their program to be a best fit for the communities they work with. Many projects offer academic support such as tutoring (during the school day and after school), ACT/SAT preparation, Accuplacer test preparation, academic enrichment activities, hands-on learning experiences, homework help, academic counseling, internships, Postsecondary Enrollment Options (PSEO)/dual credit support, and English as a Second Language (ESL) services. These support services are categorized as “Academic Supports.”
College Knowledge
All funded projects incorporate at least some College Knowledge into their curriculum. These supports include: college campus tours, financial aid navigation (including help with the Free Application for Financial Student Aid), financial literacy, , awareness of various college and career pathways, college application and essay-writing assistance, common expectations of college students, and postsecondary counseling and support, among other college awareness activities. These are used to build postsecondary readiness with high school students and to promote them seeing themselves as college students prior to enrolling in college.
Social-Emotional Development
Social-emotional development is a term often used in early childhood education to describe ways in which children learn to form and sustain positive relationships, manage and express emotions, and engage the environment around them6. ICAP measures social-emotional development by tracking students’ sense of self-awareness, self-management, responsible decision making, relationship skills, and social awareness. Activities and support services that support positive outcomes are cultural activities, teaching organizational skills, cohort-based learning, culturally-specific pedagogies, problem solving, lessons on work/life balance, lessons on soft skills, etc. Many ICAP programs incorporate social-emotional development and learning into their curriculum in order to build social capital, effective behaviors, and a sense of well-being with students.
5 Retrieved from https://mn.gov/pelsb/assets/2019%20Supply%20and%20Demand%20Report_tcm1113-370206.pdf 6Retrieved from http://helpmegrowmn.org/HMG/HelpfulRes/Articles/WhatSocialDev/index.html.

12
Strengthening Communities
An important, yet tangential, impact of ICAP throughout the years has been the overall strengthening of communities across Minnesota that goes far beyond student support. ICAP grant recipients work with the families of students to create a sense of multi-generational learning and skill-building. This includes intentional parent outreach, parent education workshops, home visits, and sibling outreach. Parents who did not receive a college credential can attend workshops to learn about what their child is preparing for and, in turn, learn about opportunities available to them.
ICAP grantees often work with community organizations, school districts, guidance counselors, and other college preparation programs to ensure that students can rely on a network of support outside of their program. Through creating comprehensive connections with families, schools, and community organizations, ICAP grantees are not only serving individual students, but are acting as catalysts for systemic change in their regions and the state.
Culturally Responsive Pedagogy
Seven ICAP projects target specific demographics of students and incorporate culturally-responsive curriculum into their programming. These projects are geared toward American Indian students, Black/African American students, and students who are refugees. Additionally, there is one program that works with students with Individualized Education Plans (students with disabilities), and one program that only serves students within a specific neighborhood of Minneapolis that has been historically underserved. In these projects, cohorts of students of similar identities are supported primarily by staff who also represent their identities. Additionally, identity is fundamentally tied to the curriculum/pedagogy used in the project. These programs and organizations help strengthen pride in diversity and address culturally-specific barriers to success directly with students and families who are impacted.
Funding History ICAP was first funded during the 2000-2001 biennium with $500,000 made available each year. Ten grants were awarded to early intervention programs to help low-income students reach the doors of college through a variety of services. The number of grant awards each biennium has reflected changes in appropriation and program focus.

13
Table 1: Funding and Grant Award History, 2000-2018
Biennial Period
Funding
Number of Grants Awarded
2000-2001 $500,000 each year 10 2002-2003 $200,000
10 2004-2005 $225,000 each year 7 2006-2007 $446,000 each year 14 2008-2009 $696,000 each year 24 2010-2011 $696,000 each year 20 2012-2013 $621,000 each year 19/18 2014-2015 $621,000 each year 18
+$48,837 in FY 2015* 22 2016-2017 $621,000 each year 20** 2018-2019 $621,000 each year 20
+$44,921 in FY 2017* +4 +$69,993 in FY 2018* +4
*Other agency funds were used to increase program support.
**Two of the projects from previous years were not continued. Starting with the 2012-2013 biennium, ICAP grant funding was reduced $75,000 each year to address state budget reductions.
Figure 5: Total ICAP Appropriation per Biennium, 2000-2018
Alternative Text: Total ICAP Appropriation per biennium as follows: 2000-2001 $500,000, 2002-2003 $200,000, 2004-2005 $225,000, 2006-2007 $446,000, 2008-2009 $696,000, 2010-2011 $696,000, 2012-2013 $621,000, 2014-2015 $621,000, 2016-2017 $621,000, 2018-2019 $621,000.
$0
$100,000
$200,000
$300,000
$400,000
$500,000
$600,000
$700,000
$800,000

14
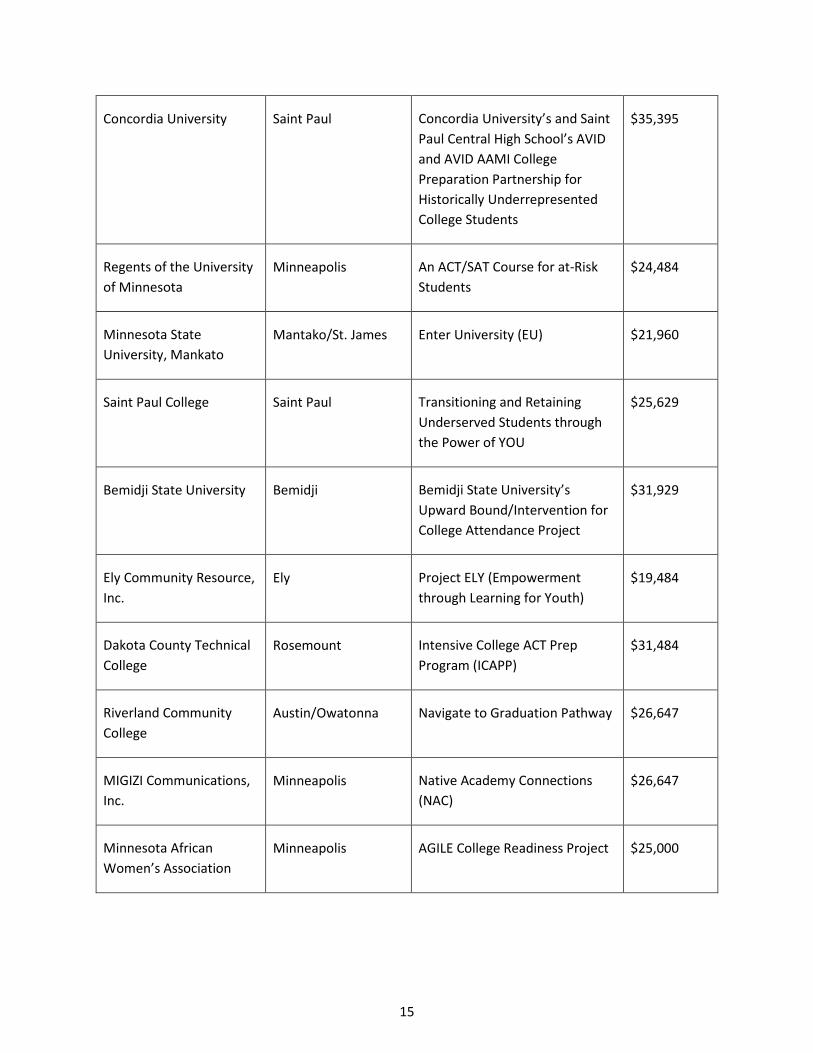
Fiscal Year 2017 Funded Programs In Fiscal Year 2017, the 24 grant projects provided services for 4,439 students in grades six through 12 and for 373 postsecondary students.
The 24 funded projects for Fiscal Year 2017 were:
Organization/Fiscal Agent
Location Project Title Funding Amount
The College of St. Scholastica
Duluth DREAM Project-Daring to Realize Excellence and Academic Motivation
$41,484
Saint Paul Public Schools Saint Paul Maadaadizi (Start a Journey) Program
$30,184
Women’s Initiative for Self Empowerment (WISE), Inc.
Saint Paul Girls Getting Ahead in Leadership (GGAL) Program
$31,484
Learning Disabilities Association, Inc. (LDA Minnesota)
Golden Valley Learning Connections: Increasing Academic and Transition Skills for Post-Secondary Success
$28,484
St. Cloud State University St. Cloud Promoting Academic Success for Underrepresented Students
$37,484
Breakthrough Twin Cities Saint Paul Breakthrough Twin Cities $44,484
Carleton College Northfield/Faribault Rice County College Access and Academic Outreach Program
$27,476
SouthWest Metro Educational Cooperative
Shakopee Project Scholar $35,484
Northfield Public Schools Northfield Tackling Obstacles and Raising College Hopes (TORCH)
$47,484
15
Concordia University Saint Paul Concordia University’s and Saint Paul Central High School’s AVID and AVID AAMI College Preparation Partnership for Historically Underrepresented College Students
$35,395
Regents of the University of Minnesota
Minneapolis An ACT/SAT Course for at-Risk Students
$24,484
Minnesota State University, Mankato
Mantako/St. James Enter University (EU) $21,960
Saint Paul College Saint Paul Transitioning and Retaining Underserved Students through the Power of YOU
$25,629
Bemidji State University Bemidji Bemidji State University’s Upward Bound/Intervention for College Attendance Project
$31,929
Ely Community Resource, Inc.
Ely Project ELY (Empowerment through Learning for Youth)
$19,484
Dakota County Technical College
Rosemount Intensive College ACT Prep Program (ICAPP)
$31,484
Riverland Community College
Austin/Owatonna Navigate to Graduation Pathway $26,647
MIGIZI Communications, Inc.
Minneapolis Native Academy Connections (NAC)
$26,647
Minnesota African Women’s Association
Minneapolis AGILE College Readiness Project $25,000

16
Minneapolis Urban League
Minneapolis MUL Future Work$: An Intervention for College Attendance Program
$25,000
Eastern Carver County Schools*
Chaska Upward & Onward Part II – Improving College Access for Hispanic/Mexican Students in District 112
$9,921
Emerge Community Development*
Minneapolis Pathways Project $10,000
Banyan Community* Minneapolis ASPIRE! College Readiness $10,000
Pillsbury United Communities*
Minneapolis Furthering Achievement Through a Network of Success (FANS)
$10,000
TOTAL $657,628
*funded with other agency funds
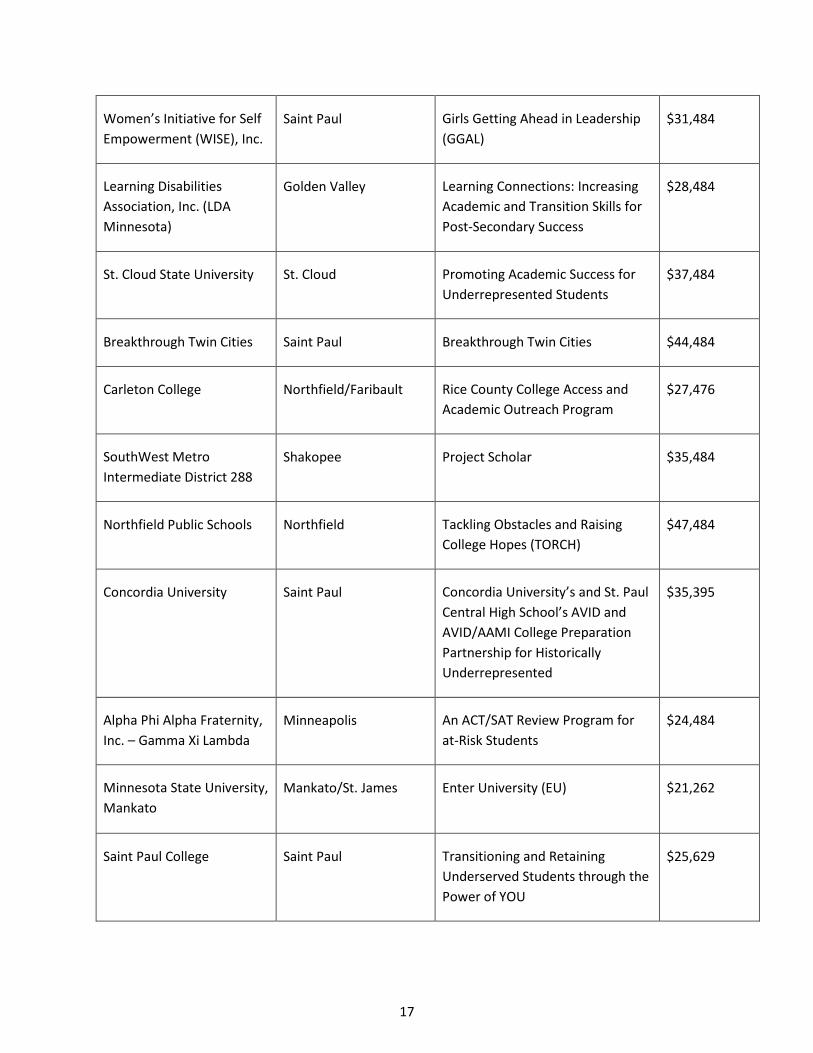
Fiscal Year 2018 Funded Programs In Fiscal Year 2018, the 23 matching grant projects provided services for 3,833 students in grades six through 12 and for 227 postsecondary students.
The 23 funded projects for Fiscal Year 2018 were:
Organization/Fiscal Agent Location Project Title Funding Amount
The College of St. Scholastica
Duluth DREAM Project-Daring to Realize Excellence and Academic Motivation
$41,484
Saint Paul Public Schools Saint Paul Maadaadizi (Start a Journey) Program
$30,184
17
Women’s Initiative for Self Empowerment (WISE), Inc.
Saint Paul Girls Getting Ahead in Leadership (GGAL)
$31,484
Learning Disabilities Association, Inc. (LDA Minnesota)
Golden Valley Learning Connections: Increasing Academic and Transition Skills for Post-Secondary Success
$28,484
St. Cloud State University St. Cloud Promoting Academic Success for Underrepresented Students
$37,484
Breakthrough Twin Cities Saint Paul Breakthrough Twin Cities $44,484
Carleton College Northfield/Faribault Rice County College Access and Academic Outreach Program
$27,476
SouthWest Metro Intermediate District 288
Shakopee Project Scholar $35,484
Northfield Public Schools Northfield Tackling Obstacles and Raising College Hopes (TORCH)
$47,484
Concordia University Saint Paul Concordia University’s and St. Paul Central High School’s AVID and AVID/AAMI College Preparation Partnership for Historically Underrepresented
$35,395
Alpha Phi Alpha Fraternity, Inc. – Gamma Xi Lambda
Minneapolis An ACT/SAT Review Program for at-Risk Students
$24,484
Minnesota State University, Mankato
Mankato/St. James Enter University (EU) $21,262
Saint Paul College Saint Paul Transitioning and Retaining Underserved Students through the Power of YOU
$25,629

18
Bemidji State University Bemidji Bemidji State University’s Upward Bound/Intervention for College Attendance Program
$31,929
Ely Community Resource, Inc.
Ely Project ELY (Empowerment through Learning for Youth)
$19,484
Dakota County Technical College
Rosemount Intensive College ACT Prep Program (ICAPP)
$31,484
Riverland Community College
Austin/Owatonna Navigate to Graduation Pathway $26,647
MIGIZI Communications, Inc.
Minneapolis Native Academy Connections (NAC)
$26,647
Minneapolis Urban League Minneapolis MUL Future Work$: An Intervention for College Attendance Program
$25,000
Eastern Carver County Schools*
Chaska Upward & Onward Part II – Improving College Access for Hispanic/Mexican Students in District 112
$13,996
Emerge Community Development*
Minneapolis Pathways Project $10,000
Banyan Community* Minneapolis ASPIRE! College Readiness $16,000
Pillsbury United Communities*
Minneapolis Furthering Achievement Through a Network of Success (FANS)
$16,000
TOTAL $616,521
*funded with other agency funds

19
Note: the Minnesota African Women’s Association formally closed their doors in 2017; therefore their grant contract was closed out at the end of their term.
The next section of this report contains a summation of overall project outcomes followed by information on the students served, activities implemented, and key outcomes of individual projects for 2017 and 2018.
Fiscal Years 2017 and 2018 Project Results Grantees were required to report on activities and outcomes of their funded projects. Grantees reported on participant numbers, participant characteristics, program activities to meet program objectives, measures to evaluate designated activities, outcomes of designated activities and student outcomes as they relate to high school graduation rates, college participation and college graduation rates. In addition, project directors identified the key support factor from their project that ensured postsecondary success for their program participants. (See Appendix C for ICAP Project Report Requirements.)
Program Impact Individual projects cannot claim to be the sole factor that influenced the more positive academic outcomes of participating students. Along with their K-12 curricular and co-curricular work, many ICAP students participated in other college access programs. (See Appendix D for a listing of other college access programs that ICAP students were involved in.) While consideration is given to the impact of student participation in multiple college access initiatives, ICAP funding has a definite role in influencing student high school graduation and college enrollment outcomes.
ICAP grants support students from grades 6 through postsecondary, with the vast majority of the participating students in grades 6-12. This means that many of the students supported by ICAP since project funding continued from 2008 are still enrolled in postsecondary programs.
The data outlined in the following sections shows students who participate in ICAP programs (ICAP students) graduate high school at a higher rate than their peers, as well as the statewide average. While not many ICAP grantees have access to longitudinal data and, therefore, can’t track students’ persistence in college, we can see that these students are applying to college at a higher rate than the statewide average for college enrollment.
Academic Outcomes
Another indicator of postsecondary readiness is the rigor of courses completed by students for the high school diploma. Students who complete a core curriculum, mathematics courses beyond Algebra II, and rigorous courses (e.g., honors, dual enrollment, AP, IB) tend to be more successful in college than students who do not. For the 2016-2017 academic year, 1650 ICAP students completed advanced courses with a more rigorous curriculum reflective of college readiness or mastery of college level
20
content. For the 2017-2018 academic year, 1064 ICAP students completed advanced coursework. For ICAP program purposes, middle school and high school courses offered to students and counted as advanced courses included: Pre-Advanced Placement, Pre- International Baccalaureate, Advanced Placement, International Baccalaureate, Honors, College-in-the- Schools, Concurrent Enrollment, and Postsecondary Enrollment Options courses.
ACT assessment scores are intended to indicate potential college success. This score is one of the most standardized ways of measuring the college readiness of students. Seven of the 2016- 2017 ICAP projects implemented activities to help students increase their ACT score. For these seven programs, students’ average composite score improved by 2.8 points between pre- and post-testing. For the 2017-2018 school year, eight projects reported the outcomes of ACT preparation activities. The average composite school improved by 2.72 points between pre- and post-testing.
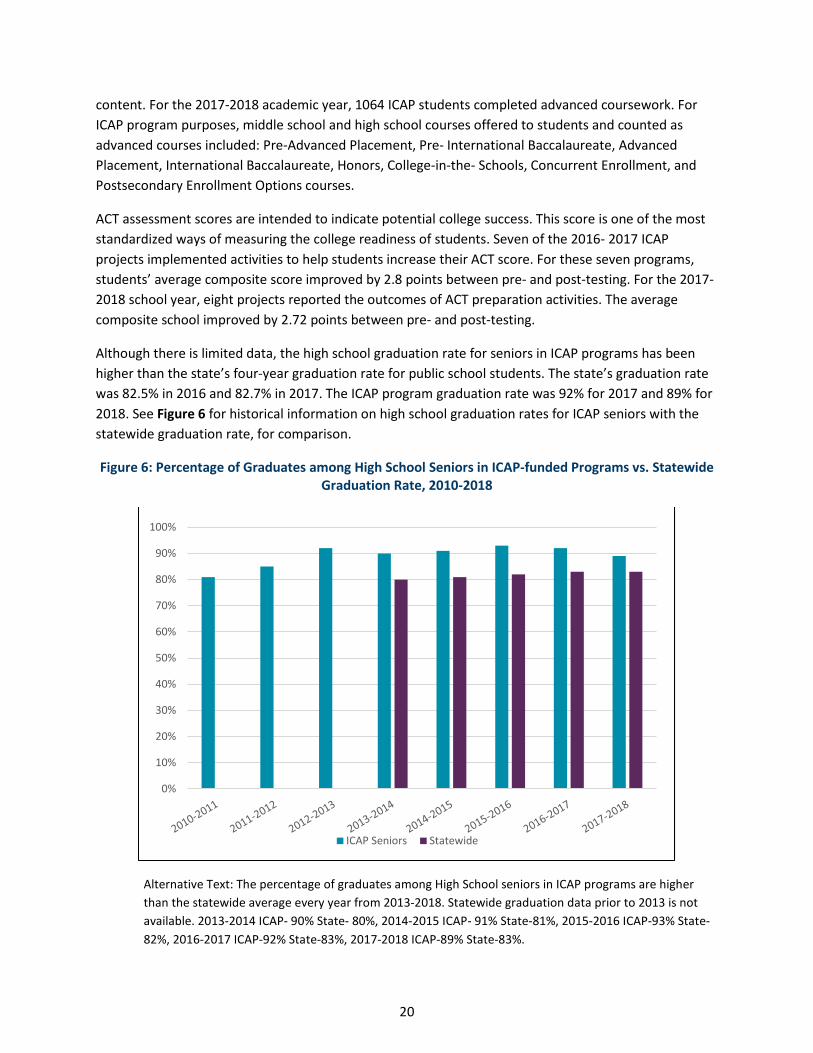
Although there is limited data, the high school graduation rate for seniors in ICAP programs has been higher than the state’s four-year graduation rate for public school students. The state’s graduation rate was 82.5% in 2016 and 82.7% in 2017. The ICAP program graduation rate was 92% for 2017 and 89% for 2018. See Figure 6 for historical information on high school graduation rates for ICAP seniors with the statewide graduation rate, for comparison.
Figure 6: Percentage of Graduates among High School Seniors in ICAP-funded Programs vs. Statewide Graduation Rate, 2010-2018
Alternative Text: The percentage of graduates among High School seniors in ICAP programs are higher than the statewide average every year from 2013-2018. Statewide graduation data prior to 2013 is not available. 2013-2014 ICAP- 90% State- 80%, 2014-2015 ICAP- 91% State-81%, 2015-2016 ICAP-93% State-82%, 2016-2017 ICAP-92% State-83%, 2017-2018 ICAP-89% State-83%.
0%
10%
20%
30%
40%
50%
60%
70%
80%
90%
100%
ICAP Seniors Statewide
21
Social-Emotional Learning
Academic preparation is one of the strongest determinants of postsecondary success. Another important determinant is the social-emotional well-being and maturity of a student. Students who can cope with stress, utilize learned life skills when necessary, build relationships, work as a part of a team, and use prioritization to manage their time may be more likely to see themselves as a college student and succeed after high school7.
As part of the annual report, project directors identified the key social-emotional support factors from their project that impacted postsecondary readiness for program participants. In defining key support factors, project directors cited the following activities that helped strengthen students’ social-emotional skills:
• Cultural activities specific to the student demographic (i.e. Pow Wows, inviting elders from the community to speak to the student-cohort)
• Mentorship with a focus on life skills management
• Exposure to internships, job shadowing, and mock interviews
• Workshops specifically on maintaining healthy relationships, work-life balance, and mental health issues
• Lessons on study skills, note-taking, financial literacy, and time management
• Personality, emotional intelligence, and work-style quizzes
• Cohort models/learning communities
The project directors also expressed a strong belief in use of the holistic and individualized approaches to meet students’ distinct needs.
College-Going Outcomes
ICAP graduating seniors consistently applied to college at a higher rate than the statewide average college enrollment rate. Figure 7 shows the college application rate of graduating high school seniors in ICAP programs compared to the statewide enrollment rate spanning from 2010-2018. For 2017, 88% of ICAP’s graduating seniors applied to postsecondary institutions; and in 2018, 90% of ICAP’s graduating seniors applied to postsecondary institutions.
Thirteen ICAP projects reported certificates, associates degrees, and bachelor’s degrees earned by prior ICAP student cohorts. Table 2 shows the total number of each credential earned by ICAP students since 2008.
7 Postelwaite and Silverman, (2006). “Improving College and Career Readiness by Incorporating Social and Emotional Learning,” College and Career Readiness and Success Center, American Institutes for Research

22
Figure 7: Percentage of College Applicants among Graduating High School Seniors in ICAP Programs vs. Statewide College Enrollment Rate, 2010-2018
Alternative Text: The percentage of college applicants among graduating high school seniors in ICAP programs are higher than the statewide national average for college enrollment every year from 2010-2017. 2010-2011 ICAP-83% State-62%, 2011-2012 ICAP-77% State-61%, 2012-2013 ICAP-85% State-60%, 2013-2014 ICAP-89% State-60%, 2014-2015 ICAP-95% State-60%, 2015-2016 ICAP-92% State-61%, 2016-2017 ICAP-88% State-62%, 2017-2018 ICAP-90%, State-62%.
Table 2: Postsecondary Credentials Awarded to ICAP Participants as Reported from 13 Projects 2008-2018
Certificates Associate of Arts Bachelor of Arts Total Awards 642 504 325 1471
ICAP Grant Matching Support Grantees are required to match the grant amount received from the state dollar-for-dollar. The match may be in financial or in-kind contributions. FY 2017 expenditures from grant funds totaled $657,521, and end-of-year reports indicated that projects used an additional $1,039,538 in matching support to implement project activities.
Expenditures from 2018 grant funds totaled $615,521, and end-of-year reports indicated that projects used an additional $1,065,636 in matching support to implement project activities. (See Appendix B for matching revenue sources for Fiscal Years 2017 and 2018.)
0%
10%
20%
30%
40%
50%
60%
70%
80%
90%
100%
ICAP Seniors Statewide
23
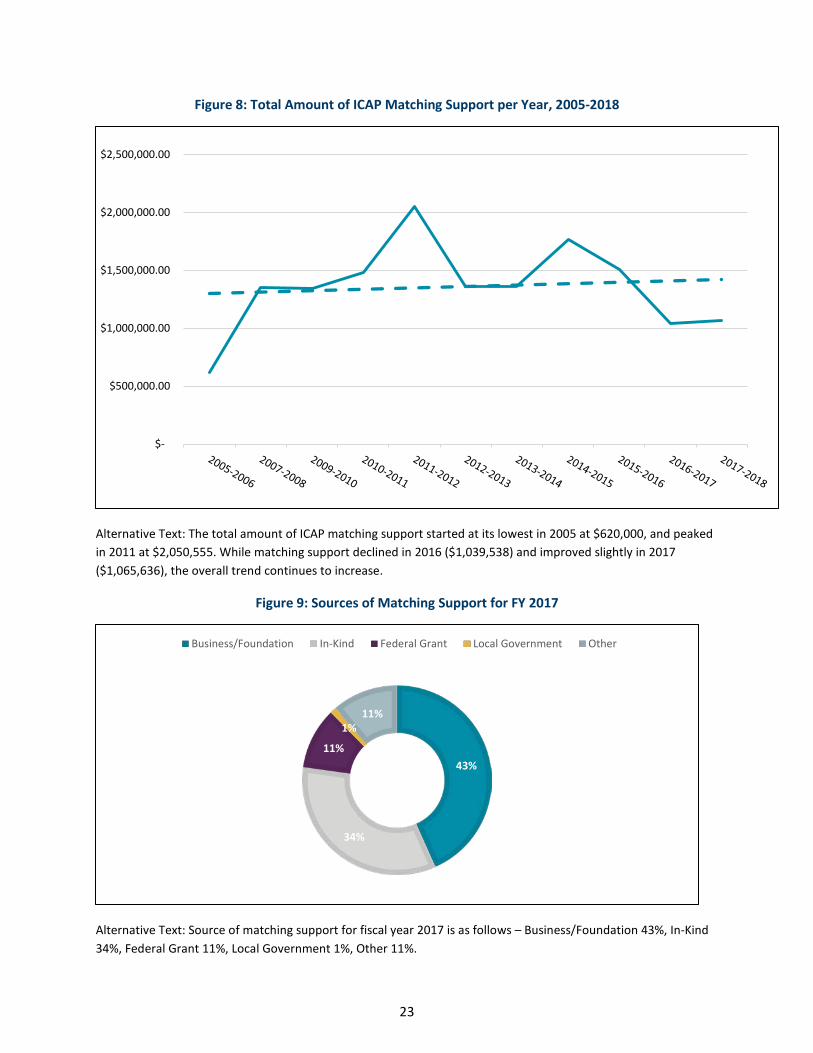
Figure 8: Total Amount of ICAP Matching Support per Year, 2005-2018
Alternative Text: The total amount of ICAP matching support started at its lowest in 2005 at $620,000, and peaked in 2011 at $2,050,555. While matching support declined in 2016 ($1,039,538) and improved slightly in 2017 ($1,065,636), the overall trend continues to increase.
Figure 9: Sources of Matching Support for FY 2017
Alternative Text: Source of matching support for fiscal year 2017 is as follows – Business/Foundation 43%, In-Kind 34%, Federal Grant 11%, Local Government 1%, Other 11%.
$-
$500,000.00
$1,000,000.00
$1,500,000.00
$2,000,000.00
$2,500,000.00
43%
34%
11%
1%11%
Business/Foundation In-Kind Federal Grant Local Government Other

24
Figure 10: Sources of Matching Support for FY 2018
Alternative Text: Source of matching support for fiscal year 2018 is as follows – Business/Foundation 15%, In-Kind 36%, Federal Grant 33%, Local Government 10%, Other 6%.
15%
36%33%
10%6%
Business/Foundation In-Kind Federal Grant Local Government Other

25
Appendix A: Fiscal Year 2019 Project Summaries

26
Fiscal Year 2019 Grant Recipients
Intervention for College Attendance Program DREAM Project – Daring to Realize Excellence and Academic Motivation, The College of St. Scholastica, receives $41,484 Duluth One hundred twenty low-income, first-generation high school students will participate in pre-college services to increase college readiness through counseling and tutoring. In the 2018-2019 academic year, these students will receive weekly academic tutoring to address study habits, core course grade improvement, and college preparatory testing. Eighty eligible students will also attend a five-week summer residential academic enrichment program to increase grade point averages and skills in core subjects. Additionally, 12 students will attend a seven month career exploration and college readiness participation program that includes a five-week supervised job placement. Knowledge of college readiness, financial aid, and study skills will be assessed through pre- and post-program surveys and career exploration activities. Contact: Amy Galarowicz, (218) 723-6760, [email protected] Maadaadizi (Start a Journey) Program, Saint Paul Public Schools, receives $40,184 St. Paul Sixty Native American 9th-12th grade students will participate in college and career motivation and readiness group counseling sessions provided in a culturally inclusive manner which will include the following topics: importance of education to Native communities, Journey to College planning, career assessments, college investigation, college testing, college applications, financial aid/scholarship applications, college visits, and Twin Cities Native American College Fair participation. Students will also participate in individual and/or group counseling sessions focusing on credit check reviews, information sessions on advanced/dual enrollment and career pathway course opportunities, recruitment for programming and assistance with completing the necessary applications; academic monitoring, tutoring, and mentoring; and inclusion of strategic partners with students and families at school, District Powwows, and community events. Contact: John Bobolink, (651) 293-5191, [email protected] Girls Getting Ahead in Leadership (GGAL), Women’s Initiative for Self-Empowerment (WISE), Inc. receives $31,484 St. Paul GGAL will serve 80 underserved/underrepresented multiethnic immigrant/refugee girls in grades 6-12, with English as a Second Language, from low-income families who receive free/reduced price lunches. This program provides college and preparation workshops on planning/ financing/preparing for college, accessing community and educational resources, study strategies, financial literacy, communication skills, problem-solving, goal-setting, career exploration, writing, vocabulary building, writing assessments, and grammar review; mentorship/support services to provide individual homework assistance and support; strong and innovative collaboration to strengthen relationships between community-based organizations, educational institutions and other stakeholders to maximize resources for participants, parents,

27
and agencies; group activities to strengthen cross-cultural relationships and increase the involvement of participants and their parents in their community; and leadership building activities to equip participants with skills to succeed in high school/college/adulthood including social skills, time management, organization, public speaking, healthy relationships, project planning, building self-esteem/cultural self-identity, and interviewing skills. Contact: Pamela Zeller, (651) 646-3268, [email protected]. Learning Connections: Increasing Academic & Transition Skills for Post-Secondary Success, LDA Minnesota receives $28,484 Golden Valley One hundred fifty students in grades 6-12 will improve academic achievement in reading and/or math to meet the demands of rigorous coursework at a high school and post-secondary level. Licensed staff delivers programming through three methods: (a) during school as a pull-out model, (b) after school, and (c) during LDA’s Saturday program. Participating students will demonstrate increased self-awareness and knowledge of transition topics, such as time management, study skills, self-advocacy, and self-determination to increase the likelihood of their success in high school and college. Contact: Dr. Rachel David, (952) 582-6002, [email protected] Promoting Academic Success for Underrepresented Students, St. Cloud State University, receives $37,484 St. Cloud Two hundred 6th-8th grade underrepresented students in the St. Cloud area with risk factors for poor academic achievement will participate in intensive mentoring, academic tutoring, and summer residential programs. The core activities will serve to improve the academic progress of participants in language arts and mathematics. Additional aims include increasing student interest and awareness of higher education options. Contact: Dr. Semya Hakim, (320) 308-3264, [email protected] Breakthrough Twin Cities: Students Teaching Students, Breakthrough Twin Cities (BTC) receives $54,484 Twin Cities BTC begins working with students as rising 7th grade students and continues to follow them through their senior year of high school. The programming serves 490 middle and high school students in the Twin Cities who qualify for free/reduced price lunch, identify with a racial or ethnic group that is underrepresented in college, speak a language other than English in their home, live in a single-parent household, and/or are the first generation in their family to attend college. The Middle School Program provides 250 hours of rigorous academic instruction in math, science, literature and writing, together with social-emotional skill building during a six-week summer program. Students attend monthly Saturday sessions during the school year. The High School Program helps students navigate high school, the rigors of college preparation, and other challenges. Students receive individualized college counseling, including college visits, essay writing coaching, and ACT Test Prep during their junior and senior years. BTC also provides a rigorous internship to a diverse group of college students (as well as select high school students) who have expressed an interest in a career in education. The aspiring educators

28
receive academic instruction from BTC, along with ongoing instructional guidance and support from licensed educators to prepare lesson plans and teach their materials. Contact: Josh Reimnitz, (651) 748-5586, [email protected] Rice County College Access and Academic Outreach Program, Carleton College, receives $26,198 Northfield This program will serve at least 300 middle and high school students from Northfield and Faribault who are low-income students, students of color, and/or the first in their families to attend college. Academic support will be provided to students who are experiencing academic challenges, especially in math and science coursework. Afterschool and summer enrichment programs will expose students to experiences and ideas that engage their minds, expand their knowledge, and strengthen their academic performance. Programming will include: homework help, PSEO support, one-on-one tutoring support, structured ACT preparation, college application support, mentoring, and summer activities, among other services. Contact: Amel Gorani, (507) 222-7019, [email protected] Project Scholar, SouthWest Metro Intermediate District 288, receives $35,484 Shakopee The purpose of Project Scholar is to encourage postsecondary attendance and increase the high school graduation rate of 100 10th-12th grade students enrolled in an alternative high school program. Students work with a case manager and a Project Scholar counselor to complete a Continuous Learning and Transition Plan. A select group of high-need students will participate in intensive college and career counseling and preparation. Project activities are geared toward increasing the number of students who initiate the postsecondary application process and provide support for those who have been accepted at postsecondary institutions to assist completion. Contact: Joyce Eissinger, (952) 567-8105, [email protected] Tackling Obstacles and Raising College Hopes (TORCH), Northfield Public Schools, receives $47,484 Northfield Four hundred Northfield youth in grades 6-12 who are students of color, English Language Learners, low-income and/or potential first generation college students will participate in TORCH, a comprehensive program aiming to increase these students’ high school graduation and postsecondary participation rates. TORCH programming will include: individual academic counseling, one-on-one mentoring and tutoring, after school homework assistance, support for transitioning to more rigorous coursework, interventions in core subject areas, access to leadership and community service opportunities, ACT and Accuplacer test preparation, remedial skills interventions, college orientation trips, career and college workshops, career exploration and summer enrichment opportunities, and assistance with financial aid and scholarship applications, as well as home visits and regular family check-ins. In addition, the program will support TORCH graduates as they pursue postsecondary education by helping participants to identify college support resources and conducting regular check-ins with alumni. Contact: Marnie Thompson, (507) 645-3450, [email protected]

29
Concordia University’s and St. Paul Central High School’s AVID and AVID/AAMI College Preparation Partnership for Historically Underrepresented College Students receives $35,395 St. Paul The Advancement Via Individual Determination (AVID) program aims to increase academic, social, and emotional support for 135 9th-12th grade students historically underrepresented in postsecondary institutions. Program delivery occurs through four elective courses and two AVID/AAMI (African American Male Initiative) elective courses at St. Paul Central High School. Students will attend the courses daily with the same teacher that remains committed to the program and the same peers for all four years of their high school career. Current Concordia University students serve as tutors. Additionally, students engage in Socratic Method tutoring twice per week. Family members of the participating students will be supported in encouraging academic and social progress toward the students’ graduation. The after-school segment will continue to provide academic, social, and emotional support for students in the AVID and AAMI groups. Contact: Dr. Cheryl Chatman, (651) 603-6151, [email protected] An ACT/SAT Review Program for at-Risk Students, Alpha Phi Alpha Fraternity, Inc. – Gamma Xi Lambda, receives $24,484 Minneapolis/St. Paul To increase student knowledge and test scores in areas assessed by college admission exams, 220 academically at-risk 7th-12th grade students will receive instruction in mathematics, reading, writing, data representation, English, vocabulary, and science reasoning. Students will work in small groups with tutors in each of the content areas. In addition, students will attend informational sessions on course-taking, test-wiseness, test anxiety, note taking, and how to study, as well as sessions on college admissions, financial aid, physical and psychological balance, and resources available to matriculating students to ensure success. Students will apply knowledge on practice tests that are scored and returned with diagnostic information. Contact: Gene L. Ward, Jr., (612) 597-2053, [email protected] Enter University, Minnesota State University, Mankato, receives $35,615 Mankato The Enter University program will provide tutoring, campus visits and ACT prep to 200 9th-12th grade students at St. James High School who are first generation, low income, and/or students of color. The tutoring/academic focus will be on math, English, and science starting in the fall semester and continuing through spring semester. This program will provide two college visits for the high school; one of the visits will include parents. Visits will include admissions and financial aid information, student panels, campus tours, and a Q&A session. ACT preparation will include practice exams, assisting students to prepare for each subject area, and following up with students after grading the exams to identify areas of improvement. Workshops at the Edina Campus, Redwood Falls, and Madelia on college readiness skills will also be provided. Contact: Ann Swartz-Beckius, (507) 389-1028, [email protected]

30
Transitioning and Retaining Underserved Students through the Power of YOU, Saint Paul College, receives $35,629 St. Paul This program will serve 240 students from communities traditionally underrepresented in postsecondary education. Students are from public high schools in St. Paul and select first-ring suburbs. Program activities will expand student academic and support services. Instructional activities will increase recruitment, transition, and retention efforts for the Power of YOU. Students will participate in learning communities, career workshops, advising sessions, academically-related social events, and visits to other colleges. Programming will engage students and families in financial literacy and college readiness workshops. Recognition events will be held to highlight and reward high-achieving students and to motivate them to achieve greater success in their academic careers. Contact: Sarah Butler, (651) 846-1325, [email protected] Bemidji State University Upward Bound/Intervention for College Attendance Program receives $31,929 Bemidji One hundred one 9th-12th grade students who are low-income, minority, and/or first generation college students from seven schools in northwest Minnesota will receive academic intervention services. Three of the schools are located on American Indian reservations in rural Minnesota. The program will provide ongoing academic-year interventions during the school year and a six-week residential summer component with the intent to increase students’ academic performance and better prepare them for postsecondary education. The summer component will focus on academic instruction in math, literature and composition, science, world languages, elective courses, ACT preparation, and cultural activities. During the school year, students will participate in tutoring, academic advising, mentoring, college visits and Saturday Back-to-Campus workshops. Contact: Kelli Steggall, (218) 755-2504, [email protected] Project ELY (Empowerment through Learning for Youth), Ely Community Resource, Inc., receives $21,133 Ely One hundred Ely youth in grades 6-12 will participate in activities to increase college access and the preparation for postsecondary success. Participating students are low income and may be first generation college students. Services will include: homework assistance and building study skills, mentoring facilitated by staff and volunteer tutors, and college awareness and readiness support (college tours and test prep opportunities). The goal is to help students succeed in rigorous course work that serves students well in college. Extra-curricular opportunities/ challenges in STEM and writing disciplines will also be provided. Career presentations by community “job-holders” will provide “street-credible” information on background and expertise, work ethic, and team attitude necessary for success. Participants gain knowledge, confidence, self-esteem, and social skills through the consistent relationships and advocacy provided by Project ELY staff. Contact: Julie Hignell, (218) 365-5254, [email protected]
31
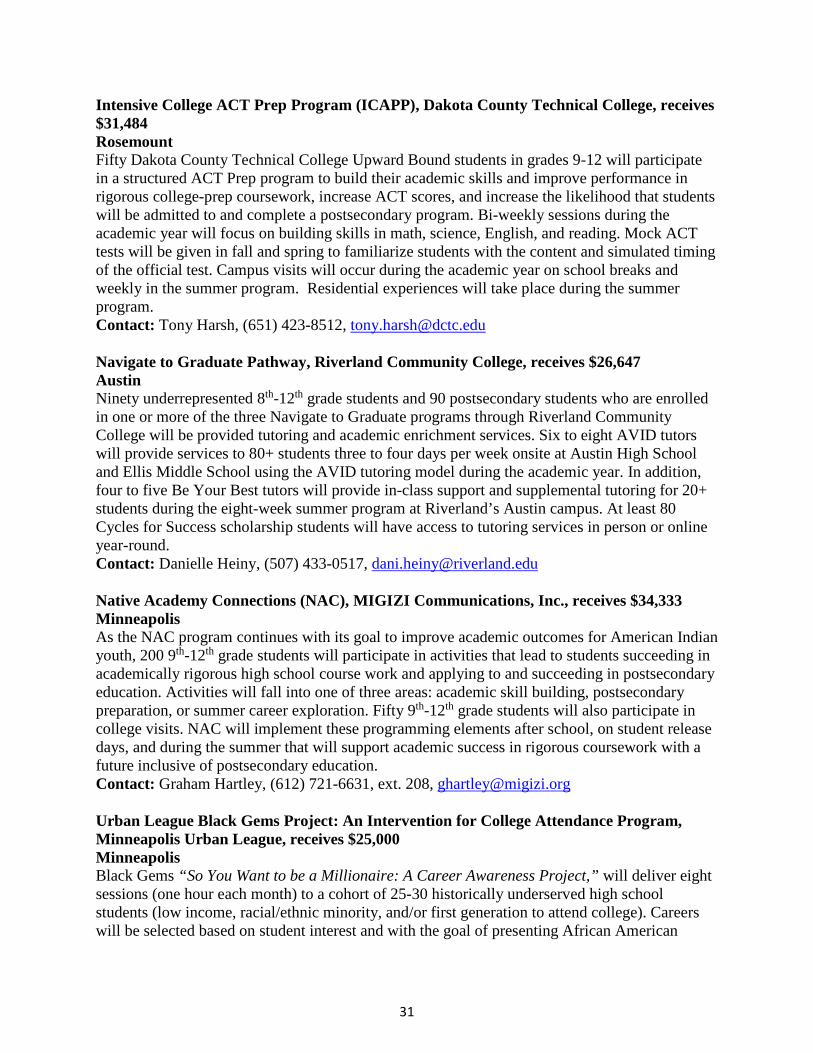
Intensive College ACT Prep Program (ICAPP), Dakota County Technical College, receives $31,484 Rosemount Fifty Dakota County Technical College Upward Bound students in grades 9-12 will participate in a structured ACT Prep program to build their academic skills and improve performance in rigorous college-prep coursework, increase ACT scores, and increase the likelihood that students will be admitted to and complete a postsecondary program. Bi-weekly sessions during the academic year will focus on building skills in math, science, English, and reading. Mock ACT tests will be given in fall and spring to familiarize students with the content and simulated timing of the official test. Campus visits will occur during the academic year on school breaks and weekly in the summer program. Residential experiences will take place during the summer program. Contact: Tony Harsh, (651) 423-8512, [email protected] Navigate to Graduate Pathway, Riverland Community College, receives $26,647 Austin Ninety underrepresented 8th-12th grade students and 90 postsecondary students who are enrolled in one or more of the three Navigate to Graduate programs through Riverland Community College will be provided tutoring and academic enrichment services. Six to eight AVID tutors will provide services to 80+ students three to four days per week onsite at Austin High School and Ellis Middle School using the AVID tutoring model during the academic year. In addition, four to five Be Your Best tutors will provide in-class support and supplemental tutoring for 20+ students during the eight-week summer program at Riverland’s Austin campus. At least 80 Cycles for Success scholarship students will have access to tutoring services in person or online year-round. Contact: Danielle Heiny, (507) 433-0517, [email protected] Native Academy Connections (NAC), MIGIZI Communications, Inc., receives $34,333 Minneapolis As the NAC program continues with its goal to improve academic outcomes for American Indian youth, 200 9th-12th grade students will participate in activities that lead to students succeeding in academically rigorous high school course work and applying to and succeeding in postsecondary education. Activities will fall into one of three areas: academic skill building, postsecondary preparation, or summer career exploration. Fifty 9th-12th grade students will also participate in college visits. NAC will implement these programming elements after school, on student release days, and during the summer that will support academic success in rigorous coursework with a future inclusive of postsecondary education. Contact: Graham Hartley, (612) 721-6631, ext. 208, [email protected] Urban League Black Gems Project: An Intervention for College Attendance Program, Minneapolis Urban League, receives $25,000 Minneapolis Black Gems “So You Want to be a Millionaire: A Career Awareness Project,” will deliver eight sessions (one hour each month) to a cohort of 25-30 historically underserved high school students (low income, racial/ethnic minority, and/or first generation to attend college). Careers will be selected based on student interest and with the goal of presenting African American

32
professionals in underrepresented careers. Participants will attend a college visit to a Minnesota State University campus after completing a career pathway plan aligned with college enrollment. Parents will meet three times to discuss their child’s career goals, including academic rigor, financial aid for college, and program support. The program meets twice each week from September through April for content classes and/or field trips and each Saturday from September through mid-December in the computer fundamentals, Microsoft Office Suite, and coding class. Content experts will deliver the lessons with the support of program staff, interns, and volunteers. Contact: Marquita Stephens, (612) 302-3114, [email protected] Compass, Eastern Carver County Schools – District 112, receives $19,993 Chaska Fifty juniors and seniors who attend ECCS High School and are low-income, a member of a group traditionally underrepresented in higher education, and/or the first in their family to attend college will participate in the Compass program. Students will meet with their grade-level Compass cohort monthly to learn about relevant college-readiness topics, such as financial aid, housing, ACT prep courses, etc. Participants will have access to individualized counseling and will have the opportunity to engage in extracurricular trips and activities to increase their exposure to college campuses and college-readiness experiences. Students and parents will gain a broad base of general knowledge of higher education options and admissions skills. Students will gain familiarity with college campuses and will be exposed to a wide variety of feasible options for their higher education path. Students will create and work towards self-identified goals to help them achieve their desired higher education paths. Also, all participants will either maintain or improve their overall GPA by the end of the year. At least 80% of the students who participate fully in the ACT test prep class will demonstrate improvement from their pre-ACT test score. Students will demonstrate an increased awareness of ACT test preparation knowledge and the role it plays in college goal planning. Finally, 80% of graduating senior cohort members will successfully apply to and register for college before fall semester. Contact: Jeff Theis, (952) 556-6219, [email protected] Education Pathways for Youth Project, Emerge Community Development, receives $10,000 Minneapolis The project will support 40 low-income African and African American 9th-12th graders in North Minneapolis and the Cedar Riverside neighborhood to gain access to postsecondary education by increasing participants’ aspirations for college enrollment, increasing academic preparation, and empowering the initial transition to college. The core activities of the project will be: TABE (test for adult basic education) testing to determine academic needs, career exploration, college visits, workshops, presentations from partners, incentives for full participation, and access to other EMERGE resources. Contact: Will Wallace, (612) 529-9267, [email protected]

33
ASPIRE! College Readiness, Banyan Community, receives $20,000 Minneapolis To ensure that 22 9th-12th grade youth from the Phillips neighborhood in South Minneapolis are well prepared to thrive in college, ASPIRE! will provide tutoring support, instruction in study skills, ACT prep, individualized mentoring, assistance in building a college plan, and supporting and empowering family. Students in this program are leaders, role models, and tutors to younger participants. Contact: Katie Kirk, (612) 722-8512, [email protected] Furthering Achievement through a Network of Success (FANS), Pillsbury United Communities, receives $20,000 Minneapolis The FANS project will support 64 North and South Minneapolis first generation college-bound students of color in grades 9-12 to assure high school graduation and college and career readiness. FANS students are talented youth who often require additional academic support to maintain competitive grades for college admission. The project objective is to increase academic success and GPAs through mentorship, case management, and tutoring. A minimum of eight in-state college trips are planned to break down stereotypes, assumptions, or anxiety around attending college in the MnSCU system outside of the metro area. Contact: Julie Graves, (612) 455-0365, [email protected]

34
Appendix B: Map of ICAP Grantees

35

36
Appendix C: Grantee Reporting Requirements

37
Due: 7/19/19
Fiscal Year 2019 Intervention for College Attendance Program
Final Report Requirements
Project Period: Year 2 The Intervention for College Attendance Program (ICAP) fosters postsecondary attendance by providing outreach services to historically underserved students in grades six through twelve and to historically underrepresented college students. Using the guidance provided below, report the outcomes of your fiscal year 2019 ICAP grant awarded by the Minnesota Office of Higher Education.
I. Project Identification
A. Project Title:
B. Grantee: (Organization awarded the grant)
C. Project Director:
D. Number of Years Grantee has Received ICAP Funding:
II. Participant Data
A. Number of Program Participants during 2018-19 Academic Year:
B. Number of ICAP participants at designated grade levels - Middle/junior high school grades 6-8:
Senior high school grades 9-12:
Postsecondary students:
C. Number of underrepresented college students or recent college graduates utilized to support program (i.e. tutors/mentors):
D. Identify the specific ICAP student eligibility criteria* that you used to select participants?
E. Explain how you are able to verify that the students in your program are eligible to receive ICAP services?
F. Does your program work with a targeted student demographic?

38
III. Program Description
A. Check all services that your program provides using ICAP funding: a. Academic Counseling (in-school) ( ) b. Academic Counseling (after school) ( ) c. Mentoring ( ) d. Parent Outreach ( ) e. English as a Second Language (ESL) Services ( ) f. Academic Enrichment Activities ( ) g. Culturally Specific/Relevant Activities ( ) h. Tutoring (in-school) ( ) i. Tutoring (after school) ( ) j. Career Awareness ( ) k. College Tours ( ) l. College Knowledge Activities ( ) m. Financial Aid/FAFSA Help ( ) n. ACT Prep ( ) o. ACT Prep with Pre- and Post-testing ( ) p. Accuplacer Testing ( ) q. Financial Literacy ( ) r. Postsecondary support ( ) s. Other (list) ( ) ___________________________________________________
B. What access does your organization have to student data such as: GPA/grades, ACT test scores, school absences, FAFSA completion rates, college acceptance, and college persistence? How does the access or lack of access to that data impact your program?
IV. Outcomes
A. State the program’s overall goal.
B. Use the template provided in Appendix A to identify EACH objective from your proposal, and provide the related activity, evaluation measure, and outcome.
C. Describe how your program specifically impacted each area of students’ social-emotional
development throughout the year, if applicable:
1. Self-Awareness
2. Self-Management
3. Responsible Decision Making
4. Relationship Skills

39
5. Social Awareness
One element of ICAP services is encouraging students to enroll in advanced courses. If you track student participation in advanced courses, please fill out the table below.
Enrollment in Advanced Courses
PreAP/
PreIB*
AP
IB
Honors
CIS
Postsecondary
Enrollment
Options
Other Advanced
Course (Identify)
Number of middle school students
Number of high school Students
*PreAP and PreIB courses are on-grade level advanced courses designed as rigorous preparation for high school AP
or IB courses.
Please provide any additional information regarding ICAP student enrollment in advanced courses. For example, report the letter grades received by students enrolled in the different advanced courses. If you are not able to collect this information, please explain why.
D. Another element of ICAP services is ACT or SAT preparation. If your program offers ACT or SAT preparation to students: • Compare the base scores to the student scores at the end of the test prep program. • Indicate the change in average scores. • Indicate the percentage of students whose scores improved.
Indicator Score
Base Score/Pre-test (average) /
Actual Score/Post-test (average)
Average Change in Score
Percentage of Students with Improved Scores

40
F. Please fill out the table below to show the project’s impact on high school graduation rates and college participation rates for ICAP program participants during Year 2 (2018-19). This information is crucial. If you cannot report on these data points for any reason, please contact Alaina DeSalvo.
ICAP Program Participants Year 2 (2018-19)
Number of high school seniors served
Number of high school seniors served who graduated
Number of graduating seniors who have applied to postsecondary
institutions for the 2018-19 academic year
Number of graduating seniors who did not apply for fall 2019
college admission, but plan to enroll in the future
G. The high school graduation rates and college participation rates of your ICAP project’s high school seniors compared with the rates of their peers (other seniors at their high school and contemporaries of the same status as identified by the ICAP Student Eligibility Criteria).
High School Graduation Rate
College Application Rate
Participating ICAP 2018-2019 seniors
All seniors at schools served
Peer group seniors at schools served - students with the same ICAP student eligibility, but not ICAP participants
Note that information on the graduation rate at Minnesota’s high schools can be found at: http://rc.education.state.mn.us. This information is crucial. If you cannot report on these data points for any reason, please contact Alaina DeSalvo.
IV. Programs that Serve Postsecondary Students
If your program does not serve postsecondary students, please skip to Section V
A. Fill out the table below to show the college success (retention) of participating college students compared to their peers.

41
Postsecondary Retention Rate
Fall Semester Spring Semester
Participating ICAP postsecondary students 2018-2019
Peer group - postsecondary students with the same ICAP Student Eligibility, but not participating in ICAP activities
Report retention rate for each participating class (freshman→senior), if ICAP provides support for students in multiple classes.
B. Fill out the below table to show the college success (numerical Grade Point Average) of participating college students compared to their ICAP-eligible peers.
Postsecondary Numerical
Grade Point Average (GPA)
Fall Semester Spring Semester
ICAP postsecondary students 2018-2019
Peer group - postsecondary students with the same ICAP Student Eligibility, but not participating in ICAP activities
Report numerical GPA for each participating class (freshman→senior), if ICAP provides support for students in multiple classes.
C. Fill out the table below to show the college success (graduation) of participating college students.
Graduation of ICAP Postsecondary Students
ICAP 2018-2019 college students receiving:
Certificate/diploma of completion
Associate’s degree
Bachelor’s degree

42
D. Data on project’s impact on college participation rates from prior ICAP grants.
Number of Participants from Previous ICAP Programs
Who Are Now Graduates of Postsecondary Institutions
ICAP students receiving:
ICAP Grant 2006
ICAP Grant 2007
ICAP Grant 2008
ICAP Grant 2009
ICAP Grant 2010
ICAP Grant 2011
ICAP Grant 2012
ICAP Grant 2013
ICAP Grant 2014
ICAP Grant 2015
Postsecondary certificate/ diploma of completion
Associate’s degree
Bachelor’s degree
Number of Participants from Previous ICAP Programs
Who Are Now Graduates of Postsecondary Institutions
ICAP students receiving:
ICAP Grant 2016
ICAP Grant 2017
ICAP Grant 2018
ICAP Grant 2019
Postsecondary certificate/ diploma of completion
Associate’s degree
Bachelor’s degree
V. Successes and Challenges
A. Did the students in your project participate in other college access programs? (A college access program would be a structured series of services designed to enhance academic and social development in high school students to better prepare them for postsecondary success.) If yes, identify those programs. How does your program fit in and complement the other services available to students?
B. Were there any unanticipated results for the 2018-2019 project, either positive or negative?
C. Were there unanticipated learnings for you, the project director, because of the 2018-2019 grant? If yes, what were they?
D. Please discuss successes and challenges of any partnerships that were established in order to achieve program outcomes.
E. Identify the main academic support factor from your project that ensures participants in grades six through 12 are meeting college-ready standards or college-ready high school graduation requirements.

43
If applicable, identify the main academic support factor from your project that ensures “success” in college for your postsecondary participants.
F. Describe how your program impacts larger systems change for the community or student demographic you are serving.
VI. Project Products and Support
A. If project information and outcomes were disseminated, please identify those efforts and materials.
B. Attach a copy of any publication or provide the electronic link to any publication that resulted from grant support.
VII. Final Invoice
A. To close out your project, the attached ICAP Final Invoice must be submitted by July 19, 2019. The report must be completed and signed by personnel from your finance office.
B. Documentation of the amount and source of matching funds (cash or in-kind contribution) must be provided as part of the Final Financial Report. Complete and submit the Statement of Matching Project Expenditure and indicate the matching amount and source of the matching resources below.
Source of Matching Resources:
1. __________________________________________________________ 2. __________________________________________________________ 3. __________________________________________________________ 4. __________________________________________________________
Cash or In-Kind Contribution:
$___________________
$___________________
$___________________
$___________________
* Student Eligibility Criteria: Eligible students include students in grades six through 12 who meet one or more of the following criteria: (1) are counted under section 1124(c) of the Elementary and Secondary Education Act of 1965 (Title I); (2) are eligible for free/reduced price lunch under the National School Lunch Act; (3) receive assistance under the Temporary Assistance for Needy Families Law (Title I of the Personal Responsibility and Work Opportunity Reconciliation Act of 1996); or (4) are a member of a group traditionally underrepresented in higher education. Eligible undergraduate students include those who met the student eligibility criteria as sixth through 12th graders.
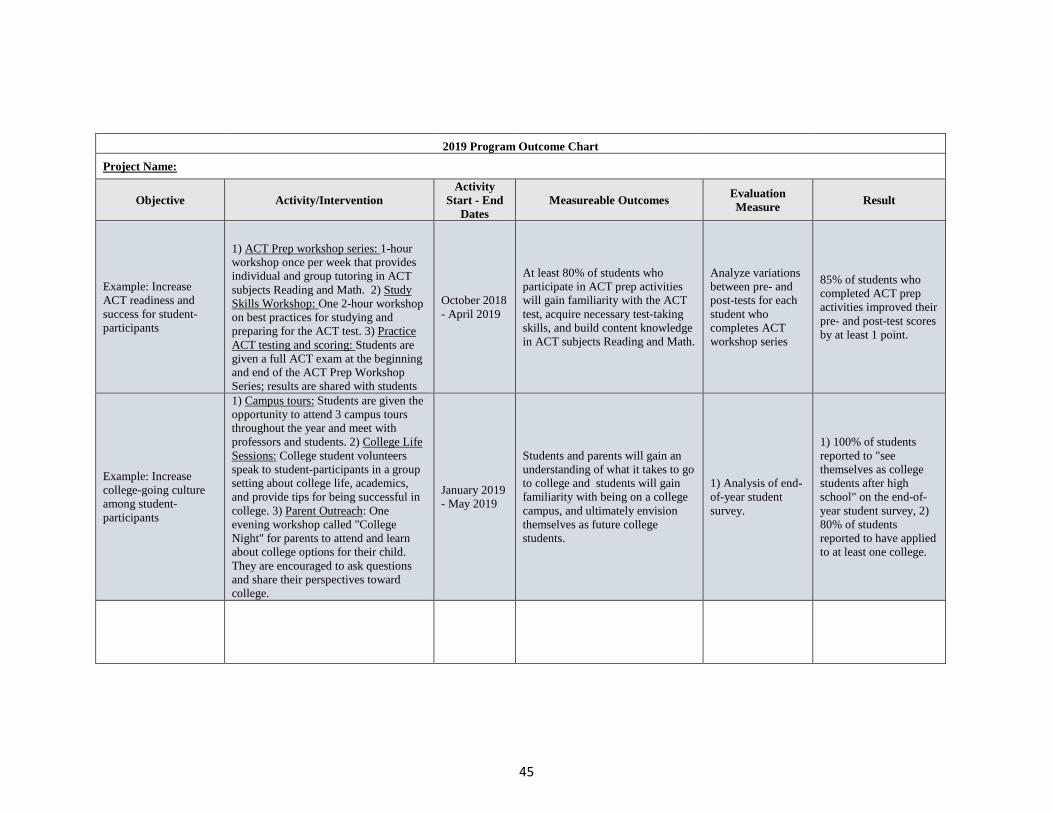
45
2019 Program Outcome Chart
Project Name:
Objective Activity/Intervention Activity
Start - End Dates
Measureable Outcomes Evaluation Measure Result
Example: Increase ACT readiness and success for student-participants
1) ACT Prep workshop series: 1-hour workshop once per week that provides individual and group tutoring in ACT subjects Reading and Math. 2) Study Skills Workshop: One 2-hour workshop on best practices for studying and preparing for the ACT test. 3) Practice ACT testing and scoring: Students are given a full ACT exam at the beginning and end of the ACT Prep Workshop Series; results are shared with students
October 2018 - April 2019
At least 80% of students who participate in ACT prep activities will gain familiarity with the ACT test, acquire necessary test-taking skills, and build content knowledge in ACT subjects Reading and Math.
Analyze variations between pre- and post-tests for each student who completes ACT workshop series
85% of students who completed ACT prep activities improved their pre- and post-test scores by at least 1 point.
Example: Increase college-going culture among student-participants
1) Campus tours: Students are given the opportunity to attend 3 campus tours throughout the year and meet with professors and students. 2) College Life Sessions: College student volunteers speak to student-participants in a group setting about college life, academics, and provide tips for being successful in college. 3) Parent Outreach: One evening workshop called "College Night" for parents to attend and learn about college options for their child. They are encouraged to ask questions and share their perspectives toward college.
January 2019 - May 2019
Students and parents will gain an understanding of what it takes to go to college and students will gain familiarity with being on a college campus, and ultimately envision themselves as future college students.
1) Analysis of end-of-year student survey.
1) 100% of students reported to "see themselves as college students after high school" on the end-of-year student survey, 2) 80% of students reported to have applied to at least one college.

46
Appendix D: Student Participation in Other College Access Programs

47
ICAP 2017-2018 Grantees
Student Participation in Other College Access Programs
ICAP Grantee ICAP Grant Students Were Involved in These Other Programs
Concordia University, St. Paul Breakthrough Twin Cities, College Possible, Multicultural Excellence Project, Upward Bound
Alpha Phi Alpha ACT/SAT Review through the Breck School and Twin Cities Academy, Upward Bound, Maximum Impact Training, Get Ready, Scholars of Minnesota – COPE Project, Asanteman Association of Minnesota, ASCENT Program, AVID, Boys to Men Mentoring Program, TRIO Educational Talent Search, Big Brothers Big Sisters
Minnesota State University, Mankato College Possible The College of St. Scholastica Upward Bound, Upward Bound Math & Science Program Saint Paul Public Schools AVID, Youth Lead, College Possible, Minnesota
Minority Education Partnership, Breakthrough Twin Cities
Women’s Initiative for Self Empowerment (WISE), Inc.
Wilder Foundation’s Youth Leadership Initiative, Dunwoody College’s Women in Technical Careers Program, International Institute of Minnesota’s College Readiness Academy, AVID, College Possible
Learning Disabilities Association, Inc. River’s Edge Academy’s College and Career Exploration Curriculum
St. Could State University Minnesota State’s Access to Opportunity Program, SCSU Summer Pipeline Program, AVID, Dreamline Program
Breakthrough Twin Cities College Possible, AVID, Genesys Works, Upward Bound, Educational Talent Search
Carleton College Northfield TORCH, Faribault CAST, Faribault Summer STEAM
SouthWest Metro Educational Cooperative Northfield Public Schools Minnesota Business Ventures, St. Catherine
University First Step, Macalester Institute for Talented Youth, Minnesota College Access Network, Mayo Clinic Career Festival, Page Scholarship
Saint Paul College Metropolitan State and University of Minnesota’s College Access Initiatives
Bemidji State University TRIO Upward Bound Ely Community Resource, Inc. Ramp Up to Readiness Dakota County Technical College AVID, Genesys Works Riverland Community College Cycles for Success Minneapolis Urban League

48
MIGIZI Communications, Inc. Minneapolis Public Schools’ Indian Education Department, Step Up Minneapolis, AchieveMpls
Pillsbury United Communities College Possible
Eastern Carver County Schools