annual report 2018-19 · السنوي، يمكنك الاتصال بخدمة الترجمة...
TRANSCRIPT

DEP
AR
TM
ENT
OF
LOC
AL
GO
VER
NM
ENT,
H
OU
SIN
G A
ND
CO
MM
UN
ITY
DEV
ELO
PMEN
TANNUAL REPORT 2018-19

Published by the Northern Territory Government Department of Local Government, Housing and Community Development
©Northern Territory Government, 2019
Apart from any use permitted under the
Copyright Act 1968, no part of this document may
be reproduced without prior written permission
from the Northern Territory Government through
the Department of Local Government, Housing
and Community Development.
ISSN: 2205-7676
Refer enquiries to:
GPO Box 4621,
Darwin NT 0801
Email: [email protected]
Website: dlghcd.nt.gov.au
DEPARTMENT OF LOCAL GOVERNMENT, HOUSING AND COMMUNITY DEVELOPMENT ANNUAL REPORT 2018-19 1
ContentsWelcome 2
Acknowledging Traditional Owners 2
Legislative requirements 2
Language assistance 3
Electronic version 3
Letter Of Compliance 4
Chief Executive Officer’s message 5
1. ABOUT US 7
Our values 8
Our organisation 10
2. OUR PEOPLE AND ACHIEVEMENTS 13
Human Resources 14
Service Delivery 19
Local Government and Community Development 28
Procurement and Grants Management 44
Strategy, Policy and Performance 46
Community Services 55
Remote Program Delivery Office 61
Town Camps 67
Housing Programs and Support Services 71
Capital works expenditure 76
3. CORPORATE AND GOVERNANCE 77
Groups and committees 79
Compliance framework 81
4. FINANCIAL REPORTS Department of Local Government, Housing and Community Development
83
5. NT HOME OWNERSHIP 137
HomeBuild Access Loans 138
Financial Reports - NT Home Ownership 140

2
WelcomeThe Department of Local Government, Housing and Community Development is pleased to present the 2018-19 Annual Report.
The annual report has been prepared to inform the Northern Territory Legislative Assembly through the Minister for Local Government, Housing and Community Development, The Hon. Gerald McCarthy MLA, stakeholders, partners and the public about the functions, activities, people, performance, strategic intent and outcomes of the department.
The report satisfies the requirements of the Public Sector Employment and Management Act 1993, the Financial Management Act 1995 and the Information Act 2002.
ACKNOWLEDGING TRADITIONAL OWNERSThe Department of Local Government, Housing and Community Development respectfully acknowledges the past and present traditional custodians of this land on which we work.
We show our recognition and respect for Aboriginal and Torres Strait Islander people, their culture and their heritage while working towards improved social outcomes for the Northern Territory.
LEGISLATIVE REQUIREMENTSIn accordance with the Northern Territory Administrative Arrangements Order, the Department of Local Government, Housing and Community Development administers the following Acts of the Northern Territory Legislative Assembly and subordinate legislation:
• Cemeteries Act 1952
• Community Housing Providers (National Uniform Legislation) Act 2013
• Crown Lands Act 1992 (section 79)
• Housing Act 1982
• Local Government Act 2008 (except Chapter 8)
• Local Government Grants Commission Act 1986
• Local Government (Katherine Rates) Act 1999
• Northern Territory Rates Act 1971
• Nudity Act 1975
• Pounds Act 1930
• Status of Darwin Act 1959
• Status of Palmerston Act 2000.
Under the Northern Territory Administrative Arrangements Order dated 12 September 2016, the Minister for the Department of Local Government, Housing and Community Development has responsibility for:
• Aboriginal housing
• remote communities and homelands
• community and social housing
• community development for regional centres, remote communities and homelands
• coordinating funding of essential services to remote Aboriginal communities not serviced by the Australian Government
• coordinating municipal essential services for regional centres, remote communities and homelands
• essential services for remote communities and homelands
• government employee housing
• homelessness services
• housing
• interpreting and translating services
• local government
• local government funding
• public housing.

DEPARTMENT OF LOCAL GOVERNMENT, HOUSING AND COMMUNITY DEVELOPMENT ANNUAL REPORT 2018-19 3
LANGUAGE ASSISTANCEThe Northern Territory Government is committed to providing accessible services to Territorians from all cultural and linguistic backgrounds.
If you have difficulty understanding this annual report, you can contact the interpreter service on 131 450 for help.
Chinese 如果您对理解这份年度报告存在困难,敬请拨打口译服务电话131 450寻求帮助。
GreekΑν έχετε δυσκολίες στην κατανόηση αυτής της ετήσιας έκθεσης, μπορείτε να επικοινωνήσετε με την υπηρεσία διερμηνέων για 131 450 για βοήθεια.
Thaiหากคุณประสบปัญหาในการทำาความเข้าใจรายงานประจำาปีฉบับนี้ คุณสามารถติดต่อขอความช่วยเหลือจากฝ่ายบริการล่ามได้ที่หมายเลข 131 450.
SwahiliIkiwa una ugumu wa kuelewa repoti hii ya mwaka, unaweza wasiliana na huduma ya ukalimani kwa 131 450 kwa usaidizi.
IndonesianJika Anda mengalami kesulitan memahami laporan tahunan ini, Anda dapat menghubungi layanan juru-bahasa di 131 450 untuk mendapat bantuan.
VietnameseNếu quý vị gặp khó khăn trong việc hiểu bản báo cáo thường niên này, quý vị có thể liên lạc với dịch vụ thông dịch viên ở số 131 450 để được giúp đỡ.
Arabic ريرقتلا اذه مهف يف ةبوعص هجاوت تنك اذا
ةمجرتلا ةمدخب لاصتالا كنكمي ،يونسلا ىلع لوصحلل 131 450 مقرلا ىلع ةيهفشلا
.ةدعاسملا
ItalianSe hai difficoltà a capire questa relazione e bilancio annuale, puoi contattare il servizio interpreti al numero 131 450 per l’assistenza del caso.
PortugueseSe tiver dificuldade em compreender este relatório anual, pode contactar o serviço de intérpretes através do número 131 450 para obter ajuda.
FilipinoKung nahihirapan kang unawain ang taunang ulat na ito, maaari mong kontakin ang serbisyo ng interpreter sa 131 450 para sa tulong.
ELECTRONIC VERSIONAn electronic version of this report is available on the department’s website at dlghcd.nt.gov.au/about-us
This symbol indicates that more information is available on our website.
4
Letter Of ComplianceThe Hon. Gerald McCarthy MLA
Minister for Local Government, Housing and Community Development
Parliament House
DARWIN NT 0800
Dear Minister
Department of Local Government, Housing and Community Development 2018-19 Annual Report.
I am pleased to present the Department of Local Government, Housing and Community Development’s annual report for the financial year 1 July 2018 to 30 June 2019.
Pursuant to the Public Sector Employment and Management Act 1993, the Financial Management Act 1995 and the Information Act 2002, I advise that to the best of my knowledge and belief:
• The department has kept proper records of all transactions affecting the department and employees have observed the provisions of the Financial Management Act 1995, the Financial Management Regulations and Treasurer’s Directions.
• Procedures within the agency afford proper internal control and a current description of such procedures has been recorded in the accounting and property manual which was prepared in accordance with the requirements of the Financial Management Act 1995.
• No indication of fraud, malpractice, major breach of legislation or delegation, major error in or omission from the accounts and records exists (or, where this is not the case, the department has provided details of any such instances).
• In accordance with the requirements of section 15 of the Financial Management Act 1995, the internal audit capacity available to the agency is adequate and the results of internal audits have been reported.
• The financial statements in this annual report have been prepared from proper accounts and records and are in accordance with Treasurer’s Directions.
• All employment instructions issued by the Commissioner for Public Employment have been satisfied.
• The agency has complied with the provisions as prescribed in the Information Act 2002, including information access, privacy protection, records and archives management.
Yours sincerely
Jamie Chalker CHIEF EXECUTIVE OFFICER
30 September 2019

DEPARTMENT OF LOCAL GOVERNMENT, HOUSING AND COMMUNITY DEVELOPMENT ANNUAL REPORT 2018-19 5
Chief Executive Officer’s messageI am proud to present the 2018-19 annual report for the Department of Local Government, Housing and Community Development.
The department has a significant footprint across the Northern Territory, and touches each corner whether it is through our work in urban and remote housing, through the local government sector or interpreter services, or through community development.
We remain committed to deliver improved social outcomes for the Territory and its people.
This includes improving access to housing and reducing overcrowding, further supporting community development and growth, increasing local decision making and providing capability development and governance support to councils and regional communities.
In this annual report, we recognise several successes in these areas, and in particular I would like to highlight some of these achievements.
Our people• The initial quick response by department staff
to the Tropical Cyclone Trevor emergency, and the ongoing effort during the evacuation and recovery phase.
• 36 different training courses were delivered across 105 sessions, facilitating the education and workplace health and wellbeing of our staff.
Housing• The Our Community. Our Futures. Our Homes.
program attended 102 community meetings with the Aboriginal Interpreter Service covering 22 Aboriginal languages.
• Room to Breathe have scoped 648 households, and have added 231 living spaces in 144 homes across 24 communities.
• Room to Breathe employment achievements averaged 49% for the proportion of Aboriginal people employed.
• The $100 million public housing stimulus program awarded 187 contracts for works packages to 197 homes.
• Seven social housing head leased dwellings were added to the department’s stock.
• Eight new public housing dwellings were built, and 23 were replaced under the Urban Housing Strategy.
• The construction of John Stokes Square precinct commenced in June 2019, and will see the existing 75 public housing dwellings replaced with 78 new homes which are fit-for-purpose.
• The department helped 63 eligible first home buyers into the market through the HomeBuild Access program.
• An additional six Public Housing Safety Officer positions were created in 2018 to expand the Public Housing Safety Strategy to Katherine and Tennant Creek.
Homelessness• Release of the Pathways out of Homelessness,
Northern Territory Homelessness Strategy 2018-23.
• Funding was provided to Mission Australia to implement the Housing for Young People program in the Greater Darwin region, to support young people who are leaving, or who have already left the care of the Chief Executive Officer, Territory Families; and work with them to develop independence and enter into private rental agreements.
• Funding was granted to NT Shelter for capacity development to enable 56 eligible participants to attend the National Housing Conference, hosted by the Northern Territory for the first time during 27 to 30 August 2019.

6
Town camps• The Town Camps Futures Unit was established
with five new positions created. The unit has also established an External Advisory Group to provide advice, guide and inform the critical reforms across the 43 town camps and community living areas.
• The Town Camps Housing and Infrastructure Program has expended $30.8 million with 271 projects commenced and 207 completed.
Homelands• Our department allocated $43.4 million to
service providers as grants for service delivery in 382 homelands, 43 town camps and nine remote communities.
• Homelands Services managed 142 capital projects across 100 different homelands.
Governance• Consulted with key stakeholders on the
draft Burial and Cremation Bill to replace the Cemeteries Act 1952.
• Consulted with key stakeholders on the draft Local Government Act 2008.
• Provided oversight and regulatory services to the local government sector.
• Led the ‘Your Voice, Your Community’ campaign to assist Territorians update their electoral enrolment information and Medicare details. This involved visiting 79 remote communities and 16 town camps in six weeks.
Interpreting services• The Aboriginal Interpreter Service completed
8872 interpreting jobs. This equates to 33 852 interpreting hours in 36 languages.
• The Interpreting and Translating Service NT completed 3402 interpreting assignments in 33 different languages, as well as 664 translations into 37 different languages.
• The Aboriginal Interpreter Service recorded phone messaging in language for NT Police. This project won the Australian Information Industry Association SA and NT iAward in the category of Community Services Markets – NT.
I would like to acknowledge the efforts of the department staff in these successes. These achievements are attainable because of their skills, but also their dedication to ensuring the best outcomes for Territorians.

ABOUT US 1

8 ABOUT US
Our valuesThe department is guided by and promotes the Northern Territory Public Sector (NTPS) values. The NTPS values are:
PURPOSE AND DIRECTION STRATEGY
Consistent with our values, the department’s Purpose and Direction Strategy clearly outlines our purpose, vision and mission.
Commitment to serviceThe NTPS is professional, hardworking, effective, innovative and efficient, working collaboratively to achieve the best results for the NT.
Purpose Develop sustainable communities through partnerships to enhance the physical and social wellbeing of Territorians through connected and resourceful service delivery.
Vision An engaged, dynamic social service that maximises opportunities for Territorians to strive, thrive and prosper.
Mission We will know our business, our people and our community to deliver improved social outcomes for the NT.
Ethical practiceThe NTPS upholds the highest standards of practice and acts with integrity in all it does.
RespectThe NTPS respects all people and in particular, their rights as individuals.
AccountabilityThe NTPS is transparent and accountable in all its actions.
ImpartialityThe NTPS is apolitical and gives the government advice that is objective, timely and based on the best available evidence.
DiversityThe NTPS values the diversity of its workforce and the NT population it serves.

DEPARTMENT OF LOCAL GOVERNMENT, HOUSING AND COMMUNITY DEVELOPMENT ANNUAL REPORT 2018-19 9
CORPORATE PLAN
The Corporate Plan and the Purpose and Direction Strategy both provide our clear purpose, vision and mission. Combined they highlight who we are, the work we do, how we do it and guidance on what we want to achieve long term.
OUR STAKEHOLDERS AND PARTNERS
We work with a broad range of stakeholders and partners in developing sustainable communities, primarily:
• Northern Territory Government
• non-government organisations, including the housing and homelessness sector
• legal advocates and peak bodies
• homelands service providers
• Aboriginal corporations
• local government councils and the Local Government Association of the Northern Territory
• land councils
• Aboriginal peak bodies
• Aboriginal business enterprises
• the construction and property development sectors
• Australian Government
• other government agencies.

10 ABOUT US1010
Our organisationOVERVIEW OF THE DEPARTMENTThe Department of Housing and Community Development became the Department of Local Government, Housing and Community Development during 2018-19. This change was announced by the Chief Minister, the Hon. Michael Gunner, MLA on 31 January 2019, and was then reflected in the Administrative Arrangements Order of the same date.
The Northern Territory Department of Local Government, Housing and Community Development comprises two output groups: Local Government, Housing and Community Development, and Corporate and Governance.
The Local Government, Housing and Community Development output group includes Housing Services Delivery; the Remote Housing Program Delivery Office; Community Services; and Local Government and Community Development.
As at 30 June 2019, the Corporate and Governance output group includes Human Resources; Finance and Programs; Procurement and Grants Management; Information Technology and Business Support; Governance and Information Management; and Corporate Communications.
The department manages more than 13 000 dwellings across the Northern Territory’s 1.35 million km2.
In partnership with government and non-government agencies, the department strives to:
• provide accommodation pathways and housing options for Territorians in need
• build stronger regions and communities through effective local government
• deliver and coordinate essential infrastructure projects and services to remote communities
• provide interpreting and translating services to support members of our community who speak a language other than English.
During the 2018 to 2019 financial year, the department had one portfolio minister.
The Hon. Gerald McCarthy, MLA, was appointed Minister for Housing and Community Development on 8 September 2016, and subsequently the Minister for Local Government, Housing and Community Development on 31 January 2019.
Mr Jamie Chalker APM is the Chief Executive Officer and was appointed on 19 December 2016.
OUR STRUCTUREThe department sits within the Northern Territory Government’s Children and Families cluster along with the departments of:
• Territory Families
• Health
• Education
• Police, Fire and Emergency Services.
These community-facing social service agencies work together to better coordinate policy and service delivery throughout the Northern Territory.

DEPARTMENT OF LOCAL GOVERNMENT, HOUSING AND COMMUNITY DEVELOPMENT ANNUAL REPORT 2018-19 11
FUNCTIONS OF THE DEPARTMENT
Office of the Chief Executive The Office of the Chief Executive provides executive support to the Chief Executive Officer, oversees the Secretariat and the Public Housing Appeals Board.
The Secretariat liaises between the department and the office of the minister.
Staff allocate, coordinate and maintain quality control of all ministerial-related correspondence including ministerial briefs, Cabinet submissions, Executive Council submissions and department comments on other agency’s Cabinet submissions.
The office supports and enhances corporate performance and ministerial communications and liaison.
This division is also responsible for coordinating the functions of the Public Housing Appeals Board. The board is a non-statutory body, appointed by the Chief Executive Officer with the approval of the Minister for Local Government, Housing and Community Development. Members are from diverse backgrounds from across the Northern Territory and appointments are for two-year terms.
Office of the Deputy Chief Executive Officer – Housing Services, Local Government and Community DevelopmentThe office is responsible for key operational services, including client-centric social housing services and day-to-day management of housing and local government assets.
It drives urban renewal and leasing programs and NT Home Ownership. It oversees tenancy and client support services in conjunction with non-government sector service providers and the Public Housing Safety program. It also provides grant funding, capability development and monitoring and compliance for the local government sector as well as underpinning support for community development and provides remote information coordination services, including Bushtel.
Office of the Deputy Chief Executive Officer – Remote Program Delivery Office and Community ServicesThe Remote Housing Program Delivery Office (RPDO) is responsible for delivering construction of new homes and improvements to existing homes in remote communities, community consultation, land tenure, Aboriginal Business Enterprise (ABE) development, and related land servicing and
essential services infrastructure to support remote housing programs.
Complementary to these functions, Community Services is responsible for providing Aboriginal and other interpreter and translator services, as well as leading and coordinating the delivery of services to homelands, outstations and town camps.
The Town Camps Futures Unit oversees and drives critical social and economic reforms across the 43 town camps and community living areas.
Strategy, Policy and PerformanceThe division provides strategic planning and review of housing programs, policy development, business intelligence, performance monitoring and reporting. The division comprises the following branches:
• Strategy
• Strategic Performance
• Policy
• Planning.
Corporate Services and GovernanceThe division provides strategic advice and coordination in developing, implementing and delivering financial, programs and budget management, human resources services, marketing and communication and stakeholder relations, information management, workplace health and safety services, business systems, office management services, governance, risk and audit services, procurement and grants management.
It supports the department’s service delivery areas by providing systems and processes that enable the efficient conduct of the department’s business.
The division comprises the following branches:
• Finance and Programs
• Human Resources
• Corporate Communications
• Information Technology and Business Support
• Procurement and Grants Management
• Governance and Information Management.

12 ABOUT US
Chief Executive O
fficer
Senior Director, O
ffice of
the Chief Executve
Deputy Chief Executive
Offi
cer Housing Services,
Local Governm
ent and Com
munity D
evelopment
Executive Director
Corporate Services
Executive Director
Strategy, Policy and Perform
ance
Deputy Chief Executive
Offi
cer Remote Program
D
elivery Offi
ce and Com
munity Services
SecretariatH
ousing ProgramSupport Services
Service Delivery South
Service Delivery N
orth
Local Governm
ent and Com
munity D
evelopment
Hum
an Resources
Finance and Programs
Procurement and G
rants
Information Technology
and Business Support
Goverance and
Information M
anagement
Corporate Com
munications
Strategy
Strategic Performance
Policy
Planning
Comm
unity Services
Remote Program
Delivery O
fficer
Land Tenure
Town Cam
ps Futures
Senior Director
Strategic Projects
Figure 1: Organisational chart as at 30 June 2019

OUR PEOPLE AND ACHIEVEMENTS 2

OUR PEOPLE AND ACHIEVEMENTS 14
Human Resources
96staff attended 6
induction sessions
49%of our employees were located
outside the Darwin region
participants matched with mentors across
the Northern Territory
Aboriginal Mentoring Program pilot
10
23% workforce trainedin Mental First Aid
DEPARTMENT OF LOCAL GOVERNMENT, HOUSING AND COMMUNITY DEVELOPMENT ANNUAL REPORT 2018-19 15
CATEGORY 2017-18 FTE 2018-19 FTE
FTE 607.95 655.53
Part-time 77.59 79.34
Ongoing (permanent) 406.83 437.36
Fixed period 146.41 158.94
Casual 53.99 58.51
Female 379.35 412.18
Aboriginal 173.92 197.49
Table: Workforce profile FTE
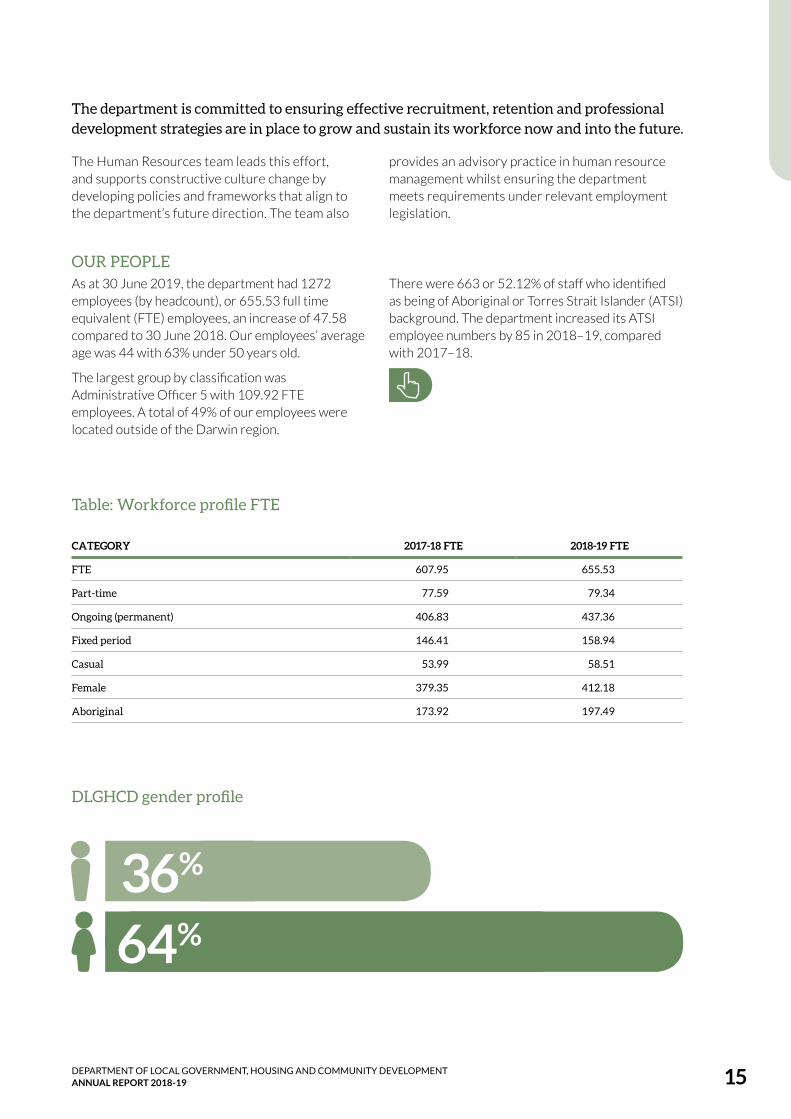
DLGHCD gender profile
The department is committed to ensuring effective recruitment, retention and professional development strategies are in place to grow and sustain its workforce now and into the future.
The Human Resources team leads this effort, and supports constructive culture change by developing policies and frameworks that align to the department’s future direction. The team also
provides an advisory practice in human resource management whilst ensuring the department meets requirements under relevant employment legislation.
OUR PEOPLEAs at 30 June 2019, the department had 1272 employees (by headcount), or 655.53 full time equivalent (FTE) employees, an increase of 47.58 compared to 30 June 2018. Our employees’ average age was 44 with 63% under 50 years old.
The largest group by classification was Administrative Officer 5 with 109.92 FTE employees. A total of 49% of our employees were located outside of the Darwin region.
There were 663 or 52.12% of staff who identified as being of Aboriginal or Torres Strait Islander (ATSI) background. The department increased its ATSI employee numbers by 85 in 2018–19, compared with 2017–18.
36%
64%
OUR PEOPLE AND ACHIEVEMENTS 16
EQUAL EMPLOYMENT OPPORTUNITY GROUP
DEPARTMENT HEADCOUNT 30 June 2018
DEPARTMENT WHOLE- OF-GOVERNMENT TARGET
DEPARTMENT HEADCOUNT 30 June 2019
Aboriginal or Torres Strait Islander
578 or 50.61% 43.8% 1 (by 2020) 663 or 52.12%
Culturally diverse background
185 or 16.20% No set target 350 or 27.51%
People with disability 22 or 1.93% 4% 25 or 1.96%
Women in executive roles SAO2 or above
41 or 60.30% 40% 32 or 57.14% 2
1 The department’s June 2020 target is in line with released Indigenous Employment and Career Development Strategy.2 Data is reflective of FTE staffing at a point in time, not position data. Figures may vary between reporting periods due to factors
including the total senior FTE for the agency, temporary promotions, paid leave and open recruitment occurring at the time
of reporting.
Table: Staff profile by equal employment opportunity groups
GENERAL STAFFING SUMMARY
$100 million public housing stimulus programProject teams were established within the existing organisational structure to deliver on the new $100 million public housing stimulus program with staff recruited to 37 new positions in order to scope, procure, award and manage between 1500 to 3000 tier 1 to tier 3 projects across the Northern Territory.
The program will invest in repairs, upgrades and construction of urban public housing across the Northern Territory resulting in an increase in stock and life span of housing.
Town Camps Futures UnitThe Remote Program Delivery Office finalised its structure including establishing the new Town Camps Futures Unit (TCFU) which saw five new positions established and staff recruited to those positions.
The TCFU is responsible for the provision of a sustainable future model for town camps which emphasises local decision making, and connections to family, culture and country while recognising the fundamental importance of safe and suitable housing to the social and economic development of Aboriginal Territorians.
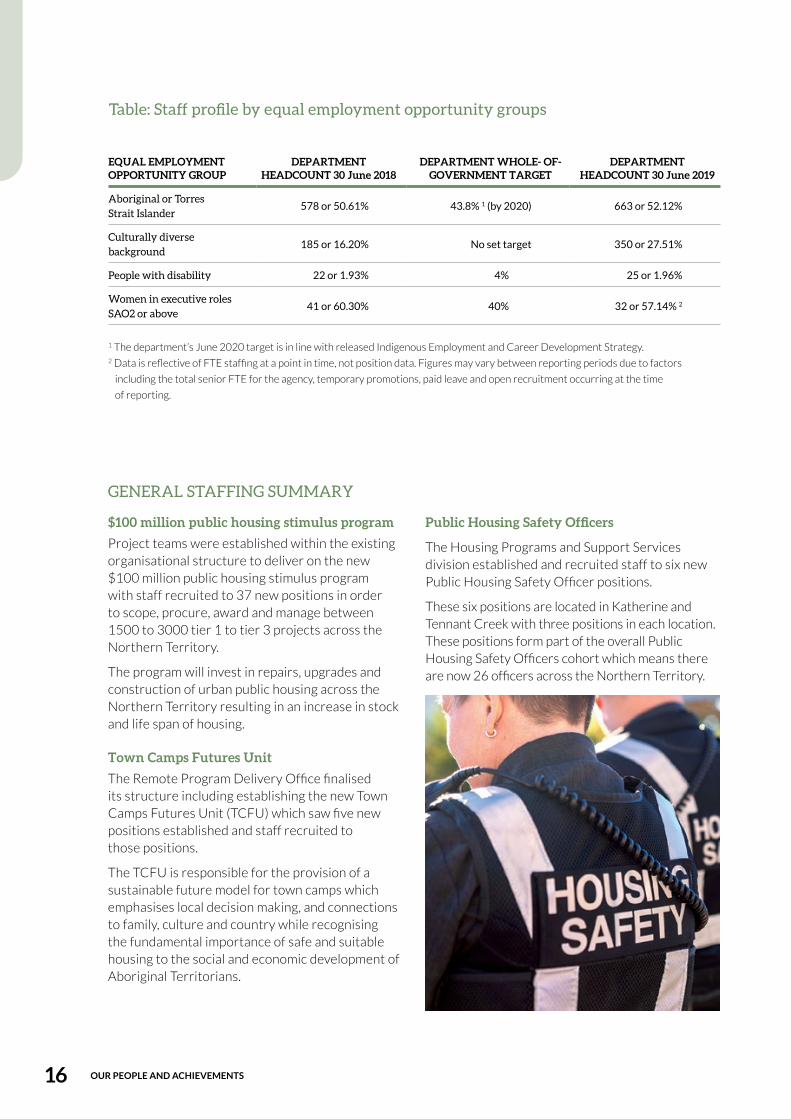
Public Housing Safety Officers
The Housing Programs and Support Services division established and recruited staff to six new Public Housing Safety Officer positions.
These six positions are located in Katherine and Tennant Creek with three positions in each location. These positions form part of the overall Public Housing Safety Officers cohort which means there are now 26 officers across the Northern Territory.
DEPARTMENT OF LOCAL GOVERNMENT, HOUSING AND COMMUNITY DEVELOPMENT ANNUAL REPORT 2018-19 17
Learning and developmentDuring 2018-19, 1833 people attended 105 sessions for 36 training courses offered throughout the Northern Territory. Highlights include:
• Combat Bullying
• Cross Cultural Awareness Training
• Independent Commission Against Corruption (ICAC) Awareness Session
• Mental Health First Aid Training.
The department is committed to the professional development of its employees and building the capability of our workforce is central to delivering services and meeting our objectives.
The department builds capability by facilitating and delivering a range of learning and development programs targeted to build skills and improve performance of employees.
Nationally Recognised Mental Health First Aid Accredited WorkplaceThe department is nationally recognised as a gold skilled workplace in Mental Health First Aid, with 23% of the workforce being trained.
The department has committed to offering accredited Mental Health First Aid training to its employees in order to provide staff with the knowledge and experience to help colleagues, clients, friends and family members who are experiencing a mental illness.
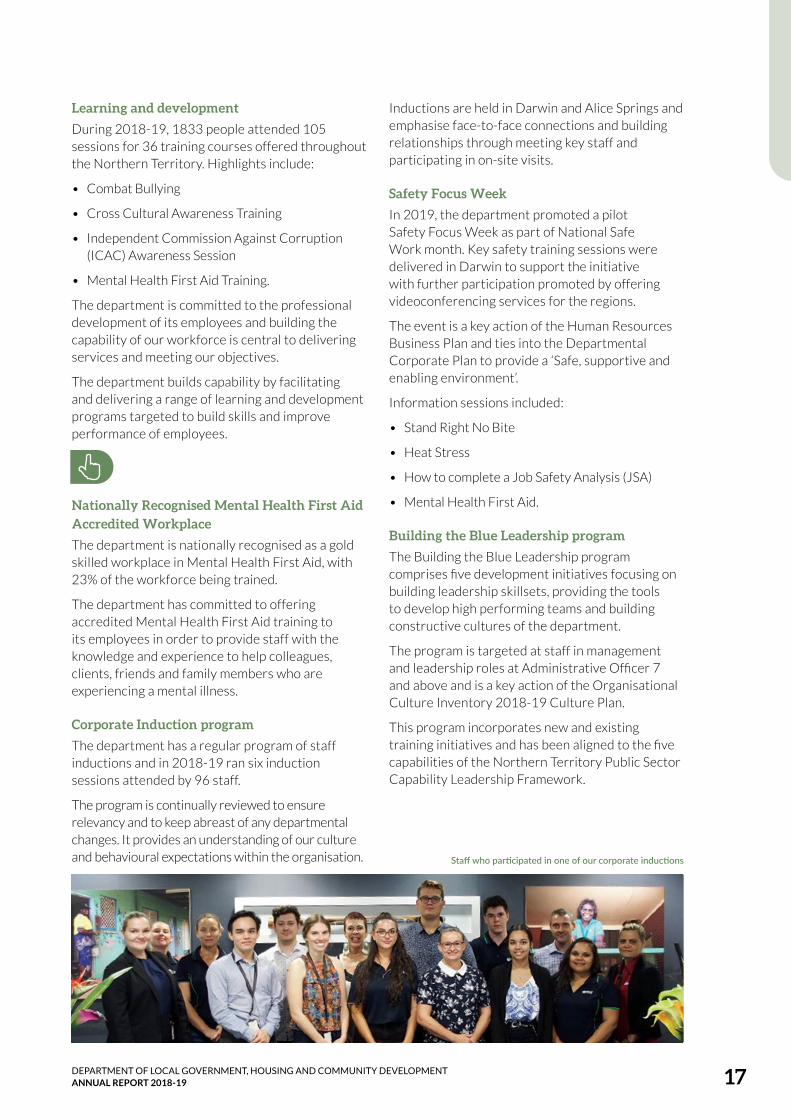
Corporate Induction programThe department has a regular program of staff inductions and in 2018-19 ran six induction sessions attended by 96 staff.
The program is continually reviewed to ensure relevancy and to keep abreast of any departmental changes. It provides an understanding of our culture and behavioural expectations within the organisation.
Inductions are held in Darwin and Alice Springs and emphasise face-to-face connections and building relationships through meeting key staff and participating in on-site visits.
Safety Focus WeekIn 2019, the department promoted a pilot Safety Focus Week as part of National Safe Work month. Key safety training sessions were delivered in Darwin to support the initiative with further participation promoted by offering videoconferencing services for the regions.
The event is a key action of the Human Resources Business Plan and ties into the Departmental Corporate Plan to provide a ‘Safe, supportive and enabling environment’.
Information sessions included:
• Stand Right No Bite
• Heat Stress
• How to complete a Job Safety Analysis (JSA)
• Mental Health First Aid.
Building the Blue Leadership programThe Building the Blue Leadership program comprises five development initiatives focusing on building leadership skillsets, providing the tools to develop high performing teams and building constructive cultures of the department.
The program is targeted at staff in management and leadership roles at Administrative Officer 7 and above and is a key action of the Organisational Culture Inventory 2018-19 Culture Plan.
This program incorporates new and existing training initiatives and has been aligned to the five capabilities of the Northern Territory Public Sector Capability Leadership Framework.
Staff who participated in one of our corporate inductions
OUR PEOPLE AND ACHIEVEMENTS 18
Aboriginal Mentoring Program pilotIn 2018, the department piloted an Aboriginal Coaching and Mentoring Program in partnership with Price Waterhouse Coopers Indigenous Consulting.
The pilot program saw 10 participants matched with mentors across the Northern Territory. This initiative was an action from the department’s Indigenous Employment and Career Development Strategic Action Plan 2017-2018.
Job Evaluation and Design project The aim of the Job Evaluation and Design project is to evaluate staff to ensure appropriate designation and remuneration with regards to work value.
The project has formally established 356 positions within the department under the Job Evaluation System process with a new Job Analysis Questionnaire.
In addition, this process provides existing staff with meaningful, accurate and consistent job descriptions and role clarity and allows the recruitment of people with appropriate skill sets.
Work Health and Safety incidents and hazardsIn 2018-19, there were 212 incidents or hazards reported to the department.
Incidents and hazards are monitored through the Online Incident and Hazard Reporting tool which allows for the evaluation of trends and identification of gaps in training.
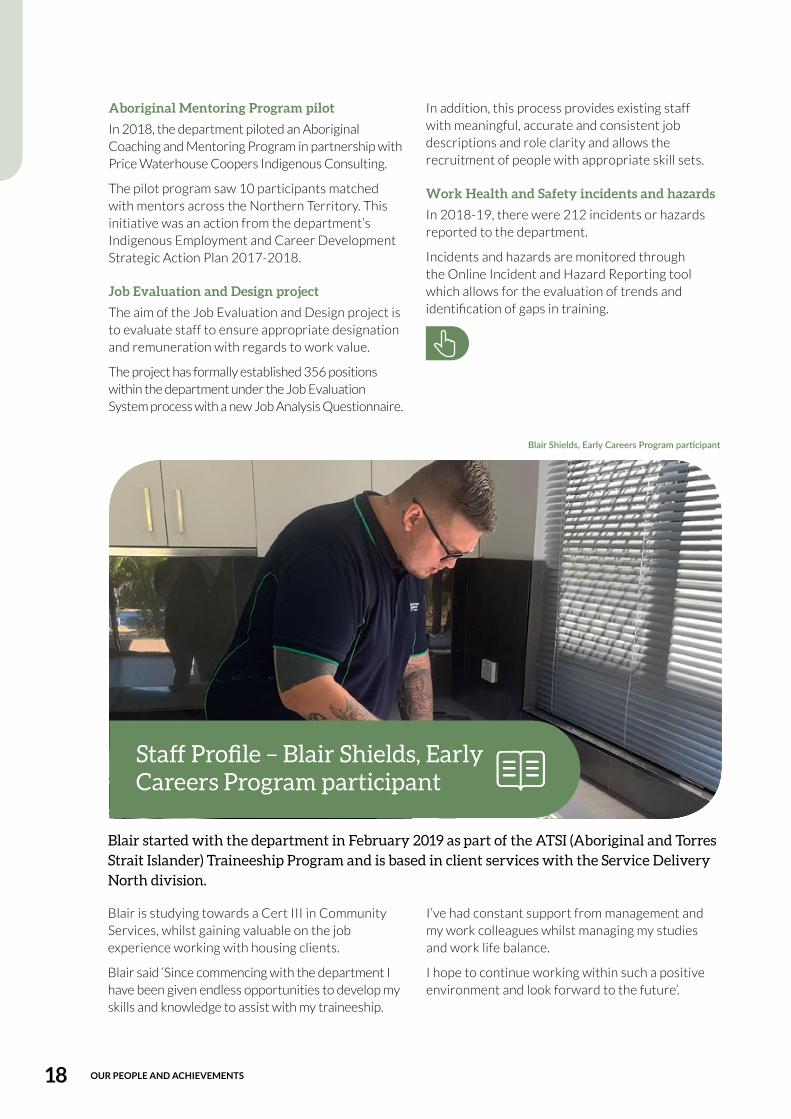
Blair Shields, Early Careers Program participant
Staff Profile – Blair Shields, Early Careers Program participant
Blair started with the department in February 2019 as part of the ATSI (Aboriginal and Torres Strait Islander) Traineeship Program and is based in client services with the Service Delivery North division.
Blair is studying towards a Cert III in Community Services, whilst gaining valuable on the job experience working with housing clients.
Blair said ‘Since commencing with the department I have been given endless opportunities to develop my skills and knowledge to assist with my traineeship.
I’ve had constant support from management and my work colleagues whilst managing my studies and work life balance.
I hope to continue working within such a positive environment and look forward to the future’.

DEPARTMENT OF LOCAL GOVERNMENT, HOUSING AND COMMUNITY DEVELOPMENT ANNUAL REPORT 2018-19 19
Service Delivery
The number of calls received for the call centres in Darwin and Alice Springs in 2018-19 was
82 079
CENTRALAUSTRALIA
BARKLY
BIGRIVERS
EASTARNHEMARAFURA
DARWIN
Tennant Creek
Alice Springs
Katherine
Darwin Jabiru Nhulunbuy
Housing Reference Groups across the
Northern Territory
57Si
nce 1 July 2018, there have been
38 11
Pride in Your Place nominations and
awards won

OUR PEOPLE AND ACHIEVEMENTS 20
The department provides front line service delivery, property and tenancy management services for eligible Territorians and Government employees living in urban and remote housing across the Northern Territory.
Service Delivery North, made up of the Darwin, Arafura, East Arnhem and Big Rivers regions provides assistance to tenants living in housing assets across 13 regional council areas including major and minor centres of Nhulunbuy, Greater Darwin, Palmerston and Katherine and 45 remote communities in those Top End regions.
Service Delivery South, made up of the Barkly and Central Desert regions provides assistance to tenants living in housing assets across three regional council areas including 32 remote communities and major and minor centres of Elliott, Tennant Creek, Ti Tree, Yulara and Alice Springs.
Housing Reference GroupsHousing Reference Groups (HRGs) are voluntary groups providing advice on issues about housing in remote communities, town camps and community living areas.
Department staff and tenancy contractors work with HRG members in each community to ensure that housing decisions are fair and that housing is provided to families most in need.
For Service Delivery North there are 30 HRGs - 14 in the Big Rivers region and eight each in the Arnhem and Arafura regions.
For Service Delivery South there are 27 HRGs - 20 in the Alice Springs region and seven in the Barkly region.
$100 million public housing stimulus programThe $100 million public housing stimulus program has the dual objective of providing an economic boost to smaller local business through construction while extending the life of social housing assets through an extended program of upgrades, repairs and maintenance and new builds for public housing in Darwin, Palmerston, Nhulunbuy, Katherine, Tennant Creek and Alice Springs.
During 2018-19:
• The Arnhem region committed $800 000 and spent $700 000 on 29 stimulus contracts awarded for works packages to 42 homes.
• The Arafura region committed $240 000 and spent $240 000 on 11 stimulus contracts awarded for works packages to 10 homes.
• Katherine committed $4.3 million and spent $4 million on 75 stimulus contracts awarded for works packages to 57 homes.
• Tennant Creek committed $1 million and spent $1 million on 37 stimulus contracts awarded for works packages to 52 homes.
• Alice Springs committed $470 000 and spent $420 000 on 35 stimulus contracts awarded for works packages to 36 homes.
Contract managementThere are a number of urban and remote contracts that exist across the regions providing tenancy and housing maintenance services to government employee and public housing properties. These services also include minor new works, repairs and maintenance.
In 2018-19:
• The Arafura region spent $10.4 million across 19 remote contracts - 12 panel contracts, four housing maintenance contracts and three tenancy contracts.
• The Arnhem region worked with 14 remote panel contractors, three community housing contracts and four housing maintenance contracts with a total expenditure of $12.6 million.
• The Big Rivers region had six urban panel contracts with a total expenditure of $15.3 million.
• Alice Springs had 30 contracts across 23 remote communities plus the Alice Springs urban space and town camps. These contracts included tenancy management, responsive repairs and maintenance, vacate and planned works and a comprehensive remote panel including Housing Maintenance Officer contractors.
• The Barkly region has 19 contracts servicing seven remote communities, plus the Tennant Creek urban stock and community living areas.

DEPARTMENT OF LOCAL GOVERNMENT, HOUSING AND COMMUNITY DEVELOPMENT ANNUAL REPORT 2018-19 21
Electrical auditProviding safe premises for our remote and government employees is critical to the safety and wellbeing of tenants and part of our duty of care and legislative requirements.
In 2018-19, Service Delivery conducted an electrical audit that included inspecting a number of items including smoke alarms, residual current device and light fittings. In total:
• The Big Rivers region inspected and approved 989 compliant dwellings at a cost of $830 000.
• The Arafura region submitted 1350 work orders to various electrical contractors enabling additional training and employment opportunities.
• The Arnhem region raised 1092 work orders to the value of $1.3 million.
• Central Australia and the Barkly region fitted, tested and made compliant devices at a cost of $2.3 million.
New public housing in Alice Springs and Tennant Creek Under the department’s Housing Strategy, Alice Springs and Tennant Creek took delivery of seven new three and four-bedroom houses - three in Alice Springs and four in Tennant Creek.
The houses in Alice Springs incorporate adaptable design features such as wide doorways and bathroom, ensuite to the main bedroom, undercover parking and concrete driveways, making them suitable for people with disabilities or other accessibility needs.
The selected location of the properties took into consideration the existing density of public housing in the area and the proximity to transport and other services.
The four new three-bedroom houses in Tennant Creek involved replacing old transportable type accommodation. The houses were constructed by local company GK Building Constructions.
Birritjimi Steering CommitteeBirritjimi is a small settlement 10 km west of Nhulunbuy. It is not a recognised community, homeland or town camp and falls outside all Northern Territory Government and Commonwealth funding sources and programmes for housing repairs and works.
To address the short and long term liveability and safety of Birritjimi residents, the Birritjimi Steering Committee was formed in 2017 to provide:
• interim housing and support for the relocation of residents to other premises in Nhulunbuy, Yirrkala, Gunyangara or East Arnhem homelands as appropriate
• upgrades and services to make existing houses safe and liveable where possible
• municipal and essential service works and maintenance and other related works which will improve the safety and living conditions of the residents.
The committee is comprised of representatives from the Commonwealth, Department of Local Government, Housing and Community Development, Department of the Chief Minister, Northern Land Councils and Rirratjingu Aboriginal Corporation.
Since 2017, five families have been relocated from Birritjimi to public housing.
As at April 2019, the invitation for tenders had closed for the demolition and asbestos removal of five vacant dwellings.
One of the new houses under the Housing Strategy using adaptable
design features in Alice Springs

OUR PEOPLE AND ACHIEVEMENTS 22
January 2019 Pride in Your Place Award winner Filomena Lemos
Pride in Your Place AwardsThe Pride in Your Place Awards are designed to acknowledge tenants who look after their garden and maintain their property and encourages a sense of ‘pride in your place’.
The annual awards are open to all public housing tenants in urban and remote areas of the Northern Territory.
Each winner receives a certificate signed by the Minister for Local Government, Housing and Community Development, and a $200 gift card to spend on their house or garden.
Since 1 July 2018, there have been 38 Pride in Your Place nominations and 11 awards won.
Breakdown of the awards per region are:
Maintenance call centreThe maintenance call centre is the primary point of contact for reporting maintenance issues relating to urban public housing properties, government employee housing, social housing head-leasing and industry housing properties.
The number of calls received and work orders raised for the call centres in Darwin and Alice Springs in 2018-19 were:
SERVICE DELIVERY NORTH SERVICE DELIVERY SOUTH
Arafura region
Arnhem region
Greater Darwin
Big Rivers region
Barkly region
Central region
1 2 5 0 2 1
SERVICE DELIVERY NORTH SERVICE DELIVERY SOUTH
Calls received 41 896 40 183
Work orders raised 19 743 16 632
DEPARTMENT OF LOCAL GOVERNMENT, HOUSING AND COMMUNITY DEVELOPMENT ANNUAL REPORT 2018-19 23
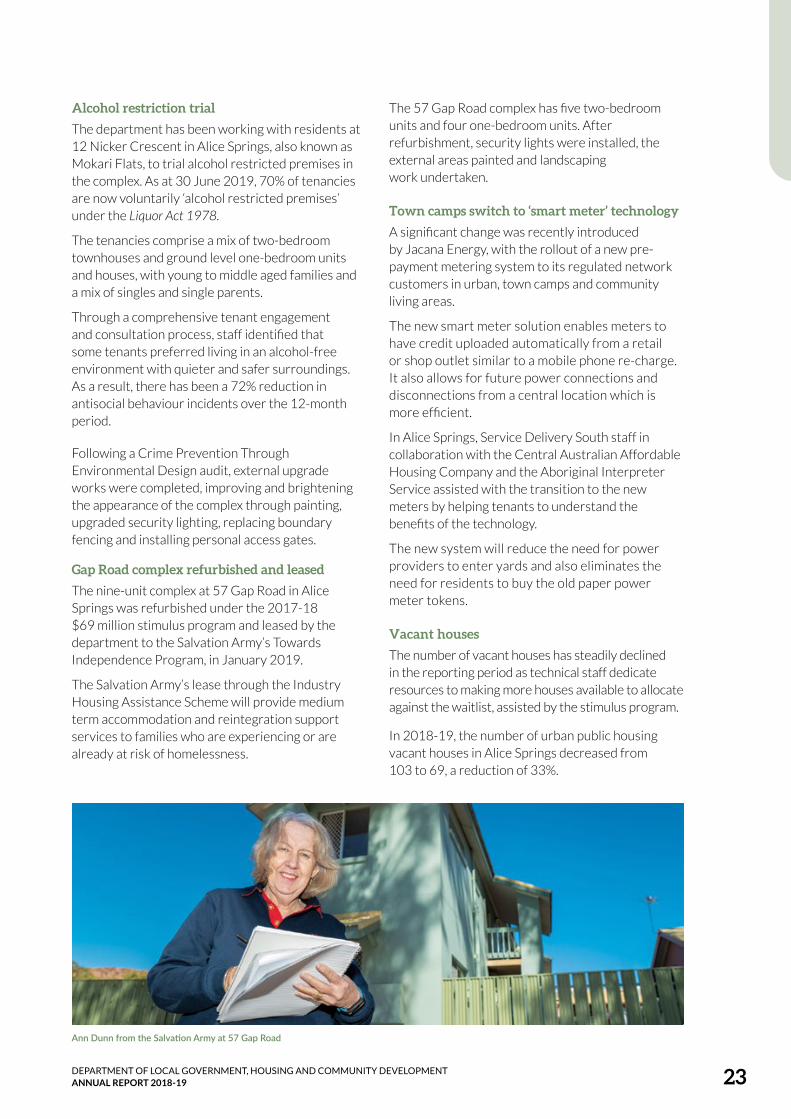
Ann Dunn from the Salvation Army at 57 Gap Road
Alcohol restriction trialThe department has been working with residents at 12 Nicker Crescent in Alice Springs, also known as Mokari Flats, to trial alcohol restricted premises in the complex. As at 30 June 2019, 70% of tenancies are now voluntarily ‘alcohol restricted premises’ under the Liquor Act 1978.
The tenancies comprise a mix of two-bedroom townhouses and ground level one-bedroom units and houses, with young to middle aged families and a mix of singles and single parents.
Through a comprehensive tenant engagement and consultation process, staff identified that some tenants preferred living in an alcohol-free environment with quieter and safer surroundings. As a result, there has been a 72% reduction in antisocial behaviour incidents over the 12-month period.
Following a Crime Prevention Through Environmental Design audit, external upgrade works were completed, improving and brightening the appearance of the complex through painting, upgraded security lighting, replacing boundary fencing and installing personal access gates.
Gap Road complex refurbished and leasedThe nine-unit complex at 57 Gap Road in Alice Springs was refurbished under the 2017-18 $69 million stimulus program and leased by the department to the Salvation Army’s Towards Independence Program, in January 2019.
The Salvation Army’s lease through the Industry Housing Assistance Scheme will provide medium term accommodation and reintegration support services to families who are experiencing or are already at risk of homelessness.
The 57 Gap Road complex has five two-bedroom units and four one-bedroom units. After refurbishment, security lights were installed, the external areas painted and landscaping work undertaken.
Town camps switch to ‘smart meter’ technologyA significant change was recently introduced by Jacana Energy, with the rollout of a new pre-payment metering system to its regulated network customers in urban, town camps and community living areas.
The new smart meter solution enables meters to have credit uploaded automatically from a retail or shop outlet similar to a mobile phone re-charge. It also allows for future power connections and disconnections from a central location which is more efficient.
In Alice Springs, Service Delivery South staff in collaboration with the Central Australian Affordable Housing Company and the Aboriginal Interpreter Service assisted with the transition to the new meters by helping tenants to understand the benefits of the technology.
The new system will reduce the need for power providers to enter yards and also eliminates the need for residents to buy the old paper power meter tokens.
Vacant housesThe number of vacant houses has steadily declined in the reporting period as technical staff dedicate resources to making more houses available to allocate against the waitlist, assisted by the stimulus program.
In 2018-19, the number of urban public housing vacant houses in Alice Springs decreased from 103 to 69, a reduction of 33%.

OUR PEOPLE AND ACHIEVEMENTS 24
Improving security for seniorsThe seniors complex at 40 Albrecht Drive in Alice Springs received a facelift under the $100 million public housing stimulus program.
The upgrade work was completed following a Crime Prevention Through Environmental Design audit that was developed jointly by the department and the Northern Territory Police.
Works included installation of a new two-metre-high tubular fence that incorporates lockable letter boxes, trimming of bushes and trees and repair and improvement of the adjoining boundary fencing.
Work being carried out under the $100 million public housing stimulus program to improve security at 40 Albrecht Drive, Alice Springs
In Tennant Creek, work under the $100 million public housing stimulus program to refurbish the house at 9 Ford Crescent in Tennant Creek was awarded to local business GK Painting Contractors. Works included a new bathroom with a disability access and a new kitchen and plumbing system.
Wooden shelves were replaced with stainless steel, new ceramic waterproof tiles replaced the old floor tiles and new ceilings were also installed.
New windows were fitted, as well as split air-conditioners throughout the house. The property received a full re-wire and full internal repaint.
Tennant Creek stimulus works

DEPARTMENT OF LOCAL GOVERNMENT, HOUSING AND COMMUNITY DEVELOPMENT ANNUAL REPORT 2018-19 25
Cheryl Wall receiving the Telstra Business Women’s Awards in Darwin.
For the past two years, Cheryl Wall has worked as the Executive Director of Service Delivery North. Starting her career in Katherine 25 years ago as an AO2 Administration Officer, Cheryl now holds the privilege of leading Arnhem, Arafura, Greater Darwin and Big Rivers regions comprising more than 9000 assets and 178 staff to deliver improved and better outcomes for Territorians.
‘I provide leadership, strategic direction and overall management of Service Delivery North in line with the Department of Local Government, Housing and Community Development’s strategic direction’, Cheryl said.
Cheryl was recently recognised for her hard work, support and commitment when she was awarded the Northern Territory 2019 Telstra Business Woman of the Year for the category of Public Sector and Academia Award and was an Australian finalist.
Cheryl says she enjoys spending time on the water fishing, reading and despite what her friends say is a great karaoke singer.
Originally born in Perth, Cheryl relocated to Katherine from the small town of Pinjarra, Western Australia more than 30 years ago. In 2001 she moved to Palmerston where Cheryl and her husband built their family home.
Cheryl noted that ‘there is no better feeling than knowing you have made a difference, either small or big to improve someone’s life and that is what our front-line staff do each day’.
Staff Profile – Cheryl Wall
“there is no better feeling than knowing
you have made a difference”

OUR PEOPLE AND ACHIEVEMENTS 26
Adriana Schembri and her horse Ace
Adriana Schembri is one of our Alice Springs-based housing officers by day, and a champion show jumper by night.
It’s a passion she has had since a child, after learning to ride when she got her first horse at four years old.
‘I love show jumping because it’s about team work. We put in all the hard work training and jumping, and it feels great to have that work recognised. Ace trusts me, I trust Ace - we are in it together’, Adriana said.
‘It’s the same in Housing. Our team in Service Delivery South relies on each other to get the job done. Each of us couldn’t achieve good outcomes for our housing tenants on our own’, she said.
Adriana said she would love to travel around Australia and compete in show jumping championships. She dreams of representing Australia at the Olympics.
‘That would be the ultimate’, she said.
Adriana wins at Alice Springs Show
“Each of us couldn’t achieve
good outcomes for our housing tenants on our
own”

DEPARTMENT OF LOCAL GOVERNMENT, HOUSING AND COMMUNITY DEVELOPMENT ANNUAL REPORT 2018-19 27
The arrival of Category 4 Tropical Cyclone Trevor saw the largest evacuation before a cyclone in the Northern Territory’s history, and the largest since Cyclone Tracy when it hit the Territory coast on 23 March 2019.
The event required significant support from the department, as staff rallied to help evacuate residents from remote communities and islands in the Gulf of Carpentaria.
Throughout the emergency and recovery phases, more than 70 volunteers came from almost every unit in the department to ensure the needs of fellow Territorians were met.
Department staff were among those who immediately responded when the Katherine evacuation centre was overcome with more than four-times the number of anticipated evacuees on the first night.
The Aboriginal Interpreter Service interpreted key emergency and health messaging into language and accompanied emergency personnel during media conferences and announcements in evacuation centres.
Public Housing Safety Officers also provided key support in Darwin and Katherine.
When it was safe to return, the Homelands team led the recovery work in 23 homelands. The clean up included clearing access roads, removing trees and demolishing and clearing destroyed buildings and debris at outstations.
The homelands included:
• 20 Mile
• Babungi
• Bauhinia Downs
• Black Rock Landing
• Cow Lagoon
• Garrinjinny
• Kangaroo Island
• Milibunthurra
• Mooloowa
• South West Island
• Wada Wadala
• Wada Warra
• West Island
• Budjanga
• Bujana
• Crabhole
• Manangoora
• Mimina
• Snake Lagoon
• Wallace Lagoon
• Wonmurri
• Wundigalla
• Yangulinyina
Work was completed on 28 June 2019.
Department stands up in response to Tropical Cyclone Trevor

OUR PEOPLE AND ACHIEVEMENTS 28
Local Government and Community Development
Com
munity
Development Offi cers worked with Approximately 550 Aboriginal
jobs were supported throughout the reporting period under the
$8.5 million Local Government Indigenous Jobs Development Program.
79
The Northern Territory Government supports
local authority projects with grant funding of
$5.4 million per annum.
communities
across the Northern Territory to support capacity building and undertake community
development projects.
or1503 12%
During 2018-19, users of the BushTel site increased by

DEPARTMENT OF LOCAL GOVERNMENT, HOUSING AND COMMUNITY DEVELOPMENT ANNUAL REPORT 2018-19 29
The Local Government and Community Development division promotes strong, resilient communities through robust local government and active partnerships centred on local decision making.
Teams across the Northern Territory support community driven projects and help build a confident and well-governed local government sector through legislation reform and assistance in areas such as governance and community engagement.
BUSHTELThe BushTel website (bushtel.nt.gov.au) is a publicly accessible central point for information about remote communities in the Northern Territory.
It provides vital social, cultural and statistical information that helps to make informed decisions when engaging with Aboriginal communities.
During 2018-19, users of the BushTel site increased by 1503, or 12%.
Recent additions to BushTel this year include:
• a Community Directory tab with information on businesses with a shopfront in a community
• Community Development Officer contact details
• information on scheduled medical service visits
• any alcohol restrictions in force in a community
• volatile substance plans for a community.
REMOTE ENGAGEMENT ESSENTIALS WORKSHOPIn 2018-19, a total of 96 participants attended six Remote Engagement Essentials workshops delivered throughout the Northern Territory.
The workshop is a two day course for public sector employees to help participants achieve outcomes from the Remote Engagement and Coordination Strategy.
The strategy establishes a platform for engaging with Aboriginal community members, improves Northern Territory Government agency coordination and service delivery outcomes, and supports greater local decision making.
COMMUNITY DEVELOPMENTCommunity Development Officers worked with 79 communities across the Northern Territory to support capacity building and undertake community development projects.
The team also supports services and agencies in their engagement with communities and works with councils and local authorities to build leadership, strengthen governance and facilitate local decision making.
Key community-led projects include:
• supporting the establishment of an artists’ enterprise in Mount Liebig
• creating a recycling project in Umbakumba
• providing governance training and support for local authorities and Housing Reference Groups
• working with the communities of Milikapiti, Pirlangimpi and Wurrumiyanga to establish a youth leadership council.
Local Decision Making The Northern Territory Government has committed through Local Decision Making to provide a pathway for communities to have more control over their own affairs including service delivery based on a community’s aspirations and needs.
The department’s focus on changes to the draft local government and burial and cremation legislation are both examples that will contribute towards local decision making in communities across the Northern Territory.
The department’s commitment to local decision making is supported by the combined focus of the Remote Engagement and Coordination Strategy, BushTel, local government legislation reform and the Community Development team’s work in communities.
OUR PEOPLE AND ACHIEVEMENTS 30
Local authorities
Local authorities work with their community as the key voice for informing councils, to find solutions to local issues and have been established in 67 remote communities across the nine regional councils of the Northern Territory.
The Northern Territory Government supports local authority projects with grant funding of $5.4 million per annum. These local projects are selected by the local authorities to reflect the needs and priorities of their communities.
An electronic presentation was developed to help local authorities understand their roles and responsibilities under the Local Government Act 2008 and delivered on request.
Your Voice Your Community
The ‘Your Voice Your Community’ campaign ran for six weeks and aimed to help people update their electoral enrolment information and Medicare details.
Working with the Department of the Chief Minister, Department of Education, Northern Territory Electoral Commission and regional councils, the Community Development team visited 79 remote communities and 16 town camps.
The Aboriginal Interpreter Service translated campaign messaging into nine common Aboriginal languages, the team engaged with more than 3600 people and helped 759 people complete electoral enrolment forms.
The success of the campaign was due to the existing trusted relationships Community Development Officers have with remote communities, as well as outstanding collaboration and support from
regional councils and government agencies.

DEPARTMENT OF LOCAL GOVERNMENT, HOUSING AND COMMUNITY DEVELOPMENT ANNUAL REPORT 2018-19 31
Antonia Wilson, Ursula Butcher and Dasphina Brown with their canvas painting depicting Nyirripi Community that can now include street names and numbers
Community Development Officers are often the first point of contact with the department for community residents and attend Local Authority meetings throughout the Northern Territory.
While visiting Nyirripi, 440 km north-west of Alice Springs, Community Development Officer Enock Menge was made aware that eligible residents received correspondence from the Australian Electoral Commission (AEC) through a single address in the community.
The local authority members requested help to update residents’ street addresses on the electoral roll, Enock contacted the AEC and the Northern Territory Electoral Commission (NTEC) on behalf of the community.
After several discussions with both the AEC and NTEC, it was acknowledged that the community required an accurate plan of street names and lot numbers for residents to be enrolled at their actual address.
Through the department’s Land Tenure Unit, a Community Land Use Plan was developed with updated information which has enabled the accurate enrolment of 155 eligible voters.
Local Authority Project – Nyirripi electoral enrolment

OUR PEOPLE AND ACHIEVEMENTS 32
REGIONAL ROADS COMMITTEES The Regional Roads Committees (RRCs) work at a regional level to help local and Northern Territory governments better meet local road and access needs by coordinating information and resources.
These committees are facilitated by the department, and include the Department of Infrastructure, Planning and Logistics, regional councils, town councils and the Local Government Association of the Northern Territory.
To date, four established RRCs have shared technical expertise and started joint planning of road network repairs and road safety initiatives. A priority for all committees is the spatial mapping of roads and improving road planning and management between the Northern Territory Government and local governments, which enhances collaboration and sharing of resources.
WASTE MANAGEMENT COMMITTEESThe department has an advisory role with two Regional Waste Management Committees.
Projects that have been funded throughout the year include:
• $1 million provided to West Daly Regional Council from the Strategic Infrastructure Fund for new waste management facilities in Wadeye and Peppimenarti
• $300 000 provided to Coomalie Community Government Council from the Special Purposes Grants funding for two transportable buildings for the Batchelor and Adelaide River Waste Transfer Stations.
The Central Australian Waste Management Committee includes Central Desert, Barkly, MacDonnell, and the Alice Springs Town councils. It has established standardised landfill designs which many communities have either commenced or completed.
The Big Rivers Waste Management Group includes West Daly, Katherine, Victoria Daly, Roper Gulf and Coomalie councils. It has focused on waste reduction education projects and removing scrap metal and car bodies from communities in its region.
LEGISLATION AND POLICY
Draft Burial and Cremation Bill A major focus of the department this financial year has been the development of and consultation on the draft Burial and Cremation Bill to replace the Cemeteries Act 1952.
The draft legislation was developed based on feedback from more than 130 stakeholders including industry groups, government agencies and land councils. Audio information on the draft Bill was also available through the department’s website in 18 Aboriginal languages.
Key points of the Bill include the recognition of cemeteries on Aboriginal land, as well as the requirement for those responsible for cemetery management to keep burial records.
The consultation period closed on 31 March 2019 and submissions are being reviewed.
Draft Local Government BillThe draft Local Government Bill aims to strengthen the Local Government Act 2008 to provide clarity on local government processes and to help councils and local authorities with their work.
The proposed legislation aims to streamline local government rules and processes such as members’ allowances, code of conduct, eligibility for office and meeting procedures. The Bill will enhance members’ understanding of the local government system, as well as financial transparency.
As part of stakeholder engagement, audio information on the Bill has been provided in Aboriginal languages on the department’s website.

DEPARTMENT OF LOCAL GOVERNMENT, HOUSING AND COMMUNITY DEVELOPMENT ANNUAL REPORT 2018-19 33
COMPLIANCE
ICAC training partnershipThe office of the Independent Commissioner Against Corruption (ICAC) is an independent body able to investigate a wide range of improper conduct of individuals or bodies.
The department takes a serious approach to its responsibilities under the ICAC legislation and a Local Government Anti-Corruption and Anti-Fraud framework is planned as a collaborative project between the two offices in 2019.
Officers from the division have started discussions on working together to provide training and information to councils on corruption prevention and good governance practice.
Australian Institute of Company Directors training for local government sector The department provided $100 000 to the Local Government Association of the Northern Territory to host two Australian Institute of Company Directors two-day courses tailored for the local government sector.
In 2018-19, 34 people attended the two day training sessions which focused on finance and good governance. The majority of attendees were elected members from regional councils across the Northern Territory.
Local Government newsletter
A new quarterly Local Government newsletter began circulation in 2018-19. The newsletter provides timely and regularly updated information, informs councils of relevant government initiatives and provides guidance on how to comply with legislation.
Energy Efficiency and Sustainability Grants programIn 2018-19, a one-off $2 million Energy Efficiency and Sustainability Grant program was established. This program offered councils the opportunity to apply for funding to help reduce energy use, greenhouse gas emissions and related costs and improve energy productivity.
Across the Northern Territory, 17 local government councils were successful in securing funding for energy efficient initiatives including 547 LED street lights throughout Tennant Creek, and the purchase
and installation of solar panels at Jabiru and Maningrida pools.
Disaster Recovery Funding During the reporting period, new Disaster Recovery Funding Guidelines for local governments in the Northern Territory were established. The guidelines align with the new Commonwealth Disaster Recovery Funding Arrangements that came into effect on 1 November 2018.
Along with the guidelines, online templates were developed to help councils with claims after a disaster event has occurred.
Revised requirements for local governments under the Disaster Recovery Funding Arrangement Guidelines for the local government sector was issued by the division and published on the department’s webpage.
Local Government Special Purpose GrantsLocal Government Special Purpose Grants allow organisations providing local government services to apply for funding to improve infrastructure and local government service delivery outcomes.
In 2018-19, grants totalling $4.2 million were awarded to councils for various projects including the purchase of a new tipper truck for the Alpurrurulam community, upgrade to irrigation throughout Blatherskite Park in Alice Springs, and the promotion of walk, cycle or scoot to school to the City of Palmerston.
Local Government Strategic Infrastructure FundIn 2018-19, $5.1 million from the Local Government Strategic Infrastructure Fund was awarded to councils for a range of projects including the upgrading of council office buildings, staff houses, roads, footpaths, aged care facilities and waste management facilities.
The fund enables regional and shire councils to apply for funding for local government infrastructure-related projects designed to boost the amenity and community development in regional and remote communities.
OUR PEOPLE AND ACHIEVEMENTS 34
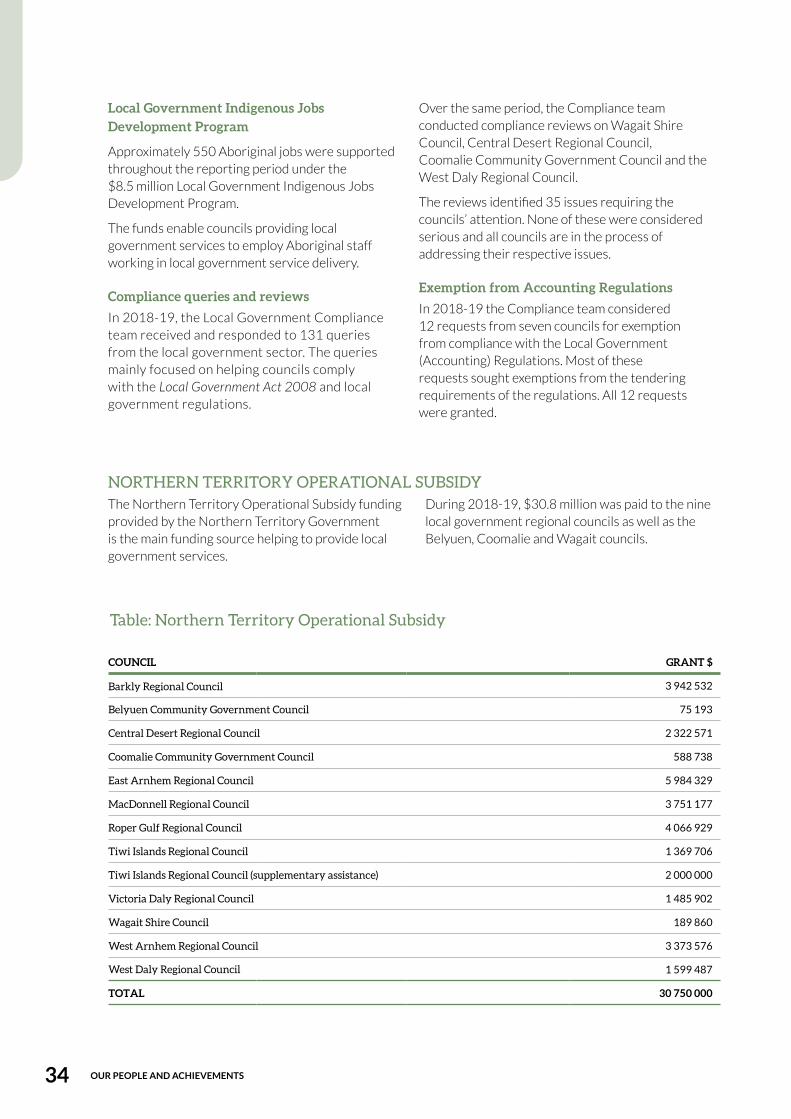
COUNCIL GRANT $
Barkly Regional Council 3 942 532
Belyuen Community Government Council 75 193
Central Desert Regional Council 2 322 571
Coomalie Community Government Council 588 738
East Arnhem Regional Council 5 984 329
MacDonnell Regional Council 3 751 177
Roper Gulf Regional Council 4 066 929
Tiwi Islands Regional Council 1 369 706
Tiwi Islands Regional Council (supplementary assistance) 2 000 000
Victoria Daly Regional Council 1 485 902
Wagait Shire Council 189 860
West Arnhem Regional Council 3 373 576
West Daly Regional Council 1 599 487
TOTAL 30 750 000
Table: Northern Territory Operational Subsidy
Local Government Indigenous Jobs Development Program
Approximately 550 Aboriginal jobs were supported throughout the reporting period under the $8.5 million Local Government Indigenous Jobs Development Program.
The funds enable councils providing local government services to employ Aboriginal staff working in local government service delivery.
Compliance queries and reviewsIn 2018-19, the Local Government Compliance team received and responded to 131 queries from the local government sector. The queries mainly focused on helping councils comply with the Local Government Act 2008 and local government regulations.
Over the same period, the Compliance team conducted compliance reviews on Wagait Shire Council, Central Desert Regional Council, Coomalie Community Government Council and the West Daly Regional Council.
The reviews identified 35 issues requiring the councils’ attention. None of these were considered serious and all councils are in the process of addressing their respective issues.
Exemption from Accounting Regulations In 2018-19 the Compliance team considered 12 requests from seven councils for exemption from compliance with the Local Government (Accounting) Regulations. Most of these requests sought exemptions from the tendering requirements of the regulations. All 12 requests were granted.
NORTHERN TERRITORY OPERATIONAL SUBSIDYThe Northern Territory Operational Subsidy funding provided by the Northern Territory Government is the main funding source helping to provide local government services.
During 2018-19, $30.8 million was paid to the nine local government regional councils as well as the Belyuen, Coomalie and Wagait councils.

DEPARTMENT OF LOCAL GOVERNMENT, HOUSING AND COMMUNITY DEVELOPMENT ANNUAL REPORT 2018-19 35
RESERVES AND OTHER ORGANISATIONSIn 2018-19, the department provided $440 000 of funding to seven organisations that, while not local
governing bodies, provide local government services around the Northern Territory through necessity.
LOCAL AUTHORITY PROJECT FUNDINGLocal authority project funding supports projects that encourage the continued development of local authorities and their communities.
The funding aims to:
• build stronger communities
• help local governing bodies and their communities become stronger and self-sustaining
• provide quality community infrastructure that facilitates community activity and integration
• develop local government capacity to provide legitimate representation, effective governance, improved service delivery and sustainable development.
The funding pool is distributed to local authorities through a methodology developed by the Northern Territory Grants Commission.
In 2018-19, the department provided $5.5 million in funding to nine councils.
ORGANISATION PURPOSE GRANT $
Australia Day Council Incorporated of the (NT) Towards the sponsorship of the 2019 Australia Day awards
10 000
Blatherskite Park Trustees Inc Operational funding 145 000
Katherine Town Council Operational funding for the community of Binjari
189 000
Nhulunbuy Public Cemetery Trust Operational funding 10 000
Robbie Robins Reserve Operational funding 75 000
Roper Gulf Regional Council Operational funding for the communityof Larrimah
9 000
Roper Gulf Regional Council Operational funding for the Mataranka (Elsey) Cemetery
2 000
TOTAL 440 000
Table: Reserves and other organisations
Table: Local authority project funding
COUNCIL GRANT $
Barkly Regional Council 460 880
Central Desert Regional Council 545 920
East Arnhem Regional Council 1 249 260
MacDonnell Regional Council 571 710
Roper Gulf Regional Council 849 620
Tiwi Islands Regional Council 359 880
Victoria Daly Regional Council 336 220
West Arnhem Regional Council 630 170
West Daly Regional Council 468 340
TOTAL 5 472 000

OUR PEOPLE AND ACHIEVEMENTS 36
INDIGENOUS JOBS DEVELOPMENT FUNDING The department funds councils that provide local government services to subsidise the employment of Aboriginal people working in local government service delivery.
The funding aims to subsidise the cost of employing Aboriginal people across regional councils and the Belyuen Community Government Council, support
the delivery of local government outcomes in the council’s strategic and operational plans and support Aboriginal employment.
In 2018-19, the department provided $8.5 million in funding to 10 councils to support 551 jobs.
Table: Indigenous Jobs Development Funding
COUNCIL GRANT $
Barkly Regional Council 968 000
Belyuen Community Government Council 39 000
Central Desert Regional Council 679 000
East Arnhem Regional Council 1 228 000
MacDonnell Regional Council 1 335 000
Roper Gulf Regional Council 1 601 000
Tiwi Islands Regional Council 571 000
Victoria Daly Regional Council 727 000
West Arnhem Regional Council 760 000
West Daly Regional Council 592 000
TOTAL 8 500 000
ONE-OFF GRANTSThree one-off grants were approved outside the special-purpose grants funding rounds timeframes.
In 2018-19, the department provided grants totalling $261 000 to three organisations.
ORGANISATION PURPOSE GRANT $
Coomalie Community Government CouncilFinalise the merger proposal and help with preparations to join with the Belyuen Community Government Council and Litchfield National Park
60 891
Katherine Town Council Assist with upgrading McKeddie Road, Katherine 100 000
Local Government Association of the Northern Territory
Facilitate and host two Australian Institute of Company Directors courses.
100 000
TOTAL 260 891
Table: One-off grants

DEPARTMENT OF LOCAL GOVERNMENT, HOUSING AND COMMUNITY DEVELOPMENT ANNUAL REPORT 2018-19 37
SPECIAL PURPOSE GRANT FUNDINGThe Local Government Special Purpose Grants are open to local councils to improve community infrastructure and service delivery.
Funding is available to purchase capital items such as road plant and equipment and to deliver recreation facilities, training programs and social infrastructure.
The grants aim to help local government bodies and communities become stronger and self-sustaining, with submissions required to show how the initiative will benefit the community.
In 2018-19, the department provided grants totalling $4.2 million to 18 organisations.
ORGANISATION PURPOSE GRANT $
Coomalie Community Government Council Construct a new powder coated panel fence at the Alice Springs Aquatic and Leisure Centre
93 278
Barkly Regional Council Construct a chainmesh fence around the oval at Staunton Street in Tennant Creek
35 422
Barkly Regional Council Purchase a new tipper truck for theAlpurrurulam community
89 442
Belyuen Community Government Council Purchase and install an outdoor payment terminal for the sale of fuel in the community
33 571
Belyuen Community Government Council Purchase mower equipment for the council's civil works program
49 909
Blatherskite Park Trustees Inc. Upgrade existing irrigation services throughout Blatherskite Park
13 244
Table: Special Purpose Grant Funding – applications based grants rounds 1 and 2
NATURAL DISASTER RELIEF AND RECOVERY ARRANGEMENTThe department administers grants to local government bodies to recover local government assets and services after a natural disaster or emergency. This financial assistance is subject to funding availability.
In 2018-19, the department provided grants totalling $13 million to five councils.
ORGANISATION PURPOSE GRANT $
Central Desert Regional Council Central Australia flash flooding December 2016 – January 2017
5 270 500
City of Darwin Cyclone Marcus March 2018 4 070 053
City of Palmerston Cyclone Marcus March 2018 865 949
Coomalie Community Government Council Monsoonal trough in January 2018 228 000
Litchfield Council Monsoonal trough in January 2018 1 848 975
Litchfield Council Cyclone Marcus March 2018 698 224
TOTAL 12 981 701
Table: Natural Disaster Relief and Recovery Arrangement

OUR PEOPLE AND ACHIEVEMENTS 38
ORGANISATION PURPOSE GRANT $
Central Desert Regional Council Refurbish the sewer pipe system and drainage at five residential units on Lot 250 Lajamanu
127 968
Central Desert Regional council Relocate six air-conditioning condenser units from the council services courtyard at Nyirripi
11 965
City of Palmerston Promote walk, cycle or scoot to school 25 000
City of Palmerston Support server room and power upgrades to the City of Palmerston's building
150 469
Coomalie Community Government Council Upgrade toilets to a flush system with septic tanks at the Adelaide River War Cemetery
40 000
Coomalie Community Government Council Purchase two transportable buildings with power supply for the Batchelor and Adelaide River transfer stations
300 000
East Arnhem Regional Council Replace security fencing at Lot 306 Angurugu mechanical garage
105 000
East Arnhem Regional Council Upgrade the mechanical workshop high boundary security fence at Lot 130 Gapuwiyak
57 897
Katherine Town Council Funding to support the construction of a themed playground as part of the Katherine Hot Springs revitalisation project
150 000
Katherine Town Council Funding to support the Big Rivers Region Waste Management Coordinator project for three years at $120 000 per year
120 000
Litchfield CouncilFunding to support reconditioning of the playground and establishment of a shade structure at Howard Park Reserve
69 970
Litchfield CouncilSupport a six-month project to plan and design shared library services across the Litchfield and City of Palmerston councils
25 000
MacDonnell Regional Council Purchase an 8 m3 side loading compactor truck 144 084
MacDonnell Regional Council Funding to support the purchase of a prime mover and side tipping trailer
232 275
Robbie Robbins Reserve Demolish and construct a new replacement office/store room
35 409
Roper Gulf Regional Council Funding to support the vitalisation of Rittarangu Town
228 382
Roper Gulf Regional Council Funding to support the upgrade of public toilet works in Mataranka, Borroloola and Bulman
200 000
Tiwi Islands Regional Council Purchase equipment to increase council's workshop capacity
180 246
Tiwi Islands Regional Council Funding to support building capacity to deliver animal management program across communities
89 445
Tiwi Islands Regional Council Enclose and secure the Jirnani crèche in Wurrumiyanga
86 886

DEPARTMENT OF LOCAL GOVERNMENT, HOUSING AND COMMUNITY DEVELOPMENT ANNUAL REPORT 2018-19 39
ORGANISATION PURPOSE GRANT $
Victoria Daly Regional CouncilPurchase a modular two-bedroom duplex unit for staff
520 750
Victoria Daly Regional Council Purchase a new tractor with a front end loader and slasher for Yarralin
126 750
Wagait Shire Council Construction of a dog pound and associated septic pit
30 537
Wagait Shire Council
Funding to support commissioning and installation of an electronic records management system and migration and renewal of council’s IT infrastructure
34 889
Wagait Shire CouncilFunding to support the purchase of a skid mounted 5000 L water tank, pump, hose reel, discharge pipe and spray bar system
7 607
West Arnhem Regional Council Funding to support the purchase of a second hand grader
180 000
West Arnhem Regional Council Purchase a replacement 12 m3 side load rubbish compactor for Gunbalanya
150 000
West Daly Regional Council Purchase a second hand grader 245 000
West Daly Regional Council Purchase a new loader 253 565
TOTAL 4 243 960

OUR PEOPLE AND ACHIEVEMENTS 40
LOCAL GOVERNMENT STRATEGIC INFRASTRUCTURE FUND The Local Government Strategic Infrastructure Fund enables regional and shire councils to apply for funding for local government infrastructure related projects that are designed to boost the
amenity and community development in regional and remote communities.In 2018-19, the department provided grants totalling $5.1 million to eight councils.
ORGANISATION PURPOSE GRANT $
Barkly Regional CouncilFunding to support the refurbishment of a staff house at Lot 126 Buchanan Street, Elliott
171 574
Barkly Regional CouncilInstall a shade cover over the basketball court in Wutunugurra at the Sport and Recreation Centre
216 700
Belyuen Community Government Council Upgrade facilities at the Imabulk Aged Care Centre
99 726
Coomalie Community Government Council Funding to support the final stage of sealing Coach Road
480 000
East Arnhem Regional Council Funding to support construction of footpaths to key facilities in Angurugu
418 775
MacDonnell Regional Council and Central Desert Regional Council
Funding to support the construction of an upper floor addition to the Gap Road/Bagot Street council office
1 500 000
Roper Gulf Regional Council Funding to support the upgrade of the Roper Gulf Regional Council office building at Lot 120 Roper Terrace, Mataranka
500 000
Victoria Daly Regional Council
Rehabilitate and construct a transfer station and recycling bays at the existing Timber Creek waste transfer station and construct the new waste transfer site 16 km east
663 225
West Daly Regional Council Upgrade waste management facilities in Wadeye and Peppimenarti
1 050 000
TOTAL 5 100 000
Table: Local Government Strategic Infrastructure Fund – application based grant
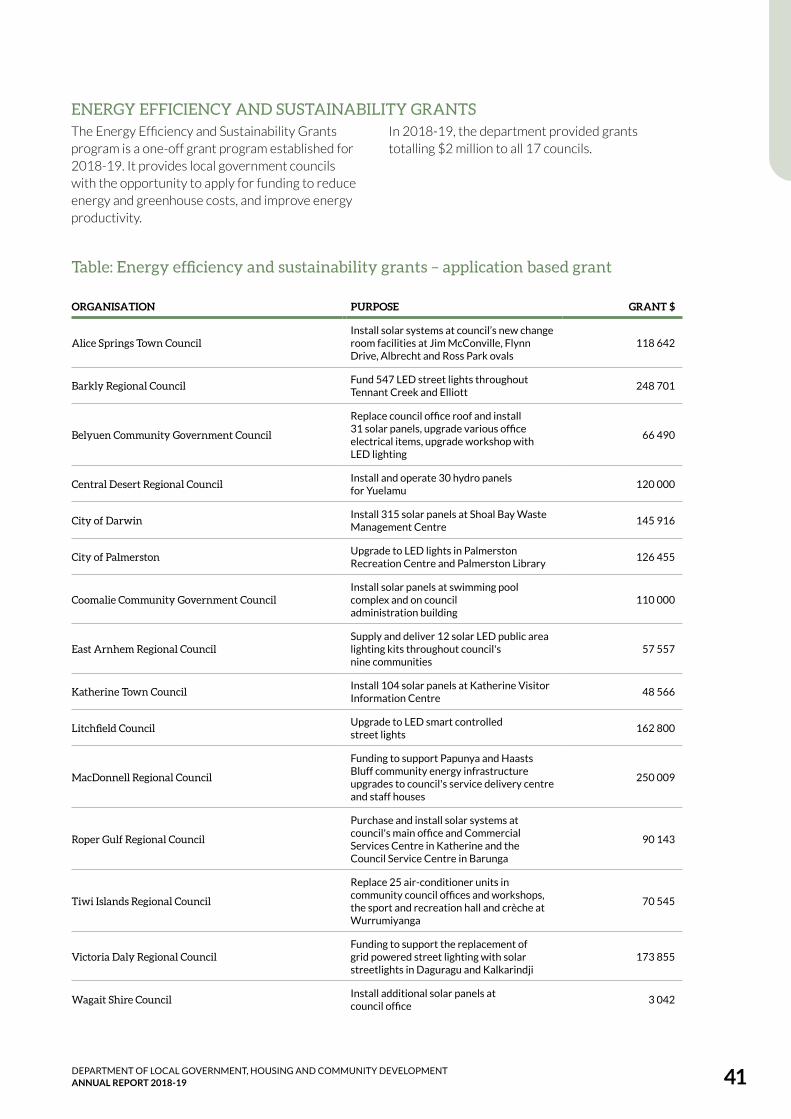
DEPARTMENT OF LOCAL GOVERNMENT, HOUSING AND COMMUNITY DEVELOPMENT ANNUAL REPORT 2018-19 41
ENERGY EFFICIENCY AND SUSTAINABILITY GRANTS The Energy Efficiency and Sustainability Grants program is a one-off grant program established for 2018-19. It provides local government councils with the opportunity to apply for funding to reduce energy and greenhouse costs, and improve energy productivity.
In 2018-19, the department provided grants totalling $2 million to all 17 councils.
ORGANISATION PURPOSE GRANT $
Alice Springs Town CouncilInstall solar systems at council’s new change room facilities at Jim McConville, Flynn Drive, Albrecht and Ross Park ovals
118 642
Barkly Regional Council Fund 547 LED street lights throughout Tennant Creek and Elliott
248 701
Belyuen Community Government Council
Replace council office roof and install 31 solar panels, upgrade various office electrical items, upgrade workshop with LED lighting
66 490
Central Desert Regional Council Install and operate 30 hydro panels for Yuelamu
120 000
City of Darwin Install 315 solar panels at Shoal Bay Waste Management Centre
145 916
City of Palmerston Upgrade to LED lights in Palmerston Recreation Centre and Palmerston Library
126 455
Coomalie Community Government Council Install solar panels at swimming pool complex and on council administration building
110 000
East Arnhem Regional Council Supply and deliver 12 solar LED public area lighting kits throughout council's nine communities
57 557
Katherine Town Council Install 104 solar panels at Katherine Visitor Information Centre
48 566
Litchfield Council Upgrade to LED smart controlled street lights
162 800
MacDonnell Regional Council
Funding to support Papunya and Haasts Bluff community energy infrastructure upgrades to council's service delivery centre and staff houses
250 009
Roper Gulf Regional Council
Purchase and install solar systems at council's main office and Commercial Services Centre in Katherine and the Council Service Centre in Barunga
90 143
Tiwi Islands Regional Council
Replace 25 air-conditioner units in community council offices and workshops, the sport and recreation hall and crèche at Wurrumiyanga
70 545
Victoria Daly Regional CouncilFunding to support the replacement of grid powered street lighting with solar streetlights in Daguragu and Kalkarindji
173 855
Wagait Shire Council Install additional solar panels at council office
3 042
Table: Energy efficiency and sustainability grants – application based grant
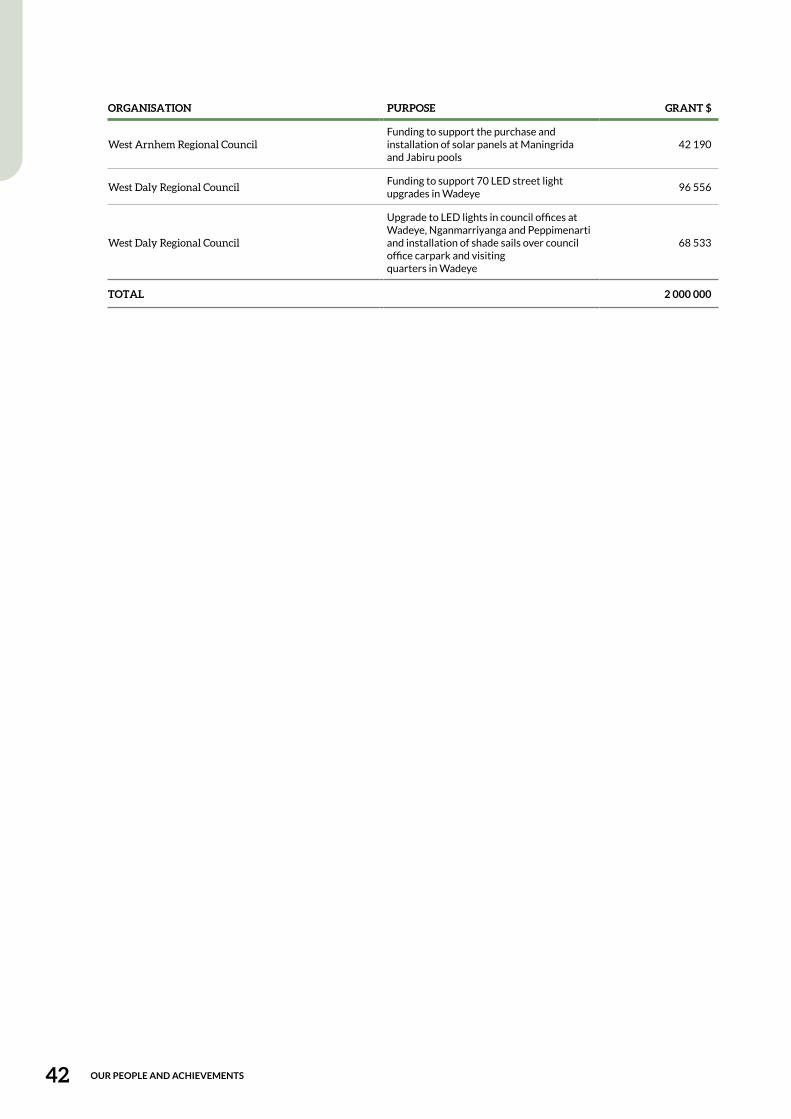
OUR PEOPLE AND ACHIEVEMENTS 42
ORGANISATION PURPOSE GRANT $
West Arnhem Regional CouncilFunding to support the purchase and installation of solar panels at Maningrida and Jabiru pools
42 190
West Daly Regional Council Funding to support 70 LED street light upgrades in Wadeye
96 556
West Daly Regional Council
Upgrade to LED lights in council offices at Wadeye, Nganmarriyanga and Peppimenarti and installation of shade sails over council office carpark and visiting quarters in Wadeye
68 533
TOTAL 2 000 000

DEPARTMENT OF LOCAL GOVERNMENT, HOUSING AND COMMUNITY DEVELOPMENT ANNUAL REPORT 2018-19 43
COMMONWEALTH FINANCIAL ASSISTANCE
General purpose and local roads fundingThe Northern Territory Grants Commission is an independent body established under the Local Government Grants Commission Act 1986 with the primary role to provide annual funding recommendations regarding the Commonwealth financial assistance general purpose and local road grants.
These grants are distributed on a needs-basis formula developed by the commission. This takes into account a number of factors such as revenue-raising capacity, expenditure requirements, the size of a council’s footprint and how difficult it is to access communities in the council area.
In 2018-19, Commonwealth Financial Assistance for general purpose funding of $8.7 million was provided to 17 councils, and $8.8 million of local roads funding provided to 18 organisations.
Table: Commonwealth Financial Assistance - general purpose and local roads funding
ORGANISATIONGENERAL PURPOSE
2018-19 $LOCAL ROADS
2018-19$
Alice Springs Town Council 325 377 477 679
Barkly Regional Council 820 406 228 970
Belyuen Community Government Council 12 409 16 494
Central Desert Regional Council 602 625 452 319
City of Darwin 930 300 965 796
City of Palmerston 411 988 456 831
Coomalie Community Government Council 16 935 249 323
East Arnhem Regional Council 1 666 357 625 572
Katherine Town Council 278 970 318 997
Litchfield Council 292 208 1 315 119
Local Government Association of the Northern Territory n/a 792 070
MacDonnell Regional Council 930 024 502 858
Roper Gulf Regional Council 1 071 060 542 529
Tiwi Islands Regional Council 201 314 487 267
Victoria Daly Regional Council 233 772 347 032
Wagait Shire Council 7 442 27 628
West Arnhem Regional Council 621 917 593 575
West Daly Regional Council 264 585 446 548
TOTAL 8 687 689 8 846 607

OUR PEOPLE AND ACHIEVEMENTS 44
Procurement and Grants Management
$77.1million
or above procurements
valued at
Dur
ing 2
018-19, the department awarded 194
TIER 2
685
60to
During 2018-19, the Centralised
Grants Management unit helped with
payment transactions
grant recipients

DEPARTMENT OF LOCAL GOVERNMENT, HOUSING AND COMMUNITY DEVELOPMENT ANNUAL REPORT 2018-19 45
CENTRALISED PROCUREMENT MANAGEMENT UNITThe Centralised Procurement Management unit is responsible for coordinating all procurements Tier 2 ($15 000 but less than $100 000) or above.
During 2018-19, the department awarded 194 Tier 2 or above procurements valued at $77.1 million.
This is a 53% increase in procurement activity, up from 127 procurements (valued at $16.5 million) in the previous financial year.
Of the 194 Tier 2 or above procurements awarded, 155 were in Darwin, 18 in Alice Springs, 17 in the Katherine region and four in Nhulunbuy.
The distribution favours procurements for Minor Works and Services which can be largely attributed to the Northern Territory Government’s $1.1 billion Our Communities. Our Futures. Our Homes. program and the $100 million public housing stimulus program.
Of the 194 procurements awarded, 95.4% were awarded to local Northern Territory businesses and shows the commitment the department has to the Northern Territory Government’s Buy Local Plan.
The department is committed to continual improvement of procurement processes and capabilities and is undertaking a range of development strategies to increase knowledge and capacity in this area. These strategies include:
• providing procurement awareness, panel assessment and panel chair training for agency employees
• facilitating internal job rotation and mobility placements to ‘grow our own’ procurement officers and contract managers in-house
• providing Certificate IV and Diploma of Government Procurement and Contracting qualifications for employees undertaking significant procurement roles.
CENTRALISED GRANTS MANAGEMENT UNITDuring 2018-19, the Centralised Grants Management unit helped with 685 payment transactions to 60 grant recipients, facilitated the drafting of more than 200 agency grant agreements, and helped with two competitive grant processes.
Key achievements include:
• leading the planning and establishment of a variable standard funding agreement to be used across government agencies
• facilitating GrantsNT training to key grant program areas in 2019
• helping 80 grant recipients register in GrantsNT to facilitate grant payments.
The Centralised Procurement unit and Grants Management unit are responsible for providing whole-of-agency policy advice, support, capability development and performance reporting for procurement and grants activities.

OUR PEOPLE AND ACHIEVEMENTS 46
Strategy, Policy and Performance
1153 from 905 in 2017-18,
an increase of 27%
In 2018-19, the allocations of urban and remote public housing
properties to eligible tenants increased to
In May 2019
the Northern Territory
Government released
Pathways out of Homelessness,
Northern Territory Homelessness
Strategy 2018-23
in urban and remote locations across the Northern Territory
The department owns or manages
13 097 dwellings
In 2018-19,
were completed
95%of ethnic interpreting assignments
The Strategy, Policy and Performance Division shapes the department’s strategic direction across the housing system by leading, developing and implementing innovative and contemporary housing policies, leading strategic planning, and program development.
The division also develops innovative business intelligence and integrated reporting solutions that improve decision making and service delivery performance.

DEPARTMENT OF LOCAL GOVERNMENT, HOUSING AND COMMUNITY DEVELOPMENT ANNUAL REPORT 2018-19 47
NT HOMELESSNESS STRATEGY In May 2019, the Northern Territory Government released Pathways out of Homelessness, Northern Territory Homelessness Strategy 2018-23.
The strategy focuses on addressing homelessness through prevention and early intervention. It aims to improve service integration and collaboration with key non-government service providers, peak bodies and Northern Territory Government agencies across the Children and Families Cluster.
Implementation of priority actions are outlined in a 5 Year Action Plan included in the strategy. During 2018-19, the department commenced work on a number of projects outlined in the strategy including:
• Transferring 17 dwellings across Greater Darwin, Alice Springs and Katherine regions to the Department of the Attorney-General and Minister for Justice for refurbishment as part of the Transitional Accommodation Program.
• Developing the Housing for Young People Program in response to findings and recommendations made by the Royal Commission into the Protection and Detention of Children in the Northern Territory that young people leaving care are at significant risk of homelessness. Three applicants have been accepted into the program, with one young person housed in June 2019.
Policy reviewThe department has reviewed a number of important housing policies to more effectively apply social landlord principles and help people experiencing homelessness. These changes include:
• Allowing applicants with a previous debt to the department to be eligible for public housing and allowing the allocation of housing for clients with outstanding debts.
• Amending the Public Housing Transfers policy to allow tenants with a debt to the department to transfer to another public housing premises.
• A new Tenant Damage policy to support the determination of liability for damage to premises in a transparent and evidence-based manner that is procedurally fair and allows for reasonable wear and tear. Under this policy, tenants are not
charged for damage that is a result of a crime against them or from an act of domestic and family violence.
Homelessness Innovation FundIn November 2018, an evaluation of programs under the Homelessness Innovation Fund identified the Doorways Hub in Katherine and My Place in Alice Springs as delivering innovative and vital housing and homelessness services to vulnerable individuals and families.
The Hub, operated by The Salvation Army is a day service helping more than 100 people per day sleeping rough in Katherine. It provides dignity services and improved health and wellbeing outcomes by providing food, showers, toilets and washing machines.
The My Place program delivered by the Central Australia Affordable Housing Company in Alice Springs consists of two separate programs. The Subsidised Private Rental Program provides subsidised private rental housing, and the Private Rental Liaison Program helps people who can afford a private rental property to overcome barriers accessing the private rental market. Since the program began, 29 adults and 35 children have been housed in the private rental market in Alice Springs
Short Stay AccommodationShort Stay Accommodation (SSA) targets those who are homeless and sleeping rough, who may have complex support needs, and include short term visitors from remote communities without secure housing.
In Darwin, SSA is being delivered through the pre-purchase of beds at the Aboriginal Hostels Ltd Galawu Hostel. Up to 30 homeless people per night have been using the hostel since the service started in May 2019.
The SSA provides shelter to people who would otherwise sleep rough in and around the CBD, and provides them with meals, hygiene services and access to referral pathways for appropriate services.

OUR PEOPLE AND ACHIEVEMENTS 48
HOUSING DATA
Housing stockThe department owns or manages 13 097 dwellings in urban and remote locations across the Northern Territory. This includes public housing, industry
housing, community housing, government employee housing, emergency housing and affordable housing.
Darwin/ Casuarina Palmerston Alice
Springs Katherine Nhulunbuy Tennant Creek Total
Urban public housing 2127 1310 767 404 37 132 4777
Social head lease 143 36 4 183
Industry housing 183 36 226 52 12 43 552
Community housing 10 52 39 101
Affordable rental housing* 153 167 57 18 395
Government employee housing* 11 32 71 183 255 229 781
Total 2627 1581 1173 678 304 426 6789
* Affordable rental housing includes 383 head leased dwellings
* Government employee housing in urban areas includes 446 head leased dwellings
Remote housing stock as at 30 June 2019:
CentralAustralia Big Rivers Arnhem Barkly Arafura Total
Remote public housing 1069 1397 928 287 1102 4783
Town camp/community living area 284 101 385
Industry housing 29 29
Government employee housing* 271 252 232 60 254 1069
Emergency housing 42 42
Total 1624 1649 1202 448 1385 6308
* Government employee housing in remote areas includes 15 head leased dwellings
Urban housing stock as at 30 June 2019:
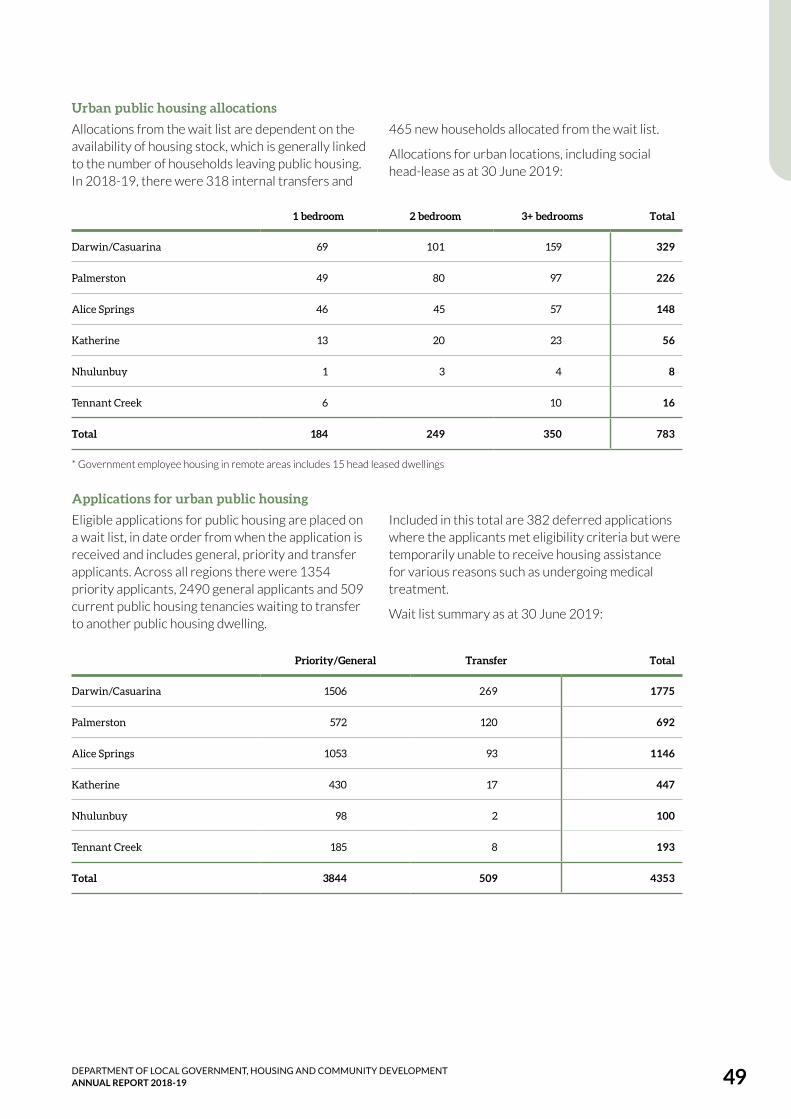
DEPARTMENT OF LOCAL GOVERNMENT, HOUSING AND COMMUNITY DEVELOPMENT ANNUAL REPORT 2018-19 49
1 bedroom 2 bedroom 3+ bedrooms Total
Darwin/Casuarina 69 101 159 329
Palmerston 49 80 97 226
Alice Springs 46 45 57 148
Katherine 13 20 23 56
Nhulunbuy 1 3 4 8
Tennant Creek 6 10 16
Total 184 249 350 783
* Government employee housing in remote areas includes 15 head leased dwellings
Urban public housing allocationsAllocations from the wait list are dependent on the availability of housing stock, which is generally linked to the number of households leaving public housing. In 2018-19, there were 318 internal transfers and
465 new households allocated from the wait list.
Allocations for urban locations, including social head-lease as at 30 June 2019:
Applications for urban public housingEligible applications for public housing are placed on a wait list, in date order from when the application is received and includes general, priority and transfer applicants. Across all regions there were 1354 priority applicants, 2490 general applicants and 509 current public housing tenancies waiting to transfer to another public housing dwelling.
Included in this total are 382 deferred applications where the applicants met eligibility criteria but were temporarily unable to receive housing assistance for various reasons such as undergoing medical treatment.
Wait list summary as at 30 June 2019:
Priority/General Transfer Total
Darwin/Casuarina 1506 269 1775
Palmerston 572 120 692
Alice Springs 1053 93 1146
Katherine 430 17 447
Nhulunbuy 98 2 100
Tennant Creek 185 8 193
Total 3844 509 4353

OUR PEOPLE AND ACHIEVEMENTS 50
1 bedroom 2 bedroom 3 bedrooms
Darwin/Casuarina 6 to 8 years 2 to 4 years 4 to 6 years
Palmerston 4 to 6 year s Less than 2 years 2 to 4 years
Alice Springs 4 to 6 years 4 to 6 years 4 to 6 years
Katherine 6 to 8 years* 4 to 6 years 4 to 6 years
Nhulunbuy 4 to 6 years 4 to 6 years 2 to 4 years
Tennant Creek 6 to 8 years More than 8 years* 6 to 8 years
* Due to limited stock and turnover, manual calculation required.
Urban public housing wait timesWait times for public housing vary depending on each applicant’s circumstances. Wait time is influenced by a number of factors such as the general demand for public housing, the number of approved priority applications, the availability and
turnover of suitable homes in each location and the applicant’s acceptance of offered housing.
Wait times as at 30 June 2019:
Turnaround time – urban public housing dwellingsTurnaround time measures the average number of days it takes to allocate a dwelling to a new tenant after it has been vacated by the previous tenancy.
The department achieved a turnaround time of 119 days compared to Budget Paper BP3 turnaround estimate of 70 days for 2018-19.
Dwellings returning to service after receiving major upgrades under both the $69 million and $100 million stimulus programs are a contributing
factor for high turnaround times. The stimulus programs have helped to complete upgrade and maintenance works to return some longer-term vacant housing to a standard able to be tenanted.
The turnover of vacant dwellings provides an opportunity for the department to survey the condition of a property and ensure that maintenance investment is focused on properties that are in sound condition and maximise the service life of the asset.

DEPARTMENT OF LOCAL GOVERNMENT, HOUSING AND COMMUNITY DEVELOPMENT ANNUAL REPORT 2018-19 51
KEY PERFORMANCE INDICATORS
Local Government, Housing and Community Development
2018-19 Estimate
2018-19 Actual
Housing Services Delivery
Households assisted into public housing 900 1153
Households assisted into private housing through the Bond Assistance Loan Scheme 470 516
Average number of days to occupy vacant public housing stock 70 119
Antisocial behaviour complaints responded to within target timeframes 91% 92%
People provided with support to sustain their tenancy 1600 1547
New social housing head-leased dwellings 9 7
Additional new constructed urban public housing dwellings 10 8
New constructed replacement urban public housing dwellings 38 23
Remote Program Delivery Office
Remote Housing Investment Package:
Proportion of Aboriginal people employed to deliver housing works and services 40% 40%
Dwellings receiving additional bedrooms or living spaces 321 349
Additional new constructed remote housing dwellings 70 50
New constructed replacement remote housing dwellings 6 5
Percentage of contracts awarded to Aboriginal business enterprises 40% 32%
Land services and infrastructure – new remote housing lots developed 150 155
Community Services
Aboriginal interpreting assignments completed 70% 70%
Aboriginal interpreting hours provided by qualified interpreters 55% 43%
Ethnic interpreting assignments completed 97% 95%
Number of local Aboriginal workers employed under Homelands Jobs Grants 143 145
Local Government and Community Development
Locations visited to progress community development initiatives 79 79
Percentage of locations visited a minimum of four times during the year to progress community development initiatives
80% 91%
Scheduled compliance reviews completed 4 5
Number of training and workshop sessions funded or delivered by the department to improve council capabilities
10 10

OUR PEOPLE AND ACHIEVEMENTS 52
Housing services delivery
Households assisted into public housing
Several factors are considered in the allocation of housing, including the number of bedrooms required by an applicant and suitability of the dwelling’s location. On most occasions, priority applicants are allocated ahead of other applicants, but this is not always the case.
In 2018-19, the allocations of urban and remote public housing properties to eligible tenants increased to 1153 from 905 in 2017-18, an increase of 27%.
Households assisted into private housing
through the Bond Assistance Loan Scheme
To help enter the private rental market, low-income clients can apply for interest-free loans to help pay a bond and up to two weeks rent in advance.
Eligibility criteria exist, which include Australian residency and income and asset limits. In 2018-19, 516 bond loans were provided to help people into private rental accommodation. This increased by 22% compared to 423 loans provided in 2017-18.
Average number of days to occupy vacant public
housing stock
The average time to re-tenant urban public housing stock across the Northern Territory was 119 days. This was 49 days more than the target of 70 days outlined in the 2018-19 Budget Paper 3, and an increase of 20 days compared to 2017-18. A range of factors contribute to the increase including available dwellings not meeting the needs of clients on the wait list and the impact on the turnaround calculation of long term vacant dwellings returned to service under the stimulus programs.
Antisocial Behaviour Complaints responded
to within target timeframes
Response time to address antisocial behaviour complaints is determined by severity level:
Complaint type Response timeframe
Serious complaints within four hours
Moderate complaints within two days
Minor complaints within four days
A 92% response rate was achieved, slightly above the target of 91%.
People provided with support to sustain
their tenancy
The department supported 1547 people to sustain their tenancy. The data is derived from individual agency level Specialist Homelessness Services Collection Statistical Summary Reports for the nine-month period of 1 July 2018 to 31 March 2019.
The target is expected to be exceeded when annual data is available through the Australian Institute of Health and Welfare in September 2019.
New public housing head-leased dwellings
To help manage housing demand, the department head leases dwellings from private property owners which are sub-leased to tenants who qualify for social housing. Social housing head-leasing increases the number of properties available to low-income Territorians and their families, seniors and people with a disability.
Additional new constructed urban public
housing dwellings
The department completed eight new urban public housing dwellings and a further 10 new builds were under construction as part of the 2018-19 program, totalling 18 new builds. This exceeds the target of 10 new builds outlined in the 2018-19 Budget Paper 3 due to achieving increased dwelling yields for some sites.
New constructed replacement urban public
housing dwellings
There were 23 newly constructed replacement urban public housing dwellings completed in 2018-19, with a further six under construction. This is 15 fewer than the 2018-19 target of 38, which is due to a lower than anticipated number of dwellings identified as suitable for replacement.
Remote Program Delivery Office
Additional new constructed remote
housing dwellings
A key factor influencing the targeted completion of new constructed remote housing dwellings under HomeBuild NT is inclement weather delaying access, however as at 30 June 2019 there were 46 new dwellings underway in addition to the 50 dwellings completed during 2018-19. Alongside the Remote Housing Investment Package under the National Partnership on Remote Housing, 88 new remote housing dwellings were completed and 168 homes were upgraded under the Remote Australia Strategies Implementation Plan.

DEPARTMENT OF LOCAL GOVERNMENT, HOUSING AND COMMUNITY DEVELOPMENT ANNUAL REPORT 2018-19 53
Percentage of contracts awarded to Aboriginal Business EnterprisesThere was a significant increase in contracts awarded to Aboriginal Business Enterprises in 2018-19 compared with previous years. There were 11 contracts awarded to Aboriginal Business Enterprises in 2018-19 compared with five in 2017-18. In addition, the value of contracts awarded to Aboriginal Business Enterprises has increased from $6.6 million in 2017-18 to $17.6 million in 2018-19.
Community Services
Aboriginal interpreting assignments completed
The Aboriginal Interpreter Service tracked in line with the target of 70%. The department continues to recruit and train more interpreters to improve capacity to meet increasing demand.
Aboriginal interpreting hours provided by
qualified interpreters
The demand for qualified interpreters continues to increase. Performance in 2018-19 was 43%. There is a requirement for trained interpreters to undertake set hours of interpreting work to achieve their qualification. As a consequence, to increase the number of qualified interpreters it has been essential to provide more interpreter hours to trained interpreters so they can complete the hours required to become qualified.
Training and development of interpreters is critical to meet the existing and increasing demand for language services. It is anticipated that performance for this KPI will improve over time as the number of qualified interpreters available increases.
Ethnic interpreting assignments completed
In 2018-19, 95% of ethnic interpreting assignments were completed. There are no on-staff interpreters for ethnic languages, and capacity to deliver services is impacted by external contractor availability in line with stakeholder demand.
Number of local Aboriginal workers employed
under Homelands Jobs Grants
This was a new performance measure in 2018-19 aimed to increase awareness of the important training and employment opportunities provided to homelands residents through grant funding. There were 145 workers employed, exceeding the target of 143.
Local Government
Locations visited to progress community
development initiatives
The Community Development branch conducted visits to 79 remote communities in
2018-19 to:
• support the work and development of local authorities
• conduct consultation sessions on the draft Burial and Cremation Bill, and the proposed legislative amendments to the Local Government Act 2008
• support the development of community directories for Bushtel, and Engagement Advice Sheets to improve contextual information for Northern Territory Public Servants conducting remote engagement.
In working with communities, the department is working towards the objectives outlined in its Community Development Policy which are aimed at building community capacity, increasing local decision making and increasing community cohesion.
Percentage of locations visited a minimum
of four times during the year to progress
community development initiatives
During the year, 91% of locations were visited a minimum of four times, which exceeds the target of 80% outlined in the 2018-19 Budget Paper 3. Working in a community development context is dependent on building relationships and trust with people. In terms of the Community Development Model, each visit aims to:
• help communities to have a voice with government
• improve engagement capability across the NTPS
• support two-way information and knowledge exchange
• support the Local Decision Making Framework Policy
• support communities with their governance
capacity and development.
Scheduled compliance reviews completed
The department administers a program of compliance reviews for councils as required by the Local Government Act 2008 to ensure councils are conducting their business lawfully. Compliance reviews are conducted by local government

OUR PEOPLE AND ACHIEVEMENTS 54
inspectors and all councils are subject to a compliance review at least once every three years. Each year the department’s Chief Executive Officer sets the local government compliance program, which includes determining which councils will be subject to a compliance review.
In 2018-19 the department conducted a compliance review of the following councils:
• Wagait Shire Council
• Central Desert Regional Council
• Coomalie Community Government Council
• West Daly Regional Council.
The compliance review conducted on Litchfield Council started in June 2018 and was completed in July 2018. During the year all outstanding issues from the 2015 compliance review conducted on CouncilBIZ, a local government subsidiary, were also resolved.
Number of training and workshop sessions
funded or delivered by the department to
improve council capabilities
During the year the department supported a number of training and information sessions to help improve councils’ capabilities. These sessions included:
• a LGANT (Local Government Association of the Northern Territory) Asset Management Workshop
• Environment, Transport Infrastructure Reference Group meetings
• two 2-day courses tailored for the local government sector delivered by the Australian Institute of Company Directors
• a rates workshop
• many presentations on good governance at several council and local authority meetings.
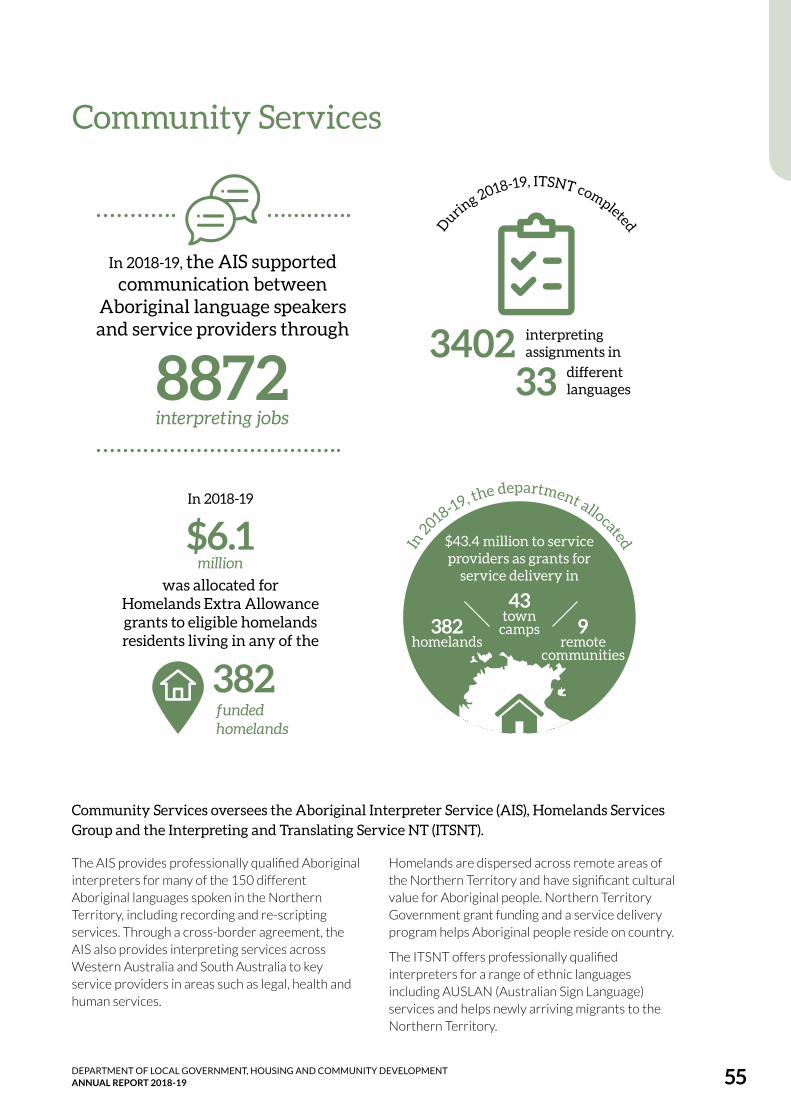
DEPARTMENT OF LOCAL GOVERNMENT, HOUSING AND COMMUNITY DEVELOPMENT ANNUAL REPORT 2018-19 55
Community Services
was allocated for Homelands Extra Allowance grants to eligible homelands residents living in any of the
8872 interpreting jobs
$6.1million
340233
interpreting assignments in
different languages
In 2018-19, the AIS supported communication between
Aboriginal language speakers and service providers through
During 2018-19, ITSNT completed
In 2018-19, the department allocated
382funded homelands
In 2018-19
$43.4 million to service providers as grants for
service delivery in
382 homelands
43town
camps 9remote
communities
Community Services oversees the Aboriginal Interpreter Service (AIS), Homelands Services Group and the Interpreting and Translating Service NT (ITSNT).
The AIS provides professionally qualified Aboriginal interpreters for many of the 150 different Aboriginal languages spoken in the Northern Territory, including recording and re-scripting services. Through a cross-border agreement, the AIS also provides interpreting services across Western Australia and South Australia to key service providers in areas such as legal, health and human services.
Homelands are dispersed across remote areas of the Northern Territory and have significant cultural value for Aboriginal people. Northern Territory Government grant funding and a service delivery program helps Aboriginal people reside on country.
The ITSNT offers professionally qualified interpreters for a range of ethnic languages including AUSLAN (Australian Sign Language) services and helps newly arriving migrants to the Northern Territory.
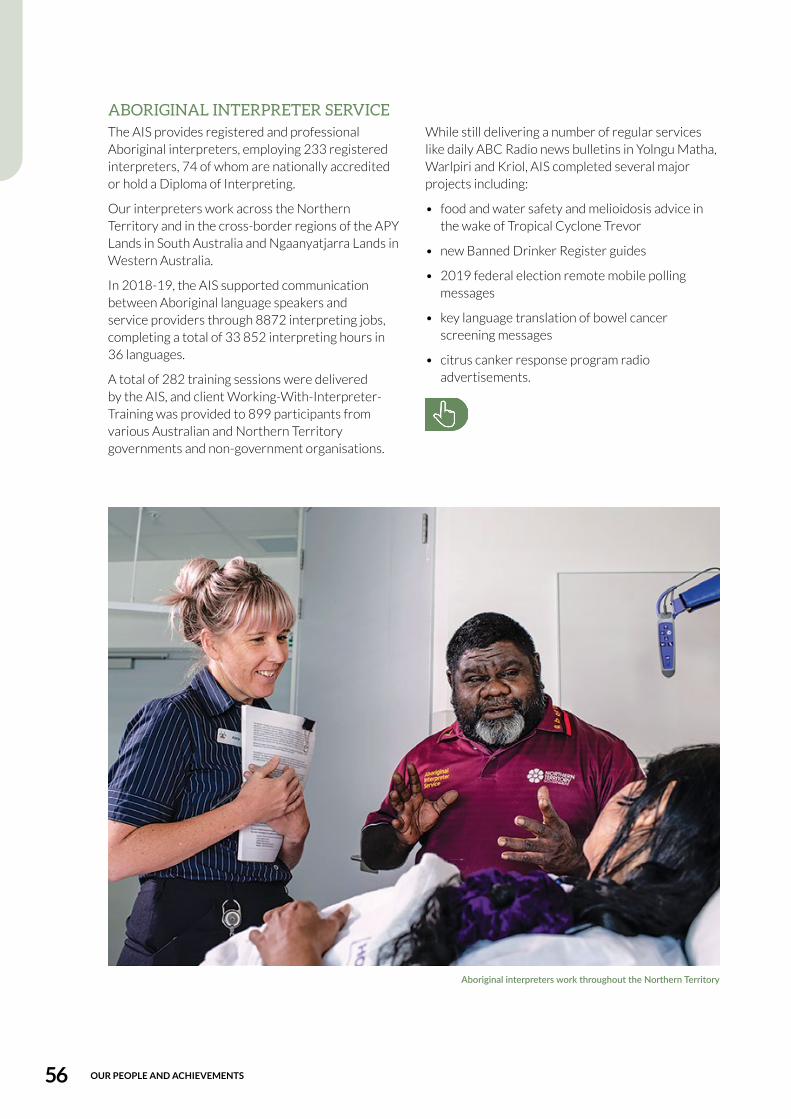
OUR PEOPLE AND ACHIEVEMENTS 56
ABORIGINAL INTERPRETER SERVICE The AIS provides registered and professional Aboriginal interpreters, employing 233 registered interpreters, 74 of whom are nationally accredited or hold a Diploma of Interpreting.
Our interpreters work across the Northern Territory and in the cross-border regions of the APY Lands in South Australia and Ngaanyatjarra Lands in Western Australia.
In 2018-19, the AIS supported communication between Aboriginal language speakers and service providers through 8872 interpreting jobs, completing a total of 33 852 interpreting hours in 36 languages.
A total of 282 training sessions were delivered by the AIS, and client Working-With-Interpreter-Training was provided to 899 participants from various Australian and Northern Territory governments and non-government organisations.
While still delivering a number of regular services like daily ABC Radio news bulletins in Yolngu Matha, Warlpiri and Kriol, AIS completed several major projects including:
• food and water safety and melioidosis advice in the wake of Tropical Cyclone Trevor
• new Banned Drinker Register guides
• 2019 federal election remote mobile polling messages
• key language translation of bowel cancer screening messages
• citrus canker response program radio advertisements.
Aboriginal interpreters work throughout the Northern Territory

DEPARTMENT OF LOCAL GOVERNMENT, HOUSING AND COMMUNITY DEVELOPMENT ANNUAL REPORT 2018-19 57
LThe iAwards
Raelene McGinness (2nd from right) accepting the iAward for Community Services Markets – NT. Image courtesy of Australian Information Industry Association
This year, a joint Aboriginal Interpreter Service and NT Police project won an Australian Information Industry Association (AIIA) iAward for its digital innovation.
The AIS was engaged by police to supply recorded messages for its phone services in 59 of its community police stations, covering 20 languages.
When calling their local police station, a community member will hear a message providing options in language and English. Message options range from instructions regarding emergency and non-emergency situations.
The project won the AIIA iAward for Community Services Markets – NT.
The iAwards recognise excellence in Australian innovation which has the potential to create a positive change in the community.
The project has since been nominated for the Prime Minister’s Awards for Excellence in Public Sector Management.
It is not the only project where the AIS has partnered with emergency services. In September, the Northern Territory Emergency Service launched the Flood Safe short films.
Seven short films describe what to do when you encounter a flooded road. Five of the seven films were interpreted by the AIS team. These films have streamed on social media, the NT Police, Fire and Emergency Services website, and have been broadcast on remote television and radio stations.
AIS interpreter Miriam Ngalmirimirin took part in interpreting one of the videos into Kunwinjku language, which covers the West Arnhem region of Gunbalanya (Oenpelli), Maningrida and the Minjilang community areas.
‘English is their second language. It’s better to explain in language so people will listen’, she said.
“It’s better to explain in language so people
will listen”
The iAwards

OUR PEOPLE AND ACHIEVEMENTS 58
HOMELANDS SERVICESWith an estimated 500 homelands and 50 000 people linked to homelands across the Northern Territory it is clear homelands are at the centre of Aboriginal economic, cultural and spiritual life.
In 2018-19, the department allocated $43.4 million to service providers as grants for service delivery in 382 homelands, 43 town camps and nine remote communities.
There were 39 service provider organisations engaged to deliver services, of which 27 were Aboriginal organisations. Services included municipal and essential services, housing repairs, maintenance and upgrades and homelands jobs funding.
Additionally, the Homelands Services Group managed 142 separate capital projects across 100 different homelands. Projects included improvements to electricity, water and septic infrastructure, municipal works, new rubbish dumps and water treatment systems.
The funding breakdown was:
• $21.6 million for homelands municipal and essential services
• $2.8 million for town camps municipal and essential services
• $6.9 million for housing maintenance services
• $6 million for the homelands jobs program
• $6.1 million for the Homelands Extra Allowance program.
Homelands Extra Allowance In 2018-19, $6.1 million was allocated for Homelands Extra Allowance grants to eligible homelands residents living in any of the 382 funded homelands. Funding was provided for works such as the upgrade and improvement of dwellings, health and safety improvements, disability modifications and more efficient electricity and water use.
Homelands Extra Allowance funding is only available for homelands dwellings which are either permanently or seasonally occupied, and are the resident’s principal place of residence.
Grant funding for successful applications is released directly to the homelands service providers who are responsible for managing funding and the delivery of upgrade and improvement works.
A total of 773 applications made by 29 service providers were funded in the reporting period.
Urapuntja Aboriginal Corporation funding arrangement The Urapuntja Aboriginal Corporation (UAC) signed a five-year varied funding arrangement with the department on 1 July 2018.
The long term commitment in funding allows for the UAC to provide forward planning and a schedule of works that will help maintain services to 13 homelands in the region.
Homelands Policy review Opening for public submissions on 19 November 2018, the department conducted a Homelands Policy review of the effectiveness of existing homelands programs and will provide recommendations on alternative programs for implementation under the new Homelands Policy.
The review identified options and opportunities to continue driving improved outcomes for Aboriginal families living on homelands and outstations.
Aboriginal peak organisations, land councils, homelands service providers and other key homelands stakeholders were consulted as part of the review.
The review closed on 28 February 2019 and received 19 public submissions. A final report is due by 31 December 2019.
Tropical Cyclone Trevor remediation works at Snake LagoonThe small family homeland of Snake Lagoon in the south-west Gulf country suffered significant damage when Cyclone Trevor crossed the Northern Territory mainland as a severe Category 4 system in March 2019.
Much of the homeland’s infrastructure was completely destroyed. Power Projects NT was engaged to install a replacement shelter at Snake Lagoon as part of cyclone recovery works, funded through the department’s Homelands Services Group. The project was completed on 28 June 2019.
The new shelter will provide much needed secure critical emergency shelter to residents in the event of other serious weather events.

DEPARTMENT OF LOCAL GOVERNMENT, HOUSING AND COMMUNITY DEVELOPMENT ANNUAL REPORT 2018-19 59
INTERPRETING AND TRANSLATING SERVICE OF THE NORTHERN TERRITORY The Interpreting and Translating Service of the Northern Territory (ITSNT) helps government and non-government organisations by providing an effective and efficient on-site interpreting and translating service.
During 2018-19, ITSNT completed 3402 interpreting assignments in 33 different languages with Swahili, Vietnamese, Mandarin and Greek being the most requested.
In the same period the service completed 664 translations into 37 different languages with the major languages being Chinese, Indonesian, Thai and Greek.
The new shelter at Snake Lagoon
L-R, Justus Korir, Thapana Kraisang and Lisa You work with ITSNT to provide interpreting and translating services in the Northern Territory

OUR PEOPLE AND ACHIEVEMENTS 60
LThe iAwards
Language and the Law conference Alice Springs - image courtesy of the Northern Territory Supreme Court
The third Language and the Law conference hosted by the Northern Territory Supreme Court was held in Alice Springs in April 2019 and attended by staff from both the Interpreting and Translating Service NT (ITSNT) and the Aboriginal Interpreter Service (AIS).
The two-day conference was about understanding and developing a greater cultural sensitivity of the court process and improving access to justice for those in the community for whom English is not their first language.
Staff from ITSNT and AIS play an integral role throughout the Northern Territory legal system. ITSNT provides qualified and experienced interpreters across the Northern Territory local and
supreme courts, the Australian Federal Court, local legal
private firms, the Legal Aid Commission, NTCAT
and various community legal services.
In 2018-19, ITSNT completed 27 interpreting assignments in the local and supreme courts, 25 assignments in the Federal Court, 92 assignments at various community legal services across Darwin and nine back-translations of court documents and electronic records of interview.
AIS provides appropriate qualified interpreters for criminal, civil and family legal matters for NT local and supreme courts, community Bush Courts, Aboriginal Legal Services, local legal private firms, the Legal Aid Commission and various community legal services, as well as across other state jurisdictions.
In 2018-19, AIS completed 2852 legal interpreting assignments (equating to 12 068 hours of interpreting), making up 32% of all jobs completed by AIS for the full year.
In 2018-19, AIS completed 2852
legal interpreting assignments.
Language and the Law Conference

DEPARTMENT OF LOCAL GOVERNMENT, HOUSING AND COMMUNITY DEVELOPMENT ANNUAL REPORT 2018-19 61
Remote Program Delivery Office
In 2018-19, 3 subdivisions were completed providing
64 new serviceable lotsat Lake Evella, Ngukurr and Wadeye
In 2018-19, 55 infrastructure leases were established in
for stakeholder agencies
12 remote communities
During 2018-19, 88 new build homes were completed and
168 homes were upgraded
The Remote Program Delivery Office is responsible for the delivery of housing and housing related infrastructure to remote communities in the Northern Territory. These programs are funded by the Northern Territory and Australian Governments and are aimed at reducing overcrowding by improving existing and building new houses.
Land Tenure, Land Services and Essential Services Infrastructure and the Indigenous Essential Services program support the remote housing delivery programs.
in Kalkarindji have been scoped for preventative
repairs and maintenance and upgrade works
homesin Lajamanu and
30
70In 2018-19,

OUR PEOPLE AND ACHIEVEMENTS 62
OUR COMMUNITY. OUR FUTURE. OUR HOMES.The Remote Housing Investment Package, Our Community. Our Future. Our Homes. (OCOFOH) program is the largest ever investment into remote housing in the Northern Territory.
The commitment of $1.1 billion over 10 years (2016-17 to 2026-27) is to improve housing, create jobs and restore local decision making in 73 remote communities in the Northern Territory.
Funding allows for:
• $500 million for HomeBuild NT to construct new homes in remote communities, including housing for people who are elderly or have a disability.
• $200 million for Room to Breathe to reduce overcrowding in existing dwellings by providing additional rooms, living and sleeping spaces, shelter and outdoor cooking areas.
• $200 million to expand Government Employee Housing to include accommodation for locally recruited remote community government employees.
• $200 million for additional preventative repairs and maintenance for remote community houses.
• An additional investment of $426 million over eight years from 2016-17 is committed for preparing land servicing and infrastructure for the remote housing works.
The combined initiatives of OCOFOH aim to reduce the effects of overcrowding, will deliver new and additional accommodation options and support Aboriginal employment and economic development over the life of the program.
HomeBuild NTHomeBuild NT is expanding housing solutions by encouraging innovative designs and products that are culturally appropriate, with input from residents around site selection, housing design and layout choices.
The RPDO undertakes the community engagement and planning to inform the new build program while the procurement and construction of new homes under HomeBuild NT is managed by the Department of Infrastructure, Planning and Logistics.
Overall, 52 homes have been completed across 11 remote communities.
As at 30 June 2019 a further 46 homes were underway and 104 in various stages of procurement.
Room to BreatheThe Room to Breathe program is designed to empower local decision making and enable tenants to collaborate through co-design of alterations, additions and improvements to their own home to improve liveability and reduce the effects of overcrowding.
To improve the liveability of a home, consideration is given to a number of factors including accessibility, privacy and cultural practices.
Under the program, works have been completed on 231 living spaces in 144 homes across 24 communities. Of the 231 living spaces completed, 132 were for additional living spaces and 99 for additional bedrooms.
A total of 648 households have had the opportunity to co-design alterations and improvements to their homes. Of these, contracts have been awarded for 125 homes in nine communities at:
• Milyakburra
• Ali Curung
• Tara
• Kalkarindji
• Kybrook Farm
• Lajamanu
• Weemol
• Areyonga
• Santa Teresa.
Government employee housingThis initiative enables locally recruited Government employees in remote communities to access Government employee housing (GEH).
As at 30 June 2019, six GEH dwellings were completed under the OCOFOH program, two each in Borroloola and Yuendemu, and one each in Nganmarriyanga and Ramingining.
A further six dwellings are under construction, nine pending release of tenders, and preparation of procurement for a further eight dwellings.

DEPARTMENT OF LOCAL GOVERNMENT, HOUSING AND COMMUNITY DEVELOPMENT ANNUAL REPORT 2018-19 63
Preventative repairs and maintenancePreventative repairs and maintenance works help keep houses safe and include safety audits, replacements of residual current devices and smoke alarms.
In 2018-19, 70 homes in Lajamanu and 30 in Kalkarindji have been scoped for preventative repairs and maintenance and upgrade works. A contract was awarded for works on 10 homes in Kalkarindji to a local Aboriginal Business Enterprise with four homes completed. Works have been awarded for 20 homes in Lajamanu with five completed.
The department understands the benefits of upgrading or maintaining houses and has committed to implementing the healthy living principles outlined in Housing for Health - the Guide.
Local decision making and community engagementLocal decision making gives communities meaningful input into how the OCOFOH program is delivered.
Communities have control over decisions about what work will happen, when it takes place, where it happens, how it happens and who does the work.
As at 30 June 2019, there were 309 community engagement visits to 64 communities for:
• Room to Breathe
• HomeBuild NT
• Government Employee Housing
• preventative repairs and maintenance
• Land Servicing and Headworks Infrastructure
• Land Tenure.
To ensure that a program is developed in true partnership with Aboriginal communities, trained Aboriginal interpreters are available throughout each phase of an engagement.
In 2018-19, the OCOFOH program attended 102 community meetings with the Aboriginal Interpreter Service covering 22 Aboriginal languages.
Local decision making allows communities to control what work will happen
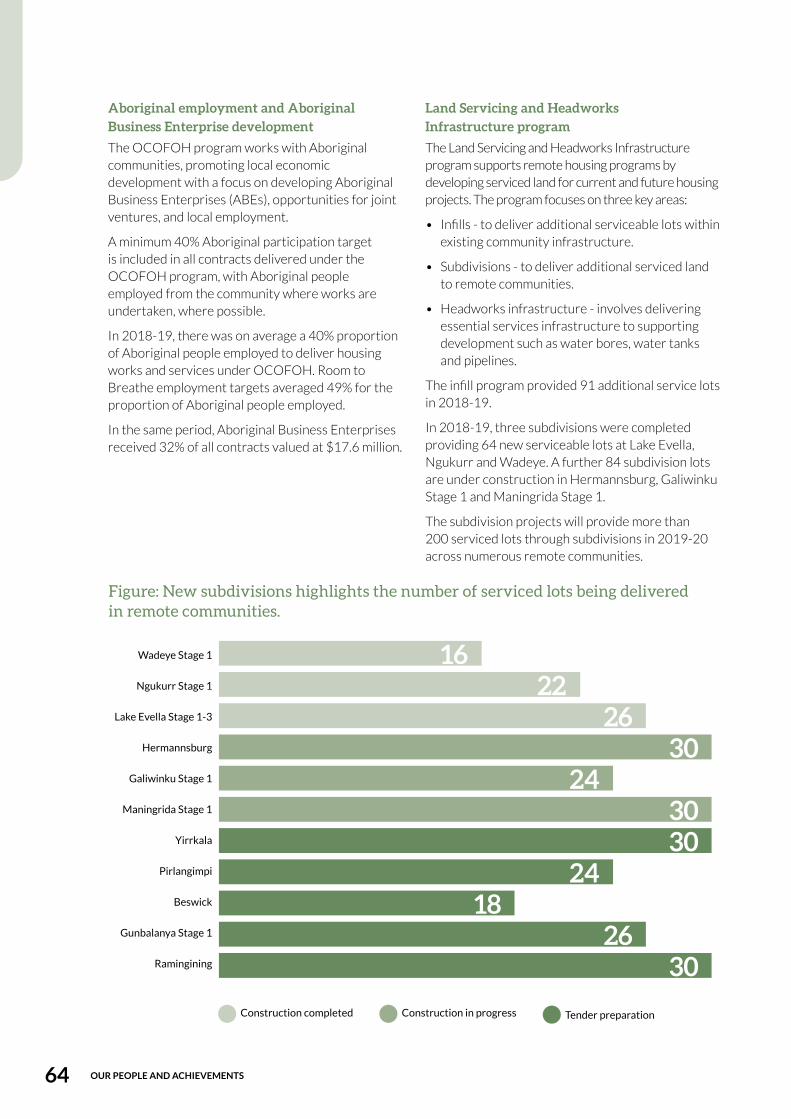
OUR PEOPLE AND ACHIEVEMENTS 64
Aboriginal employment and Aboriginal Business Enterprise developmentThe OCOFOH program works with Aboriginal communities, promoting local economic development with a focus on developing Aboriginal Business Enterprises (ABEs), opportunities for joint ventures, and local employment.
A minimum 40% Aboriginal participation target is included in all contracts delivered under the OCOFOH program, with Aboriginal people employed from the community where works are undertaken, where possible.
In 2018-19, there was on average a 40% proportion of Aboriginal people employed to deliver housing works and services under OCOFOH. Room to Breathe employment targets averaged 49% for the proportion of Aboriginal people employed.
In the same period, Aboriginal Business Enterprises received 32% of all contracts valued at $17.6 million.
Land Servicing and Headworks Infrastructure programThe Land Servicing and Headworks Infrastructure program supports remote housing programs by developing serviced land for current and future housing projects. The program focuses on three key areas:
• Infills - to deliver additional serviceable lots within existing community infrastructure.
• Subdivisions - to deliver additional serviced land to remote communities.
• Headworks infrastructure - involves delivering essential services infrastructure to supporting development such as water bores, water tanks and pipelines.
The infill program provided 91 additional service lots in 2018-19.
In 2018-19, three subdivisions were completed providing 64 new serviceable lots at Lake Evella, Ngukurr and Wadeye. A further 84 subdivision lots are under construction in Hermannsburg, Galiwinku Stage 1 and Maningrida Stage 1.
The subdivision projects will provide more than 200 serviced lots through subdivisions in 2019-20 across numerous remote communities.
Figure: New subdivisions highlights the number of serviced lots being delivered in remote communities.
Construction completed Construction in progress Tender preparation
Wadeye Stage 1
Ngukurr Stage 1
Lake Evella Stage 1-3
Hermannsburg
Galiwinku Stage 1
Maningrida Stage 1
Yirrkala
Pirlangimpi
Beswick
Gunbalanya Stage 1
Ramingining
1622
26
26
30
3030
30
24
2418
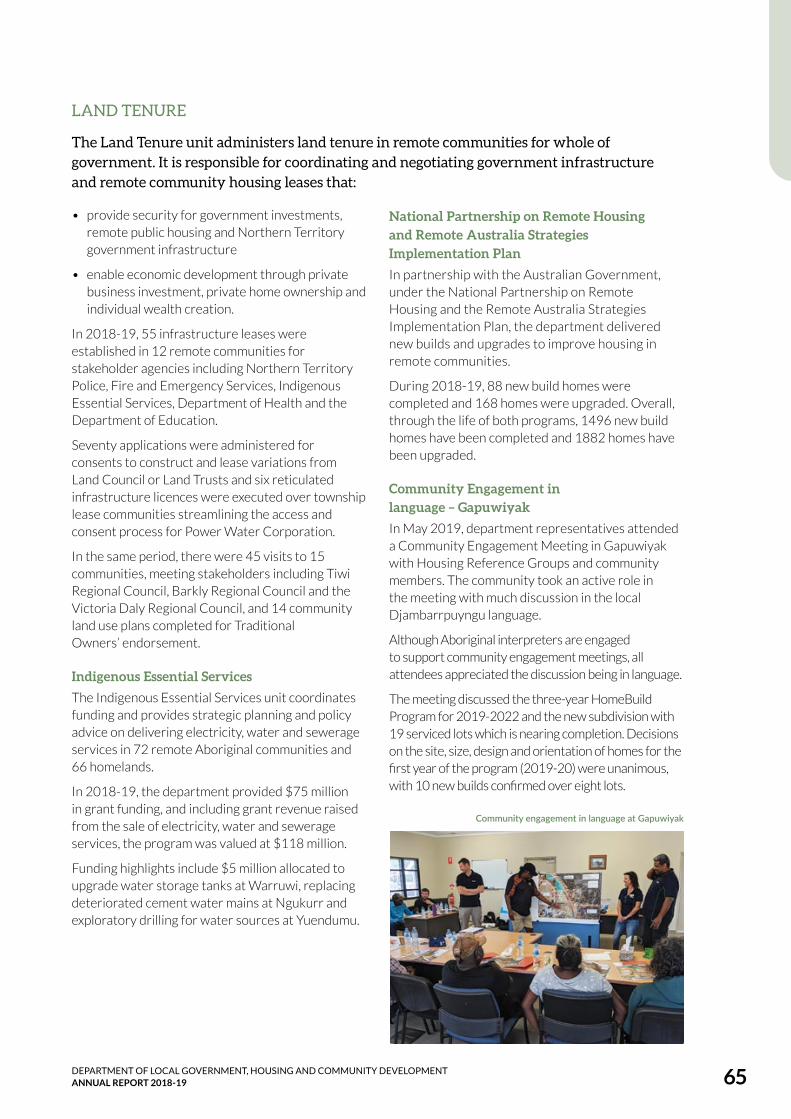
DEPARTMENT OF LOCAL GOVERNMENT, HOUSING AND COMMUNITY DEVELOPMENT ANNUAL REPORT 2018-19 65
LAND TENURE
The Land Tenure unit administers land tenure in remote communities for whole of government. It is responsible for coordinating and negotiating government infrastructure and remote community housing leases that:
• provide security for government investments, remote public housing and Northern Territory government infrastructure
• enable economic development through private business investment, private home ownership and individual wealth creation.
In 2018-19, 55 infrastructure leases were established in 12 remote communities for stakeholder agencies including Northern Territory Police, Fire and Emergency Services, Indigenous Essential Services, Department of Health and the Department of Education.
Seventy applications were administered for consents to construct and lease variations from Land Council or Land Trusts and six reticulated infrastructure licences were executed over township lease communities streamlining the access and consent process for Power Water Corporation.
In the same period, there were 45 visits to 15 communities, meeting stakeholders including Tiwi Regional Council, Barkly Regional Council and the Victoria Daly Regional Council, and 14 community land use plans completed for Traditional Owners’ endorsement.
Indigenous Essential Services The Indigenous Essential Services unit coordinates funding and provides strategic planning and policy advice on delivering electricity, water and sewerage services in 72 remote Aboriginal communities and 66 homelands.
In 2018-19, the department provided $75 million in grant funding, and including grant revenue raised from the sale of electricity, water and sewerage services, the program was valued at $118 million.
Funding highlights include $5 million allocated to upgrade water storage tanks at Warruwi, replacing deteriorated cement water mains at Ngukurr and exploratory drilling for water sources at Yuendumu.
National Partnership on Remote Housing and Remote Australia Strategies Implementation PlanIn partnership with the Australian Government, under the National Partnership on Remote Housing and the Remote Australia Strategies Implementation Plan, the department delivered new builds and upgrades to improve housing in remote communities.
During 2018-19, 88 new build homes were completed and 168 homes were upgraded. Overall, through the life of both programs, 1496 new build homes have been completed and 1882 homes have been upgraded.
Community Engagement in language – GapuwiyakIn May 2019, department representatives attended a Community Engagement Meeting in Gapuwiyak with Housing Reference Groups and community members. The community took an active role in the meeting with much discussion in the local Djambarrpuyngu language.
Although Aboriginal interpreters are engaged to support community engagement meetings, all attendees appreciated the discussion being in language.
The meeting discussed the three-year HomeBuild Program for 2019-2022 and the new subdivision with 19 serviced lots which is nearing completion. Decisions on the site, size, design and orientation of homes for the first year of the program (2019-20) were unanimous, with 10 new builds confirmed over eight lots.
Community engagement in language at Gapuwiyak

OUR PEOPLE AND ACHIEVEMENTS 66
The Remote Housing Industry Forum attracted more than 200 delegates
The Remote Housing Industry Forum 2019 was held in Darwin on 13-14 June. It focused on ABEs and industry involvement and attracted more than 200 delegates.
The forum featured Commissioner Ken Fleming QC, the Northern Territory Independent Commissioner Against Corruption as the keynote speaker, as well as a range of industry and government presenters.
The event featured case study presentations from five ABEs based in community including:
• Power Projects NT
• Ingkerreke Commercial
• Ganybu Aboriginal Housing Corporations
• Yolngu Business Enterprises (YBE)
• Bawinanga Aboriginal Corporation.
Of the delegates representing the business sector, 70% identified as an ABE.
Remote Housing Industry Forum 2019
70% of the delegates representing the business sector,
identified as an ABE.
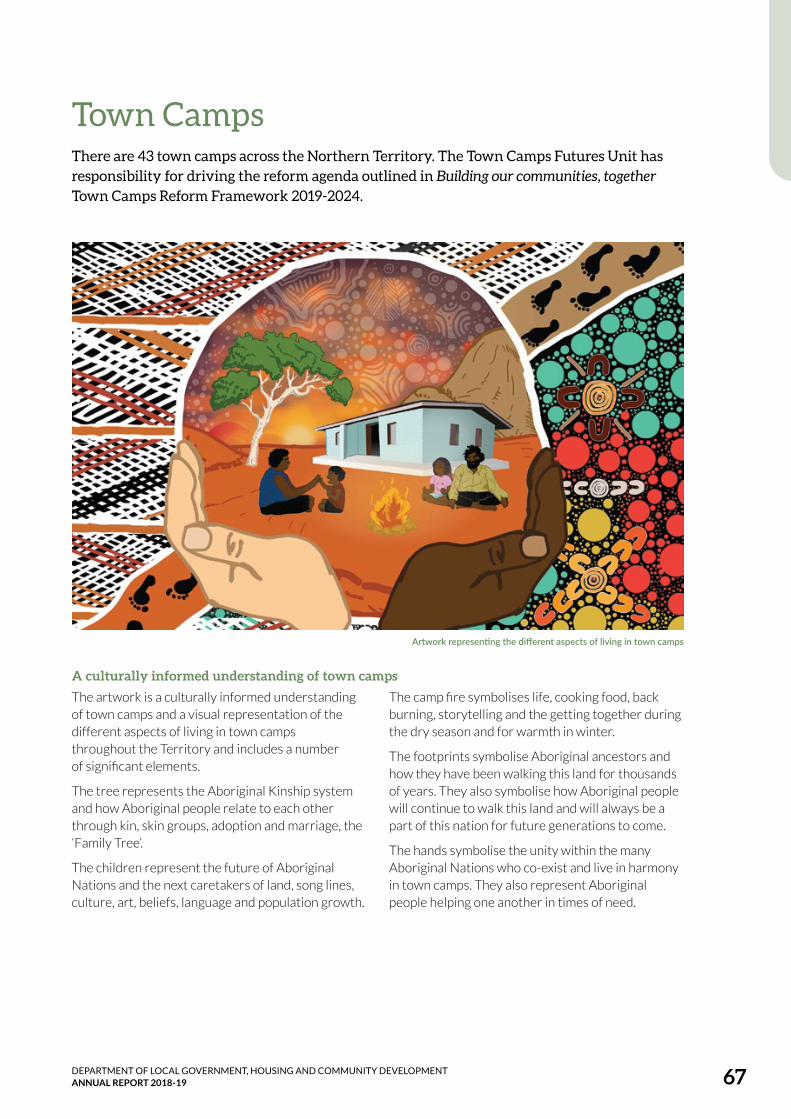
DEPARTMENT OF LOCAL GOVERNMENT, HOUSING AND COMMUNITY DEVELOPMENT ANNUAL REPORT 2018-19 67
Town CampsThere are 43 town camps across the Northern Territory. The Town Camps Futures Unit has responsibility for driving the reform agenda outlined in Building our communities, together Town Camps Reform Framework 2019-2024.
A culturally informed understanding of town campsThe artwork is a culturally informed understanding of town camps and a visual representation of the different aspects of living in town camps throughout the Territory and includes a number of significant elements.
The tree represents the Aboriginal Kinship system and how Aboriginal people relate to each other through kin, skin groups, adoption and marriage, the ‘Family Tree’.
The children represent the future of Aboriginal Nations and the next caretakers of land, song lines, culture, art, beliefs, language and population growth.
The camp fire symbolises life, cooking food, back burning, storytelling and the getting together during the dry season and for warmth in winter.
The footprints symbolise Aboriginal ancestors and how they have been walking this land for thousands of years. They also symbolise how Aboriginal people will continue to walk this land and will always be a part of this nation for future generations to come.
The hands symbolise the unity within the many Aboriginal Nations who co-exist and live in harmony in town camps. They also represent Aboriginal people helping one another in times of need.
Artwork representing the different aspects of living in town camps

OUR PEOPLE AND ACHIEVEMENTS 68
In April 2018, the Northern Territory Government’s Initial Response to the Town Camp Review Report was released along with a $25.5 million commitment to undertake urgent repairs and maintenance, and to establish the Town Camps Futures Unit (TCFU).
The TCFU was established in August 2018. Some of its key functions are to:
• oversee implementation of the five-year investment plans which provide funding for housing and infrastructure upgrades
• support effective processes for engagement and consultation with the Aboriginal controlled housing sector
• support the capability building of residents and Aboriginal controlled construction and housing sector.
Town Camps Futures Unit
Town Camps Housing and Infrastructure Program From the $100 million stimulus housing program, $10 million was identified for additional housing and infrastructure works in Top End town camps.
Immediate work has focused on ensuring the health, safety and security of town camp residents, namely:
• upgrading roads
• repairing critical water infrastructure
• installing new street lights and fencing
• renovating and repairing housing.
Investment was prioritised to the Top End town camps due to the significant need outlined in the ‘Living on the Edge’ Northern Territory Town Camps Review.
The delivery of work was through Aboriginal controlled organisations, local sub-contractors and where possible, local suppliers. This ensures that housing and infrastructure investment supports local employment and economic development.
This program is stimulating the local economy and enhancing town camps and community living areas.
Town Camps Futures Unit External Advisory GroupThe Town Camps Futures Unit established an External Advisory Group to provide advice to guide and inform the critical reforms across the 43 town camps and community living areas.
Members are representatives from the Aboriginal Controlled Housing Organisations who are currently responsible for service provision in town camps and community living areas.
They are:
• Yilli Rreung Housing Aboriginal Corporation - Darwin
• Pine Creek Aboriginal Advancement Association Inc. - Pine Creek
• Kalano Community Association - Katherine
• Mabunji Aboriginal Resource Association incorporated - Borroloola
• Julalikari Council Aboriginal Corporation – Tennant Creek
• Tangentyere Council and Central Australian Affordable Housing – Alice Springs
• Aboriginal Housing NT.
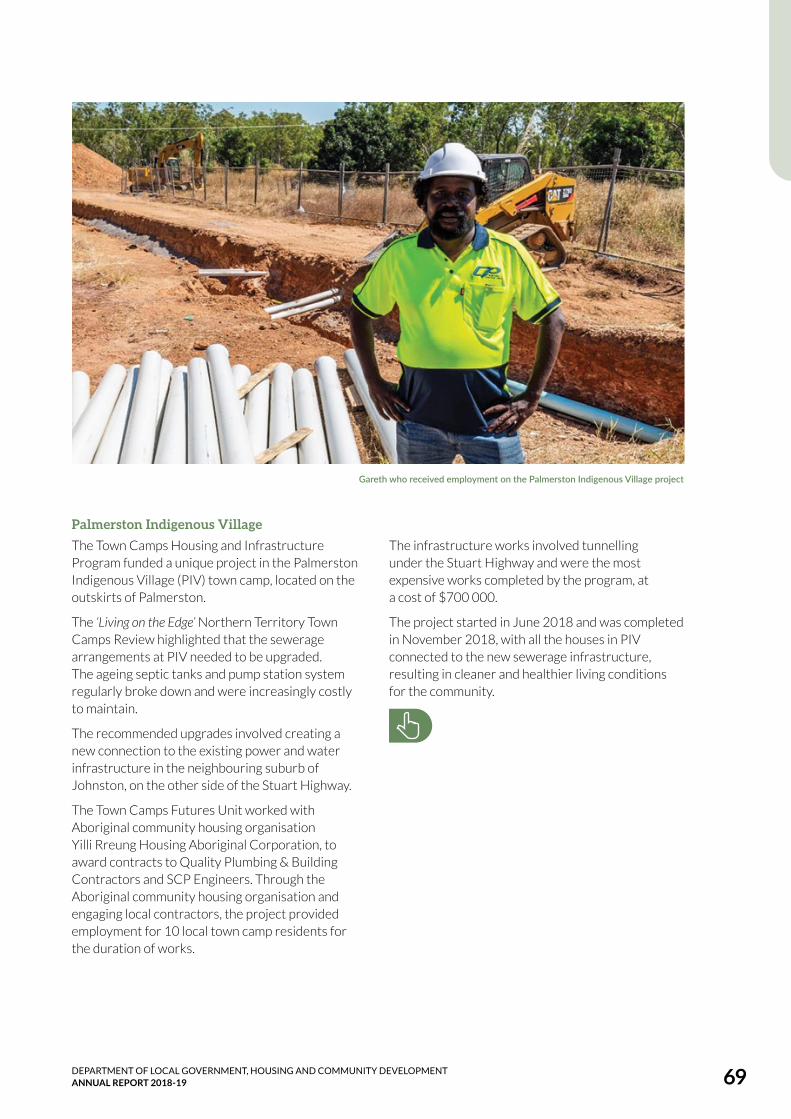
DEPARTMENT OF LOCAL GOVERNMENT, HOUSING AND COMMUNITY DEVELOPMENT ANNUAL REPORT 2018-19 69
Palmerston Indigenous Village The Town Camps Housing and Infrastructure Program funded a unique project in the Palmerston Indigenous Village (PIV) town camp, located on the outskirts of Palmerston.
The ‘Living on the Edge’ Northern Territory Town Camps Review highlighted that the sewerage arrangements at PIV needed to be upgraded. The ageing septic tanks and pump station system regularly broke down and were increasingly costly to maintain.
The recommended upgrades involved creating a new connection to the existing power and water infrastructure in the neighbouring suburb of Johnston, on the other side of the Stuart Highway.
The Town Camps Futures Unit worked with Aboriginal community housing organisation Yilli Rreung Housing Aboriginal Corporation, to award contracts to Quality Plumbing & Building Contractors and SCP Engineers. Through the Aboriginal community housing organisation and engaging local contractors, the project provided employment for 10 local town camp residents for the duration of works.
The infrastructure works involved tunnelling under the Stuart Highway and were the most expensive works completed by the program, at a cost of $700 000.
The project started in June 2018 and was completed in November 2018, with all the houses in PIV connected to the new sewerage infrastructure, resulting in cleaner and healthier living conditions for the community.
Gareth who received employment on the Palmerston Indigenous Village project

OUR PEOPLE AND ACHIEVEMENTS 70
LThe iAwards
Helen Fejo-Frith was thrilled to receive her keys from the contractor Jerry Rice
Through the Town Camps Housing and Infrastructure Program, houses were upgraded in the local Darwin community of Bagot.
Resident and member of the Bagot Advisory Group, Helen Fejo-Frith was excited to receive her keys after the upgrades. She said her house was like a palace compared to what it used to be.
‘After being in the house for 20 years and then all of a sudden you come up with a brand new house, and that’s what it is, I’m really over the moon about it’.
As well as housing, other infrastructure improvements occurred in Bagot including:
• new bollards around parks in the community
• arboreal safety clean up
• repair and upgrades to all street lighting
• refurbishment of the administration building
• resealing of all internal roads
• removing old water mains containing asbestos and replacing with new water infrastructure.
Jerry Rice from Dice Australia, who carried out the housing upgrades said that homes received new electrical work, plumbing, painting, windows, fly screens and security screens and doors, using local and Aboriginal tradespeople.
‘We virtually rebuilt the whole house, it’s brand new’, he said.
“We virtually rebuilt the whole house, it’s
brand new”
Bagot homes upgraded

DEPARTMENT OF LOCAL GOVERNMENT, HOUSING AND COMMUNITY DEVELOPMENT ANNUAL REPORT 2018-19 71
Housing Programs and Support Services
In 2018-19, the department added
7 social housing
head-leased dwellings to its stock
As a
t 30 June 2019, the department had
588 Industry Housing leases with non-government organisations and 68 with government organisations
and private enterprises
588 + 68
Housing Programs and Support Services provides support for the housing service delivery divisions and delivers significant Northern Territory wide housing projects and programs.
The division identifies housing supply opportunities and promotes home ownership through innovation and partnership with the private sector, strategic program development, asset repurposing, asset maintenance and management.
The division funds a number of non-government organisations to deliver accommodation and client services in urban and regional centres, supporting
vulnerable Territorians who are at risk of or would otherwise be homeless.
This division implements and manages housing support, compliance, intervention and public housing safety programs for tenants to provide integrated housing responses aligned to the department’s objectives, policies and legislation.
PHSOs also achieved a
92% response rate when responding to complaints of antisocial or disruptive behaviour
Grants were provided to 18 NGOs across urban
and regional areas in the Northern Territory, for the
delivery of 49 specialist homelessness services

OUR PEOPLE AND ACHIEVEMENTS 72
CAPABILITY DEVELOPMENTThe Capability Development branch provides training and ongoing support to service delivery staff so they understand internal systems, service delivery objectives and provide a high quality of service.
In 2018-19, 545 staff attended 85 training sessions including:
• Introduction to Tenancy Management System
• Acceptable Behaviour Agreement
• Transitional Accommodation.
HEAD LEASING AND PROJECTS
Industry Housing Assistance SchemeThe Industry Housing Assistance Scheme primarily supports non-government organisations to provide community and homelessness services and supported accommodation.
As at 30 June 2019, the department had 588 Industry Housing leases with non-government organisations and 68 with government organisations and private enterprises.
The department started 17 new leases with non-government organisations during 2018-19, including four with new organisations Eastern Regional Mental Health Association (ERMHA) Ltd and the Machado-Joseph Disease Foundation (MJD Foundation).
ERMHA delivers services through Industry Housing leases including coordinating specialist behaviour support, helping with daily living, travel and community participation targeted at high risk clients with complex needs.
The MJD Foundation introduced the MJD House, an initiative which provides short term respite to National Disability Insurance Scheme participants and their carers from remote communities. Through the two Industry Housing leases offered at 50% of the market rent, MJD Foundation estimates that 40 clients will benefit from much needed respite each year enabling them to return to their own home and remain in their communities longer.
Social Housing head-leasingThe social housing head-leasing strategy is an innovative method to increase the number of dwellings available to low income Territorians and families. The department offers long term leases to private sector property owners of existing or new constructions which are then subleased to tenants who qualify for public housing.
In 2018-19, the department added seven social housing head-leased dwellings to its stock and a further 24 dwellings were secured through agreements to lease, starting in 2019-20.
The department is negotiating for a further 110 head-leased dwellings with construction
anticipated to begin by June 2020.
National Rental Affordability SchemeThe National Rental Affordability Scheme (NRAS) is a partnership between the Australian Government and the states and territories to invest in affordable rental housing.
A total of 1007 dwellings across the Northern Territory are part of the scheme, including 173 that are part of the department’s affordable rental head-leasing program. During 2018-19, the department received a 14% increase in incentive payments from the previous financial year from the Australian Government, with 68% of the 173 NRAS dwellings eligible.
The scheme offers financial incentives to individuals and organisations to rent new dwellings to low and medium income households. The scheme runs for 10 years from the date the Australian Government approves the dwellings. Phasing out of financial incentive payments in the Northern Territory will occur from 2022 to 2026.

DEPARTMENT OF LOCAL GOVERNMENT, HOUSING AND COMMUNITY DEVELOPMENT ANNUAL REPORT 2018-19 73
Transfer of 18 Bernhard Street, Katherine to community housingAs part of a commitment made by the Northern Territory Government to increase the availability of community housing solutions across the Territory, the department sought submissions from community housing providers and non-government agencies for the lease and tenancy management services of the housing complex at 18 Bernhard Street, Katherine.
On 21 December 2018, the Bernhard Street
complex was transferred to the management and property maintenance services of St Vincent de Paul who was the successful proponent.
Since taking on management of the complex, St Vincent de Paul has provided wrap around services to the tenants and the organisation has a visible and regular presence on the site.
On 1 May 2019, a memorandum of understanding between St Vincent de Paul and Katherine Senior Citizens Association Incorporated was signed for the use of the community hall at the complex.
HOMELESS PROGRAMS AND SUPPORTThe Northern Territory Government is committed to supporting vulnerable Territorians and providing access to sustainable accommodation options and specialist homelessness support services.
During the 2018-19 financial year, $23.3 million was allocated to housing and homelessness support programs delivered by non-government organisations (NGOs).
Grants were provided to 18 NGOs across urban and regional areas in the Northern Territory, for the delivery of 49 specialist homelessness services, most through ongoing five-year funding agreements.
Funding is allocated to ensure the delivery of services in two key areas:
• Accommodation management services to support crisis, short term or transitional housing needs
• Support services, which consist of outreach, case management and support to individuals and families to sustain tenancies.
Smaller one-off grant funds were also made available to help with new initiatives, which included:
• Support for Mission Australia to implement a Housing for Young People Program in the Greater Darwin region supporting those aged 18 to 25 years who are leaving, or who have already left the care of the Chief Executive Officer, Territory Families.
• One-off funding to NT Shelter to continue the Homelessness Response Group for a further three years. The service focuses on addressing the needs of homeless clients in Darwin who require complex multi-service support. The grant also enables the service to be extended to clients in Alice Springs.
• Funding to NT Shelter to support sector capacity development by helping 56 eligible participants attend the National Housing Conference held in the Northern Territory for the first time from 27 to 30 August 2019.

OUR PEOPLE AND ACHIEVEMENTS 74
PUBLIC HOUSING SAFETYPublic Housing Safety Officers (PHSOs) play a key role in promoting community safety and managing disruptive and antisocial behaviour in and around public housing.
In 2018-19, PHSOs responded to more than 4100 incidents of antisocial behaviour across the Northern Territory and seized or tipped out a total of 345 litres of alcohol during these incidents.
PHSOs also achieved a 92% response rate when responding to complaints of antisocial or disruptive behaviour, exceeding designated timeframes.
Throughout the year, officers worked closely with Northern Territory Police, conducting joint patrols to deter antisocial and criminal behaviour, and collaborated with local councils, government agencies and community organisations to promote community safety.
Officers are also trained in Crime Prevention Through Environmental Design, enabling them to complete assessments of public housing properties and make recommendations to improve safety.
New Public Housing Safety Officers in Katherine and Tennant Creek
An additional six Public Housing Safety Officer positions were recently created to expand the Public Housing Safety Strategy to other urban locations across the Northern Territory.
Officers now operate in Darwin and Alice Springs, and permanent patrols began on 18 September 2018 in Katherine and on 25 September 2018 in Tennant Creek.
Public Housing Safety Officers play a key role in promoting community safety
PLANNING AND HOUSING SUPPLYIn 2018-19, the department oversaw the construction and completion of eight new public housing dwellings across the Northern Territory. Six of these dwellings were delivered in a single modern complex in the Palmerston suburb of Zuccoli and the remaining two were delivered in Darwin’s northern suburbs of Wagaman and Tiwi.
There were also 23 new replacement urban public housing dwellings constructed throughout the Northern Territory in Darwin, Alice Springs, Tennant Creek and Katherine.
All dwellings are a fit-for-purpose construction, that support current needs with a view to long term accessibility and usability as tenants age.
DEPARTMENT OF LOCAL GOVERNMENT, HOUSING AND COMMUNITY DEVELOPMENT ANNUAL REPORT 2018-19 75
Construction of John Stokes Square precinct began in June 2019 and will see the existing 75 public housing dwellings replaced with 78 new homes in an attractive, modern design.
The new residences are designed for seniors and disability support and capable of supporting a wide range of tenants regardless of their age and ability, and are easily adaptable to meet specific tenant needs. Non-government organisation accommodation will be provided onsite for local support.
The project includes a new 24-hour purpose built police station and a pedestrian friendly link between the Nightcliff Village and Nightcliff Shopping Centre.
Construction is expected to be completed by late 2020.
Redevelopment of John Stokes Square
CLIENT RELATIONS AND COMPLIANCEThe department’s Client Relations unit supports operational housing service delivery across the following key areas of service:
• Complaints – management of antisocial behaviour and general complaints lodged via the call centre, by online submission or email.
• Third Party Advocates enquiries – management of enquiries made to the department by legal advocates or other third parties on behalf of a mutual client.
• First Tier Appeals – independent review of decisions made by the department relating to the delivery of public housing services.
• Compliance – commences, responds to and manages actions taken by either a tenant or landlord in relation to non-compliance of public housing tenancy agreements and breaches of the Residential Tenancies Act 1999 or the Housing Act 1982.
During 2018-19, the Client Relations Call Centre received 6768 calls. Of these, 4920 calls related to the public housing safety strategy and 1848 calls were general enquiries, complaints or housing advocate enquiries.
The Client Relations unit responded to:
• 1792 complaints regarding disruptive or antisocial behaviour at public housing premises that were subsequently investigated by Public Housing Safety Officers
• 810 general housing related complaints
• 709 enquiries from third party advocates
• 444 compliance requests
• 94 appeal applications.

OUR PEOPLE AND ACHIEVEMENTS 76
Capital works expenditureThe table below details expenditure against the Department’s capital programs for the 2018-19 financial year.
2018-19 Original Program
$’000
2018-19 Revised Program
$’000
2018-19 Final Cash budget
$’000
2018-19 Actual expenditure
$’000
Major New Works 615 814 541 882 258 465 216 176
Public housing 1 42 548 105 027 35 657 33 458
Government employee housing 10 474 9 629 5 537 3 949
Aboriginal housing and infrastructure 2 562 792 426 550 217 271 178 176
Construct and refurbish remote morgues 676 91% 593
Minor New Works 21 972 68 030 45 351 60 227
Public housing 3 18 441 64 499 42 265 56 468
Government employee housing 3 086 3 086 3 086 3 590
Other 445 445 169
Total Capital Works 637 786 609 912 303 816 276 403
Public housing 60 989 169 526 77 922 89 926
Government employee housing 13 560 12 715 8 623 7 539
Aboriginal housing and infrastructure 562 792 426 550 217 271 178 176
Construct and refurbish remote morgues 676 593
Other 445 445 169
1 Increase in program reflects government’s $100 million stimulus program.2 Program reduced due to delays in finalising agreement with the Australian Government for matching funding for remote housing.3 Minor New Works for public housing exceeded cash budget due to higher than anticipated vacate rate.

CORPORATEAND GOVERNANCE 3
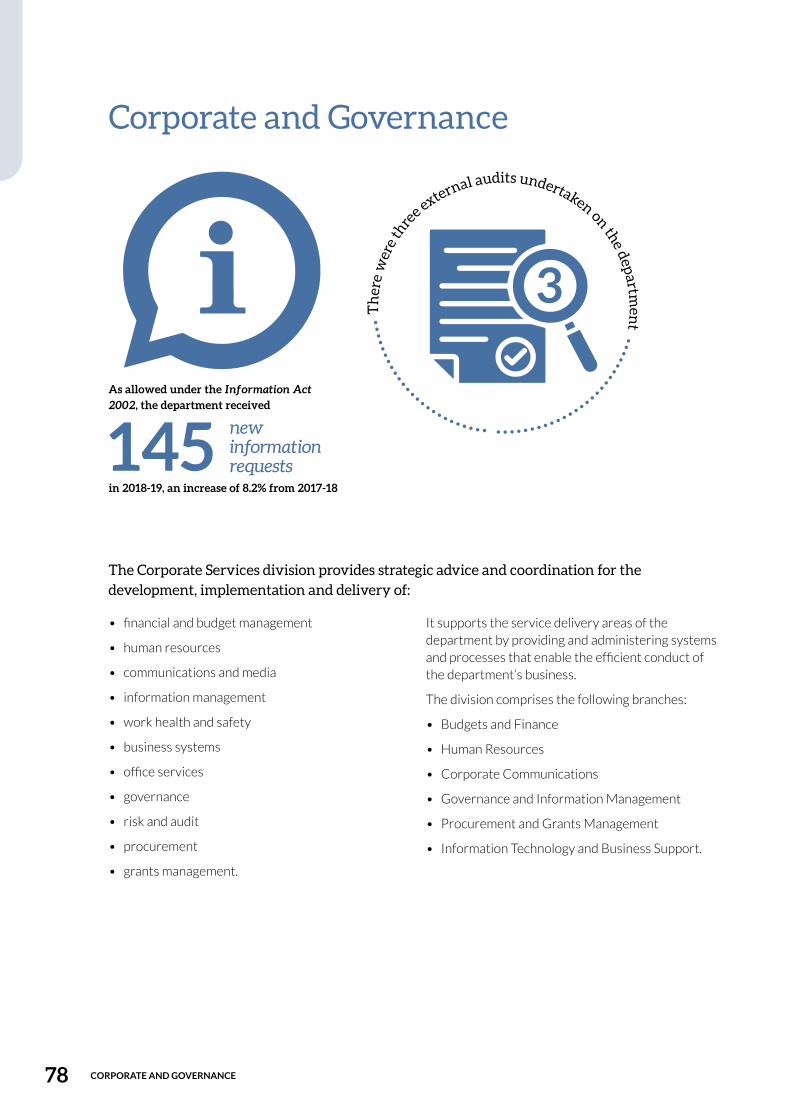
78 CORPORATE AND GOVERNANCE
Corporate and Governance
The Corporate Services division provides strategic advice and coordination for the development, implementation and delivery of:
• financial and budget management
• human resources
• communications and media
• information management
• work health and safety
• business systems
• office services
• governance
• risk and audit
• procurement
• grants management.
It supports the service delivery areas of the department by providing and administering systems and processes that enable the efficient conduct of the department’s business.
The division comprises the following branches:
• Budgets and Finance
• Human Resources
• Corporate Communications
• Governance and Information Management
• Procurement and Grants Management
• Information Technology and Business Support.
The
re w
ere t
hre
e external audits undertaken on the department
3
As allowed under the Information Act 2002, the department received
145 new information requests
in 2018-19, an increase of 8.2% from 2017-18

DEPARTMENT OF LOCAL GOVERNMENT, HOUSING AND COMMUNITY DEVELOPMENT ANNUAL REPORT 2018-19 79
GROUPS AND COMMITTEESThe department’s corporate objective is to deliver strong and efficient operational services which is achieved through a solid governance foundation.
As part of ensuring effective operations through sound business practices, the department invested in developing the expertise of its senior leaders and staff and maintained a strong focus on leadership and governance through a range of high level committees and working groups.
Senior Executive GroupThe Senior Executive Group holds daily meetings to consider the department’s strategic priorities and critical issues, as well as key whole-of-government matters.
The group comprises:
• Chief Executive Officer
• Deputy Chief Executive Officer Housing Services, Local Government and Community Development
• Deputy Chief Executive Officer Remote Program Delivery Office and Community Services
• Executive Director Corporate Services
• Senior Director of the Office of the Chief Executive.
Executive Management BoardThe Executive Management Board monitors the department’s performance across finance, people, procurement and ministerial indicators.
The board evaluates the reporting of key data to provide informed risk management practices.
It also shares appropriate information and reviews high level policies and strategic documentation, ensuring they are fit for purpose, reflect best practice and support future departmental direction.
Risk and Audit CommitteeThe Risk and Audit Committee provides objective assurance and assistance allowing the Chief Executive Officer to meet responsibilities under relevant legislation.
The committee is independently chaired and oversees the department’s governance framework. This involves developing governance, risk management and audit policies, setting strategic direction and reviewing and endorsing best practice initiatives consistent with business objectives.
Finance subcommitteeThe Finance subcommittee monitors the implementation of strategic budget objectives and the financial performance against those objectives.
It ensures reporting of financial achievements and emerging budget risks are made to the Executive Management Board and can recommend corrective action to ensure the fiscal objectives were met.
Chaired by the Chief Financial Officer, the subcommittee comprises:
• Deputy Chief Executive Officer Housing Services, Local Government and Community Development
• Deputy Chief Executive Officer Remote Program Delivery Office and Community Services
• Executive Director Corporate Services.
Executive Strategic Operational GroupThe Executive Strategic Operational Group:
• advises the Chief Executive Officer on the strategic direction of the department
• leads the delivery of cross-agency and whole-of-government priorities
• ensures the implementation and achievement of the department’s performance measures as set out in the Corporate Plan and Purpose and Direction Strategy.
Optimisation CommitteeThe Optimisation Committee is a sub-committee of the department’s Executive Management Board. The committee has been established to drive improvement primarily in the housing service operations of the organisation through:
• improved processes and documentation to create efficiencies
• better use of technology and business intelligence to support improved practise
• alignment to address the department’s priorities
• relevant training for staff to deliver our business.
Information Management Governance CommitteeThe Information Management Governance Committee oversees project proposals and business cases in line with departmental strategic priorities. It monitors project risks in information and communications technology and business systems.

80 CORPORATE AND GOVERNANCE
In the reporting period the committee focused on ASNEX, Tenancy Management System (TMS) and the e-Tenant projects that delivered public housing safety, tenancy and asset management business improvements.
Department and Union Consultative CommitteeThe Department and Union Consultative Committee provides a forum for consultation and negotiation between the department and unions on issues of mutual concern.
The committee is chaired by the Executive Director Corporate Services, with the Director Human Resources as deputy chair.
The committee comprises:
• Manager Human Resources
• up to four union delegates
• up to four nominated staff representatives.
Change Management CommitteeThe Change Management Committee oversees the implementation of significant changes and monitors communications and consultation, organisation and workforce development, employee support and resourcing.
It is responsible for reviewing proposed organisational changes and job profiles to ensure alignment with departmental operations.
The committee reports to senior management and is made up of staff from across the department and includes at least one member from a regional centre.
Work Health and Safety Steering CommitteeThe Work Health and Safety Steering Committee ensures consultation and communication occurs and staff concerns are considered in all Work Health and Safety matters.
The primary focus of the committee is to ensure safety and environment considerations are prominent in all departmental decisions and helps develop, review and communicate Work Health and Safety related practices, procedures and policies.
Work Health and Safety Worksite committeesThe Work Health and Safety Worksite committees identify local work, health and safety risks and implement policies and practices that mitigate risks.
The committees provided a forum to effectively address matters arising at departmental worksites and make recommendations to the Work Health and Safety Steering Committee.

DEPARTMENT OF LOCAL GOVERNMENT, HOUSING AND COMMUNITY DEVELOPMENT ANNUAL REPORT 2018-19 81
COMPLIANCE FRAMEWORKIn line with compliance requirements of the Information Act 2002, internal and external audits are regularly undertaken as part of the department’s governance and compliance framework. Audits ensure compliance with legislation, the Treasurer’s Directions and department policies and procedures.
Internal auditsIn 2018-19, there were two internal audits carried out by the department:
• Travel Audit
• Value for Territory Audit.
External auditsExternal audits are those undertaken by the NT Auditor General or initiated by external bodies. The following external audits were undertaken in 2018 -19:
• NT Home Ownership Interim Financial Statement
• Agency Compliance Audit
• Data Analytic Review of Expenditure.
Compliance with the Information Act The department, its staff and service providers comply with the requirements of the Information Act 2002 by securing, recording and retaining required information.
It specifically complies with:
• Records Management Standards for Public Sector Organisations in the Northern Territory
• Part 9 of the Information Act 2002
• the Information Privacy Principles as described by the Information Commissioner Northern Territory.
Under legislation and information sharing arrangements the department provides information to help law enforcement agencies, animal welfare inspectors and council rangers.
The department also provides investigative support where required to the Office of the Coroner, Ombudsman NT, Territory Families, and local, state and federal courts.
Applications under the Information ActAs allowed under the Information Act 2002, the department received 145 new information requests in 2018-19, an increase of 8.2% from 2017-18.
Most requests were for personal information relating to tenancies, with most of these being from legal advocates and other organisations helping clients access their personal information.
Applications under the Information Act 2002 2018-19 2017-18
Accepted applications outstanding at start of year 0 0
Applications received to correct personal information 0 0
Applications received to access personal information 143 128
Applications received to access government information 2 5
Applications received to access personal and government information 0 1
TOTAL RECEIVED TO 30 JUNE 2019 145 134
Application Outcomes 128
Accepted applications withdrawn 1 3
Applications transferred 0 0
Unaccepted applications – pending acceptance 0 0
Applications completed 144 131
Open applications 0 0
TOTAL OUTCOMES TO 30 JUNE 2019 145 134

82 CORPORATE AND GOVERNANCE
This page left intentionally blank

FINANCIALREPORTS 4

FINANCIAL REPORTS84
Financial ReportsThe Department of Local Government, Housing and Community Development provides accommodation pathways, housing options and client support for those in need, empowers and supports communities to grow through respectful engagement, including through the delivery of interpreting and translating services. The department also delivers remote essential services and land tenure outcomes, provides funding and support to the local government sector and helps with homelands services.
The department’s financial performance for the year and its financial position as at 30 June 2019 are reported in the following financial statements and consist of a Comprehensive Operating Statement, Balance Sheet, Statement of Changes in Equity, and Cash Flow Statement, and the notes accompanying these statements.
The department’s output groups are Local Government, Housing and Community Development and Corporate and Governance. Note 3 of the financial statements outlines the Comprehensive Operating Statement by output groups.
SUMMARY OF FINANCIAL PERFORMANCE The department reports an operating deficit of $258 million against a budgeted deficit of $165 million. Deficit results were planned as depreciation expenses ($130 million budget and $134 million actual result) are not funded through Output Appropriation under the Territory’s Financial Management Framework. The deficit also includes write downs of the book value of remote and urban dwellings that have been demolished (for
replacement), re-categorisation of capital works program expenditure to capital grants, and non-cash expenses relating to capital works expenditure that did not meet the department’s capitalisation criteria. Note 28 outlines the original budget against the actual result for the year.
The department’s overall Comprehensive Result of $322 million deficit includes $64 million related to revaluation of assets (revaluation decrement for the year).
50
150
250
350
450
550
650
750
850
DeficitTotal ExpensesTotal Income
$ M
ILLI
ON
Actual Original Budget
543
447
801
612
258
165

DEPARTMENT OF LOCAL GOVERNMENT, HOUSING AND COMMUNITY DEVELOPMENT ANNUAL REPORT 2018-19 85
Operating revenue received for the financial year was $543 million. This included goods and services revenue of $90 million from housing tenancy charges and income earned from language interpreter services.
The department remains dependent on government appropriations with the Northern Territory Government contributing $312 million and the Australian Government $91 million. A further $38 million in grants was received from the Commonwealth Government.
The department’s operating expenses were $801 million. The payment of grants and subsidies contributed to 51% ($408 million) of total operating expenses. These were largely grants to local councils, government and non-government organisations for the provision of services, capital works and included property and tenancy management services to remote communities, including repairs and maintenance.
Employee expense was 9% ($72 million) of total operating expenses, with purchase of goods and services expenditure being $22 million. Interest expense from borrowings and finance leases was $10 million.
The remainder of operational expenses were directly related to expenses on the department’s housing assets, these being repairs and maintenance of $50 million, and property management of $61 million. An additional $57 million was spent on remote housing repairs and maintenance and property management. This was classified as current grants expenditure as outlined above.
Non-cash asset expenses were $160 million including $134 million in depreciation and amortisation charges across the urban and remote housing portfolio.
Operating revenue 2018-19 Operating expenses 2018-19
COMPREHENSIVE OPERATING STATEMENT
$543M
NT Output Appropriation
$312M
$91M
$90M
$38M
$12M
Commonwealth Appropriation
Other Revenue
Grants and Subsidies
Goods and Services Revenue
$801M
Grants and Subsidies
$408M
$10M
Interest Expenses
Employee Expenses
Repairs and Maintenance
Property Management
Purchase of Goods and Services
Asset Expenses
Other Expenses
$72M
$50M
$61M
$160M
$22M
$18M

FINANCIAL REPORTS86
BALANCE SHEETThe Balance Sheet shows the department’s net worth and financial position. The department held total assets worth $3.2 billion at 30 June 2019, consisting mainly of $3.1 billion (2018: $3.1 billion) of public housing assets.
Total liabilities is $118 million, which consists largely of borrowings from the NT Treasury Corporation.
CASH FLOW STATEMENTThe Statement of Cash Flows represents cash received and used during the year from department’s operating, investing and financing activities. As at 30 June 2019, the department held $33.2 million (2018; $105.7 million) in cash and deposits. In 2018-19, the department spent $230 million in capital works, upgrading dwellings and building new dwellings largely funded through Northern Territory and Commonwealth capital appropriation.
0
800
1 600
2 400
3 200
20182019
Urban land Urban buildings Remote buildings
707
$ M
ILLI
ON
732
709 695
1 660 1 658
DEPARTMENT OF LOCAL GOVERNMENT, HOUSING AND COMMUNITY DEVELOPMENT ANNUAL REPORT 2018-19 87
DEPARTMENT OF LOCAL GOVERNMENT, HOUSING AND COMMUNITY DEVELOPMENT
FINANCIAL REPORT
CERTIFICATION OF THE FINANCIAL STATEMENTSWe certify that the attached financial statements for the Department of Local Government, Housing and Community Development have been prepared from the proper accounts and records in accordance with the prescribed format, the Financial Management Act 1995 and Treasurer’s Directions.
We further state that the information set out in the Comprehensive Operating Statement, Balance Sheet, Statement of Changes in Equity, Cash Flow Statement, and notes to and forming part of the financial statements, presents fairly the financial performance and cash flows for the year ended 30 June 2019 and the financial position on that date.
At the time of signing, we are not aware of any circumstances that would render the particulars included in the financial statements misleading or inaccurate.

FINANCIAL REPORTS88
COMPREHENSIVE OPERATING STATEMENTFor the year ended 30 June 2019
NOTE 2019 2018
$000 $000
INCOME
Grants and subsidies revenue
Current 37 728 36 134
Capital - 5 000
Appropriation
Output 311 795 308 269
Commonwealth 90 906 72 305
Sales of goods and services 90 096 82 087
Goods and services received free of charge 4 9 937 8 854
Other income 2 248 2 346
TOTAL INCOME 3 542 710 514 995
EXPENSES
Employee expenses 71 858 64 915
Administrative expenses
Purchases of goods and services 5 21 640 20 452
Repairs and maintenance 6 49 948 49 536
Property management 61 073 58 162
Depreciation and amortisation 133 783 130 983
Asset expenses 7 25 914 11 991
Other administrative expenses1 8 17 999 14 291
Grants and subsidies expenses
Current 291 013 268 131
Capital 113 772 47 365
Community service obligations 3 414 3 455
Interest expenses 9 10 282 10 586
Loss on disposal of assets 10 158 2 656
TOTAL EXPENSES 3 800 854 682 523
NET SURPLUS/(DEFICIT) (258 144) (167 528)
OTHER COMPREHENSIVE INCOME Items that will not be reclassified to net deficit
Changes in asset revaluation surplus (63 993) (173 822)
TOTAL OTHER COMPREHENSIVE INCOME (63 993) (173 822)
COMPREHENSIVE RESULT (322 137) (341 350)
1Includes DCIS service charges
The Comprehensive Operating Statement is to be read in conjunction with the notes to the financial statements.

DEPARTMENT OF LOCAL GOVERNMENT, HOUSING AND COMMUNITY DEVELOPMENT ANNUAL REPORT 2018-19 89
BALANCE SHEETAs at 30 June 2019
NOTE 2019 2018
$000 $000
ASSETS
Current Assets
Cash and deposits 12 33 185 105 706
Receivables 14 15 575 14 539
Prepayments 4 450 2 581
Advances - 667
Total Current Assets 53 210 123 493
Non-Current Assets
Property, plant and equipment 15, 22 3 145 801 3 155 428
Leased property, plant and equipment 15 22 655 22 499
Total Non-Current Assets 3 168 455 3 177 927
TOTAL ASSETS 3 221 665 3 301 420
LIABILITIES
Current Liabilities
Deposits held 19 431 402
Payables 16 7 225 10 783
Borrowings and advances 17 3 276 2 893
Provisions 18 8 762 8 205
Other liabilities 19 3 720 5 326
Total Current Liabilities 23 414 27 609
Non-Current Liabilities
Borrowings and advances 17 89 536 92 019
Deposits held 19 5 466 5 276
Total Non-Current Liabilities 95 002 97 295
TOTAL LIABILITIES 118 416 124 904
NET ASSETS 3 103 249 3 176 516
EQUITY
Capital 2 276 762 2 024 458
Asset revaluation reserve 21 1 478 174 1 561 258
Accumulated funds (651 687) (409 200)
TOTAL EQUITY 3 103 249 3 176 516
The Balance Sheet is to be read in conjunction with the notes to the financial statements.

FINANCIAL REPORTS90
STATEMENT OF CHANGES IN EQUITYFor the year ended 30 June 2019
NOTE EQUITY AT 1 JULY COMPREHENSIVE
RESULT
TRANSACTIONS WITH OWNERS IN THEIR CAPACITY
AS OWNERSEQUITY AT
30 JUNE
$000 $000 $000 $000
2018-19
Accumulated Funds (409 200) (258 144) - (667 343)
Changes in accounting policy - adoption of AASB 9
2.b (3 436) (3 436)
Transfers from reserves - 19 092 - 19 092
(412 636) (239 051) - (651 687)
Asset Revaluation Reserve 21 1 561 258 (83 084) - 1 478 174
Transfers to accumulated funds - - - -
1 561 258 (83 084) - 1 478 174
Capital – Transactions with Owners 2 024 457 - - 2 024 457
Equity injections
Capital appropriation - - 140 506 140 506
Equity transfers in - - 85 85
Other equity injections - - 27 000 27 000
National partnership payments - - 85 469 85 469
Equity withdrawals
Capital withdrawal - - - -
Equity transfers out - - (755) (755)
2 024 457 - 252 305 2 276 762
Total Equity at End of Financial Year 3 173 079 (322 135) 252 305 3 103 249
NOTE EQUITY AT 1 JULY COMPREHENSIVE
RESULT
TRANSACTIONS WITH OWNERS IN THEIR CAPACITY
AS OWNERSEQUITY AT
30 JUNE
$000 $000 $000 $000
2017-18
Accumulated Funds (262 009) (167 528) - (429 537)
Transfers from reserves - 20 338 - 20 338
(262 009) (147 191) - (409 200)
Asset Revaluation Reserve 21 1 755 418 (194 160) - 1 561 258
Transfers to accumulated funds - - - -
1 755 418 (194 160) - 1 561 258
Capital – Transactions with Owners 1 955 920 - - 1 955 920
Equity injections
Capital appropriation - - 39 956 39 956
Equity transfers in - - 359 359
Other equity injections - - - -
National partnership payments - - 28 621 28 621
Equity withdrawals
Capital withdrawal - - (398) (398)
Equity transfers out - - - -
1 955 920 - 68 537 2 024 457
Total Equity at End of Financial Year 3 449 329 (341 351) 68 537 3 176 515
The Statement of Changes in Equity is to be read in conjunction with the notes to the financial statements.
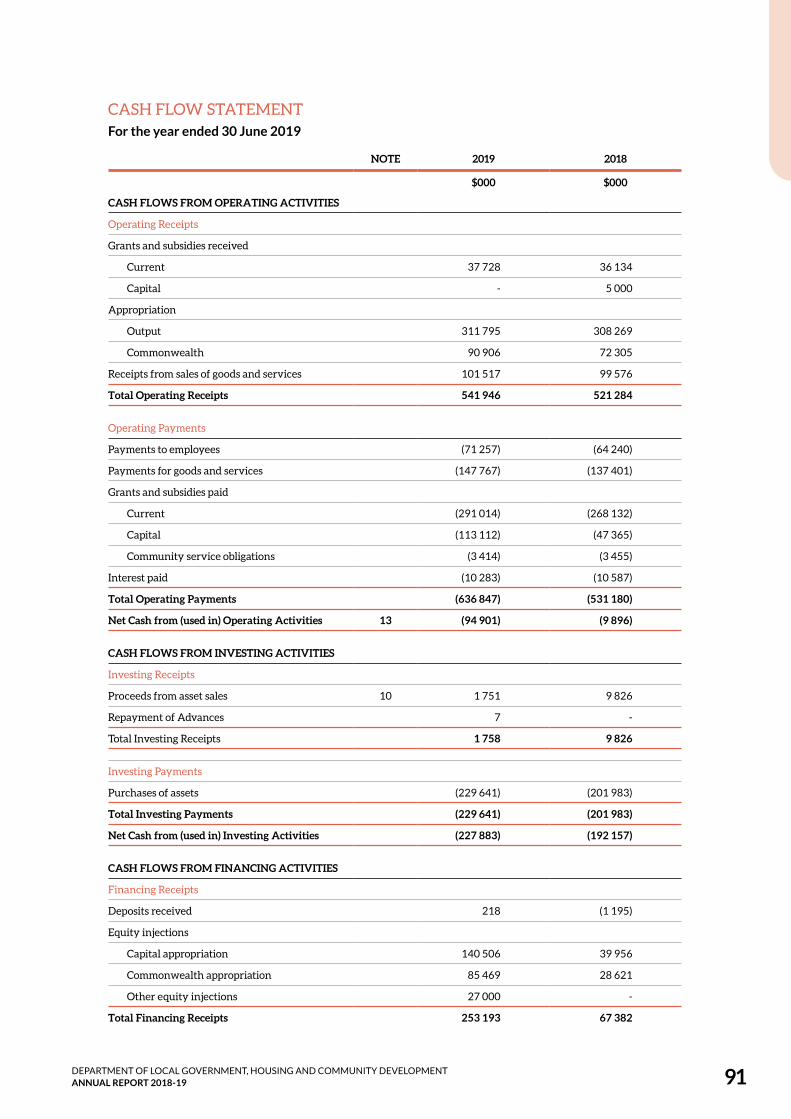
DEPARTMENT OF LOCAL GOVERNMENT, HOUSING AND COMMUNITY DEVELOPMENT ANNUAL REPORT 2018-19 91
CASH FLOW STATEMENTFor the year ended 30 June 2019
NOTE 2019 2018
$000 $000
CASH FLOWS FROM OPERATING ACTIVITIES
Operating Receipts
Grants and subsidies received
Current 37 728 36 134
Capital - 5 000
Appropriation
Output 311 795 308 269
Commonwealth 90 906 72 305
Receipts from sales of goods and services 101 517 99 576
Total Operating Receipts 541 946 521 284
Operating Payments
Payments to employees (71 257) (64 240)
Payments for goods and services (147 767) (137 401)
Grants and subsidies paid
Current (291 014) (268 132)
Capital (113 112) (47 365)
Community service obligations (3 414) (3 455)
Interest paid (10 283) (10 587)
Total Operating Payments (636 847) (531 180)
Net Cash from (used in) Operating Activities 13 (94 901) (9 896)
CASH FLOWS FROM INVESTING ACTIVITIES
Investing Receipts
Proceeds from asset sales 10 1 751 9 826
Repayment of Advances 7 -
Total Investing Receipts 1 758 9 826
Investing Payments
Purchases of assets (229 641) (201 983)
Total Investing Payments (229 641) (201 983)
Net Cash from (used in) Investing Activities (227 883) (192 157)
CASH FLOWS FROM FINANCING ACTIVITIES
Financing Receipts
Deposits received 218 (1 195)
Equity injections
Capital appropriation 140 506 39 956
Commonwealth appropriation 85 469 28 621
Other equity injections 27 000 -
Total Financing Receipts 253 193 67 382

FINANCIAL REPORTS92
NOTE 2019 2018
$000 $000
Financing Payments
Repayment of borrowings (2 592) (2 279)
Finance lease payments ( 338) (299)
Equity withdrawals - (398)
Total Financing Payments ( 2 930) (2 976)
Net Cash from (used in) Financing Activities 250 263 64 406
Net increase (decrease) in cash held (72 521) (137 647)
Cash at beginning of financial year 105 706 243 353
CASH AT END OF FINANCIAL YEAR 12 33 185 105 706
The Cash Flow Statement is to be read in conjunction with the notes to the financial statements.
CASH FLOW STATEMENTFor the year ended 30 June 2019
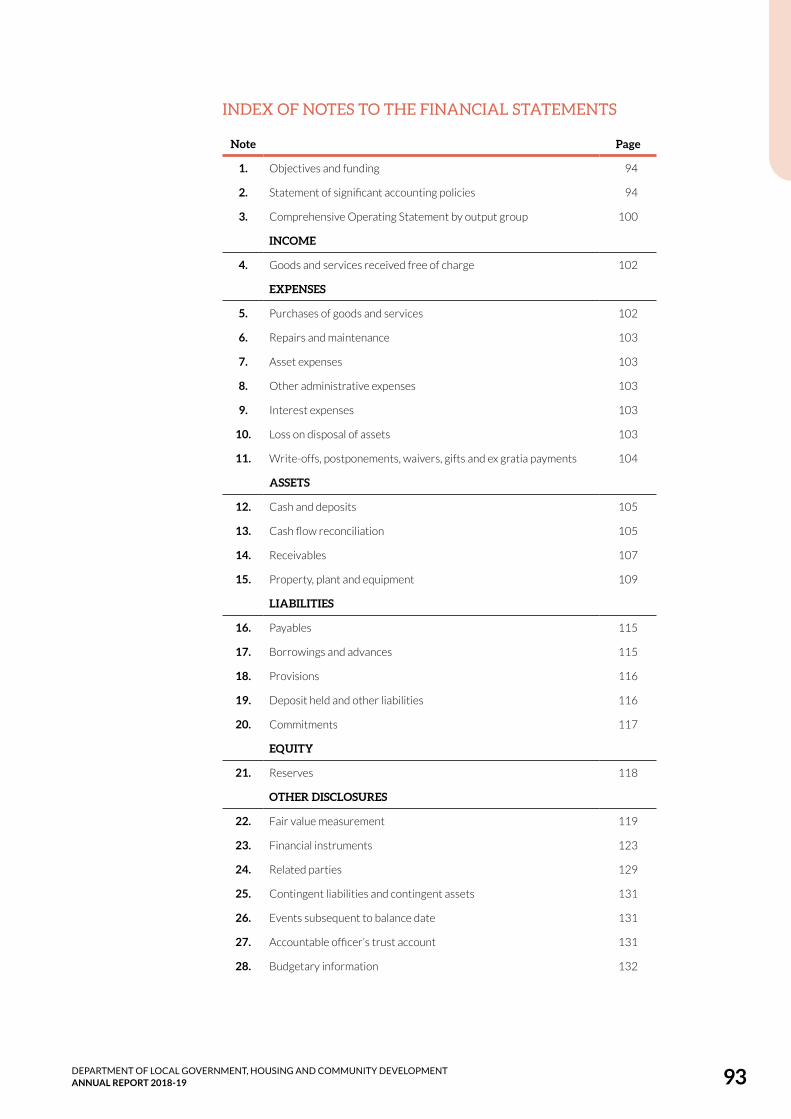
DEPARTMENT OF LOCAL GOVERNMENT, HOUSING AND COMMUNITY DEVELOPMENT ANNUAL REPORT 2018-19 93
INDEX OF NOTES TO THE FINANCIAL STATEMENTS
Note Page
1. Objectives and funding 94
2. Statement of significant accounting policies 94
3. Comprehensive Operating Statement by output group 100
INCOME
4. Goods and services received free of charge 102
EXPENSES
5. Purchases of goods and services 102
6. Repairs and maintenance 103
7. Asset expenses 103
8. Other administrative expenses 103
9. Interest expenses 103
10. Loss on disposal of assets 103
11. Write-offs, postponements, waivers, gifts and ex gratia payments 104
ASSETS
12. Cash and deposits 105
13. Cash flow reconciliation 105
14. Receivables 107
15. Property, plant and equipment 109
LIABILITIES
16. Payables 115
17. Borrowings and advances 115
18. Provisions 116
19. Deposit held and other liabilities 116
20. Commitments 117
EQUITY
21. Reserves 118
OTHER DISCLOSURES
22. Fair value measurement 119
23. Financial instruments 123
24. Related parties 129
25. Contingent liabilities and contingent assets 131
26. Events subsequent to balance date 131
27. Accountable officer’s trust account 131
28. Budgetary information 132

FINANCIAL REPORTS94
1. OBJECTIVES AND FUNDINGThe Department of Local Government, Housing and Community Development (the department) provides accommodation pathways, housing options and client support for those in need, empowers and supports communities to grow through respectful engagement, including through the delivery of interpreting and translating services, delivers remote essential services and land tenure outcomes, and provides funding and support to the local government sector, and assists with homelands services.
Additional information in relation to the Department of Local Government, Housing and Community Development and its principal activities may be found in the performance section of the Annual Report.
The Department is predominantly funded by, and is dependent on, the receipt of Parliamentary appropriations. Approximately seventeen per cent of all operating revenue is collected from tenants and the public. The financial statements encompass all funds through which the agency controls resources to carry on its functions and deliver outputs. For reporting purposes, outputs delivered by the agency are summarised into two output groups:
• Local Government, Housing and Community Development output group with the following outputs:
• Housing Services Delivery
• Remote Program Delivery office
• Community Services
• Local Government and Community Development
• Corporate and Governance outgroup with the following output:
• Corporate and Governance
• Shared Services Received
Note 3 provides summary financial information in the form of a Comprehensive Operating Statement by output group.
2. STATEMENT OF SIGNIFICANT ACCOUNTING POLICIES
a) Statement of complianceThe financial statements have been prepared in accordance with the requirements of the Financial Management Act 1995 and related Treasurer’s Directions. The Financial Management Act 1995 requires the Department of Local Government, Housing and Community Development to prepare financial statements for the year ended 30 June based on the form determined by the Treasurer. The form of agency financial statements is to include:
(i) a certification of the financial statements
(ii) a Comprehensive Operating Statement
(iii) a Balance Sheet
(iv) a Statement of Changes in Equity
(v) a Cash Flow Statement
(vi) applicable explanatory notes to the financial statements.
b) Basis of accountingThe financial statements have been prepared using the accrual basis of accounting, which recognises the effect of financial transactions and events when they occur, rather than when cash is paid out or received. As part of the preparation of the financial statements, all intra agency transactions and balances have been eliminated.
Except where stated, the financial statements have also been prepared in accordance with the historical cost convention.

DEPARTMENT OF LOCAL GOVERNMENT, HOUSING AND COMMUNITY DEVELOPMENT ANNUAL REPORT 2018-19 95
The form of the agency financial statements is also consistent with the requirements of Australian Accounting Standards. The effects of all relevant new and revised Standards and Interpretations issued by the Australian Accounting Standards Board (AASB) that are effective for the current annual reporting period have been
evaluated.
Standards and interpretations effective from 2018-19The following new and revised accounting standards and interpretations were effective for the first time in 2018-19:
AASB 9 Financial InstrumentsThe agency applied AASB 9 for the first time in 2018-19. AASB 9 Financial Instruments replaces AASB 139 Financial Instruments: Recognition and Measurement for annual periods beginning on or after 1 January 2018. The agency has not restated the comparative information, which continues to be reported under AASB 139. Where applicable, differences arising from the adoption of AASB 9 have been recognised directly in accumulated funds and other components of equity. The nature and effect of the changes as a result of adoption of this new accounting standard are described below.
Classification and measurement
Financial instruments have been reclassified into one of three measurement bases – amortised cost, fair value through other comprehensive income (FVOCI) and fair value through profit or loss (FVTPL). The classification of these instruments is based on the Agency’s business model for managing the financial assets and the contractual terms of the cash flows.
The classification and measurement requirements of AASB 9 did not have a significant impact to the agency. The following are the changes in the classification of the financial assets:
• The agency’s debt instruments are comprised of receivables, advances paid. These assets were classified as Loans and Receivables as at 30 June 2018 under AASB 139 and were measured at amortised cost. As these assets are held to collect contractual cash flows that are solely payments of principal and interest, they continue to be measured at amortised cost from 1 July 2018.
The agency has not designated any financial liabilities as at fair value through profit or loss. There are no changes in classification and measurement for the agency’s financial liabilities.
In summary, upon the adoption of AASB 9, the agency had the following reclassifications as at 1 July 2018:
AASB 9 CATEGORIES Balances at 1 July 2018
Balances at 30 June 2018
Fair value through profit or loss
Amortised costFair value
through OCIMandatorily at fair value
Designated at fair value
AASB 139 categories $000 $000 $000 $000 $000
Loans and receivables
Receivables1 14 539 - - 11 103 -
Advances paid 667 - - 667 -
15 206 - - 11 770 -
1The change in carrying amount is a result of re-measurement adjustments for impairment. See discussion on impairment below.
Impairment
The adoption of AASB 9 requires the loss allowance to be measured using a forward-looking expected credit loss (ECL) approach, replacing AASB 139’s incurred loss approach. AASB 9 also requires a loss allowance to be recognised for all debt instruments other than those held at fair value through profit or loss.

FINANCIAL REPORTS96
Upon adoption of the new impairment model, the agency has recognised additional impairment losses which resulted in a decrease in opening accumulated surplus. A reconciliation of the ending impairment allowance under AASB 139 to the opening loss allowance under AASB 9 is detailed below.
AASB 9 CATEGORIES
IMPAIRMENT ALLOWANCE 30 JUNE 2018 RE-MEASUREMENT
LOSS ALLOWANCE 1 JULY 2018
AASB 139 categories $000 $000 $000
Loans and receivables
Receivables Amortised cost 40 008 3 436 43 444
Advances paid Amortised cost - - -
40 008 3 436 43 444
Several other amending standards and AASB interpretations have been issued that apply to the current reporting periods, but are considered to have no impact on public sector reporting.
Standards and interpretations issued but not yet effectiveNo Australian accounting standards have been early adopted for 2018-19.
On the date of authorisation of the financial statements, the following standards and interpretations were in issue but are not yet effective and are expected to have an impact on future reporting periods:
AASB 16 LeasesAASB 16 Leases is effective for annual reporting periods beginning on or after 1 January 2019 and will be reported for the first time in 2019-20 financial statements. When effective, the standard will supersede AASB 117 Leases and require the majority of leases to be recognised on the Balance Sheet.
For lessees with operating leases, a right-of-use asset will now be included in the Balance Sheet together with a lease liability for all leases with a term of 12 months or more, unless the underlying assets are of low value. The Comprehensive Operating Statement will no longer report operating lease rental payments. Instead, amortisation expense will be recognised relating to the right-of-use asset and interest expense relating to the lease liability.
The right-of-use asset will be amortised generally on a straight-line basis while the lease liability will reduce to reflect lease payments made and increase to reflect the interest on the liability. Consistent with methodology applied to other long term liabilities, the lease liability is discounted using the Territory bond rates. As the lease term progresses, the carrying amount of the asset (cost less accumulated amortisation) is likely to reduce more quickly than the liability, resulting in a lower net asset in the earlier stages of the lease arrangement.
The modified retrospective approach has been elected to transition to the new lease standard. This approach does not require restatement of comparative years and the cumulative impact is accounted for as an equal adjustment to the right-of-use asset and lease liabilities, thus, having no impact in agency’s net assets at initial adoption.
Consequently, it is expected that approximately $84 million will be recognised in the Balance Sheet as a lease liability and corresponding right to use asset from 2019-20.
For lessors, the finance and operating lease distinction remains largely unchanged.
AASB 1058 Income for Not-for-Profit Entities and AASB 15 Revenue from Contracts with CustomersAASB 1058 Income for Not-for-Profit Entities and AASB 15 Revenue from Contracts with Customers are effective for not-for-profit entities for annual reporting periods beginning on or after 1 January 2019 and will be reported for the first time in 2019-20 financial statements.
AASB 1058 clarifies and simplifies income-recognition requirements that apply to not-for-profit entities in conjunction with AASB 15.

DEPARTMENT OF LOCAL GOVERNMENT, HOUSING AND COMMUNITY DEVELOPMENT ANNUAL REPORT 2018-19 97
Under AASB 15, revenue from agreements which are enforceable, have sufficiently specific performance obligations and transfer goods or services to the customer or third party beneficiary will be recognised when or as performance obligations are satisfied, and not immediately upon receipt as currently occurs. Consequently, more liabilities will be recognised in the Balance Sheet after adoption of this standard.
Where a transaction does not meet the criteria above or is classified as a donation transaction, revenue will accounted for in accordance with AASB 1058.
Impacts identified include:
• grants received to construct or acquire a non-financial asset will be recognised as a liability, and subsequently recognised as revenue as the performance obligations under the grant are satisfied. At present, such grants are recognised as revenue on receipt
• grants with an enforceable agreement and sufficiently specific performance obligations will be recognised as revenue progressively as the associated performance obligations are satisfied. At present, such grants are recognised as revenue on receipt
• grants that have an enforceable agreement but no specific performance obligations but have restrictions on the timing of expenditure will also continue to be recognised on receipt as time restriction on the use of funds is not sufficiently specific to create a performance obligation
• grants that are not enforceable and or not sufficiently specific will not qualify for deferral, and will continue to be recognised as revenue on receipt
The modified retrospective approach has been elected to transition to the new revenue standards. This approach does not require restatement of comparative year with the cumulative impact adjusted to the opening accumulated funds.
The standard is estimated to increase the agency’s liability (unearned revenue) by $98.721 million with an equivalent reduction to accumulated funds due to the timing difference between the receipt of revenue and performance of obligations. The liability will unwind upon satisfaction of the performance obligation.
Agency receives funding from the Commonwealth which it on-passes immediately to external entities. On adoption of AASB 15, the agency will de-recognise anticipated revenue and expenses of $18.633 million for 2019-20 from the comprehensive operating statement (For 2018-19, $35.36 million was recognised in revenue and expenses). This transaction will now flow through a clearing account.
c) Reporting entityThe financial statements cover the Department as an individual reporting entity.
The Department of Local Government, Housing and Community Development (“the Department”) is a Northern Territory department established under the Interpretation Act 1978 Administrative Arrangements Order.
The principal place of business of the Department is 47 Mitchell Street, Darwin, Northern Territory 0800.
d) Agency and Territory itemsThe financial statements of the Department of Local Government, Housing and Community Development include income, expenses, assets, liabilities and equity over which the Department of Local Government, Housing and Community Development has control (Agency items). Certain items, while managed by the agency, are controlled and recorded by the Territory rather than the agency (Territory items). Territory items are recognised and recorded in the Central Holding Authority as discussed below.
Central Holding AuthorityThe Central Holding Authority is the ‘parent body’ that represents the Government’s ownership interest in Government-controlled entities.
The Central Holding Authority also records all Territory items, such as income, expenses, assets and liabilities controlled by the Government and managed by agencies on behalf of the Government. The main Territory

FINANCIAL REPORTS98
item is Territory income, which includes taxation and royalty revenue, Commonwealth general purpose funding (such as GST revenue), fines, and statutory fees and charges.
The Central Holding Authority also holds certain Territory assets not assigned to agencies as well as certain Territory liabilities that are not practical or effective to assign to individual agencies such as unfunded superannuation and long service leave.
The Central Holding Authority recognises and records all Territory items, and as such, these items are not included in the agency’s financial statements.
The Department of Local Government, Housing and Community Development does not collect any territory items on behalf of the Central Holding Authority.
e) ComparativesWhere necessary, comparative information for the 2017-18 financial year has been reclassified to provide consistency with current year disclosures.
f) Presentation and rounding of amountsAmounts in the financial statements and notes to the financial statements are presented in Australian dollars and have been rounded to the nearest thousand dollars, with amounts of $500 or less being rounded down to zero. Figures in the financial statements and notes may not equate due to rounding.
g) Changes in accounting policiesThere have been no changes to accounting policies adopted in 2018-19 as a result of management decisions.
h) Accounting judgments and estimates The preparation of the financial report requires the making of judgments and estimates that affect the recognised amounts of assets, liabilities, revenues and expenses and the disclosure of contingent liabilities. The estimates and associated assumptions are based on historical experience and various other factors that are believed to be reasonable under the circumstances, the results of which form the basis for making judgments about the carrying values of assets and liabilities that are not readily apparent from other sources. Actual results may differ from these estimates.
The estimates and underlying assumptions are reviewed on an ongoing basis. Revisions to accounting estimates are recognised in the period in which the estimate is revised if the revision affects only that period, or in the period of the revision and future periods if the revision affects both current and future periods.
Judgments and estimates that have significant effects on the financial statements are disclosed in the relevant notes to the financial statements.
i) Goods and services taxIncome, expenses and assets are recognised net of the amount of Goods and Services Tax (GST), except where the amount of GST incurred on a purchase of goods and services is not recoverable from the Australian Tax Office (ATO). In these circumstances the GST is recognised as part of the cost of acquisition of the asset or as part of the expense.
Receivables and payables are stated with the amount of GST included. The net amount of GST recoverable from, or payable to, the ATO is included as part of receivables or payables in the Balance Sheet.
Cash flows are included in the Cash Flow Statement on a gross basis. The GST components of cash flows arising from investing and financing activities, which are recoverable from, or payable to, the ATO are classified as operating cash flows. Commitments and contingencies are disclosed net of the amount of GST recoverable or payable unless otherwise specified.

DEPARTMENT OF LOCAL GOVERNMENT, HOUSING AND COMMUNITY DEVELOPMENT ANNUAL REPORT 2018-19 99
j) Contributions by and distributions to governmentThe agency may receive contributions from Government where the Government is acting as owner of the agency. Conversely, the agency may make distributions to Government. In accordance with the Financial Management Act 1995 and Treasurer’s Directions, certain types of contributions and distributions, including those relating to administrative restructures, have been designated as contributions by, and distributions to, Government. These designated contributions and distributions are treated by the agency as adjustments to equity.
The Statement of Changes in Equity provides additional information in relation to contributions by, and distributions to, Government.

FINANCIAL REPORTS100
3. COMPREHENSIVE OPERATING STATEMENT BY OUTPUT GROUPLOCAL GOVERNMENT,
HOUSING AND COMMUNITY
DEVELOPMENTCORPORATE AND
GOVERNANCE TOTAL
NOTE 2019 2018 2019 2018 2019 2018
$000 $000 $000 $000 $000 $000
INCOME
Grants and subsidies revenue
Current 37 728 36 134 - - 37 728 36 134
Capital - 5 000 - - - 5 000
Appropriation
Output 295 497 295 396 16 298 12 873 311 795 308 269
Commonwealth 90 906 72 305 - - 90 906 72 305
Sales of goods and services 90 096 82 085 - 2 90 096 82 087
Goods and services received free of charge
4 - - 9 937 8 854 9 937 8 854
Other income 2 172 2 273 76 73 2 248 2 346
TOTAL INCOME 516 399 493 193 26 311 21 802 542 710 514 995
EXPENSES
Employee expenses 59 146 55 764 12 712 9 151 71 858 64 915
Administrative expenses - - -
Purchases of goods and services
5 18 439 17 420 3 201 3 032 21 640 20 452
Repairs and maintenance 6 49 871 49 438 77 98 49 948 49 536
Property management 60 688 57 495 385 667 61 073 58 162
Depreciation and amortisation
133 014 129 914 769 1 069 133 783 130 983
Asset expenses 7 25 914 11 991 - - 25 914 11 991
Other administrative expenses1 8 8 062 5 437 9 937 8 854 17 999 14 291
Grants and subsidies expenses -
Current 291 013 268 131 - - 291 013 268 131
Capital 113 772 47 365 - - 113 772 47 365
Community service obligations
3 414 3 455 - - 3 414 3 455
Interest expenses 9 10 282 10 586 - - 10 282 10 586
Loss on disposal of assets 10 158 2 656 - - 158 2 656
TOTAL EXPENSES 773 773 659 652 27 081 22 871 800 854 682 523
NET DEFICIT (257 374) (166 459) (770) (1 069) (258 144) (167 528)
OTHER COMPREHENSIVE INCOME
Items that will not be reclassified to net deficit
Changes in asset revaluation surplus
(63 993) (173 822) - - (63 993) (173 822)
TOTAL OTHER COMPREHENSIVE INCOME (63 993) (173 822) - - (63 993) (173 822)
COMPREHENSIVE RESULT (321 367) (340 281) (770) (1 069) (322 137) (341 350)
1 Includes DCIS service charges.
This Comprehensive Operating Statement by output group is to be read in conjunction with the notes to the financial statements.

DEPARTMENT OF LOCAL GOVERNMENT, HOUSING AND COMMUNITY DEVELOPMENT ANNUAL REPORT 2018-19 101
Income
Income encompasses both revenue and gains.
Income is recognised at the fair value of the consideration received, exclusive of the amount of GST. Exchanges of goods or services of the same nature and value without any cash consideration being exchanged are not recognised as income.
Grants and other contributionsGrants, donations, gifts and other non-reciprocal contributions are recognised as revenue when the agency obtains control over the assets comprising the contributions. Control is normally obtained upon receipt.
Contributions are recognised at their fair value. Contributions of services are only recognised when a fair value can be reliably determined and the services would be purchased if not donated.
AppropriationOutput appropriation is the operating payment to each agency for the outputs they provide and is calculated as the net cost of agency outputs after taking into account funding from agency income. It does not include any allowance for major non-cash costs such as depreciation.
Commonwealth appropriation follows from the Intergovernmental Agreement on Federal Financial Relations, resulting in Specific Purpose Payments (SPPs) and National Partnership (NP) payments being made by the Commonwealth Treasury to state treasuries, in a manner similar to arrangements for GST payments. These payments are received by the Department of Treasury and Finance on behalf of the Central Holding Authority and then on passed to the relevant agencies as Commonwealth appropriation.
Revenue in respect of appropriations is recognised in the period in which the agency gains control of the funds.
Sale of goodsRevenue from the sale of goods is recognised (net of returns, discounts and allowances) when:
• the significant risks and rewards of ownership of the goods have transferred to the buyer
• the agency retains neither continuing managerial involvement to the degree usually associated with ownership nor effective control over the goods sold
• the amount of revenue can be reliably measured
• it is probable that the economic benefits associated with the transaction will flow to the agency
• the costs incurred or to be incurred in respect of the transaction can be measured reliably
Rendering of servicesRevenue from rendering services is recognised by reference to the stage of completion of the contract. The revenue is recognised when:
• the amount of revenue, stage of completion and transaction costs incurred can be reliably measured
• it is probable that the economic benefits associated with the transaction will flow to the entity
Interest revenueInterest revenue is recognised as it accrues, taking into account the effective yield on the financial asset.
Goods and services received free of chargeGoods and services received free of charge are recognised as revenue when a fair value can be reliably determined and the resource would have been purchased if it had not been donated. Use of the resource is recognised as an expense. See Note 4.

FINANCIAL REPORTS102
Disposal of assetsA gain or loss on disposal of assets is included as a gain or loss on the date control of the asset passes to the buyer, usually when an unconditional contract of sale is signed. The gain or loss on disposal is calculated as the difference between the carrying amount of the asset at the time of disposal and the net proceeds on disposal. Refer also to Note 10.
Contributions of assetsContributions of assets and contributions to assist in the acquisition of assets, being non reciprocal transfers, are recognised, unless otherwise determined by government, as gains when the agency obtains control of the asset or contribution. Contributions are recognised at the fair value received or receivable.
4. GOODS AND SERVICES RECEIVED FREE OF CHARGE 2019 2018
$000 $000
Department of Corporate and Information Services 9 937 8 854
9 937 8 854
5. PURCHASES OF GOODS AND SERVICESThe net deficit has been arrived at after charging the following expenses:
Goods and services expenses:
Consultants1 4 720 2 308
Advertising2 9 2
Marketing and promotion3 387 392
Document production 41 57
Legal expenses4 916 746
Recruitment5 56 55
Training and study 878 1 017
Official duty fares 1 311 1 244
Accommodation 651 619
Travelling allowance 648 584
Agency service arrangements 2 432 4 197
Motor vehicle expenses 2 419 2 321
Information Technology expenses 4 552 4 382
Communications 950 930
Audit Fees 54 46
Other operating expenses 1 616 1 552
21 640 20 452
(1) Includes marketing, promotion and IT consultants.(2) Does not include recruitment, advertising or marketing and promotion advertising.(3) Includes advertising for marketing and promotion but excludes marketing and promotion consultants’ expenses, which are
incorporated in the consultants’ category.(4) Includes legal fees, claim and settlement costs.(5) Includes recruitment-related advertising costs.

DEPARTMENT OF LOCAL GOVERNMENT, HOUSING AND COMMUNITY DEVELOPMENT ANNUAL REPORT 2018-19 103
6. REPAIRS AND MAINTENANCE 2019 2018
$000 $000
Repairs and maintenance program 40 059 44 272
Capital works projects which could not be capitalised 9 889 5 264
49 948 49 536
Repairs and maintenance expenseFunding is received for repairs and maintenance works associated with agency assets as part of output appropriation. Costs associated with repairs and maintenance works on agency assets are expensed as incurred. This does not include repairs and maintenance on remote housing, which is currently classified as current grants expenditure.
7. ASSET EXPENSESAssets demolished 25 914 10 981
Assets gifted - training centres - 1 010
25 914 11 991
8. OTHER ADMINISTRATIVE EXPENSES Doubtful debts expense 6 273 4 373
Write offs and losses 1 789 1 064
Goods and services received free of charge 9 937 8 854
17 999 14 291
9. INTEREST EXPENSES Interest expense – borrowings 9 143 9 456
Interest expense – finance leases 1 139 1 130
10 282 10 586
Interest expenseInterest expenses include interest and finance lease charges. Interest expenses are expensed in the period in which they are incurred.
10. LOSS ON DISPOSAL OF ASSETS Net proceeds from the disposal of non-current assets 1 750 9 826
Less: Carrying value of non-current assets disposed (1 908) (12 482)
Total loss on disposal of assets (158) (2 656)
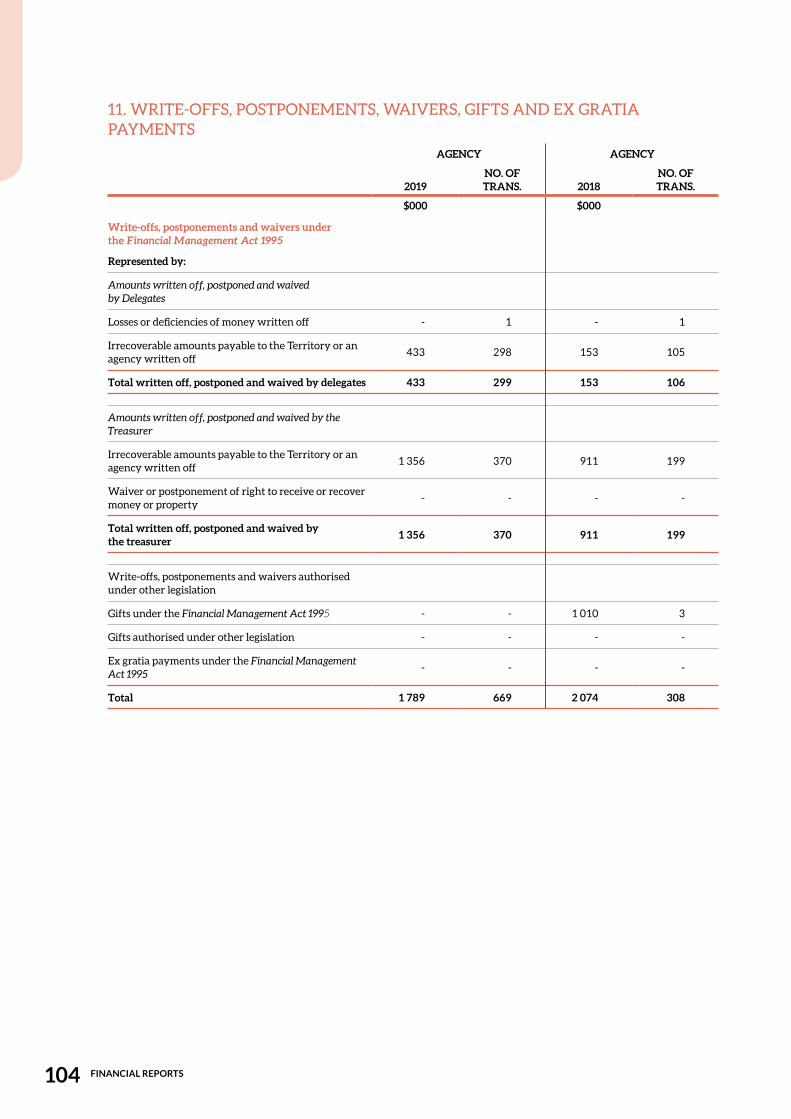
FINANCIAL REPORTS104
11. WRITE-OFFS, POSTPONEMENTS, WAIVERS, GIFTS AND EX GRATIA PAYMENTS
AGENCY AGENCY
2019NO. OF TRANS. 2018
NO. OF TRANS.
$000 $000
Write-offs, postponements and waivers under the Financial Management Act 1995
Represented by:
Amounts written off, postponed and waived by Delegates
Losses or deficiencies of money written off - 1 - 1
Irrecoverable amounts payable to the Territory or an agency written off
433 298 153 105
Total written off, postponed and waived by delegates 433 299 153 106
Amounts written off, postponed and waived by the Treasurer
Irrecoverable amounts payable to the Territory or an agency written off
1 356 370 911 199
Waiver or postponement of right to receive or recover money or property
- - - -
Total written off, postponed and waived by the treasurer 1 356 370 911 199
Write-offs, postponements and waivers authorised under other legislation
Gifts under the Financial Management Act 1995 - - 1 010 3
Gifts authorised under other legislation - - - -
Ex gratia payments under the Financial Management Act 1995 - - - -
Total 1 789 669 2 074 308

DEPARTMENT OF LOCAL GOVERNMENT, HOUSING AND COMMUNITY DEVELOPMENT ANNUAL REPORT 2018-19 105
12. CASH AND DEPOSITS2019 2018
$000 $000
Cash on hand 25 22
Cash at bank 33 160 105 684
33 185 105 706
For the purposes of the Balance Sheet and the Cash Flow Statement, cash includes cash on hand, cash at bank and cash equivalents. Cash equivalents are highly liquid short-term investments that are readily convertible to cash. Cash at bank includes monies held in the Accountable Officer’s Trust Account (AOTA) that are ultimately payable to the beneficial owner – refer also to Note 27.
13. CASH FLOW RECONCILIATION
a) Reconciliation of cash The total of agency ‘Cash and deposits’ of $33.185 million recorded in the Balance Sheet is consistent with that recorded as ‘Cash’ in the Cash Flow Statement.
Reconciliation of net (deficit) to net cash from operating activities
Net (Deficit) ( 258 144) (167 528)
Non-cash items:
Depreciation and amortisation 133 783 130 983
Asset write-offs/write-downs 25 914 11 991
Loss on disposal of assets 158 2 656
Repairs and maintenance expense (non-cash) 9 889 5 264
Capital Grant (non-cash) 660 -
Changes in assets and liabilities:
Decrease in receivables (1 036) 3 045
Increase in prepayments 218 (582)
Decrease in payables (1 858) 3 070
Increase in provision for employee benefits 456 575
Increase in other provisions (3 335) 66
Increase in other liabilities (1 606) 564
Net Cash from Operating Activities (94 901) (9 896)

FINANCIAL REPORTS106
b) R
econ
cilia
tion
of l
iabi
litie
s ari
sing
from
fina
ncin
g ac
tivi
ties
2018
-19
CASH
FLO
WS
NO
N C
ASH
1-Ju
lLo
ans a
nd
adva
nces
App
ropr
iati
onEq
uity
Inj
wth
drw
1Fi
nanc
e le
ase
Tota
l cas
h fl
ows
Fina
nce
Leas
eO
ther
Tota
l no
n-ca
sh30
Jun
e
$000
$000
$000
$000
$000
$000
$000
$000
$000
$000
Dep
osit
s h
eld
5 6
78
21
9
- -
-
21
9
- -
- 5
89
7
Bor
row
ings
72
07
1
(2 5
92
) -
- -
(2 5
92
) -
- -
69
47
9
Leas
e Li
abili
ties
22
84
0
- -
- (3
38
) (3
38
)
83
1
-
83
1
23
33
3
Equi
ty In
j & W
thdr
w1
- -
22
5 9
75
2
7 0
00
-
25
2 9
75
-
(67
0)
(67
0)
25
2 3
05
Tota
l 1
00
58
9
(2 3
73
) 2
25
97
5
27
00
0
(33
8)
25
0 2
63
83
1
(67
0)
1
61
3
51
01
4
1E
qu
ity
inje
ctio
n a
nd
wit
hd
raw
al
2017
-18
CASH
FLO
WS
NO
N C
ASH
1-Ju
lLo
ans a
nd
adva
nces
App
ropr
iati
onEq
uity
Inj
wth
drw
1Fi
nanc
e le
ase
Tota
l cas
h fl
ows
Fina
nce
Leas
eO
ther
Tota
l no
n-ca
sh30
Jun
e
$000
$000
$000
$000
$000
$000
$000
$000
$000
$000
Dep
osit
s h
eld
6 8
74
(
1 1
95
)-
--
(1 1
95
)
-
- -
5 6
78
Bor
row
ings
74
35
0
(2 2
78
)-
--
(2 2
78
)-
--
72
07
1
Leas
e Li
abili
ties
21
02
5
-
- -
(2
99
) (2
99
)
2
11
4
-
2 1
14
22
84
0
Equi
ty In
j & W
thdr
w1
- -
68
57
7
(39
8)
-
68
17
9
- 3
59
35
9
68
53
8
Tota
l1
02
24
9
(3
47
3)
68
57
7
(
39
8)
(2
99
)6
4 4
06
2 1
14
3
59
2
47
3
16
9 1
27
1E
qu
ity
inje
ctio
n a
nd
wit
hd
raw
al
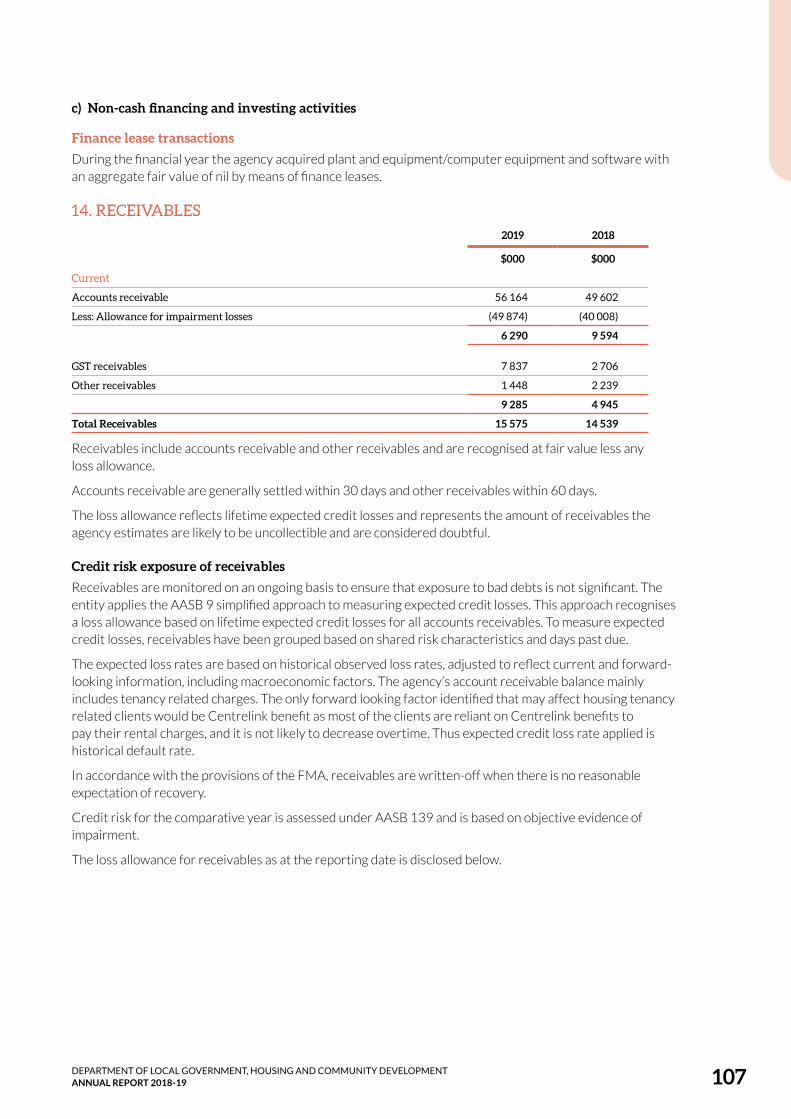
DEPARTMENT OF LOCAL GOVERNMENT, HOUSING AND COMMUNITY DEVELOPMENT ANNUAL REPORT 2018-19 107
c) Non-cash financing and investing activities
Finance lease transactionsDuring the financial year the agency acquired plant and equipment/computer equipment and software with an aggregate fair value of nil by means of finance leases.
14. RECEIVABLES2019 2018
$000 $000
Current
Accounts receivable 56 164 49 602
Less: Allowance for impairment losses (49 874) (40 008)
6 290 9 594
GST receivables 7 837 2 706
Other receivables 1 448 2 239
9 285 4 945
Total Receivables 15 575 14 539
Receivables include accounts receivable and other receivables and are recognised at fair value less any loss allowance.
Accounts receivable are generally settled within 30 days and other receivables within 60 days.
The loss allowance reflects lifetime expected credit losses and represents the amount of receivables the agency estimates are likely to be uncollectible and are considered doubtful.
Credit risk exposure of receivablesReceivables are monitored on an ongoing basis to ensure that exposure to bad debts is not significant. The entity applies the AASB 9 simplified approach to measuring expected credit losses. This approach recognises a loss allowance based on lifetime expected credit losses for all accounts receivables. To measure expected credit losses, receivables have been grouped based on shared risk characteristics and days past due.
The expected loss rates are based on historical observed loss rates, adjusted to reflect current and forward-looking information, including macroeconomic factors. The agency’s account receivable balance mainly includes tenancy related charges. The only forward looking factor identified that may affect housing tenancy related clients would be Centrelink benefit as most of the clients are reliant on Centrelink benefits to pay their rental charges, and it is not likely to decrease overtime. Thus expected credit loss rate applied is historical default rate.
In accordance with the provisions of the FMA, receivables are written-off when there is no reasonable expectation of recovery.
Credit risk for the comparative year is assessed under AASB 139 and is based on objective evidence of impairment.
The loss allowance for receivables as at the reporting date is disclosed below.
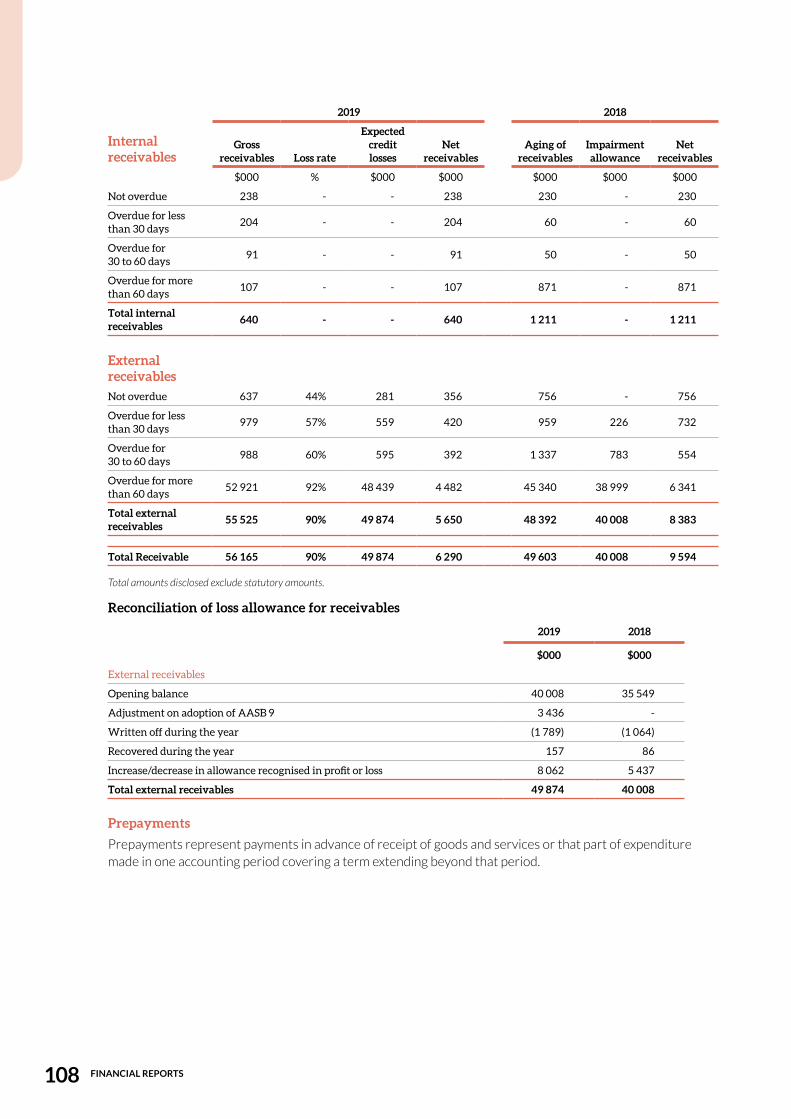
FINANCIAL REPORTS108
2019 2018
Internal receivables
Gross receivables Loss rate
Expected credit losses
Net receivables
Aging of receivables
Impairment allowance
Net receivables
$000 % $000 $000 $000 $000 $000
Not overdue 238 - - 238 230 - 230
Overdue for less than 30 days
204 - - 204 60 - 60
Overdue for 30 to 60 days
91 - - 91 50 - 50
Overdue for more than 60 days
107 - - 107 871 - 871
Total internal receivables 640 - - 640 1 211 - 1 211
External receivablesNot overdue 637 44% 281 356 756 - 756
Overdue for less than 30 days
979 57% 559 420 959 226 732
Overdue for 30 to 60 days
988 60% 595 392 1 337 783 554
Overdue for more than 60 days
52 921 92% 48 439 4 482 45 340 38 999 6 341
Total external receivables 55 525 90% 49 874 5 650 48 392 40 008 8 383
Total Receivable 56 165 90% 49 874 6 290 49 603 40 008 9 594
Total amounts disclosed exclude statutory amounts.
Reconciliation of loss allowance for receivables
2019 2018
$000 $000
External receivables
Opening balance 40 008 35 549
Adjustment on adoption of AASB 9 3 436 -
Written off during the year (1 789) (1 064)
Recovered during the year 157 86
Increase/decrease in allowance recognised in profit or loss 8 062 5 437
Total external receivables 49 874 40 008
PrepaymentsPrepayments represent payments in advance of receipt of goods and services or that part of expenditure made in one accounting period covering a term extending beyond that period.

DEPARTMENT OF LOCAL GOVERNMENT, HOUSING AND COMMUNITY DEVELOPMENT ANNUAL REPORT 2018-19 109
15. PROPERTY, PLANT AND EQUIPMENT 2019 2018
$000 $000
Buildings: housing rental properties Urban rental properties
Urban vacant land at fair value 12 820 12 903
Urban improved land at fair value 694 384 719 131
Urban buildings at fair value 708 842 695 412
1 416 046 1 427 446
Remote rental properties
Remote buildings at fair value 2 993 328 2 989 359
Less: Accumulated depreciation (1 333 710) (1 331 774)
1 659 618 1 657 585
Total rental dwellings 3 075 664 3 085 031
Public buildings – remote training centres
At fair value 15 008 15 021
Less: Accumulated depreciation (9 538) (9 068)
5 470 5 953
Land – cemeteries and land under training centres
At fair value 3 651 3 650
Construction (Work in Progress)
At capitalised cost 60 216 59 582
Plant and equipment
At fair value 8 943 8 831
Less: Accumulated depreciation (8 143) (7 619)
800 1 212
Total property plant and equipment 3 145 801 3 155 428
Leased property, plant and equipment
Land under finance lease - at capitalised cost 24 250 23 435
Less: Accumulated amortisation (1 595) (936)
22 655 22 499
Total non-current assets 3 168 455 3 177 927

FINANCIAL REPORTS110
15. P
RO
PER
TY
, PLA
NT
AN
D E
QU
IPM
ENT
(CO
NT
INU
ED)
2019
Pro
pert
y, p
lant
and
equ
ipm
ent r
econ
cilia
tion
sA
rec
on
cilia
tio
n o
f th
e ca
rryi
ng
amo
un
t o
f pro
pert
y, p
lan
t an
d e
qu
ipm
ent
at t
he
beg
inn
ing
and
en
d o
f 20
18
-19
is s
et o
ut
bel
ow
:
Land
- ce
met
erie
s an
d la
nd u
nder
tr
aini
ng c
entr
es
Land
- ur
ban
rent
al
prop
erti
es
Build
ings
- ur
ban
rent
al
dwel
lings
Build
ings
- re
mot
e re
ntal
dw
ellin
gsTr
aini
ng
cent
res
Cons
truc
tion
(w
ork
in
prog
ress
)Pl
ant a
nd
equi
pmen
t
Leas
ed
prop
erty
, pla
nt
and
equi
pmen
tTo
tal
$0
00$0
00$0
00$0
00$0
00$0
00$0
00$0
00$0
00
Car
ryin
g A
mou
nt a
s at
1
July
201
8 3
65
0
73
2 0
34
6
95
41
2
1 6
57
58
5
5 9
53
5
9 5
82
1
21
2
22
49
9
3 1
77
92
7
Add
itio
ns
- -
- -
- 2
71
45
1
5
7
9
30
2
72
43
8
Dis
posa
ls -
(1 2
89
) (4
22
8)
(22
30
5)
- -
- (1
00
) (2
7 9
22
)
Dep
reci
atio
n
- -
(33
22
9)
(99
11
1)
(25
3)
- (5
16
) (6
74
) (1
33
78
3)
Add
itio
ns/
(dis
posa
ls) f
rom
ad
min
istr
ativ
e re
stru
ctur
ing
- -
- -
- -
- -
-
Add
itio
ns/
(Dis
posa
ls) f
rom
as
set t
ran
sfer
s -
7
7
83
98
4
13
0 5
53
-
(27
0 8
17
)
47
-
(56
15
6)
Rev
alua
tion
incr
emen
ts/
(dec
rem
ents
)
1
(23
61
8)
(45
59
0)
5 3
88
(2
30
) -
- -
(64
04
9)
Oth
er m
ovem
ents
Tra
nsf
ers
betw
een
ass
et c
lass
es -
- 1
2 4
92
(1
2 4
92
) -
- -
- -
Carr
ying
Am
ount
as a
t 30
Jun
e 20
19 3
65
1
70
7 2
04
7
08
84
2
1 6
59
61
8
5 4
70
6
0 2
16
80
0
22
65
5
3 1
68
45
5

DEPARTMENT OF LOCAL GOVERNMENT, HOUSING AND COMMUNITY DEVELOPMENT ANNUAL REPORT 2018-19 111
2018
Pro
pert
y, p
lant
and
equ
ipm
ent r
econ
cilia
tion
sA
rec
on
cilia
tio
n o
f th
e ca
rryi
ng
amo
un
t o
f pro
pert
y, p
lan
t an
d e
qu
ipm
ent
at t
he
beg
inn
ing
and
en
d o
f 20
17
-18
is s
et o
ut
bel
ow
:
Land
- ce
met
erie
s an
d la
nd u
nder
tr
aini
ng c
entr
es
Land
- ur
ban
rent
al
prop
erti
es
Build
ings
- ur
ban
rent
al
dwel
lings
Build
ings
- re
mot
e re
ntal
dw
ellin
gsTr
aini
ng
cent
res
Cons
truc
tion
(w
ork
in
prog
ress
)Pl
ant a
nd
equi
pmen
t
Leas
ed
prop
erty
, pla
nt
and
equi
pmen
tTo
tal
$0
00$0
00$0
00$0
00$0
00$0
00$0
00$0
00$0
00
Car
ryin
g A
mou
nt a
s at
1
July
201
7 3
70
0
82
5 8
44
7
81
05
4
1 6
25
60
1
4 9
96
4
0 2
62
1
57
2
21
06
1
3 3
04
09
0
Add
itio
ns
- -
- -
- 2
06
15
7
1
07
2
11
5
20
8 3
79
Dis
posa
ls -
(11
44
0)
(6 3
04
) (5
71
9)
(1 0
10
) -
- (2
4 4
73
)
Dep
reci
atio
n
- -
( 3
4 8
16
) (9
4 4
21
) (2
45
) -
(82
4)
(67
7)
(13
0 9
83
)
Add
itio
ns/
(dis
posa
ls) f
rom
ad
min
istr
ativ
e re
stru
ctur
ing
- -
- -
- -
- -
-
Add
itio
ns/
(Dis
posa
ls) f
rom
as
set t
ran
sfer
s -
2
9
45
04
8
13
6 1
68
-
(18
6 8
37
)
35
7
- (5
23
5)
Rev
alua
tion
incr
emen
ts/
(dec
rem
ents
) (5
0)
(82
39
9)
(89
57
0)
(4 0
44
) 2
21
2
- -
- (1
73
85
1)
Oth
er m
ovem
ents
Tra
nsf
ers
betw
een
ass
et c
lass
es -
- -
- -
- -
- -
Carr
ying
Am
ount
as a
t 30
Jun
e 20
18 3
65
0
73
2 0
34
6
95
41
2
1 6
57
58
5
5 9
53
5
9 5
82
1
21
2
22
49
9
3 1
77
92
7
FINANCIAL REPORTS112
AcquisitionsAll items of property, plant and equipment with a cost, or other value, equal to or greater than $10 000 are recognised in the year of acquisition and depreciated as outlined below. Items of property, plant and equipment below the $10 000 threshold are expensed in the year of acquisition.
The construction cost of property, plant and equipment includes the contractor’s cost.
Complex assetsMajor items of plant and equipment comprising a number of components that have different useful lives, are accounted for as separate assets. The components may be replaced during the useful life of the complex asset. The Department of Local Government, Housing and Community Development policy is not to componentise assets with values less than $5 million.
Subsequent additional costsCosts incurred on property, plant and equipment subsequent to initial acquisition are capitalised when it is probable that future economic benefits in excess of the originally assessed performance of the asset will flow to the agency in future years. Where these costs represent separate components of a complex asset, they are accounted for as separate assets and are separately depreciated over their expected useful lives.
Construction (work in progress) rental dwellingsThe capital works for the construction of urban, remote and government employee dwellings are funded through capital appropriation directly to the Department of Local Government, Housing and Community Development, the expenditure as it is incurred is recognised in construction work in progress. Capital works funded through the National Partnership on Remote Housing are also recognised in construction work in progress. Upon completion the projects are recognised as either an asset or an expense, dependent on capitalisation policy.
AcquisitionsConstructed rental dwellings, upgrading costs and minor capital works carried out on existing rental dwellings are recorded at their expended completed contract price, including tendering costs, contract management and supervision fees and all fees and charges relating to construction as property assets. Rental dwelling contracts not completed at 30 June 2019 are stated as works in progress.
Demolitions/giftsObsolete rental dwellings demolished and dwellings which are gifted or reverted under land rights legislation are written off in the financial year of occurrence. The write-offs represent the written down historical cost component of such dwellings. Appropriate adjustments are made against the asset revaluation reserve where previous revaluations have occurred.
SalesDwellings to be sold are valued immediately prior to the sale. The agency’s policy is to record the difference between the sale price and the asset carrying amount as a gain or loss on sale.
Remote training centres and leased office accommodationAs part of the financial management framework, the Department of Infrastructure, Planning and Logistics is responsible for managing general government capital works projects on a whole of Government basis. Therefore appropriation for remote training centres and office accommodation capital works is provided directly to the Department of Infrastructure, Planning and Logistics and the cost of construction work in progress is recognised as an asset of that Department. Once completed, capital works assets are transferred to the agency.

DEPARTMENT OF LOCAL GOVERNMENT, HOUSING AND COMMUNITY DEVELOPMENT ANNUAL REPORT 2018-19 113
Revaluations and impairment
Revaluation of assetsSubsequent to initial recognition, assets belonging to the following classes of non-current assets are revalued with sufficient regularity to ensure that the carrying amount of these assets does not differ materially from their fair value at reporting date:
Department of Local Government, Housing and Community Development revalued the following class of assets as at 30 June 2019;
• Urban rental land and dwellings
• Remote rental land and dwellings including, Government Employee Housing (GEH) remote rental dwellings
• Training Centres
All revaluations completed have been endorsed by the Northern Territory Valuer- General.
Asset Classes not re-valued during the 2019 financial year include;
• Local Government Cemeteries are specialised assets in nature and are stated at Unimproved Capital Value.
• Plant and equipment are stated at historical cost less depreciation, which is deemed to equate to fair value.
Urban rental dwellingsAn independent valuation of urban rental dwellings was completed at 30 June 2019 by Territory Property Consultants Pty Ltd, the results of which are reflected in these financial statements. The basis for the valuation of urban rental dwellings is that of ‘fair value’ being the estimate the price at which an orderly transaction to sell the asset or to transfer the liability would take place between market participants at the measurement date under current market conditions. The agency has adopted the policy of revaluing its urban rental land and dwellings every year to ensure that the carrying amount does not differ materially from their fair value at reporting date. Urban rental dwellings consist of land, houses, flat complexes and interest in body corporate.
Where the carrying amount of any urban rental property was determined to be greater than its recoverable amount the carrying amount of that dwelling has been written down to its recoverable amount. Details of the related carrying amount written down and any recoverable amount write downs have been disclosed in the financial statements.
Existing urban rental properties that have incurred major renovations or upgrading costs are revalued as soon as possible after the contract has been completed for those works. Useful lives of all urban rental dwellings have been reassessed at the time of valuation.
Remote rental land and dwellings including, Government Employee Housing (GEH) remote rental dwellings and training centresTerritory Property Consultants Pty Ltd completed an independent valuation of remote rental dwellings and training centres at 30 June 2019, the results of which are reflected in these financial statements. The agency has adopted the policy of revaluing its remote rental dwellings and training centres at 30 June each year. Remote rental dwellings and training centres are measured on the basis of ‘fair value’ using the depreciated replacement cost methodology. The useful lives of all remote rental dwellings and training centres are also reassessed at the time of valuation.
Impairment of assetsAn asset is said to be impaired when the asset’s carrying amount exceeds its recoverable amount.
The agency has adopted the policy of revaluing its urban and remote rental property assets annually to ensure that assets are carried at amounts that are not in excess of their recoverable amounts. Where indications of impairment exist the agency determines the asset’s recoverable amount as the asset’s

FINANCIAL REPORTS114
depreciated replacement cost for remote assets and fair value less costs to sell for urban assets. Any amount by which the asset’s carrying amount exceeds the recoverable amount is recorded as an impairment loss.
Other non-current physical agency assets are assessed for indicators of impairment on an annual basis or whenever there is indication of impairment. If an indicator of impairment exists, the agency determines the asset’s recoverable amount. The asset’s recoverable amount is determined as the higher of the asset’s depreciated replacement cost and fair value less costs to sell. Any amount by which the asset’s carrying amount exceeds the recoverable amount is recorded as an impairment loss.
Asset classes found to have impairment losses are recognised in the Comprehensive Operating Statement. They are disclosed as an expense unless the asset is carried at a revalued amount. Where the asset is measured at a revalued amount, the impairment loss is offset against the asset revaluation surplus for that class of asset to the extent that an available balance exists in the asset revaluation surplus.
In certain situations, an impairment loss may subsequently be reversed. Where an impairment loss is subsequently reversed, the carrying amount of the asset is increased to the revised estimate of its recoverable amount. A reversal of an impairment loss is recognised in the Comprehensive Operating Statement as income, unless the asset is carried at a revalued amount, in which case the impairment reversal results in an increase in the asset revaluation surplus. Note 21 provides additional information in relation to the asset revaluation surplus.
Department of Local Government, Housing and Community Development assets were assessed for impairment after revaluation and impairment was identified to be immaterial to overall asset values.
Depreciation and amortisation expenseItems of property, plant and equipment, including buildings but excluding land, have limited useful lives and are depreciated or amortised using the straight-line method over their estimated useful lives.
Amortisation applies in relation to intangible non-current assets with limited useful lives and is calculated and accounted for in a similar manner to depreciation.
The estimated useful lives for each class of asset are in accordance with the Treasurer’s Directions and are determined as follows:
2019
Urban Dwellings 50 years
Remote Public Housing Dwellings 30 years
GEH(a) remote area dwellings 40 years
Plant and Equipment 5-10 years
Land Under Finance Lease Remaining period of lease
Leased Building Upgrades Remaining period of lease
Note: (a) Government employee housing (GEH)
Assets are depreciated or amortised from the date of acquisition or from the time an asset is completed and held ready for use. Where an asset is revalued due to capital construction or upgrade, or due to market movements, the useful life is reassessed and the annual depreciation charge is adjusted to reflect the new value of the asset.
Assets held for saleAssets and disposal groups are classified as held for sale if their carrying amount will be recovered through a sale transaction or a grant agreement rather than continuing use. Assets held for sale consist of those assets that management has determined are available for immediate sale or granting in their present condition and their sale is highly probable within one year from the date of classification.
These assets are measured at the lower of the asset’s carrying amount and fair value less costs to sell. These assets are not depreciated. Non-current assets held for sale have been recognised on the face of the financial statements as current assets.

DEPARTMENT OF LOCAL GOVERNMENT, HOUSING AND COMMUNITY DEVELOPMENT ANNUAL REPORT 2018-19 115
Leased assetsLeases under which the agency assumes substantially all the risks and rewards of ownership of an asset are classified as finance leases. Other leases are classified as operating leases.
Finance leasesFinance leases are capitalised. A lease asset and lease liability equal to the lower of the fair value of the leased property and present value of the minimum lease payments, each determined at the inception of the lease, are recognised.
Lease payments are allocated between the principal component of the lease liability and the interest expense.
The Department of Local Government, Housing and Community Development holds long-term leases of Aboriginal land for remote government employee housing and some training centres.
Operating leasesOperating lease payments made at regular intervals throughout the term are expensed when the payments are due, except where an alternative basis is more representative of the pattern of benefits to be derived from the leased property. Lease incentives under an operating lease of a building or office space are recognised as an integral part of the consideration for the use of the leased asset. Lease incentives are to be recognised as a deduction of the lease expenses over the term of the lease.
16. PAYABLES 2019 2018
$000 $000
Accounts payable 1 701 3 303
Accrued expenses 3 276 3 533
Accrued expenses - works in progress 2 224 3 922
Interest payable 24 25
Total payables 7 225 10 783
Liabilities for accounts payable and other amounts payable are carried at cost, which is the fair value of the consideration to be paid in the future for goods and services received, whether or not billed to the agency. Accounts payable are normally settled within 30 days.
17. BORROWINGS AND ADVANCES Current
Loans and advances 2 949 2 593
Finance lease liabilities 327 300
3 276 2 893
Non-current
Loans and advances 66 530 69 479
Finance lease liabilities 23 006 22 540
89 536 92 019
Total borrowings and advances 92 812 94 912
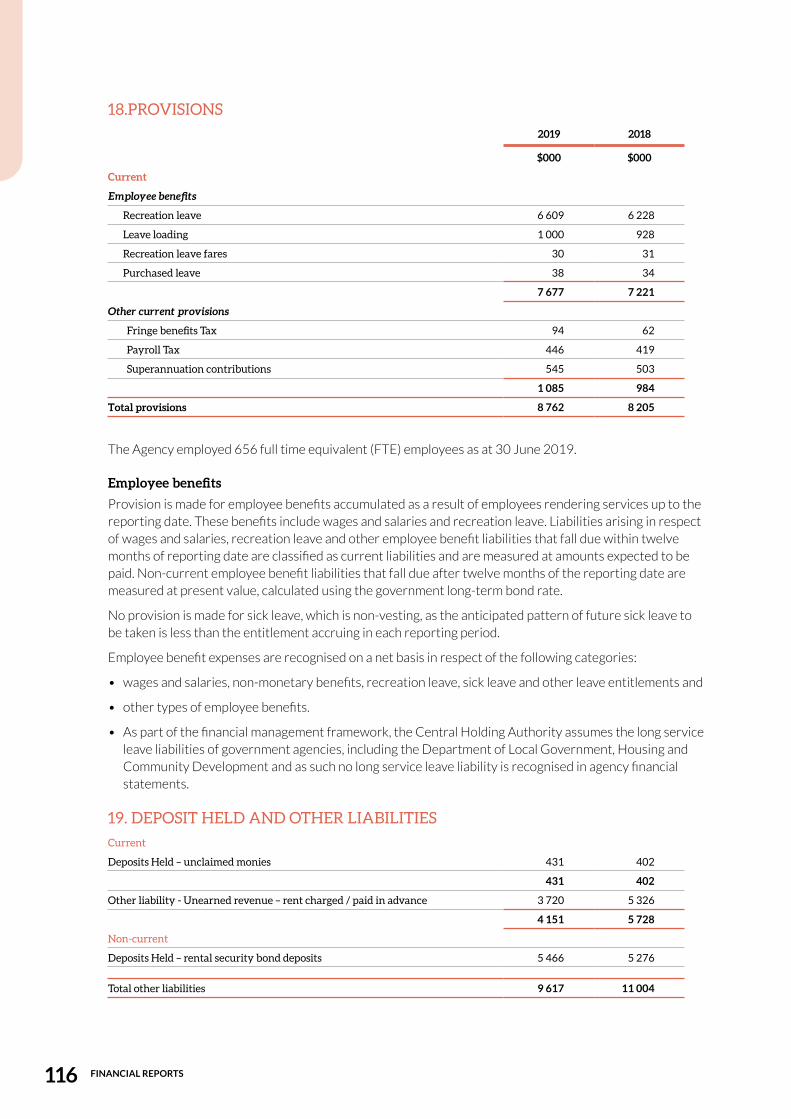
FINANCIAL REPORTS116
18.PROVISIONS 2019 2018
$000 $000
Current
Employee benefits
Recreation leave 6 609 6 228
Leave loading 1 000 928
Recreation leave fares 30 31
Purchased leave 38 34
7 677 7 221
Other current provisions
Fringe benefits Tax 94 62
Payroll Tax 446 419
Superannuation contributions 545 503
1 085 984
Total provisions 8 762 8 205
The Agency employed 656 full time equivalent (FTE) employees as at 30 June 2019.
Employee benefits Provision is made for employee benefits accumulated as a result of employees rendering services up to the reporting date. These benefits include wages and salaries and recreation leave. Liabilities arising in respect of wages and salaries, recreation leave and other employee benefit liabilities that fall due within twelve months of reporting date are classified as current liabilities and are measured at amounts expected to be paid. Non-current employee benefit liabilities that fall due after twelve months of the reporting date are measured at present value, calculated using the government long-term bond rate.
No provision is made for sick leave, which is non-vesting, as the anticipated pattern of future sick leave to be taken is less than the entitlement accruing in each reporting period.
Employee benefit expenses are recognised on a net basis in respect of the following categories:
• wages and salaries, non-monetary benefits, recreation leave, sick leave and other leave entitlements and
• other types of employee benefits.
• As part of the financial management framework, the Central Holding Authority assumes the long service leave liabilities of government agencies, including the Department of Local Government, Housing and Community Development and as such no long service leave liability is recognised in agency financial statements.
19. DEPOSIT HELD AND OTHER LIABILITIES Current
Deposits Held – unclaimed monies 431 402
431 402
Other liability - Unearned revenue – rent charged / paid in advance 3 720 5 326
4 151 5 728
Non-current
Deposits Held – rental security bond deposits 5 466 5 276
Total other liabilities 9 617 11 004
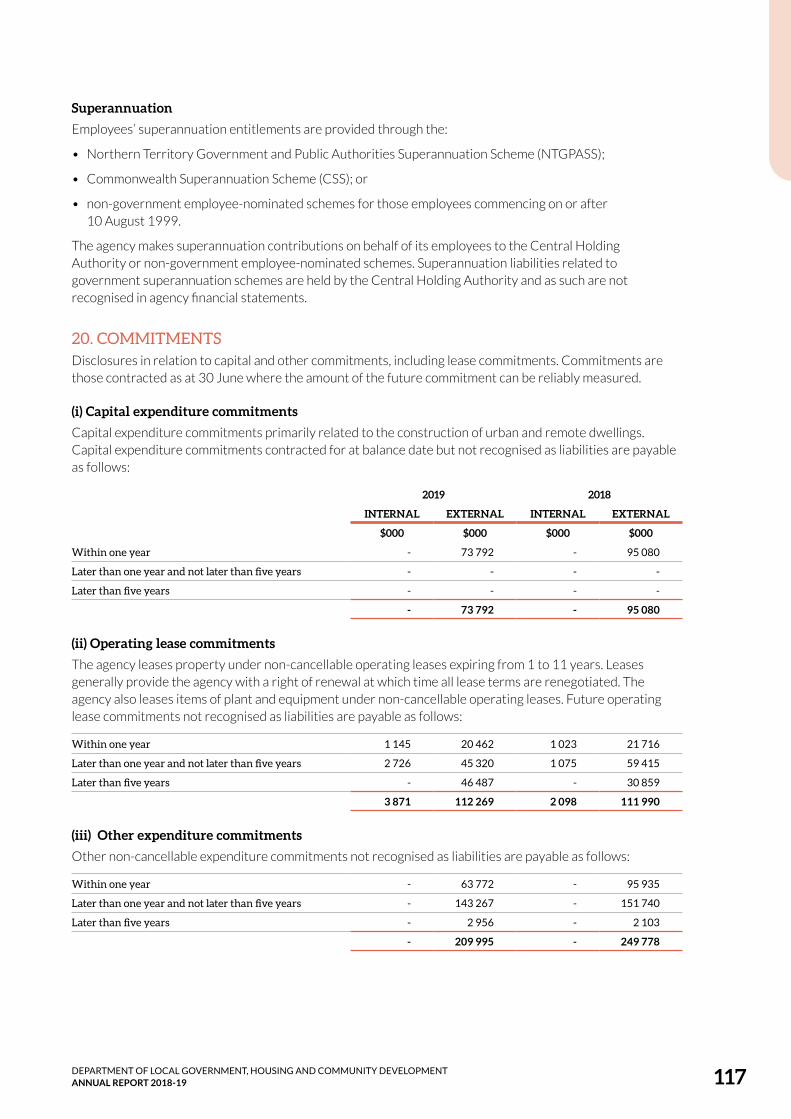
DEPARTMENT OF LOCAL GOVERNMENT, HOUSING AND COMMUNITY DEVELOPMENT ANNUAL REPORT 2018-19 117
SuperannuationEmployees’ superannuation entitlements are provided through the:
• Northern Territory Government and Public Authorities Superannuation Scheme (NTGPASS);
• Commonwealth Superannuation Scheme (CSS); or
• non-government employee-nominated schemes for those employees commencing on or after 10 August 1999.
The agency makes superannuation contributions on behalf of its employees to the Central Holding Authority or non-government employee-nominated schemes. Superannuation liabilities related to government superannuation schemes are held by the Central Holding Authority and as such are not recognised in agency financial statements.
20. COMMITMENTSDisclosures in relation to capital and other commitments, including lease commitments. Commitments are those contracted as at 30 June where the amount of the future commitment can be reliably measured.
(i) Capital expenditure commitments Capital expenditure commitments primarily related to the construction of urban and remote dwellings. Capital expenditure commitments contracted for at balance date but not recognised as liabilities are payable as follows:
2019 2018
INTERNAL EXTERNAL INTERNAL EXTERNAL
$000 $000 $000 $000
Within one year - 73 792 - 95 080
Later than one year and not later than five years - - - -
Later than five years - - - -
- 73 792 - 95 080
(ii) Operating lease commitments The agency leases property under non-cancellable operating leases expiring from 1 to 11 years. Leases generally provide the agency with a right of renewal at which time all lease terms are renegotiated. The agency also leases items of plant and equipment under non-cancellable operating leases. Future operating lease commitments not recognised as liabilities are payable as follows:
Within one year 1 145 20 462 1 023 21 716
Later than one year and not later than five years 2 726 45 320 1 075 59 415
Later than five years - 46 487 - 30 859
3 871 112 269 2 098 111 990
(iii) Other expenditure commitments Other non-cancellable expenditure commitments not recognised as liabilities are payable as follows:
Within one year - 63 772 - 95 935
Later than one year and not later than five years - 143 267 - 151 740
Later than five years - 2 956 - 2 103
- 209 995 - 249 778

FINANCIAL REPORTS118
21. RESERVES
Asset revaluation surplus
(i) Nature and purpose of the asset revaluation surplus The asset revaluation surplus includes the net revaluation increments and decrements arising from the revaluation of non-current assets. Impairment adjustments may also be recognised in the asset revaluation surplus.
(ii) Movements in the asset revaluation surplus
Land - Cemeteries and
Land under training centres
Land - Urban Rental
Properties
Buildings - Urban Rental
Dwellings
Buildings - Remote Rental
DwellingsTraining Centres Total
$000 $000 $000 $000 $000 $000
2018-19
Balance as at 1 July 2018
1 826 670 961 167 567 718 693 2 211 1 561 258
Transfer to accumulated funds
- (1 246) (1 770) (16 076) - (19 092)
Transfers in/(out) - 607 7 356 (7 906) - 57
Increment/(decrement)
1 (23 618) (45 590) 5 388 (230) (64 049)
Balance as at 30 June 2019 1 827 646 704 127 563 700 099 1 981 1 478 174
Land - Cemeteries and
Land under training centres
Land - Urban Rental
Properties
Buildings - Urban Rental
Dwellings
Buildings - Remote Rental
DwellingsTraining Centres Total
$000 $000 $000 $000 $000 $000
2017-18
Balance as at 1 July 2017
1 876 764 924 259 685 728 934 - 1 755 419
Transfer to accumulated funds
- (11 593) (2 548) (6 197) - (20 338)
Transfers in - 29 - - - 29
Increment/(decrement)
(50) (82 399) (89 570) (4 044) 2 211 (173 852)
Balance as at 30 June 2018 1 826 670 961 167 567 718 693 2 211 1 561 258

DEPARTMENT OF LOCAL GOVERNMENT, HOUSING AND COMMUNITY DEVELOPMENT ANNUAL REPORT 2018-19 119
22. FAIR VALUE MEASUREMENT Fair value is the price that would be received to sell an asset or paid to transfer a liability in an orderly transaction between market participants at the measurement date.
Fair value measurement of a non-financial asset takes into account a market participant’s ability to generate economic benefits by using the asset in its highest and best use or by selling it to another market participant that would use the asset in its highest and best use. The highest and best use takes into account the use of the asset that is physically possible, legally permissible and financially feasible.
When measuring fair value, the valuation techniques used maximise the use of relevant observable inputs and minimise the use of unobservable inputs. Unobservable inputs are used to the extent that sufficient relevant and reliable observable inputs are not available for similar assets/liabilities.
Observable inputs are publicly available data that are relevant to the characteristics of the assets/liabilities being valued. Observable inputs used by the agency include, but are not limited to, published sales data for land and general office buildings.
Unobservable inputs are data, assumptions and judgments that are not available publicly, but are relevant to the characteristics of the assets/liabilities being valued. Such inputs include internal agency adjustments to observable data to take account of particular and potentially unique characteristics/functionality of assets/liabilities and assessments of physical condition and remaining useful life.
All assets and liabilities for which fair value is measured or disclosed in the financial statements are categorised within the following fair value hierarchy based on the inputs used:
Level 1 – inputs are quoted prices in active markets for identical assets or liabilities;
Level 2 – inputs are inputs other than quoted prices included within Level 1 that are observable for the asset or liability, either directly or indirectly; and
Level 3 – inputs are unobservable.
The fair value of financial instruments is determined on the following basis:
• the fair value of cash, deposits, advances, receivables and payables approximates their carrying amount, which is also their amortised cost
• the fair value of derivative financial instruments are derived using current market yields and exchange rates appropriate to the instrument and
• the fair value of other monetary financial assets and liabilities is based on discounting to present value the expected future cash flows by applying current market interest rates for assets and liabilities with similar risk profiles.

FINANCIAL REPORTS120
a) Fair value hierarchyThe agency does not recognise any financial assets or liabilities at fair value as these are recognised at amortised cost. The carrying amounts of these financial assets and liabilities approximates their fair value.
The table below presents non-financial assets recognised at fair value in the Balance Sheet categorised by levels of inputs used to compute fair value.
LEVEL 1 LEVEL 2 LEVEL 3 TOTAL FAIR VALUE
$000 $000 $000 $000
2018-19
Asset classes
Land - cemeteries and land under training centres
- - 3 651 3 651
Land - urban rental properties
- 707 204 - 707 204
Buildings - urban rental dwellings
- 708 842 - 708 842
Buildings - remote rental dwellings
- - 1 659 618 1 659 618
Buildings -training centres
- - 5 470 5 470
Construction work in progress
- - 60 216 60 216
Plant and equipment - - 800 800
Total - 1 416 046 1 729 755 3 145 801
There were no transfers between Level 1 and Levels 2 or 3 during 2018-19.
LEVEL 1 LEVEL 2 LEVEL 3 TOTAL FAIR VALUE
$000 $000 $000 $000
2017-18
Asset classes
Land - cemeteries and land under training centres
- - 3 650 3 650
Land - urban rental properties
- 732 034 - 732 034
Buildings - urban rental dwellings
- 695 412 - 695 412
Buildings - remote rental dwellings
- - 1 657 585 1 657 585
Buildings -training centres
- - 5 953 5 953
Construction work in progress
- - 59 582 59 582
Plant and equipment - - 1 212 1 212
Total - 1 427 446 1 727 982 3 155 428
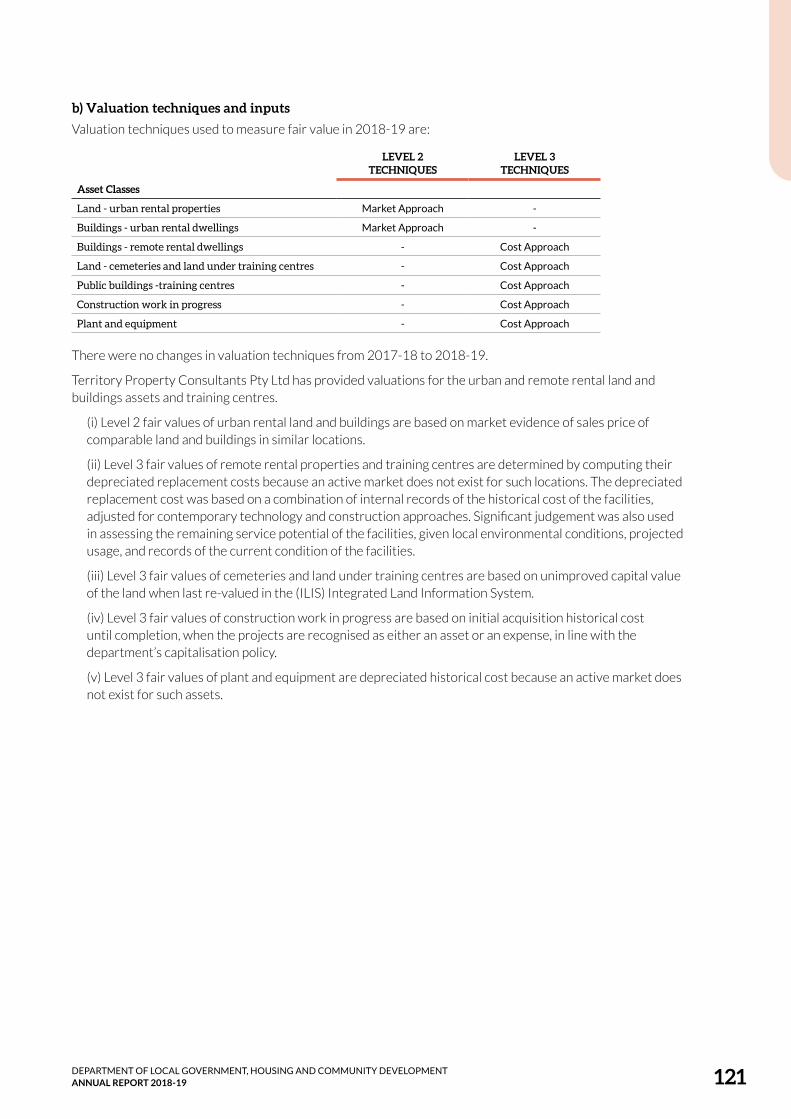
DEPARTMENT OF LOCAL GOVERNMENT, HOUSING AND COMMUNITY DEVELOPMENT ANNUAL REPORT 2018-19 121
b) Valuation techniques and inputsValuation techniques used to measure fair value in 2018-19 are:
LEVEL 2 TECHNIQUES
LEVEL 3 TECHNIQUES
Asset Classes
Land - urban rental properties Market Approach -
Buildings - urban rental dwellings Market Approach -
Buildings - remote rental dwellings - Cost Approach
Land - cemeteries and land under training centres - Cost Approach
Public buildings -training centres - Cost Approach
Construction work in progress - Cost Approach
Plant and equipment - Cost Approach
There were no changes in valuation techniques from 2017-18 to 2018-19.
Territory Property Consultants Pty Ltd has provided valuations for the urban and remote rental land and buildings assets and training centres.
(i) Level 2 fair values of urban rental land and buildings are based on market evidence of sales price of comparable land and buildings in similar locations.
(ii) Level 3 fair values of remote rental properties and training centres are determined by computing their depreciated replacement costs because an active market does not exist for such locations. The depreciated replacement cost was based on a combination of internal records of the historical cost of the facilities, adjusted for contemporary technology and construction approaches. Significant judgement was also used in assessing the remaining service potential of the facilities, given local environmental conditions, projected usage, and records of the current condition of the facilities.
(iii) Level 3 fair values of cemeteries and land under training centres are based on unimproved capital value of the land when last re-valued in the (ILIS) Integrated Land Information System.
(iv) Level 3 fair values of construction work in progress are based on initial acquisition historical cost until completion, when the projects are recognised as either an asset or an expense, in line with the department’s capitalisation policy.
(v) Level 3 fair values of plant and equipment are depreciated historical cost because an active market does not exist for such assets.
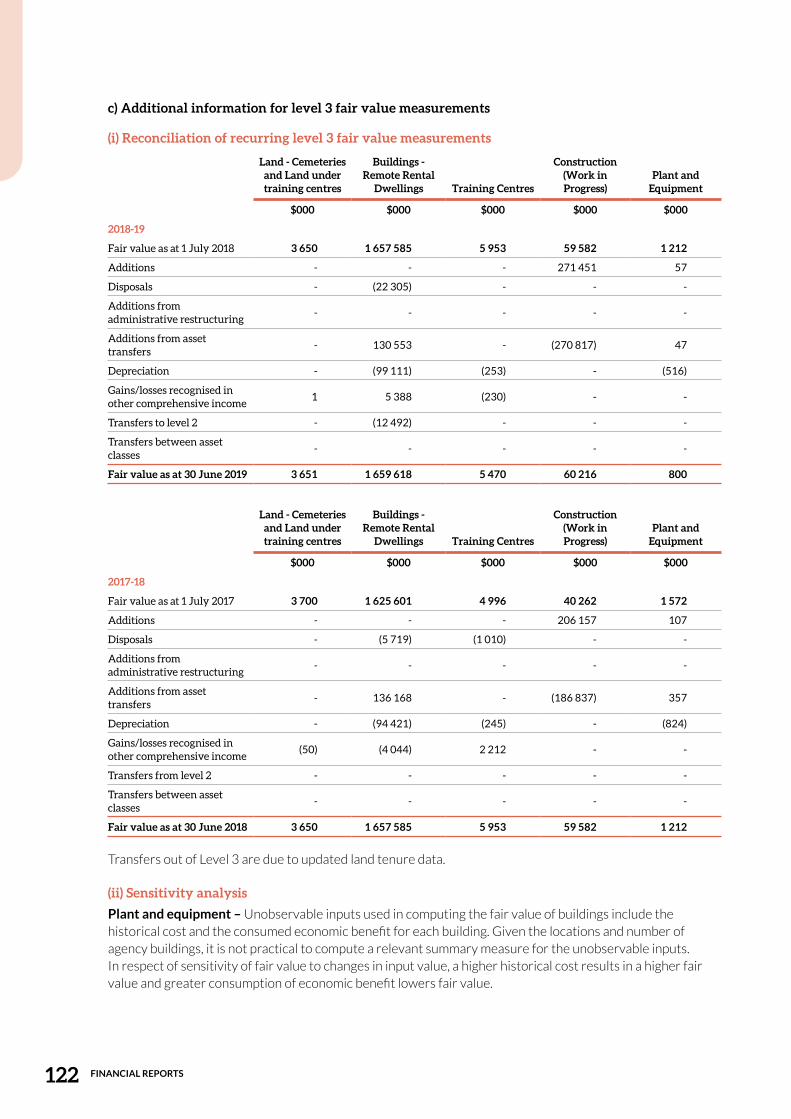
FINANCIAL REPORTS122
c) Additional information for level 3 fair value measurements
(i) Reconciliation of recurring level 3 fair value measurements
Land - Cemeteries and Land under training centres
Buildings - Remote Rental
Dwellings Training Centres
Construction (Work in Progress)
Plant and Equipment
$000 $000 $000 $000 $000
2018-19
Fair value as at 1 July 2018 3 650 1 657 585 5 953 59 582 1 212
Additions - - - 271 451 57
Disposals - (22 305) - - -
Additions from administrative restructuring
- - - - -
Additions from asset transfers
- 130 553 - (270 817) 47
Depreciation - (99 111) (253) - (516)
Gains/losses recognised in other comprehensive income
1 5 388 (230) - -
Transfers to level 2 - (12 492) - - -
Transfers between asset classes
- - - - -
Fair value as at 30 June 2019 3 651 1 659 618 5 470 60 216 800
Land - Cemeteries and Land under training centres
Buildings - Remote Rental
Dwellings Training Centres
Construction (Work in Progress)
Plant and Equipment
$000 $000 $000 $000 $000
2017-18
Fair value as at 1 July 2017 3 700 1 625 601 4 996 40 262 1 572
Additions - - - 206 157 107
Disposals - (5 719) (1 010) - -
Additions from administrative restructuring
- - - - -
Additions from asset transfers
- 136 168 - (186 837) 357
Depreciation - (94 421) (245) - (824)
Gains/losses recognised in other comprehensive income
(50) (4 044) 2 212 - -
Transfers from level 2 - - - - -
Transfers between asset classes
- - - - -
Fair value as at 30 June 2018 3 650 1 657 585 5 953 59 582 1 212
Transfers out of Level 3 are due to updated land tenure data.
(ii) Sensitivity analysisPlant and equipment – Unobservable inputs used in computing the fair value of buildings include the historical cost and the consumed economic benefit for each building. Given the locations and number of agency buildings, it is not practical to compute a relevant summary measure for the unobservable inputs. In respect of sensitivity of fair value to changes in input value, a higher historical cost results in a higher fair value and greater consumption of economic benefit lowers fair value.

DEPARTMENT OF LOCAL GOVERNMENT, HOUSING AND COMMUNITY DEVELOPMENT ANNUAL REPORT 2018-19 123
Remote rental dwellings and training centres – Unobservable inputs used in computing the fair value of buildings include the new replacement costs on a per structure basis, have been ascertained from analysis of remote residential construction contracts for new constructions over the past year, on either a whole or part basis, information received from major construction contractors/architects/quantity surveyors and engineers cross referenced to Rawlinson’s, Cordell’s and the Building Economists guidelines to derive construction cost rates on a per square metre/net area modern equivalent basis.
Useful economic life determinations on a per structure basis have been undertaken with reference to historic information, individual construction/engineering characteristics and associated obsolescent factors (to include technical, structural, economic and functional features) and industry standards as identified by the Australian Taxation Office and the Institute of Chartered Accountants in Australia. Remote residential housing and associated infrastructure are generally accepted to have useful economic lives of between 20-40 years, however individual units will vary dependent on construction type, location, utility, alternate use and related service features and functions. For the purposes of this valuation a useful economic life of 30 years has been applied in all instances with the exception of Government Employee Housing (GEH) which have a higher quality of internal fit-out and fittings, and these have had a useful economic life of 40 years applied. The Training Centre generally has a useful economic life of between 30 to 40 years.
Given the locations and number of agency buildings, it is not practical to compute a relevant summary measure for the unobservable inputs. In respect of sensitivity of fair value to changes in input value, a higher replacement cost results in a higher fair value and greater consumption of economic benefit lowers fair value.
23. FINANCIAL INSTRUMENTSA financial instrument is a contract that gives rise to a financial asset of one entity and a financial liability or equity instrument of another entity. Financial instruments held by the Department of Local Government, Housing and Community Development include cash and deposits, receivables, payables and finance leases. The agency has limited exposure to financial risks as discussed below.
Financial instrumentsA financial instrument is a contract that gives rise to a financial asset of one entity and a financial liability or equity instrument of another entity.
Financial assets and liabilities are recognised on the Balance Sheet when the agency becomes a party to the contractual provisions of the financial instrument. The agency’s financial instruments include cash and deposits; receivables; advances; investments loan and placements; payables; advances received; borrowings and derivatives.
Due to the nature of operating activities, certain financial assets and financial liabilities arise under statutory obligations rather than a contract. Such financial assets and liabilities do not meet the definition of financial instruments as per AASB 132 Financial Instruments Presentation. These include statutory receivables arising from taxes including GST and penalties.
The Department of Local Government, Housing and Community Development has limited exposure to financial risks as discussed below.
Exposure to interest rate risk, foreign exchange risk, credit risk, price risk and liquidity risk arise in the normal course of activities. The agency’s investments, loans and placements, and borrowings are predominantly managed through the Northern Territory Treasury Corporation (NTTC) adopting strategies to minimise the risk. Derivative financial arrangements are also utilised to manage financial risks inherent in the management of these financial instruments. These arrangements include swaps, forward interest rate agreements and other hedging instruments to manage fluctuations in interest or exchange rates.

FINANCIAL REPORTS124
a) Categorisation of financial instrumentsThe carrying amounts of the agency’s financial assets and liabilities by category are disclosed in the table below.
2018-19 Categorisation of financial instruments
Fair value through profit or loss
Mandatorily at fair value
Designated at fair value Amortised cost
Fair value through other
comprehensive income Total
$000 $000 $000 $000 $000
Cash and deposits - 33 185 - - 33 185
Receivables1 - - 7 738 - 7 738
Advances - - - - -
Total Financial Assets - 33 185 7 738 - 40 923
Deposits held1 - 5 897 - - 5 897
Payables1 - 7 225 - - 7 225
Advances unearned rev - 3 720 - - 3 720
Loans - - 69 479 - 69 479
Finance lease liabilities - - 23 333 - 23 333
Total Financial Liabilities - 16 842 92 812 - 109 654
2017-18 Categorisation of financial instruments
Fair value through profit or loss
Held for trading
Designated at fair value
Held to maturity
investments
Financial assets -
Loans and receivables
Financial assets -
available for sale
Financial Liabilities
- amortised cost Total
$000 $000 $000 $000 $000 $000 $000
Cash and deposits - 105 706 - - - - 105 706
Receivables1 - - - 11 833 - - 11 833
Advances - - - 667 - - 667
Total Financial Assets - 105 706 - 12 500 - - 118 206
Deposits held1 - 5 678 - - - - 5 678
Payables1 - 10 783 - - - - 10 783
Advances - 5 326 - - - - 5 326
Loans - - - - - 72 072 72 072
Finance lease liabilities - - - - - 22 840 22 840
Total Financial Liabilities - 21 787 - - - 94 912 116 699
1 Total amounts disclosed here exclude statutory amounts, as these are not within the scope of AASB 7. Therefore, the total will not reconcile to the amount as per the Balance Sheet.

DEPARTMENT OF LOCAL GOVERNMENT, HOUSING AND COMMUNITY DEVELOPMENT ANNUAL REPORT 2018-19 125
Classification of financial instruments from 1 July 2018From 1 July 2018, the agency classifies its financial assets in the following measurement categories:
• those to be measured subsequently at fair value (either through other comprehensive income (OCI) or through profit or loss), and
• those to be measure at amortised cost.
The classification depends on the agency’s business model for managing the financial assets and the contractual terms of the cash flows.
For assets measured at fair value, gains and losses will either be recorded in profit or loss or OCI. For investments in equity instruments that are not held for trading, the agency has made an irrevocable election at the time of initial recognition to account for the equity investment at fair value through other comprehensive income (FVOCI).
The agency reclassifies debt investments when and only when its business model for managing those assets changes.
At initial recognition, the agency measures a financial asset at its fair value plus, in the case of a financial asset not at fair value through profit or loss (FVTPL), transaction costs that are directly attributable to the acquisition of the financial asset. Transaction costs of financial assets carried at FVTPL are expensed in profit or loss.
Financial assets with embedded derivatives are considered in their entirety when determining whether their cash flows are solely payment of principal and interest.
Debt instruments
Subsequent measurement of debt instruments depends on the agency’s business model for managing the asset and the cash flow characteristics of the asset. There are three measurement categories into which the agency classifies its debt instruments:
• Amortised cost: Assets that are held for collection of contractual cash flows where those cash flows represent solely payments of principal and interest are measured at amortised cost. Interest income from these financial assets is calculated using the effective interest rate method. Any gain or loss arising on derecognition is recognised directly in profit or loss and presented in other gains/(losses).
• FVOCI: Assets that are held for collection of contractual cash flows and for selling the financial assets, where the assets’ cash flows represent solely payments of principal and interest, are measured at FVOCI. Movements in the carrying amount are taken through OCI, except for the recognition of impairment gains or losses and interest income which are recognised in profit or loss. When the financial asset is derecognised, the cumulative gain or loss previously recognised in OCI is reclassified from equity to profit or loss and recognised in other gains/(losses). Interest income from these financial assets is calculated using the effective interest rate method.
• FVTPL: Assets that do not meet the criteria for amortised cost or FVOCI are measured at FVTPL. A gain or loss on a debt investment that is subsequently measured at FVTPL is recognised in profit or loss and presented net within other gains/(losses) in the period in which it arises.

FINANCIAL REPORTS126
Equity instruments
The agency subsequently measures all equity investments at fair value. Where the agency’s management has elected to present fair value gains and losses on equity investments in OCI, there is no subsequent reclassification of fair value gains and losses to profit or loss following the derecognition of the investment. Dividends from such investments continue to be recognised in profit or loss as other income when the agency’s right to receive payments is established.
Changes in the fair value of financial assets at FVTPL are recognised in other gains/(losses) in the statement of profit or loss as applicable. Impairment losses (and reversal of impairment losses) on equity investments measured at FVOCI are not reported separately from other changes in fair value.
Financial liabilities are classified into the following categories either at FVTPL or at amortised cost. The classification and measurement of financial liabilities under AASB 9 is substantially the same as in AASB 139, except where an entity designates financial liabilities at FVTPL. For such liabilities, the fair value changes of liabilities designated at FVTPL are presented as follows:
• the fair value changes attributable to changes in the liability’s credit risk are recognised in OCI; and
• the remaining changes in the fair value are recognised in profit or loss.
Classification of financial instruments until 30 June 2018The agency has elected not to restate comparative information. As a result, the comparative information provided continues to be accounted for in accordance with AASB 139.
Financial assets are classified into the following categories:
• financial assets at fair value through profit or loss
• held-to-maturity investments
• loans and receivables and
• available-for-sale financial assets.
Financial liabilities are classified into the following categories:
• financial liabilities at fair value through profit or loss (FVTPL) and
• financial liabilities at amortised cost.
Financial assets or financial liabilities at fair value through profit or lossFinancial instruments are classified as at FVTPL when the instrument is either held for trading or is designated as at FVTPL. Financial instruments classified as at FVTPL are initially and subsequently measured at fair value. Gains or losses on these assets are recognised in the net result for the year.
Held-to-maturity investmentsNon-derivative financial assets with fixed or determinable payments and fixed maturity dates that the entity has the positive intent and ability to hold to maturity are classified as held-to-maturity investments. Held-to-maturity investments are recorded at amortised cost using the effective interest method less impairment, with revenue recognised on an effective yield basis.
Loans and receivablesLoans and are non-derivative financial assets with fixed or determinable payments that are not quoted in an active market other than those held for trading and available for sale. Loans and receivables exclude statutory receivables. Loans and receivables are measured initially at fair value and subsequently at amortised cost using the effective interest rate method less impairment

DEPARTMENT OF LOCAL GOVERNMENT, HOUSING AND COMMUNITY DEVELOPMENT ANNUAL REPORT 2018-19 127
Available-for-sale financial assetsAvailable-for-sale financial assets are those non-derivative financial assets, principally equity securities that are designated as available-for-sale or are not classified as any of the three preceding categories. Available-for-sale financial assets are initially measured at fair value plus transaction costs and subsequently at fair value. Gains or losses are recognised as a separate component of equity until the investment is derecognised or until the investment is determined to be impaired, at which time the cumulative gain or loss previously reported in equity is recognised in the Comprehensive Operating Statement.
Financial liabilities at amortised costFinancial instrument liabilities measured at amortised cost include all advances received, finance lease liabilities and borrowings. Amortised cost is calculated using the effective interest method.
DerivativesThe agency enters into a variety of derivative financial instruments to manage its exposure to interest rate risk. The agency does not speculate on trading of derivatives.
Derivatives are initially recognised at fair value on the date a derivative contract is entered in to and are subsequently remeasured at their fair value at each reporting date. The resulting gain or loss is recognised in the Comprehensive Operating Statement immediately unless the derivative is designated and qualifies as an effective hedging instrument, in which event, the timing of the recognition in the Comprehensive Operating Statement depends on the nature of the hedge relationship. Application of hedge accounting will only be available where specific designation and effectiveness criteria are satisfied.
Netting of swap transactionsThe agency, from time to time, may facilitate certain structured finance arrangements, where a legally recognised right to set-off financial assets and liabilities exists, and the Territory intends to settle on a net basis. Where these arrangements occur, the revenues and expenses are offset and the net amount is recognised in the Comprehensive Operating Statement.
b) Credit riskThe agency has limited credit risk exposure (risk of default). In respect of any dealings with organisations external to Government, the agency has adopted a policy of only dealing with credit worthy organisations and obtaining sufficient collateral or other security where appropriate, as a means of mitigating the risk of financial loss from defaults.
The carrying amount of financial assets recorded in the financial statements, net of any allowances for losses, represents the agency’s maximum exposure to credit risk without taking account of the value of any collateral or other security obtained.
Credit risk relating to receivables is disclosed in note 14.

FINANCIAL REPORTS128
c) Liquidity riskLiquidity risk is the risk that the agency will not be able to meet its financial obligations as they fall due. The agency’s approach to managing liquidity is to ensure that it will always have sufficient funds to meet its liabilities when they fall due. This is achieved by ensuring that minimum levels of cash are held in the Agency bank account to meet various current employee and supplier liabilities. The agency’s exposure to liquidity risk is minimal. Cash injections are available from the Central Holding Authority in the event that one-off extraordinary expenditure items arise that deplete cash to levels that compromise the agency’s ability to meet its financial obligations.
The following tables detail the agency’s remaining contractual maturity for its financial liabilities, calculated based on undiscounted cash flows at reporting date. The undiscounted cash flows in these tables differ from the amounts included in the Balance Sheet which are based on discounted cash flows.
2019 Maturity analysis for financial liabilities
Variable Interest Rate Fixed Interest Rate
Carrying amount
Less than a Year
1 to 5 Years
More than 5 Years
Less than a Year
1 to 5 Years
More than 5 Years
Non-Interest Bearing Total
Weighted Average
$000 $000 $000 $000 $000 $000 $000 $000 %
Liabilities
Deposits held 5 897 - - - - - - 5 897 5 897 -
Payables 7 225 - - - - - - 7 225 7 225 -
Advances - Unearned Rev
3 720 - - - - - - 3 720 3 720 -
Loans 69 479 - - - 11 736 46 943 73 162 - 131 841 12.90%
Finance lease liabilities 23 333 - - - 1 380 5 520 38 132 - 45 032 4.51%
Total financial liabilities 109 654 - - - 13 116 52 463 111 294 16 842 193 715
2018 Maturity analysis for financial liabilities
Variable Interest Rate Fixed Interest Rate
Carrying amount
Less than a Year
1 to 5 Years
More than 5 Years
Less than a Year
1 to 5 Years
More than 5 Years
Non-Interest Bearing Total
Weighted Average
$000 $000 $000 $000 $000 $000 $000 $000 %
Liabilities
Deposits held 5 678 - - - - - - 5 678 5 678 -
Payables 10 783 - - - - - - 10 783 10 783 -
Advances - Unearned Rev
5 326 - - - - - - 5 326 5 326
Loans 72 072 - - - 11 736 46 943 84 898 - 143 577 12.90%
Finance lease liabilities 22 840 - - - 1 351 5 406 38 453 - 45 210 4.60%
Total financial liabilities 116 699 - - - 13 087 52 349 123 351 21 787 210 574
d) Market riskMarket risk is the risk that the fair value of future cash flows of a financial instrument will fluctuate because of changes in market prices. It comprises interest rate risk, price risk and currency risk.
i) Interest rate riskThe Department of Local Government, Housing and Community Development is not exposed to interest rate risk as agency financial assets and financial liabilities, with the exception of NT Treasury Corporation (NTTC) loans and remote land finance leases are non interest bearing. NTTC loans and finance lease arrangements are established on a fixed interest rate and as such do not expose the Department of Local

DEPARTMENT OF LOCAL GOVERNMENT, HOUSING AND COMMUNITY DEVELOPMENT ANNUAL REPORT 2018-19 129
Government, Housing and Community Development to interest rate risk. Interest rate exposure for NTTC loans and remote land finance leases are outlined in maturity analysis for financial liabilities tables above.
ii) Price riskThe Department of Local Government, Housing and Community Development is not exposed to price risk as Department of Local Government, Housing and Community Development does not hold units in unit trusts.
iii) Currency riskThe Department of Local Government, Housing and Community Development is not exposed to currency risk as Department of Local Government, Housing and Community Development does not hold borrowings denominated in foreign currencies or transactional currency exposures arising from purchases in a foreign currency.
24. RELATED PARTIES
i) Related partiesThe Department of Local Government, Housing and Community Development is a government administrative entity and is wholly owned and controlled by the Territory Government. Related parties of the department include:
• the Portfolio Minister and key management personnel (KMP) because they have authority and responsibility for planning, directing and controlling the activities of the department directly; and
• spouses, children and dependents who are close family members of the Portfolio Minister or KMP; and
• all public sector entities that are controlled and consolidated into the whole of government financial statements; and
• any entities controlled or jointly controlled by KMP’s or the Portfolio Minister or controlled or jointly controlled by their close family members.
ii) Key management personnel (KMP)Key management personnel of the Department of Local Government, Housing and Community Development are those persons having authority and responsibility for planning, directing and controlling the activities of Department of Local Government, Housing and Community Development. These include the Minister for Local Government, Housing and Community Development, the Chief Executive Officer and 20 members of the executive team.
iii) Remuneration of key management personnelThe details below excludes the salaries and other benefits of Minister for Housing and Community Development as the Minister’s remunerations and allowances are payable by the Department of the Legislative Assembly and consequently disclosed within the Treasurer’s Annual Financial Statements.
The aggregate compensation of key management personnel of Department of Local Government, Housing and Community Development is set out below:
2019 2018
$000 $000
Short-term benefits 4 586 4 067
Termination benefits - 99
Total 4 586 4 166

FINANCIAL REPORTS130
iv) Related party transactions:Transactions with Northern Territory Government controlled entities
The departments’ primary ongoing source of funding is received from the Central Holding Authority in the form of output and capital appropriation and on-passed Commonwealth national partnership and specific purpose payments.
The following table provides quantitative information about related party transactions entered into during the year with all other Northern Territory Government controlled entities apart from the Central Holding Authority payments listed above.
Related PartyRevenue from related parties
Payments to related parties
Amounts owed by related parties
Amounts owed to related parties
$000 $000 $000 $000
2018-19
All NTG Government departments 18 729 170 851 2 373 71 816
2017-18
All NTG Government departments 17 628 130 256 446 73 685
The departments’ transactions with other government entities relate to:
• Revenue from employee housing to other agencies
• Payments for vehicles, information technology systems, corporate services provided by other agencies and loans from Northern Territory Treasury Corporation
• Amounts owed by other agencies relate to employee housing to other agencies
• Amounts owed to other agencies are loans from Northern Territory Treasury Corporation
Other related party transactions are as follows:
Given the breadth and depth of Territory Government activities, related parties will transact with the Territory Public sector in a manner consistent with other members of the public including paying stamp duty and other government fees and charges and therefore these transactions have not been disclosed.
Of 21 KMPs, 20 have provided a signed “Related party Disclosures Declaration Form” to the agency. Based on those declarations, the department has no other related party transactions with KMP’s and could not identify for the one, who has left the department.
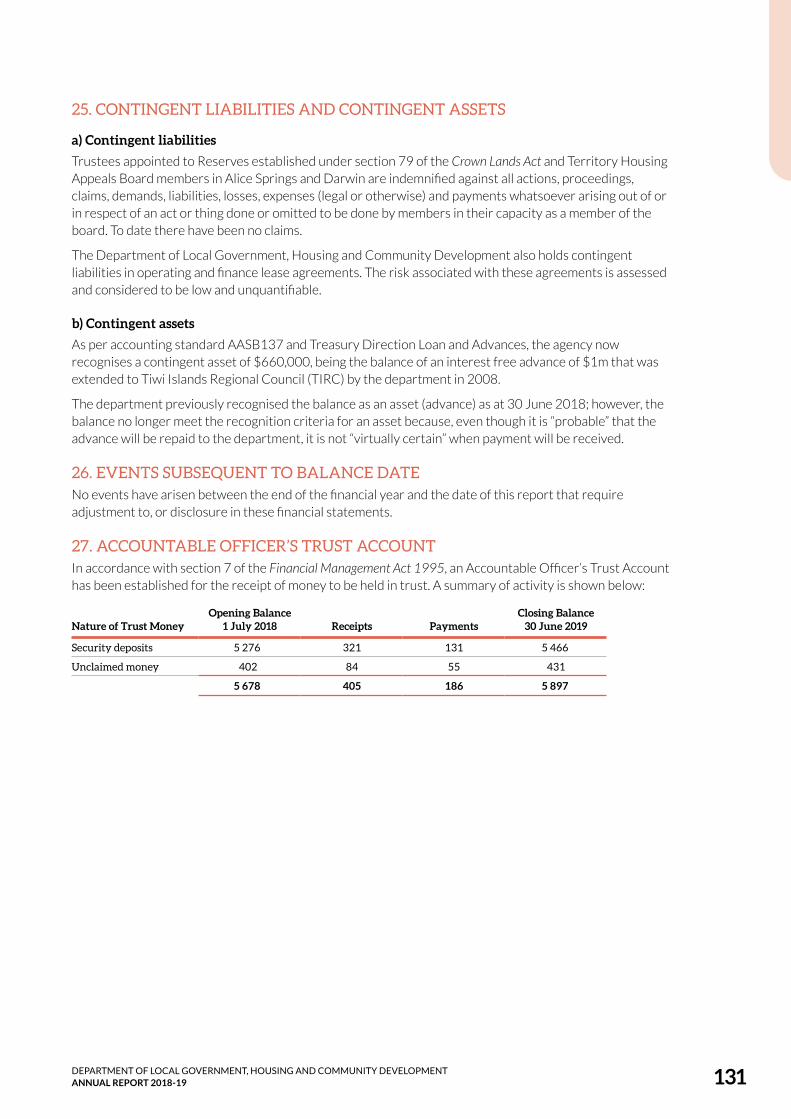
DEPARTMENT OF LOCAL GOVERNMENT, HOUSING AND COMMUNITY DEVELOPMENT ANNUAL REPORT 2018-19 131
25. CONTINGENT LIABILITIES AND CONTINGENT ASSETS
a) Contingent liabilitiesTrustees appointed to Reserves established under section 79 of the Crown Lands Act and Territory Housing Appeals Board members in Alice Springs and Darwin are indemnified against all actions, proceedings, claims, demands, liabilities, losses, expenses (legal or otherwise) and payments whatsoever arising out of or in respect of an act or thing done or omitted to be done by members in their capacity as a member of the board. To date there have been no claims.
The Department of Local Government, Housing and Community Development also holds contingent liabilities in operating and finance lease agreements. The risk associated with these agreements is assessed and considered to be low and unquantifiable.
b) Contingent assetsAs per accounting standard AASB137 and Treasury Direction Loan and Advances, the agency now recognises a contingent asset of $660,000, being the balance of an interest free advance of $1m that was extended to Tiwi Islands Regional Council (TIRC) by the department in 2008.
The department previously recognised the balance as an asset (advance) as at 30 June 2018; however, the balance no longer meet the recognition criteria for an asset because, even though it is “probable” that the advance will be repaid to the department, it is not “virtually certain” when payment will be received.
26. EVENTS SUBSEQUENT TO BALANCE DATENo events have arisen between the end of the financial year and the date of this report that require adjustment to, or disclosure in these financial statements.
27. ACCOUNTABLE OFFICER’S TRUST ACCOUNTIn accordance with section 7 of the Financial Management Act 1995, an Accountable Officer’s Trust Account has been established for the receipt of money to be held in trust. A summary of activity is shown below:
Nature of Trust MoneyOpening Balance
1 July 2018 Receipts PaymentsClosing Balance
30 June 2019
Security deposits 5 276 321 131 5 466
Unclaimed money 402 84 55 431
5 678 405 186 5 897

FINANCIAL REPORTS132
28. BUDGETARY INFORMATION
Comprehensive Operating Statement 2018-19Actual2018-19 Original
Budget Variance Note
$000 $000 $000
INCOME
Grants and subsidies revenue
Current 37 728 34 846 2 882
Capital - - -
Appropriation
Output 311 795 297 325 14 470
Commonwealth 90 906 23 230 67 676 1
Sales of goods and services 90 096 80 217 9 879
Goods and services received free of charge 9 937 8 860 1 077
Other income 2 248 30 2 218
TOTAL INCOME 542 710 444 508 98 202
EXPENSES
Employee expenses 71 858 46 686 25 172 2
Administrative expenses
Purchases of goods and services 21 640 16 994 4 646
Repairs and maintenance 49 948 32 853 17 095 3
Property management 61 073 58 360 2 713
Depreciation and amortisation 133 783 129 659 4 124
Asset expenses 25 914 - 25 914 4
Other administrative expenses 17 999 8 860 9 139
Grants and subsidies expenses
Current 291 013 251 463 39 550 5
Capital 113 772 54 038 59 734 6
Community service obligations 3 414 3 657 ( 243)
Interest expenses 10 282 9 143 1 139
Loss on disposal of assets 158 (2 000) 2 158
TOTAL EXPENSES 800 854 609 713 191 141
NET (DEFICIT) (258 144) (165 205) (92 939)
OTHER COMPREHENSIVE INCOME
Items that will not be reclassified to net deficit
Changes in asset revaluation surplus (63 993) - (63 993)
TOTAL OTHER COMPREHENSIVE INCOME (63 993) - (63 993)
COMPREHENSIVE RESULT (322 137) (165 205) (156 932)
Notes: Explanations relate to significant variations greater than 10 per cent and $10 million.
1. Budget adjustments related to timing of 2018 Commonwealth Appropriation not received until 2019 financial year, and the impact of the new National Partnership for Remote Housing Northern Territory.
2. Increase in budget following negotiation of the new National Partnership for Remote Housing Northern Territory
3. Variation relates to carryovers of unspent 2018 preventative maintenance budget and an end of year adjustment to expense 2019 work in progress that does not meet capitalisation criteria.

DEPARTMENT OF LOCAL GOVERNMENT, HOUSING AND COMMUNITY DEVELOPMENT ANNUAL REPORT 2018-19 133
4. Write off of demolished dwellings, plus adjustments made as a result of the continued review of assets recorded in the Asset Register.
5. Increased budget following finalisation of the new National Partnership for Remote Housing Northern Territory, followed by a consequential budget redistribution, and unfunded expenditure on Natural Disaster Relief Arrangements to support Local Government bodies.
6. Additional budget to support Town Camps provided through NT Government’s $100 million industry Stimulus program, and capital works program expenditure transferred to capital grants to fund subdivision requirements for remote housing.

FINANCIAL REPORTS134
Balance Sheet 2018-19 Actual2018-19 Original
Budget Variance Note
$000 $000 $000
ASSETS
Current Assets
Cash and deposits 33 185 64 409 (31 224) 1
Receivables 15 575 17 583 (2 008)
Prepayments 4 450 2 000 2 450
Advances - 667 (667)
Total Current Assets 53 210 84 659 (31 449)
Non-Current Assets
Property, plant and equipment 3 168 456 3 536 869 (368 413) 2
Total Non-Current Assets 3 168 456 3 536 869 (368 413)
TOTAL ASSETS 3 221 665 3 621 528 (399 862)
LIABILITIES
Current Liabilities
Deposits held 431 6 874 ( 6 443)
Payables 7 225 3 788 3 437
Borrowings and advances 3 276 1 564 1 712
Provisions 8 762 7 563 1 199
Other liabilities 3 720 4 762 (1 042)
Total Current Liabilities 23 414 24 551 (1 137)
Non-Current Liabilities
Borrowings and advances 89 536 88 940 596
Deposits held 5 466 - 5 466
Total Non-Current Liabilities 95 002 88 940 6 062
TOTAL LIABILITIES 118 416 113 491 4 925
NET ASSETS 3 103 249 3 508 037 (404 788)
EQUITY
Capital 2 276 762 2 308 563 (31 801)
Reserves 1 478 174 1 755 418 (277 244) 3
Accumulated funds (651 687) (555 944) (95 743)
TOTAL EQUITY 3 103 249 3 508 037 (404 788)
Notes: Explanations relate to significant variations greater than 10 per cent and $10 million.
1. Variations are detailed in the Cash Flow Statement and notes thereto. The variation reflects the net result of higher deficit from Operating Activities than budgeted, lower than budgeted cash outflows from Investing Activities, and lower than budgeted Financing Receipts from the Commonwealth.
2. Adjustment to Original Budget due to the 2018 actuals being substantially less than the budget ($187 million), together with net cash budget adjustments (-$17 million) during the year. Expenditure for 2019 was $104 million less than the cash budget, following the transfer of $45 million of expenditure to capital grants, and a $64 million revaluation decrement on end of 2019 values. Full details of property, plant and equipment movements can be found in note 15.
3. Effect of movement in Revaluation Reserve account in 2018 (adjust to opening balance - original budget) and 2019.

DEPARTMENT OF LOCAL GOVERNMENT, HOUSING AND COMMUNITY DEVELOPMENT ANNUAL REPORT 2018-19 135
Cash Flow Statement 2018-19 Actual2018-19 Original
Budget Variance Note
$000 $000 $000
CASH FLOWS FROM OPERATING ACTIVITIES
Operating receipts
Grants and subsidies received
Current 37 728 34 846 2 882
Appropriation
Output 311 795 297 325 14 470
Commonwealth 90 906 23 230 67 676 1
Receipts from sales of goods and services 101 517 80 247 21 270 2
Total operating receipts 541 946 435 648 106 298
Operating payments
Payments to employees (71 257) (46 686) (24 571) 3
Payments for goods and services (147 767) (108 207) (39 560) 4
Grants and subsidies paid
Current (291 014) (251 463) (39 551) 5
Capital (113 112) (54 038) (59 074) 6
Community service obligations (3 414) (3 657) 243
Interest paid (10 283) (9 144) (1 139)
Total operating payments (636 847) (473 195) (163 652)
Net cash from/(used in) operating activities (94 901) (37 547) (57 354)
CASH FLOWS FROM INVESTING ACTIVITIES
Investing receipts
Proceeds from asset sales 1 751 20 200 (18 449) 7
Repayment of Advances 7 - 7
Total investing receipts 1 758 20 200 ( 18 442)
Investing payments
Purchases of assets (229 641) (319 669) 90 028 8
Total investing payments (229 641) (319 669) 90 028
Net cash from/(used in) investing activities (227 883) (299 469) 71 586
CASH FLOWS FROM FINANCING ACTIVITIES
Financing receipts
Deposits received 218 - 218
Equity injections -
Capital appropriation 140 506 69 456 71 050 9
Commonwealth appropriation 85 469 116 013 (30 544) 10
Other equity injections 27 000 - 27 000 11
Total financing receipts 253 193 185 469 67 724
Financing payments
Repayment of borrowings (2 592) (2 592) -
Finance lease payments (338) - (338)
Total financing payments (2 930) (2 592) (338)
Net cash from/(used in) financing activities 250 263 182 877 67 386
Net increase (decrease) in cash held (72 521) (154 139) 81 618
Cash at beginning of financial year 105 706 218 548 (112 842)
CASH AT END OF FINANCIAL YEAR 33 185 64 409 (31 224)

FINANCIAL REPORTS136
Notes: Explanations relate to significant variations greater than 10 per cent and $10 million.
1. Budget adjustments related to timing of 2018 Commonwealth Appropriation not received until 2019 financial year, and the impact of the new National Partnership for Remote Housing Northern Territory.
2. The variance relates to GST receivables from the Australian Taxation Office that are not budgeted.
3. Increase in budget following negotiation of the new National Partnership for Remote Housing Northern Territory.
4. Variation relates to carryovers of unspent 2018 preventative maintenance budget, an end of year adjustment to expense 2019 work in progress that does not meet capitalisation criteria, and an unbudgeted GST creditor.
5. Increased budget following finalisation of the new National Partnership for Remote Housing Northern Territory, followed by a consequential budget redistribution, and unfunded expenditure on Natural Disaster Relief Arrangements to support Local Government bodies.
6. Variation relates to land servicing arrangements originally budgeted for under Investing Payments - Purchase of Assets.
7. Reduced asset sales due to uneconomic returns in current real estate market.
8. Reduced budget due to various initiatives during the year, and variation to planned delivery resulting in the transfer of funds for remote housing subdivisions to capital grants.
9. Increased NT government appropriation due to delay in finalising new National Partnership Agreement on Remote Housing and the NT Government’s initiative with the $100 million Industry Stimulus program.
10. Reduction reflects transfer of a portion of budgeted Commonwealth funding for the new National Partnership Agreement on Remote Housing to Output Appropriation to fund Property and Tenancy Management.
11. Department of Treasury and Finance provided equity funding at end of the financial year due to expected capital funding from Commonwealth received in fiscal 2020.

NT HOMEOWNERSHIP 5
Financial Reports - NT Home OwnershipNT Home Ownership is a Government Business Division (GBD) that provides low deposit home loan options through HomeBuild Access Loans, helping Territorians on the pathway to home ownership and housing independence.
Reflecting the changing market conditions, the number of Territorians accessing NT Home Ownership loan products decreased during 2018-19.
HOMEBUILD ACCESS LOANS HomeBuild Access Loan products are aimed at the purchase and construction of new homes to increase housing supply and provide home ownership opportunities for Territorians unable to access the private finance market.
Purchase price limits of $475 000 for a one or two-bedroom home and $550 000 for homes with three or more bedrooms provides HomeBuild Access home ownership opportunities at the more affordable end of the housing market.
There are two primary home loan products available under this scheme, the HomeBuild Access Low Deposit Loan, and the Homebuild Access Subsidised Interest Rate Loan.
The HomeBuild Access Low Deposit Loan:
• provides second mortgage home loans up to 17.5% of the purchase price
• provides first mortgage finance of 80% of the purchase price through People’s Choice Credit Union
• is available to Territorians, including those who own or have previously owned a home in Australia.
The HomeBuild Access Subsidised Interest Rate Loan provides home loan finance for up to 98% of the purchase price. It is only available to first home buyers and has income eligibility limits from $80 000 for single applicants through to $127 500 for households of six or more people.
Details of the Low Deposit Loans and Subsidised Interest Rate Loans funded during the 2017–18 and 2018–19 financial years are as follows:
Financial YearNumber of Low Deposit Loans
Low Deposit Loans funded $000
Number of Subsidised Interest
Rate Loans
Subsidised Interest Rate Loans funded
$000Total First Home
Buyers
2017-18 105 8 792 3 1 192 81
2018-19 66 5 343 1 395 63
Those accessing the HomeBuild Access Subsidised Interest Rate Loan can also access an interest free Fee Assistance Loan of up to $10 000. This loan helps with the costs associated with buying a home, like conveyancing costs. Applicants can use surplus funds as a part of their 2% deposit.
HomeBuild Access also offers an Off-the-Plan Deposit Loan for Territorians with approved finance through a HomeBuild Access Low Deposit Loan.
The Off-the-Plan Deposit Loan provides up to 10% of the purchase price on a new property or land for a deposit on an off-the-plan purchase.
NT HOME OWNERSHIP138

Key Performance Indicators:
Key Deliverables 2018-19 ESTIMATE 2018-19ACTUAL
Output Group
Loan portfolio balance¹ $156m $155m
Loan turnover rate² 9.5% -4%
Loan accounts in arrears greater than 30 days³ 3.16% 3.15%
Households assisted into home ownership4 90 71
Notes:
1. Reduction reflective of slowing down of new lending.
2. Reflects slowing in market conditions, both in new lending and property sales.
3. Lower than anticipated due to the waiver of irrecoverable debts.
4. HomeBuild Access Loan approvals and public housing tenant purchases lower than anticipated due to slowing in market conditions.
DEPARTMENT OF LOCAL GOVERNMENT, HOUSING AND COMMUNITY DEVELOPMENT ANNUAL REPORT 2018-19 139
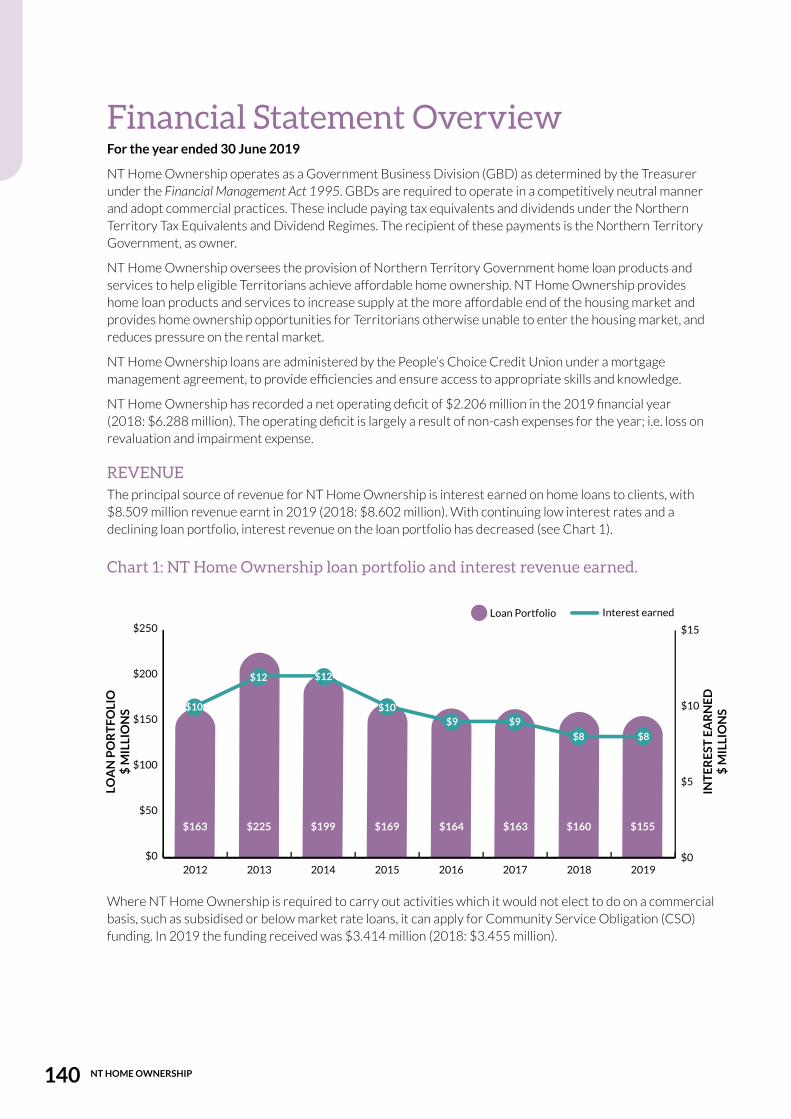
Financial Statement OverviewFor the year ended 30 June 2019
NT Home Ownership operates as a Government Business Division (GBD) as determined by the Treasurer under the Financial Management Act 1995. GBDs are required to operate in a competitively neutral manner and adopt commercial practices. These include paying tax equivalents and dividends under the Northern Territory Tax Equivalents and Dividend Regimes. The recipient of these payments is the Northern Territory Government, as owner.
NT Home Ownership oversees the provision of Northern Territory Government home loan products and services to help eligible Territorians achieve affordable home ownership. NT Home Ownership provides home loan products and services to increase supply at the more affordable end of the housing market and provides home ownership opportunities for Territorians otherwise unable to enter the housing market, and reduces pressure on the rental market.
NT Home Ownership loans are administered by the People’s Choice Credit Union under a mortgage management agreement, to provide efficiencies and ensure access to appropriate skills and knowledge.
NT Home Ownership has recorded a net operating deficit of $2.206 million in the 2019 financial year (2018: $6.288 million). The operating deficit is largely a result of non-cash expenses for the year; i.e. loss on revaluation and impairment expense.
REVENUEThe principal source of revenue for NT Home Ownership is interest earned on home loans to clients, with $8.509 million revenue earnt in 2019 (2018: $8.602 million). With continuing low interest rates and a declining loan portfolio, interest revenue on the loan portfolio has decreased (see Chart 1).
Chart 1: NT Home Ownership loan portfolio and interest revenue earned.
$0
$50
$100
$150
$200
$250
20192018201720162015201420132012$0
$5
$10
$15
LOA
N P
OR
TF
OLI
O$
MIL
LIO
NS
INT
ER
EST
EA
RN
ED
$ M
ILLI
ON
S
Loan Portfolio Interest earned
$163 $225 $199 $169 $164 $163 $160 $155
$10
$12 $12
$10
$9 $9
$8 $8
Where NT Home Ownership is required to carry out activities which it would not elect to do on a commercial basis, such as subsidised or below market rate loans, it can apply for Community Service Obligation (CSO) funding. In 2019 the funding received was $3.414 million (2018: $3.455 million).
NT HOME OWNERSHIP140
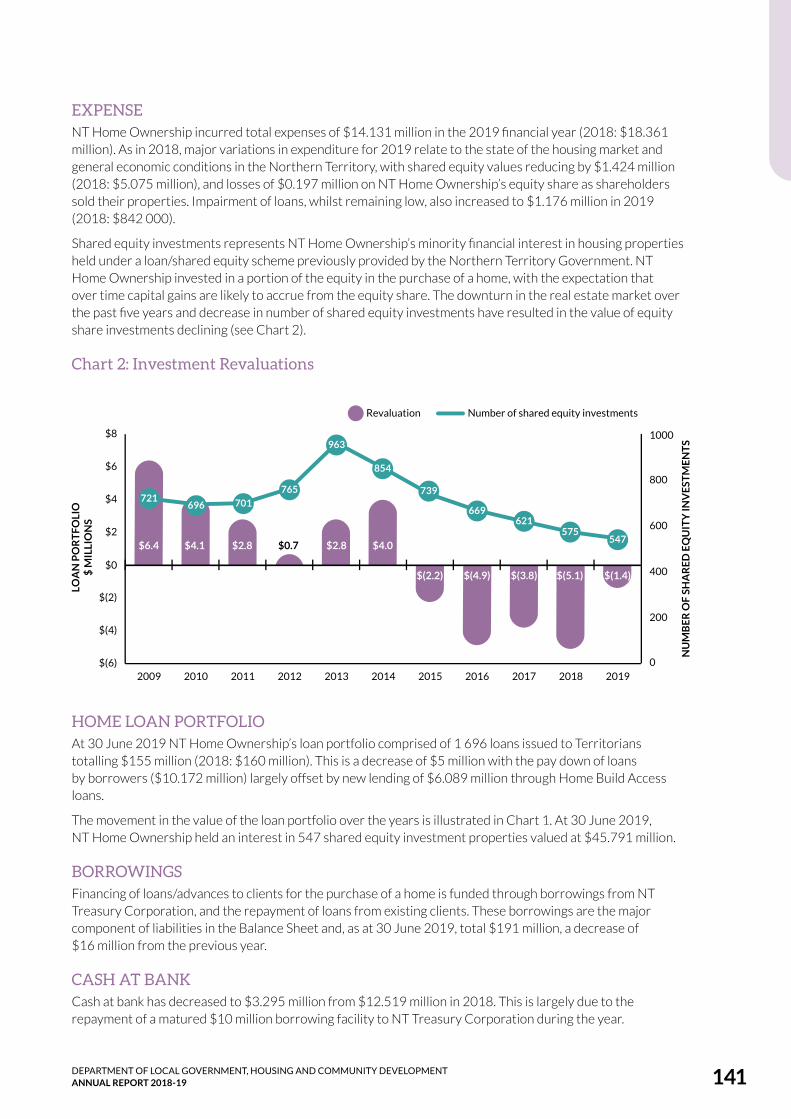
EXPENSENT Home Ownership incurred total expenses of $14.131 million in the 2019 financial year (2018: $18.361 million). As in 2018, major variations in expenditure for 2019 relate to the state of the housing market and general economic conditions in the Northern Territory, with shared equity values reducing by $1.424 million (2018: $5.075 million), and losses of $0.197 million on NT Home Ownership’s equity share as shareholders sold their properties. Impairment of loans, whilst remaining low, also increased to $1.176 million in 2019 (2018: $842 000).
Shared equity investments represents NT Home Ownership’s minority financial interest in housing properties held under a loan/shared equity scheme previously provided by the Northern Territory Government. NT Home Ownership invested in a portion of the equity in the purchase of a home, with the expectation that over time capital gains are likely to accrue from the equity share. The downturn in the real estate market over the past five years and decrease in number of shared equity investments have resulted in the value of equity share investments declining (see Chart 2).
Chart 2: Investment Revaluations
$(6)
$(4)
$(2)
$0
$2
$4
$6
$8
201920182017201620152014201320122011201020090
200
400
600
800
1000
LOA
N P
OR
TF
OLI
O$
MIL
LIO
NS
NU
MB
ER
OF
SH
AR
ED
EQ
UIT
Y IN
VE
STM
EN
TS
Revaluation Number of shared equity investments
$6.4 $4.1 $2.8 $0.7 $2.8 $4.0
$(2.2) $(4.9) $(3.8) $(5.1) $(1.4)
721696 701
765
963
854
739
669621
575547
HOME LOAN PORTFOLIOAt 30 June 2019 NT Home Ownership’s loan portfolio comprised of 1 696 loans issued to Territorians totalling $155 million (2018: $160 million). This is a decrease of $5 million with the pay down of loans by borrowers ($10.172 million) largely offset by new lending of $6.089 million through Home Build Access loans.
The movement in the value of the loan portfolio over the years is illustrated in Chart 1. At 30 June 2019, NT Home Ownership held an interest in 547 shared equity investment properties valued at $45.791 million.
BORROWINGSFinancing of loans/advances to clients for the purchase of a home is funded through borrowings from NT Treasury Corporation, and the repayment of loans from existing clients. These borrowings are the major component of liabilities in the Balance Sheet and, as at 30 June 2019, total $191 million, a decrease of $16 million from the previous year.
CASH AT BANKCash at bank has decreased to $3.295 million from $12.519 million in 2018. This is largely due to the repayment of a matured $10 million borrowing facility to NT Treasury Corporation during the year.
DEPARTMENT OF LOCAL GOVERNMENT, HOUSING AND COMMUNITY DEVELOPMENT ANNUAL REPORT 2018-19 141
NT HOME OWNERSHIP142

DEPARTMENT OF LOCAL GOVERNMENT, HOUSING AND COMMUNITY DEVELOPMENT ANNUAL REPORT 2018-19 143

CERTIFICATION OF THE FINANCIAL STATEMENTS
NT HOME OWNERSHIP144
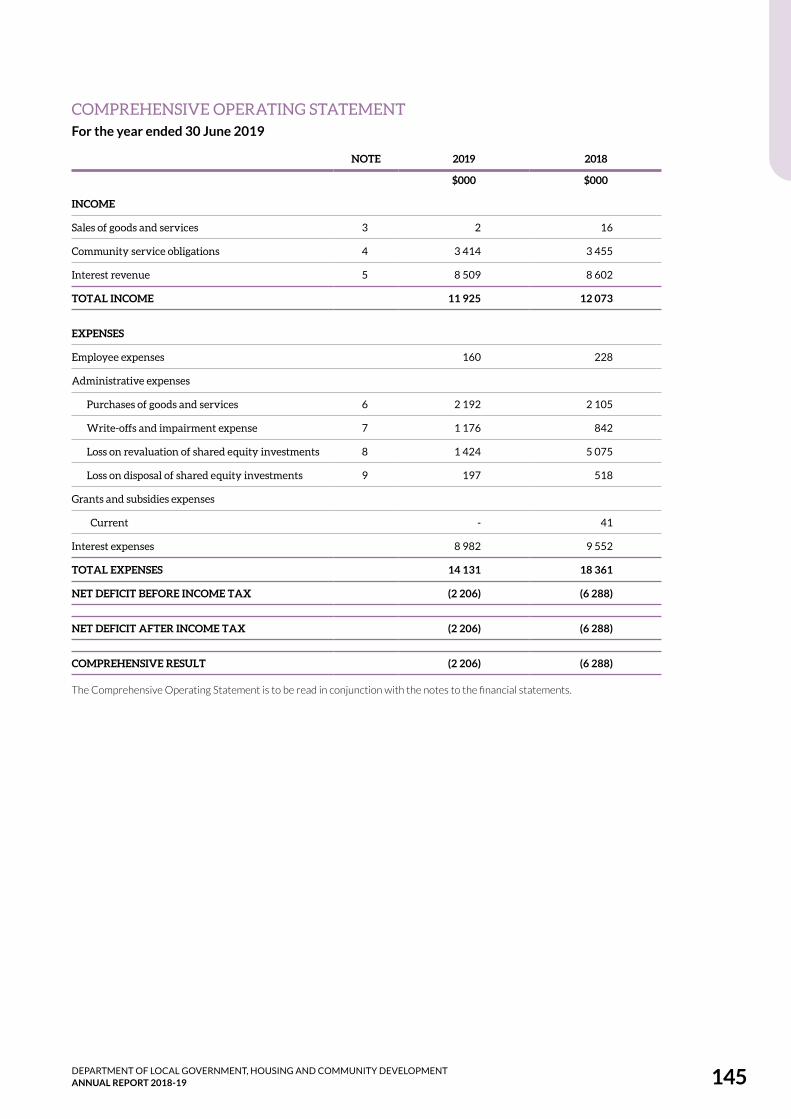
COMPREHENSIVE OPERATING STATEMENTFor the year ended 30 June 2019
NOTE 2019 2018
$000 $000
INCOME
Sales of goods and services 3 2 16
Community service obligations 4 3 414 3 455
Interest revenue 5 8 509 8 602
TOTAL INCOME 11 925 12 073
EXPENSES
Employee expenses 160 228
Administrative expenses
Purchases of goods and services 6 2 192 2 105
Write-offs and impairment expense 7 1 176 842
Loss on revaluation of shared equity investments 8 1 424 5 075
Loss on disposal of shared equity investments 9 197 518
Grants and subsidies expenses
Current - 41
Interest expenses 8 982 9 552
TOTAL EXPENSES 14 131 18 361
NET DEFICIT BEFORE INCOME TAX (2 206) (6 288)
NET DEFICIT AFTER INCOME TAX (2 206) (6 288)
COMPREHENSIVE RESULT (2 206) (6 288)
The Comprehensive Operating Statement is to be read in conjunction with the notes to the financial statements.
DEPARTMENT OF LOCAL GOVERNMENT, HOUSING AND COMMUNITY DEVELOPMENT ANNUAL REPORT 2018-19 145
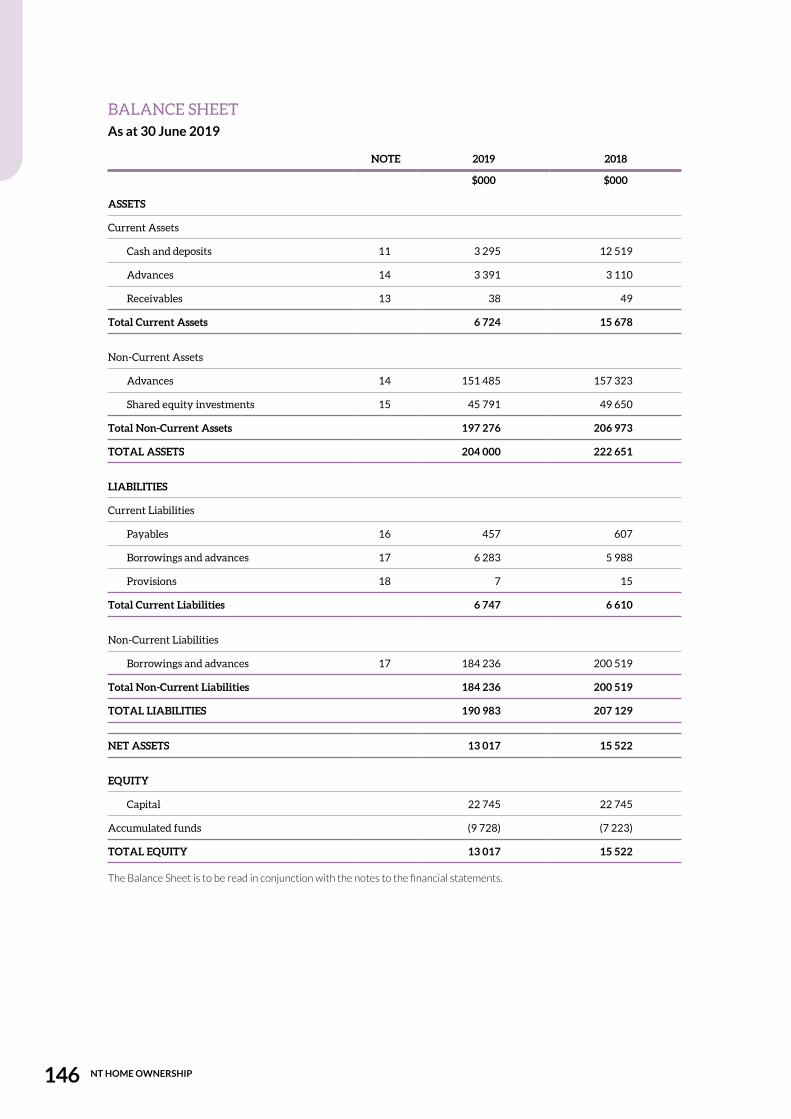
BALANCE SHEETAs at 30 June 2019
NOTE 2019 2018
$000 $000
ASSETS
Current Assets
Cash and deposits 11 3 295 12 519
Advances 14 3 391 3 110
Receivables 13 38 49
Total Current Assets 6 724 15 678
Non-Current Assets
Advances 14 151 485 157 323
Shared equity investments 15 45 791 49 650
Total Non-Current Assets 197 276 206 973
TOTAL ASSETS 204 000 222 651
LIABILITIES
Current Liabilities
Payables 16 457 607
Borrowings and advances 17 6 283 5 988
Provisions 18 7 15
Total Current Liabilities 6 747 6 610
Non-Current Liabilities
Borrowings and advances 17 184 236 200 519
Total Non-Current Liabilities 184 236 200 519
TOTAL LIABILITIES 190 983 207 129
NET ASSETS 13 017 15 522
EQUITY
Capital 22 745 22 745
Accumulated funds (9 728) (7 223)
TOTAL EQUITY 13 017 15 522
The Balance Sheet is to be read in conjunction with the notes to the financial statements.
NT HOME OWNERSHIP146
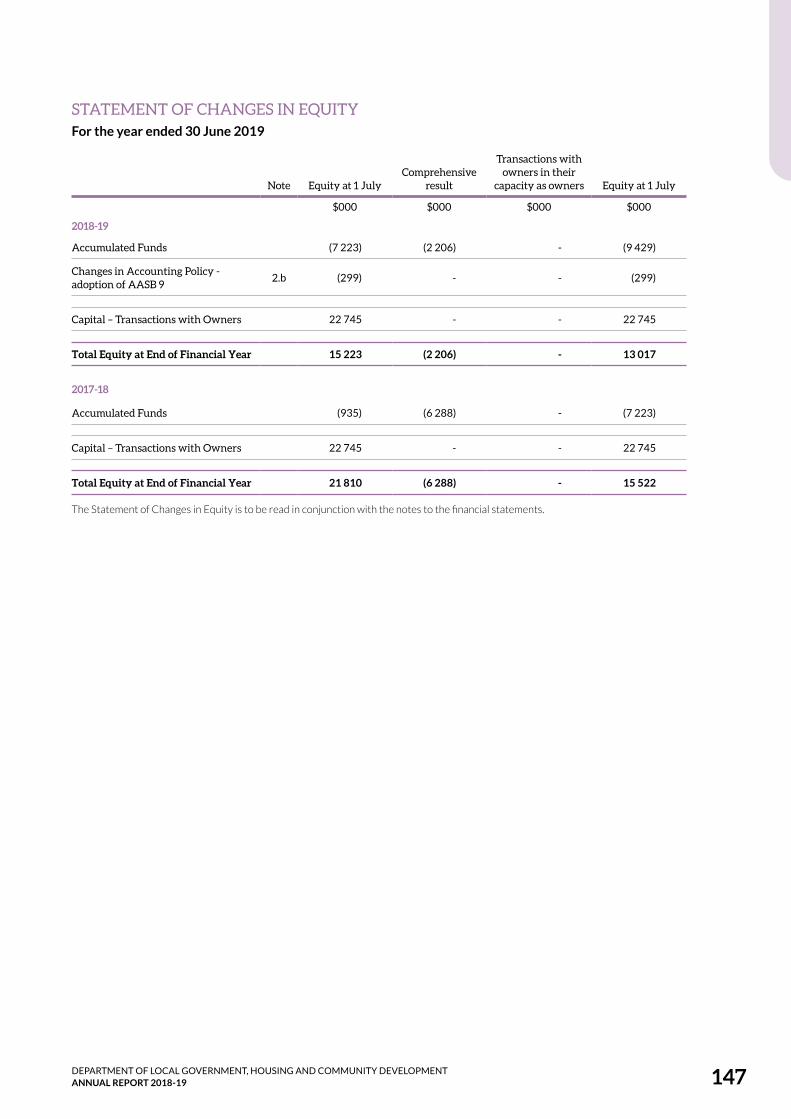
STATEMENT OF CHANGES IN EQUITYFor the year ended 30 June 2019
Note Equity at 1 July Comprehensive
result
Transactions with owners in their
capacity as owners Equity at 1 July
$000 $000 $000 $000
2018-19
Accumulated Funds (7 223) (2 206) - (9 429)
Changes in Accounting Policy - adoption of AASB 9
2.b (299) - - (299)
Capital – Transactions with Owners 22 745 - - 22 745
Total Equity at End of Financial Year 15 223 (2 206) - 13 017
2017-18
Accumulated Funds (935) (6 288) - (7 223)
Capital – Transactions with Owners 22 745 - - 22 745
Total Equity at End of Financial Year 21 810 (6 288) - 15 522
The Statement of Changes in Equity is to be read in conjunction with the notes to the financial statements.
DEPARTMENT OF LOCAL GOVERNMENT, HOUSING AND COMMUNITY DEVELOPMENT ANNUAL REPORT 2018-19 147

CASH FLOW STATEMENTFor the year ended 30 June 2019
NOTE 2019 2018
$000 $000
CASH FLOWS FROM OPERATING ACTIVITIES
Operating Receipts
Receipts from sales of goods and services and community service obligations
3 562 3 629
Interest received 8 521 8 590
Total Operating Receipts 12 083 12 219
Operating Payments
Payments to employees (169) (231)
Payments for goods and services (2 382) (2 306)
Grants and subsidies paid
Current - (41)
Interest paid (9 089) (9 851)
Total Operating Payments (11 640) (12 429)
Net Cash from Operating Activities 12 443 (210)
CASH FLOWS FROM INVESTING ACTIVITIES
Investing Receipts
Repayment of advances 10 172 12 600
Sales of investments 9 2 238 3 280
Total Investing Receipts 12 410 15 880
Investing Payments
Advances and investing payments (6 089) (10 432)
Total Investing Payments (6 089) (10 432)
Net Cash From Investing Activities 6 321 5 448
CASH FLOWS FROM FINANCING ACTIVITIES
Financing Receipts
Proceeds of borrowings - 10 000
Total Financing Receipts - 10 000
Financing Payments
Repayment of borrowings (15 988) (5 707)
Total Financing Payments (15 988) (5 707)
Net Cash from Financing Activities (15 988) 4 293
Net increase/(decrease) in cash held (9 224) 9 531
Cash at beginning of financial year 12 519 2 988
CASH AT END OF FINANCIAL YEAR 11 3 295 12 519
The Cash Flow Statement is to be read in conjunction with the notes to the financial statements.
NT HOME OWNERSHIP148
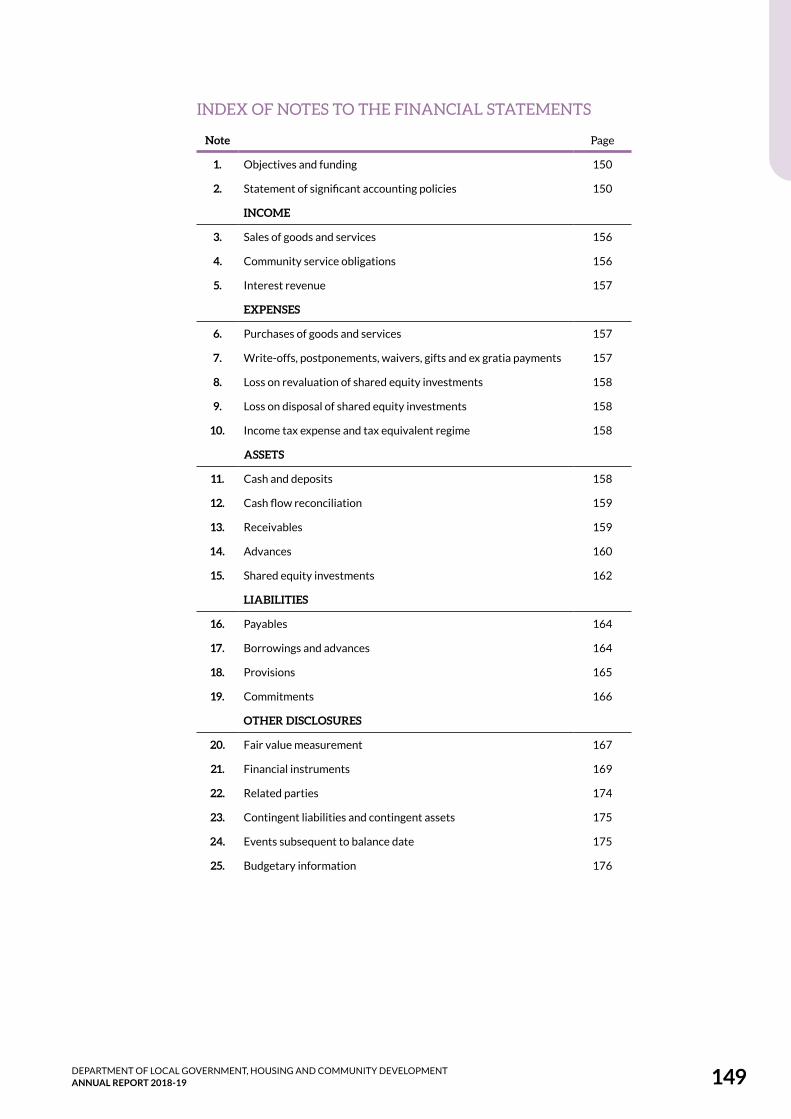
INDEX OF NOTES TO THE FINANCIAL STATEMENTS
Note Page
1. Objectives and funding 150
2. Statement of significant accounting policies 150
INCOME
3. Sales of goods and services 156
4. Community service obligations 156
5. Interest revenue 157
EXPENSES
6. Purchases of goods and services 157
7. Write-offs, postponements, waivers, gifts and ex gratia payments 157
8. Loss on revaluation of shared equity investments 158
9. Loss on disposal of shared equity investments 158
10. Income tax expense and tax equivalent regime 158
ASSETS
11. Cash and deposits 158
12. Cash flow reconciliation 159
13. Receivables 159
14. Advances 160
15. Shared equity investments 162
LIABILITIES
16. Payables 164
17. Borrowings and advances 164
18. Provisions 165
19. Commitments 166
OTHER DISCLOSURES
20. Fair value measurement 167
21. Financial instruments 169
22. Related parties 174
23. Contingent liabilities and contingent assets 175
24. Events subsequent to balance date 175
25. Budgetary information 176
DEPARTMENT OF LOCAL GOVERNMENT, HOUSING AND COMMUNITY DEVELOPMENT ANNUAL REPORT 2018-19 149
1. OBJECTIVES AND FUNDINGNT Home Ownership operates as a Government Business Division (GBD), as determined by the Treasurer under the Financial Management Act 1995. Under the Government Business Division Framework, government businesses declared to be a GBD are required to operate in a competitively neutral manner and adopt commercial practices. These include paying tax equivalents under the Northern Territory Tax Equivalents Regime and Dividend Regime to the Northern Territory Government, as owner.
NT Home Ownership provides home loan products and services to increase supply at the more affordable end of the housing market, provides more home ownership opportunities for Territorians otherwise unable to enter the market and reduces pressure on the rental market. Where NT Home Ownership carries out activities which it would not elect to do on a commercial basis, Community Service Obligation funding is provided through the Department of Local Government, Housing and Community Development appropriation for identifiable community or social benefits. See Note 4.
The home loans are administered under a management arrangement by the People’s Choice Credit Union. Additional information in relation to NT Home Ownership and its principal activities may be found in the performance section of the Annual Report.
2. STATEMENT OF SIGNIFICANT ACCOUNTING POLICIES
a) Statement of complianceThe financial statements have been prepared in accordance with the requirements of the Financial Management Act 1995 and related Treasurer’s Directions. The Financial Management Act 1995 requires NT Home Ownership to prepare financial statements for the year ended 30 June based on the form determined by the Treasurer. The form of agency financial statements is to include:
(i) a certification of the financial statements
(ii) a comprehensive operating statement
(iii) a balance sheet
(iv) a statement of changes in equity
(v) a cash flow statement
(vi) applicable explanatory notes to the financial statements.
b) Basis of accountingThe financial statements have been prepared using the accrual basis of accounting, which recognises the effect of financial transactions and events when they occur, rather than when cash is paid out or received.
Except where stated, the financial statements have also been prepared in accordance with the historical cost convention.
The form of the agency financial statements is also consistent with the requirements of Australian Accounting Standards. The effects of all relevant new and revised standards and interpretations issued by the Australian Accounting Standards Board (AASB) that are effective for the current annual reporting period have been evaluated.
Standards and interpretations effective from 2018-19
The following new and revised accounting standards and interpretations were effective for the first time in 2018-19:
AASB 9 Financial Instruments
The agency applied AASB 9 for the first time in 2018 19. AASB 9 Financial Instruments replaces AASB 139 Financial Instruments: Recognition and Measurement for annual periods beginning on or after 1 January 2018. The agency has not restated the comparative information, which continues to be reported under AASB 139. Where applicable, differences arising from the adoption of AASB 9 have been recognised directly in
NT HOME OWNERSHIP150

accumulated funds and other components of equity. The nature and effect of the changes as a result of adoption of this new accounting standard are described below.
Classification and measurement
Financial instruments have been reclassified into one of three measurement bases – amortised cost, fair value through other comprehensive income (FVOCI) and fair value through profit or loss (FVTPL). The classification of these instruments is based on the Agency’s business model for managing the financial assets and the contractual terms of the cash flows.
The classification and measurement requirements of AASB 9 did not have a significant impact to the agency. The following are the changes in the classification of the financial assets:
• The agency’s debt instruments are comprised of receivables and advances paid. These assets were classified as Advances and Receivables as at 30 June 2018 under AASB 139 and were measured at amortised cost. As these assets are held to collect contractual cash flows that are solely payments of principal and interest, they continue to be measured at amortised cost from 1 July 2018.
The agency has not designated any financial liabilities as at fair value through profit or loss. There are no changes in classification and measurement for the agency’s financial liabilities.
In summary, upon the adoption of AASB 9, the agency had the following reclassifications as at 1 July 2018:
AASB 9 CATEGORIES Balances at 1 July 2018
Balances at 30 June 2018)
Fair value through profit or lossAmortised
costFair value
through OCIMandatorily at fair value
Designated at fair value
AASB 139 categories $000 $000 $000 $000 $000
Loans and receivables
Receivables1 49 - - 49 -
Advances paid 160 433 - - 160 134 -
160 482 - - 160 183 -
1The change in carrying amount is a result of remeasurement adjustments for impairment. See discussion on impairment below.
Impairment
The adoption of AASB 9 requires the loss allowance to be measured using a forward-looking expected credit loss (ECL) approach, replacing AASB 139’s incurred loss approach. AASB 9 also requires a loss allowance to be recognised for all debt instruments other than those held at fair value through profit or loss.
Upon adoption of the new impairment model, the agency has recognised additional impairment losses which resulted in a decrease in opening accumulated surplus. A reconciliation of the ending impairment allowance under AASB 139 to the opening loss allowance under AASB 9 is detailed below.
AASB 9 CATEGORIES
IMPAIRMENT ALLOWANCE 30 JUNE 2018 RE-MEASUREMENT
LOSS ALLOWANCE 1 JULY 2018
AASB 139 categories $000 $000 $000
Loans and receivables
Receivables Amortised cost - - -
Advances paid Amortised cost 1 891 299 2 190
1 891 299 2 190
Several other amending standards and AASB interpretations have been issued that apply to the current reporting periods, but are considered to have no impact on public sector reporting.
DEPARTMENT OF LOCAL GOVERNMENT, HOUSING AND COMMUNITY DEVELOPMENT ANNUAL REPORT 2018-19 151
Standards and interpretations issued but not yet effective
No Australian Accounting Standards have been early adopted for 2018-19.
On the date of authorisation of the financial statements, the following standards and interpretations were in issue but are not yet effective and are expected to have an impact on future reporting periods:
AASB 16 Leases
AASB 16 Leases is effective for annual reporting periods beginning on or after 1 January 2019 and will be reported for the first time in 2019-20 financial statements. When effective, the standard will supersede AASB 117 Leases and require the majority of leases to be recognised on the balance sheet.
For lessees with operating leases, a right-of-use asset will now be included in the balance sheet together with a lease liability for all leases with a term of 12 months or more, unless the underlying assets are of low value. The comprehensive operating statement will no longer report operating lease rental payments. Instead, amortisation expense will be recognised relating to the right-of-use asset and interest expense relating to the lease liability.
The right-of-use asset will be amortised generally on a straight-line basis while the lease liability will reduce to reflect lease payments made and increase to reflect the interest on the liability. Consistent with methodology applied to other long term liabilities, the lease liability is discounted using the Territory bond rates. As the lease term progresses, the carrying amount of the asset (cost less accumulated amortisation) is likely to reduce more quickly than the liability, resulting in a lower net asset in the earlier stages of the lease arrangement.
The modified retrospective approach has been elected to transition to the new lease standard. This approach does not require restatement of comparative years and the cumulative impact is accounted for as an equal adjustment to the right-of-use asset and lease liabilities, thus, having no impact in agency’s net assets at initial adoption.
At the reporting date, this standard does not have any impact on NT Home Ownership.
For lessors, the finance and operating lease distinction remains largely unchanged.
AASB 1058 Income for Not-for-Profit Entities and AASB 15 Revenue from Contracts with Customers
AASB 1058 Income for Not-for-Profit Entities and AASB 15 Revenue from Contracts with Customers are effective for not-for-profit entities for annual reporting periods beginning on or after 1 January 2019 and will be reported for the first time in 2019-20 financial statements.
AASB 1058 clarifies and simplifies income-recognition requirements that apply to not-for-profit entities in conjunction with AASB 15.
Under AASB 15, revenue from agreements which are enforceable, have sufficiently specific performance obligations and transfer goods or services to the customer or third party beneficiary will be recognised when or as performance obligations are satisfied, and not immediately upon receipt as currently occurs. Consequently, more liabilities will be recognised in the balance sheet after adoption of this standard.
Where a transaction does not meet the criteria above or is classified as a donation transaction, revenue will accounted for in accordance with AASB 1058.
Impacts identified include:
• grants received to construct or acquire a non-financial asset will be recognised as a liability, and subsequently recognised as revenue as the performance obligations under the grant are satisfied. At present, such grants are recognised as revenue on receipt
• grants with an enforceable agreement and sufficiently specific performance obligations will be recognised as revenue progressively as the associated performance obligations are satisfied. At present, such grants are recognised as revenue on receipt
• grants that have an enforceable agreement but no specific performance obligations but have restrictions on the timing of expenditure will also continue to be recognised on receipt as time restriction on the use of funds is not sufficiently specific to create a performance obligation
NT HOME OWNERSHIP152

• grants that are not enforceable and or not sufficiently specific will not qualify for deferral, and will continue to be recognised as revenue on receipt
The modified retrospective approach has been elected to transition to the new revenue standards. This approach does not require restatement of comparative year with the cumulative impact adjusted to the opening accumulated funds.
At the reporting date, this standard does not have any impact on NT Home Ownership.
c) Reporting entityThe financial statements cover NT Home Ownership (NTHO) as an individual reporting entity.
NT Home Ownership (“the Agency”) is a Northern Territory agency established under the Interpretation Act Administrative Arrangements Order and a Government Business Division established under the Financial Management Act 1995.
The principal place of business of the Agency is: 47 Mitchell Street Darwin, Northern Territory.
d) Agency and Territory itemsThe financial statements of NT Home Ownership include income, expenses, assets, liabilities and equity over which NT Home Ownership has control (Agency items). Certain items, while managed by the agency, are controlled and recorded by the Territory rather than the agency (Territory items). Territory items are recognised and recorded in the Central Holding Authority as discussed below.
Central Holding Authority
The Central Holding Authority is the ‘parent body’ that represents the government’s ownership interest in Government-controlled entities.
The Central Holding Authority also records all Territory items, such as income, expenses, assets and liabilities controlled by the government and managed by agencies on behalf of the government. The main Territory item is Territory income, which includes taxation and royalty revenue, Commonwealth general purpose funding (such as GST revenue), fines, and statutory fees and charges.
The Central Holding Authority also holds certain Territory assets not assigned to agencies as well as certain Territory liabilities that are not practical or effective to assign to individual agencies such as unfunded superannuation and long service leave.
The Central Holding Authority recognises and records all Territory items, and as such, these items are not included in the agency’s financial statements.
NT Home Ownership does not have any Territory items other than unfunded superannuation and long service leave.
e) ComparativesWhere necessary, comparative information for the 2017-18 financial year has been reclassified to provide consistency with current year disclosures.
f) Presentation and rounding of amountsAmounts in the financial statements and notes to the financial statements are presented in Australian dollars and have been rounded to the nearest thousand dollars, with amounts of $500 or less being rounded down to zero. Figures in the financial statements and notes may not equate due to rounding.
g) Changes in accounting policiesThere have been no changes to accounting policies adopted in 2018-19 as a result of management decisions.
h) Accounting judgments and estimates The preparation of the financial report requires the making of judgments and estimates that affect the recognised amounts of assets, liabilities, revenues and expenses and the disclosure of contingent liabilities.
DEPARTMENT OF LOCAL GOVERNMENT, HOUSING AND COMMUNITY DEVELOPMENT ANNUAL REPORT 2018-19 153
The estimates and associated assumptions are based on historical experience and various other factors that are believed to be reasonable under the circumstances, the results of which form the basis for making judgments about the carrying values of assets and liabilities that are not readily apparent from other sources. Actual results may differ from these estimates.
The estimates and underlying assumptions are reviewed on an ongoing basis. Revisions to accounting estimates are recognised in the period in which the estimate is revised if the revision affects only that period, or in the period of the revision and future periods if the revision affects both current and future periods.
Judgments and estimates that have significant effects on the financial statements are disclosed in the relevant notes to the financial statements.
i) Goods and services taxIncome, expenses and assets are recognised net of the amount of Goods and Services Tax (GST), except where the amount of GST incurred on a purchase of goods and services is not recoverable from the Australian Tax Office (ATO). In these circumstances the GST is recognised as part of the cost of acquisition of the asset or as part of the expense.
Receivables and payables are stated with the amount of GST included. The net amount of GST recoverable from, or payable to, the ATO is included as part of receivables or payables in the Balance Sheet.
Cash flows are included in the Cash Flow Statement on a gross basis. The GST components of cash flows arising from investing and financing activities, which are recoverable from, or payable to, the ATO are classified as operating cash flows. Commitments and contingencies are disclosed net of the amount of GST recoverable or payable unless otherwise specified.
j) Contributions by and distributions to governmentThe agency may receive contributions from Government where the Government is acting as owner of the agency. Conversely, the agency may make distributions to Government. In accordance with the Financial Management Act 1995 and Treasurer’s Directions, certain types of contributions and distributions, including those relating to administrative restructures, have been designated as contributions by, and distributions to, Government. These designated contributions and distributions are treated by the agency as adjustments to equity.
The Statement of Changes in Equity provides additional information in relation to contributions by, and distributions to, Government.
k) DividendsThe agency provides for a dividend payable at the rate of 50 percent of net surplus after tax in accordance with the Northern Territory Government’s dividend policy. No dividend is payable by NT Home Ownership in respect of the 2018-19 financial year.
l) Economic dependenceThe agency, NT Home Ownership, is established by the Financial Management Act 1995 as a Government Business Division and is subject to the direction of the Minister for Local Government, Housing and Community Development. The agency operates in a competitively neutral manner and adopts commercial practices. Where NT Home Ownership carries out activities which it would not elect to do on a commercial basis, Community Service Obligation funding is provided through the Department of Local Government, Housing and Community Development appropriation for identifiable community or social benefits. Community Service Obligation payments are reflected separately as revenue in the Comprehensive Operating Statement. These statements are prepared on a “going concern” basis in the expectation that such funding will continue. See Note 4.
m) Nature and purpose of reservesNT Home Ownership currently does not hold any reserves.
NT HOME OWNERSHIP154

n) Administration feesAdministration fees were paid by the agency throughout the year to People’s Choice Credit Union, for services provided in respect of home loans. See Note 6.
o) Income Income encompasses both revenue and gains.
Income is recognised at the fair value of the consideration received, exclusive of the amount of GST. Exchanges of goods or services of the same nature and value without any cash consideration being exchanged are not recognised as income.
Sale of Goods
Revenue from the sale of goods is recognised (net of returns, discounts and allowances) when:
• the significant risks and rewards of ownership of the goods have transferred to the buyer
• the agency retains neither continuing managerial involvement to the degree usually associated with ownership nor effective control over the goods sold
• the amount of revenue can be reliably measured
• it is probable that the economic benefits associated with the transaction will flow to the agency
• the costs incurred or to be incurred in respect of the transaction can be measured reliably.
Rendering of Services
Revenue from rendering services is recognised by reference to the stage of completion of the contract. The revenue is recognised when:
• the amount of revenue, stage of completion and transaction costs incurred can be reliably measured
• it is probable that the economic benefits associated with the transaction will flow to the agency.
Interest Revenue
Interest revenue is recognised as it accrues, taking into account the effective yield on the financial asset. Refer Note 5.
Disposal of Assets - Investments
A gain or loss on disposal of assets is included as a gain or loss on the date control of the asset passes to the buyer, usually when an unconditional contract of sale is signed. The gain or loss on disposal is calculated as the difference between the carrying amount of the asset at the time of disposal and the net proceeds on disposal. Refer to Note 9.
Community Service Obligation funding
Community Service Obligation funding is received from the Northern Territory Government where the agency is required to carry out activities on a non-commercial basis. Revenue in respect of this funding is recognised in the period in which the agency gains control of the funds. Refer Note to 4.
Contributions of Assets
Contributions of assets and contributions to assist in the acquisition of assets, being non reciprocal transfers, are recognised, unless otherwise determined by Government, as gains when the agency obtains control of the asset or contribution. Contributions are recognised at the fair value received or receivable.
DEPARTMENT OF LOCAL GOVERNMENT, HOUSING AND COMMUNITY DEVELOPMENT ANNUAL REPORT 2018-19 155
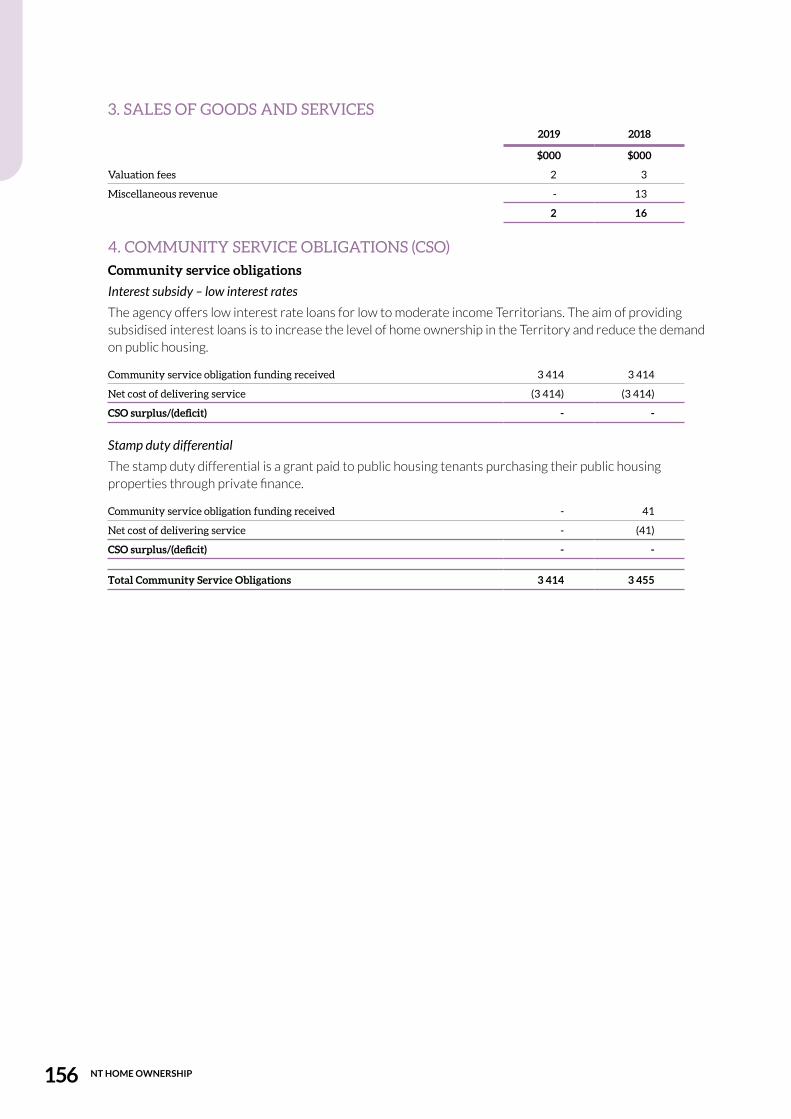
3. SALES OF GOODS AND SERVICES 2019 2018
$000 $000
Valuation fees 2 3
Miscellaneous revenue - 13
2 16
4. COMMUNITY SERVICE OBLIGATIONS (CSO) Community service obligations Interest subsidy – low interest rates
The agency offers low interest rate loans for low to moderate income Territorians. The aim of providing subsidised interest loans is to increase the level of home ownership in the Territory and reduce the demand on public housing.
Community service obligation funding received 3 414 3 414
Net cost of delivering service (3 414) (3 414)
CSO surplus/(deficit) - -
Stamp duty differential
The stamp duty differential is a grant paid to public housing tenants purchasing their public housing properties through private finance.
Community service obligation funding received - 41
Net cost of delivering service - (41)
CSO surplus/(deficit) - -
Total Community Service Obligations 3 414 3 455
NT HOME OWNERSHIP156
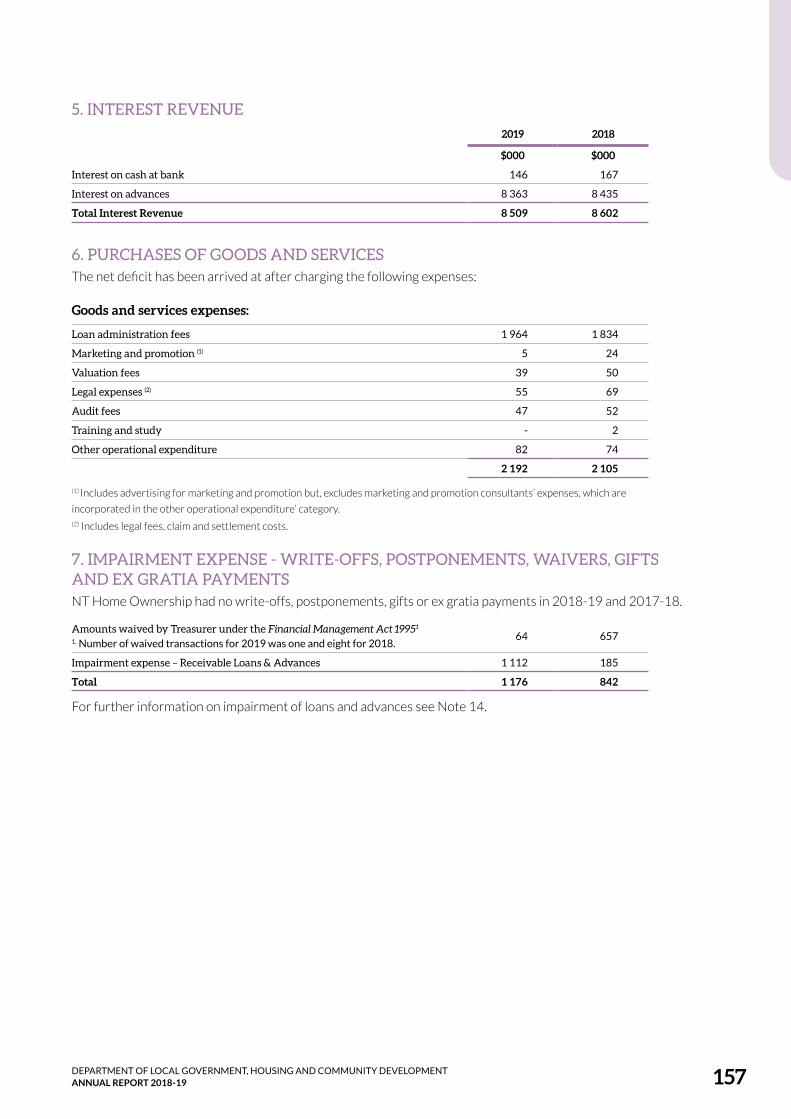
5. INTEREST REVENUE2019 2018
$000 $000
Interest on cash at bank 146 167
Interest on advances 8 363 8 435
Total Interest Revenue 8 509 8 602
6. PURCHASES OF GOODS AND SERVICESThe net deficit has been arrived at after charging the following expenses:
Goods and services expenses:
Loan administration fees 1 964 1 834
Marketing and promotion (1) 5 24
Valuation fees 39 50
Legal expenses (2) 55 69
Audit fees 47 52
Training and study - 2
Other operational expenditure 82 74
2 192 2 105
(1) Includes advertising for marketing and promotion but, excludes marketing and promotion consultants’ expenses, which are
incorporated in the other operational expenditure’ category. (2) Includes legal fees, claim and settlement costs.
7. IMPAIRMENT EXPENSE - WRITE-OFFS, POSTPONEMENTS, WAIVERS, GIFTS AND EX GRATIA PAYMENTSNT Home Ownership had no write-offs, postponements, gifts or ex gratia payments in 2018-19 and 2017-18.
Amounts waived by Treasurer under the Financial Management Act 19951
1. Number of waived transactions for 2019 was one and eight for 2018.64 657
Impairment expense – Receivable Loans & Advances 1 112 185
Total 1 176 842
For further information on impairment of loans and advances see Note 14.
DEPARTMENT OF LOCAL GOVERNMENT, HOUSING AND COMMUNITY DEVELOPMENT ANNUAL REPORT 2018-19 157

8. LOSS ON REVALUATION OF SHARED EQUITY INVESTMENTS 2019 2018
$000 $000
Revaluation of investments 45 791 49 650
Less: book value prior to revaluation (47 215) (54 729)
Add: revaluation increment of investments during year - 4
Loss on the revaluation of shared equity investments (1 424) (5 075)
9. LOSS ON DISPOSAL OF SHARED EQUITY INVESTMENTS Net proceeds from the sale of shared equity investments 2 238 3 280
Less: carrying value of shared equity investments disposed (2 435) (3 798)
Loss on the disposal of shared equity investments (197) (518)
10. INCOME TAX EXPENSE AND TAX EQUIVALENT REGIME Income Tax Payable
Deficit before income tax (2 206) (6 288)
Revaluation of investments 1 424 5 075
Taxable Income (Loss) (782) (1 213)
Income tax expense @30% - -
Income tax is only payable where NT Home Ownership makes an accounting surplus for the financial year.
TaxationThe agency is required to pay income tax on its taxable income, at the company tax rate of 30 percent in accordance with the requirements of the Treasurer’s Directions and the NT Tax Equivalents Regime. Taxable income is accounting surplus less revaluation gains on shared equity investments. No tax is payable by NT Home Ownership in respect to the 2018-19 or 2017-18 financial years.
11. CASH AND DEPOSITS Cash on hand 331 110
Cash at bank 2 964 12 409
3 295 12 519
For the purposes of the Balance Sheet and the Cash Flow Statement, cash includes cash on hand, cash at bank and cash equivalents. Cash equivalents are highly liquid short-term investments that are readily convertible to cash.
NT HOME OWNERSHIP158
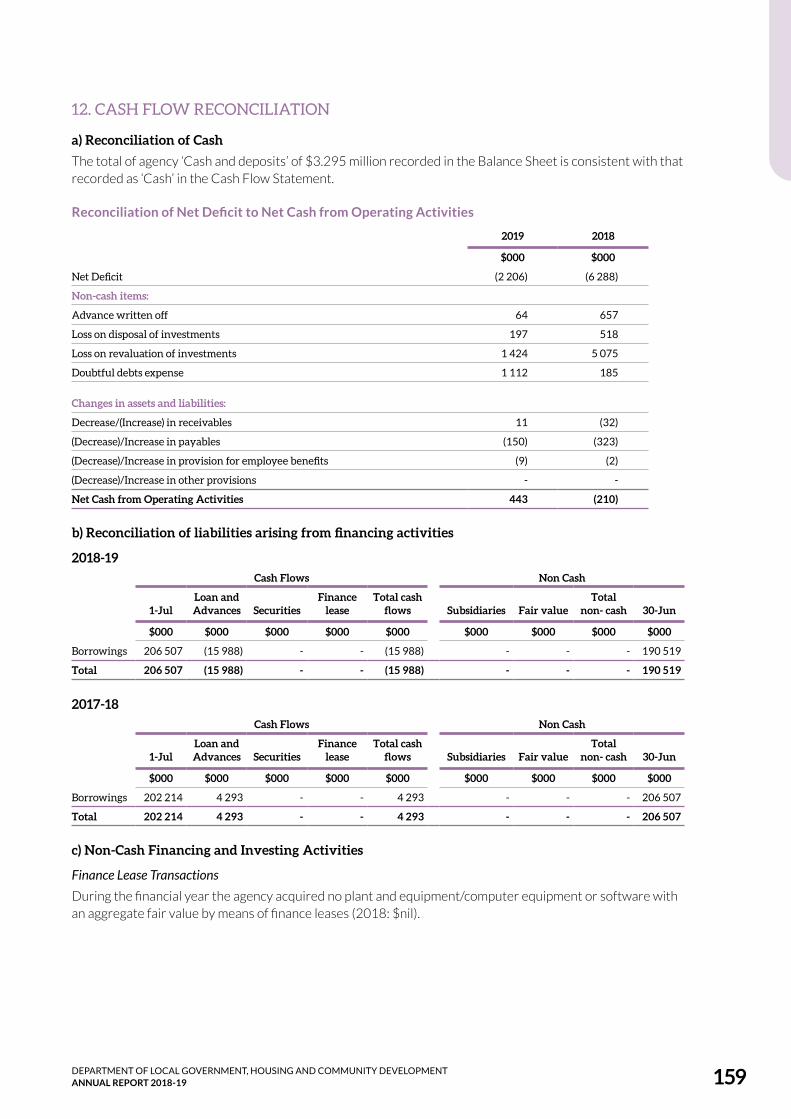
12. CASH FLOW RECONCILIATION
a) Reconciliation of Cash The total of agency ‘Cash and deposits’ of $3.295 million recorded in the Balance Sheet is consistent with that recorded as ‘Cash’ in the Cash Flow Statement.
Reconciliation of Net Deficit to Net Cash from Operating Activities
2019 2018
$000 $000
Net Deficit (2 206) (6 288)
Non-cash items:
Advance written off 64 657
Loss on disposal of investments 197 518
Loss on revaluation of investments 1 424 5 075
Doubtful debts expense 1 112 185
Changes in assets and liabilities:
Decrease/(Increase) in receivables 11 (32)
(Decrease)/Increase in payables (150) (323)
(Decrease)/Increase in provision for employee benefits (9) (2)
(Decrease)/Increase in other provisions - -
Net Cash from Operating Activities 443 (210)
b) Reconciliation of liabilities arising from financing activities
2018-19Cash Flows Non Cash
1-JulLoan and Advances Securities
Finance lease
Total cash flows Subsidiaries Fair value
Total non- cash 30-Jun
$000 $000 $000 $000 $000 $000 $000 $000 $000
Borrowings 206 507 (15 988) - - (15 988) - - - 190 519
Total 206 507 (15 988) - - (15 988) - - - 190 519
2017-18Cash Flows Non Cash
1-JulLoan and Advances Securities
Finance lease
Total cash flows Subsidiaries Fair value
Total non- cash 30-Jun
$000 $000 $000 $000 $000 $000 $000 $000 $000
Borrowings 202 214 4 293 - - 4 293 - - - 206 507
Total 202 214 4 293 - - 4 293 - - - 206 507
c) Non-Cash Financing and Investing Activities
Finance Lease Transactions
During the financial year the agency acquired no plant and equipment/computer equipment or software with an aggregate fair value by means of finance leases (2018: $nil).
DEPARTMENT OF LOCAL GOVERNMENT, HOUSING AND COMMUNITY DEVELOPMENT ANNUAL REPORT 2018-19 159

13. RECEIVABLES 2019 2018
$000 $000
Current
Interest receivables 4 16
GST receivables 34 33
Total current receivables 38 49
Receivables include interest receivable from Northern Territory Treasury Corporation and GST receivable from Australian Taxation Office and are recognised at fair value less any loss allowance.
Accounts receivable are generally settled within 30 days and other receivables within 60 days.
The loss allowance reflects lifetime expected credit losses and represents the amount of receivables the agency estimates are likely to be uncollectible and are considered doubtful.
NTHO believes that no loss allowance is necessary in respect of general receivables.
Credit risk exposure of receivablesReceivables are monitored on an ongoing basis to ensure that exposure to bad debts is not significant. The entity applies the AASB 9 simplified approach to measuring expected credit losses. This approach recognises a loss allowance based on lifetime expected credit losses for all accounts receivables.
Receivables for NTHO includes interest receivable from Northern Territory Corporation and GST receivable from Australian Taxation Office and are not subject to impairment.
PrepaymentsPrepayments represent payments in advance of receipt of goods and services or that part of expenditure made in one accounting period covering a term extending beyond that period.
14. ADVANCES Current
Advances to home purchasers 3 413 3 110
Less: loss allowance (22) -
3 391 3 110
Non-current
Advances to home purchasers 154 764 159 214
Less: loss allowance (3 279) (1 891)
151 485 157 323
Total advances to home purchasers 154 876 160 433
b) Advances paidAdvances paid are recognised initially at fair value plus or minus relevant transaction costs and are recognised in the balance sheet when the agency becomes party to the contractual provisions of the financial instruments.
Subsequently, advances paid are measured at amortised cost using the effective interest method. The effective interest rate calculation includes the contractual terms of the loans together with fees and transaction costs.
Loss allowances on advances paid reflect either 12-month or lifetime expected credit losses depending on changes in credit risk and represents the amount of advances paid that the agency estimates are likely to be uncollectible and are considered doubtful.
NT HOME OWNERSHIP160

Credit risk exposure of advances paid
Advances paid are monitored on an ongoing basis to ensure that exposure to bad debts is not significant. NTHO applies the AASB 9 general approach to measuring expected credit losses. This approach recognises a loss allowance based on 12-month expected credit losses if there has been no significant increase in credit risk since initial recognition and lifetime expected credit losses if there has been a significant increase in credit risk since initial recognition.
Credit risk for the comparative year is assessed under AASB 139 and is based on objective evidence of impairment.
The loss allowance for advances paid as at the reporting date is disclosed below.
2019 2018
Gross advances paid Loss rate
Expected credit losses
Net receivables
Aging of advances paid
Impairment allowance
Net receivables
$000 % $000 $000 $000 $000 $000
Not overdue 155 464 0.39% 610 154 854 160 433 - 160 433
Overdue for less than 30 days
12 7.85% 1 11 16 16 -
Overdue for 30 to 60 days
12 7.85% 1 11 7 7 -
Overdue for more than 60 days
2 689 100% 2 689 - 1 868 1 868 -
Total advances paid 158 177 2.09% 3 301 154 876 162 324 1 891 160 433
2019 2018
$000 $000
Reconciliation of loss allowance for advances paid
Opening balance 1 891 1 706
Adjustment on adoption of AASB 9 299 -
Written off during the year (64) (657)
Increase/decrease in allowance recognised in profit or loss 1 176 842
Total 3 301 1 891
DEPARTMENT OF LOCAL GOVERNMENT, HOUSING AND COMMUNITY DEVELOPMENT ANNUAL REPORT 2018-19 161

15. SHARED EQUITY INVESTMENTS 2019 2018
$000 $000
Minority interest holding at independent valuation 45 791 49 650
Total investments in shared equity 45 791 49 650
Shared equity investments
Opening balance as at 1 July 49 650 58 495
Additions - 29
Disposals (2 435) (3 799)
Revaluation (1 424) (5 075)
Total investments in shared equity as at 30 June 45 791 49 650
Shared equity investmentsShared equity investments represent NT Home Ownership’s minority financial interest in housing properties held under a loan/shared equity scheme previously provided by the Northern Territory Government and properties purchased and/or constructed from/by external parties under these schemes. These investments are classified as investment properties.
Shared equity investments are recognised at cost, including transaction costs at the time of acquisition and subsequently measured at fair value. Revaluations are performed annually at the reporting date. Gains and losses arising from changes in the fair value, retirement or disposal are included in the comprehensive operating statements in the period in which they arise. Shared equity investments are not subject to depreciation.
Property, plant and equipmentNT Home Ownership does not hold any property, plant or equipment.
AcquisitionsAll items of property, plant and equipment with a cost, or other value, equal to or greater than $10 000 are recognised in the year of acquisition and depreciated. Items of property, plant and equipment below the $10 000 threshold are expensed in the year of acquisition.
The construction cost of property, plant and equipment includes the cost of materials and direct labour, and an appropriate proportion of fixed and variable overheads.
Revaluations and impairmentRevaluation of assets
Subsequent to initial recognition, assets belonging to the following classes of non-current assets are revalued with sufficient regularity to ensure that the carrying amount of these assets does not differ materially from their fair value at reporting date.
Shared equity investments
Shared Equity Investments are revalued with sufficient regularity to ensure that the carrying amount of these assets does not differ materially from their fair value at reporting date.
Shared Equity Investments are measured on the market approach of fair value basis, being the amount that would be received to sell an asset or paid to transfer a liability in an orderly transaction between market participants at the measurement date. The agency has adopted the policy of revaluing its Shared Equity Investments every year with any changes in fair value recognised as a gain or loss in the Comprehensive Operating Statement.
NT HOME OWNERSHIP162

An independent valuation of shared equity investment was completed as at 30 June 2019 by Territory Property Consultants Pty Ltd, the results of which are reflected in these financial statements. The valuation method used was based on market evidence of sales prices of comparable land and buildings in similar locations.
Impairment of assets
An asset is said to be impaired when the asset’s carrying amount exceeds its recoverable amount.
Non-current physical and intangible NTHO assets are assessed for indicators of impairment on an annual basis or whenever there is indication of impairment. If an indicator of impairment exists, NTHO determines the asset’s recoverable amount. The asset’s recoverable amount is determined as the higher of the asset’s depreciated replacement cost and fair value less costs to sell. Any amount by which the asset’s carrying amount exceeds the recoverable amount is recorded as an impairment loss.
Impairment losses are recognised in the comprehensive operating statement. They are disclosed as an expense unless the asset is carried at a revalued amount. Where the asset is measured at a revalued amount, the impairment loss is offset against the asset revaluation surplus for that class of asset to the extent that an available balance exists in the asset revaluation surplus.
In certain situations, an impairment loss may subsequently be reversed. Where an impairment loss is subsequently reversed, the carrying amount of the asset is increased to the revised estimate of its recoverable amount. A reversal of an impairment loss is recognised in the comprehensive operating statement as income, except to the extent that reversal exceeds the previous impairment loss, in which case the impairment reversal results in an increase in the asset revaluation surplus.
DEPARTMENT OF LOCAL GOVERNMENT, HOUSING AND COMMUNITY DEVELOPMENT ANNUAL REPORT 2018-19 163

16. PAYABLES 2019 2018
$000 $000
Accounts payable 88 303
Accrued expenses 205 33
Interest payable 164 271
Total payables 457 607
PayablesLiabilities for accounts payable and other amounts payable are carried at cost, which is the fair value of the consideration to be paid in the future for goods and services received, whether or not billed to the agency. Accounts payable are normally settled within 30 days.
Interest expenseInterest expenses include interest on borrowings. Interest expenses are expensed in the period in which they are incurred.
17. BORROWINGS AND ADVANCES Current
Loans and advances 6 283 5 988
Non-current
Loans and advances 184 236 200 519
Total borrowings and advances 190 519 206 507
BorrowingsGovernment loans are initially recognised at the fair value of the consideration received less directly attributable transaction costs, and are subsequently measured at amortised cost using the effective interest method.
One interest only loan valued at $15 million will mature within the next financial year. NT Home Ownership has advised the lender, NT Treasury Corporation that it intends to refinance this loan when it matures. This is reflected in the 2019-20 budget and the loan is treated as non-current in the financial statements.
NT HOME OWNERSHIP164

18. PROVISIONS 2019 2018
$000 $000
Current
Employee benefits
Recreation leave 4 8
Leave loading 2 5
Total current provisions 6 13
Other current provisions
Employee superannuation 1 2
Total other provisions 1 2
Total Provisions 7 15
The Agency employed one employee as at 30 June 2019 (two employees as at 30 June 2018).
Employee benefits Provision is made for employee benefits accumulated as a result of employees rendering services up to the reporting date. These benefits include wages and salaries and recreation leave. Liabilities arising in respect of wages and salaries, recreation leave and other employee benefits are classified as current liabilities and are measured at amounts expected to be paid.
No provision is made for sick leave, which is non-vesting, as the anticipated pattern of future sick leave to be taken is less than the entitlement accruing in each reporting period.
Employee benefit expenses are recognised on a net basis in respect of the following categories:
• wages and salaries, non-monetary benefits, recreation leave, sick leave and other leave entitlements; and
• other types of employee benefits.
As part of the financial management framework, the Central Holding Authority assumes the long service leave liabilities of Government agencies, including NT Home Ownership and as such no long service leave liability is recognised in agency financial statements.
SuperannuationEmployees’ superannuation entitlements are provided through the:
• Northern Territory Government and Public Authorities Superannuation Scheme (NTGPASS);
• Commonwealth Superannuation Scheme (CSS); or
• Non-government employee-nominated schemes for those employees commencing on or after 10 August 1999.
NTHO makes superannuation contributions on behalf of its employees to the Central Holding Authority or non-government employee-nominated schemes. Superannuation liabilities related to government superannuation schemes are held by the Central Holding Authority and as such are not recognised in agency financial statements.
DEPARTMENT OF LOCAL GOVERNMENT, HOUSING AND COMMUNITY DEVELOPMENT ANNUAL REPORT 2018-19 165
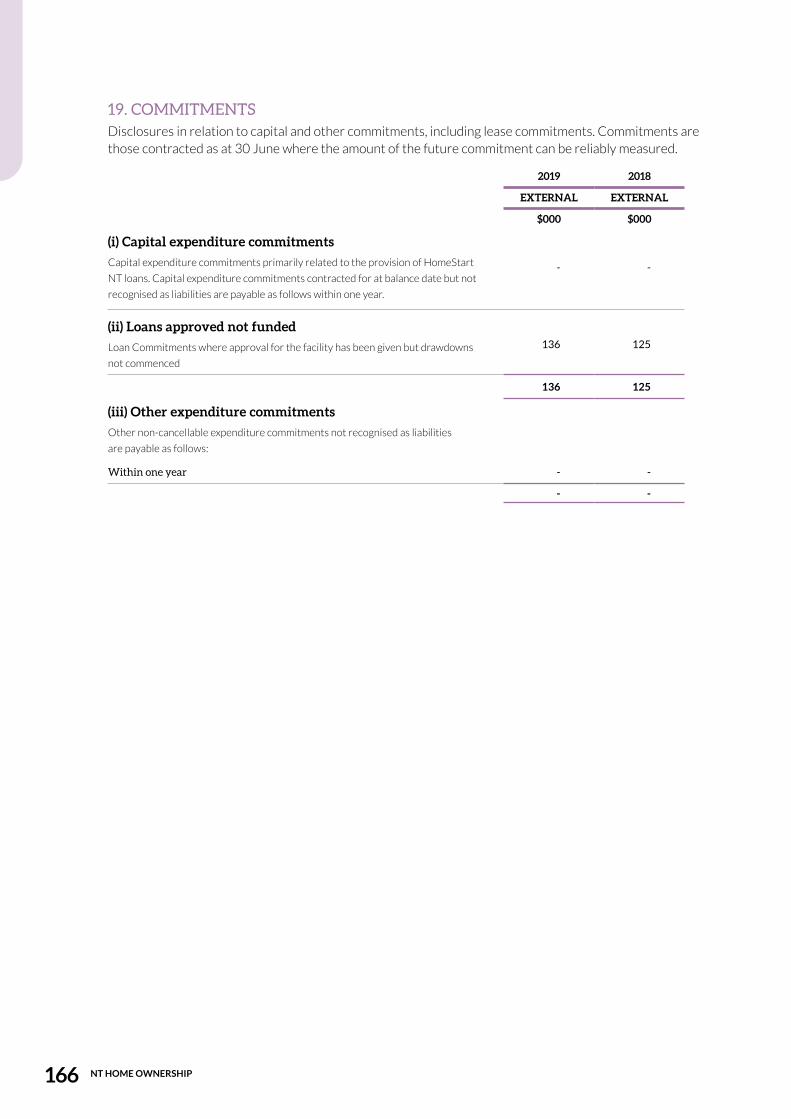
19. COMMITMENTSDisclosures in relation to capital and other commitments, including lease commitments. Commitments are those contracted as at 30 June where the amount of the future commitment can be reliably measured.
2019 2018
EXTERNAL EXTERNAL
$000 $000
(i) Capital expenditure commitmentsCapital expenditure commitments primarily related to the provision of HomeStart
NT loans. Capital expenditure commitments contracted for at balance date but not
recognised as liabilities are payable as follows within one year.
- -
(ii) Loans approved not fundedLoan Commitments where approval for the facility has been given but drawdowns
not commenced
136 125
136 125
(iii) Other expenditure commitmentsOther non-cancellable expenditure commitments not recognised as liabilities
are payable as follows:
Within one year - -
- -
NT HOME OWNERSHIP166

20. FAIR VALUE MEASUREMENT Fair value is the price that would be received to sell an asset or paid to transfer a liability in an orderly transaction between market participants at the measurement date.
Fair value measurement of a non-financial asset takes into account a market participant’s ability to generate economic benefits by using the asset in its highest and best use or by selling it to another market participant that would use the asset in its highest and best use. The highest and best use takes into account the use of the asset that is physically possible, legally permissible and financially feasible.
When measuring fair value, the valuation techniques used maximise the use of relevant observable inputs and minimise the use of unobservable inputs. Unobservable inputs are used to the extent that sufficient relevant and reliable observable inputs are not available for similar assets/liabilities.
Observable inputs are publicly available data that are relevant to the characteristics of the assets/liabilities being valued. Observable inputs used by the agency include, but are not limited to, published sales data for land and general office buildings.
Unobservable inputs are data, assumptions and judgments that are not available publicly, but are relevant to the characteristics of the assets/liabilities being valued. Such inputs include internal agency adjustments to observable data to take account of particular and potentially unique characteristics/functionality of assets/liabilities and assessments of physical condition and remaining useful life.
All assets and liabilities for which fair value is measured or disclosed in the financial statements are categorised within the following fair value hierarchy based on the inputs used:
Level 1 – inputs are quoted prices in active markets for identical assets or liabilities;
Level 2 – inputs are inputs other than quoted prices included within Level 1 that are observable for the asset or liability, either directly or indirectly; and
Level 3 – inputs are unobservable.
The fair value of financial instruments is determined on the following basis:
• the fair value of cash, deposits, advances, receivables and payables approximates their carrying amount, which is also their amortised cost
• the fair value of derivative financial instruments are derived using current market yields and exchange rates appropriate to the instrument
• the fair value of other monetary financial assets and liabilities is based on discounting to present value the expected future cash flows by applying current market interest rates for assets and liabilities with similar risk profiles.
DEPARTMENT OF LOCAL GOVERNMENT, HOUSING AND COMMUNITY DEVELOPMENT ANNUAL REPORT 2018-19 167

a) Fair value hierarchyFair values of non-financial assets categorised by levels of inputs used to compute fair value are:
LEVEL 1 LEVEL 2 LEVEL 3 TOTAL FAIR VALUE
$000 $000 $000 $000
2018-19
Asset classes
Shared equity investments (Note 15)
- 45 791 - 45 791
Total - 45 791 - 45 791
2017-18
Asset classes
Shared equity investments (Note 15)
- 49 650 - 49 650
Total - 49 650 - 49 650
There were no transfers between Level 1 and Levels 2 or 3 during 2018-19.
b) Valuation techniques and inputsValuation techniques used to measure fair value in 2018-19 are:
LEVEL 2 TECHNIQUES
LEVEL 3 TECHNIQUES
Asset Classes
Shared equity investments Market approach -
There were no changes in valuation techniques from 2017-18 to 2018-19.
Territory Property Consultants Pty. Ltd. provided valuation for the Shared equity investments as at 30 June 2019.
Level 2 fair values of Shared Equity Investments were based on market evidence of sales prices of comparable land and buildings in similar locations.
c) Additional Information for Level 3 Fair Value MeasurementsNT Home Ownership does not have any Level 3 Fair Value Measurement assets.
NT HOME OWNERSHIP168

21. FINANCIAL INSTRUMENTSA financial instrument is a contract that gives rise to a financial asset of one entity and a financial liability or equity instrument of another entity. NT Home Ownership has limited exposure to financial risks as discussed below.
Financial assets and liabilities are recognised on the balance sheet when the agency becomes a party to the contractual provisions of the financial instrument. The agency’s financial instruments include cash and deposits; receivables; advances; investment loans and placements; payables; advances received and borrowings.
Due to the nature of operating activities, certain financial assets and financial liabilities arise under statutory obligations rather than a contract. Such financial assets and liabilities do not meet the definition of financial instruments as per AASB 132 Financial Instruments Presentation. These include statutory receivables arising from taxes including GST and penalties.
a) Categorisation of financial instrumentsThe carrying amounts of the agency’s financial assets and liabilities by category are disclosed in the table below.
2018-19 Categorisation of financial instruments
Fair value through profit or loss
Mandatorily at fair value
Designated at fair value Amortised cost
Fair value through other comprehensive
income Total
$000 $000 $000 $000 $000
Cash and deposits - 3 295 - - 3 295
Receivables1 - - 4 - 4
Advances - - 154 876 - 154 876
Total Financial Assets - 3 295 154 880 - 158 175
Payables1 - - 457 - 457
Loans - - 190 519 - 190 519
Total Financial Liabilities - - 190 976 - 190 976
1.Total amounts disclosed here exclude statutory amounts
2017-18 Categorisation of financial instruments
Fair value through profit or loss
Held for trading
Designated at fair value
Held to maturity
investments
Financial assets -
Loans and receivables
Financial assets -
available for sale
Financial Liabilities
- amortised cost Total
$000 $000 $000 $000 $000 $000 $000
Cash and deposits - 12 519 - - - - 12 519
Receivables1 - - - 16 - - 16
Advances - - - 160 433 - - 160 433
Total Financial Assets - 12 519 - 160 449 - - 172 968
Payables1 - - - - - 607 607
Loans - - - - - 206 507 206 507
Total Financial Liabilities - - - - - 207 114 207 114
1.Total amounts disclosed here exclude statutory amounts
DEPARTMENT OF LOCAL GOVERNMENT, HOUSING AND COMMUNITY DEVELOPMENT ANNUAL REPORT 2018-19 169

Classification of financial instruments from 1 July 2018
From 1 July 2018, the agency classifies its financial assets in the following measurement categories:
• those to be measured subsequently at fair value (either through other comprehensive income (OCI) or through profit or loss), and
• those to be measured at amortised cost.
The classification depends on the agency’s business model for managing the financial assets and the contractual terms of the cash flows.
For assets measured at fair value, gains and losses will either be recorded in profit or loss or OCI. For investments in equity instruments that are not held for trading, the agency has made an irrevocable election at the time of initial recognition to account for the equity investment at fair value through other comprehensive income (FVOCI).
The agency reclassifies debt investments when and only when its business model for managing those assets changes.
At initial recognition, the agency measures a financial asset at its fair value plus, in the case of a financial asset not at fair value through profit or loss (FVTPL), transaction costs that are directly attributable to the acquisition of the financial asset. Transaction costs of financial assets carried at FVTPL are expensed in profit or loss.
Financial assets with embedded derivatives are considered in their entirety when determining whether their cash flows are solely payment of principal and interest.
Debt instruments
Subsequent measurement of debt instruments depends on the agency’s business model for managing the asset and the cash flow characteristics of the asset. There are three measurement categories into which the agency classifies its debt instruments:
• Amortised cost: Assets that are held for collection of contractual cash flows where those cash flows represent solely payments of principal and interest are measured at amortised cost. Interest income from these financial assets is calculated using the effective interest rate method. Any gain or loss arising on de-recognition is recognised directly in profit or loss and presented in other gains/ (losses).
• FVOCI: Assets that are held for collection of contractual cash flows and for selling the financial assets, where the assets’ cash flows represent solely payments of principal and interest, are measured at FVOCI. Movements in the carrying amount are taken through OCI, except for the recognition of impairment gains or losses and interest income which are recognised in profit or loss. When the financial asset is derecognised, the cumulative gain or loss previously recognised in OCI is reclassified from equity to profit or loss and recognised in other gains/(losses). Interest income from these financial assets is calculated using the effective interest rate method.
• FVTPL: Assets that do not meet the criteria for amortised cost or FVOCI are measured at FVTPL. A gain or loss on a debt investment that is subsequently measured at FVTPL is recognised in profit or loss and presented net within other gains/(losses) in the period in which it arises.
Financial liabilities are classified into the following categories either at FVTPL or at amortised cost. The classification and measurement of financial liabilities under AASB 9 is substantially the same as in AASB 139, except where an entity designates financial liabilities at FVTPL. For such liabilities, the fair value changes of liabilities designated at FVTPL are presented as follows:
• the fair value changes attributable to changes in the liability’s credit risk are recognised in OCI; and
• the remaining changes in the fair value are recognised in profit or loss.
NT HOME OWNERSHIP170
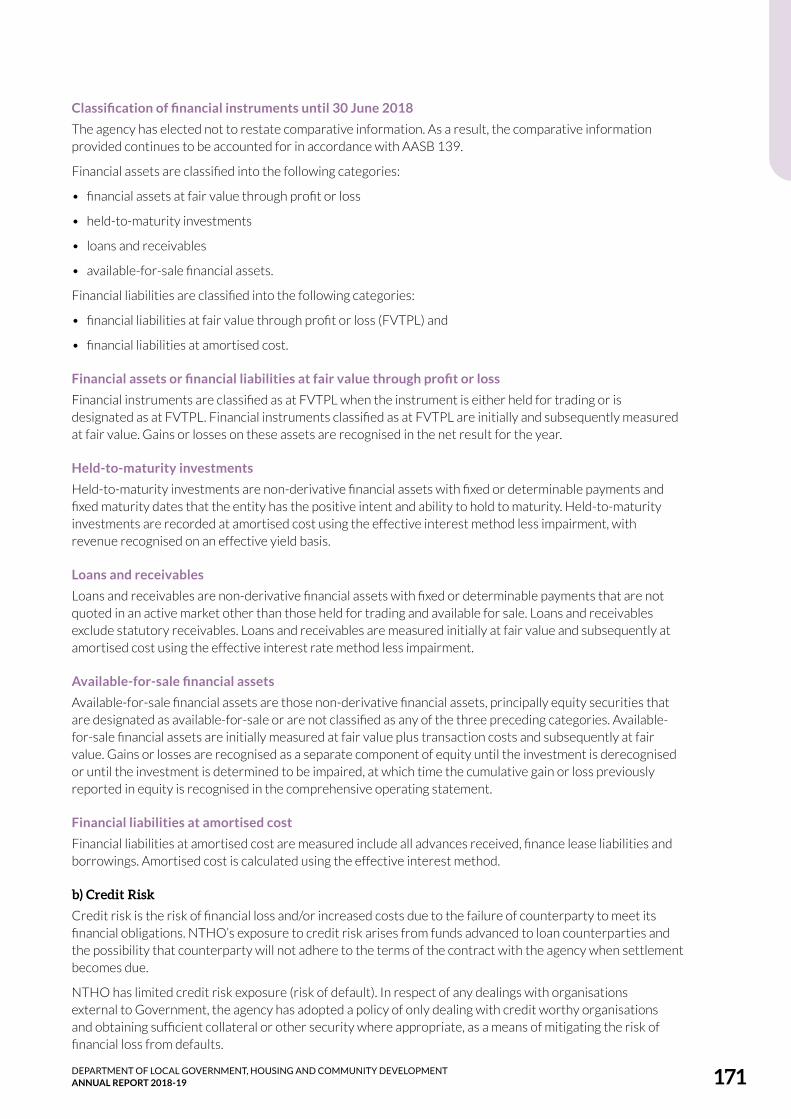
Classification of financial instruments until 30 June 2018
The agency has elected not to restate comparative information. As a result, the comparative information provided continues to be accounted for in accordance with AASB 139.
Financial assets are classified into the following categories:
• financial assets at fair value through profit or loss
• held-to-maturity investments
• loans and receivables
• available-for-sale financial assets.
Financial liabilities are classified into the following categories:
• financial liabilities at fair value through profit or loss (FVTPL) and
• financial liabilities at amortised cost.
Financial assets or financial liabilities at fair value through profit or loss
Financial instruments are classified as at FVTPL when the instrument is either held for trading or is designated as at FVTPL. Financial instruments classified as at FVTPL are initially and subsequently measured at fair value. Gains or losses on these assets are recognised in the net result for the year.
Held-to-maturity investments
Held-to-maturity investments are non-derivative financial assets with fixed or determinable payments and fixed maturity dates that the entity has the positive intent and ability to hold to maturity. Held-to-maturity investments are recorded at amortised cost using the effective interest method less impairment, with revenue recognised on an effective yield basis.
Loans and receivables
Loans and receivables are non-derivative financial assets with fixed or determinable payments that are not quoted in an active market other than those held for trading and available for sale. Loans and receivables exclude statutory receivables. Loans and receivables are measured initially at fair value and subsequently at amortised cost using the effective interest rate method less impairment.
Available-for-sale financial assets
Available-for-sale financial assets are those non-derivative financial assets, principally equity securities that are designated as available-for-sale or are not classified as any of the three preceding categories. Available-for-sale financial assets are initially measured at fair value plus transaction costs and subsequently at fair value. Gains or losses are recognised as a separate component of equity until the investment is derecognised or until the investment is determined to be impaired, at which time the cumulative gain or loss previously reported in equity is recognised in the comprehensive operating statement.
Financial liabilities at amortised cost
Financial liabilities at amortised cost are measured include all advances received, finance lease liabilities and borrowings. Amortised cost is calculated using the effective interest method.
b) Credit RiskCredit risk is the risk of financial loss and/or increased costs due to the failure of counterparty to meet its financial obligations. NTHO’s exposure to credit risk arises from funds advanced to loan counterparties and the possibility that counterparty will not adhere to the terms of the contract with the agency when settlement becomes due.
NTHO has limited credit risk exposure (risk of default). In respect of any dealings with organisations external to Government, the agency has adopted a policy of only dealing with credit worthy organisations and obtaining sufficient collateral or other security where appropriate, as a means of mitigating the risk of financial loss from defaults.
DEPARTMENT OF LOCAL GOVERNMENT, HOUSING AND COMMUNITY DEVELOPMENT ANNUAL REPORT 2018-19 171

The exposure to credit risk is influenced mainly by the individual characteristics of each non-government debtor. In monitoring debtor credit risk, debtors are grouped according to their aging profile and existence of previous financial difficulties. Loans are provided to home purchasers subject to the retention of title clauses, so that in the event of non-payment, NTHO may have a secured claim.
The carrying amount of financial assets recorded in the financial statements, net of any allowances for losses, represents the NTHO’s maximum exposure to credit risk without taking account of the value of any collateral or other security obtained.
Credit risk relating to receivables is disclosed in note 13 and advances paid in note 14.
c) Liquidity RiskLiquidity risk is the risk that the agency will not be able to meet its financial obligations as they fall due. The agency’s approach to managing liquidity is to ensure that it will always have sufficient liquidity to meet its liabilities when they fall due. This is achieved by ensuring that minimum levels of cash are held in the Agency bank account to meet various current employee and supplier liabilities. The agency’s exposure to liquidity risk is minimal.
The following tables detail the agency’s remaining contractual maturity for its financial assets and liabilities. It should be noted that these values are undiscounted, and consequently totals may not reconcile to the carrying amounts presented in the Balance Sheet.
2019 Maturity analysis for financial liabilities
Carrying Amount Less than a Year 1 to 5 Years
More than 5 Years Total
$000 $000 $000 $000 $000
Liabilities
Payables 457 457 - - 457
Loans 190 519 28 325 128 375 72 414 229 114
Total Financial Liabilities 190 976 28 782 128 375 72 414 229 571
2018 Maturity analysis for financial liabilities
Carrying Amount Less than a Year 1 to 5 Years
More than 5 Years Total
$000 $000 $000 $000 $000
Liabilities
Payables 607 607 - - 607
Loans 206 507 44 951 124 395 82 759 252 105
Total Financial Liabilities 207 114 45 558 124 395 82 759 252 712
d) Market RiskMarket risk is the risk that the fair value of future cash flows of a financial instrument will fluctuate because of changes in market prices. It comprises interest rate risk, price risk and currency risk.
(i) Interest Rate Risk
Interest rate risk is the risk of financial loss and or increased costs due to adverse movements in the values of financial assets and liabilities as a result of changes in interest rates. NT Home Ownership’s exposure to interest rate risk and the average interest rate for classes of financial assets and financial liabilities is set out below. The average interest rate is based on the outstanding balance at the end of the year.
NT Home Ownership’s operating account earns monthly interest at a variable interest rate of Northern Territory Treasury Corporation’s weighted average cash return less 50 basis points.
NT Home Ownership’s exposure to interest rate risk by asset and liability classes is disclosed below.
NT HOME OWNERSHIP172

2019 Interest rate risk for financial assets and liabilities
Interest bearing
Variable FixedNon-interest
bearing TotalWeighted
average
$000 $000 $000 $000 %
Assets
Cash and deposits 3 295 - - 3 295 1.25%
Receivables - - 4 4 -
Advances 154 876 - - 154 876 5.13%
Total financial assets 158 171 - 4 158 175
Liabilities
Payables - - 457 457
Loans - 190 519 - 190 519 4.48%
Total financial liabilities - 190 519 457 190 976
2018 Interest rate risk for financial assets and liabilities
Interest bearing
Variable FixedNon-interest
bearing TotalWeighted
average
$000 $000 $000 $000 %
Assets
Cash and deposits 12 519 - - 12 519 1.50%
Receivables - - 16 16 -
Advances 160 433 - - 160 433 5.22%
Total financial assets 172 952 - 16 172 968
Liabilities
Payables - - 607 607 -
Loans - 206 507 - 206 507 4.48%
Total financial liabilities - 206 507 607 207 114
Market Sensitivity Analysis
Receivables and payables are non-interest bearing loans from NT Treasury Corporation are with fixed interest rate and are not exposed to interest rate risk. Assuming that the other financial assets and liabilities at 30 June 2019 were to remain until maturity or settlement without any action by NT Home Ownership to alter the resulting interest rate risk exposure, an immediate and sustained increase or decrease of one per cent in market interest rates across all maturities would have the following impact on the NT Home Ownership’s profit or loss and equity:
Profit or Loss and Equity
100 basis points increase 100 basis points decrease
$000 $000
30 June 2019
Financial assets – cash at bank 33 (33)
Financial assets – advances 1 549 (1 549)
Net Sensitivity 1 582 (1 582)
30 June 2018
Financial assets – cash at bank 125 (125)
Financial assets – advances 1 604 (1 604)
Net Sensitivity 1 729 (1 729)
DEPARTMENT OF LOCAL GOVERNMENT, HOUSING AND COMMUNITY DEVELOPMENT ANNUAL REPORT 2018-19 173

(ii) Price Risk
NT Home Ownership is not exposed to price risk as NT Home Ownership does not hold units in unit trusts or shares.
(iii) Currency Risk
NT Home Ownership is not exposed to currency risk as NT Home Ownership does not hold borrowings denominated in foreign currencies or transactional currency exposures arising from purchases in a foreign currency.
22. RELATED PARTIES
i) Related PartiesNT Home Ownership is a Government Business Division of the Department of Local Government, Housing and Community Development, which is a government administrative agency and is wholly owned and controlled by the Territory Government. Related parties of the agency include:
• the Portfolio Minister and key management personnel (KMP) because they have authority and responsibility for planning, directing and controlling the activities of the agency directly
• spouses, children and dependents who are close family members of the Portfolio Minister or KMP
• all public sector entities that are controlled and consolidated into the whole of government financial statements
• any entities controlled or jointly controlled by KMP’s or the Portfolio Minister or controlled or jointly controlled by their close family members
ii) Key Management Personnel (KMP)Key management personnel of the Department of Local Government, Housing and Community Development and NT Home Ownership are those persons having authority and responsibility for planning, directing and controlling the activities of NT Home Ownership. These include the Minister for Local Government, Housing and Community Development, the Chief Executive Officer and two members of the executive team of Department of Local Government, Housing and Community Development.
iii) Remuneration of Key Management PersonnelThe details below exclude the salaries and other benefits of Minister for Local Government, Housing and Community Development as the Minister’s remunerations and allowances are payable by the Agency of the Legislative Assembly and consequently disclosed within the Treasurer’s Annual Financial Statements. The KMP employment benefits provided below are paid by Department of Local Government, Housing and Community Development and are not included in NTHO’s accounts.
The aggregate compensation of key management personnel of NT Home Ownership is set out below:
2019 2018
$000 $000
Short-term benefits 922 940
Termination benefits - 51
Total 922 991
NT HOME OWNERSHIP174

iv) Related party transactions:Significant transactions with government related entities includes funding received from the Department of Local Government, Housing and Community Development for Community Service Obligations and loans from Northern Territory Treasury Corporation.
The following table provides quantitative information about related party transactions entered into during the year with all other Northern Territory Government controlled entities.
Related PartyRevenue from related parties
Payments to related parties
Amounts owed by related parties
Amounts owed to related parties
$000 $000 $000 $000
2018-19
All NTG Government departments 3 560 25 053 4 190 714
2017-18
All NTG Government departments 3 636 15 361 16 206 809
Given the breadth and depth of Territory Government activities, related parties will transact with the Territory Public sector in a manner consistent with other members of the public including paying stamp duty and other government fees and charges and therefore these transactions have not been disclosed.
All KMPs have provided a signed “Related Party Disclosures Declaration Form” to NTHO. Based on the declarations, NTHO has no other related party transactions with KMPs.
23. CONTINGENT LIABILITIES AND CONTINGENT ASSETS
a) Contingent LiabilitiesNT Home Ownership had no contingent liabilities as at 30 June 2019 or 30 June 2018.
b) Contingent AssetsNT Home Ownership had no contingent assets as at 30 June 2019 or 30 June 2018.
24. EVENTS SUBSEQUENT TO BALANCE DATENo events have arisen between the end of the financial year and the date of this report that require adjustment to, or disclosure in these financial statements.
DEPARTMENT OF LOCAL GOVERNMENT, HOUSING AND COMMUNITY DEVELOPMENT ANNUAL REPORT 2018-19 175
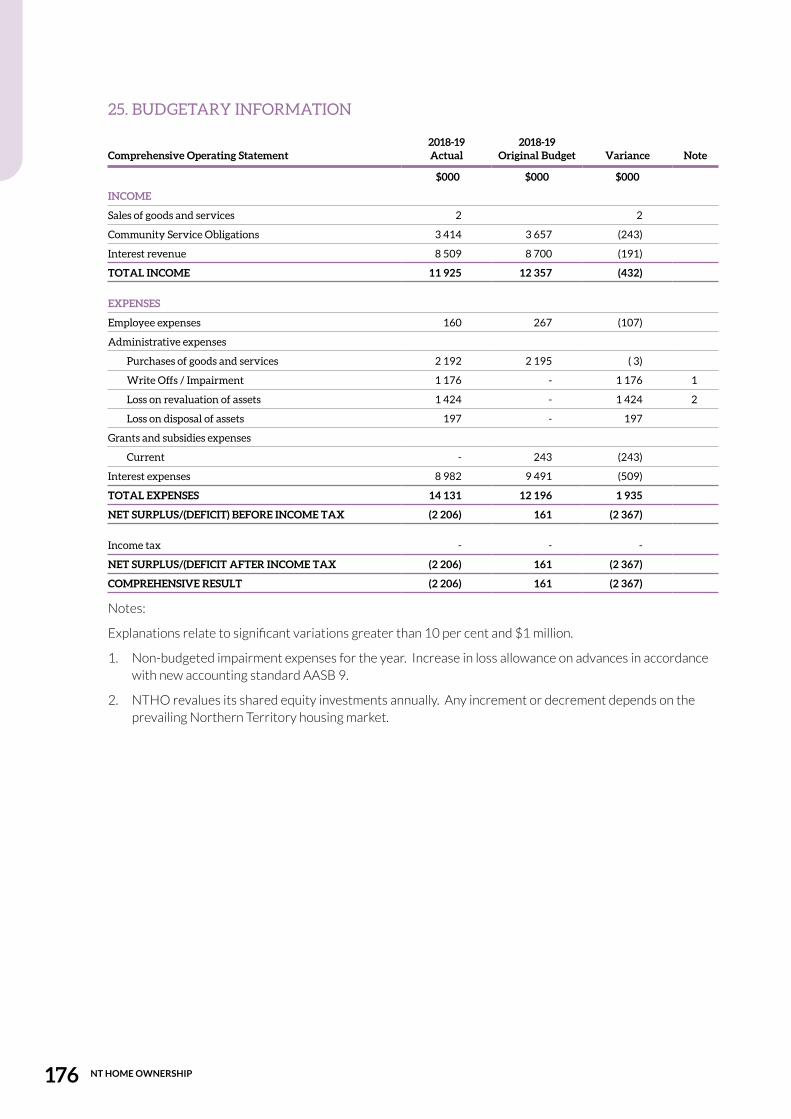
25. BUDGETARY INFORMATION
2018-19 Actual
2018-19 Original BudgetComprehensive Operating Statement Variance Note
$000 $000 $000
INCOME
Sales of goods and services 2 2
Community Service Obligations 3 414 3 657 (243)
Interest revenue 8 509 8 700 (191)
TOTAL INCOME 11 925 12 357 (432)
EXPENSES
Employee expenses 160 267 (107)
Administrative expenses
Purchases of goods and services 2 192 2 195 ( 3)
Write Offs / Impairment 1 176 - 1 176 1
Loss on revaluation of assets 1 424 - 1 424 2
Loss on disposal of assets 197 - 197
Grants and subsidies expenses
Current - 243 (243)
Interest expenses 8 982 9 491 (509)
TOTAL EXPENSES 14 131 12 196 1 935
NET SURPLUS/(DEFICIT) BEFORE INCOME TAX (2 206) 161 (2 367)
Income tax - - -
NET SURPLUS/(DEFICIT AFTER INCOME TAX (2 206) 161 (2 367)
COMPREHENSIVE RESULT (2 206) 161 (2 367)
Notes:
Explanations relate to significant variations greater than 10 per cent and $1 million.
1. Non-budgeted impairment expenses for the year. Increase in loss allowance on advances in accordance with new accounting standard AASB 9.
2. NTHO revalues its shared equity investments annually. Any increment or decrement depends on the prevailing Northern Territory housing market.
NT HOME OWNERSHIP176

2018-19 Actual
2018-19 Original BudgetBalance Sheet Variance Note
$000 $000 $000
ASSETS
Cash and deposits 3 295 19 410 (16 115) 1
Advances and investments 200 667 213 967 (13 300) 2
Receivables 38 17 21
TOTAL ASSETS 204 000 233 394 (29 394)
LIABILITIES
Payables 457 792 ( 335)
Borrowings and advances 190 519 210 519 (20 000) 3
Provisions 7 17 (10)
TOTAL LIABILITIES 190 983 211 328 (20 345)
NET ASSETS 13 017 22 066 (9 049)
EQUITY
Capital 22 745 22 745 -
Accumulated funds (9 728) (679) (9 049)
TOTAL EQUITY 13 017 22 066 (9 049)
Notes:
Explanations relate to significant variations greater than 10 per cent and $1 million.
1. Refer cash flow statement for movements in cash.
2. Repayment of loans from the sale of Shared Equity Investments and less new loans than anticipated all contributed to a lower level of advances than budgeted.
3. NT Home Ownership did not proceed with a loan drawdown of $10 million as originally budgeted. Additionally, it repaid a $10 million loan that matured in 2018-19.
DEPARTMENT OF LOCAL GOVERNMENT, HOUSING AND COMMUNITY DEVELOPMENT ANNUAL REPORT 2018-19 177

2018-19 Actual
2018-19 Original BudgetCash Flow Statement Variance Note
$000 $000 $000
CASH FLOWS FROM OPERATING ACTIVITIES
Operating receipts
Receipts from sales of goods and services and community service obligations
3 562 3 657 (95)
Interest received 8 521 8 700 (179)
Total operating receipts 12 083 12 357 (274)
Operating payments
Payments to employees (169) ( 267) 98
Payments for goods and services (2 382) (2 195) (187)
Grants and subsidies paid
Current - (243) 243
Interest paid (9 089) (9 445) 356
Total operating payments (11 640) (12 150) 510
Net cash used in operating activities 443 207 236
CASH FLOWS FROM INVESTING ACTIVITIES
Investing receipts
Repayment of advances 10 172 15 000 (4 828) 1
Sales of investments 2 238 4 000 (1 762) 2
Total investing receipts 12 410 19 000 (6 590)
Investing payments
Advances and investing payments (6 089) (15 000) 8 911 3
Total investing payments (6 089) (15 000) 8 911
Net cash from/(used in) investing activities 6 321 4 000 2 321
CASH FLOWS FROM FINANCING ACTIVITIES
Financing Receipts
Proceeds of Borrowings - 10 000 (10 000) 4
Total Financing Receipts - 10 000 (10 000)
Financing payments
Repayment of borrowings (15 988) (5 988) (10 000) 5
Total financing payments (15 988) (5 988) (10 000)
Net cash from/(used in) financing activities (15 988) 4 012 (20 000)
Net increase/(decrease) in cash held (9 224) 8 219 (17 443)
Cash at beginning of financial year 12 519 11 191 1 328
CASH AT END OF FINANCIAL YEAR 3 295 19 410 (16 115)
Notes:
Explanations relate to significant variations greater than 10 per cent and $1 million.
1. Repayment of advances is lower due to less new loans being advanced than anticipated in the budget.
2. Sales of investments is lower as a result of slow real estate market.
3. Fewer loans funded to clients due to real estate market and the state of the NT economy.
4. Original budget of $10 million loan drawdown did not proceed.
5. Loan repayment of $10 million not originally budgeted.
NT HOME OWNERSHIP178


dlghcd.nt.gov.au