bolt inc - ntrs.nasa.gov
TRANSCRIPT
* B O L T B E R A N E K A N D N E W M A N I N C e
pi 1 C O N S U L T I N G * D E V E L O P M E N T - R E S E A R C H c
AERODYNAMIC SOUND R A D I A T I O N FROM L I F T I N G SURFACES
M I T H AND W I T H O U T L E A D I N G - E D G E S E R R A T I O N S
By Alan S. Hersh and Richard E. Hayden ..
D i s t r i b u t i o n of t h i s r e p o r t i s provided fn t he i n t e r e s t - of information exchange. Respons ib i l i ty f o r t h e conten ts
resides i n t he author o r organiza t ion that prepared i t .
T
Prepared under Contract No. NASL-5974 by BOLT BERANEK AND NEWMAN I N C .
21120 Vanowen S t r e e t Canoga Park, Ca l i fo rn ia 91303
f o r
NATIONAL AERONAUTICS AND SPACE ADMINISTRATION
AMES RESEARCH CE?FTER
i
i z (ACCESSION UMBER) ./?o,/ ro
jI 0
l y .
=! 2 (NASA CR OR T M X OR AD N’bMBER) (CATEGORY) 97 l g
I I&
Reproduced by
NATIONAL TECHNICAL 1 INFORMATION SERVICE U S Departmenf of Commerce
Spnngfteid, VA. 22151
AERODYNAMIC SOUND R A D I A T I O M FROM L I F T I N 6 SURFACES
UITH AND WITHOUT L E A D I N G - E D G E S E R R A T I O N S
By Alan S. Hersh and Richard E. Hayden
D i s t r i b u t i o n of t h i s r e p o r t i s provided i n t h e i n t e r e s t ' of information exchange. Respons ib i l i ty f o r the conten ts
resides in t h e author or organiza t ion that prepared i t .
Prepared under Contract No. NASL-5974 by BOLT BERANEK AND NEWMAN IMC.
21120 Vanowen S t r e e t Canoga Park, California 91303
f o r
NATIONAL AERONAUTICS AND SPACE ADMINISTRATION
A P E S RESEARCH CENTER

TABLE OF CONTENTS
Page
SUMMARY.. . . . . . . . . . . . . . . . . . . . 1
1. INTRODUCTION . . . . . . . . . . . . . . . . . . 2
2. REVIEW OF AERODYNAMIC SOUND THEORY FOR STATIONARY AND ROTATING LIFTING SURFACES . . i . . . . . . . 3
2.1 Curle's Dipole Sound Theory . . . . . . . . 3
L i f t i n g Surfaces . . . . . . . . . . . . . . 4 2.2 Sound Radiat ion from S ta t iona ry
2.3 Sound Radiat ion from Rotat ing L i f t i n g Surfaces . . . . . . . . . . . . . . 6
3 SOUND DIRECTIVITY PATTERN RADIATED FROM SMALL AIRFOILS . . . . . . . . . . . . . . . . . 8
3.1 Basic Equations . . . . . . . . . . . . . . 8 3.2 Experimental Program . . . . . . . . . . . . 8
4 . THEORY OF SOUND RADIATION FROM SMALL AIRFOILS I N TURBULENT FLOlh? . . . . . . . . . . . . . . . . 1 2
4 . 1 Theore t i ca l Model . . . . . . . . . . . . . 12 4.2 Experimental Program . . . . . . . . . . . . 1 3
5. STUDIES OF LEADING-EDGE SERRATIONS AS A DEVICE FOR REDUCING AERODYNAMIC SOUND RADZATION FROM LIFTING SURFACES . . . . . . . . . . . . . . . . 15
'5.1 Review of Soderman's Studies . . . . . . . . 15 Serrations. on a NACA 0012 A i r f o i l . . . . . 16
5.2 Study of the Ef fec t s of Leading-Edge
5.2.1 Acoustic Tests . . . . . . . . . . . 16 5.2.2 Diagnostic Tests . . . . . . . . . . 19
Performance Tests . . . . . . . . . . 23 5.2.3 Steady-State Aerodynamic
5.3 Study of the Ef fec t s of Leading-Edge S e r r a t i o n s on a Two-Bladed NACA 0012 P rope l l e r . . . . . . . . . . . . . . . . . 25
6 . CONCLUSIONS AND RECOMIGNDATIONS . . . . . . . . . 28
iv.
I : Preceding page blank ). . . . . . . .__ . ........ .___ __.-. =. ..... .*.". .
TABLE OF COZTEiqTS ( C o n t )
Page
REFERENCES. . . . . . . . . . . . . . . . . . . . . . . . 30
TABLES . . . 33
FIGUFE3S. . . . . . . . . . . . . . . . . . . . . . . . . 35 APPENDIX A - UCLA FREE-JET ANECHOIC FACILITY . . . . . . 78
APPENDIX B - EXTENSION OF LIEPMANN'S MODEL TO PREDICT SOUND RADIATION FROM SMALL AIRFOILS IN TURBULENT FLOW . . . . . . . . . . . . . . . 84
APPENDIX C - BBN QUIET W I N D TUNNEL . . , . e . . . . 88
V
Preceding page blank I.. . . . . . . . . . . . . . . . . . . . . . . . . . . . . . . . . . . . . . i
LIST O F FIGURES
Figure 1. Schematic of A i r f o i l Support App.aratus and Microphone Angular Path
Figure 2. Schematic of T e s t Set-uD and D e f i n i t i o n o f Coordinate Sys tem
Figure 3. Air fo i l D i r e c t i v i t y P a t t e r n f = 1250 Hz, - l / 3 Octave B a n d
Figure 4. Comparison of Curle v s Dipole D i r e c t i v i t y P a t t e r n with Experiment
Figure 5. Comparison of C u r l e ' s - Dipole D i r e c t i v i t y P a t t e r n w i t h Experiment
Figure 6. A i r f o i l Sound Radiat ion One-Third Octave Band Spectrum
Figure 7. A i r f o i l Sound Rzdiat ion ir, Turbulent Flow- Comparison Between Theory and Experiment
Figure 8a. Photograph of NACA 0012 A i r f o i l Support Apparatus
Figure 8b. Photograph of NACA 0012 A i r f o i l with Leading- Edge S e r r a t i o n
Figure 9 . Schematic and Location of S e r r a t i o n s
Figure 10. BBN Free-Jet Background Sound Power Levels
Figure 11. E f f e c t of S e r r a t i o n S ize on A i r f o i l Sound Radiat ion f o r a = 409 V = 60 f t / s e c
Figure 12 . Ef fec t of S e r r a t i o n Location on A i r f o i l Sound Radiat ion for a -- bo, V = 60 f t / s e c
Figure 13. E f fec t o f S e r r a t i o n 4 , LOC 3' on A i r f o i l Sound
Figure 1 4 . E f f e c t of S e r r a t i o n 4 , Loc 3" on A i r f o i l Sound
Radiat ion f o r cx = O o , V = 60 f t / sec
Radiat ion f o r c1 = 4* , V = 60 f t / s e c
Figure 15. E f f e c t of S e r r a t i o n 4 , Loc 3' on A i r f o i l Sound Radiat ion f o r a = 8 O , V = 60 f t /sec
vi
I .... ~ ___ . ,-
Preceding Page blank
LIST O F FIGURES (Cont)
Figure 16 .
Figure 17 .
Figure 18.
Figure 19.
Figure 20.
Figure 21.
Figure 22.
Figure 23.
Figure 2 4 .
Figure 25.
Figure 26.
Figure 27.
Figure 28.
Figure 29.
S f f e c t of S e r r a t i o n 4 , LOC 3' on A i r f o i l Sound Radiation f a r 01 = 1Z0, V = 60 f t /sec
Effec t of S e r r a t i o n 4, Loe 3' on A i r f o i l Sound Radiat ion f o r a = 1 6 O , V = 60 f t / s ec
Ef fec t of S e r r a t i o n 4, LOC 3' on A i r f o i l Sound Radiation f o r a = 0°, V = 100 f t / s e c
Ef fec t of S e r r a t i o n Q 3 LOC 3' on A i r f o i l Sound Radiat ion f o r a = 4 O , V = 100 f t / s e c
Ef fec t of S e r r a t i o n 4, Loc 3' on A i r f o i l Sound Radiat ion f o r a = 8 O , V = 100 f t / s ec
Ef fec t of Se r ra t ion Q 3 LOC 3# on A i r f o i l Sound Radiat ion f o r a = 1203 V = 100 f t / s e c
Ef fec t of S e r r a t i o n 4, LOC 3' on A i r f o i l Sound Radiat ion f o r a = 1 6 O , V = 100 f t / s q c
Ef fec t of Reynolds Number on NACA 0 0 1 2 A i r f o i l C h a r a c t e r i s t i c s (Ref. 25)
F luc tua t ing L i f t , Drag and Noment about Aero- dynamic Center of Unmodified NACA 0012 A i r f o i l f o r a = O b , V = 25 f t / s e c
F luc tua t ing Lift, Drag and Moment about Aero- dynamic Center of NACA 0012 A i r f o i l wi th S e r r a t i o n 4, Loc 3'for a = Oo, V = 25 f t / s e c
Var ia t ion of S t rouha l No. of the Tone w i t h Reynolds Number
P r o f i l e s of Unsteady Velocity i n Acoustic Tone Band ( 8 0 0 H z ) i n V ic in i ty of T r a i l i n g Edge; v = 6 0 r t / s e c
'dake Turbulence, 0.1'' Behind T r a i l i n g .Edge /,See Figure 27 for Probe Location) a = +403 Tr = 60 f t / s e c
1;ake Turbulence 1" from T r a i l i n g ' Edge (see Figure 27 f o r Probe Location) a = f Q o , V = 60 f t / s e c
v i i
L I S T OF FIGURES (Cont)
Figure 30.
Figure 31.
Figure 32.
Figure 33.
Figure 34.
Figure 35a.
Figure 35b.
Figure 36.
Figure 37.
Figure 38.
Figure 39.
‘Figure 40.
Figure 4 1 .
Figure 42.
W&e TurSulence 1” from T r a i l i n g Edge (see Figure 27 for Probe Location) a = + 1 4 O ,
V = 60 f t / s e c
E f f e c t of T r i p Wire(s) on Steady L i f t of A i r f o i l
Effect of T r i p Wire(s) on Steady Lift of Airfoil
E f f e c t of Serration Q3 LOC. 3’ on Mean Velocity P r o f i l e i n Vic in i ty of‘ T r a i l i n g Edge
Flow Visua l i za t ion ; NACA 0012 A l r f o i l ; a = +5* (Arrows Indicate Direc t ion of Local Mean Flow)
Photograph of f r o p e l l e y Mounted on Spinner
Photograph of P r o p e l l e r and S e r r a t i o n Attached at Outer 1/4 Span
Background Sound Power Level. with Spinner Attached; V = 40 f t / s e c
E f f e c t of Varying Spanwise Length of S e r r a t i o n 5 , Loc 2’ on P rope l l e r Sound Radiation; 2000 rpm, V I = 40 f t / s e c , ag = 20°
E f f e c t of Varying Spanwise Length of S e r r a t i o n 5, LOC 2’ on Propellefi Sound Radiation; 2000 rpm, V. = 40 f t / s ec , % = 22.5O
E f f e c t of Varying Spanwise Length of S e r r a t i o n 5, Loc 2’ on P r o p e l l e r Sound. Radiation; 2000 rpm, V
E f f e c t of Varying Spanwise Length of S e r r a t i o n 5 , LOC 2’ on P rope l l e r Sound Radiation; 2000 rpm, V = 40 f t /sec, ag = 27.5’
E f f e c t o f s e r r a t i o n 5 , LOC 1’ and 2’ on P rope l l e r Sound Radiation; 4000 rpm, V = 40 f t / s e c ,
E f fec t of S e r r a t i o n 5, Loc 1” and 2’ on P rope l l e r Sound Radiation; 4000 rpm, V = 40 f t / s ec , a = 20°
= 40 f t / sec , aB = 25’
CLB = 17.50
B
v i i i
L I S T O F FIc(JRES (Cont)
Figure 43. E f f e c t of Se r ra t ion 5, Loc 1’ and 2’ on P r o p e l l e r Sound Radiat ion; 4000 spn, V r 40 f t /sec, ag = 22.50
Figure A-1. Schematic of UCLA Jet Flow F a c i l i t y (Plainview)
Figure A-2. Experimental Confirmation t h a t UCLA Jet Flow F a c i l i t y i s Anechoic
Figure A-3. Experimental Confirmation t h a t UCLA Jet Flow F a c i l i t y i s Anecholc
Figure A-4. Schematic of Noise Measurement System
Figure C - l . Schematic of BBN Q u i e t Wind Tunnel
Figure C-2. Schematic of Noise Measurement System
i x
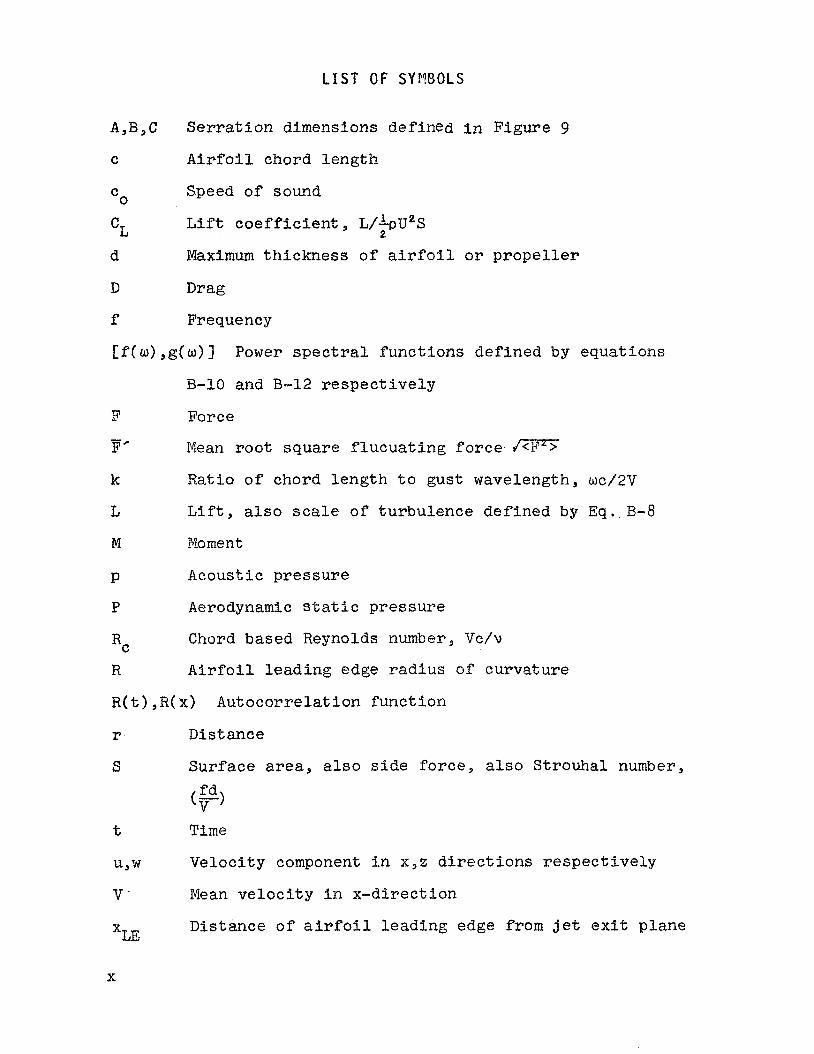
LIST OF sYr?BoLs
A,B,C
C
cO
cL d
D
f
S e r r a t i o n dimensions defined i n Figure 9
A i r f o i l chord length
Speed of sound
L i f t c o e f f i c i e n t L/"~u~s
Maximum th ickness o f a i r f o i l o r p r o p e l l e r
Drag
Frequency
2
[ f ( w ) , g ( w ) ] Power s p e c t r a l func t ions deffned by equat ions
B-10 and B-12 r e spec t ive ly
F Force
P' Mean roo t square f l u c u a t i n g fo rce ,
k Ratio of chord length t o gust wavelength, wc/ZV
L L i f t , also s c a l e of turbulence def ined by Eq . . B-8
M Moment
P Acoustic pressure
P Aerodynamic s t a t i c pressure
Chord based Reynolds number, Vc/u
R A i r f o i l l ead ing edge radius of curvature
R ( t ) ,R( x) Autocorrelat ion func t ion
Rc
r. Distance
S Surface area3 a l s o s ide Force, a l s o Strouhal number,
t Time
u,w Velocity component i n x,z d i r e c t i o n s r e spec t ive ly
V ' Mean ve loc i ty i n x-direct ion
Distance of a i r f o i l leadfng edge from j e t e x i t plane 'LE
X
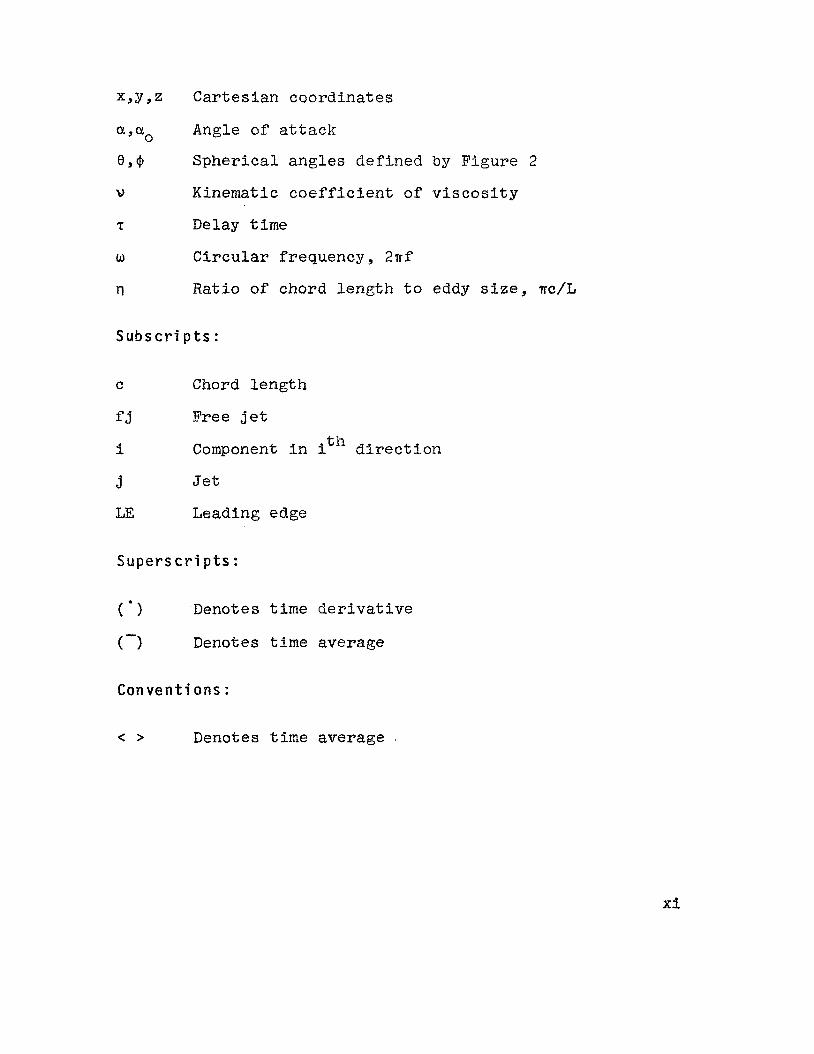
x,y,z Car tes ian coordinates
aJao Angle of a t t a c k
Spher ica l angles def ined by Figure 2
V Kinematic c o e f f i c i e n t of v i s c o s i t y
T Delay t i m e
w Circular frequency, 2 n f
rl Rat io of chord length t o eddy s i z e , nc/L
Subscripts:
C Chord length
f j Free j e t
i Component i n it’ d i r e c t i o n
j J e t
LE Leading edge
Superscripts:
( ’ > Denotes t i m e d e r i v a t i v e
( -1 Denotes t i m e average
Conventions:
< > Denotes t i m e average .
xi
4
AERODYNAMIC SOUND R A D I A T I O N FROM L I F T I N G SURFACES WITH AlWD WITHOUT LEADING-EDGE S E R R A T I O N S
By A l a n S . Hersh a n d Richard E. Hayden" B o l t Beranek and Netdman Inc.
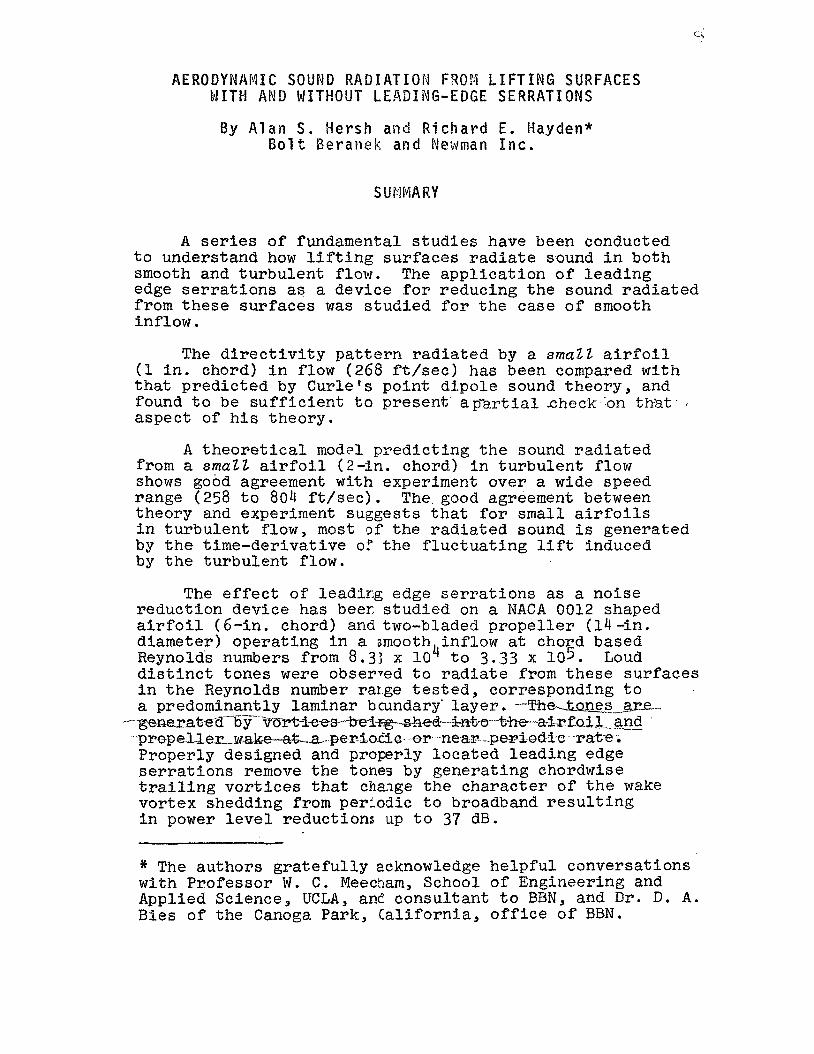
A series of fundamental s t u d i e s have been conducted t o understand how l i f t i n g su r faces radiate sound i n both smooth and tu rbu len t flow. The a p p l i c a t i o n of l ead ing edge s e r r a t i o n s as a device f o r reducing the sound radiated from t h e s e su r faces was s tud ied for the case of smooth inflow.
The d i r e c t i v i t y p a t t e r n radiated by a smaZZ a i r f o i l (1 i n . chord) i n flow (268 f t / s e c ) has been compared w i t h t h a t p red ic t ed by Curle 's po in t d ipo le sound theory , and found t o be s u f f i c i e n t t o present ap-ar t ia l .check on t h a t . , aspec t of h i s theory.
A t h e o r e t i c a l modcl p r e d i c t i n g t h e sound radiated from a smaZZ a i r f o i l (2-in. chord) i n tu rbu len t flow shows good agreement w i t h experiment over a wide speed range (258 t o 804 f t / s e c ) . The good agreement between theory and experiment suggests t h a t f o r small a i r f o i l s i n tu rbu len t flow, most cJf the radiated sound i s generated by t h e t ime-derivat ive of the f l u c t u a t i n g l i f t induced by the tu rbu len t flow.
The e f f e c t of leadicg edge s e r r a t i o n s as a noise reduct ion device has beer s t u d i e d on a NACA 0012 shaped a i r f o i l (6-in. chord) and two-bladed p r o p e l l e r ( 1 4 -in. diameter) ope ra t ing i n a smooth inflow at chord based Reynolds numbers from 8.3: x lo4 t o 3 . 3 3 x 10⁵. Loud d i s t i n c t tones were obserTed t o radiate from these su r faces i n t h e Reynolds number rarge t e s t e d , corresponding t o a predominantly laminar bcundary' layer. - -Fk-sg_p%.
p r o p e U e ~ - ~ ~ a - t ; l 9 ~ - p e r i 6 6 i , C o r neap -perlod-ic rate Properly designed and properly loca t ed leading edge s e r r a t i o n s remove the tones by genera t ing chordwise t r a i l i n g v o r t i c e s t h a t chmge the cha rac t e r of the wake vor tex shedding from periodic t o broadband r e s u l t i n g i n power l e v e l reductions up t o 37 dB.
- - - ~ ~ ~ ~ - a ~ ~ B - - ~ y - ~ ~ ~ ~ ~ ~ ~ ~ ~ -%&m---t-he- a42 Sa.% ?.
The au thors g r a t e f u l l y acknowledge h e l p f u l conversat ions wi th Professor W. C . Meecham, School of Engineering and Applied Science, UCLA, and consul tan t t o BBN, and Dr. D. A. Bles of t he Caiioga Park, Cal i forn ia , o f f i c e o f BBN.
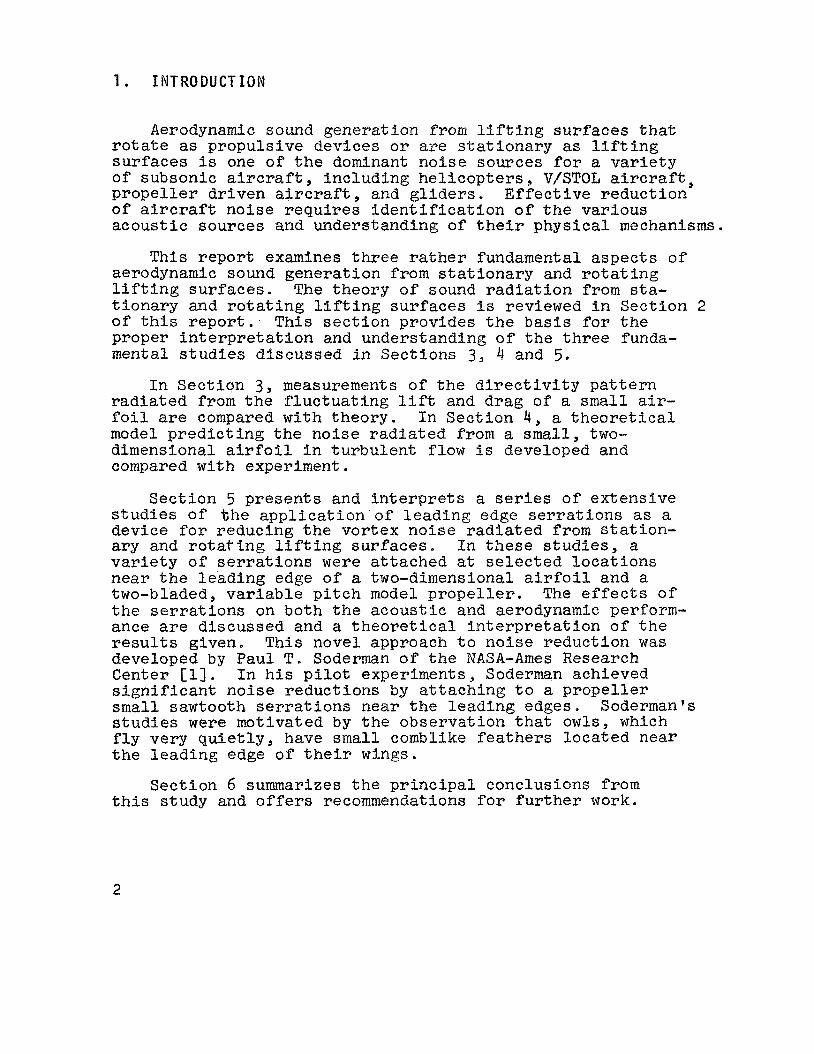
1 . I N T R O D U C T I O N
Aerodynamic sound generat ion from l i f t i n g su r faces t h a t r o t a t e as propuls ive devices or ape s t a t i o n a r y as l i f t i n g sur faces i s one of the dominant no ise sources f o r a v a r i e t y of subsonic a i r c r a f t , inc luding h e l i c o p t e r s , V/STOL a i r c r a f t , p r o p e l l e r dr iven a i r c r a f t , and gl iders . E f f e c t i v e reduct ion of a i rc raf t no ise r e q u i r e s i d e n t i f i c a t i o n o f t he var ious acous t i c sources and understanding of t h e i r phys ica l mechanisms.
T h i s r epor t examines t h r e e rather fundamental a spec t s of aerodynamic sound genera t ion from s t a t i o n a r y and r o t a t i n g l i f t i n g sur faces . The theory of sound r a d i a t i o n from sta- t i ona ry and r o t a t i n g l i f t i n g su r faces i s reviewed i n Sect ion 2 of t h i s report. T h i s s e c t i o n provides t h e basis for t h e proper i n t e r p r e t a t i o n and understanding o f t h e three funda- mental s t u d i e s discussed i n Sec t ions 3, 4 and 5 .
I n Sec t ion 3, measurements of t he d i r e c t i v i t y p a t t e r n radiated from the f l u c t u a t i n g l i f t and drag of a small a i r - f o i l are compared w i t h theory. I n Sec t ion 4, a t h e o r e t i c a l model p r e d i c t i n g the noise r a d i a t e d from a small, two- dimensional a i r f o i l i n t u rbu len t flow i s developed and compared w i t h experiment.
Sec t ion 5 p resen t s and i n t e r p r e t s a series of ex tens ive s t u d i e s of t h e a p p l i c a t i o n o f l ead ing edge s e r r a t i o n s as a device f o r reducing t h e vor tex noise radiated from s t a t i o n - ary and r o t a t t n g l i f t i n g su r faces . I n these s t u d i e s , a v a r i e t y of s e r r a t i o n s were attached at s e l e c t e d l o c a t i o n s near t h e l ead ing edge of' a two-dimensional a i r f o i l and a two-bladed, v a r i a b l e p i t c h model p r o p e l l e r . The e f f e c t s of t he s e r r a t i o n s on both t he acous t i c and aerodynamic perform- ance are discussed and a t h e o r e t i c a l i n t e r p r e t a t i o n of t h e r e s u l t s given. This novel approach t o noise reduct ion was developed by Paul T . Soderman of t h e NASA-Ames Research Center El]. I n h i s p i l o t experiments, Soderman achieved s i g n i f i c a n t no ise reduct ions by a t t a c h i n g t o a p r o p e l l e r small sawtooth s e r r a t i o n s near t h e l ead ing edges. Soderman's s t u d i e s were motivated by the observa t ion t h a t ow1s9 which f l y very q u i e t l y , have small comblike feathers loca ted near t he l ead ing edge o f t h e i r wings.
Sec t ion 6 summarizes t h e p r i n c i p a l conclusions from t h i s study and o f f e r s recommendations f o r f u r t h e r work.
2
2 . REVIEW OF AERODYNAIKLC SOUND THEORY FOR STATIONARY AND ROTATING LIFTING SURFACES
2 . 1 Cur l e l s Dipole Souad Theory
C u r l e r s d ipo le sound theo ry i s commonly used t o p r e d i c t t h e l e v e l and d i r e c t i v i t y o f sound radiated fron? su r faces i n flow [2]. Curle Os theory r ep resen t s an extension of L i g h t h i l l s aerodynamic sound theory [3]. L i g h t h i l l shows that t h e f l u c - t u a t i n g f l u i d stresses i n a t u r b u l e n t flow can genera te sound i n t h e absence o f s o l i d s u r f a c e s wi th in t h e flow. These stresses are equiva len t t o a d i s t r i b u t i o n of volume quadrupoles. C u r l e shows that whenever s u r f a c e s are present i n t h e flow, t h e volume quadrQpoles are supplemented by a d d i t i o n a l sur- face sources . These a d d i t i o n a l sources , which are equiva len t t o a d i s t r i b u t i o n of acous t i c d i p o l e s , are more e f f i c i e n t rad- i a t o r s a t subsonic flow speeds t h a n the volume quadrupoles; t hus these s u r f a c e sources are l i k e l y t o overwhelm any quad- rupoles i n t h e nearby flow.
Recent s t u d i e s by C l a r k and Ribner C4], Gordon [ S I , and Heller [ 6 ] have established q u i t e conclusively t ha t t h e . sucface-generated sound c8n be c o r r e l a t e d d i r e c t l y w i t h t h e f l u c t u a t i n g fo rce f i e l d produced by i n t e r a c t i o n o f t h e f l u i d wi th t h e su r face . Clark and Ribner, i n p a r t i c u l a r , show tha t t h e instantaneous souiic? radiated by a small a i r f o i l ( r e l a t i v e t o a t y p i c a l a c o u s t i c wavelength) immersed i n a t u r b u l e n t flow and its f l u c t u a t i n g l i f t are connected by C u r l e t s equation.
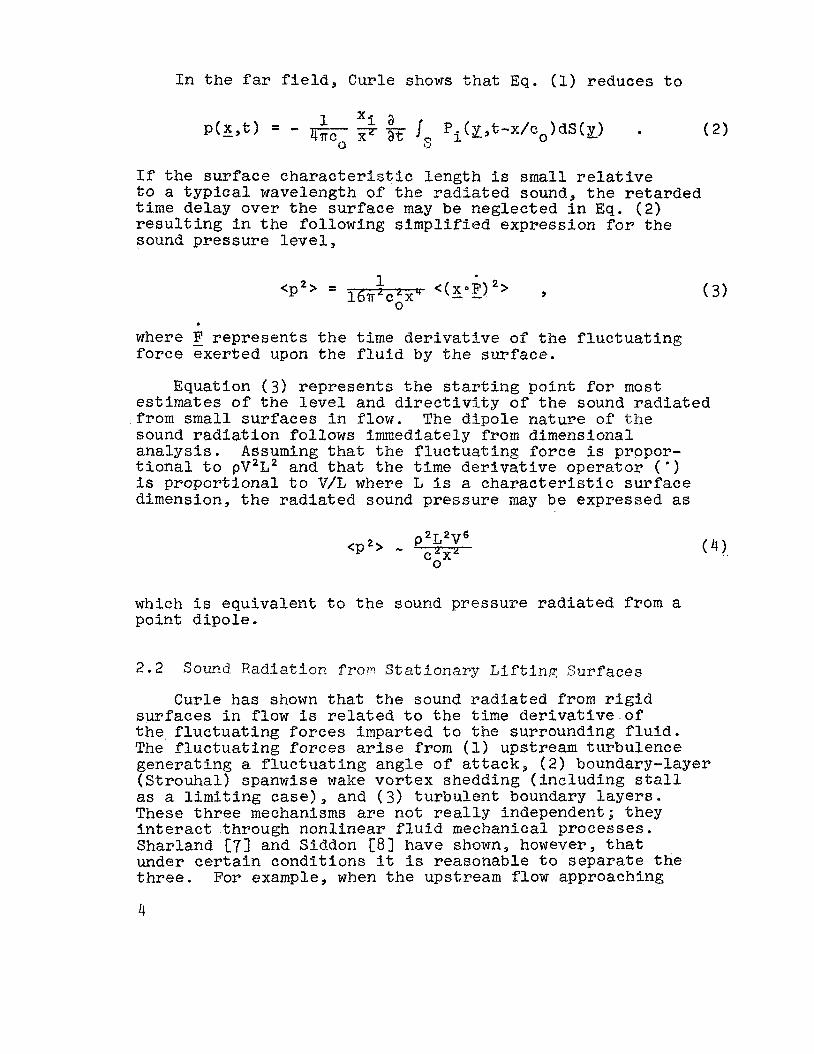
Curle supplemented L i g h t h i l l s equat ion w i t h t h e fol lowing expression
which r ep resen t s t he r a d i a t i o n of sound p ( x , t > due t o t he presence o f t he s u r f a c e S immersed i n a f l o w . Here, Pi i s t h e r e a c t i o n fo rce per u n i t s u r f a c e area exe r t ed by t h e su r face upon t h e f l u i d i n t he i - d i r e c t i o n , x i s t h e vec to r d i s t ance t o t h e observa t ion po in t , y is the veccor d i s t a n c e t o t he c e n t e r o f t he d i f f e r e n t i a l sur7ace area d S ( y ) , - and r = Iz-x/.
3
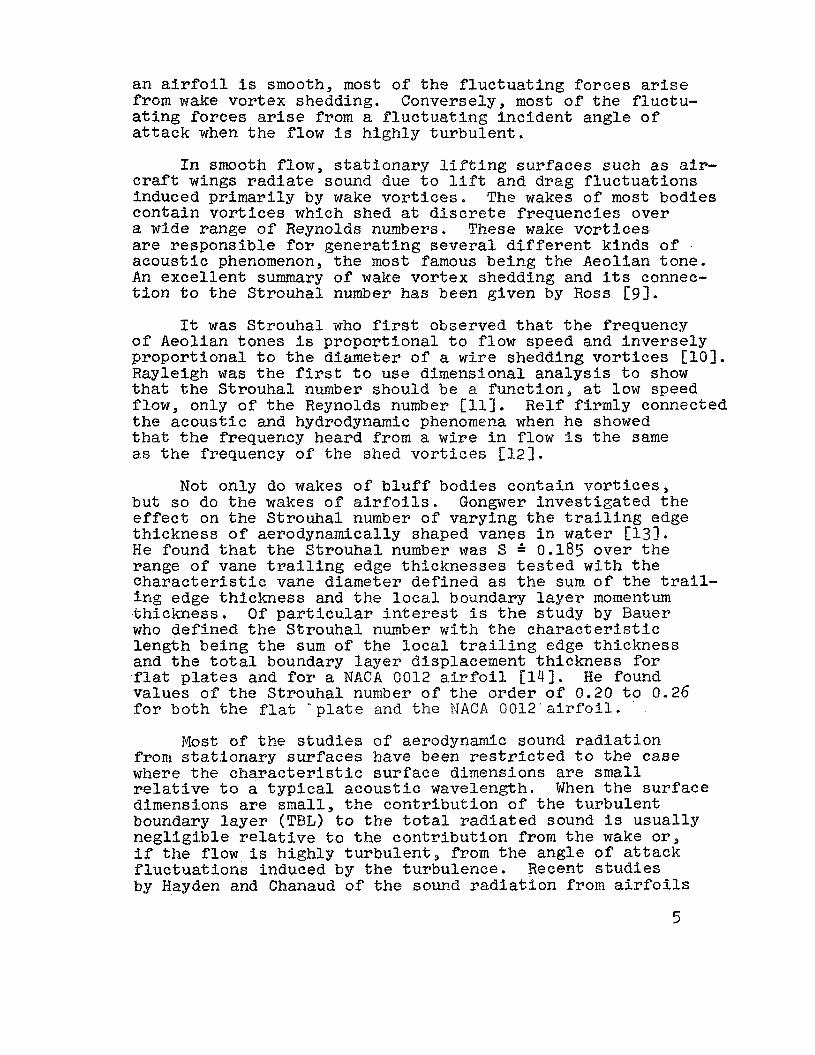
I n t h e f a r f ie ld , , Curle shows tha t Eq. (1) reduces to
I f t h e su r face c h a r a c t e r i s t i c l eng th i s small r e l a t i v e t o a t y p i c a l wavelength of the radiated sound, t h e retarded time delay over the su r face may be neglected i n Eq. ( 2 ) r e s u l t i n g i n t h e following s i m p l i f i e d expression for t h e sound pressure l eve l s
* where F r ep resen t s t h e t i m e d e r i v a t t v e of the f l u c t u a t i n g f o r c e exerted upon t h e f l u i d by the su r face .
Equation ( 3 ) r ep resen t s t h e s t a r t i n g poin t f o r most estimates of the l e v e l and d i r e c t i v i t y of the sound radiated from small su r faces i n flow. The d ipo le na tu re o f t h e sound r a d i a t i o n follows immediately from dimensional a n a l y s i s . Assuming tha t t he f l u c t u a t i n g fo rce i s propor- t i o n a l t o pV2L2 and tha t t h e t ime d e r i v a t i v e opera tor ( ' ) i s propor t iona l t o V/L where L i s a c h a r a c t e r i s t i c su r f ace dimension,, t h e radiated sound pressure may be expressed as
which i s equiva len t t o t h e sound pressure radiated from a point d ipole .
2 .2 Sound Radiat ion f ror ! S t a t i o n a r y L i f t i n ? Surfaces
Curle has shown that t h e sound r a d i a t e d from r i g i d su r faces i n flow is related t o t h e t i m e d e r i v a t i v e of t h e f l u c t u a t i n g f o r c e s imparted t o t h e surrounding f l u i d . The f l u c t u a t i n g fo rces ar ise from (1) upstream turbulence genera t ing a f l u c t u a t i n g angle of a t t a c k , ( 2 ) boundary-layer (S t rouhal ) spanwise wake vor tex shedding ( inc luding s t a l l as a l i m i t i n g c a s e ) , and ( 3 ) t u rbu len t boundary Layers. These three mechanisms are not r ea l ly independent; t h e y i n t e r a c t through nonl inear f l u i d mechanical processes . Sharland 1'71 and Siddon [8] have shown, however, that under c e r t a i n condi t ions i t i s reasonable t o sepa ra t e t h e three. For example, when the upstream flow approaching
4
an a i r f o i l i s smooth, most of t h e f l u c t u a t i n g fo rces arise from wake vor tex shedding. Conversely, most of the f luc tu - a t i n g fo rces arise from a f l u c t u a t i n g inc iden t angle of a t t a c k when the flow i s h ighly tu rbu len t .
I n smooth flow, s t a t i o n a r y l i f t i n g su r faces such as air- c r a f t wings radiate sound due t o l i f t and drag f l u c t u a t i o n s induced pr imar i ly by wake v o r t i c e s . The wakes of most bodies con ta in v o r t i c e s which shed a t d i s c r e t e f requencies over a wide range of Reynolds numbers. These wake v o r t i c e s are respons ib le f o r genera t ing s e v e r a l d i f f e r e n t kinds o f acous t i c phenomenon, t he most famous being the Aeolian tone . An e x c e l l e n t summary of wake vor tex shedding and i t s connec- t i o n t o the St rouhal number has been given by Ross [ 9 ] .
It was St rouhal who first observed t h a t t h e frequency o f Aeolian tones i s propor t iona l to flow speed and inve r se ly propor t iona l t o the diameter of a wire shedding v o r t i c e s [LO]. Rayleigh was the f i r s t t o use dimensional a n a l y s i s t o show tha t the St rouhal number should be a func t ion , at low speed flow, only of the Reynolds number [ll]. R e l f f i r m l y connected the acous t i c and hydrodynamic phenomena when he showed tha t t he frequency heard from a wire i n flow i s the same as t h e frequency of t h e shed v o r t i c e s [12].
Not only do wakes of b l u f f bodies con ta in v o r t i c e s , but s o do t h e wakes of a i r f o i l s . Gongwer inves t iga t ed t h e e f f e c t on t h e S t rouhal number of varying the t r a i l i n g edge th ickness o f aerodynamically shaped vanes i n water 1133. H e found that the S t rouha l number was S 0.185 over t h e range of vane t r a i l i n g edge th icknesses tested w i t h t h e c h a r a c t e r i s t i c vane diameter def ined as t h e sum of t h e t ra i l - i n g edge th ickness and t h e l o c a l boundary l a y e r momentum th ickness . O f p a r t i c u l a r i n t e r e s t i s t h e study by Bauer who def ined the S t rouhal number w i t h t h e c h a r a c t e r i s t i c l eng th being the sum of t h e l o c a l t r a i l i n g edge th ickness and the t o t a l boundary layer displacement th ickness f o r f l a t plates and f o r a NACA GO12 a i r f o i l [14]. H e found values o f t h e S t rouhal number of t h e o r d e r of 0.20 to 0.26 f o r bo th the f l a t . p l a t e and t h e NACA 0012'airfoil.
Most of t h e s tudies of aerodynamic sound r a d i a t i o n from s t a t i o n a r y su r faces have been r e s t r i c t e d t o the case where t h e c h a r a c t e r i s t i c su r f ace dimensions are small r e l a t i v e t o a t y p i c a l a c o u s t i c wavelength. When t h e su r face dimensions are small, t h e con t r ibu t ion of t h e tu rbu len t boundary l a y e r (TBL) t o t h e t o t a l radiated sound is usua l ly n e g l i g i b l e r e l a t i v e t o the con t r ibu t ion from the wake o r , i f t h e f low i s h ighly t u r b u l e n t , from the angle of a t t a c k f l u c t u a t i o n s induced by t h e turbulence. Recent s t u d i e s by Hayden and Chanaud of the sound r a d i a t i o n from a i r f o i l s
5
having a l a r g e chord ( r e l a t i v e t o a t y p i c a l acous t i c wave- l eng th ) show tha t the i n t e r a c t i o n of the TBL w i t h t h e t r a i l i n g edge imparts momentum f l u c t u a t i o n s t o t he surround- i n g medium an3 the t o t a l radiated spectrum may be separated i n t o TBL-dominated components and wake-dominated components [15,16]. Hayden and Chanaud found tha t when t h e TBL i s t h i n ( r e l a t i v e t o t h e a i r f o i l t h i ckness ) , the wake contribu- t i o n t o t h e t o t a l r a d i a t i o n sound dominates t ha t due t o the TBL i n t e r a c t i o n w i t h t h e t r a i l i n g edge.
2 . 3 Sound R a d i a t i o n from R o t a t i n g L i f t i n g S u r f a c e s
The sound radiated from r o t a t i n g l i f t i n g su r faces such as p r o p e l l e r s , r o t o r s , and fans differs from t h a t from s t a t i o n a r y su r faces i n t ha t p e r i o d i c o r d i s c r e t e components, h i s t o r i c a l l y c a l l e d r o t a t i o n a l no i se , appear i n the sound spectrum a r i s i n g from the steady and pe r iod ic loads a c t i n g upon the f l u i d i n t h e neighborhood o f the r o t a t i n g blades.
The steady loads are def ined as t h e time-average r o t a t i n g l i f t and drag f o r c e s . The pe r iod ic loads are a s soc ia t ed wi th (1) non-uniform but steady inflow, ( 2 ) pe r iod ic v i b r a t i o n of t h e l i f t i n g su r face blades, and (3) c y c l i c p i t c h changes. The steady loads may be modeled by a mean c i r c u l a t i o n about t h e l i f t i n g su r face blades; t h e pe r iod ic loads may be modeled by a pe r iod ic c i r c u l a t i o n about t h e l i f t i n g su r face blades. I n both cases , t h e fluid dynamic loads may be charac te r ized as being i n v i s c i d . Although t h e c i r c u l a t i o n i s i n i t i a l l y c rea t ed by the v i s - c o s i t y of the f l u i d , t h e c i r c u l a t i o n may be subsequently modeled by a d i s t r i b u t i o n of bound, shed, and t i p v o r t i c e s .
The nondiscre te o r broadband sound components of t he sound spectrum, h i s t o r i c a l l y called vor tex noise , are generated by the randomly f l u c t u a t i n g l i f t and drag fo rces (in both amplitude and phase) imparted t o t he surrounding f l u i d . The var ious random f o r c e s arise from (1) boundary- layer (S t rouhal ) spanwise vor tex shedding ( inc lud ing s t a l l as a l i m i t i n g case) , ( 2 ) upstream turbulence inducing angle-of-attack f l u c t u a t i o n s , (3 ) t h e blade tu rbu len t boundary layer, ( 4 ) vor tex shedding i n t e r a c t i o n between r o t a t i n g blades, and ( 5 ) random blade v ib ra t ion .
Stowell and Deming were t h e f irst to s t u d y t h e r e l a t i o n between vortex wake shedding from a r o t a t i n g c y l i n d r i c a l rod and the subsequent radiated sound [l73. They showed tha t t h e s i z e or s c a l e of t h e v o r t i c e s shed was approxi- mately constant along t h e rod with magnitude l / 5 th of
6
t he rod diameter . Laters Yudin observed t h a t a body shedding v o r t i c e s experiences an a l t e r n a t i n g fo rce which he related t o an a c o u s t i c d ipo le [18]. Orig ina l ly only a suppos i t ion on the part of Yudin, t h i s concept was l a t e r confirmed by Curle [ 2 l t o be a consequence of L i g h t h i l l ' s b a s i c theory o f aerodynamic sound [3]*
Hubbard [lg] extended Pudin's work on r o t a t i n g rods t o t h e p r a c t i c a l . case of r o t a t i n g a i r f o i l s and found , tha t t h e radiatea suund power due t o vor tex noise was p ropor t iona l t o t h e blade area and t h e s i x t h power of a c h a r a c t e r i s t i c blade s e c t i o n v e l o c i t y . Schlegel e t a1 E201 developed an empir ica l p r e d i c t i o n scheme f o r vortex noise from a c e r t a i n c l a s s o f p r o p e l l e r s based on mean l i f t and drag c o e f f i c i e n t and a c h a r a c t e r i s t i c ve loc i ty t o t h e s i x t h power. Schlegel*s work does not account for vor tex nc i se from symmetrical a i r f o i l s e c t i o n s when t h e s e c t i o n angle of a t t a c k l is zero ( i . e . , no l i f t o r t h r u s t ) and thus may not be genera l ly used ,
I n a d d i t i o n t o generat ing acous t i c d ipole sources , a r o t a t i n g blade also generates acous t i c monopole and quad- rupole sources . The monopole acous t i c sources are generated by the blade th ickness which imparts a pe r iod ic volumetric f low rate t o t h e surrounding f l u i d . The quadrupole a c o u s t i c sources are generated by the f l u c t u a t i n g shear stresses imparted t o t h e surrounding f l u i d . For t h i n l i f t i n g su r faces ope ra t ing a t moderate subsonic speeds, t h e sound radiated from the monopole and quadrupole sources i s n e g l i g i b l e r e l a t i v e t o the sound radiated from t h e d ipo le sources and, hence, w i l l not be considered i n t h i s s tudy.
7
3 . SOUND DIRECTIVITY PATTERN RADIATED FROM SMALL AIRFOILS
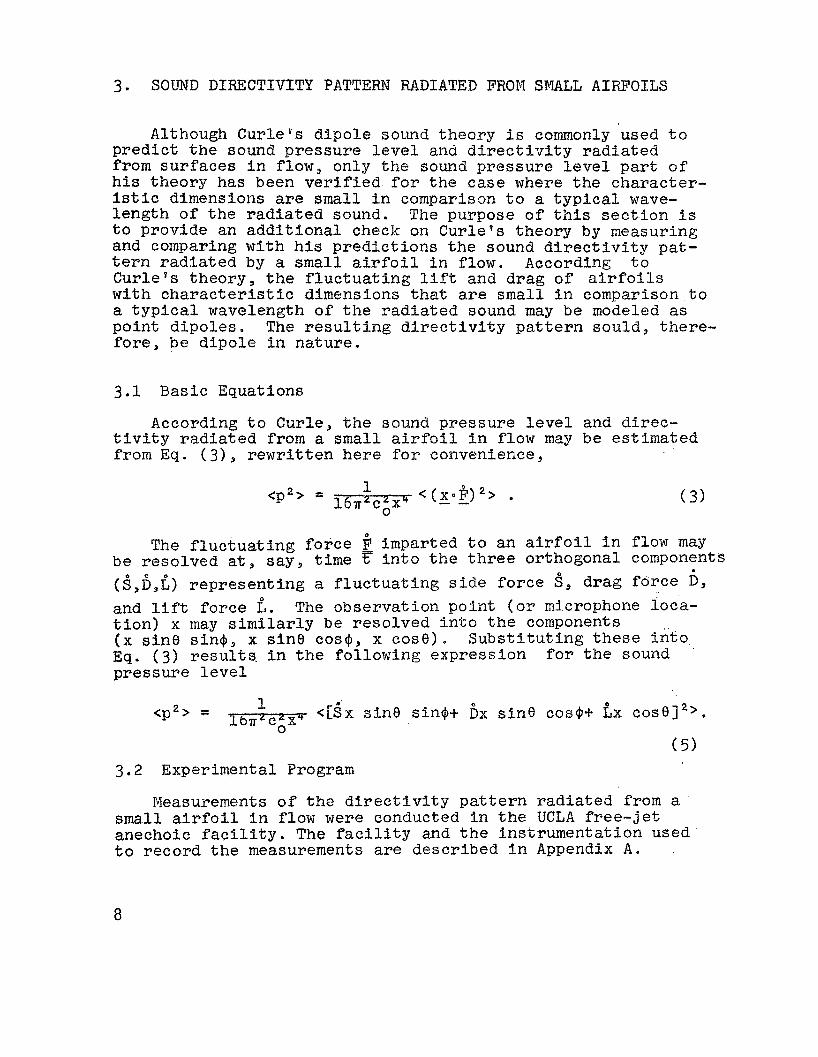
Although C u r l e t s d ipo le sound theory i s commonly used t o p red ic t t h e sound pressure l e v e l and d i r e c t i v i t y radiated from su r faces i n f l o w , only the sound pressure l e v e l part of his theory has been v e r i f i e d f o r t h e case where t h e charac te r - i s t i c dimensions are small i n comparison t o a t y p i c a l wave- l eng th of t h e radiated sound. The purpose of this s e c t i o n i s t o provide an a d d i t i o n a l check on Curie's theory by measuring and comparing w i t h h i s p r e d i c t i o n s the sound d i r e c t i v i t y pat- t e r n radiated by a small a i r f o i l i n flow. According t o Cur l e9s theory, t he f l u c t u a t i n g l i f t and drag of a i r f o i l s with c h a r a c t e r i s t i c dimensions tha t are small i n comparison t o a t y p i c a l wavelength of t he r a d i a t e d sound may be modeled as point d ipoles . The r e s u l t i n g d i r e c t i v i t y p a t t e r n sould , there- f o r e , be d ipo le i n na ture .
3 . 1 Basic Equations
According t o Curle, t h e sound pressure l e v e l and d i rec- t i v i t y radiated from a small a i r f o i l i n flow may be est imated from Eq. ( 3 ) , r e w r i t t e n here f o r convenience,
The f l u c t u a t i n g fo rce 3 imparted t o an a i r f o i l i n f low may be resolved a t , say, t i m e 7 i n t o t h e three orthogonal components (8,6,6> rep resen t ing a f l u c t u a t i n g s i d e fo rce 5 , drag fo rce 6, and lift force E. The observat ion poin t ( o r mlcrophone loca- t i o n ) x may s i m i l a r l y be reso lved i n t o t h e components (x s i n 6 s i n + , x Sin9 cos$ , x cos0) S u b s t i t u t i n g these i n t o Eq. ( 3 ) resu l t s . i n the following expression f o r t h e sound pressure l e v e l
3.2 Experimental Program
Measurements o f the d i r e c t i v i t y p a t t e r n radiated from a small a i r f o i l i n flow were conciucted i n the UCLA free-je+, anechoic f a c i l i t y . The f a c i l i t y and t h e ins t rumenta t ion used t o record t h e measurements are descr ibed I n Appendix A .
8
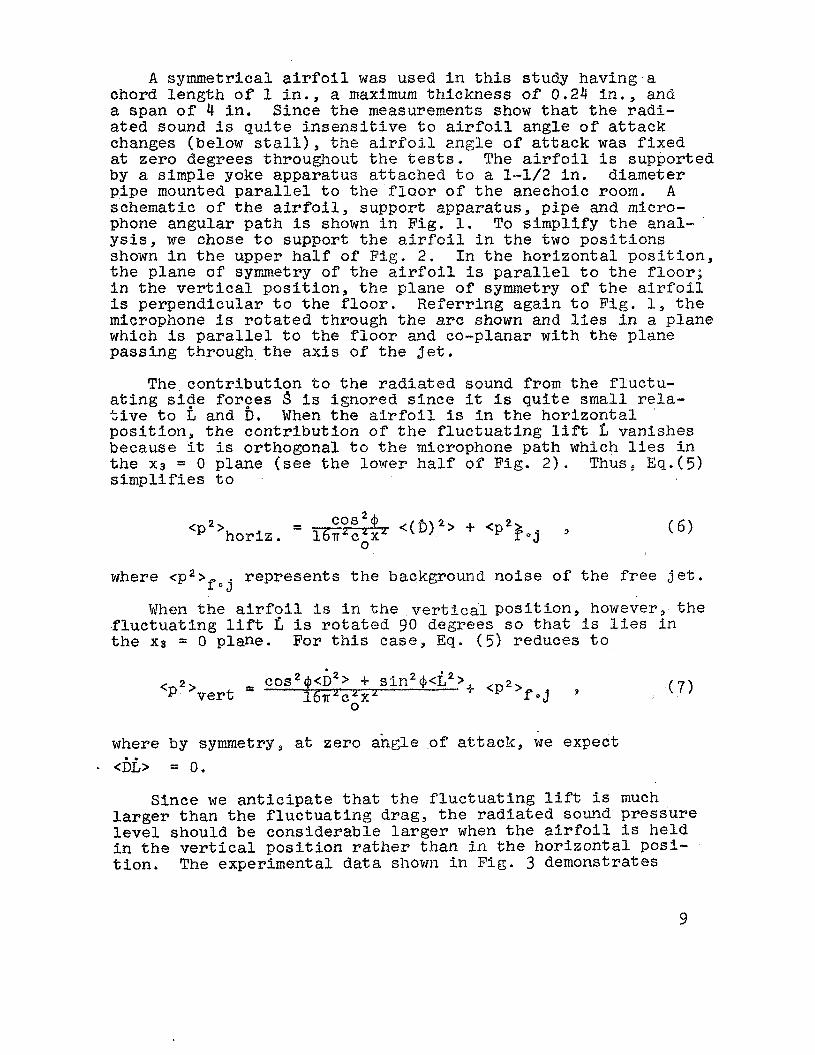
A symmetrical a i r f o i l was used i n t h i s study having a chord l eng th o f 1 i n . , a maximum th ickness of 0.24 i n . , and a span o f 4 i n . Since t h e measurements show that the radi- ated sound is q u i t e i n s e n s i t i v e t o a i r f o i l angle o f a t t a c k changes (below stall), t he a i r f o i l angle of a t t a c k was f i x e d at zero degrees throughout the t e s t s . The a i r f o i l i s supported by a s imple yoke apparatus a t t ached t o a I-1/2 i n . diameter p ipe mounted paral le l t o t he floor o f t h e anechoic room. A schematic of t h e a i r f o i l , support apparatus , p i p e and micro- phone angular path 2s shown i n Fig. 1. To s i m p l i f y t h e anal- y s i s , w e chose t o support t h e a i r f o i l i n the two p o s i t i o n s shown i n t h e upper half of F i g . 2 . I n t h e h o r i z o n t a l p o s i t i o n , the plane of syrmetry of t he a i r f o i l i s parallel t o t h e floor; i n the v e r t i c a l p o s i t i o n , t h e plane of symmetry of t h e a i r f o i l i s perpendicular t o t he f l o o r . Refer r ing again t o F ig . 1, t h e microphone i s r o t a t e d through the arc shown and l ies i n a plane which is para l le l t o t h e f l o o r and co-planar wi th the plane pass lng through t h e axis of the j e t .
The con t r ibu t ion t o t h e r a d i a t e d sound from t h e f luc tu- a t i n g siqe for9es s i s ignored s i n c e it i s q u i t e small r e l a - 2ive t o L and D. When t h e a i r f o i l i s i n t h e h o r i z o n t a l p o s i t i o n , the con t r ibu t ion of the f l u c t u a t i n g l i f t 2 vanishes because it i s orthogonal t o t h e microphone path which l i e s i n t h e x3 = 0 plane (see t h e lower h a l f of Fig. 2 ) . Thus, Eq. (5 ) s impl i f i e s t o
where <p2>f
f l u c t u a t i n g l i f t f, i s r o t a t e d 90 degrees s o t ha t i s l i e s i n t h e x3 = 0 plane. For t h i s case, Eq. ( 5 ) reduces t o
represents t h e background noise of t h e f r e e j e t .
When t h e a i r f o i l i s i n t h e v e r t i c a l p o s i t i o n , however, t h e
where by symmetry, a t zero angle of a t t a c k , w e expect - <Ix> = 0.
Since w e a n t i c i p a t e t ha t t h e f l u c t u a t i n g l i f t i s much larger than t h e f l u c t u a t i n g drag, t h e radiated sound pressure l e v e l should be considerable larger when the a i r f o i l i s he ld i n t h e v e r t i c a l p o s i t i o n rather than i n the h o r i z o n t a l posi- t i o n . The experimental data shown i n F i g - 3 demonstrates
9
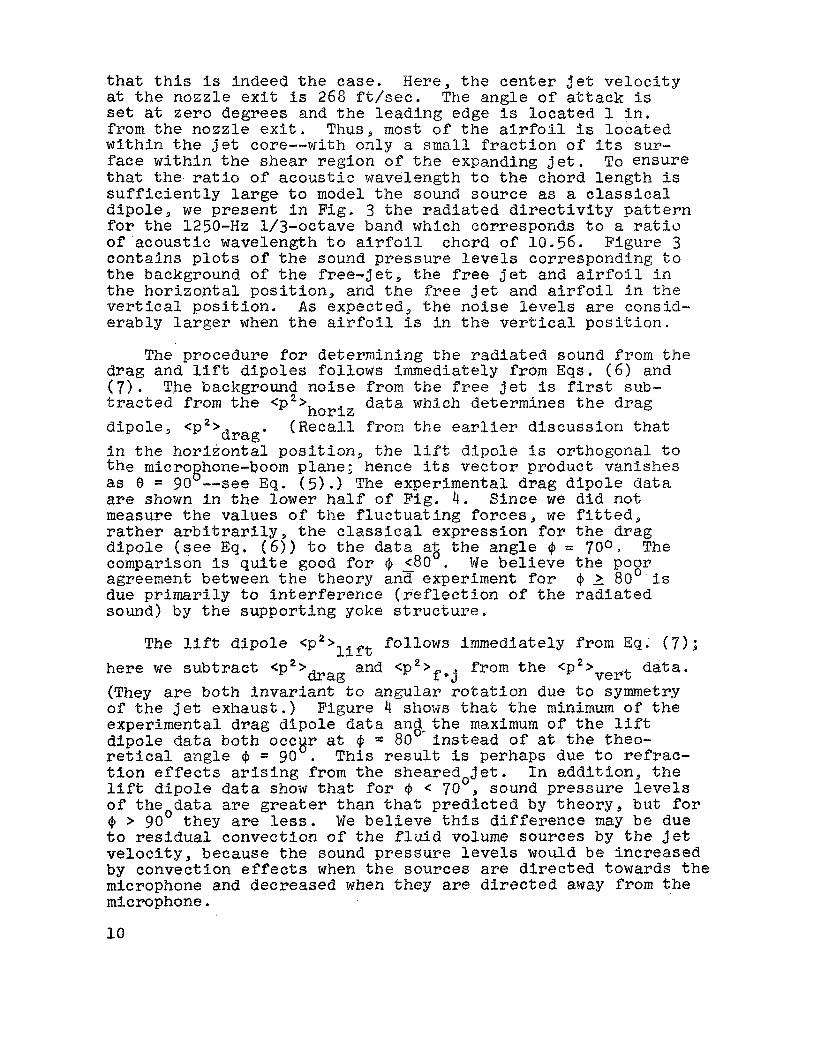
that t h i s i s indeed t h e case. Here, t h e cen te r 3 e t v e l o c i t y at t h e nozzle e x i t is 268 f t / s e c . The angle of a t t a c k i s set a t zero degrees and t h e l ead ing edge i s loca ted 1 i n . from the nozzle e x i t . Thus., most of t h e a i r f o i l i s loca ted wi th in t h e j e t core--with only a small f r a c t i o n o f i t s sur- face wi th in the shear reg ion of t h e expanding j e t . To ensure t ha t t h e r a t i o of acous t i c wavelength t o t h e chord length i s s u f f i c i e n t l y large t o model t h e sound source as a c l a s s i c a l d ipole , w e p resent i n Fig. 3 t h e r a d i a t e d d i r e c t i v i t y p a t t e r n f o r the 1250-Hz 1/3-octave band which corresponds t o a r a t i o of acous t i c wavelength t o a i r f o i l chord of 10.56. Figure 3 contains p l o t s of t h e sound pressure l e v e l s corresponding t o t h e background of t h e f r e e - j e t , t h e free j e t and a i r f o i l i n t h e ho r i zon ta l pos i t i on , and t h e f r e e j e t and a i r f o i l i n t h e v e r t i c a l pos i t i on . A s expected, t h e noise levels a r e consid- erably l a r g e r when t h e a i r f o i l i s i n t h e v e r t i c a l p o s i t i o n .
The procedure f o r determining t h e radiated sound from t h e drag and l i f t d ipo le s follows immediately from E q s . ( 6 ) and ( 7 ) . The background noise from t h e f r e e j e t i s first sub- t r a c t e d from t h e <p2>horiz data which determines t h e drag d ipole , <p2>drag. i n the ho r i zon ta l pos i t i on , t h e lift d ipo le I s orthogonal t o t h e micro hone-boom plane; hence i t s vec to r product vanishes as 8 = 90 --see E q . ( 5 ) .) The experimental d rag d ipo le data are shown i n t h e lower h a l f of Fig. 4 . Since w e d i d not measure t h e values of t h e f l u c t u a t i n g fo rces , we f i t t e d . , rather a rb i t ra r i ly , t h e c l a s s i c a l expression f o r t h e drag d ipo le (see Eq. ( 6 ) ) bo t h e data a t the angle $ = 7 0 0 . The comparison i s q u i t e good f o r 0 <80 We be l i eve t h e pogr agreement between t h e theory an8 experiment f o r Q, 1 80 i s due pr imar i ly t o i n t e r f e r e n c e ( r e f l e c t i o n of the radiated sound) by t h e support ing yoke s t r u c t u r e
(Reca l l from t h e e a r l i e r d i scuss ion that
8
The l i f t d ipo le <p2>lift follows immediately from Eq. ( 7 ) ; here w e s u b t r a c t <p2>drag arid < p 2 > f o j from the <p2>vert data. (They are both inva r i an t to angular r o t a t i o n due to symmetry of t h e J e t exhaust.) Figure 4 shows t h a t t h e minimum of the experimental d rag d ipole data an$- the maximum o f t h e l i f t dipole data both occBr a t Cp 2 80 i n s t e a d of a t the theo- r e t i c a l angle $ = 90 . T h i s r e s u l t i s perhaps due t o r e f r ac - t i o n e f f e c t s a r i s i n g from t h e shea redo je t . l i f t d ipo le data show tha t f o r $ < 70 sound p res su re l e v e l s of t heoda ta are g r e a t e r than t h a t p red ic t ed by theory, but f o r (0 > 90 t hey are less. We be l i eve t h i s d i f f e r e n c e may be due t o r e s i d u a l convection of t h e f l u i d volume sources by t h e j e t v e l o c i t y , because the sound pressure l e v e l s would b e increased by convection e f f e c t s when t h e sources are d i r ec t ed towards the microphone and decreased when t h e y are d i r e c t e d away from t h e microphone.
I n add i t ion , t he
10
Figure 5 shows a comparison between theory and d a t a f o r the ~OOO-HZ 1/3-octave band center Freqtlency, which corre- sponds t o a ratio of acoustic wavelength t o airfoil chord of 1.65. For this caseg the agreement between theory and data i s poor. T h i s r e s u l t i s t o be expeeted from Eq. ( 3 ) which is v a l i d only f o r large r a t i o s o f wavelength t o chord,
We b e l i e v e the comparfson between theory and experiment, f o r t he sound angular d i s t r i b u t i o n , t o be s u f f i c i e n t t o present a p a r t i a l check on t h e v a l i d i t y o f Curlegs equat ion for t h e case of a surface whose dimensions are small r e l a t i v e t o the wavelength of t h e radiated sound.
11
4. THEORY OF SOUND RADIATION FROM SMALL AIRFOILS IN TURBULENT FLOW
I n t h i s s e c t i o n , w e p resent and compare wi th experiment a t h e o r e t i c a l model of t h e sound r a d i a t e d from a small two- dimensional a i r f o i l i n t u rbu len t flow. We assume t h a t v i r - t u a l l y a l l the f l u c t u a t i n g fo rces are caused by v a r i a t i o n s of angle of a t t a c k due t o upstream turbulence.
4 . 1 Theore t i ca l Model
The l i f t and drag of a small, t h i n two-dimensional a i r f o i l of chord c moving w i t h ve loc i ty V through a tu rbu len t f l u i d w i l l f l u c t u a t e because of angle-of-attack f l u c t u a t i o n s . Liepmann [211 proposed a simple a n a l y t i c a l model o f t h e mean square l i f t f l u c t u a t i o n s < L ~ > for a p p l i c a t i o n t o a i r f o i l f l u t t e r and f a t i g u e . (The mean square drag f l u c t u a t i o n s <D2> are small r e l a t i v e t o < L ~ > , hence are ignored.) Lieprnannqs model can be immediately a&.tcnr“led. t o p r e d i c t a i r f o i l sound m d i a t i o n by using Curle’s equat ion t o connect t h e t i m e de r i - va t ive o f t h e mean square l i f t <L2> t o t he radiated sound.
Liepmann assumed tha t t h e r e l a t i o n s h i p between t h e f l u c t u a t i n g angle of attack of t he a i r f o i l and t h e r e s u l t i n g l i f t i s giveii uy t h i n a i r f o i l theory. The a i r f o i l i s loca ted a t t h e o r i g i n of a coordinate system x,y,z where t h e mean flow i s V-directed along t h e p o s i t i v e x-axis. The a i r f o i l i s i n f i n i t e l y extended i n t h e y-direct ion. Within t h e frame of unsteady t h i n wing theory, t h e a i r f o i l i s replaced by a Z i f t i n g p o i n t a t the o r i g i n responding t o angle- of -a t tack f l u c t u a t i o n s i n the x-z plane. The e f f e c t of the f i n i t e a i r f o i l chord c i s absorbed i n an admittance func t ion which relates the frequency and magnitude of t h e l i f t t o t h e frequency and magnitude of t h e angle-of-attack f l u c t u a t i o n s at t h e o r i g i n .
A d e t a i l e d de r iva t ion of Liepmann’s model and i t s exten- s ion t o p red ic t sound r a d i a t i o n from small a i r f o i l s i n t u r - bulent flow i s given i n Appendix B , The o v e r a l l sound pressure r a d i a t e d a t a d i s t ance x from a small a i r f o i l t o chord c immersed i n tu rbu len t flow of i n t e n s i t y <w2>/V2 and c h a r a c t e r i s t i c eddy s c a l e L i s given from Eq. (B.17) of Appendix B as
12
where = w / L . Equation 8 shows tha t t h e o v e r a l l sound pressure radiated from small a i r fo i l s i n tu rbu len t flow i s independent of mean angle-of-attack below s t a l l e
We no te t ha t Eq. ( 8 ) diverges f o r large values o f q which corresponds t o an z i r fo i l of large chord i n small-scale turbulence. We be l i eve tha t t h e model breaks down fop large 77 because w e have neglected t o account f o r t i m e delay e f f e c t s along the a i r f o i l sur face . Since Liepmann appl ied h i s theory t o a i r f o i l b u f f e t i n g and f a t i g u e , he d i d not have t o be con- cerned about; t i m e de lay e f f e c t . I n Eq. (1) of Sec t ion 2*19 w e showed t h a t t h e sound r a d i a t e d from a small r i g i d su r face may be w r i t t e n as
1
repeated here f o r convenience. where w i s a t y p i c a l sound frequency, then , i n Eq. (11, w e may neglec t t h e t i m e d e l a y r /co, and E q . (1) s i m p l i f i e s t o
If the a i r f o i l chord c << co/w,
Thus, time delay i s important when w i s large. Large w , however3 corresponds t o small eddy sizes ( recal l that under our assumption of f rozen tu rbu len t flow--see Appendix B-- w - 2n/-c = 27rc0/L). Thus, the model is v a l i d only when t h e r a t i o of eddy s i z e L t o a i r f o i l chord c is of o r d e r un i ty o r l a r g e r e
4.2 Experimental Program
A s e r i e s of experiments were conducted i n t h e UCLA free- j e t anechoic f a c i l i t y t o v e r i f y E q , ( 8 ) * The experiments cons is ted of p lac ing a small 2-in. chord, 8-in. span, MACA 0012 s e c t i o n a i r f o i l i n the tu rbu len t mixing reg ion of t h e j e t exhaust. The l ead ing edge of t h e a i r f o i l was located 10.25 i n . downstream of t h e j e t e x i t p lane well ihko t h e i n t e n s e tu rbu len t mixing region of t he J e t exhaust . Sound pressure measurements were recorded f o r l oca l j e t c e n t e r l i n e v e l o c i t i e s of 258 f t / s e c , 393 f t / s e c , and 804 f't/sec w l t h t h e a i r f o i l o r i en ted i n t h e v e r t i c a l p o s i t i o n a t a zero angle-of- a t t a c k ( s e e Appendix A and Sec t ion 3 f o r a deSCriptiGn of t h e f a c i l i t y and t h e experimental set-up) . The measurements showed t h a t t h e radiated sound was q u i t e i n s e n s i t i v e t o
angles-of-attack changes below s t a l l which i s cons i s t en t with t h e d e r i v a t i o n o f Eq. 8. The microphone was loca ted at 4 = 90 degrees. Figure 6 shov~s 1/3-octave band sound pressure l e v e l s and o v e r a l l sound pressure l e v e l s f o r t h e three v e l o c i t i e s t e s t e d . We note that most of t h e sound energy occurs at f requencies s u f f f c i e n t l y low t o warrant using the point d ipo le model of Eq, ( 8 ) .
Measurements of the tu rbu len t i n t e n s i t y d->/V and eddy s i z e L of a subsonic c i r c t r l a r j e t by Davies et a2 [22] show t h a t i n t h e tu rbu len t mixing reg ion o f a subsonic j e t ,
cw:> i 2.25 x lO-'and L A 1 i n . vc
9 (10a ,b)
where ITc = 0.6 V i s t h e average convection ve loc i ty of t h e eddies , Using these values and assuming tha t ai2 e f f e c t i v e su r face area i s S 1 . 5 i n . by 2 i n . ( s i n c e the j e t v e l o c i t y decays i n t h e rad ia l d i r e c t f o n from 9 t s maximum value at t h e j e t a x i s ) , w e show i n F ig , 7 a comparison betweelr Eq. ( 8 ) and t h e data. Considering t h e approximations made, t h e com- par i son is reasonably good,
The good agreement ,.bekween ..tlW? theor.eW,Xa-l. mode2 ',an&: t h e experimental data s u p p o r t s t h e idei;lo of Sharland [7 ] and Siddon [81 tha t f o r a i r f o i l s i n h igh ly tu rbu len t flow, most of the r a d i a t e d noise i s generated by t h e t ime-derivat ive of the f l u c t u a t i n g l i f t induced by t he tu rbu len t flow.
14
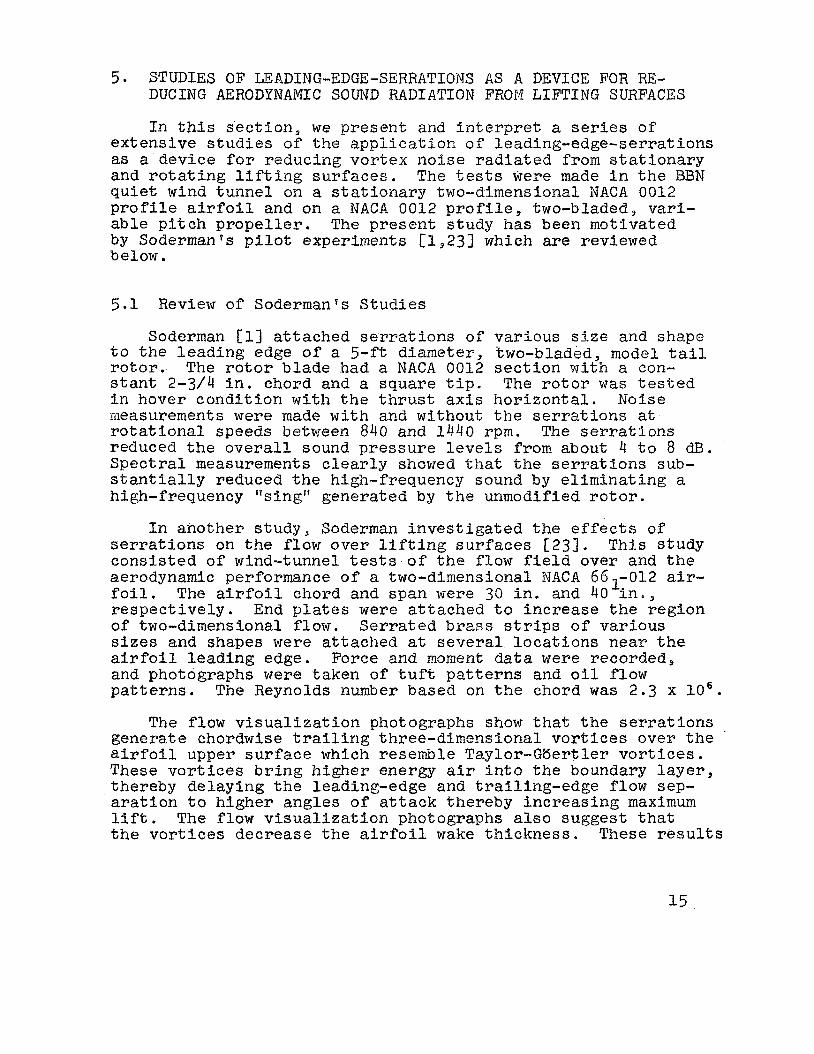
5. STUDIES OF LEADING-EDGE-SERRATIONS A S A DEVICE FOR RI3- DUCING AERODYNAMIC SOUND R A D I A T I O N FROM LIFTING SURFACES
I n t h i s s e c t i o n , w e p resent and i n t e r p r e t a series of ex tens ive s t u d i e s of t h e a p p l i c a t i o n o f leading-edge-serrations as a device f o r reducing vor tex noise r a d i a t e d from s t a t i o n a r y and r o t a t i n g l i f t i n g su r faces . The tes ts were made i n t h e BBN q u i e t wind tunne l on a s t a t i o n a r y two-dimensional HACA 0012 p r o f i l e a i r f o i l and on a NACA 0012 p r o f i l e , two-bladed, var i - able p i t c h p r o p e l l e r . The present study has been motivated by Soderrnan's p i l o t experiments [l,23] which are reviewed below.
5 .1 Review of Soderman's S tudies
Soderman [l] attached s e r r a t i o n s of var ious s i z e and shape t o the l ead ing edge of a 5-f t diameter, two-bladed, model t a i l r o t o r . The r o t o r blade had a NACA 0012 s e c t i o n w i t h a con- s t a n t 2-3/4 i n . chord and a square t i p . The r o t o r was tes ted i n hover condi t ion w i t h t h e t h r u s t axis ho r i zon ta l . Noise measurements were made with and without t h e s e r r a t i o n s at r o t a t i o n a l speeds between 840 and 1440 rpm. The s e r r a t i o n s reduced t h e o v e r a l l sound p res su re l e v e l s from about 4 t o 8 d3. S p e c t r a l measurements c l e a r l y showed t h a t t h e s e r r a t i o n s sub- s t a n t i a l l y reduced the high-frequency sound by e l imina t ing a high-frequency rrsingl ' generated by t h e unmodified r o t o r .
I n another s tudy, Soderman i n v e s t i g a t e d t h e e f f e c t s of s e r r a t i o n s on the flow over L i f t i n g surfaces [23]. T h i s study cons is ted of wind-tunnel tests of' t h e flow f i e l d over and t h e aerodynamic performance of a two-dimensional NACA 661-012 air- f o i l . The a i r f o i l chord and span were 30 i n . and 40 i n . , r e spec t ive ly . End plates were a t t ached t o inc rease the region of two-dimensional flow. S e r r a t e d brass strips of var ious s i z e s and shapes were a t tached a t s e v e r a l l o c a t i o n s near t h e a i r f o i l l ead ing edge. Force and moment data were recorded, and photographs were taken of t u f t p a t t e r n s and o i l flow p a t t e r n s . The Reynolds number based on t h e chord was 2 . 3 x lo6.
The flow v i s u a l i z a t i o n photographs show t h a t t h e s e r r a t i o n s generate chordwise t r a i l i n g three-dimensional v o r t i c e s over t he a i r f o i l upper su r face which resemble Taylor-gdert ler v o r t i c e s . These v o r t i c e s b r i n g higher energy a i r i n t o the boundary layer , thereby delaying t h e leading-edge and t ra i l ing-edge flow sep- a r a t i o n t o higher angles of a t t a c k thereby inc reas ing maximum l i f t . The flow v i s u a l i z a t i o n photographs a l s o suggest tha t t h e v o r t i c e s decrease t h e a i r f o i l wake th ickness . These r e s u l t s
s t rong ly suggest t h n t t h e v o r t i c e s p l a y an important r o l e i n t h e rotor noise reduct ions achieved w i t h t h e s e r r a t i o n s , Meas- urements show that t h e maximum l i f t i s q u i t e s e n s i t i v e to ser- r a t i o n s i z e and p o s i t i o n on t h e a i r f o i l and spacing between s e r r a t i o n s .
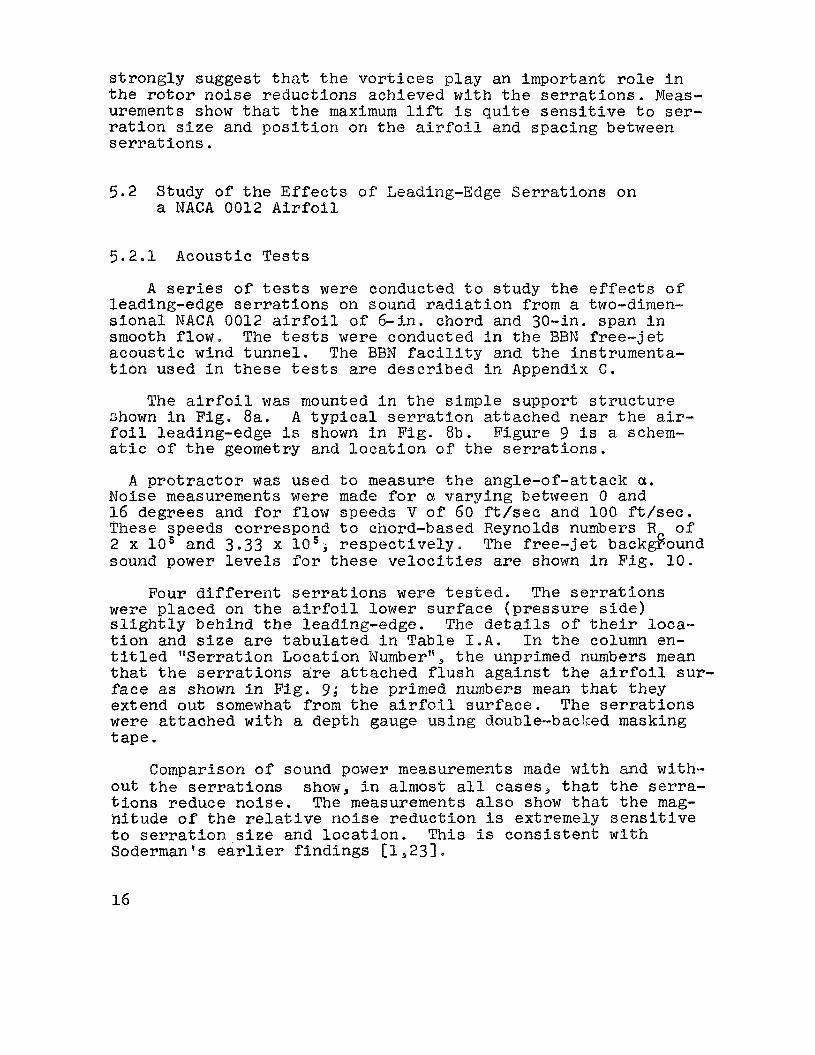
5 .2 Study of the E f f e c t s o f Leading-Edge S e r r a t i o n s on a NACA 0012 A i r f o i l
5.2.1 Acoustic Tests
A s e r i e s of tes ts were conducted to study t h e e f f e c t s of leading-edge s e r r a t i o n s on sound r a d i a t i o n from a two-dimen- s i o n a l NACA 0012 a i r f o f l of 6-in. chord and 30-in. span i n smooth flow. The tes ts were conducted i n t h e 3BN f r e e - j e t acous t i c wind tunnel . The BBN f a c i l i t y and the instrumenta- t i o n used i n these tes t s are descr ibed i n Appendix C,
The a i r f o i l was mounted i n t h e s i m p l e support s t r u c t u r e shown i n Fig. 8a. A t y p i c a l s e r r a t i o n a t tached near t h e a i r - f o i l leading-edge i s shown i n Fig. 8b. Figure 9 i s a schem- a t i c of t h e geometry and l o c a t i o n of' t h e s e r r a t i o n s .
A p r o t r a c t o r was used t o measure t h e angle-of-attack a. Noise measurements were made for a varying between 0 and 16 degrees and f o r flow speeds V of 60 f t / s e c and 1 0 0 f t / s e c . These speeds correspond t o chord-based Reynolds numbers Rc of 2 x lo5 and 3.33 x 10sj r e s p e c t i v e l y . The f r e e - j e t background sound power l e v e l s f o r t h e s e v e l o c i t i e s are shown i n Fig. 10.
Four d i f f e r e n t s e r r a t i o n s were tested. The s e r r a t i o n s were placed on t h e a i r f o i l lower su r face (p re s su re s i d e ) s l i g h t l y behind t h e leading-edge. The details of t h e i r loca- t i o n and s i z e are t a b u l a t e d i n T a b l e I . A . I n the column en- t i t l e d "Ser ra t ion Location Number" > t he unprimed numbers mean t h a t t h e s e r r a t i o n s are a t t ached f l u s h aga ins t t h e a i r f o i l sur- f a c e its shown i n Fig. 9; t h e primed numbers mean that they extend out somewhat from t h e a i r f o i l su r f ace . The s e r r a t i o n s were a t tached w i t h a depth gauge using double-backed masking t ape .
Comparison of sound power measurements made wi th and wi th- Out t h e s e r r a t i o n s show, i n almost a l l ca sesg tha t the serra- t i o n s reduce noise . The measurements a l s o show t h a t t h e mag- i-iitude of t h e r e l a t i v e no i se reduct ion i s extremely s e n s i t i v e t o s e r r a t i o n s i z e and l o c a t i o n . This i s cons i s t en t w i t h Sodermanss e a r l i e r f ind ings [1,23].
16
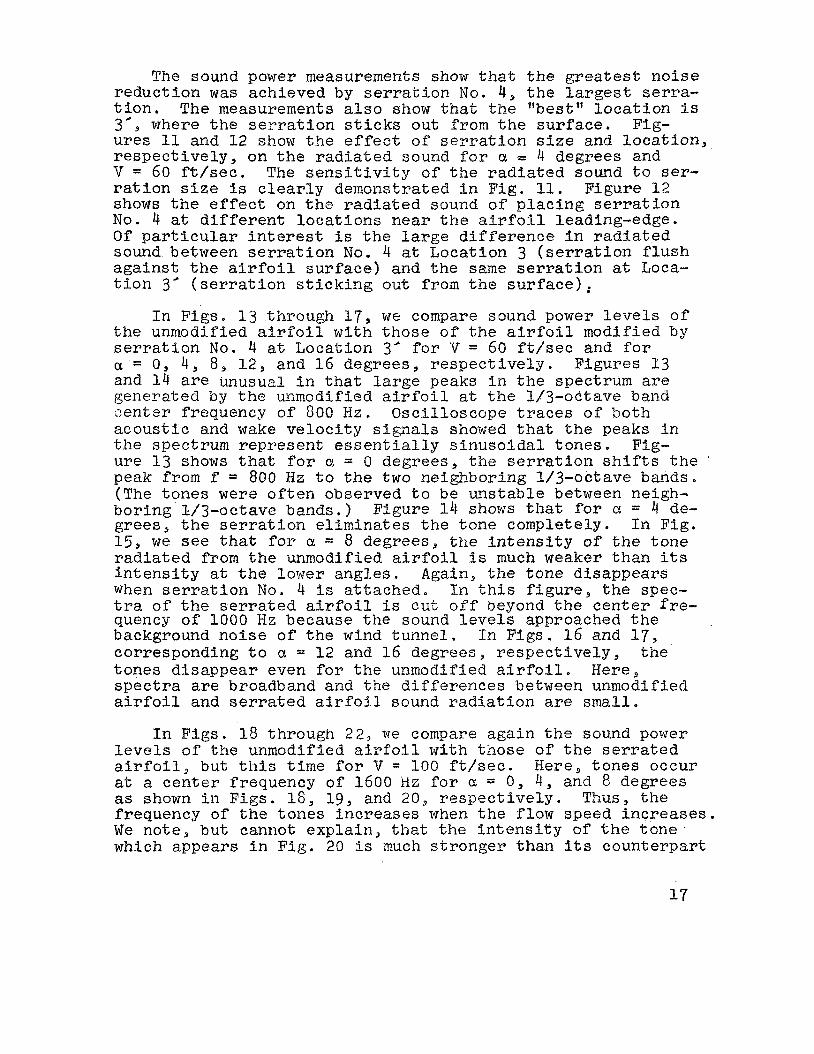
The sound power measurements show t h a t t h e greatest no i se reduct ion was achieved by ser ra t io l? No. 4, t h e l a r g e s t serra- t i o n . The measurements a l s o show that the "best" l o c a t i o n i s 3., where t h e s e r r a t i o n s t i c k s out from the su r face . Fig- ures 11 and 1 2 show t h e e f f e c t o f s e r r a t i o n size and Location, r e spec t ive ly , on t h e radiated sound f o r a '= 4 degrees and V = 60 f t / s e c . The s e n s i t i v i t y of t he r a d i a t e d sound t o ser- r a t i o n s i z e i s c l e a r l y demonstrated i n Fig. 11. Figure 1 2 shows the e f f e c t on t h e r a d i a t e d sound of p l ac ing s e r r a t i o n No. 4 at d i f f e r e n t Locations near t h e a i r f o i l leading-edge. Of p a r t i c u l a r i n t e r e s t i s the large d i f f e r e n c e i n radiated sound between s e r r a t i o n No. 4 a t Location 3 ( s e r r a t i o n f l u s h aga ins t t he a i r f o i l su r f ace ) and t h e same s e r r a t i o n a t Loca- t i o n 3' ( s e r r a t i o n s t i c k i n g out from t h e s u r f a c e ) ,
I n F igs . 1 3 through 17, we compare sound power l e v e l s of t h e Unmodified a i r f o i l w i t h t hose of the a i r f o i l modified b y s e r r a t i o n No. 4 a t Location 3' f o r V = 60 St/sec and f o r a = 0, 4, 8, 1 2 , and 1 6 degrees, r e spec t ive ly . Figures 13 and 1 4 a r e unusual i n t ha t large peaks i n t h e spectrum a r e generated by t h e unmodified a i r f o i l a t t h e 1/3-octave band zenter frequency of 800 Hz. Oscil loscope t r a c e s o f 30th acous t i c and wake ve loc i ty s i g n a l s showed tha t t h e peaks i n the spectrum represent e s s e n t i a l l y s i n u s o i d a l tones. Fig- ure 13 shows t h a t f o r a = 0 degrees, the s e r r a t i o n sh i f t s t h e peak from f = 800 Hz t o t h e two neighboring 1/3-octave bands, (The tones were o f t e n observed t o be uns tab le between neigh- boring L/3-octave bands.) Figure 1 4 shows that fo r a = 4 de- grees, t h e s e r r a t i o n e l imina tes t h e tone completely. I n F ig . 15, we s e e t h a t for a = 8 degrees, t h e i n t e n s i t y of t h e tone radiated from t h e unmodified a i r f o i l I s much weaker than i t s i n t e n s i t y a t t h e lower angles . Again, t h e tone disappears When s e r r a t i o n No. 4 i s a t tached . I n t h i s f i g u r e , t h e spec- t r a of the s e r r a t e d a i r f o i l i s c u t o f f beyond t h e c e n t e r fre- quency of 1000 Hz because t h e sound l e v e l s approached t h e background no i se o f t h e wind tunne l , I n Figs. 1 6 and 17, corresponding t o a = 1 2 and 1 6 degrees, r e spec t ive ly , t h e tones disappear even f o r t h e unmodified a i r f o i l , Here, s p e c t r a are broadband and t h e d i f f e rences between unmodified a i r f o i l and serrated a i r f o i l sound r a d i a t i o n a r e small.
I n F igs . 1 8 through 2 2 , we compare again t h e sound power l e v e l s of t h e unmodified a i r f o i l with those of t h e serrated a i r f o i l , but this t i m e f o r V = 100 f t / s e c . Here, tones occur at a cen te r frequency o f 1600 dz f o r a = 0, 4 , and 8 degrees as shown i n F igs . 1 8 , 19, and 20, r e spec t ive ly . Thus, t h e frequency of the tones increases when t h e flow speed inc reases . We note , b u t cannot expla in , t h a t t h e i n t e n s i t y of t h e t c n e . which appears i n Fig, 20 Ps much s t ronge r than i t s counterpar t
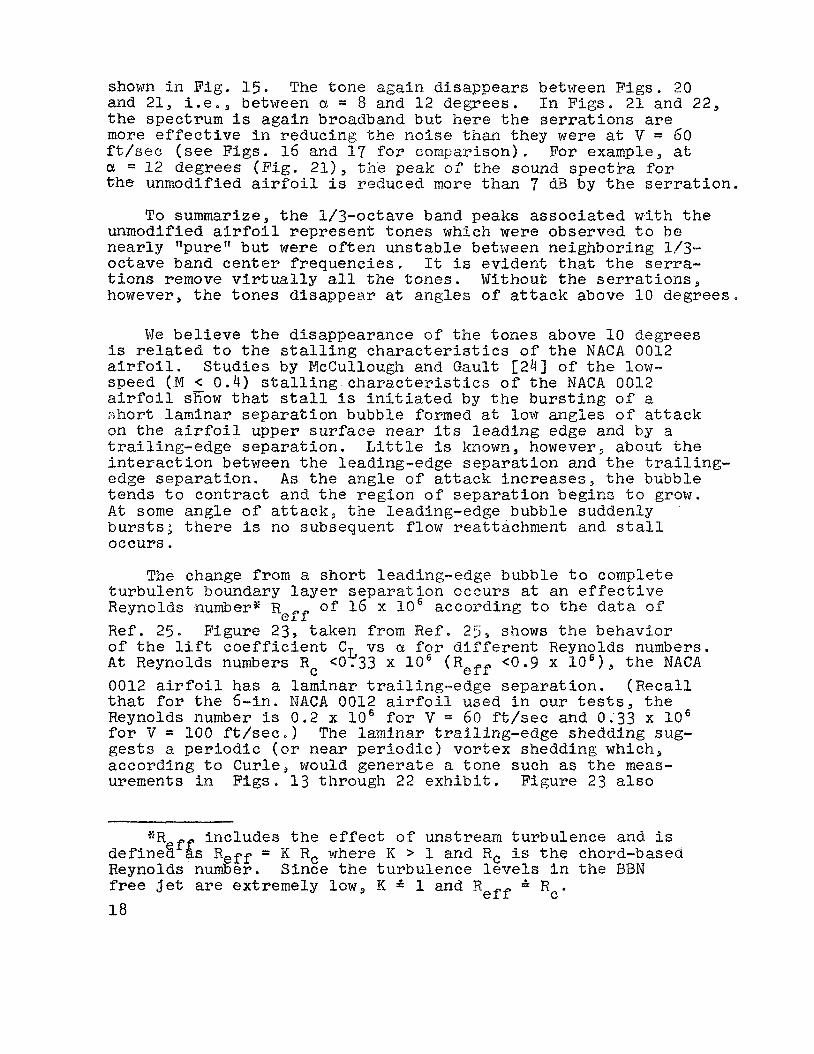
shown i n Fig. 1 5 . The tone aga in disappears between Figs . 20 and 21, i . e e , between a = 8 and 1 2 degrees. I n F igs . 2 1 and 22, the spectrum i s aga in broadband but here t h e s e r r a t i o n s are more e f f e c t i v e i n reducing t h e no i se t i i m they were a t V = 60 f t / sec (see Figs . 1 6 and 17 f o r comparison). For example, a t a = 1 2 degrees (F ig . 23.1, t h e peak of the sound s p e c t r a f o r t h e unmodified a i r f o i l i s reduced more than 3 d B by t h e s e r r a t i o n .
To summarize, t h e 1/3-octave band peaks a s soc ia t ed w i t h t h e unmodified a i r f o i l r ep resen t t ones which were observed t o b e near ly "purerr bu t were o f t e n uns tab le between neighboring 1/3- octave band c e n t e r f requencies . It i s evident t ha t the serra- t i o n s remove v i r t u a l l y all t h e tones. Without t h e s e r r a t i o n s , however, the tones disappear a t angles o f a t t a c k above LO degrees ,
We b e l i e v e t h e disappearance of t h e tones above 1 0 degrees is related t o t h e s t a l l f n g c h a r a c t e r i s t i c s o f t h e NACA 0012 a i r f o i l . S tud ie s by McCullough and Gault [ 2 4 J of t h e low- speed (M < 0.41 s t a l l i n g c h a r a c t e r i s t i c s o f t he NACA 0012 a i r f o i l sEow t h a t s t a l l i s i n i t i a t e d by t h e b u r s t i n g o f a sho r t laminar s epa ra t ion bubble formed a t low angles o f a t t a c k on the a i r f o i l upper s u r f a c e nea r its l ead ing edge and by a t r a i l i ng -edge sepa ra t ion . L i t t l e i s known, however, about t h e i n t e r a c t i on between the leading-edge sepa ra t ion and the t r a i l i n g - edge sepa ra t ion . A s t he angle of a t t a c k inc reases , t h e bubble tends t o con t r ac t and t h e r eg ion o f s epa ra t ion begins t o grow. A t some angle o f a t t a c k , t h e leading-edge bubble suddenly b u r s t s ; t he re is no subsequent flow reattachment and s t a l l occurs .
The change from a s h o r t leadfng-edge bubble t o complete t u r b u l e n t boundary l aye r sepa ra t ion occurs at an e f f e c t i v e Reynolds number% Reff of 16 x lo6 according t o the data of R e f . 2 5 . Figure 23, taken from R e f . 25 , shows t h e behavior of t h e l ift c o e f f i c i e n t CL vs a f o r d i f f e r e n t Reynolds iiumbers. At Reynolds numbers Rc C0.33 x 106 ( R e f f C O . 9 x IO6), the NACA 0012 a i r f o i l has a laminar t r a i l i ng -edge sepa ra t ion . (Reca l l t h a t f o r t h e 6-in. NACA 0012 a i r f o i l used i n our tests, t h e Reynolds number i s 0 . 2 x lo6 f o r V = 6 0 f t / s e c and 0.33 x lo6 f o r V = 100 f t / s e c . ) The laminar t r a i l i ng -edge shedding sug- gests a pe r iod ic ( o r near pe r iod ic ) vor tex shedding which, according t o Curleg would genera te a tone such as t h e meas- urements i n F igs . 1 3 through 22 e x h i b i t . Figure 23 a l s o
%R inc ludes t h e e f fec t of unstream turbulence and i s ff def ine8 as R e f f = K Re where K > 1 and Rc i s the chord-based Reynolds number. Since t h e turbulence l e v e l s i n t h e BBN
18 free j e t are extremely l o w , K 1 and R e f f Rc .
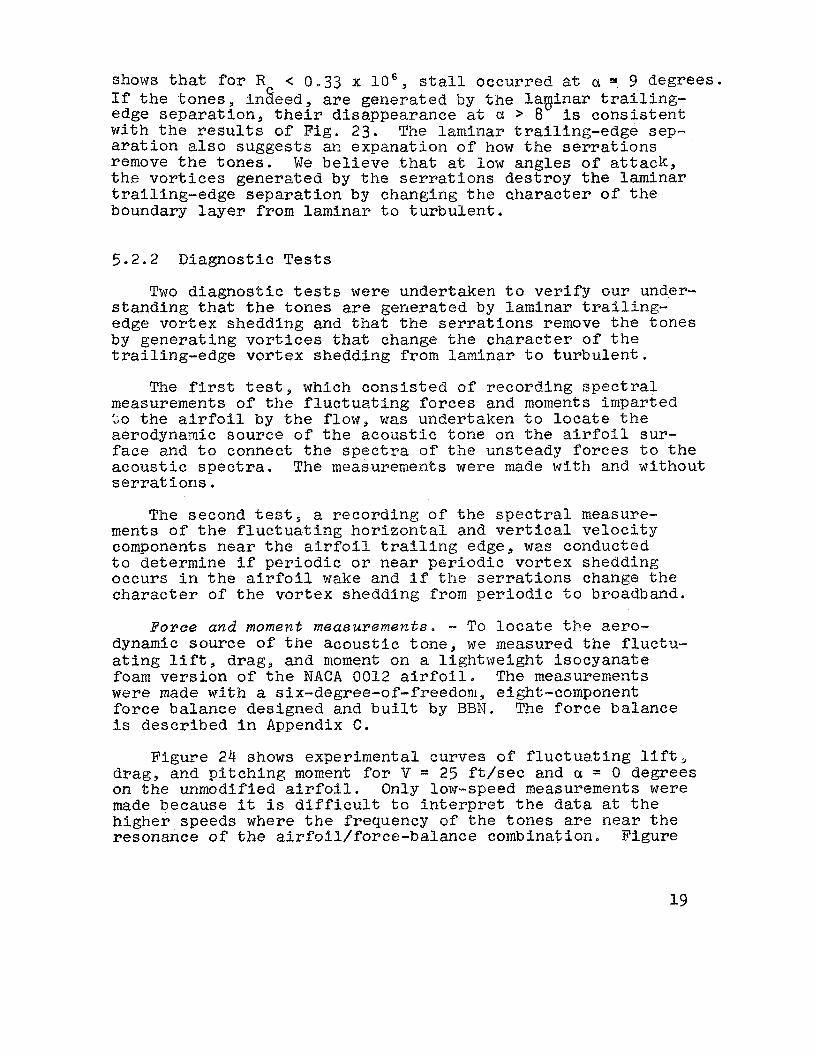
shows t h a t f o r R < 0.33 x lo6 s t a l l occurred a t a s 9 degrees. If the tones inseed , are generated by the lapJinar t r a i l i n g - edge sepa ra t ion , t h e i r disappearance a t a > 8 i s cons i s t en t w i t h t h e r e s u l t s of Fig. 23. The laminar t r a i l i ng -edge sep- a r a t i o n also suggests an expanation o f how t h e s e r r a t i o n s remove the tones . Me b e l i e v e that at low angles of a t t a c k , t h e v o r t i c e s generated by the s e r r a t i o n s des t roy the laminar t ra i l ing-edge sepa ra t ion by changing t h e cha rac t e r of t h e boundary layer from laminar t o tu rbu len t .
5.2.2 Diagnostic Tests
Two d iagnos t i c t es t s were undertaken t o v e r i f y our under- s tanding that t he tones a r e generated by laminar t r a i l i n g - edge vor tex shedding and tha t t h e s e r r a t i o n s remove t h e tones by genera t ing v o r t i c e s t h a t change t h e c h a r a c t e r of t h e t r a i l i ng -edge vor tex shedding from laminar t o t u r b u l e n t .
The f irst t e s t , which cons is ted of recording s p e c t r a l measurements of t h e f l u c t u a t i n g fo rces and moments imparted >o the a i r f o i l by t he flow, was undertaken t o l o c a t e t h e aerodynamic source of t h e acous t i c lone on the a i r f o i l sur- f ace and t o connect the s p e c t r a of t h e unsteady fo rces t o t h e acous t i c s p e c t r a . The measurements were made w i t h and without s e r r a t i o n s .
The second t e s t , a recording of t h e s p e c t r a l measure- ments of t h e f l u c t u a t i n g h o r i z o n t a l and v e r t i c a l ve loc i ty components near t he a i r f o f l t r a i l i n g edge, was conducted t o determine i f pe r iod ic o r near pe r iod ic vortex shedding Q C C U ~ S i n t h e a i r f o i l wake and if t h e s e r r a t i o n s change t h e cha rac t e r of the vor tex shedding from pe r iod ic t o broadband.
Force and moment measurements, - To l o c a t e the aero- dynamic source of t he acous t i c tone , w e measured t h e f luc tu - a t i n g l i f t , drag, and moment on a l ightweight isocyanate foam vers ion of t h e NACA 0012 a i r f o i l . The measurements were made w i t h a six-degree-of-freedom, eight-component force balance designed and b u i l t by BBM. The fo rce balance i s descr ibed i n Appendix C.
Figure 24 shows experimental curves of f l u c t u a t i n g l i f t drag, and p i t ch ing moment f o r V = 25 f t l s e c and 01 = 0 degrees on the unmodified a i r f o i l . Only low-speed measurements were made because i t i s d i f f i c u l t t o i n t e r p r e t t h e data a t the h igher speeds where t h e frequency of t h e tones a r e near t h e resonance of the a i r fo i l / fo rce -ba lance combination, Figure
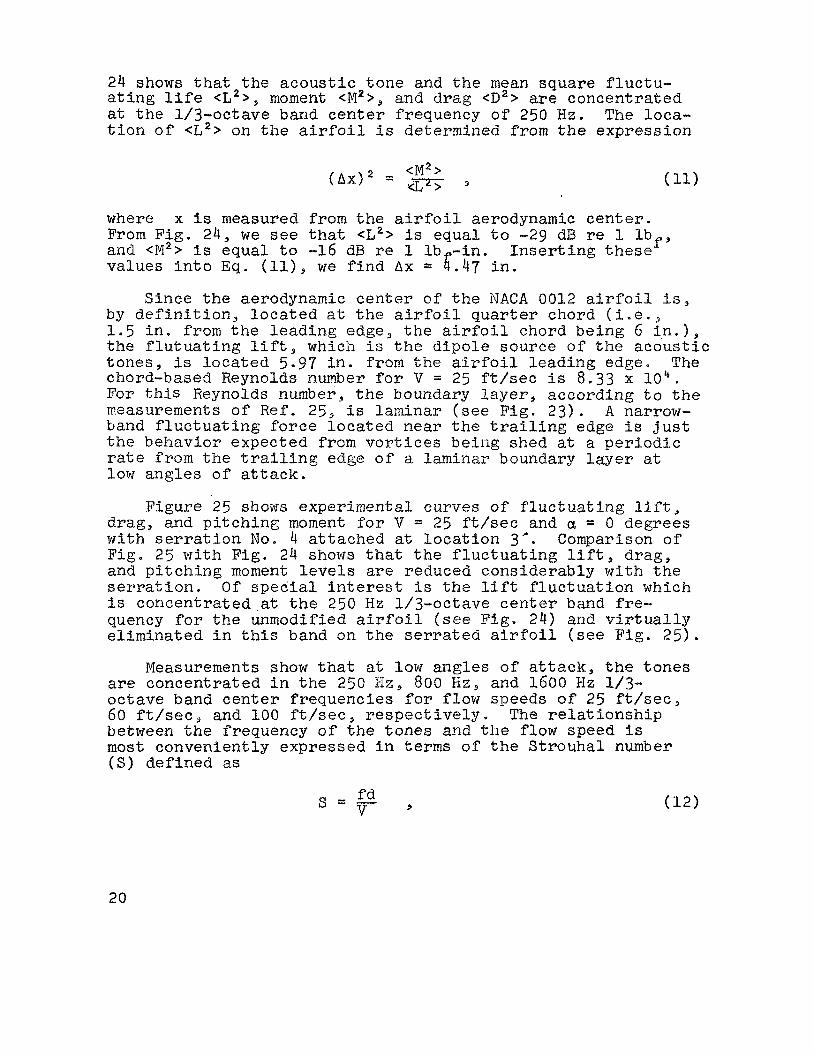
24 shows t h a t t h e acous t i c tone and t h e mean square f l u c t u - a t i n g l i f e <L2>> moment <M2>s and drag <D2> a r e concentrated at t h e 1/3-octave band cen te r frequency of 250 Hz. The loca- t i o n o f <L2> on t h e a i r f o i l i s determined from t h e expression
where x i s measured from the a i r f o i l aerodynamic c e n t e r . From Fig . 24 , we see t h a t <L2r i s equal t o -29 dB r e 1 l b f 9 and <M2> i s equal t o -16 dB re 1 l b - in . I n s e r t i n g these values i n t o E q . (ll), we f i n d Ax = 5.47 i n .
Since the aerodynamic c e n t e r o f the NACA 0012 a i r f o i l i s , by d e f i n i t i o n , l oca t ed at t h e a i r f o i l quarter chord ( i * e . . > 1 . 5 i n . from t h e l ead ing edge, t h e a i r f o i l chord being 6 i n . ) , t h e f l u t u a t i n g l i f t , which i s t h e d ipole source of the acous t i c tones , i s loca ted 5.97 i n . from t h e a i r f o i l l ead ing edge. The chord-based Reynolds number f o r V = 25 f t / s e c i s 8.33 x 10‘. For t h i s Reynolds number, t h e boundary layer, according t o the t-teasurements of‘ Ref. 25, i s laminar (see Fig. 2 3 ) A narrow- band f l u c t u a t i n g force loca ted near t h e t r a i l i n g edge is j u s t t h e behavior expected from v o r t i c e s being shed a t a pe r iod ic ra te from t h e t r a i l i n g edge o f a laminar boundary layer a t low angles of a t t a c k .
Figure 25 shows experimental curves of f l u c t u a t i n g lift drag, and p i t ch ing moment f o r V = 25 f t / s e c and a = 0 degrees w i t h s e r r a t i o n No. 4 a t tached at l o c a t i o n 3 ” . Comparison of F ig . 2 5 w i t h F i g . 24 shows tha t t h e f l u c t u a t i n g l i f t , drag, and p i t ch ing moment l e v e l s a r e reduced considerably w i t h t h e s e r r a % i o n , O f s p e c i a l i n t e r e s t i s t h e l i f t f l u c t u a t i o n which i s concentrated at t h e 250 Hz 1/3-octave c e n t e r band fre- quency f o r t h e unmodified a i r f o i l ( s e e Fig. 2 4 ) and v i r t u a l l y e l imina ted i n t h i s band on t h e serratea a i r f o i l ( s e e Pig. 2 5 ) .
Measurements show t ha t a t low angles of a t t a c k , t h e tones a r e concentrated i n t h e 250 H z , 800 Hz, and 1600 Hz 1/3- octave band c e n t e r f requencies f o r flow speeds o f 25 f t / s e c , 60 f t / s e c , and 100 f t / s e c , r e spec t ive ly . The r e l a t i o n s h i p between the frequency of the tones and the flow speed i s most conveniently expressed i n terms of the Strouhal number (S ) defined a s
9 s = - f d
v
20
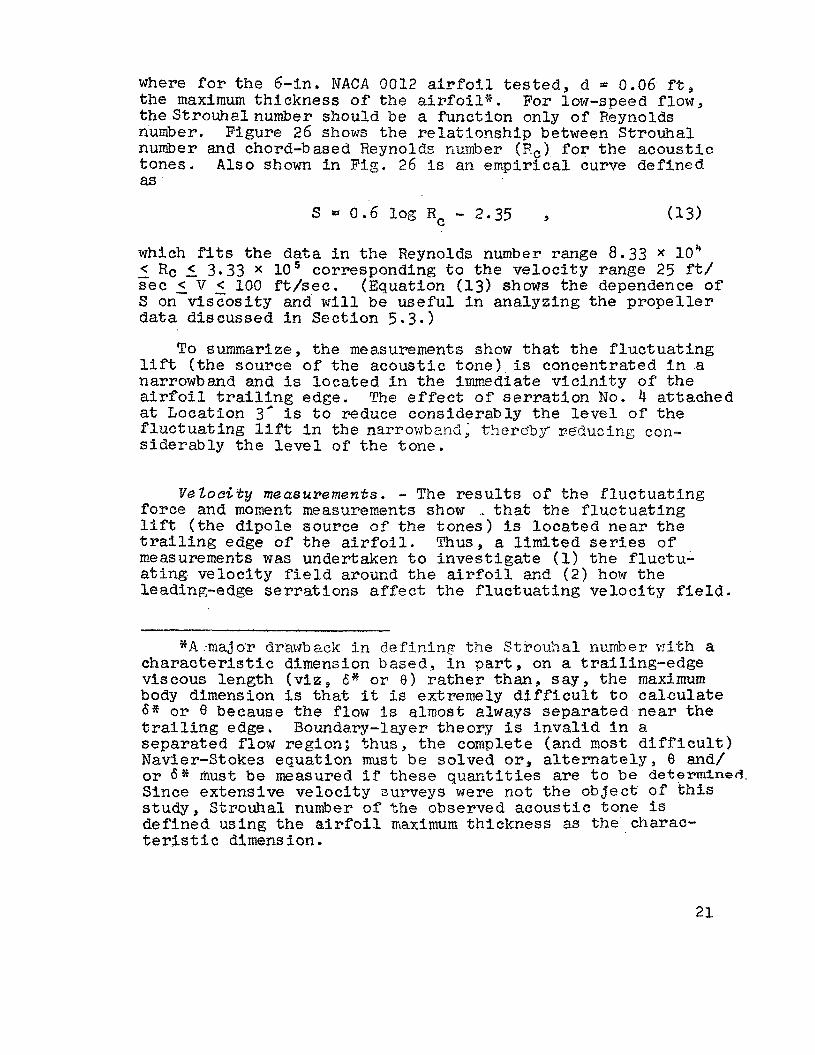
where for the &in . WACA 0012 airPo3.1 tested, d = 0.06 f t , the maximum th ickness o f t h e a i r f o i l * . For low-speed flow, the Strouhal number should be a funct ion only of Reynolds number. Figure 26 shows t h e r e l a t i o n s h i p between St rouhal nurnber and chord-based Reynolds number (R,) f o r t h e acous t i c tones . Also shown i n F i g . 26 i s an empirical curve def ined as
which f i t s the data in the Reynolds number range 8.33 x lo4 ”..- < Rc 5 3 . 3 3 X l o 5 corresponding t o t h e ve loc i ty range 25 f t / see < V < 100 f t l s e c . (Equation ( 1 3 ) shows the dependence of S on-viscosity and w i l l be useful i n analyzing the p r o p e l l e r data discussed i n Sec t ion 5.3.)
To summarize, the measurements show tha t the f l u c t u a t i n g l i f t ( t he source of the acous t i c t one ) i s concentrated i n a narrowband and is loca ted i n t h e immediate v i c l n i t y of the a i r f o i l t r a i l i n g edge. The e f f e c t of s e r r a t i o n No. 4 a t tached at Location 3a is t o reduce considerably the l e v e l of the f l u c t u a t i n g l i f t i n t h e narrowbend, Wierebg reducing con- s i d e r a b l y t h e l e v e l of t h e tone .
Ve Zoccty measurements. - The r e s u l t s of t h e f l u c t u a t i n g force and moment measurements show . t ha t the f l u c t u a t i n g lift ( the d ipole source of the tones) i s loca ted nea r the t r a i l i n g edge of the a i r f o i l . Thus, a l i m i t e d ser-ies of measurements was undertaken t o i n v e s t i g a t e (1) the f l u c t u - a t i n g velocf ty f i e l d around the a i r f o i l ar,d ( 2 ) how t h e leading-edge s e r r a t i o n s a f f e c t t he f l u c t u a t i n g ve loc i ty f i e l d .
S A .major drawback i n d e f i n i n p t h e S t roul ia l number v i t h a c h a r a c t e r i s t i c dimension based, i n part, on a t ra i l ing-edge viscous length ( v f z , & @ o r 8 ) rather than , s ay , t h e maximum body dimension i s t h a t i t i s extremely d i f f i c u l t t o c a l c u l a t e 6 % or e because the flow is almost rtlways separated nea r the t r a i l i n g edge. Boundary-layer theory i s i n v a l i d i n a separa ted flow region; thus, t he complete (and most d i f f i c u l t ) Navier-Stokes equat ion must be solved or , a l t e r n a t e l y , 8 and/ or 6% must be measured if these quaritities are to be determined. SSnce extensive ve loc i ty surveys were not t h e o b j e c t of t h i s s tudy , Strouhal number of the observed acoustic tone I S def ined using the airfoil naximum thickness as the charac- t e r i s t i c dimension.
21
Veloci ty f l u c t u a t i o n s , i n t h e 1/3-octave band c e n t e r frequency of 800 Hz corresponding t o t h e a c o u s t i c t one f o r V = 60 f t / s e c , were measured a t var ious loca t ions near t h e a i r f o i l s u r f a c e us ing a s i n g l e 0.00025-in. diameter hot- w i r e probe a t t ached to a t r a v e r s i n g mechanism. Only near t h e t r a i l i n g edge and i n the wake were s t r o n g v e l o c i t y f l u c t u a t i o n s observed. The small f l u c t u a t i o n s (on t h e o rde r of 0.001 V ) , which were observed fa r from t h e a i r f o i l sur- face, seem t o r ep resen t weak c i r c u l a t i o n f l u c t u a t i o n s induced by t h e wake.
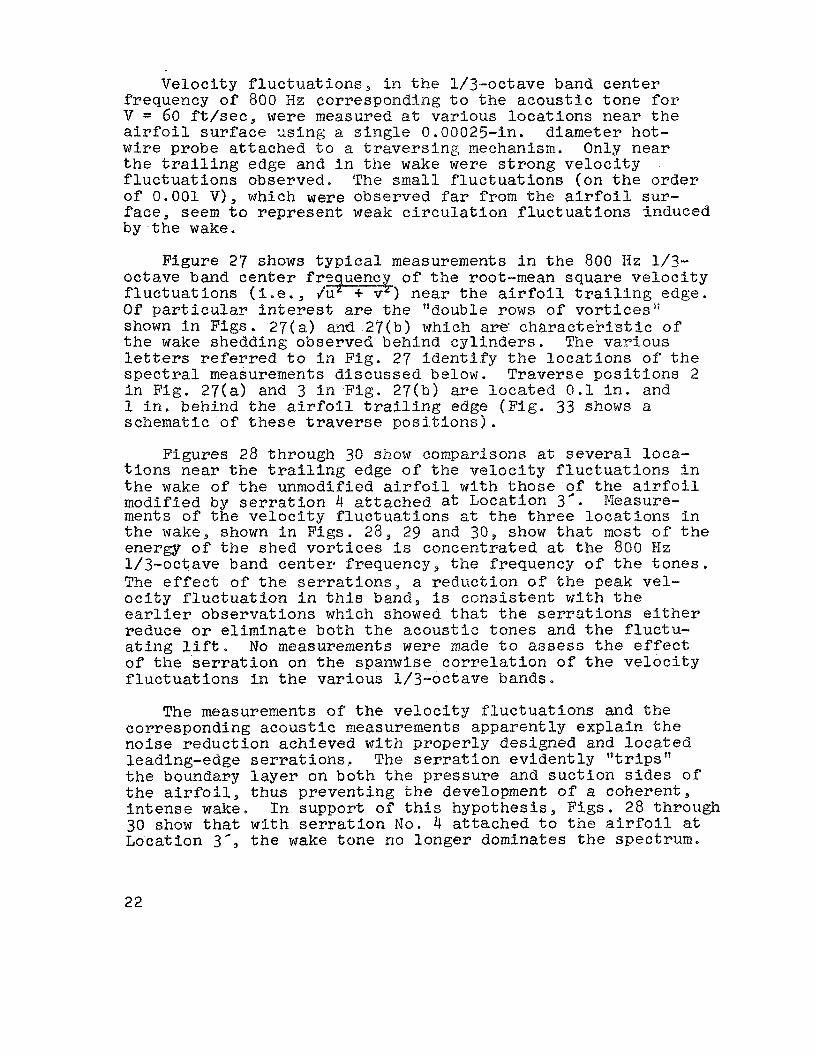
Figure 27 shows t y p i c a l measurements i n the 800 Hz 1/3- octave band c e n t e r frequency of t h e root-mean square v e l o c i t y f l u c t u a t i o n s (ice.> d'u' + v') nea r t h e a i r f o i l t r a i l i n g edge. O f p a r t i c u l a r i n t e r e s t are the "double rows o f vor t ices ' ; shown i n Figs . 2 7 ( a ) and 2?(b) which are' c h a r a c t e r i s t i c of the wake shedding observed behind cy l inde r s . T'ne vax-ious le t ters referred t o i n Fig. 27 i d e n t i f y t h e l o c a t i o n s of t he s p e c t r a l measurements d i scussed below. Traverse p o s i t i o n s 2 i n Fig. 2 7 ( a ) and 3 i n Ffg. 27(b) are loca ted 0 . 1 i n . and 1 i n . behind t h e a i r f o i l t r a i l i n g edge (F ig . 3 3 shows a schematic of these t r a v e r s e p o s i t i o n s ) .
Figures 28 through 30 show cornparisolrs a t s e v e r a l loca- t i o n s near t h e t r a i l i n g edge o f t h e v e l o c i t y f l u c t u a t i o n s i n t h e wake of t h e unmodified a i r f o i l w i t h t hose of the a i r f o i l modified by s e r r a t i o n 4 attached a t Location 3 " . ments of t h e v e l o c i t y f l u c t u a t i o n s at the three l o c a t i o n s i n t h e wake, shown i n F igs . 28, 29 and 3 0 , show tha t most of t h e energy of t h e shed v o r t i c e s i s concentrated a t t h e 800 Hz 1/3-octave band c e n t e r frequency, t h e frequency of t h e tones . The e f f e c t of t h e s e r r a t i o n s , a reduct ion o f t h e peak vel- o c i t y f l u c t u a t i o n i n t h l s band, i s ccnsis tef i t w i t h t h e ear l ie r observa t ions which showed that t h e s e r r a t i o n s e i t h e r reduce o r e l imina te both t h e a c o u s t i c tones and t h e f luc tu - a t i n g l i f t * No measurements were made t o assess the e f f e c t of t h e s e r r a t i o n on t h e spanwise c o r r e l a t i o n of t h e v e l o c i t y f l u c t u a t i o n s i n the var ious 1/3-octave bands
p'kasure-
The measurements of" t h e v e l o c i t y f l u c t u a t i o n s and t h e corresponding acous t i c measurements apparent ly exp la in t h e noise reduct ion achieved w i t h p roper ly designed and loca ted leading-edge s e r r a t i o n s , The s e r r a t i o n ev iden t ly " t r i p s " the boundary layer on both t h e pressure and suc t ion s ides o f t h e a i r f o i l , t hus prevent ing t h e development of a coherent i n t e n s e wake, I n support of t h i s hypothesis , F igs . 28 through 30 show that wi th s e r r a t i o n No. 4 a t t ached t o t h e a i r f o i l at Location 3 * , t h e wake tone no longer dominates t h e spectrum.
22
5.2.3 S t e a d y - S t a t e Aerodynamic Performance T e s t s
A series of tests were conducted t o determine t h e e f f e c t s of s e r r a t i o n s on the steady-state aerodynamic performance o f the a i r f o i l . The t e s t s were conductedt with and without the "best9' s e r r a t i o n (No. 4 a t Location 3') and cons is ted of (1) measurements of t h e s t eady- s t a t e l i f t and drag, ( 2 ) steady- s ta te ve loc i ty surveys a t s e l e c t e d l o c a t i o n s on t h e a i r f o i l upper su r face and i n t h e vake, and ( 3 ) flow v i s u a l i z a t i o n photographs of t h e a i r f o i l upper sur face .
L i f t and drag measurements. - Mean l i f t and drag d a t a were obtained t o i n v e s t i g a t e t h e e f f e c t s of s e r r a t i o n s on a i r f o i l performance. To increase t h e reg ion of two-dimensional flow, end plates were a t tached t o t h e a i r f o i l a t both ends. The flow was found t o be two-dimensional only a t low angles of a t t a c k ; at high angles of a t t a c k , t h e f l o w was observed t o b e s t i l l three-dimensional. No s i g n i f i c a n t Smprovements i n aerodynamic performance ( v i z , CL vs a, CD vs 01, e t c . ) were observed by a t t a c h i n g t h e s e r r a t i o n s . s l i g h t l y extended by a t t a c h i n g s e r r a t i o n 4 a Location 3 @ , but only by 1-2%. Simi la r ly , the drag was reduced but only
The C k vs a curve was
by 1-5$.
If t h e s e r r a t i o n s do indeed remove t h e tones ba changing t h e cha rac t e r of the boundary l a y e r from laminar tcj t u r b u l e n t , then any device which c r e a t e s a tu rbu len t f i e l d should a l so remove t h e tones . Therefore, w e placed a 0.09-in. dismeter t r i p w i r e a t s e v e r a l l oca t ions on t h e a i r f o i l . A s expected, a t t a c h i n g t h e t r i p w i r e reduced o r removed t h e a i r f o i l :one, However, t h e t r i p wires had a de t r imen ta l e f f e c t upon aepody- namic lift w i t h stall of t en occurr ing abrupt ly . Figure 31 shows the e f f e c t of a s i n g l e t r i p wire on aerodynamic l i f t f o r var ious l o c a t i o n s on t h e a i r f o i l su r f ace . When placed on t h e suc t ion s ide of t h e a i r f o i l (F ig , 3 l a ) , t h e t r i p wire d id not s u b s t a n t i a l l y reduce t h e tone but induced stall prematurely, i n most cases , a t r e l a t i v e l y low angles of a t t a c k . When placed on t h e pressure s i d e (F ig . 31b), t h e t r i p wire reduced o r e l iminated t h e tone but degraded aerodynamic performance near s t a l l , although t o a much lesser exten t t han when placed on t h e suc t ion s i d e .
Figure 32a shows t h e e f f e c t of p l ac ing a s i n g l e t r i p wire
However, t h e toneo
a t the cen te r ofo the leading edge (i, e . , t h e s tagnat ion point when 01 = 0 1; t he r e s u l t i s a dramatic Cmprovement of the s t a l l c h a r a c t e r i s t i c s o o f t he a i r f o i l . i s reduced only fg r a < 2 ( i . e . , a 6-d.B reduct ion f o r c1 = 0 but 0 dB a t a = 2 ) . Figure 32b shows the e f f e c t of p l ac ing ''double t r i p " wires a t t h e aerodynamic cen te r ( i . e . , one on
23
t h e p re s su re s ide and one on t h e s u c t i o n s i d e ) ; t he r e s u l t i s almost complete reduct ion of t h e tone but aga in degradat ion of t he n e a r - s t a l l performance o f t h e a i r f o i l a
We conclude from these s t u d i e s that t r i p wires when placed on the p res su re s ide o f t n e a i r f o i l reduce t h e a c o u s t i c tone but genera l ly degrade aerodynamic performance near s t a l l . Properly placed leading-edge s e r r a t i o n s ( i . e o 9 on pressure s ide) , on t h e o t h e r hand, can r e s u l t i n s l i g h t improvements’ i n aerodynamic performance as w e l l as s i g n i f i c a n t l y reducing o r e l imina t ing t h e tones at t h e Reynolds numbers tes ted .
S teady - s ta t e veZoci ty measurements. - Mean v e l o c i t y pro- f i l e s for t h e unmodified a i r f o i l were measured over t he e n t i r e region from t h e l ead ing edge t o two chord l eng ths ( 1 2 i n , ) downstream from t h e t r a i l i n g edge. The measurements show tha t the flow i s accelerated i n t h e v i c i n i t y o f t h e a i r f o i l aero- dynamic c e n t e r and that a v e l o c i t y d e f i c i t ex i s t s i n t h e wake behind t h e a i r f o i l .
The e f f e c t o f leading-edge s e r r a t i o n s on t h e mean flow was observedoto b e ra ther i n s i g n i f i c a n t a t low angles of a t t a c k ( a <4 >. (All angles up t o stall were not s t u d i e d . ) Figure 33 zhows a r e p r e s e n t a t i v e comparison of mean v e l o c i t y p r o f i l e s i n t h e v i c i n i t y o f t h e t r a i l i n g edge w i t h and with- out leading-edge s e r r a t i o n s . The e f f e c t of t h e s e r r a t i o n s on the mearr flow i s t o t h i n s l i g h t l y both the boundary l aye r near t h e t r a i l i n g edge and t h e v e l o c i t y p r o f i l e i n t h e wake. The s l i g h t l y reduced wake i s cons i s t en t w i t h the 1-5% reduc- t i o n s i n drag observed from the fo rce measurements.
FZow vzkuaZixat ion s t u d y . - O i l v i s u a l i z a t i o n photographs were taken of t h e a i r f o i l upper su r face t o study the e f f e c t of s e r r a t i o n s on the behavior o f t h e leading-edge bubble w i t h varying angle of a t t a c k . T h i s t e s t was motivated by SodermanPs work [23], which shows that with properly designed s e r r a t i o n s s t a l l can be delayed t o extremely high angles of a t t a c k . Since s t a l l i s i n i t i a t e d on t h e NACA 0012 a i r f o i l wi th b u r s t i n g o f t h e leading-edge bubble, obviously t he ser- r a t i o n s must a f f e c t t h e bubble behavior .
We a p p l i e d a mixture of kerosene, t i tanium-dioxide, and motor o i l t o t h e upper su r face o f t h e a i r f o i l so tha t w e could s tudy the behavior o f t h e a i r f o i l leading-edge bubble. For t h e unmodified a i r f o i l , the leading-edge bubble was not observed u n t i l an angle of attack of 5 degrees. shows a photograph of t he leading-edge bubble formed a t
Figure 34
24
et = 5 degrees. The arrows i n d i c a t e t h e d i r e c t i o n o f t h e flow near t h e a i r f o i l sur face ; t he do t t ed l i n e i s the reattachment po in t . When the s e r r a t i o n s were a t t ached , no such bubble was observed - the f low appeared t o be i n t h e d i r e c t i o n of t he free stream at a l l po in t s .
Since w e d id not s i g n i f i c a n t l y improve the a i r f o i l aero- dynamic performance wi th t h e s e r r a t i o n s tes ted, w e cannot o f f e r any d e f i n i t i v e explanat ion of how or why s e r r a t i o n s can delay s ta l l , as Soderman showed [23], to high angles of a t t a c k . The r e s u l t s of these tests do, however, support t he explanat ion put f o r t h by Soderman t o expla in how s e r r a t i o n s delay s t a l l . We o f f e r t h e fol lowing t e n t a t i v e explanat ion based i n part on Soderman * s ear l ie r f ind ings .
It i s well-known tha t t h e laminar boundary l a y e r over t h e nose of a t h i n a i r f o i l a t high angle of a t t a c k fa i l s t o remain a t t ached t o t h e upper su r face i n t he reg ion of t he high adverse pressure gradient tha t e x i s t s j u s t downstream of t h e suc t ion peak. A leading-edge bubble forms when the separated flow r e a t t a c h e s t o t h e upper su r face .
Under proper e x c i t a t i o n , the bubble may t o form an unattached free shear layer r ep resen t ing t h e onset o f s t a l l . We b e l i e v e that t h e v o r t i c e s generated by t h e s e r r a t i o n s aug- ment t h e momentum i n the boundary layer by mixing high energy a i r from t h e p o t e n t i a l flow above the boundary layer s u f f i - c i e n t l y t o prevent t h e flow from sepa ra t ing l o c a l l y from t h e upper sur face , thereby e l imina t ing t h e sepa ra t ion bubble. If t h e momentum augmentation i f s u f f i c i e n t l y strong, the char- a c t e r of the s t a l l may change from a leading-edge bubble s t a l l t o a t ra i l ing-edge s t a l l charac te r ized by a separated t r a i l i n g region growing inward towards t h e l ead ing edge. SodermanPs study [ 23 ] shows t h a t t h e s e r r a t i o n s delay even the t r a i l i n g edge sepa ra t ion t o higher angles of a t t a c k . We note t ha t t ra i l ing-edge s t a l l occurs on t h i c k airfoils which genera l ly stall a t higher angles of a t t a c k than do t h i n a i r f o i l s f 2 4 1 .
5.3 Study o f the E f f e c t s of Lsading-Edge Serrations on a Two-Bladed i4ACA 3012 Propeller
A series of t e s t s were conducted to study t h e e f f e c t s of leading-edge s e r r a t i o n s on vor tex sound r a d i a t i o n from a two- bladed, v a r i a b l e p i t c h NACA 0012 section propeller of chord 2 i n . and diameter 1 4 i n . Sound power measurements, w i th and without s e r r a t i o n s , were made i n the laminar core of the free j e t . Photographs of t h e p r o p e l l e r w i t h a t y p i c a l s e r r a t i o n a t tacked near t h e l ead ing edge are shown i n Fig. 35. The p r o p e l l e r was spun at r o t a t i o n a l speeds of 2000 and 4000 rpm
25
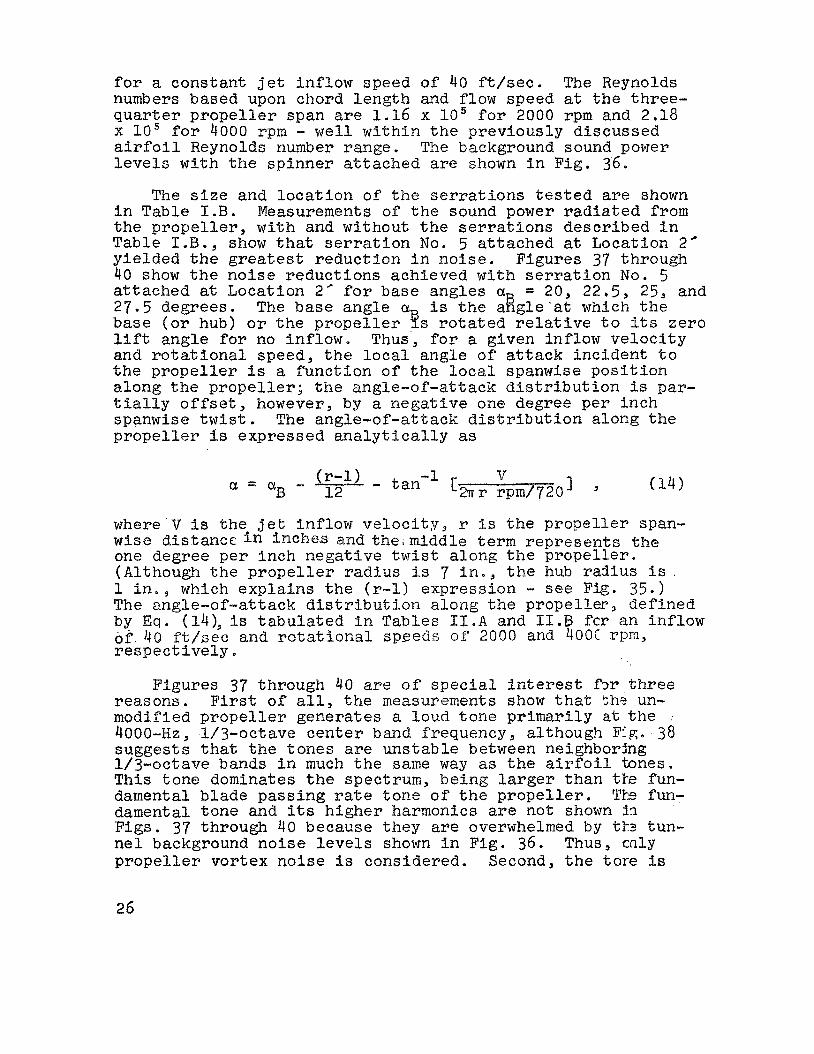
f o r a constant j e t inflow speed of 40 f t / s e c . The Reynolds numbers based upon chord length and flow speed a t t h e three- q u a r t e r p r o p e l l e r span are 1 - 1 6 x lo5 f o r 2000 rpm and 2,18 x lo5 f o r 4000 rpm - wel l w i th in t h e previously discussed a i r f o i l Reynolds number range. The background sound power l e v e l s w i t h t h e sp inner a t t ached are shown i n Fig. 36.
The s i z e and l o c a t i o n of the s e r r a t i o n s t e s t e d are shown i n Table I.B. Measurements of t h e sound power r a d i a t e d from the p r o p e l l e r , w i t h and without t h e s e r r a t i o n s descr ibed i n Table I.B. , show that s e r r a t i o n No, 5 a t tached a t Location 2’ yie lded t h e g r e a t e s t reduct ion i n nolse . Figures 37 through 40 show t h e no i se reduct ions achieved wi th s e r r a t i o n N o . 5 a t t ached at Location 2’ f o r base angles ag = 20, 22.5, 25, and 27.5 degrees. The base angle a i s t h e a n g l e ’ a t which t h e base ( o r hub) o r t h e p r o p e l l e r 9 s r o t a t e d r e l a t i v e to i t s zero l i f t angle f o r no inflow. Thus, f o r a given inflow v e l o c i t y and r o t a t i o n a l speed, t h e l o c a l angle of a t t a c k inc ident t o t h e p r o p e l l e r i s a func t ion o f t h e l o c a l spanwise p o s i t i o n along t h e p r o p e l l e r ; t h e angle-of-attack d i s t r i b u t i o n i s par- t i a l l y offset, however, by a nega t ive one degree per inch spanwise t w i s t . The angle-of-attack d i s t r i b u t i o n along the p r o p e l l e r i s expressed a n a l y t i c a l l y as
where V i s t h e j e t inflow velocity, r i s the propeller span- wise d is tance i n inches and the ,midd le t e r m r ep resen t s t h e one degree pe r inch negat ive t w i s t along the propel le r . (Although t h e p r o p e l l e r radj-us i s 7 i n . , t he hub ra9ius i s 1 i n . , which expla ins t h e (r-1) expression - see Fig. 35.) The angle-of-attack d i s t r i b u t i o n a long t h e propel ler def ined by E q . (14), is t abu la t ed i n Tables I1.A and 1I.B f c r an inflow o f . 40 f t / s e c and r o t a t i o n a l speeds of 2000 and 400; r p m , r e s p e c t i v e l y .
Figures 37 through 40 are o f s p e c i a l i n t e r e s t fx? three reasons. F i r s t of a l l , t h e measurements show t ha t Sh? un- modified p r o p e l l e r generates a loud tone p r i m a r i l y a t t h e ~OOO-EZ, l /+oe tave cen te r band frequency, although Ffg. 38 suggests t h a t %he tones are uns tab le between neighborhg 1/3-octave bands i n much t h e saine way 6s t he a i r f o i l tones. T h i s tone dominates t h e spectrum, being l a r g e r than tl-2 fun- damental blade pass ing ra te tone o f t h e p r o p e l l e r . Tb fun- damental tone and i t s h igher harmonics are not shown 22 Figs. 37 through 40 because t h e y are overwhelmed by tk tun- n e l background no i se l e v e l s shown i n Fig. 3 6 . Thus, cnly p r o p e l l e r vortex no i se i s considered., Second, t h e tore is
26
v i r t u a l l y e l imina ted when s e r r a t i o n No. 5 is attached at Location 2’. Figures 37 through 40 demonstrate that the s e r r a t i o n s produce less no i se reduct ion at high angles of attack t h a n a t low angles o f attack. Third, t o isolate the sound-producing regiorr o f t h e blade, w e cu t t he s e r r a t i o n span progress ive ly i n half and made comparative measurements. L i t t l e or no e f f e c t upon t h e tones was found u n t i l 1 / 4 of t he o r i g i n a l ’ s e r r a t i o n l eng th remained a t t h e t i p . For l eng ths less than 1 / 4 of the o r i g i n a l s e r r a t i o n length, t h e l e v e l of t he tones increased as shown i n Figs. 37 through 40. Thus, t o c l a r i f y some long-standing specu la t ion on the s u b j e c t , w e conclude t h a t the dominant region of non-rotat ional or vor tex noise generat ion i s the o u t e r 1/4 of t h e blade r ad ius .
We b e l i e v e tha t t h e p r o p e l l e r tones are generated i n pre- c i s e l y t h e same way that t h e a i r f o i l tones discussed e a r l i e r are generated. To support t h i s conclusion, w e have p l o t t e d the Strouhal number corresponding t o t he p rope l l e r tone on the a i r f o i l S t rouhal curve shown i n Fig. 26. The p r o p e l l e r S t rouhal number i s determined from Eq. (13) where V 104 f t / s e c and R, = 1.16 x 10’ a r e based on the l o c a l ve loc i ty a t the 3/4 r a d i u s - s t a t i o n and d = 0.02 f t , the p r o p e l l e r maximum th ickness .
Figures 4 1 through 4 3 show the e f f e c t s of a t t a c h i n g ser- r a t i o n No. 5 a t Locations 1’ and 2’ f o r the higher r o t a t i o n a l speed of 4000 rpm. Tones are again generated from t he un- modified p r o p e l l e r but at t h e h igher 1/3=octave cen te r fre- quency of 8000 Hz. The tones are v i r t u a l l y e l iminated wi th s e r r a t i o n No. 5 attached a t Location 2’. The S t rouhal num- o f t h e tones where V = 196 f t / s e c and R = 2.18 x 10‘ is p l o t t e d i n Fig. 26. Thus, w e b e l i e v e tgat t h e tones a t the higher r o t a t i o n a l speed of 4000 rpm are a l s o generated by v o r t i c e s shed at a pe r iod ic o r near per iodfc rate i n t o the p r o p e l l e r wake.
27
6. CONCLUSIONS APlD RECOMIE$lDATIONS
The p r i n c i p a l conclusions from t h i s study are:
(1) Loud, d i s t i n c t tones are generated by NACA 0012 shaped a i r f o i l s and p rope l l e r s opera t ing a t l o w angles of a t t a c k i n smooth flow w i t h chord based Reynolds numbers ranging from 8.33 x lo4 L R 5 3 . 3 3 x lo5, The tones are generated by pe r iod ic o r ne& pe r iod ic f l u c t u a t i n g f o r c e s , l oca t ed on the a i r f o i l and p r o p e l l e r near t h e t r a i l i n g edge and induced by laminar boundary-layer wake vor tex shedding. We suspec t , al though w e have not v e r i f i e d , t h a t t h e f fuc tu- a t i n g fo rces are wel l -cor re la ted along t h e a i r fo i l , and pro- p e l l e r span. At higher angles of' a t t a c k , corresponding t o s t a l l where the wake vor tex shedding i s broadband, the tones disappear.
( 2 ) The tones are reduced o r e l iminated by a t t a c h i n g properly designed and properly loca t ed s e r r a t i o n s near t h e l ead ing edge o f t h e a i r f o i l and p r o p e l l e r pressure s ide . The s e r r a t i o n s generate chordwise t r a i l i n g v o r t i c e s which t r i p the laminar boundary layer on both t h e pressure and suc t ion su r faces thereby changing t h e charac te r of' t h e wake vor tex shedding from pe r iod ic o r almost per iodic t o broadband --hence t h e reduct ion o r e l imina t ion o f t h e tones. A t high angles of a t t a c k corresponding t o s t a l l , t h e s e r r a t i o n s a l s o reduce the broadband noise .
(3) The d i r e c t i v i t y p a t t e r n r a d i a t e d by srnaZZ a i r f o i l s i n flow has been conpared wi th tha t p red ic t ed by Curie's point d ipole sound theory. We be l i eve t h e comparison between theory and experiment t o be s u f f i c i e n t to present a par t ia l . !
check of t h e v a l i d i t y o f Cur l eDs theory .
( 4 ) A t h e o r e t i c a l model p red ic t ing t h e sound r ad ia t ed from srnaZZ a i r f o i l s i n tu rbu len t flow shows good agreement with experiment over a l a r g e ve loc i ty range. The good agreement between theory and experiment suggests t h a t f o r small a i r f o i l s i n t u rbu len t flow, most of t h e r a d i a t e d sound I s generated by t h e t ime-derivative of t h e f l u c t u a t i n g l i f t induced by t h e turbulence.
The present study has inves t iga t ed t h e behavior of t he tones and t h e i r subsequent removal with leading-edge ser- r a t i o n s f o r only a L i m i t e d Reynolds number range. For low angles of a t t a c k , the boundary layer over t h e unmodified a i r f o i l and p r o p e l l e r su r f ace i s pPedominantly laminar. Since t h e tones are generated by v o r t i c e s shed at a pe r iod ic o r near per iodic rate i n t o the a i r f o i l o r propel le r wake,
28
they should be s e n s i t i v e t o t h e l o c a l flow condi t ions near t h e t r a i l i n g edge. Thus, the behavior of t h e tones and t h e i r e f f e c t i v e removal w i t h s e r r a t i o n s should be inves t iga t ed over a Reynolds number range s u f f i c i e n t l y large t o include a t u r - bulent boundary layer over most o f the a i r f o l l and p r o p e l l e r su r f ace .
CurlePs d ipo le sound equat ion i s commonly used t o pre- d i c t the sound r a d i a t i o n from smaZZ l i f t i n g sur faces i n flow. L i t t l e i s known, however, about t h e v a l i d i t y of h i s genera l model f o r large l i f t i n g su r faces i n flou--f.e., large w i t h r e spec t t o a t y p i c a l wavelength of' t h e radiated sound. Since there are many s i t u a t i o n s where t h e dimensions of t h e l i f t i n g su r faces are l a r g e (e .g . , t h e a i r f o i l blades on a high rpm compressor o r lift f a n ) , a comparison of h i s theory w i t h ex- periments i s important . The experiments should be designed t o i s o l a t e the various sur face d ipo le d i s t r i b u t i o n s . For example, it i s commonly be l ieved tha t f o r airfoils i n smooth flow, most of t h e d ipo le source s t r e n g t h i s concentrated near t h e a i r f o i l t r a i l i n g edge [8, 15, 161. Conversely, f o r air- f o i l s i n t u rbu len t flow, most o f the d ipo le source s t r e n g t h is be l ieved t o be concentrated near t h e a i r f o i l l ead ing edge. It would be desirable t o understand t h e condi t ions under which both t h e l ead ing and t r a i l i n g edge d ipo le sources are import- ant con t r ibu to r s t o the sound f i e l d ,
REFERENCES
1. Soderman, P . T . : A Device f o r Reducing A i r f o i l Noise Vodeled After t h e Leading Edge Comb of t h e Owl. NASA TN t o be published;
2. Curle, N. : The Inf luence a f Solid Boundaries Upon Aero- dynamic Sound. P P O C . Roy. Soe. 231A, 1955, pp. 505-517.
3. L i g h t h i l l , ?!I. J. : On Sound Generated Aerodynamically I. General Theory. Proc. Roy. Soc. 211A, 1952, pp. 564- 587.
4. C l a r k , P. J. F.; and Ribner, H. S o : Direct Corre la t ion of F luc tua t ing L i f t wi th Radiated Sound f o r an A i r f o i l fn Turbulent Flow. J. Aeoust. Soe. Arner. 46, 1969, pp. 802-805.
5 . Gordon, C. G.: Inf luence of Upstream Power Flow Discon- t i n u i t i e s on the Acoustic Power Radiated by a Model A i r J e t . NASA CR-679, January 1967.
6. He l l e r , K . H . : Correlation of' FZuctuating Forces with the Sound Radiation of Rig id Flow-Spoilers. BBN Report 1734, Bolt Beranek and N e w m a n Inc . Cambridge, Massa- c h u s e t t s , 17 October 1968.
7. Sharland, I . J . : Sources o f Noise i n .Axial Flow. J. Sound N b . , v o l . I, no. 3, Ju ly 1964, pp. 302-322,
8. Siddon, T, E.: Surface Dipole Strength for Flow P a s t A i r f o i l s . Presented a t the 7 9 t h Meeting of the Acous t ica l Society of' America .(Atlantic Cigy, - N e w Je rsey) , Apr i l X97O
9 . Ross9 D.: Vortex-Shedding Sounds of Propel le rs . BBN Report 1115, Bol t Beranek and Newman I n c , Cambridge, Massachusetts March 1964.
10. Strouhal , V.: Ueber e i n e Besondere A Y ~ der Tonerregung. Annaten d e r P h y s i k and Chernie 5 , 18?d, p p b 216-251.
11. R a y l e i & , Lord: Aeolian Toms. P h i Z . >fag. 29, 1915,
12. R e l f , E. F.: On the Sound Emitted by Wires of C i rcu la r Sec t ion when Exposed t o iil? Air Curllent. P h C Z . Mag. 42,
F a 433.
1921, pp. 173-1764
30
13. Gongwer, C. A , : A Study of Vanes Singing i n Water.
1 4 . Bauer, A , E . : Vortex Shedding -from T h i s F l a t rElates
J . AppZ. klech. 1 9 , 1952, p. 432.
Paral le l t o the Free Stream. J. Aero. S e i . 28,'1961, pp. 340-341.
15. Hayden, R. E. : Sound Generation by Turbulent Wall J e t Flow Over a T r a i l i n g Edge. M.S. Thesis , Purdue University , 1969. Also Paper FF-10 wi th R . C . Chanaud, 1970 Spring Meeting of the Acoustical Soclety of America, A t l an t i c Ci ty , New Jersey.
16. Chanaud, R. C.; and Haydelz, R. E . : Edge Sound Produced by Two Turbulent Wall J e t s . Paper FF-11, 1970 Spring Meeting of t h e Acoustical Society of' America, A t l an t i c City, New Jersey.
1 7 . Stowell , E . Z . ; and Deming, A. F. : Vortex Noise frm Rotat ing Cylind-rical Rods. ??at ion& Advisory Go!;?mittee for Aeronautics, NACA 519, 1935.
18. Yudin, E. Y . : On the V o r t e x Noise from Rotating Rods. Washington, D.C., NACA TM 1x36, Parch 1947.
19. Hubbard, 13. H . : Prope l l e r Noise %arts f o r Transport Airplanes. Washington, D . C . , NACA TN 2968, June 1953.
20. Schlegel , R. ; King, R. ; and Mull, E . : Helicopter Rotor Noise Generation and PropagatSon. F?. E u s t i s , Virginia , USAVLABS TR 66-4, Oct b 1966.
21. Liepmann, H. W . : On the Application cf S t a t i s t i c a l Concepts t o t h e Buffet ing Proglem. J . Aero. S e i . 19, 1952, P * 7 9 3 .
22. Davies, P. 0. A . L. ; Barrett, M. J. ; axl Fisher , 14. .J , : Turbulence i n the Nixing Region of a Romd Jet. ARC^23, 728-N200-FM 3181, 1962.
23. Soderman, F.T. : Effects of Leading Edge Yeerrations on a Two-Dimensional Airfoil, NASA TN t o ,e published.
24. McCullogh, G. B.; and G a u l t , D, E. : Examples of Threk Representat ive Types of Airfoi l -Sect ion S t c l l a t Low Speed. NACA TN 2502, 1951.
31
25. Jacobs, E. N.; and Shermans A.: Airfoil Section Charac- t e r i s t i c s as Affected by Variations in t he Reynolds Number. NACA Tech. Report 586, 1937.
32
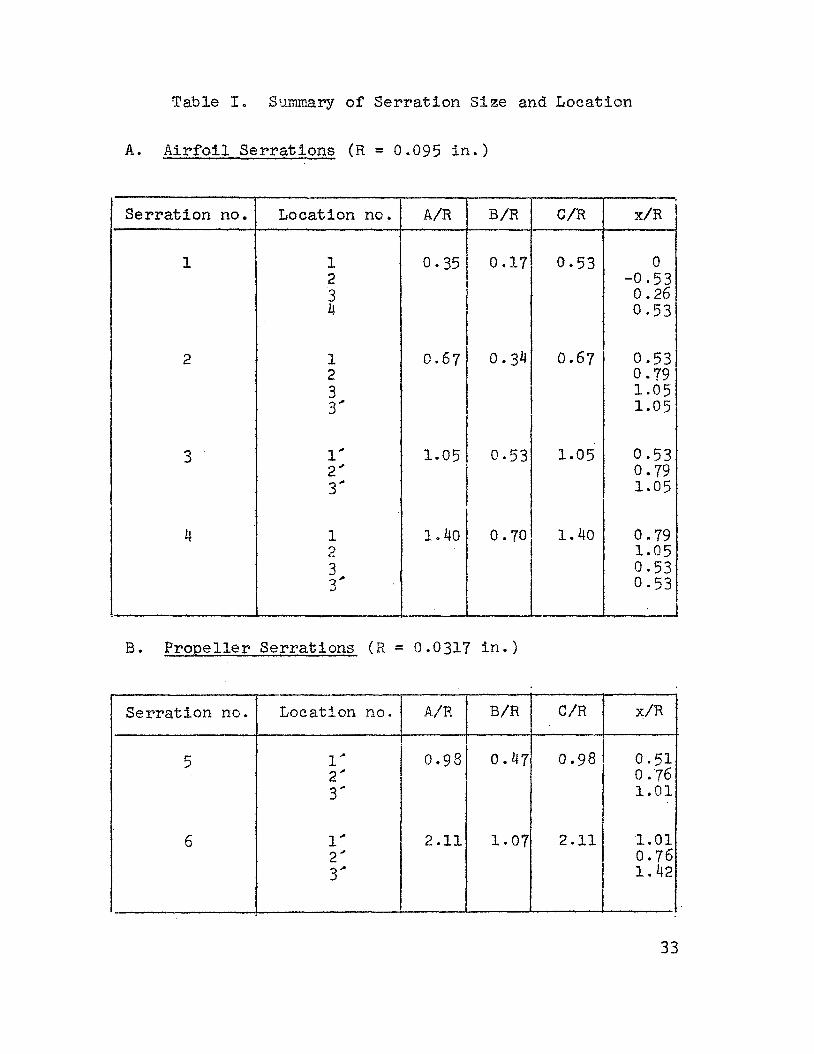
Table I, Summary of S e r r a t i o n S i n e and Locatlon
A. Airfoi l S e r r a t i o n s ( R = 0.095 in.)
Serrat ion no
1
2
3 .
4
Location no.
1 2 3 &
1 2 3 3’
1’ 2’ 3’
1 2 3 3*
A/R
0.35
0.67
1.05
1.40
B/R
0.17
0.34
0.53
0.70
3. Propel le r Se r ra t ions ( R = 0.0317 in.)
S e r r a t i o n no.
5
5
c/n
0.53
0.67
3.05
1.40
x/R
0 4 - 5 3
0.26 0 .53
0.53 0 *19 1.05 1.05
0 053 0 79 1.05
0 79 1 . 0 5 0 . 5 3 0.53
33
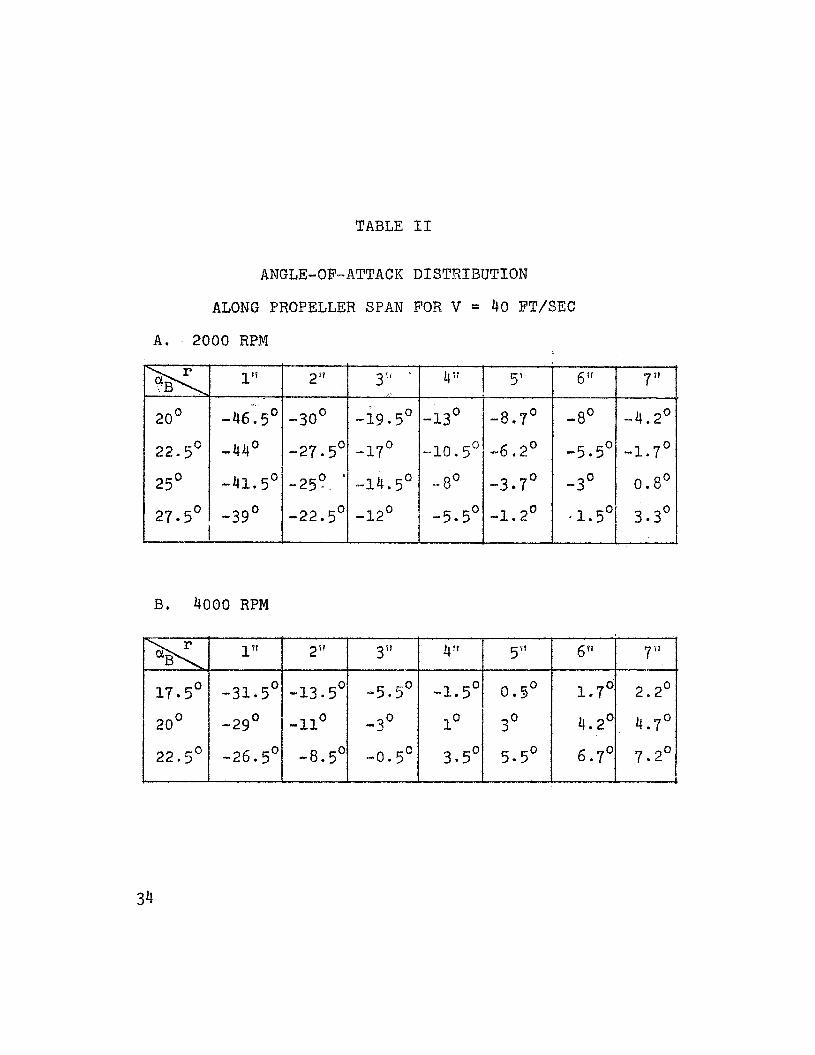
TABLE I1
17t 2 i f 3 5 (? 6 *! 7 4 7 1
ANGLE-OF-ATTACK DISTRIBUTION
17.5' -31.5' -13.5' -5.5'
20° -29' -11 -3O 0
2 2 0 5 ~ -26.5' -8.5' -0.5'
ALONG PROPELLER SPAN FOR V = 40 FT/SEC
1
-1.5' 0.5' 1.7* 2.2O
lo 3O 4.2' 4.7'
3.5' 5.5' 6.7' 7.2' 1
A. 2000 RPM
27 5'
". ,
-46.5'
-44O
-39O
1
-41.5'
-30' - i g . 5 O -13' -8.7'
-27.5' -17' -10.5" -6.2'
-250 , ' -14.5' -8' -3 7 O
-22.5' -12' -5.5' -1.2 0
i t -8' - 4 . 2 O
-5.5* -1.7'
-3' 0.8'
I I I I I I 1
B. 4000 RPM
34
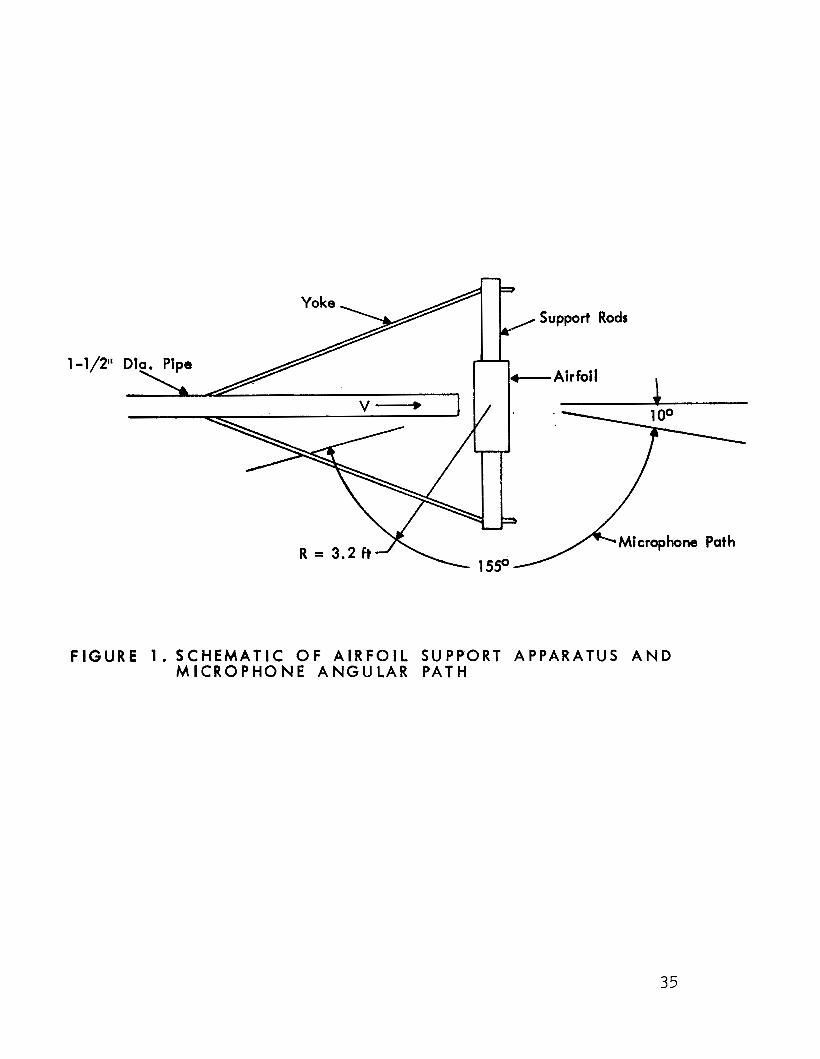
n
1 4/21'
F I G U R E 1 . S C H E M A T I C O F A I R F O I L SUPPORT APPARATUS A N D M I C R O P H O N E A N G U L A R PATH
35
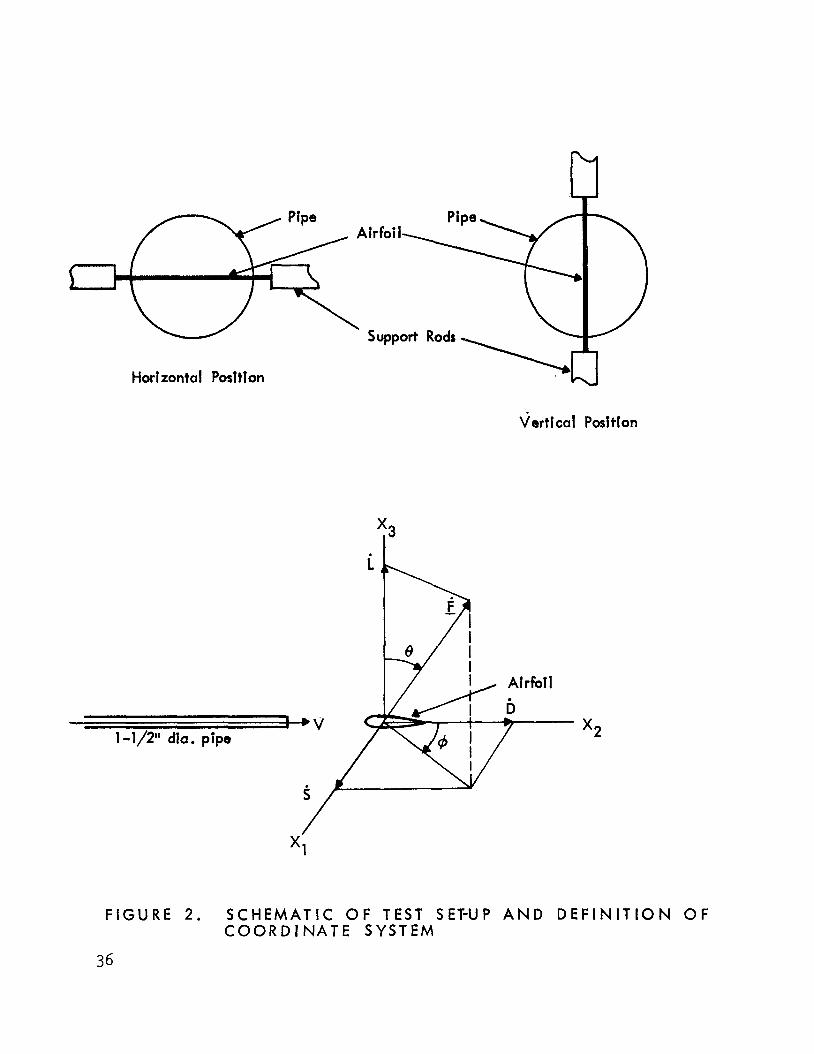
Airfoil-, A
I Support Rods
Horizontal Posltlon
Vertical Posltlon
F I G U R E 2. S C H E M A T I C O F T E S T SET-UP A N D D E F I N I T I O N OF C O O R D I N A T E S Y S T E M
36
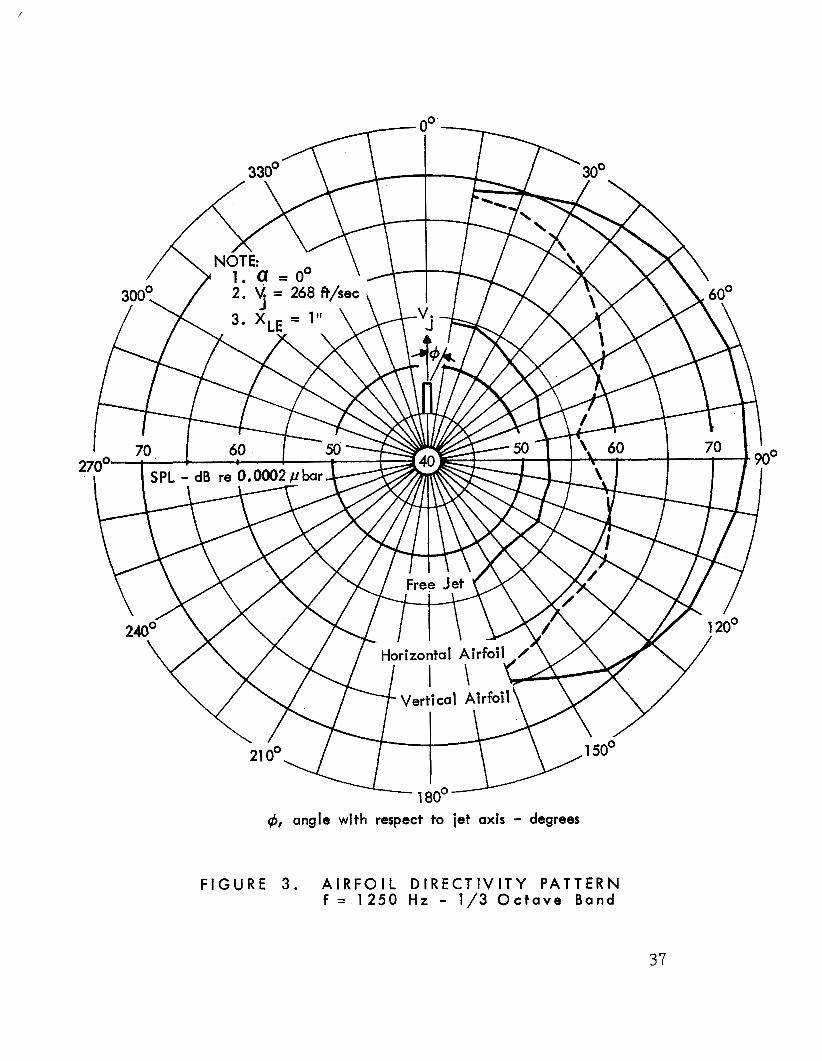
@, angle with respect to jet axis - degrees
FIGURE 3 . A IRFOIL DIRECTIVITY P A T T E R N f = 1 2 5 0 H z - 1/3 O c t a v e Band
37
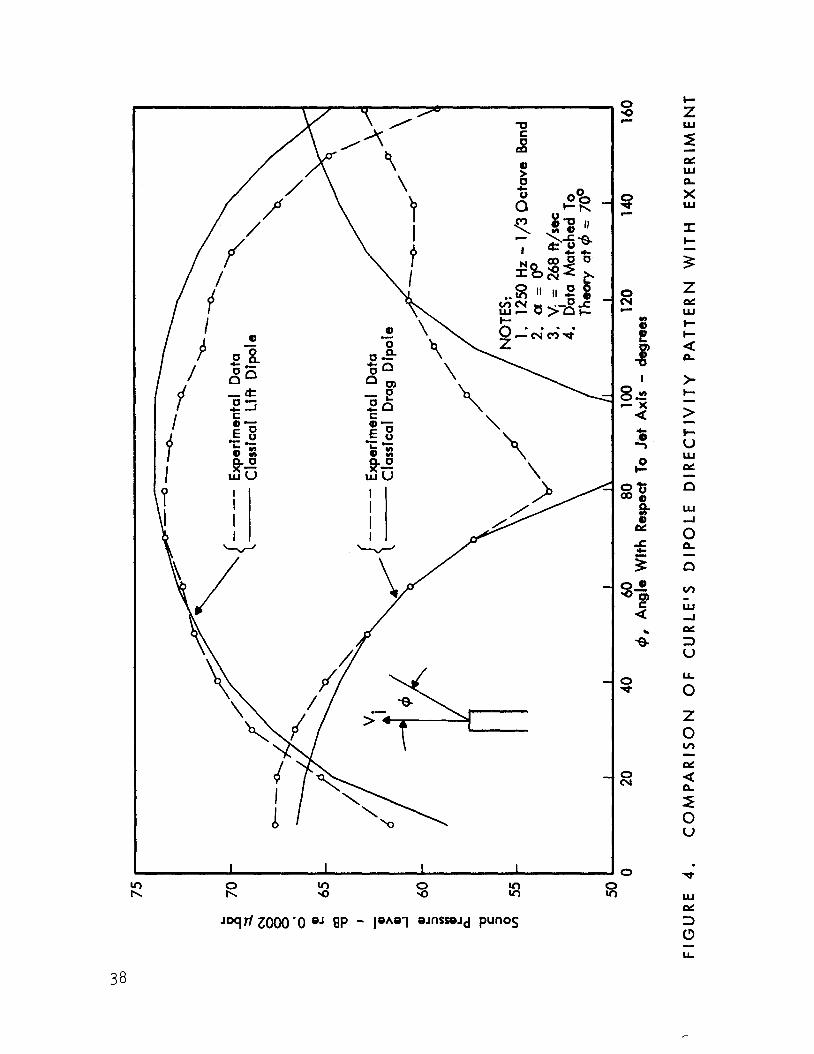
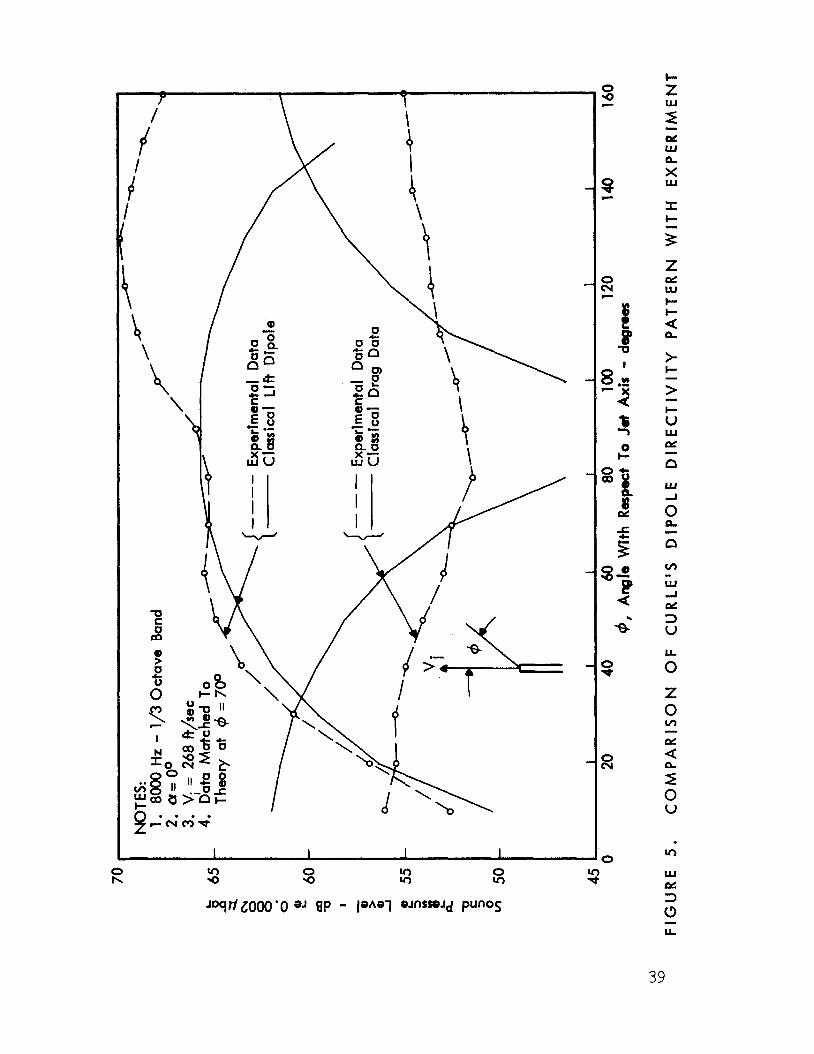
\ -i \
a \ t \
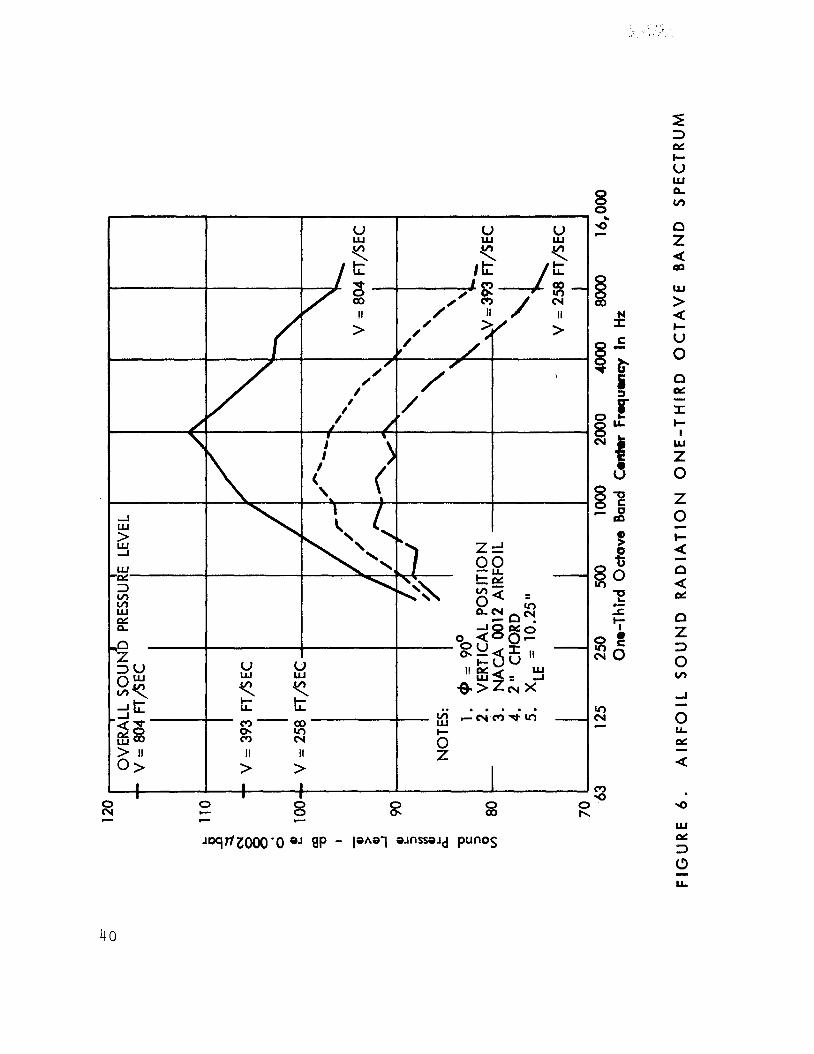
4 0
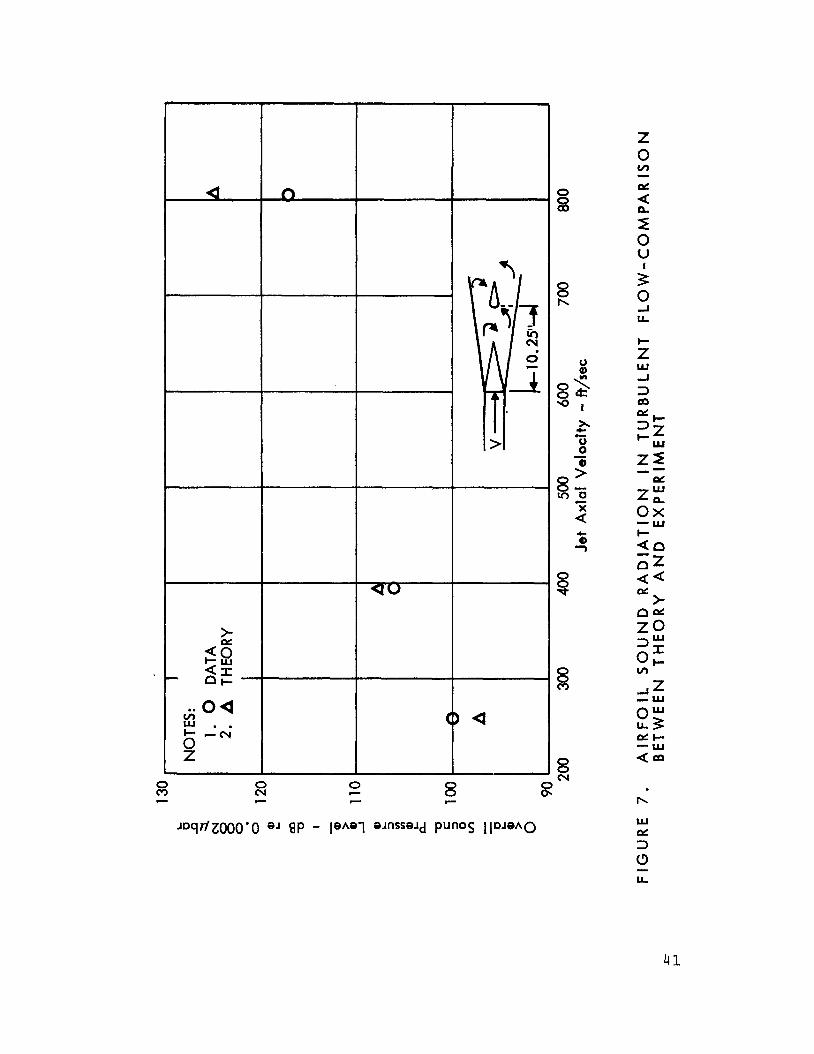
41
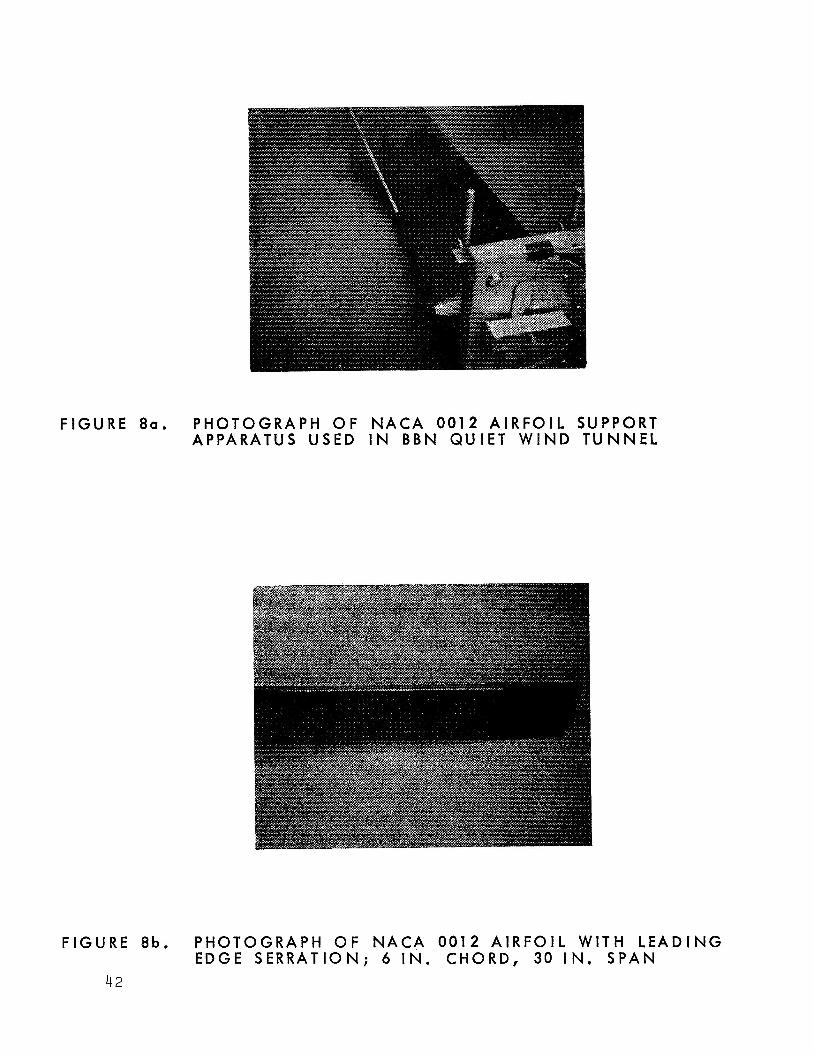
F I G U R E 8 a . P H O T O G R A P H O F N A C A 0 0 1 2 A I R F O I L SUPPORT APPARATUS U S E D I N BBN Q U I E T W I N D TUNNEL
F I G U R E 8 b . P H O T O G R A P H OF N A C A 0012 A I R F O I L W I T H L E A D I N G E D G E S E R R A T I O N ; 6 IN. C H O R D , 30 IN. S P A N
4 2
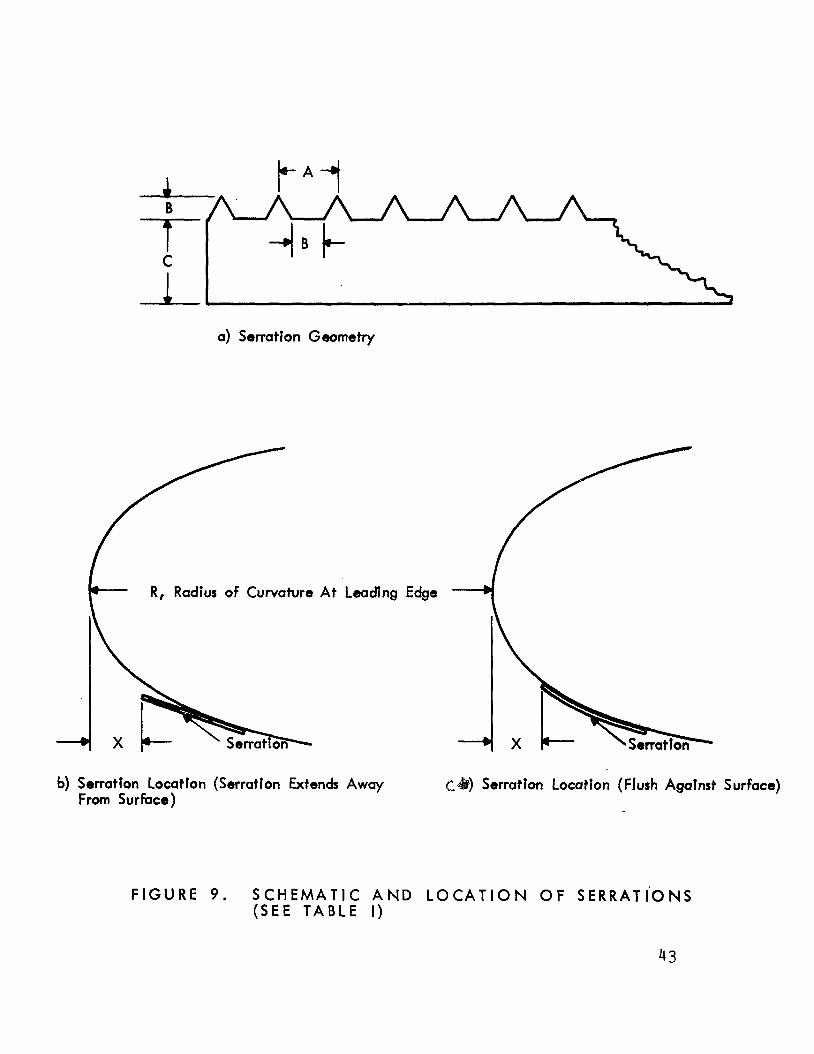
a) Serration Geometry
R, Radius of Curvature At Leading Edge
b) Serratfon Location (Serration Extends Away Serration Location (Flush Agatnst Surface) From Surface)
F I G U R E 9 . S C H E M A T I C A N D L O C A T I O N O F S E R R A T I O N S ( S E E T A B L E I )
43
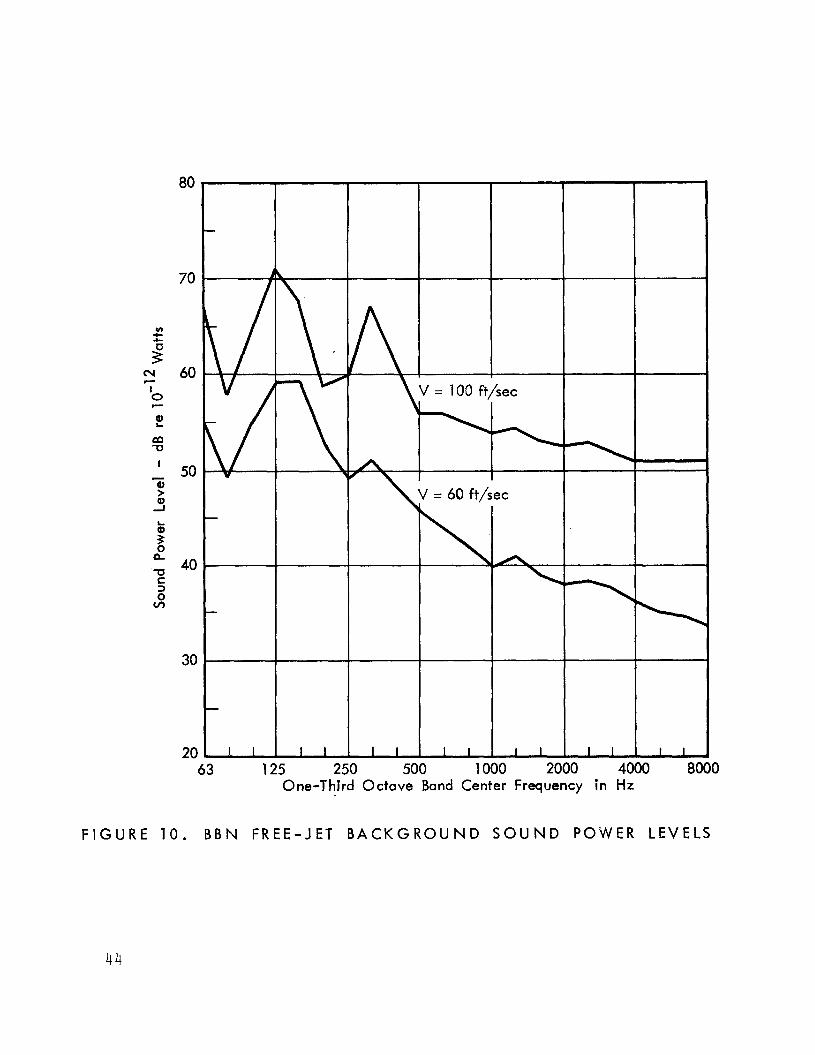
80
70
v) c .I-
2 CI( 60 .-
I 0 7
2 m
- ' 50
U
0, > 0, 1
$
40 W C 3 0 v)
30
20 63 125 250 500 1000 2000 4000 8000
One-Third Octave Band Center Frequency in Hz
F I G U R E 1 0 . B B N FREE-JET B A C K G R O U N D S O U N D POWER LEVELS
44
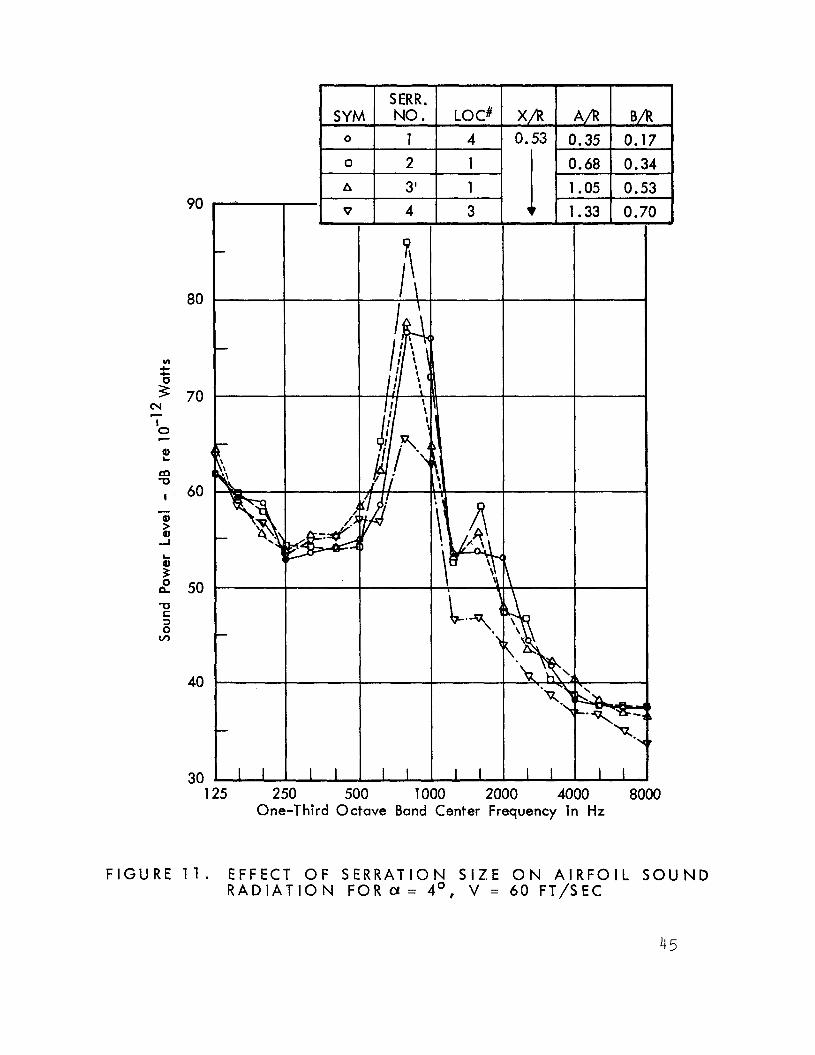
v)
c 4-
; cv I 0 .- - L m -0
I
Q) > Q) A
-
t LL
-0 S 3 0 v)
FIGURE
90
80
70
60
50
40
30 125 250 500 1000 2000 4000 8000
One-Third Octave Band Center Frequency in Hz
1 1 . EFFECT OF SERRATION S I Z E O N A I R F O I L SOU R A D I A T I O N FOR = 4 O , V = 60 FT/SEC
45
N D
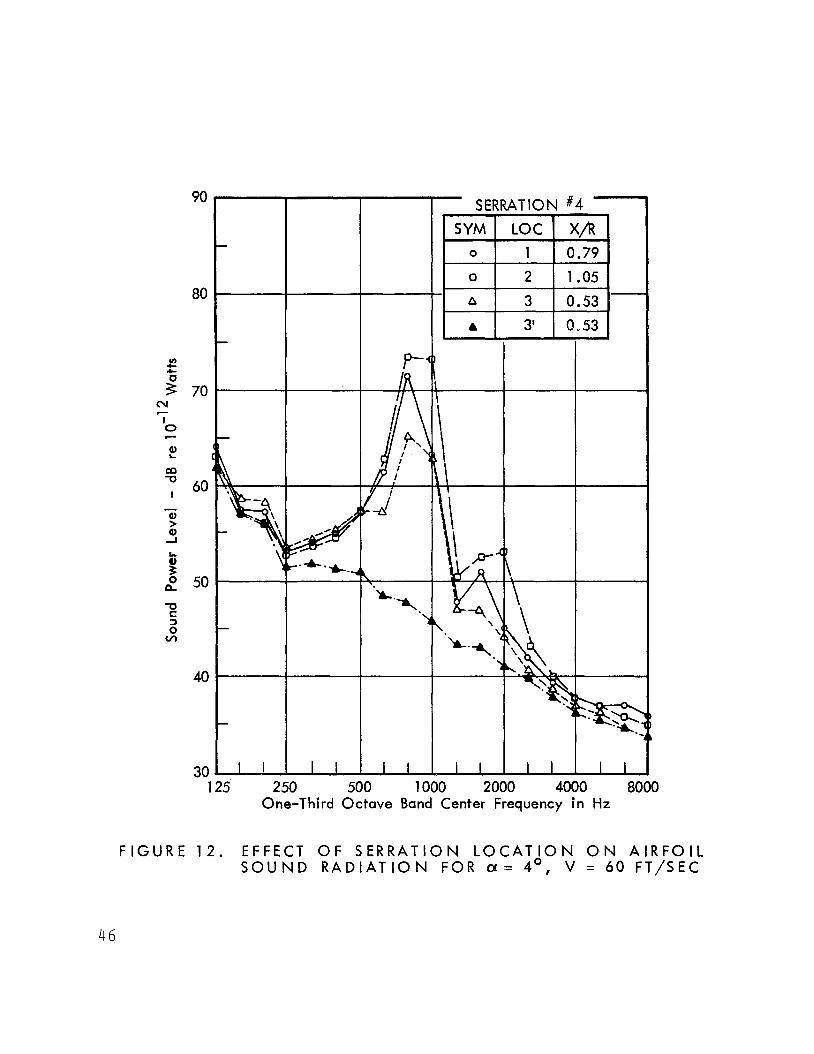
90
80
70
60
50
40
30 125 250 500 1000 2000 4000 8000
One-Third Octave Band Center Frequency i n Hz
F I G U R E 1 2 . EFFECT OF S E R R A T I O N L O C A T I O N O N A I R F O I L S O U N D R A D I A T I O N FOR C Y = 4 O , V = 60 FT/SEC
46
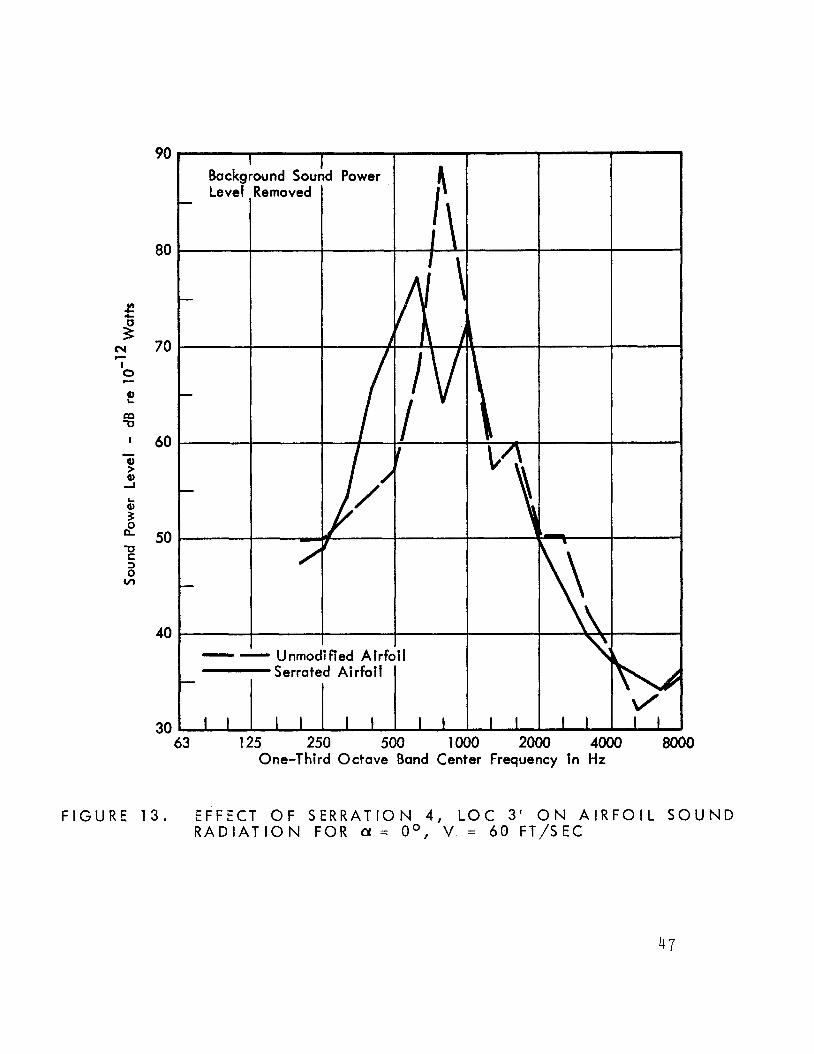
90
80
70
60
50
40
30 63 125 250 500 1000 2000 4000 8000
One-Third Octave Band Center Frequency tn Hz
FIGURE 1 3 . E F F Z C T OF SERRATION 4, L O C 3 ' O N A I R F O I L S O U N D R A D I A T I O N FOR 01 = Oo, V = 6 0 F T / S E C
47
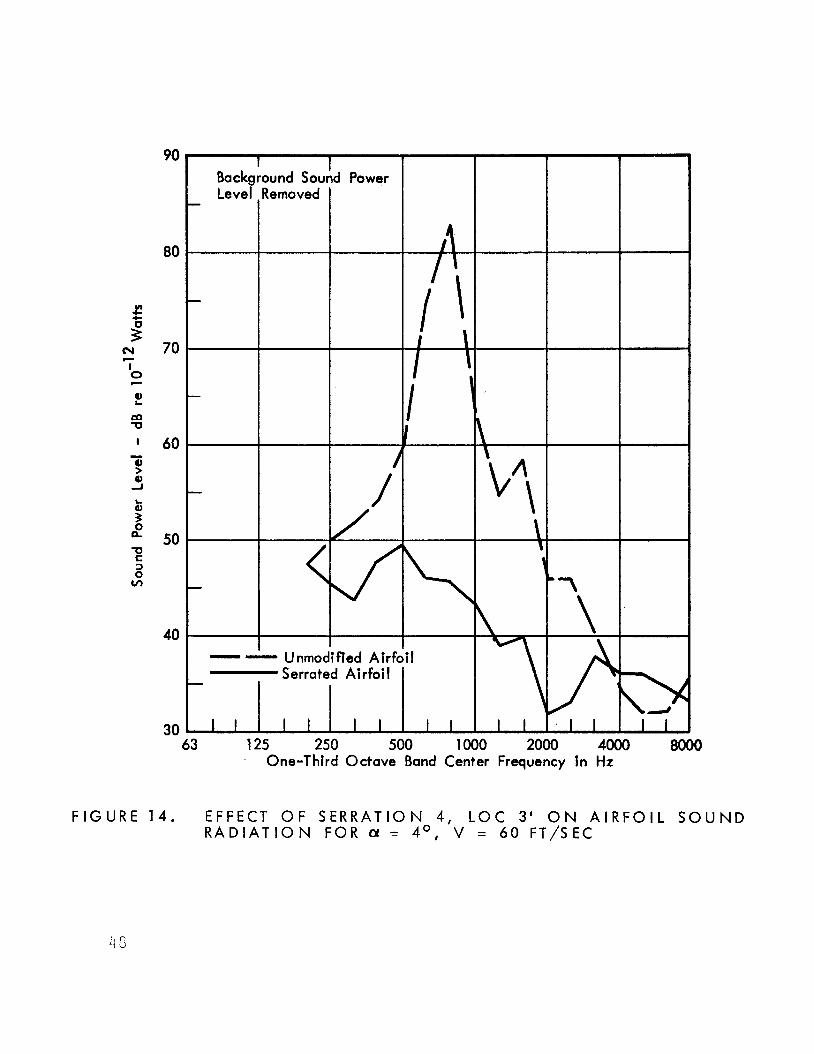
90
80
70
60
50
40
30 63 125 250 500 1000 2000 4000 8000
One-Third Octave Band Center Frequency In Hz
F I G U R E 1 4 . EFFECT O F S E R R A T I O N 4 , L O C 3 ' O N A I R F O I L S O U N D R A D I A T I O N F O R = 4O, V = 6 0 FT/SEC
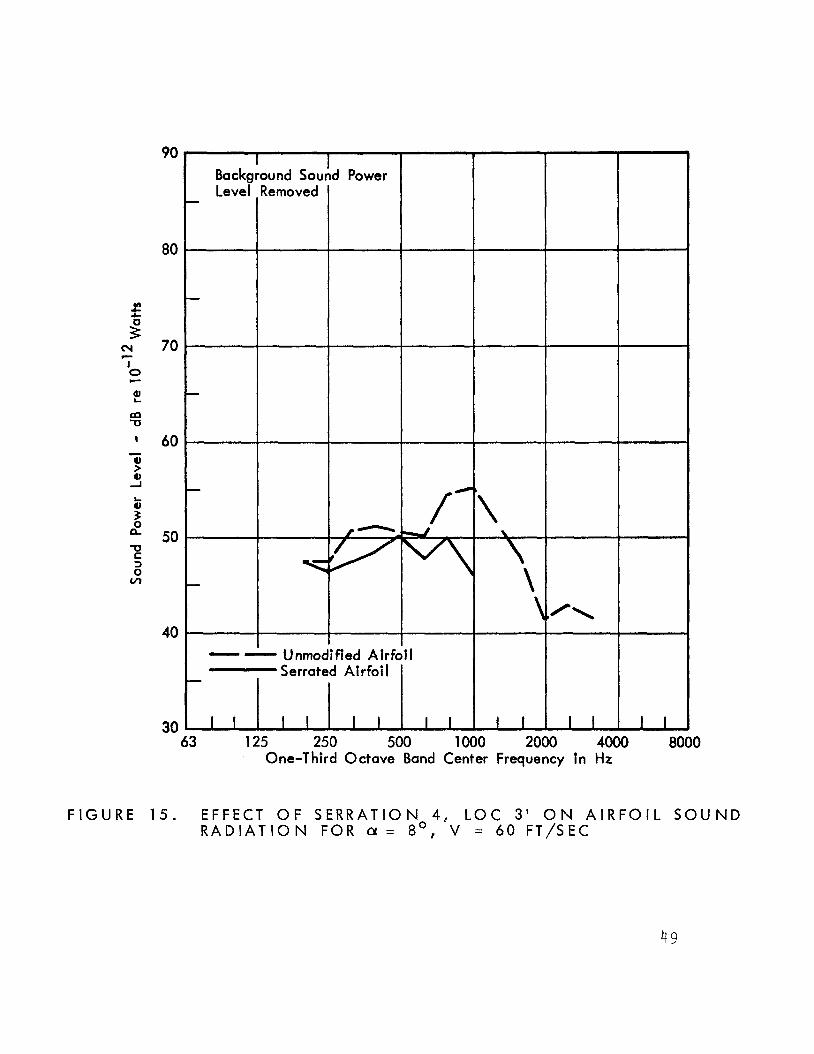
s P
cy I 0 b
c
2 m -0
90
80
70
60
50
40
30
FIGURE 1 5 . EFFECT O F S E R R A T I O N 4 , L O C 3 ' O N A I R F O I L S O U N D R A D I A T I O N FOR a = 8 O , V = 60 FT/SEC
49
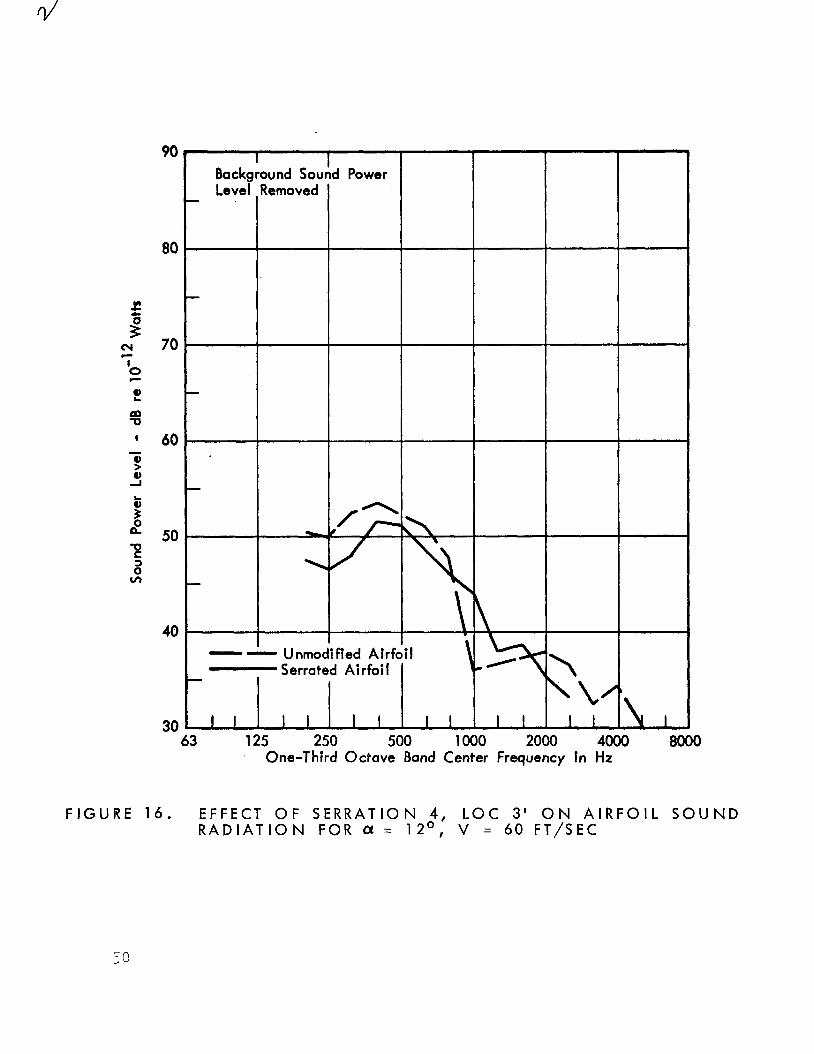
f s cy I c
a
0, m
c
-0 I
t LL
90
80
70
60
50
40
30 63 125 250 500 lo00 2000 4OOo 8000
One-Thfrd Octave Band Center Frequency In Hz
FIGURE 1 6 . EFFECT OF SERRATION 4 , L O C 3 ' O N A I R F O I L S O U N D R A D I A T I O N FOR ct = 12', V = 60 FT/SEC
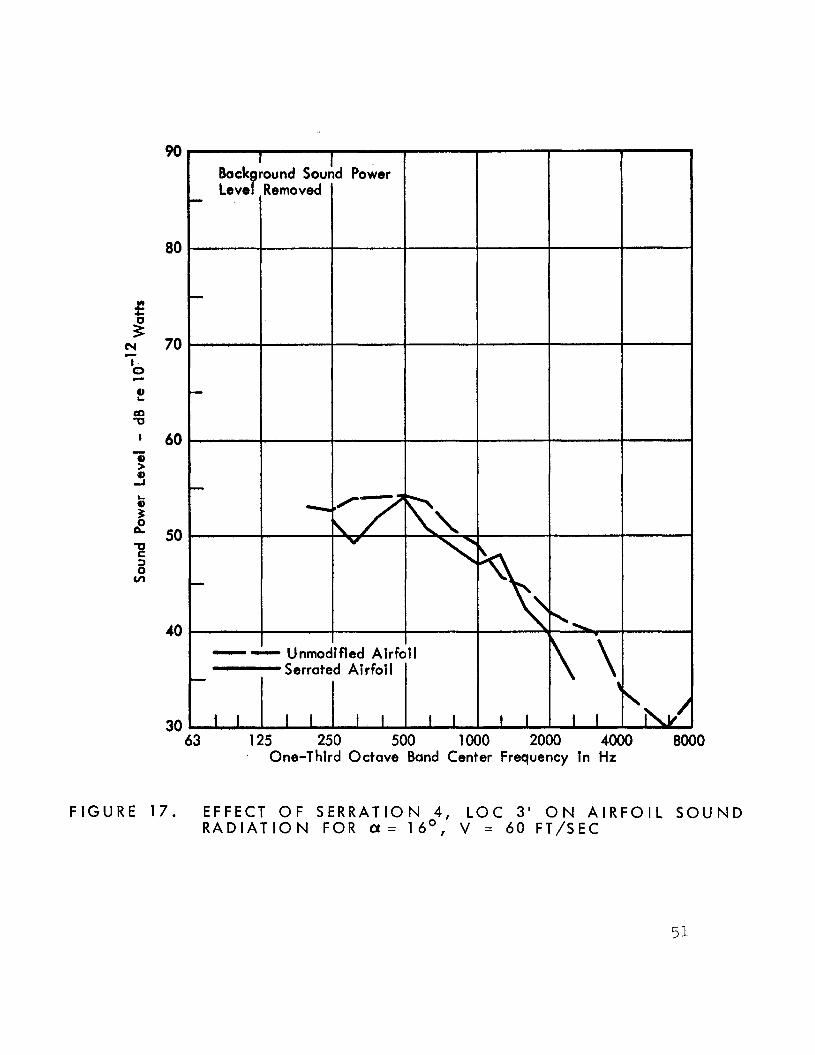
90
80
f s (Y 70 *
I 0 c
!! rn
I 60 0
- a > a -I
a 3
r~ 50 B 5
0
v)
40
30 63 125 250 500 lo00 2000 4000 8000
One-Third Octave Band Center Frequency In Hz
F I G U R E 17. EFFECT O F S E R R A T I O N 4 , L O C 3 ' O N A I R F O I L S O U N D R A D I A T I O N FOR C Y = 1 6 O , V = 6 0 FT/SEC
5:
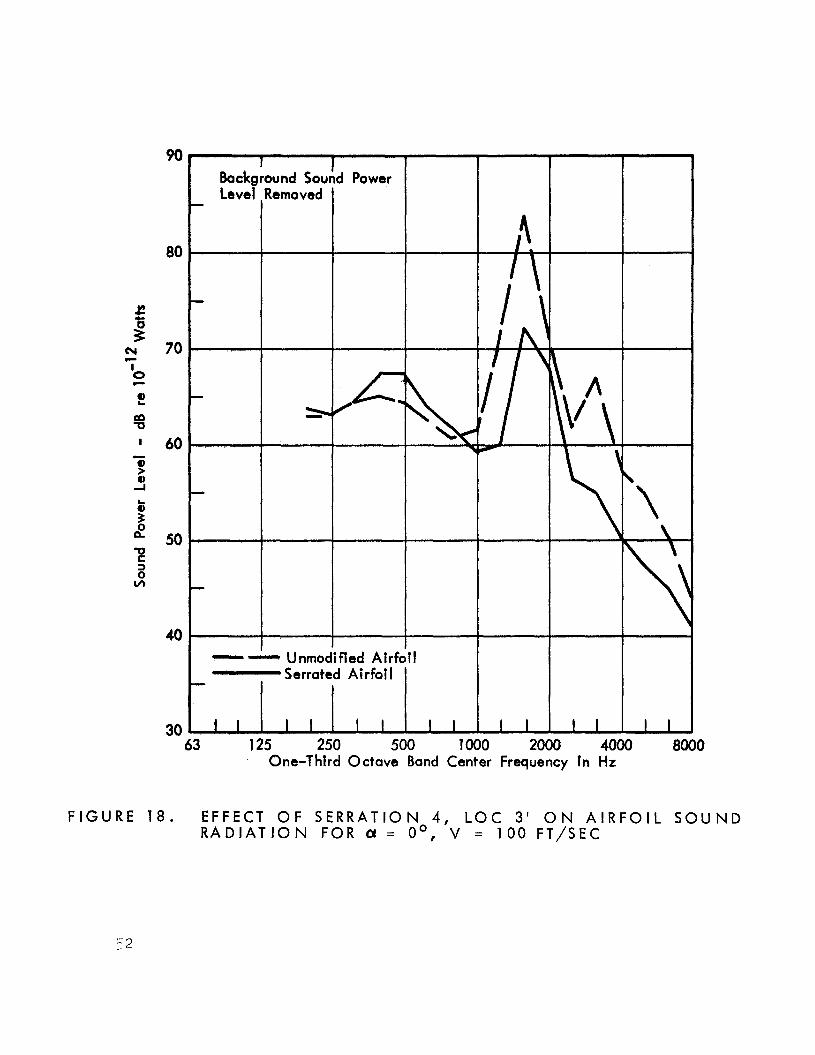
80
70
60
50
40
- Serrated Airfoil
30 - - 63 125 250 500 1000 2000 4000 8000
One-Third Octave Band Center Frequency in Hz
F I G U R E 1 8 . EFFECT O F S E R R A T I O N 4 , L O C 3 ’ O N A I R F O I L S O U N D R A D I A T I O N F O R = Oo, V = 1 0 0 FT/SEC
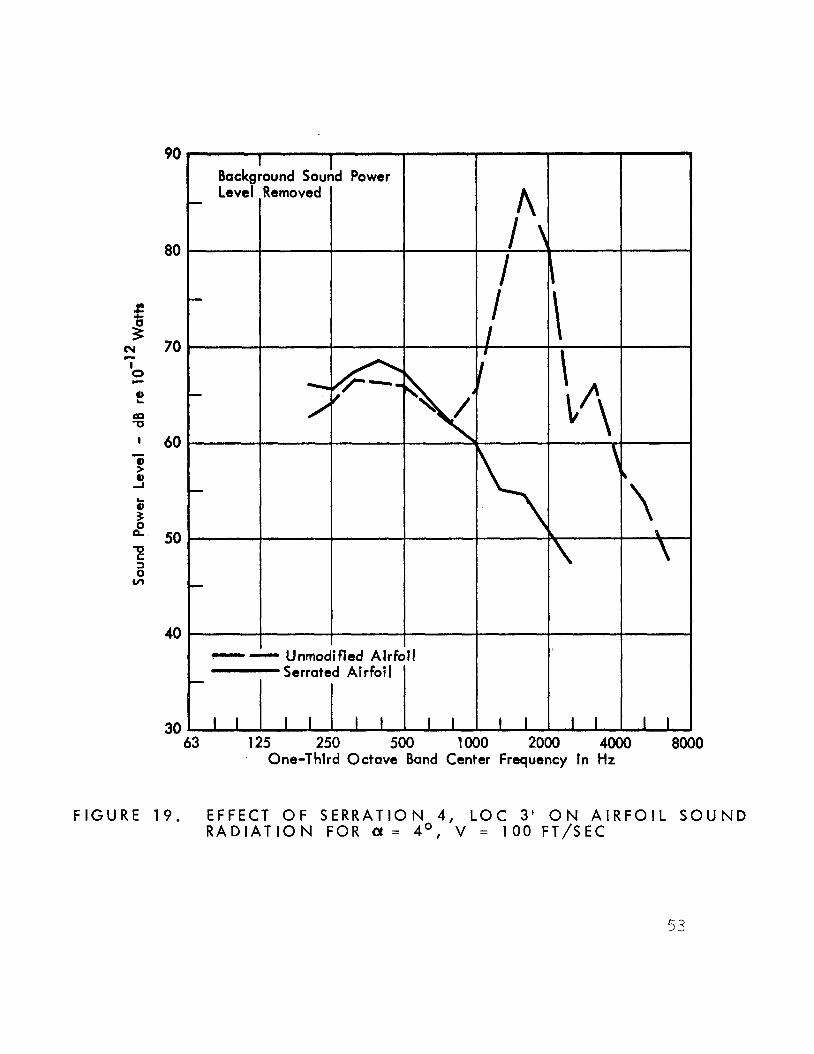
90
80
c c s cv 70 c I 0 c
!!
I 60
a -u
c 0 > 0 A
8
t~ 50 rn S 3 0 ul
40
30 63 125 250 500 1000 2000 4000 8000
One-Third Octave Band Center Frequency in Hz
F I G U R E 1 9 . EFFECT O F S E R R A T I O N 4 , L O C 3 ' O N A I R F O I L S O U N D R A D I A T I O N FOR o L = 4 O , V = 100 FT/SEC
53
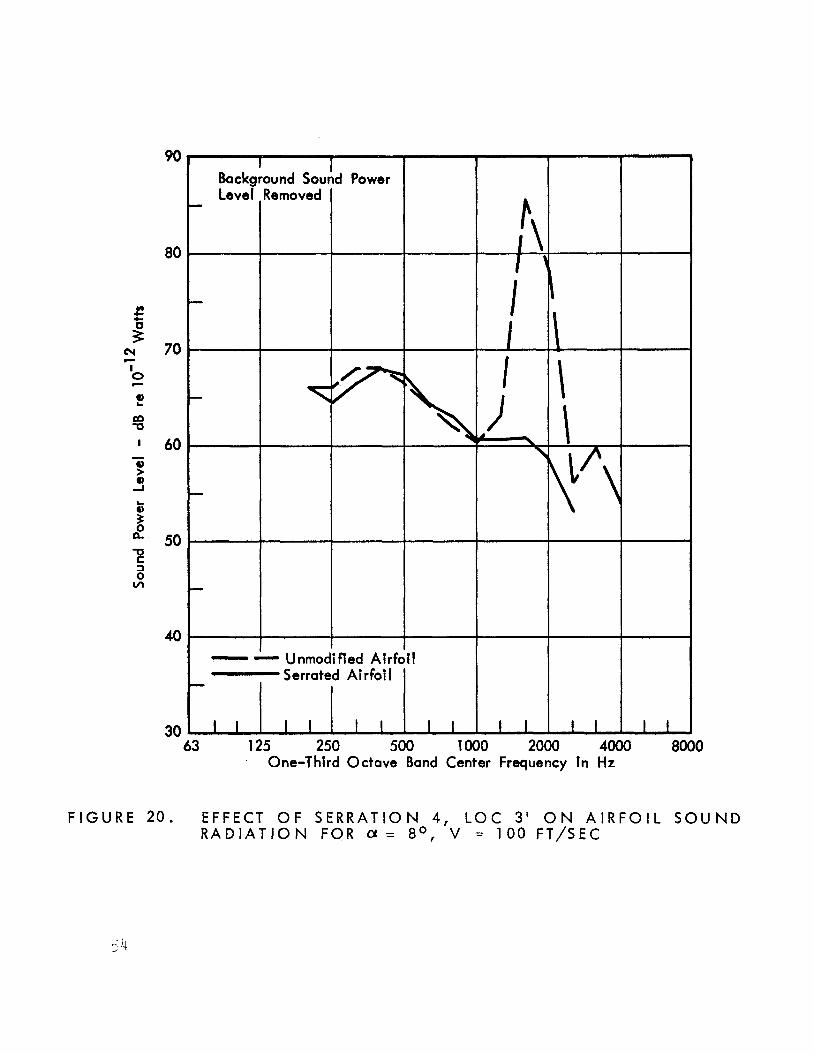
90
80
f s w 70 c I 0 c
t! m
I 60 0 > 0
ti
50 'CI C
VI 0'
40
30
-- Unmodified Airf<
63 125 250 500 lo00 2000 4000 8000 One-Third Octave Band Center Frequency in Hz
F I G U R E 2 0 . EFFECT OF S E R R A T I O N 4 , L O C 3 ' O N A I R F O I L S O U N D R A D I A T I O N FOR a = 8 0 , v = 100 F T / S E C
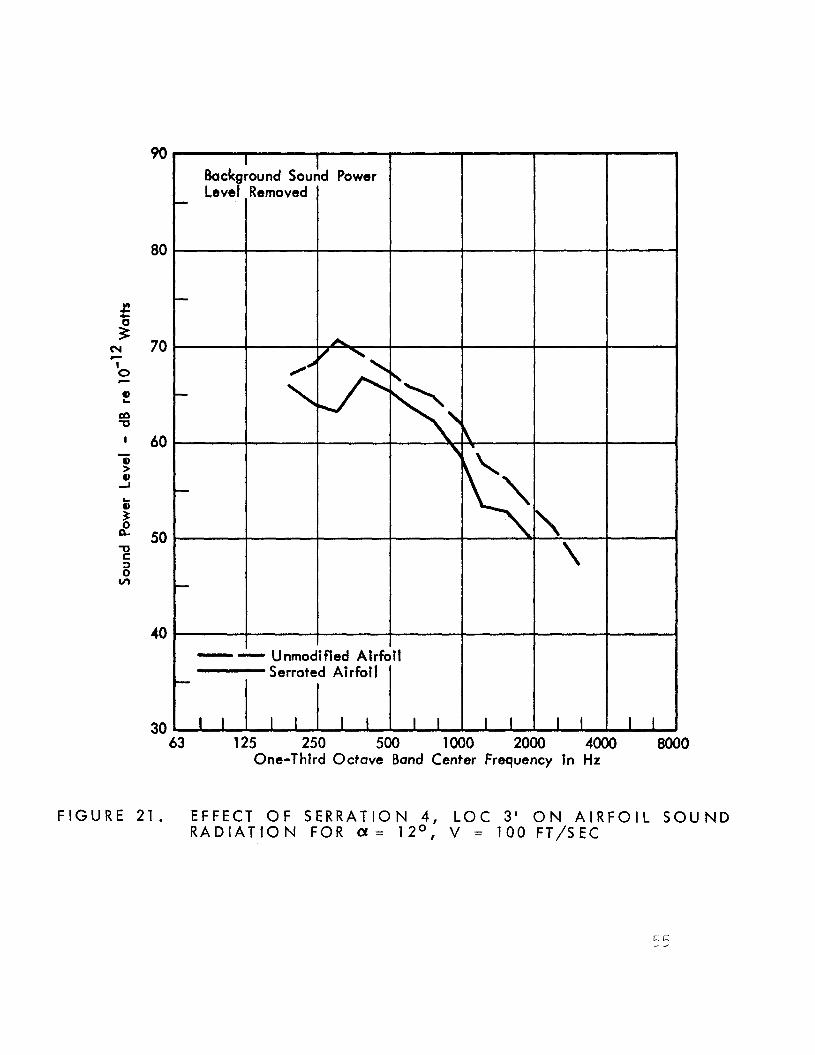
80
70
60
50
40
30 63 125 250 500 1000 2000 4000 8000
One-Third Octave Band Center Frequency in Hz
F I G U R E 2 1 . EFFECT OF S E R R A T I O N 4 , L O C 3 ' O N A I R F O I L S O U N D R A D I A T I O N FOR C Y = 1 2 O , V = 100 FT/SEC
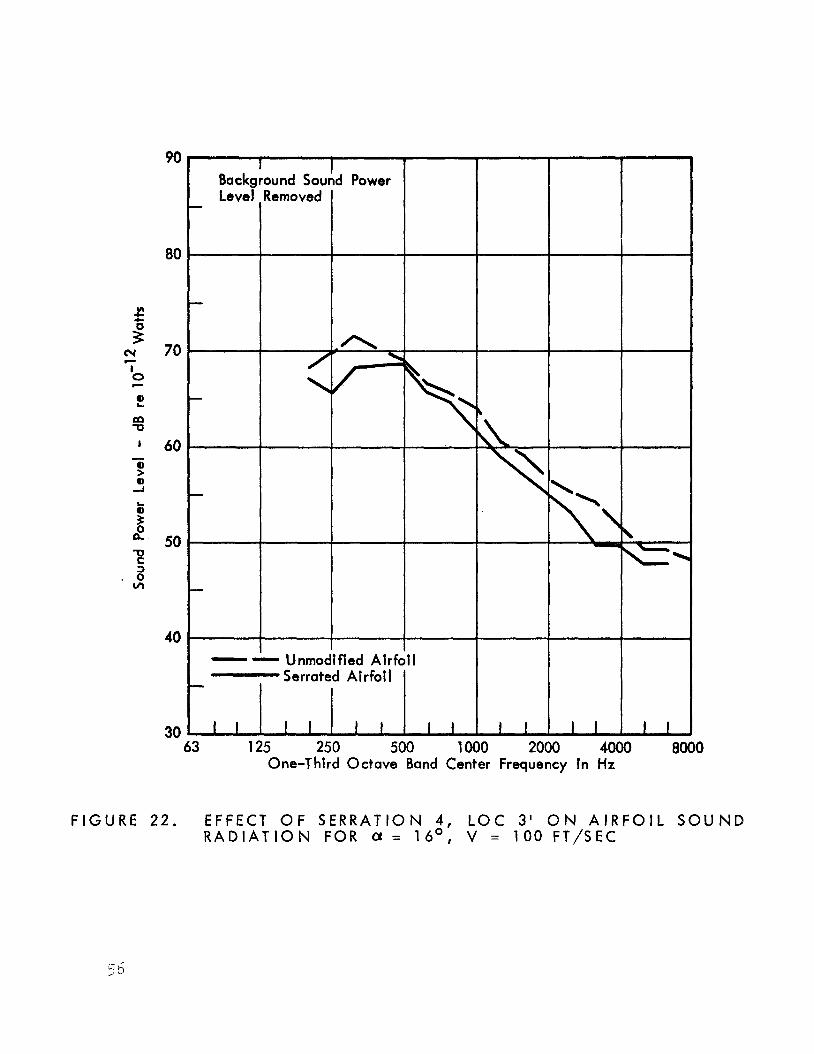
90
80
70
60
50
40
30 63 125 250 500 1000 2000 4000 8000
One-Thlrd Octave Band Center Frequency fn Hz
F I G U R E 22. EFFECT O F S E R R A T I O N 4 , L O C 3 ' O N A I R F O I L S O U N D R A D I A T I O N F O R a = 1 6 O , V = 100 FT/SEC
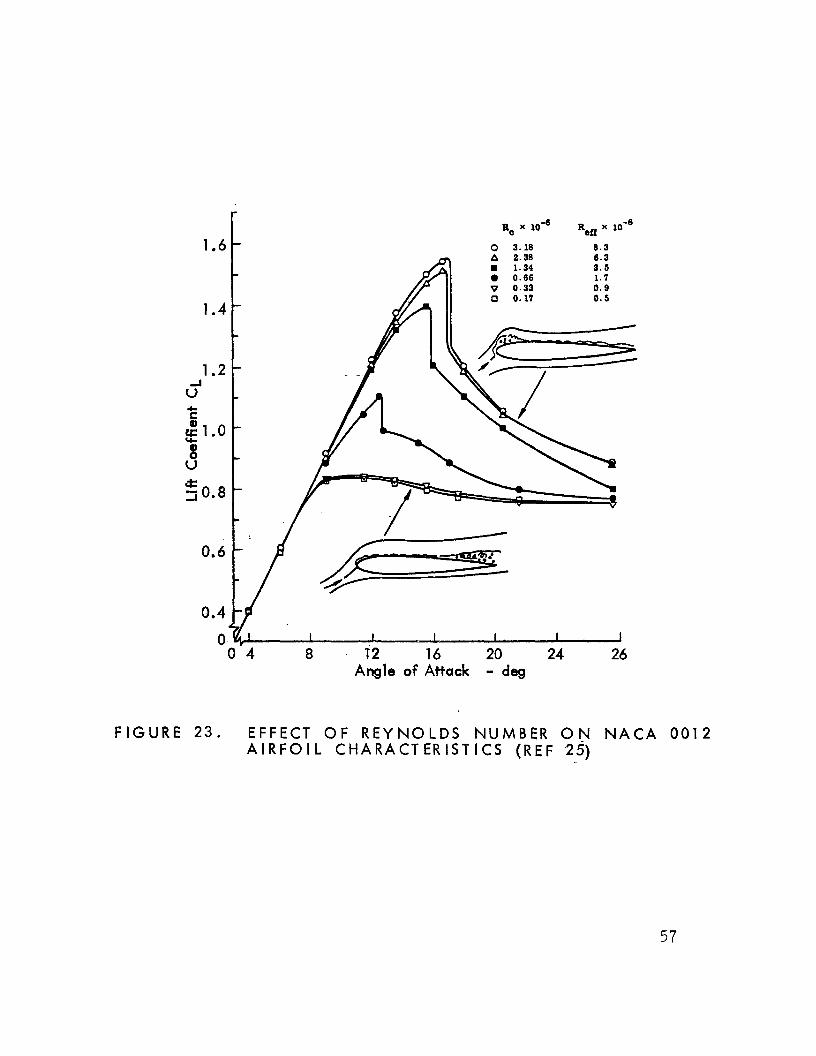
Rc x 10" Iteu x io-' 0 3.18 8.3 A 2.38 8.3 m 1.34 3.5
1.7 0.9
0 0.17 0.5
1.6 F
1 I I I I 1 0 4 8 1'2 16 20 24 26
Angle of Attack - deg
FIGURE 2 3 . EFFECT O F R E Y N O L D S NUMBER O N N A C A 0 0 1 2 A I R F O I L C H A R A C T E R I S T I C S ( R E F 25)
57
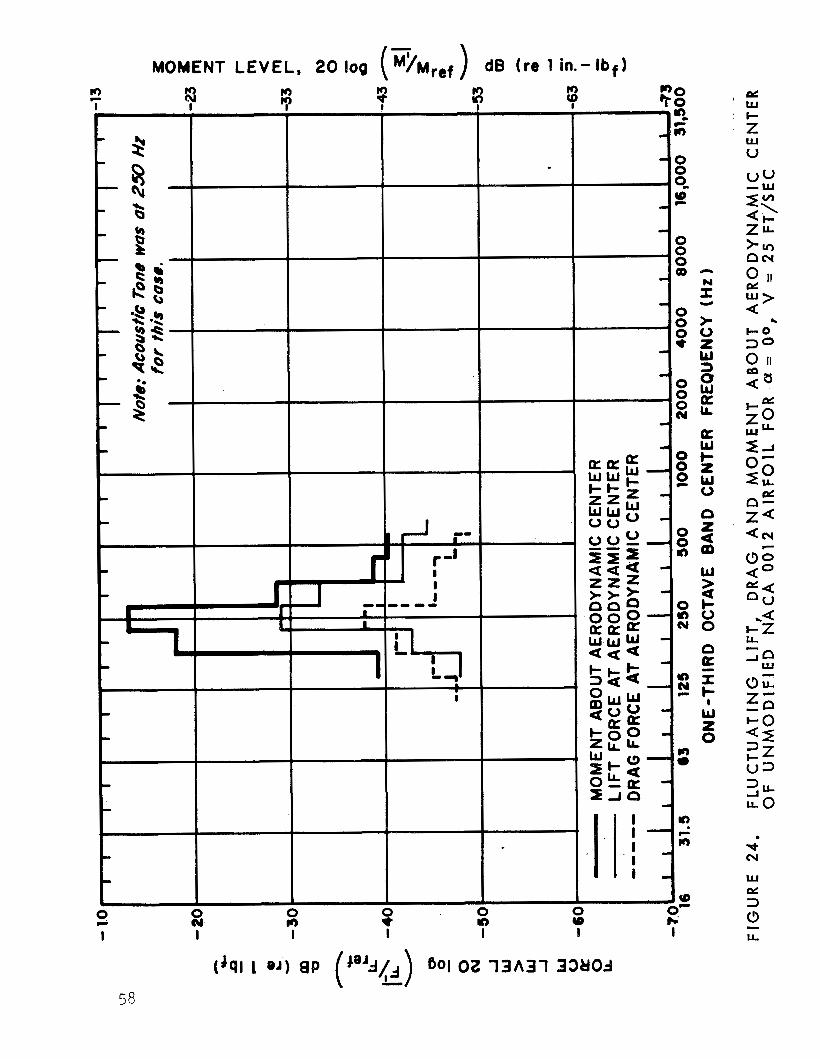
MOMENT LEVEL, 20 log (Fh,cf) dB (re 1 in . - Ib f ) : e
Z
V
w I-
w
58
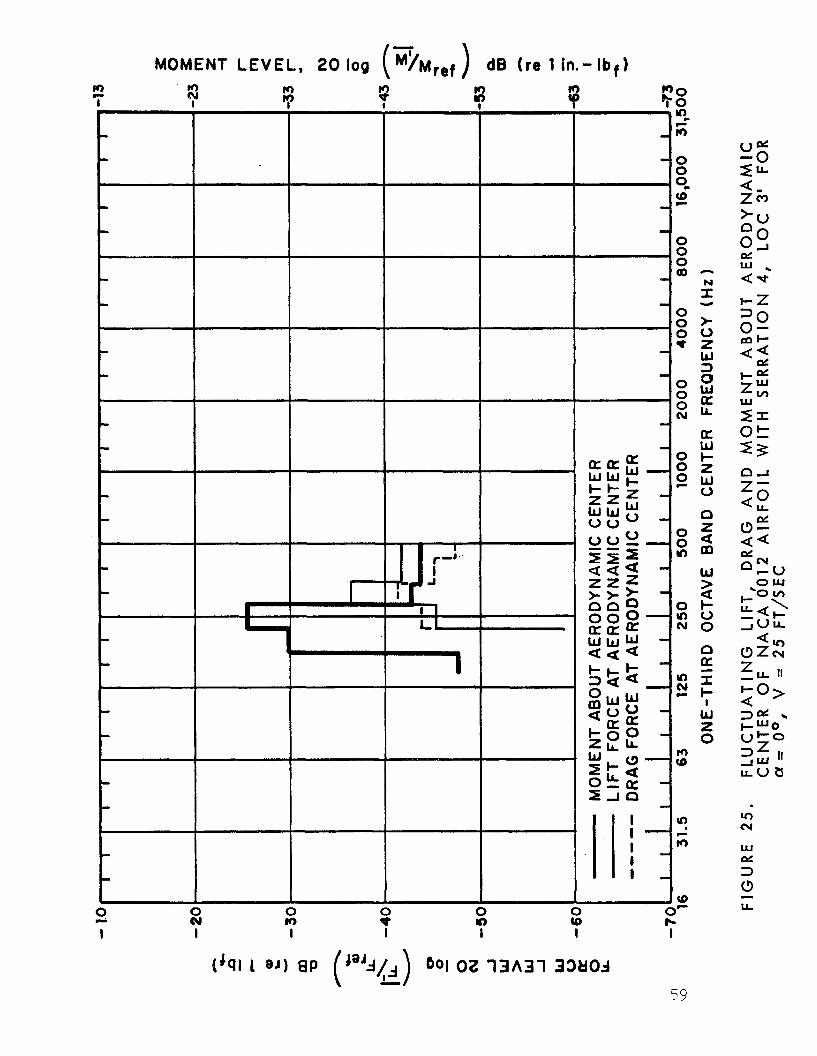
MOMENT LEVEL, 20 log (%Mref) d 6 (re 1 in . - Ib f )
0 0 0 0 0 0- (u IQ 4 n (0 )c
0
I I I I I I I c
( I S 1 1 81) 8 P (4aJA,'d) 601 02 13h31 33klOd - 59
n N I Y
). e, z W 3 0 W
a w
W > Qc
0
I I-
a - I
Wo" -0
o"
!gi o" " Z "
W & 3 (3 - LL
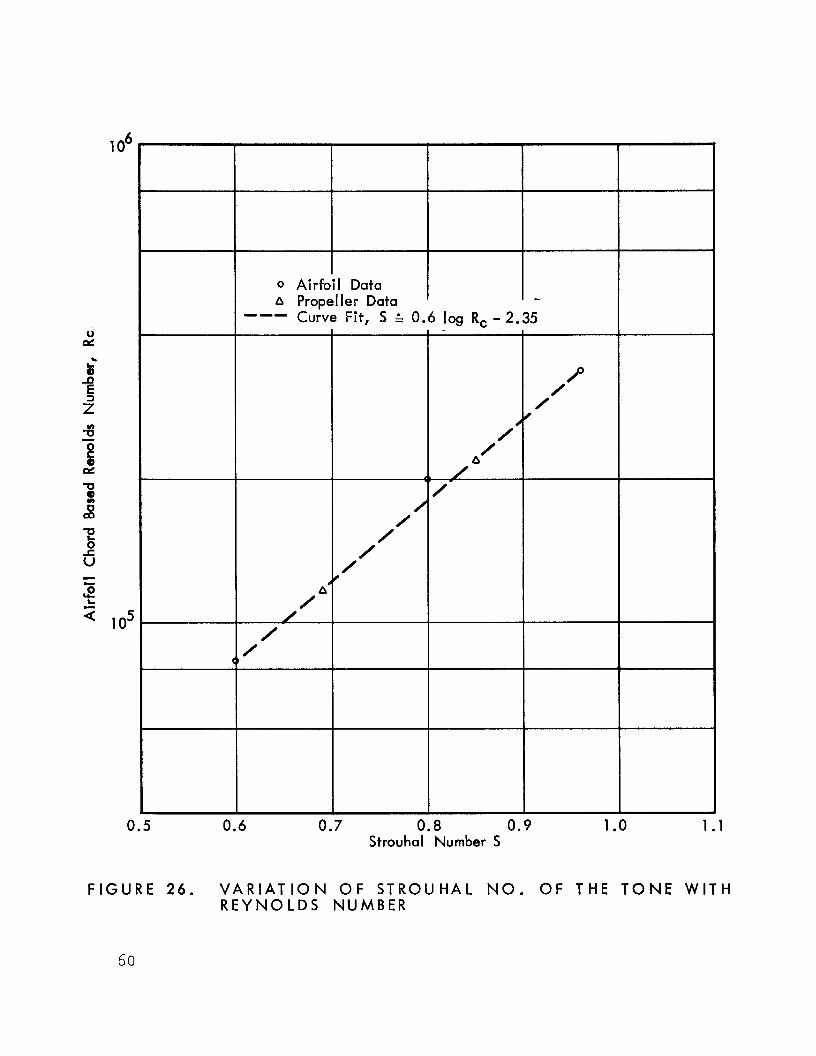
0.5 0.6 0.7 0.8 0 .9 Strouhal Number S
1 .o 1
F I G U R E 2 6 . V A R I A T I O N OF S T R O U H A L NO. OF T H E TONE W I T H R E Y N O L D S NUMBER
60
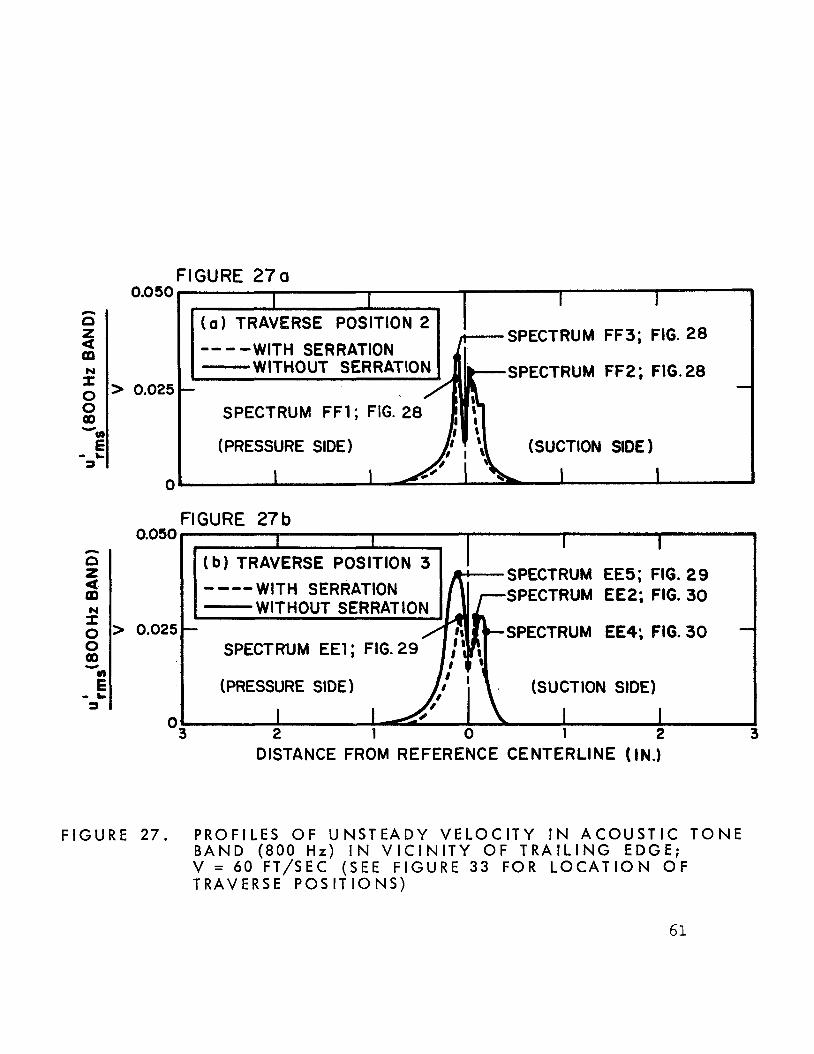
FIGURE 270
n
n a m 2
E
z
0 0 a0 Y
- L a
n P z d m r N
0 0 QD Y
2 - L a
> 0.025
0.050
> 0.025
0
0.050 FIGURE 27b
0
I I I I I
SPECTRUM FF3; FIG. 28
SPECTRUM FF2; FIG. 28 WITHOUT SERRATION WITH SERRATION
(SUCTION SlOE 1
- SPECTRUM FF1; FIG. 28
(PRESSURE SIDE)
I 1 I I
FIGURE 2 7 . PROFILES OF U N S T E A D Y V E L O C I T Y I N A C O U S T I C TONE B A N D (800 H z ) I N V I C I N I T Y OF T R A I L I N G EDGE; V = 60 FT/SEC ( S E E FIGURE 3 3 FOR L O C A T I O N OF TRAVERSE POSITIONS)
61
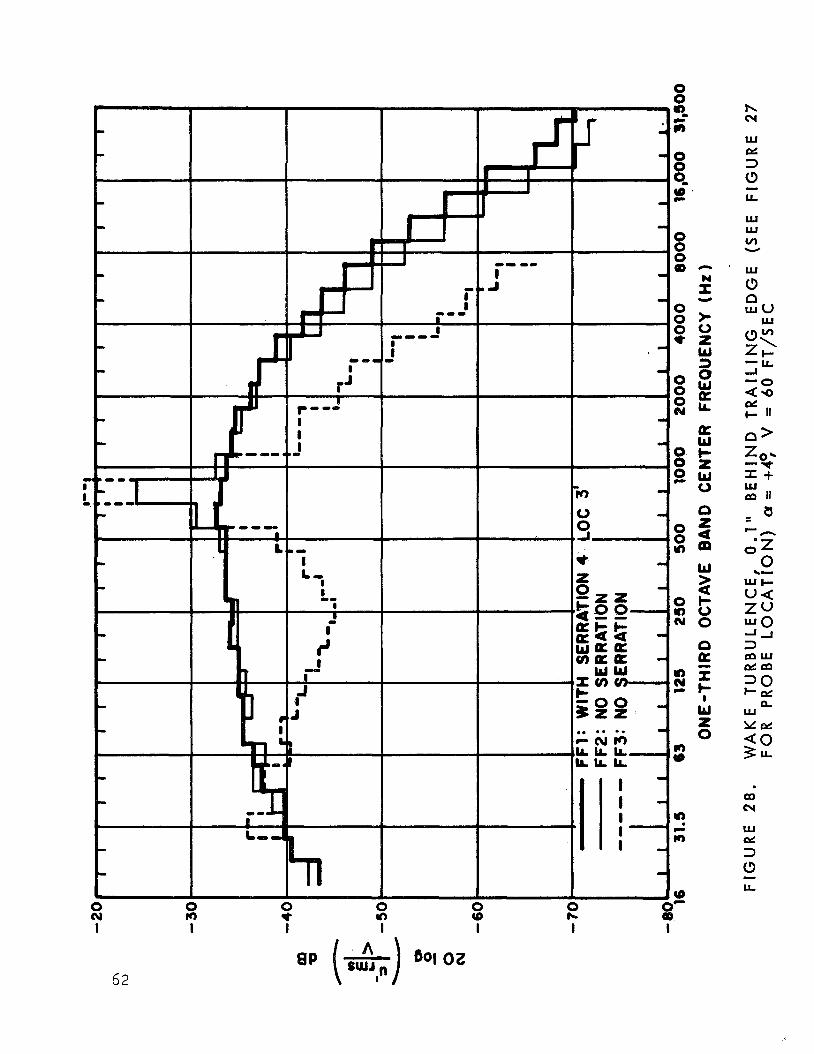
I I
62
I I I
9P m o z
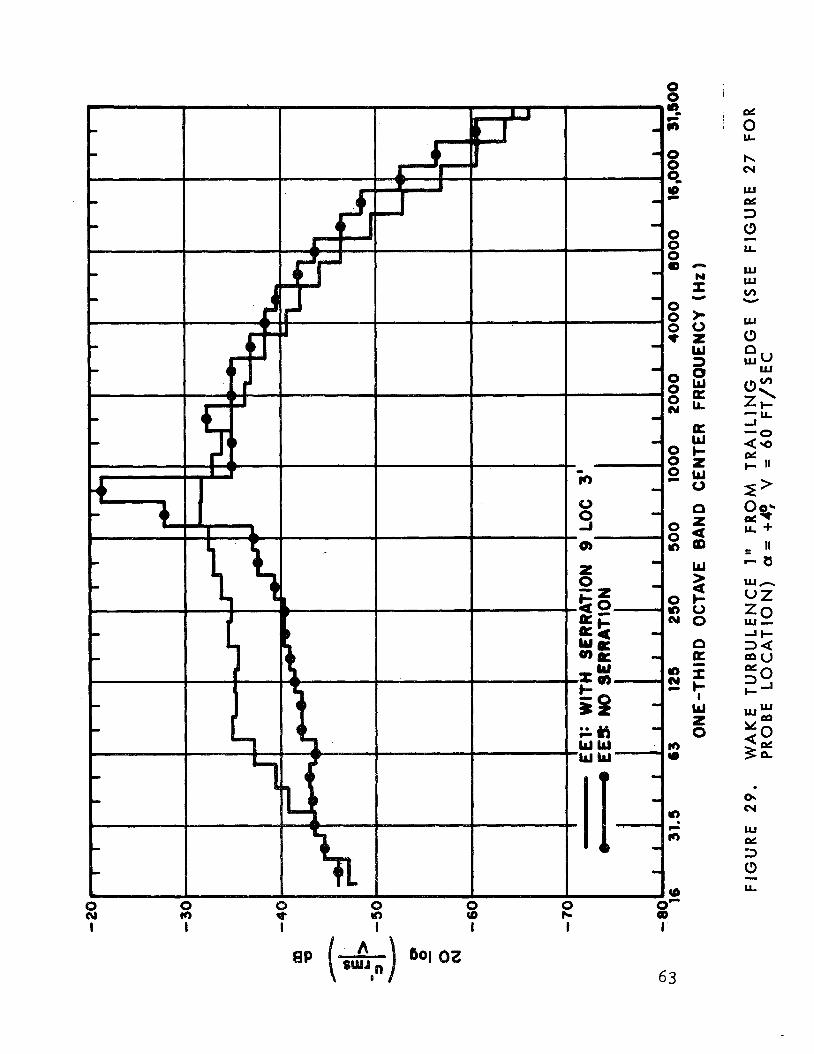
8
I I I I I I I'
63
I
W W
n N I v)
U Y
L =0 0 W-
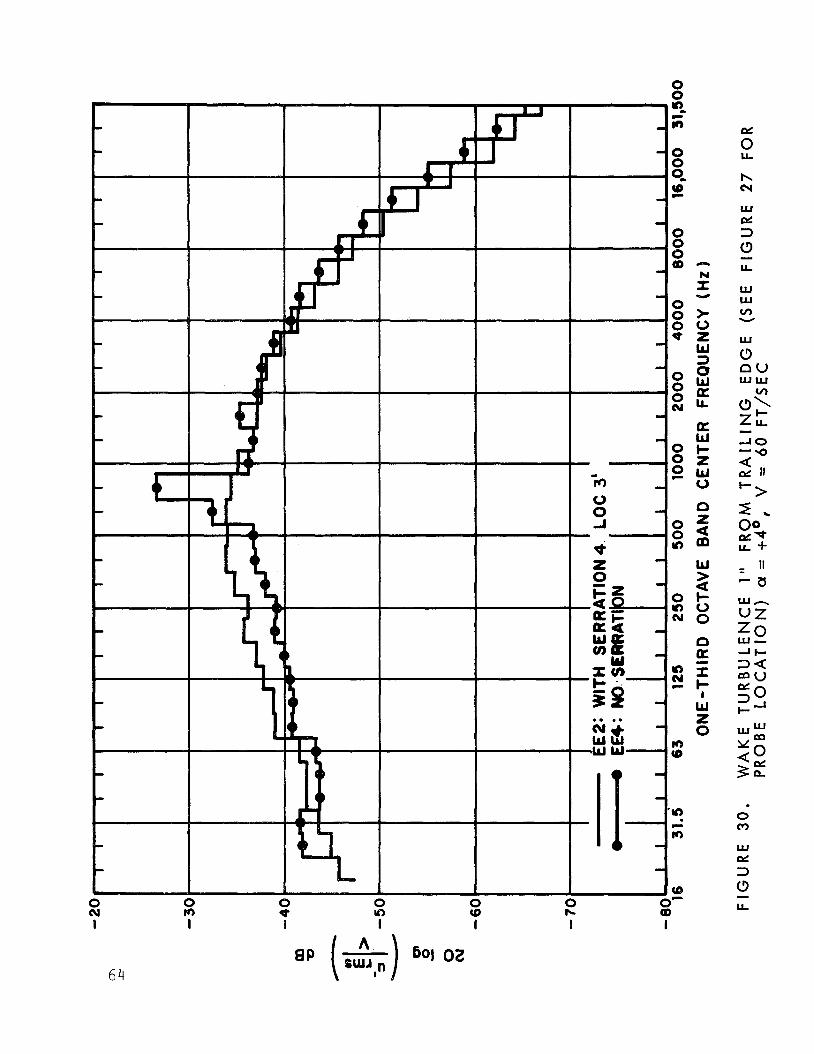
&
U
h cy
W &
0
3 (3 - LL
W W v) W
w (3 nu W U
m
n N I Y
w > I- o 0
a
P a - r I- W
I
64
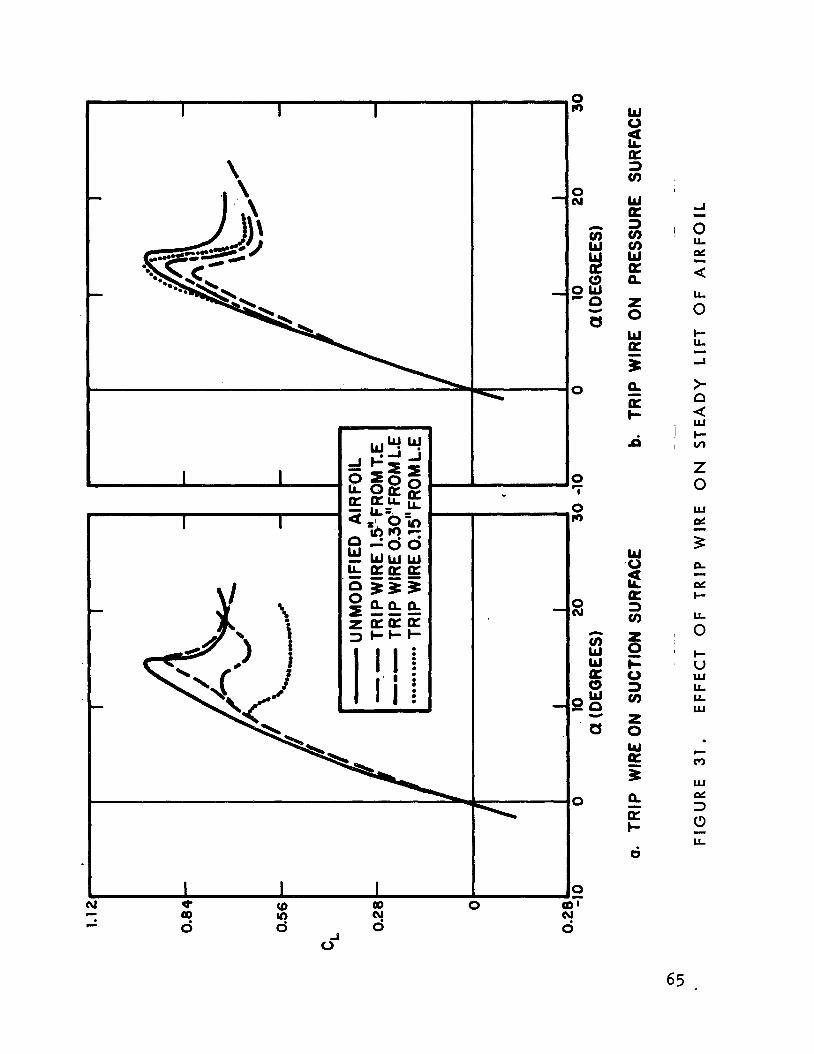
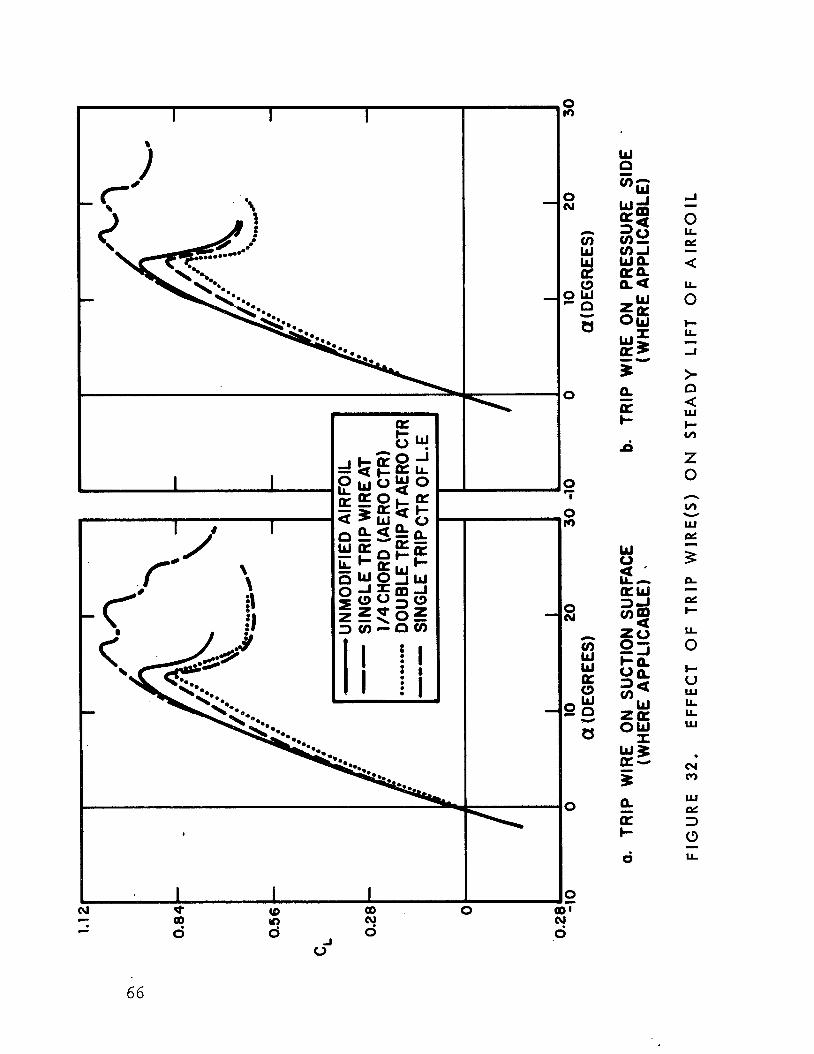
I I I
I J I
0 rr)
A
v) w w (3 o w -a U
a
Y
0
0 * I
3
6 6
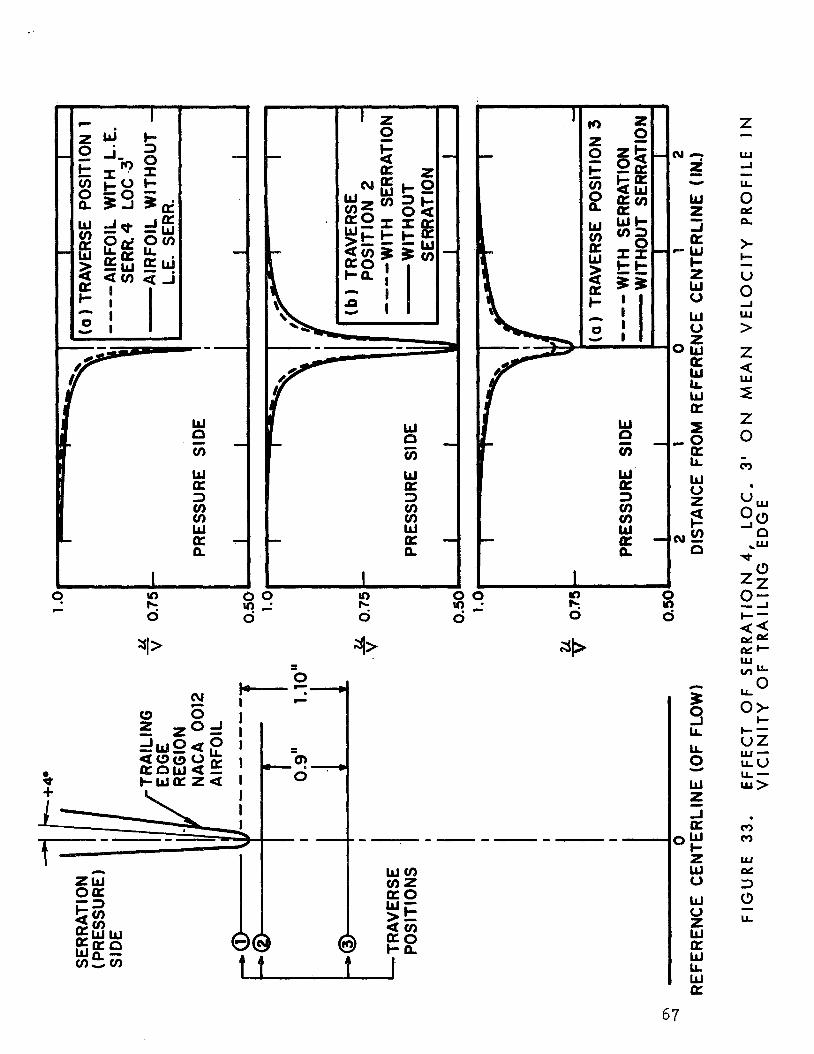
I
0
aI>
c
w v)
w K 3 v) v) w a - n
N ? z .I
Y
I F O
U LL W 0 z
NE Q
O>
67
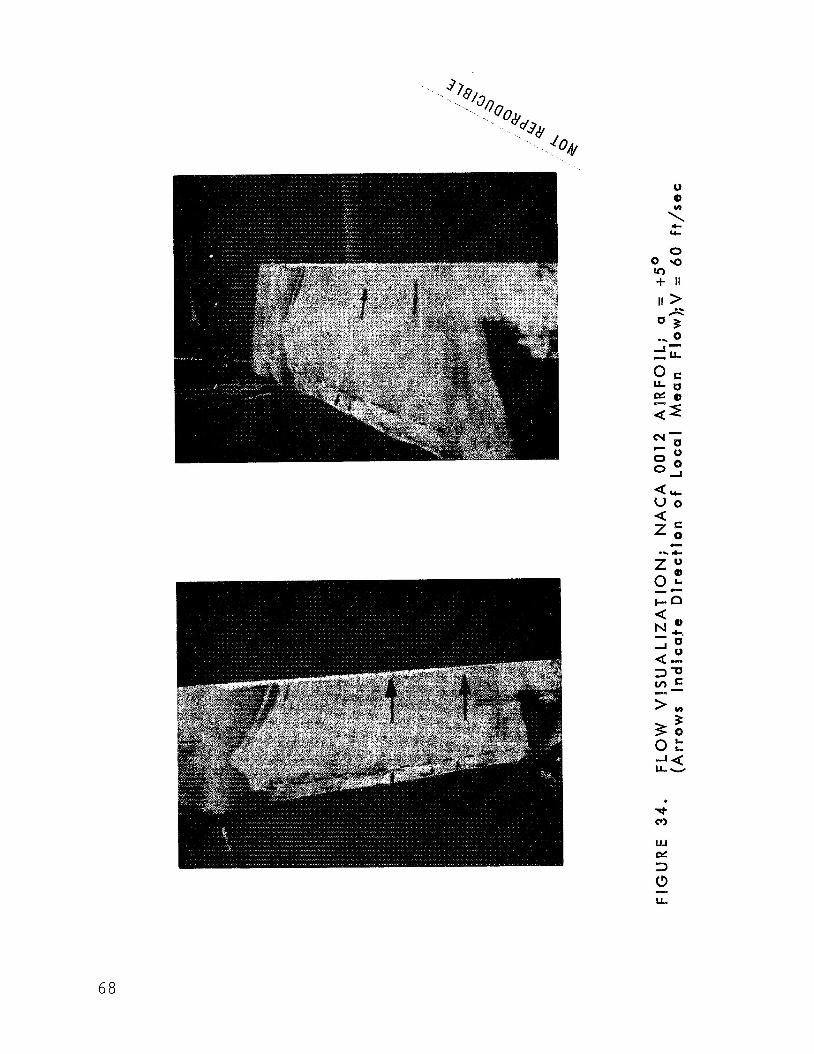
-
68
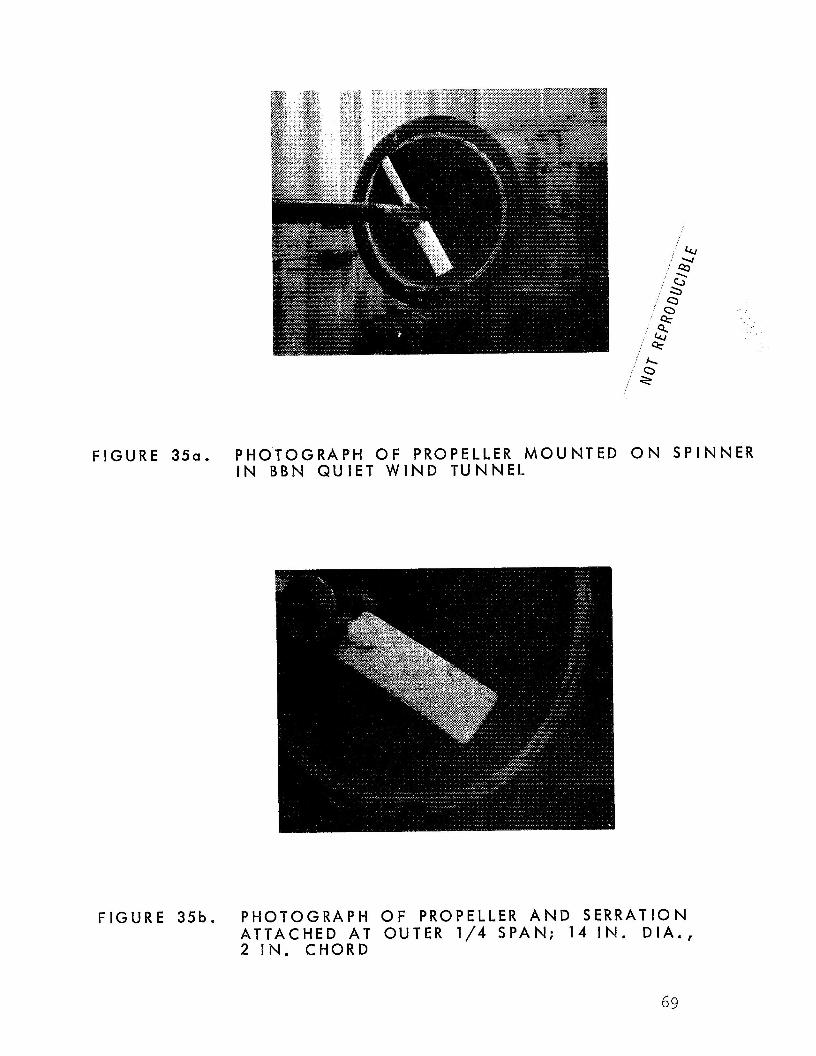
FIGURE 3 5 a . PHOTOGRAPH OF PROPELLER MOUNTED O N S P I N N E R IN B B N QUIET W I N D TUNNEL
FIGURE 35b. PHOTOGRAPH OF PROPELLER A N D SERRATION ATTACHED AT OUTER 1/4 SPAN; 14 IN . D I A . , 2 IN. CHORD
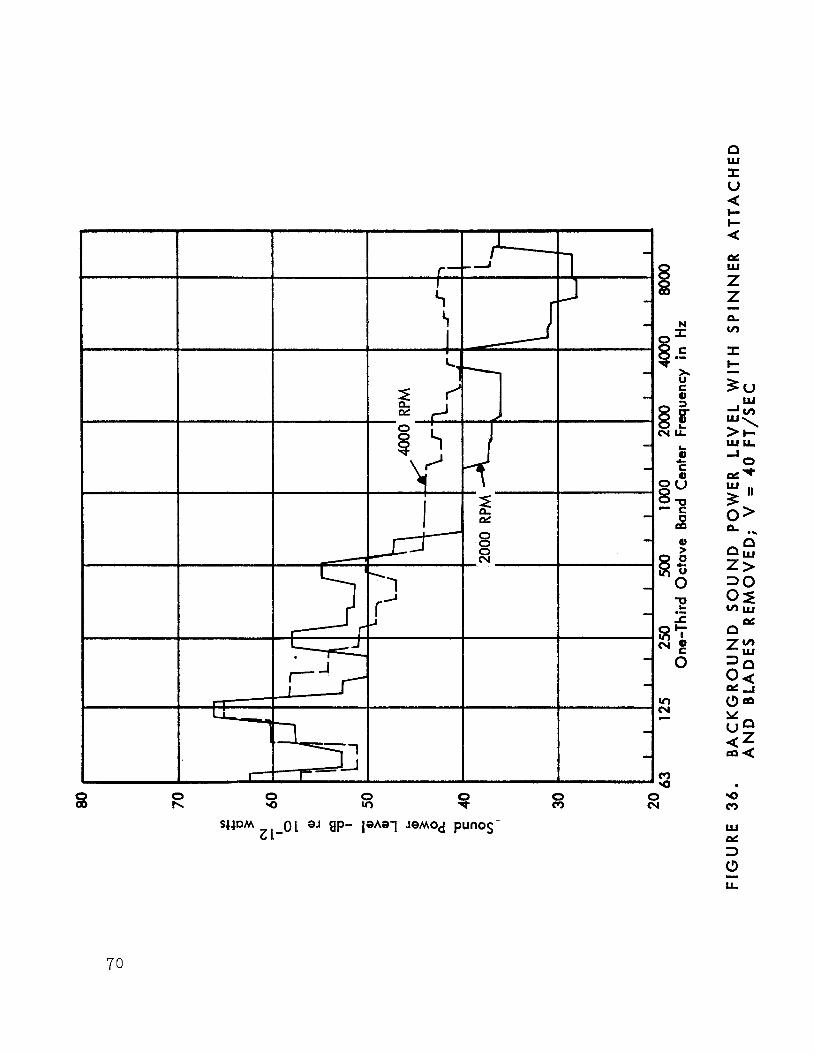
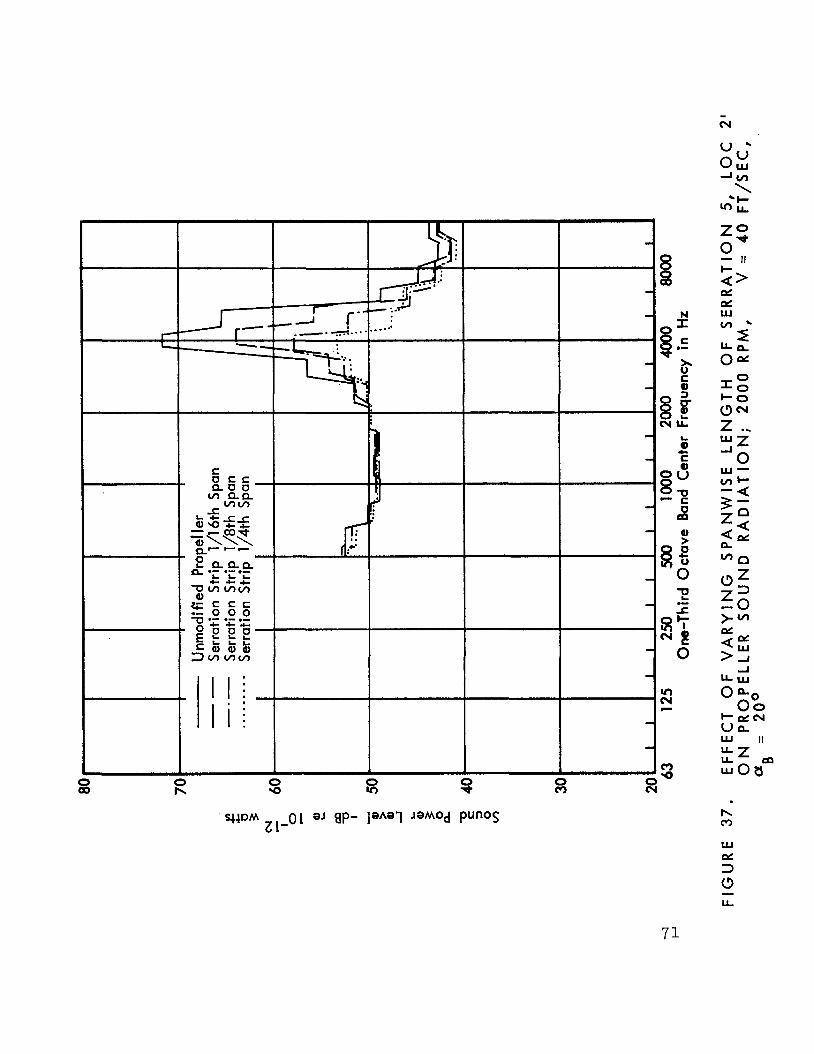
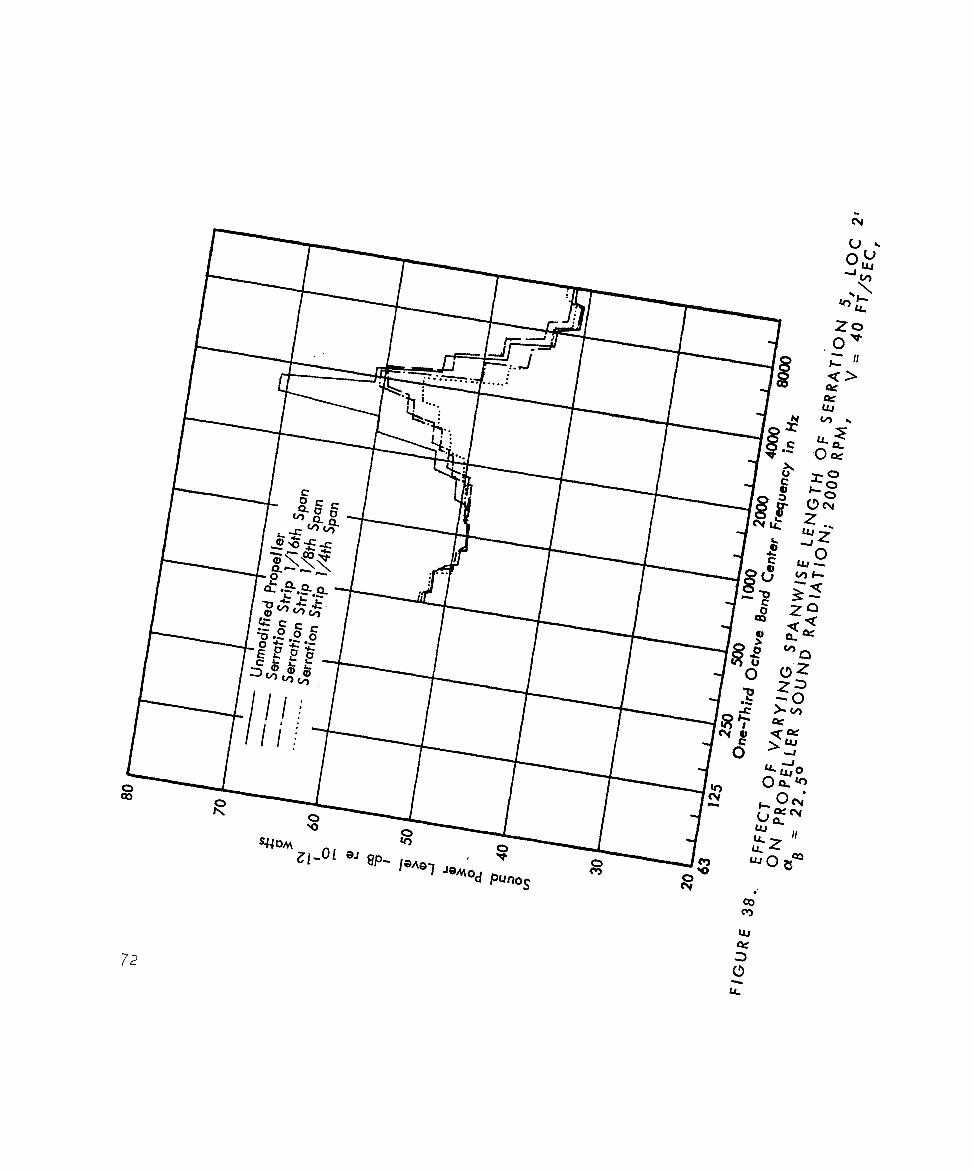
72
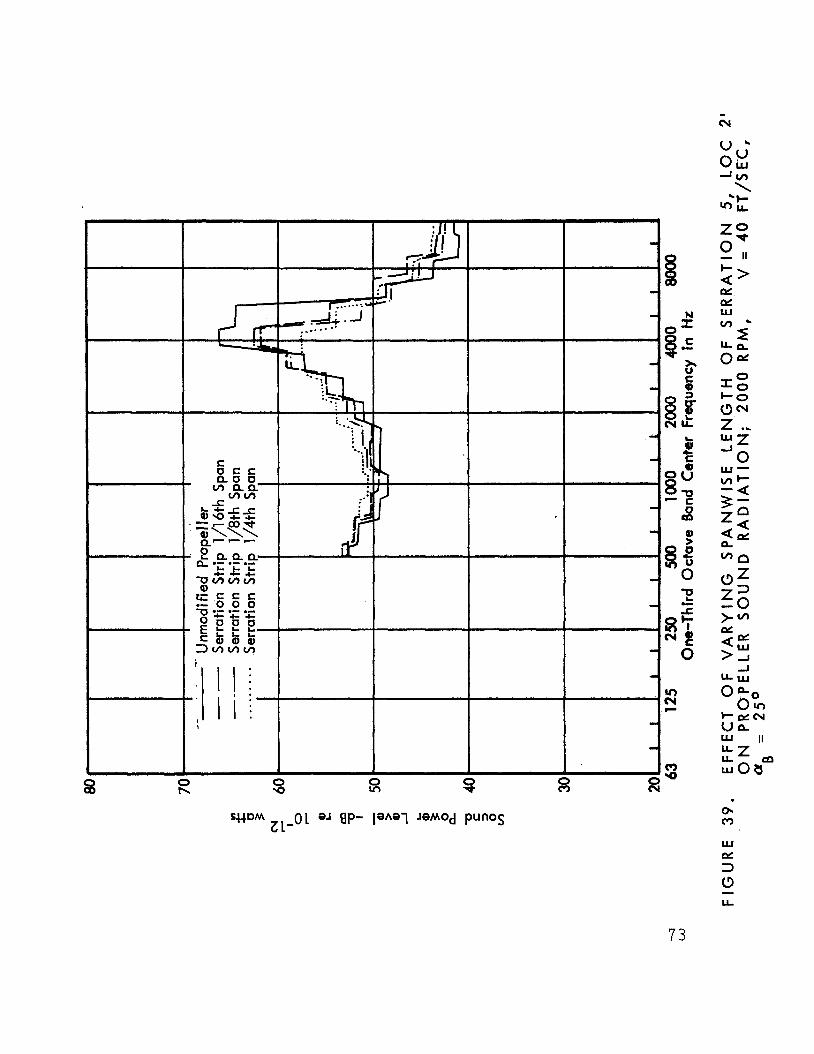
73
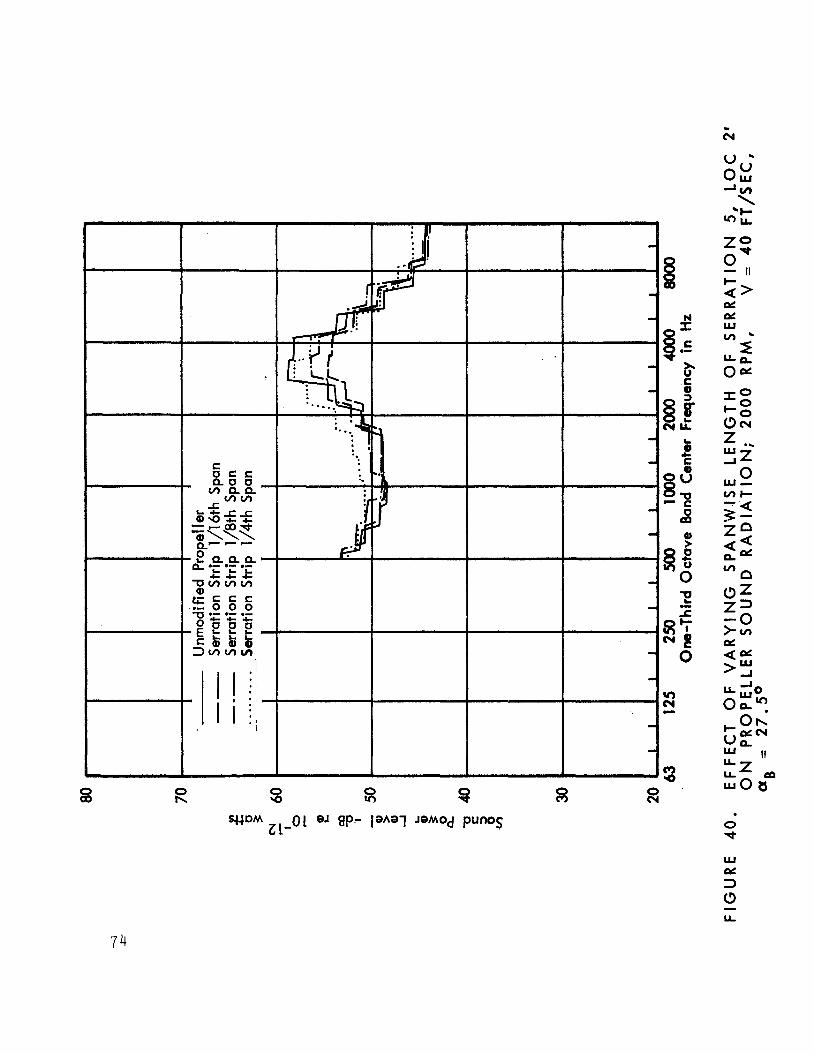
74
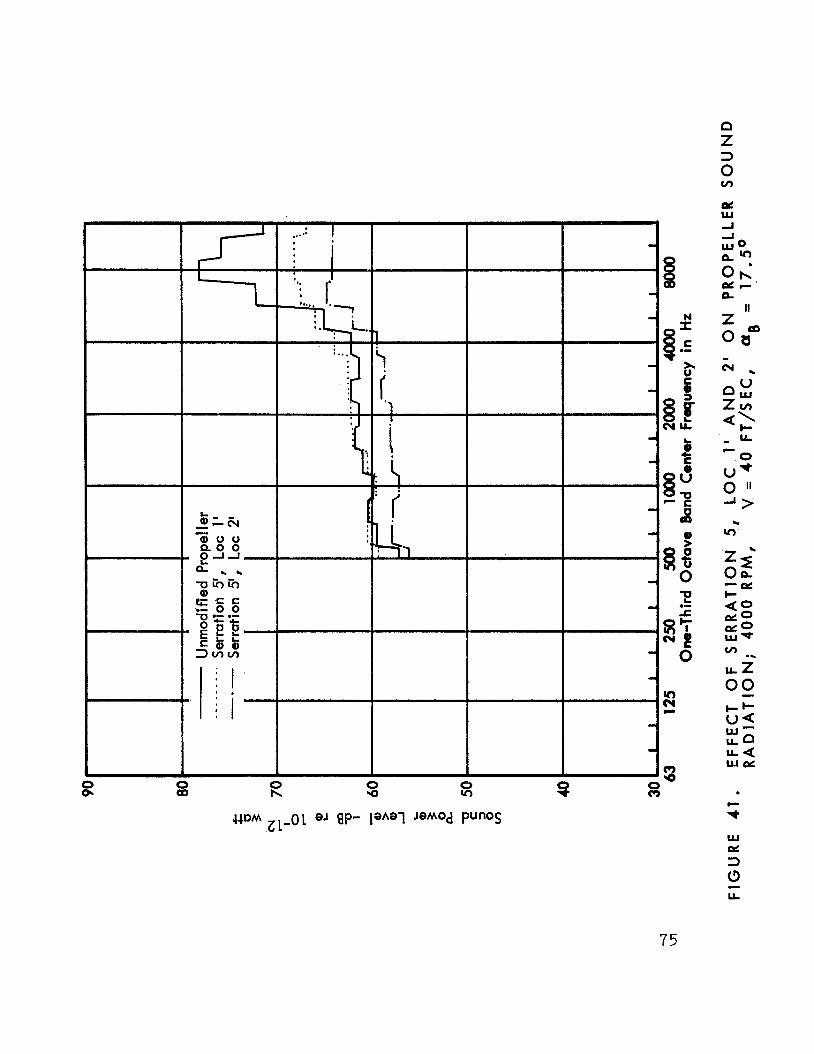
75
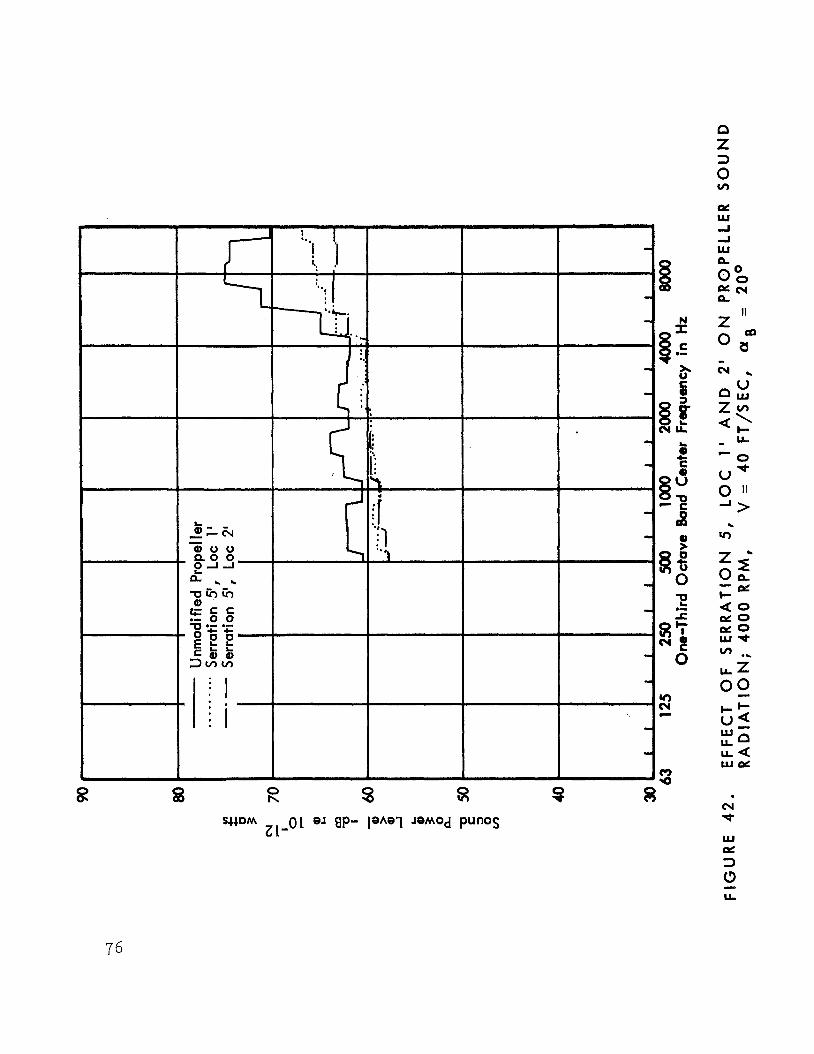
8
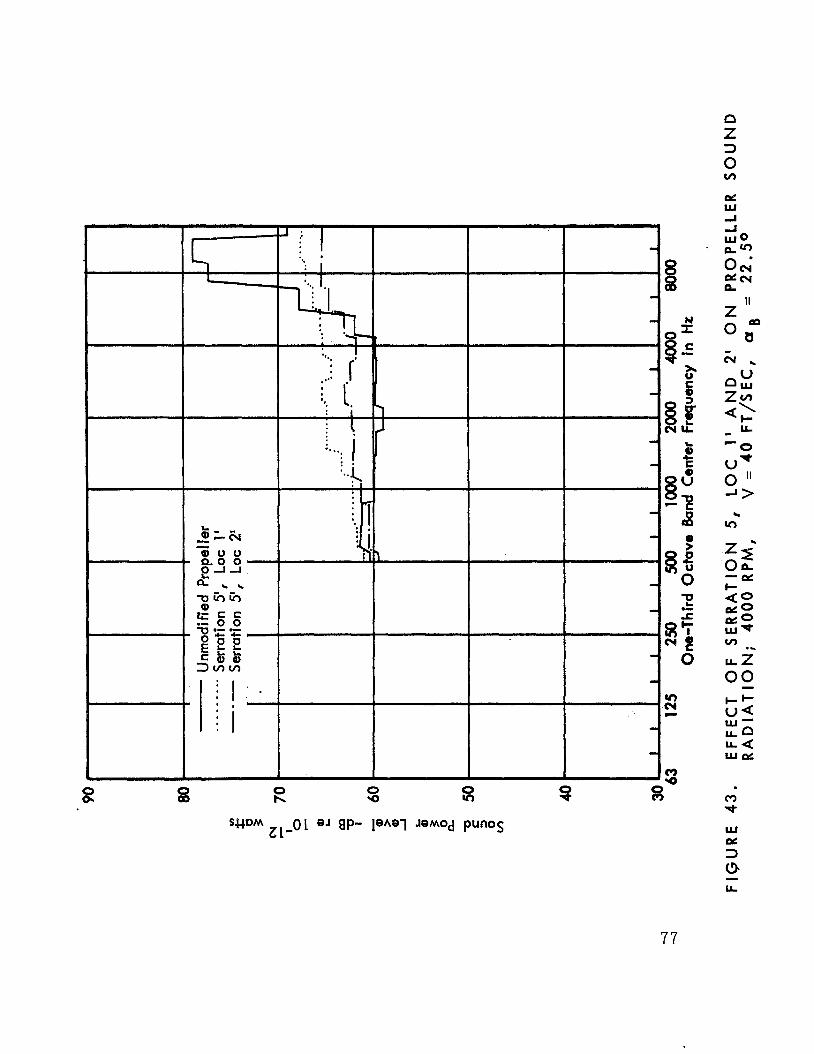
8
77
APPENDIX A
CCtA F R E E - J E T A i l E C I I O I C F A C I L I T Y
The UCLA f a c i l i t y , ' w h ~ c h . ~ s . - d e S i g n e d t o :gtudy jet n o i s e , c o n s i s t s of a small subsonic j e t exhaus t ing i n t o an anechoic room. A planview of t h e UCLA free-jet f a c i l i t y i s shown i n F ig . A-1. The a i r f l o w i s passed khrough a water sepa- r a t o r t o remove p o s s i b l e condensed l i q u i d . Upon e x i t i n g the water separator, t he a i r f l o w e n t e r s a 20-ft muff le r used t o remove any extraneous n o i s e s produced by t h e var ious sys t em c o n t r o l va lves . The flow t h e n e n t e r s the 1-1/2-9n. diameter p ipe which i s o r i e n t e d p a r a l l e l t o and 5-f t above the f l o o r of t h e tes t room. The t e s t chamber has mean dimensions of 21 - f t long by 22-ft wide by 9- f t 6 i n . high.
One of t h e f irst tasks undertaken i n c a l i b r a t i n g t h e UCLA f a c i l i t y Was t o determine t h e frequency response range of the f a c i l i t y . To accomplish t h i s , we placed a broadband monopole sound source a t t h e nozzle e x i t and recorded the decay i n sound p r e s s u r e l eve l (SPL) i n oc tave bands against d i s t a n c e from the source. We cons t ruc t ed t h e source by a t t a c h i n g a 1-ft long cardboard tube t o a Stromberg-Carlson d r i v e r . S ince the diameter of t he tube was 1 /2 i n . , the soLind appeared as monopole a t f requencies below 22,000 kHz .
The r e s u l t s o f t h e tes ts are shown i n F i g s . A-2 and A-3. Experimental po in ts are presented f o r only t h e 1 kHz and 1 6 kHz f requencies - - resu l t s f o r f r equenc ie s in te rmedia te between these are comparable. Figure A-2 r ep resen t s data t aken along the j e t a x i s . Figure A-3 r e p r e s e n t s data taken a t a 4 5 O ang le from t h e j e t a x i s . I n both cases t h e data i n d i c a t e that the room is anechoic a3 these f requencies . A t h i r d s e t o f drta taken i n a v e r t i c a l d i r e c t i o n from the source t o t h e f l o o r a l s o showed a 6-d3 loss per double d i s t a n c e . Thus, the data i n d i c a t e t h a t t h e room i s s u f f i - c i e n t l y anechoic f o r o u r pu rposes .
To conduct t h e d i r e c t i v i t y experiments, w e mounted a self-powered microphone boom, which r o t a t e s a t a ra te of 4.5 degrees per second, on a Bruel and Kjaer ( B & K ) Type 3921 tu rn tab le . This arrangement provides f o r continuous no i se l e v e l measurements from 10 t o 165 degrees r e l a t i v e to t h e j e t exhaust ax is .
A 1/2-in. B & K Type 4133 condenser microphone, covered w i t h a n Electrovoice windscreen, was used t o t r a v e r s e t h e r a d i a t i o n f i e l d along the microphone pa th . The ou tpu t
78
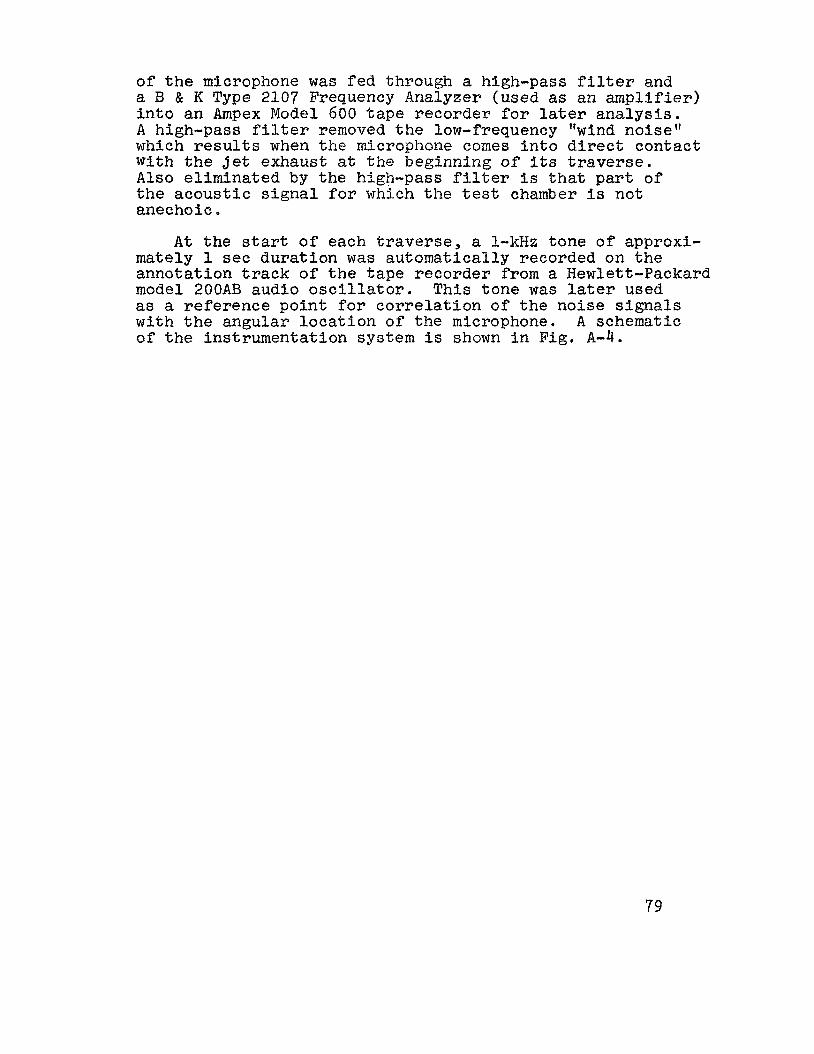
of t h e microphone was fed through a high-pass f i l t e r and a €3 & K Type 2107 Frequency Analyzer (used as an amplifier) i n t o an Ampex Model 600 tape recorder f o r later a n a l y s i s . A high-pass f i l t e r removed the low-frequency "wind noise" which r e s u l t s when the microphone comes i n t o d i r e c t contact with t h e Je t exhaust at t h e beginning of i t s t r a v e r s e . Also e l imina ted by t h e high-pass f i l t e r i s tha t part of the a c o u s t i c s i g n a l for which t h e t e s t chamber i s not anechoic.
A t t h e s ta r t of each t r a v e r s e , a 1-kHz tone of approxi- mately 1 s e c du ra t fon was automatical ly recorded on t h e annota t ion t r a c k of t h e t ape recorder from a Hewlett-Packard model 200AB audio o s c i l l a t o r . This tone was l a t e r used as a r e fe rence po in t f o r c o r r e l a t i o n of t h e noise s i g n a l s w i t h t h e angular l o c a t i o n of t h e microphone. A schematic of t h e ins t rumenta t ion system i s shown in Fig. A-4.
79
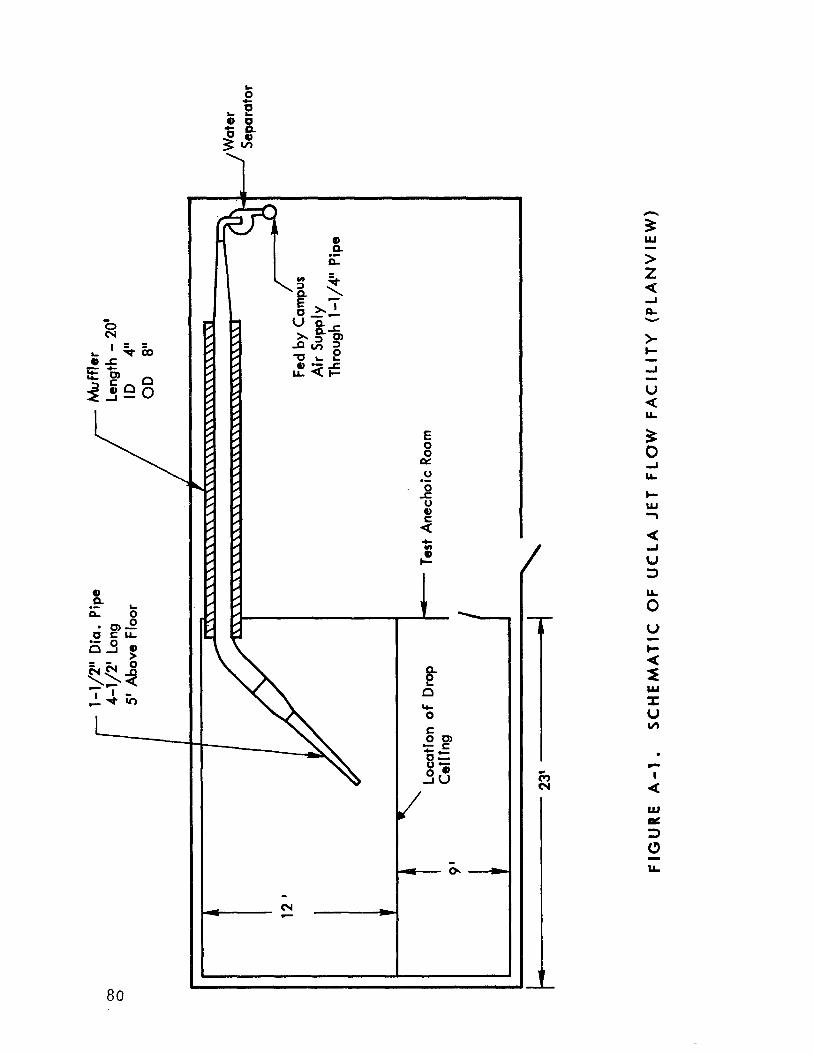
80
t-- -
/
-
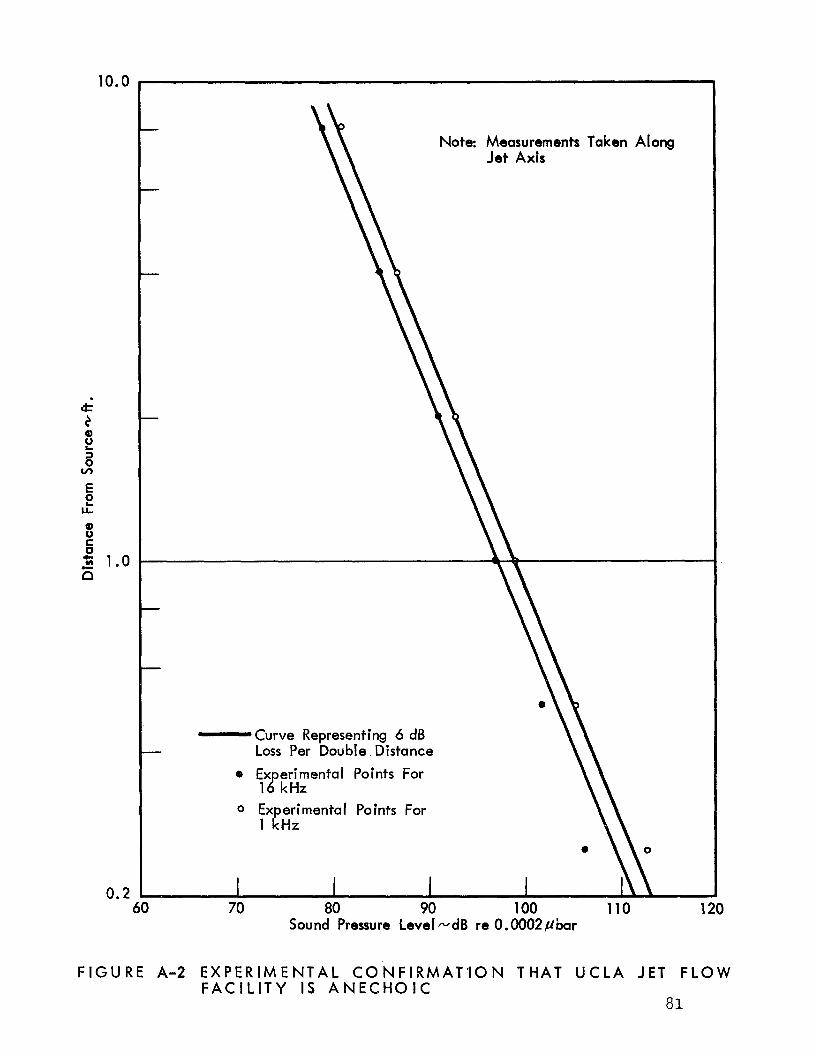
F I
- Curve Represei Loss Per Double Distance \ \
0 Ex erimentaf Points For lgkHz \\
0 Experimental Points For 1 kHz
AI ong
0.2 60
G U R E A-2
70 80 90 100 110 Sound Pressure Level -dB re 0.0002flbar
E X P E R I M E N T A L C O N F I R M A T I O N T H A T U C L A F A C I L I T Y IS A N E C H O I C
120
JET F L O W
81
70 80 90 100 110 1 20 Sound Pressure Level .vdB re 0.0002~bar
F I G U R E A-3 E X P E R I M E N T A L C O N F I R M A T I O N T H A T U C L A JET F L O W F A C I L I T Y IS A N E C H O I C
82
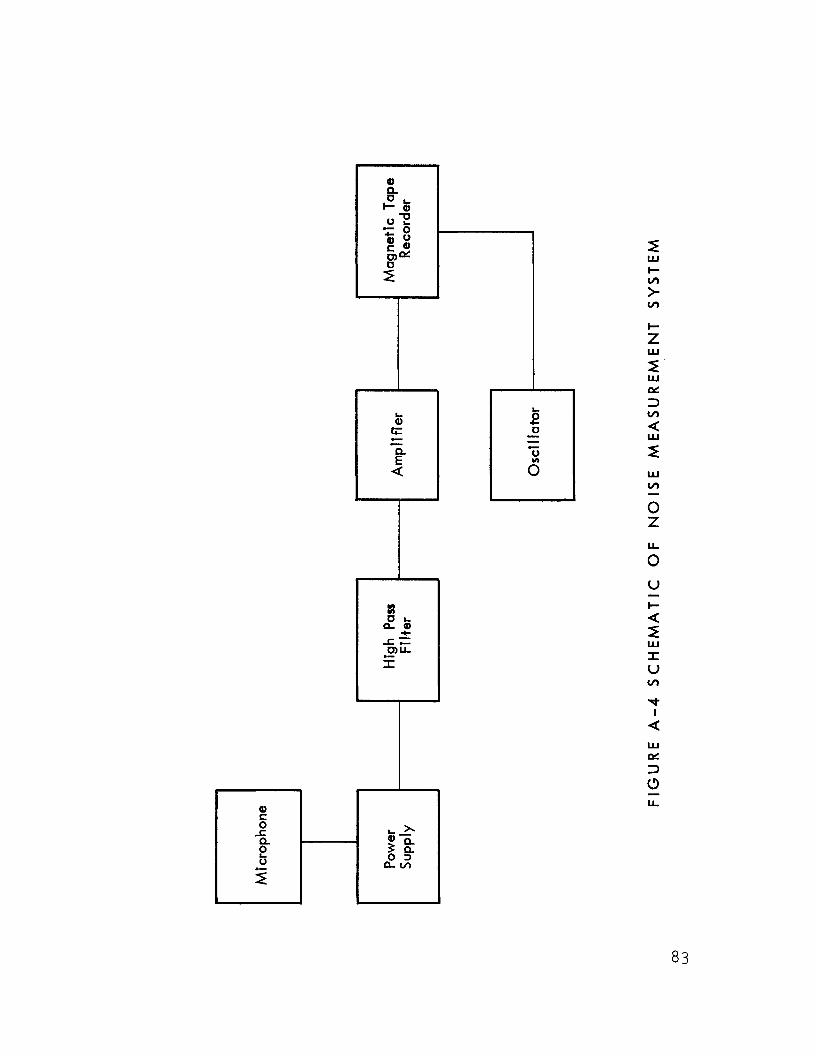
z W I- v)
v)
I-
W
>
Z z W
1
83
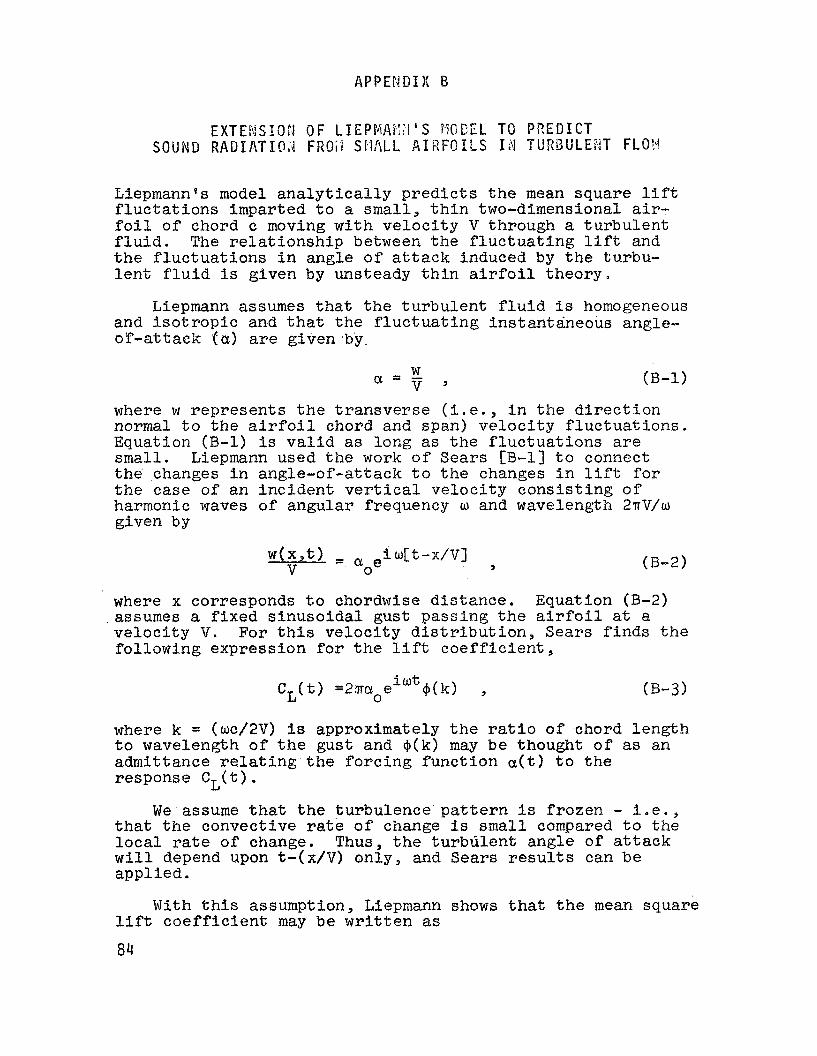
APPEPtDIX B
LiepmannPs model a n a l y t i c a l l y p r e d i c t s the mean square l i f t f l u c t a t i o n s imparted t o a small, t h i n two-dimensional a i r - f o i l o f chord c moving w i t h v e l o c i t y V through a tu rbu len t f l u i d . The r e l a t i o n s h i p between t h e f l u c t u a t i n g l i f t and t h e f l u c t u a t i o n s i n angle o f a t t a c k induced by t h e turbu- l e n t f l u i d i s given by unsteady t h i n a i r f o i l theory.
Liepmann assumes t h a t t h e tu rbu len t f l u i d i s homogeneous and i s o t r o p i c and t h a t t h e f l u c t u a t i n g instantaneous angle- or -a t tack ( a ) are given -by.
(B-1) W a = v ,
where w r ep resen t s t h e t r ansve r se ( i . e . , i n t he d i r e c t i o n normal t o t h e a i r f o i l chord and span} v e l o c i t y f l u c t u a t i o n s . Equation (B-1) i s v a l i d as long as the f l u c t u a t i o n s a r e small. Liepmann used t h e work of Sears CB-11 t o connect the changes i n angle-of-attack t o t h e changes i n lift f o r t h e case of an i n c i d e n t v e r t i c a l ve loc i ty cons i s t ing of harmonic waves of angular frequency w and wavelength 2.rrV/o given by
where x corresponds t o chordwise d i s t ance . Equation (B-2) assumes a f ixed s i n u s o i d a l gust passing t h e a i r f o i l a t a ve loc i ty V. For t h i s ve loc i ty d i s t r i b u t i o n , Sears f i n d s t he fol lowing expression f o r t h e l i f t c o e f f i c i e n t ,
where k = (wc/2V) i s approximately the r a t i o of chord l eng th t o wavelength of the gust and +(k) may be thought o f as an admittance r e l a t i n g t h e fo rc ing func t ion a ( t ) t o t h e response CL( t ) .
We assume that the turbulence p a t t e r n i s frozen - i . e . , t ha t t h e convective r a t e o f change is small. compared t o t h e l o c a l rate of change. Thus, t h e tu rbu len t angle of a t t a c k w i l l depend upon t-(x/V) only, and Sears r e s u l t s can be app l i ed .
With t h i s assumption, Liepmann shows that t h e mean square l i f t c o e f f i c i e n t may be w r i t t e n as
84
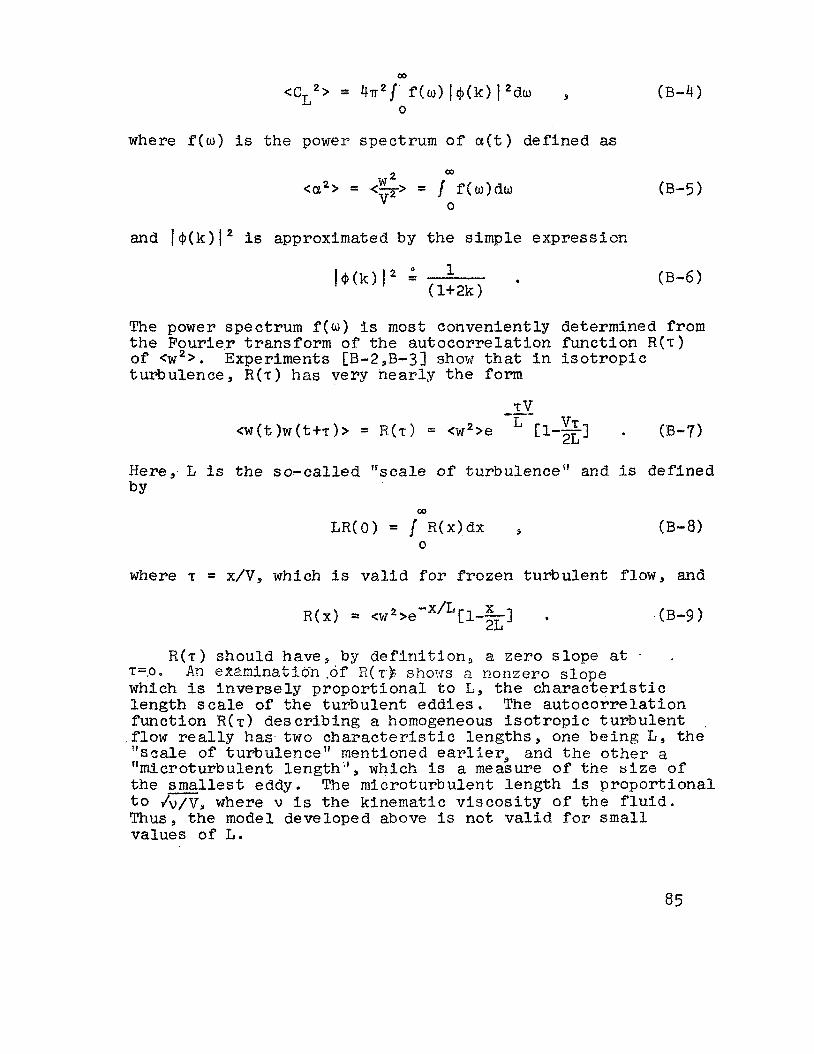
where f ( w ) i s the power spectrum of' a ( t ) def ined as
and 19(k)l2 is approximated by the simple express ion
The power spectrum f(w) i s most convenient ly determined from t h e Four i e r t r ans fo rm of t h e a u t o c o r r e l a t i o n func t ion R ( r ) of <w2>. Experiments [B-2,B-3] show t h a t i n i s o t r o p i c t,urbulence, R ( o ) has very n e a r l y t h e form
Here, L i s t h e so -ca l l ed " sca l e of tu rbu lence" and is def ined by
where T = x/V, which i s v a l i d f o r f rozen t u r b u l e n t flow, and
R ( T ) should have, by d e f i n i t i o n , a ze ro s l o p e at . F.O. An e22.minatio-n .of R ( T) shovs a nonzero s lope whfch i s i n v e r s e l y p r o p o r t i o n a l t o L , t h e c h a r a c t e r i s t i c l eng th scale of the t u r b u l e n t eddies The a u t o c o r r e l a t i o n func t ion R ( T ) d e s c r i b i n g a homogeneous i s o t r o p i c t u r b u l e n t .flow r e a l l y has two c h a r a c t e r i s t i c l e n g t h s , one b e i n g L , the "Scale of tu rbulence" mentioned earlier, and t h e o t h e r a "mfcroturbulent length" , which i s a measure of t n e s i z e of the - smallest eddy. t o v'v/V, where v i s the kinematic v i s c o s i t y of t h e f l u i d . Thus, the model developed above i s no t va l id f o r small values of L.
The micro turbulen t l eng th i s p r o p o r t i o n a l
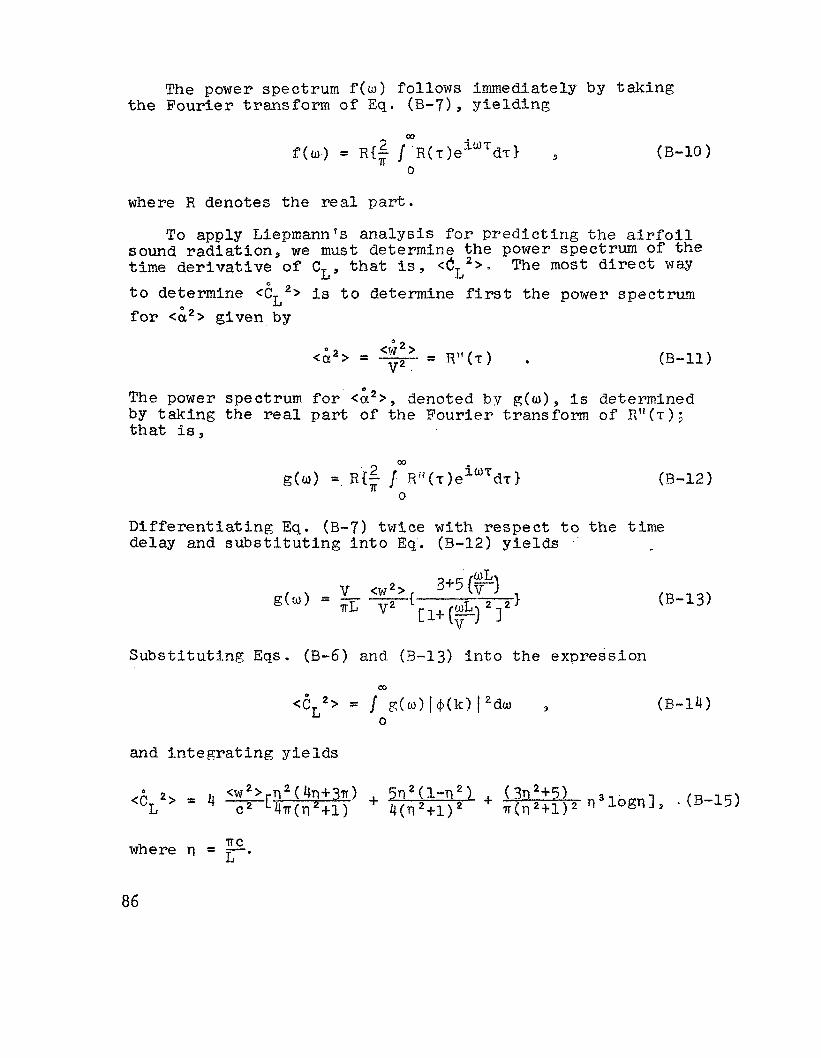
The power spectrum f ( w ) follows immediately b y t a k i n g the Four ie r t ransform of E q . (€3-71, y i e l d i n g
9 (B-10 )
where R denotes the real par t ,
To apply Liepmann’s ana lys i s f o r p r e d i c t i n g the a i r f o i l sound r a d i a t i o n , w e must determine t h e power spectrum of the t i m e d e r i v a t i v e of CL, t ha t is, <CL2>* The most d i r e c t way
t o determine <eL‘> i s t o determine f t rs t t h e power spectrum for <i2> given by
<I?> < a > = - - O . 2
v2 ’ - R V i ( r ) . (B-11)
The power spectrum f o r <&*>, denoted by g ( w > , i s determined by t ak ing t h e real part of the Four ie r transform of R “ ( T ) ; that i s ,
(B-12)
D i f f e r e n t i a t i n g Eq. (€3-7) twice w i t h r e spec t t o the t i m e delay and s u b s t i t u t i n g i n t o Eq. (B-12) y i e l d s
S u b s t i t u t i n g Eqs. (B-6) and (3-13) i n t o t h e expression
and i n t e g r a t i n g y i e l d s
ITC where rl = r.
86
The t i m e n d e r i v a t i v e o f t h e f l u c t u a t i n g l i f t and lift c o e f f i c i e n t C, are related by t h e expres s ion
where p i s the f l u i d d e n s i t y and S The f i n a l expres s ion f o r t h e sound a f r f o i l in t u r b u l e n t flow fol lows
ov2s 9 (B-16)
the a i r f o i l s u r f a c e area. radiated from a smaZZ' mrnediately by subs t it ut fng
(B-17)
Eq. (B;l$Iainto Eq. ( 3 ) (Cur le ' s p o i n t d fpole sbund equat ion ' j where F = L y i e l d i n g
<w2>p2V'S2 ~1~(413+37~) + 5 f l ' ( 1 - ~ 1 ~ ) 16r2c2 ~ ~ 2 x 2 IT (q 2 + l ) wl 2+1>
<p2> =
(3n2+5) + q 3 l o g 171.
R E FE R Erx! C E S
B-1. Sears, I?. R. : Some Aspects of Nonstationary A i r f o i l Theory and I ts P r a c t i c a l Appl ica t ions . J . A o r o . S e i . 8, no. 2, Feb. 1941, p . 104.
Nat iona l Bureau of Standards. Presented a t Inter- n a t i o n a l Congress of Applied Mechanics , Cambridge, England, 1938.
Spectrum of I s o t r o p i c Turbulence. NACA TN2473, 1551.
B-2. Dryden, H . L . : Turbulence I n v e s t i g a t i o n s at t h e
B-3. Liepmann, H . W . ; Laufer , J; atJd Liepmann, K . : On lhe
87
APPENDIX C
BBiY QUIET !41f45 TUNNEL
The BBN wind tunnel i s a low turbulence, low no i se free-jet f a c i l i t y designed s p e c i f i c a l l y t o study low-speed aerodynamic noise phenomena. V e r t i c a l and p l an views of the f a c i l i t y are shown i n Fig. C-1. The f a c i l i t y ope ra t e s i n the l'suction mode" (%.e. , t h e blower lowers t h e pressure i n the room), w i t h a i r e n t e r i n g t h e roum through a smoothly contoured converging nozzle having a l f - to-1 area contrac- t i o n . The speed of t h e low turbulence core of the j e t i s v a r i a b l e between 20 and 1 2 0 fps i n a 16-in. by 16-in. square c ross -sec t ion o r an 18-in. diameter round cross-sect ion.
Surrounding t h e free-jet f a c i l i t y i s a semireverberant room of approximately 3000 f t 3 wi th c e i l i n g and one wall skewed t o improve the uniformity of t h e reverberant sound f i e l d . The "cutoff frequencyfr of t he room is 180 Hz ( i n 1/3-octave bands) . Below t h i s frequency, absolu te sound measurements are not h i g h l y accura te , but meaningful reZatCve measurements may be made. To achieve a space- averaged sound measurement, w e mount t h e microphone on a pendulum which has a per iod o f approximately 2 see . The measured sound data has been found t o be very r epea tab le .
A General Radio Model 1521 Real-Time Analyzer i s used f o r d i r e c t l y record ing s p e c t r a of sound power from a space-averaged measurement of mean square pressure (SPL). The GR Analyzer has a spectrum shaper which allows weighting of t h e ind iv idua l 1/3-octave bands through a range of 225 d3. An ILG f a n i s used as the known broadband sound power source, and t h e SPL measurements are appropr ia te ly weighted to give a d i r ec t l /+octave band p l o t i n dB re watts.
The flow speed i s monitored by a s tandard P i t o t - s t a t i c tube used w i t h a Pace-Whittaker Model P7D d i f f e r e n t f a l - pressure sensor and a Hewlett-Packard Model 412A Vacuum Tube Voltmeter. The acous t i c measurements are made w i t h a B & K Model 4131 l - i n . condenser microphone with random incidence cor rec tor ; t h e microphone connects i n t o a E & K Model 2513 cathode fol lower and B & K Model 2801 power supply. A GR Model 1551B Sound Level Meter ( v a r i a b l e gain) i s used as a preamplifier.
S p e c t r a l data i s obtained w i t h a GR Model 1 3 2 1 1/3- Octave Band Real -Time Analyzer. A 32-see sampling per iod i s used; t h u s , t he sound measurements are repeatable
w i t h i n 20 .5 dB i n most bands. The s p e c t r a data are then immediately p l o t t e d on a BBM P lo tama t i c (TM) Nodel 800 X-Y plotter. i s shown i n F ig . (2-2.
A schematic of the no i se measurement s y s t e m
The f l u c t u a t i n g f o r c e and moment measurements were made w i t h a s ix-degree -of -freedom, e igh t - component fo rce ba lance designed and b u i l t by BBM. A unisue technique employed by BBN's t r a n s d u c e r development group t o i s o l a t e f o r c e direc- t i o n r e s u l t s i n mechanical c r o s s t a l k between force-sensing elements of less t h a n 1%.
The f o r c e ba lance is mounted on a massive v i b r a t i o n - i s o l a t e d t u r n t a b l e and ou tpu t s of t h e i n d i v i d u a l s e n s i n g elements are a m p l i f i e d by D.C . - d i f f e r e n t i a l amplifiers having v a r i a b l e g a i n o f up t o 2000:l. The o u t p u t s of t h e var ious channels are combined t o g ive l i f t , drag, e t c . through use of a sum-and-difference a m p l i f i e r . Both steady- s ta te and f l u c t u a t i n g output s i g n a l s are p l o t t e d on a BBN Model 800 P lo tomat ic X-Y P l o t t e r . S p e c t r a l measurements are ob ta ined w i t h t h e General RadSo ?lode1 1521 1/3-0ctave Band Real -Time Analyzer e
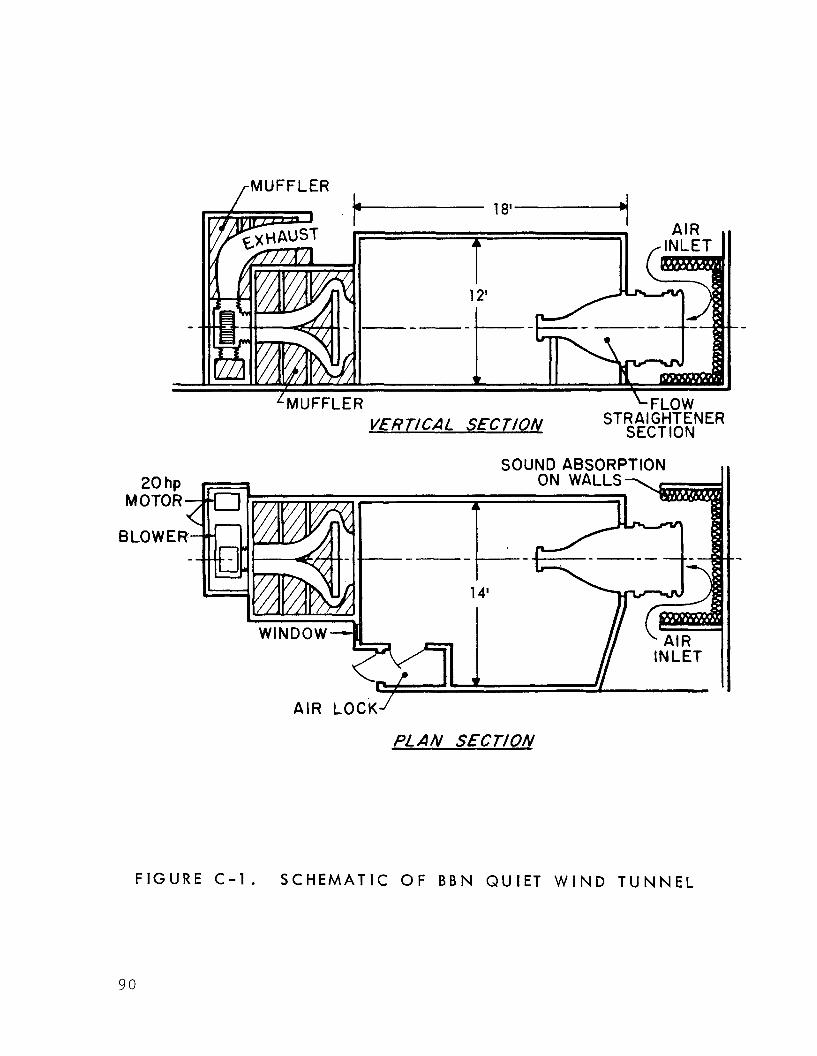
/MUFFLER
LFLOW STRAIGHTENER
SECTION VERTICAL S€CTlON
SOUND ABSORPTION
.-
PLAN S€C;rlON
FIGURE C - 1 . S C H E M A T I C OF B B N Q U I E T W I N D T U N N E L
90
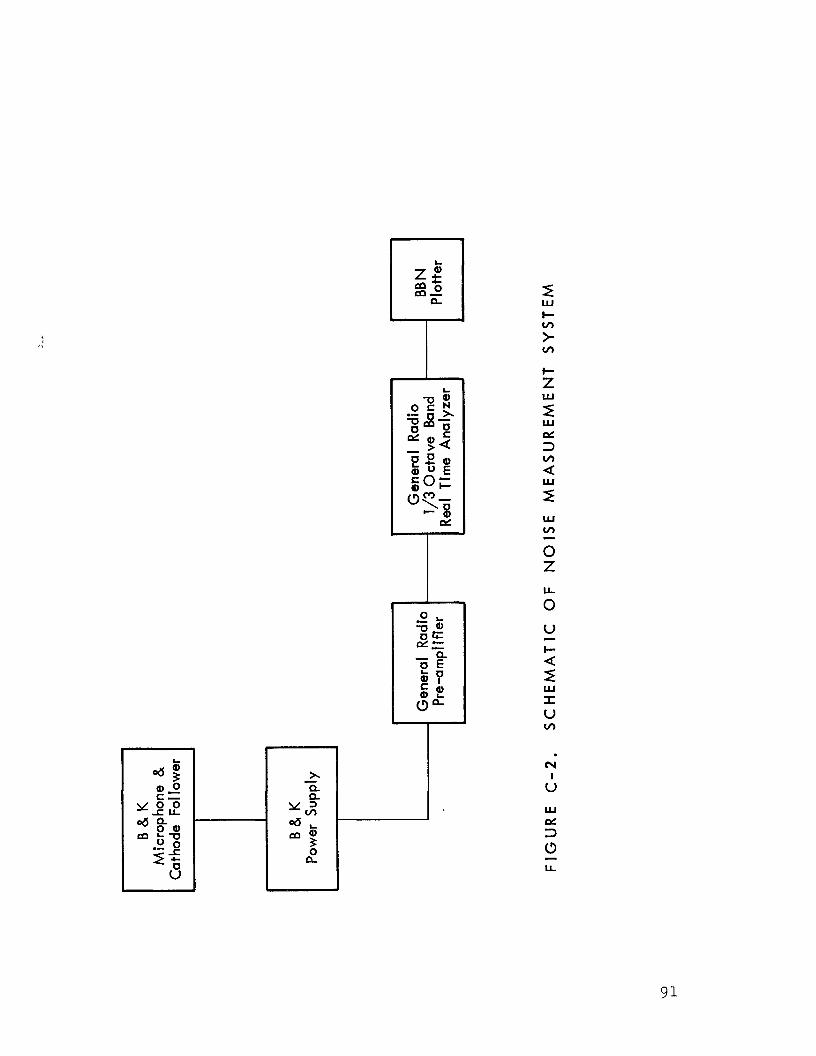
1
I 7-
L W I- v)
v)
I-
W
2.
Z
z W e
v)
W
3
4
L W v) - 0 Z U
0 u
Q
- I-
L W I u v)