building global water use scenarios
TRANSCRIPT

BUILDING GLOBAL WATER USE SCENARIOS
Sylvia Tramberend, David Wiberg, Yoshihide Wada, Martina Flörke, Gűnther Fischer, Yusuke Satoh, Paul Yillia, Michelle van Vliet, Eva Hizsnyik, Luzma Fabiola Nava Jimenéz, Mirjam Blokker
IIASA, Laxenburg, Austria
April 2015
INTERIM REPORT
International Institute for
Applied Systems Analysis
Schlossplatz 1
A-2361 Laxenburg, Austria
Tel: +43 2236 807 342
Fax: +43 2236 71313
E-mail: [email protected]
Web: www.iiasa.ac.at
Interim Reports on work of the International Institute for Applied Systems Analysis receive only limited review. Views or opinions expressed herein do not necessarily represent those of the Institute, its National Member Organizations, or other organizations supporting the work.
Interim Report
BUILDING GLOBAL WATER USE SCENARIOS
ZVR 524808900

ii
Contents
1. Introduction 1
2. Scenario approach 2
2.1 Building scenarios in Water Futures and Solutions (WFaS) 2
2.1 The water dimension in the Shared Socio-Economic Pathways 3
2.2 Hydro-Economic classification for regional differentiation of scenario drivers 6
3. Industrial water use 8
3.1 Water dimensions 8
3.2 SSP storylines and implications for industrial water use 9
3.3 Technological change rates: Qualitative and quantitative assessment 14
3.4 Structural changes 16
4. Domestic water use 17
4.1 Water dimensions 17
4.1.1 Components of domestic water use 17
4.1.2 Drivers for domestic water use 19
4.3 SSP storylines and implications for domestic water use 19
4.3 Qualitative and quantitative scenario assumptions 23
4.3.1 Technological change rates 23
4.3.2 Structural changes: Access and Behavior 24
5. Agricultural water use 24
5.1 Water dimensions related to agricultural production 24
5.2 SSP storylines and implications for agricultural water use 25
5.3 Qualitative scenario assumptions 30
5.3.1 Irrigation cropping intensity 30
5.3.2 Utilization intensity of area equipped for irrigation 31
5.3.3 Irrigation water use efficiency 32
5.3.4 Area equipped for irrigation 33
6. Preliminary results of the WFaS 'fast-track' assessment 34
6.1 Summary of drivers and assumptions 35
6.2 Industrial water use sector 37
6.3 Domestic water use sector 42
6.4 Discussion: Sensitivity of modelling approaches on the results 46
7. Conclusions 48
References 50
AENNX I - Key elements of Shared Socio-Economics (SSP) storylines 52

iii
Annex II. Global maps of industrial water withdrawals 54
Annex III. Global maps of domestic water withdrawals 55
List of Tables
Table 1. Domestic water consumption per person 19
Table 2. Drivers and assumptions applied in the WFaS ‘fast-track’ scenario runs,
deployed at country level 36
Table 3. Scenario assumptions for technology and structural change in the industry and
domestic sector 36
List of Figures
Figure 1: The shared socioeconomic pathways (SSPs) representing different
combinations of challenges to climate mitigation and adaptation. Source: (O'Neill, et al.,
2015) 4
Figure 2: Conceptual framework for allocation of hydro-economic classification to four
quadrants of water security 7
Figure 3. Share of industrial water withdrawal in total water withdrawal Source:
AQUASTAT 8
Figure 4. Ensemble of three global industrial water withdrawal (water demand)
projections calculated with the global water models: H08, WaterGAP, and PCR-
GLOBWB (PCR) for the years 2010, 2020, 2030, 2040, and 2050 respectively under
three SSPs scenarios (SSP1, SSP2, and SSP3). 38
Figure 5. Ensemble statistics of three global water models for industrial water
withdrawals (water demand), for 2010 and 2050, SSP2 scenario. Avr (Average), Std
(Standard deviation), and Std/Avr denotes the coefficient of variations (CV). 39
Figure 6. Regional industrial water withdrawal (water demand) projections with three
global water models: H08, WaterGAP, and PCR-GLOBWB (PCR) for the year 2010,
2020, 2030, 2040, and 2050 respectively under three SSPs scenarios (SSP1, SSP2, and
SSP3). HE denotes the hydro-economic classification (see section 2.2) 41
Figure 7. Global domestic water withdrawal (water demand) projections with three
global water models: H08, WaterGAP, and PCR-GLOBWB (PCR) for the year 2010,
2020, 2030, 2040, and 2050 respectively under three SSPs scenarios (SSP1, SSP2, and
SSP3). 42
Figure 8. Ensemble statistics of three global water models for domestic water
withdrawals (water demand), for 2010 and 2050, SSP2 scenario. Avr (Average), Std
(Standard deviation), and Std/Avr denotes the coefficient of variations (CV). 43
Figure 9. Regional domestic water withdrawal (water demand) projections with three
global water models: H08, WaterGAP, and PCR-GLOBWB (PCR) for the year 2010,
2020, 2030, 2040, and 2050 respectively under three SSPs scenarios. HE denotes the
hydro-economic classification (see section 2.2) 45

iv
Abstract
The Water Future and Solutions Initiative (WFaS) develops consistent, multi-model
global water scenarios with the aim to analyze the water-food-energy-climate-
environment nexus and identify future hotspots of water insecurity and related impacts
on food and energy security. WFaS coordinates its work with on-going scenario
development in the fifth assessment review of the Intergovernmental Panel on Climate
Change (IPCC), which has developed climate scenarios based on the Representative
Concentration pathways (RCPs) and alternative futures of societal developments
described in the Shared Socio-economic Pathways (SSPs). In its ‘fast-track’ scenario
assessment WFaS applies available multi-model ensembles of RCP climate scenarios and
population, urbanization, and economic development quantifications of the SSPs. Here
we interpret SSP narratives to indicate direct or indirect consequences for key water
dimensions. Critical scenario assumptions are assessed for different conditions in terms
of a country or regions ability to cope with water-related risks and its exposure to complex
hydrological conditions. For this purpose a classification of hydro-economic challenges
across countries has been developed. Scenario assumptions were developed for defined
categories of hydro-economic development challenges and relevant features of SSPs. In
this way we systematically assess qualitatively key scenario drivers required for global
water models. We then provide quantifications of assumptions for technological and
structural changes for the industry and domestic sector. For the quantification of global
scenarios of future water demand, we applied an ensemble of three global water models
(H08, PCR-GLOBWB, WaterGAP). Ensemble results of global industrial water
withdrawal highlight a steep increase in almost all SSP scenarios. Global amounts across
the three models show a wide spread with the highest amounts reaching almost 2000 km3
yr-1 by 2050, more than doubled compared to the present industrial water use intensity
(850 km3 yr-1). Increases in world population result in global domestic water withdrawals
by 2050 reaching 700-1500 km3 yr-1 depending on scenario and water model. This is an
increase of up to 250% compared to the present domestic water use intensity (400-450
km3 yr-1). We finally suggest improvements for future water use modelling.

v
Acknowledgments
The Water Futures and Solutions Initiative is a broad-based international consortium with
the long term goal of providing the systems analytical frameworks and tools to identify
and assess sustainable, robust, no-regret portfolios of options, which are coherent across
sectors and management scales, for the purpose of improving human well-being through
enhanced water security, under the range of possible futures and uncertainties faced by
society. Broad-based participation of the water community, and the communities of
related sectors, is critical for not only advancing knowledge and science, but also for
providing consistent messages on which decision makers across sectors and scales of
management can act to produce consistent implementation of portfolios of solutions. We
therefore would like to acknowledge and thank the partners that helped launch the
initiative: IIASA, UN-Water/UNESCO, the World Water Council (WWC), the
International Water Association (IWA), and the Ministry of Land, Infrastructure and
Transport (MOLIT) of the Republic of Korea. We also thank the many organizations that
have contributed as part of the consortium (see blue-box below).
In particular, we thank the Austrian Development Cooperation and the Asian
Development Bank for the provision of funds to support this Fast-Track analysis of the
Water Futures and Solutions Initiative.
WFaS Contributors: Academy of Sciences Malaysia (ASM); Asian Development Bank (ADB);
Austrian Development Agency (ADA); Bibliotheca Alexandrina, Egypt; Center for Environmental
Systems Research (CESR), University of Kassel, Germany; Commonwealth Scientific and Industrial
Research Organisation (CSIRO), Australia; Global Environment Facility (GEF), Government of
Hungary; Gujarat Institute of Development Research (GIDR), India; Helmholtz Centre for
Environmental Research (UFZ), Germany; Institute of Rural Management Anand (IRMA), India;
Institute of Geographic Sciences and Natural Resources Research (CAS), China; Institute of Water
Resources and Hydropower Research (IWHR), China; International Food Policy Research Institute
(IFPRI); International Water Management Institute (IWMI); Joint Research Centre (JRC) – European
Commission; Korean National Committee, 7th World Water Forum; KWR Watercycle Research
Institute, Netherlands; The Millennium Project; Ministry of Foreign Affairs, Norway; National Institute
for Environmental Studies (NIES), Japan; National Institute of Hydrology (NIH), India; National
Natural Science Foundation of China (NSFC); Natural Environment Research Council (NERC), United
Kingdom; Norwegian Water Resources and Energy Directorate (NVE); Organization for Economic
Co-operation and Development (OECD); University of Oxford, United Kingdom; Potsdam Institute for
Climate Impact Research (PIK), Germany; South African Water Research Commission (WRC); The
City University of New York (CUNY), USA; Utrecht University, Netherlands; Wageningen UR,
Netherlands; Walker Institute for Climate System Research, United Kingdom.

1
BUILDING GLOBAL WATER USE SCENARIOS
Sylvia Tramberend, David Wiberg, Yoshihide Wada, Martina Flörke, Gűnther Fischer, Yusuke Satoh, Paul Yillia, Michelle van Vliet, Eva Hizsnyik, Luzma Fabiola Nava Jimenéz, Mirjam Blokker
1. Introduction
One of the primary tasks of the Water Futures and Solutions (WFaS) initiative is to
develop global scenarios of water potentials and stressors, their interdependencies across
the different sectors, the climate-water-food-energy-ecosystem nexus, and the impacts
on human wellbeing and earth ecosystems and the services they provide. In the
quantitative analysis WFaS develops consistent, multi-model global water scenarios with
the aim to analyze the water-food-energy-climate-environment nexus and identify future
hotspots of water insecurity and related impacts on human well-being, in particular food
and energy security.
The WFaS initiative coordinates its work with other on-going scenario efforts in the
context of the Intergovernmental Panel on Climate Change (IPCC) 5th Assessment
Report (AR5) (Moss, et al., 2010) for the sake of establishing a consistent set of new
global water scenarios. The emission scenarios of the Representative Concentration
Pathways (RCPs) (van Vuuren, et al., 2011) were completed in 2012 and provide input
that is essential for climate modelers. The spatial and seasonal patterns of future climate
change estimated by climate models must be complemented by socioeconomic and
ecological data that the other climate change research groups, namely the integrated
assessment modelers (IAM), and the impacts, adaptation, and vulnerability community
need. In response to this the climate change research community converged on new
projections, termed Shared Socioeconomic Pathways (SSPs) (O'Neill, et al., 2015)
(O'Neill, et al., 2014) (O’Neill, et al., 2011). Very few assessments have used the SSPs to
assess the impacts of global change on water resources, e.g. (Hanasaki, et al., 2013)1,
(Arnell & Lloyd-Hughes, 2014).
The WFaS global water scenario assessment framework has initially followed a ‘fast-
track’ mode to produce well-founded yet preliminary scenario estimates. It extends the
SSP storylines with a water dimension and makes use of available results of climate
1 Hanasaki et.al (2013) focused on technology change and environmental consciousness as prescribed by
the SSP narratives to determine a qualitative assessment of key assumptions required for water use
scenarios and literature based quantified variables for application in water use scenario analysis.

2
projections2 based on the four RCPs and socio-economic developments based on the five
SSPs to develop a set of (preliminary) quantitative water projections. These climate and
socio-economic pathways are being analyzed in a coordinated multi-model assessment
process involving sector and integrated assessment models, water demand models and
different global hydrological models.
State-of-the-art global water use models will be forced with available future projections
of population, urbanization, economic growth and energy consumption for each SSP and
country. Next to these exogenous drivers, global water use models calculate future water
demand and use based on a set of assumptions mainly related to technological and
structural changes. The aim of this paper is to describe the process of developing these
additional assumptions that critically determine future water use.
In the second section we first present the WFaS scenario approach (Chapter 2), followed
by the implementation separately for each main water use sector, industry (Chapter 3)
domestic (Chapter 4) and agriculture (Chaper 5). We also provide quantifications of
assumptions for technological and structural changes for the industry and domestic sector.
Respective quantifications for the agricultural sector are more complex and presented
elsewhere. In Chapter 6 we summarize drivers and assumptions applied in the WFaS
‘fast-track’ assessment and present preliminary results for future industrial and domestic
water demand. We finally conclude (Chapter 7) with key findings and suggest next steps
for further improving future water scenario assessments.
2. Scenario approach
2.1 Building scenarios in Water Futures and Solutions (WFaS)
Alternative scenarios are an important method for exploring uncertainty in future societal
and interrelated environmental conditions. The WFaS global water scenarios follow the
SSP storylines, apply available quantification of socioeconomic variables from the SSP
database (IIASA, 2015), and extend critical water dimensions (Cosgrove, et al., 2015).
The SSPs designed to offer the possibilities for experimentation by a wide range of
researchers on extending the basis SSPs in various dimensions (O'Neill, et al., 2014).
Developed by the climate change community, the key elements of the SSP narratives
focus on climate policy analysis. Thus narratives include less or maybe even no
information relevant for the water sector. We contribute here by extending the SSPs with
relevant critical dimensions of the main water use sectors industry, domestic, and
agriculture for the development of a first set of assumptions applied in global water
models.
A global assessment is essential in view of the increasing importance of global drivers
such as climate change, economic globalization or safeguarding biodiversity. Maintaining
a global perspective and provide the necessary regional detail to identify future pathways
2 Distributed by the Coupled Model Intercomparison Project (CMIP),
see http://cmip-pcmdi.llnl.gov/cmip5/
3
and solutions is key for water scenario development. Against this background, WFaS
aims for its quantitative scenario assessment not only a high level of regional detail
(typically at the grid-cell level) but also to go beyond globally uniform assumptions of
important scenario drivers.
This is achieved for different conditions in terms of a country or regions ability to cope
with water-related risks and its exposure to complex hydrological conditions. For this
purpose a classification of hydro-economic challenges across countries has been
developed (Fischer, et al., 2015). In this way, countries and/or watersheds can assume
varying scenario drivers (e.g. technological change rates) for defined categories of hydro-
economic development challenges. Critical water dimensions have been assessed
qualitatively and quantitatively for each SSP and hydro-economic class. The
quantification determines assumptions for variables required in state-of-the-art global
water models.
The WFaS project extends the use of participatory processes to scenario development.
Stakeholders and experts are asked to develop and refine qualitative storylines for the
scenarios and to provide qualitative and quantitative estimates of changes in some of the
factors affecting freshwater resources now and in the future. In WFaS the following
stakeholder groups play an active role in the scenario development process:
(i) The Scenario Focus Group (SFG), a representative group of stakeholders
whose role is to provide guidance to ensure the global and regional relevance
and legitimacy of the scenarios and
(ii) The Sector Actors Group (SAG), a stakeholder group which enriches and
grounds the water scenarios by providing a range of sector perspectives and
considerations during their development, to ascertain the feasibility of the
scenarios. The SAG will also develop portfolios of solutions for the main
global challenges.
(iii) In addition, regional stakeholder groups will focus on respective geographic
areas. IIASA, together with the Asian Development Bank, is building a
regional stakeholder consortium for Asia, and the Water Futures and Solutions
Initiative has established case studies, which have their own stakeholder
groups, in other parts of the world
Overall, the scenario development is based on the SAS (Story And Simulation) approach
linking storyline revision and modeling work in an iterative process. These different
groups of stakeholders will broaden and enrich the analysis and assumptions.
A first stakeholder meeting has reflected on the scenario approach (Magnuszewski, et al.,
2015). Additional stakeholder involvements will provide important sounding boards for
developing a second round of stakeholder-driven multi-model assessments.
2.1 The water dimension in the Shared Socio-Economic Pathways
The Shared Socio-Economic Pathways (SSP) include both a qualitative component in the
form of a narrative on global development and a quantitative component that includes
numerical pathways for certain variables that are particularly useful to have in

4
quantitative form for use in other studies. Narratives were developed and agreed upon for
basic versions of five SSPs, illustrated in Figure 1 within the space of socio-economic
challenges to mitigation and adaptation outcomes that the SSPs are intended to span. Each
narrative includes a summary and a full version. Box 1 provides an excerpt of the
summary of each storyline.
For each SSP “elements” were identified to describe a set of variables, processes, or
components of human-environment systems that provide the building blocks for
constructing both the qualitative and quantitative aspects of SSPs. Key elements of an
SSP characterize the global socio-economic future of the 21st century as a reference for
climate change analysis. They include demography, economic development, human
development, technology, lifestyles, environment and natural resources, and policy and
institutions. For a subset of SSP elements an associated table of qualitative assumptions
for all SSPs about direction and magnitude of trends in SSP elements were developed
(Annex III in (O’Neill, et al., 2011)).
Figure 1: The shared socioeconomic pathways (SSPs) representing different combinations of
challenges to climate mitigation and adaptation. Source: (O'Neill, et al., 2015)
Here we extend the SSP storylines with a water dimension and develop “water extended
SSP storylines”. The SSP element list in (O'Neill, et al., 2015) includes an element group
‘environment and natural resources’. However, no water aspect has been included in the
qualitative ranking. Throughout the storylines particular reference to freshwater is rare,
mainly discussed in the context of ‘access to safe water’. Selected SSPs refer to ‘water
pollution’ (SSP5) or ‘water insecurity’ (SSP1, SSP2).
We’ve first scrutinized the SSP storylines to identify key variables relevant for the
different water use sectors. Each SSP describes a specific set of variables. To achieve a
comprehensive overview we’ve appended our own interpretation (green colored text in
Annex I) for variables lacking in selected narratives.
Box 1: Key characteristics of the Shared Socio-Economic Pathways (SSP)
SSP1 (Sustainability). A world making relatively good progress toward sustainability, with ongoing efforts to achieve
development goals while reducing resource intensity and fossil fuel dependency. It is an environmentally aware world
with rapid technology development, and strong economic growth, even in low-income countries.
SSP2 (Middle of the road). This “business-as-usual” world sees the trends typical of recent decades continuing, with
some progress toward achieving development goals. Dependency on fossil fuels is slowing decreasing. Development of
low-income countries proceeds unevenly.
SSP3 (Fragmentation). A world that is separated into regions characterized by extreme poverty, pockets of moderate
wealth, and a large number of countries struggling to maintain living standards for a rapidly growing population.
SSP4 (Inequality). A highly unequal world in which a relatively small, rich global elite is responsible for most of the
greenhouse gas emissions, while a larger, poor group that is vulnerable to the impact of climate changes, contributes little
to the harmful emissions. Mitigation efforts are low and adaptation is difficult due to ineffective institutions and the low
income of the large poor population.
SSP5 (Conventional Development). A world in which conventional development oriented toward economic growth as
the solution to social and economic problems. Rapid conventional development leads to an energy system dominated by
fossil fuels, resulting in high greenhouse gas emissions and challenges to mitigation.
Source: IIASA Options Magazine Summer 2012 adapted from O’Neill et.al, 2012

5
Box 1. Shared Socioeconomic Pathways (SSP)
SSP1: Sustainability – Taking the green road
“The world shifts gradually, but pervasively, toward a more sustainable path, emphasizing more inclusive development that respects perceived environmental boundaries. Increasing evidence of and accounting for the social, cultural, and economic costs of environmental degradation and inequality drive this shift. Management of the global commons slowly improves, facilitated by increasingly effective and persistent cooperation and collaboration of local, national, and international organizations and institutions, the private sector, and civil society. …..”
SSP2: Middle of the road
“The world follows a path in which social, economic, and technological trends do not shift markedly from historical patterns. Development and income growth proceeds unevenly, with some countries making relatively good progress while others fall short of expectations. Most economies are politically stable. Globally connected markets function imperfectly. Global and national institutions work toward but make slow progress in achieving sustainable development goals, including improved living conditions and access to education, safe water, and health care. Technological development proceeds apace, but without fundamental breakthroughs. …..”
SSP3: Regional rivalry – A rocky road
“A resurgent nationalism, concerns about competitiveness and security, and regional conflicts push countries to increasingly focus on domestic or, at most, regional issues. This trend is reinforced by the limited number of comparatively weak global institutions, with uneven coordination and cooperation for addressing environmental and other global concerns. Policies shift over time to become increasingly oriented toward national and regional security issues, including barriers to trade, particularly in the energy resource and agricultural markets. Countries focus on achieving energy and food security goals within their own regions at the expense of broader-based development, and in several regions move toward more authoritarian forms of government with highly regulated economies. Investments in education and technological development decline.…..”
SSP4: Inequality – A road divided
“Highly unequal investments in human capital, combined with increasing disparities in economic opportunity and political power, lead to increasing inequalities and stratification both across and within countries. Over time, a gap widens between an internationally-connected society that is well educated and contributes to knowledge- and capital-intensive sectors of the global economy, and a fragmented collection of lower-income, poorly educated societies that work in a labor intensive, lowtech economy. Power becomes more concentrated in a relatively small political and business elite, even in democratic societies, while vulnerable groups have little representation in national and global institutions…..” (O'Neill, et al., 2015)
SSP5: Fossil-fueled development – Taking the highway
“Driven by the economic success of industrialized and emerging economies, this world places increasing faith in competitive markets, innovation and participatory societies to produce rapid technological progress and development of human capital as the path to sustainable development. Global markets are increasingly integrated, with interventions focused on maintaining competition and removing institutional barriers to the participation of disadvantaged population groups…..”
Source: (O'Neill, et al., 2015)

6
2.2 Hydro-Economic classification for regional differentiation of scenario drivers
Maintaining a global perspective and provide the necessary regional detail to identify
future pathways and solutions is key for water scenario development. Against this
background, WFaS aims for its quantitative scenario assessment not only a high level of
regional detail (typically at the grid-cell level) but also to go beyond globally uniform
assumptions of important scenario drivers. This requires developing a system of
classification for countries and watersheds describing different conditions pertaining to
water security (or its reverse water challenges). We’ve developed a compound indicator
based methodology for the classification of countries (and watersheds) into a two-
dimensional hydro-economic space. In this way, countries and/or watersheds can assume
varying scenario drivers (e.g. technological change rates) for defined categories of hydro-
economic development challenges.
The hydro-economic classification consists of two broad dimensions representing
respectively
(i) a country’s/region’s economic and institutional capacity to address water
challenges; i.e. the economic institutional capacity (y-dimension)
(ii) a country’s/region’s magnitude / complexity of challenges related to the
management of available water resources; i.e. hydrological
challenge/complexity (x-dimension)
For the classification, each major dimension is measured by a normalized composite
index, which is computed from a set of relevant indicators. In this way countries/regions
will be located in a two-dimensional space representing different human-natural water
development challenges and levels of water security.
For example, for the estimation of qualitative and quantification assumptions of critical
water dimensions and drivers in the WFaS scenario assessment (e.g. technological change
rates) we assign different values depending on the country’s location in one of four
quadrants in the two-dimensional space (Figure 1).
For the y-dimension, we’ve selected one indicator, namely GDP per caput (in constant
PPP dollars per caput) as a measure of economic strength and financial resources
available for investing in risk management. Another indicator initially discussed was the
Corruption Perception Index (CPI) (Transparency International3, see
www.transparency.org). In a first attempt the CPI was included in the compound indicator
for economic-institutional capacity based on the assumption that lower corruption may
indicate higher coping capacity to water related risks and vice versa. However, in
response to disapproval of this indicator by a workshop of WFaS stakeholders, the CPI
was excluded from the composite indicator. Moreover for determining hydro-economic
classes in different future scenarios, an estimation of the CPI would be required using
formal methods or expert judgments based on the information available in the scenario
narratives.
3 See www.transparency.org
7
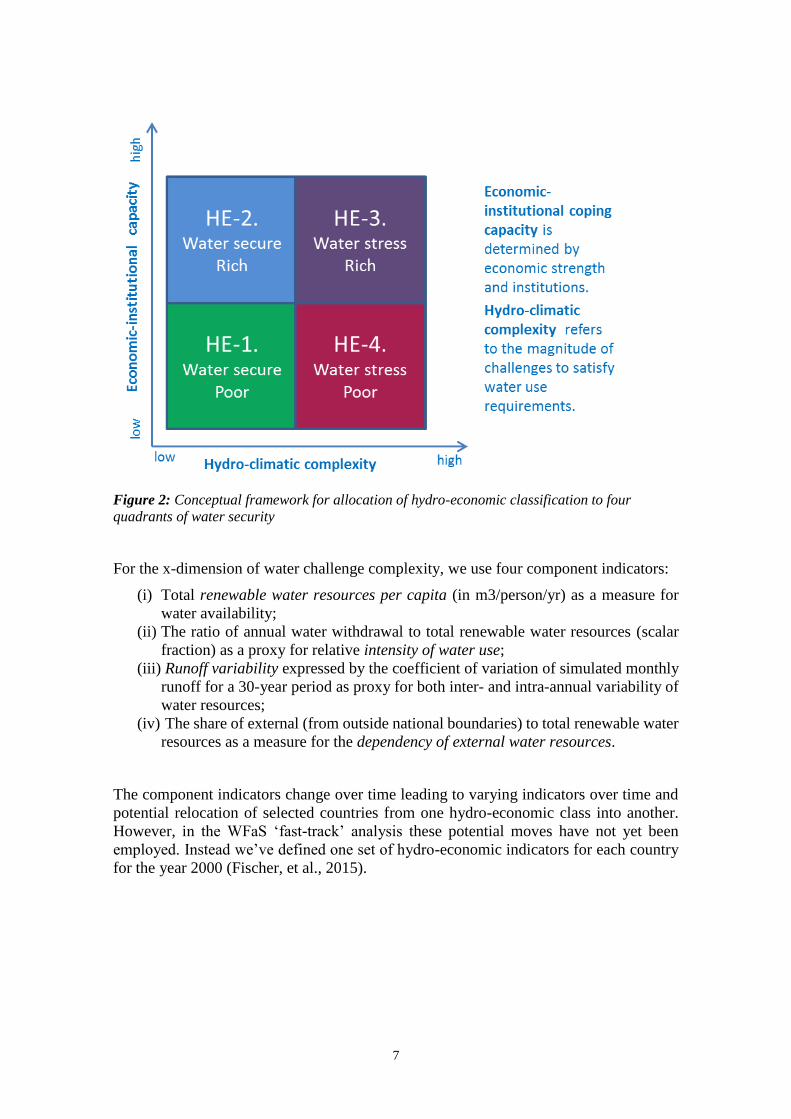
Figure 2: Conceptual framework for allocation of hydro-economic classification to four
quadrants of water security
For the x-dimension of water challenge complexity, we use four component indicators:
(i) Total renewable water resources per capita (in m3/person/yr) as a measure for
water availability;
(ii) The ratio of annual water withdrawal to total renewable water resources (scalar
fraction) as a proxy for relative intensity of water use;
(iii) Runoff variability expressed by the coefficient of variation of simulated monthly
runoff for a 30-year period as proxy for both inter- and intra-annual variability of
water resources;
(iv) The share of external (from outside national boundaries) to total renewable water
resources as a measure for the dependency of external water resources.
The component indicators change over time leading to varying indicators over time and
potential relocation of selected countries from one hydro-economic class into another.
However, in the WFaS ‘fast-track’ analysis these potential moves have not yet been
employed. Instead we’ve defined one set of hydro-economic indicators for each country
for the year 2000 (Fischer, et al., 2015).

8
3. Industrial water use
3.1 Water dimensions
Globally industrial water withdrawal amounts to 731 billion m3 per year, corresponding
to about one fifth of total water withdrawal (AQUASTAT). However, in industrialized
countries the share of industrial water withdrawal in total water withdrawal usually
exceeds 40% (Figure 3). Water demand for industrial uses doubled since the 1960s.
Figure 3. Share of industrial water withdrawal in total water withdrawal Source: AQUASTAT
Industrial water use includes two main components. First water for the cooling of
thermoelectric plants determines water use in the electricity sector. Besides electricity the
other main industrial water use occurs in the manufacturing sector.
Water use intensities describe the amount of water required to produce a unit of electricity
(m3/GJ) or a unit of manufacturing (m3/Gross Value Added in Manufacturing). Future
industrial water demand depends on:
i) technological changes in the industries concerned, and
ii) structural changes in a country’s / region’s industrial sector
Global water models require country specific assumptions about the future developments
of electricity consumption, gross value added in the manufacturing sector (the main
consumer of water in industry besides electricity generation) and technological changes
rates. Depending on global water model one or more of the following input data are
required:
i) Energy consumption
ii) Electricity consumption
iii) Economic development
iv) Gross Value Added in Manufacturing
v) The impact of technological change on industry water use intensities

9
vi) The impact of structural changes on industry water use intensities
The former are derived from available results of global economic and energy models.
Technological change rates are determined in WFaS for each SSP and depending on the
country’s attribution to one of the four hydro-economic classifications.
3.2 SSP storylines and implications for industrial water use
In the following we scrutinize each SSP narrative for developments relevant for water use
in the industry sector, separate for electricity and manufacturing, and interpret those in
terms of implications for electricity water use intensities and extents of water use in the
manufacturing sector. We first summarize for each SSP those key elements of the
storylines, which impact the water dimensions of each sector (excerpts of the storylines)
and then interpret those in relation to their water dimensions.
In general, the size, structure and technologies applied in the electricity and
manufacturing sector and their impact on water use and water use intensities are closely
linked to resource-efficiency of the economy, implementation of environmental
regulations, and progress in water saving technologies.
SSP1: Sustainability – Taking the green road
Elements of the SSP storyline relevant for the ELECTRICITY sector
reduced overall energy demand over the longer term
lower energy intensity, with decreasing fossil fuel dependency
relatively rapid technological change is directed toward environmentally friendly
processes, including energy efficiency, clean energy technologies; favorable
outlook for renewables - increasingly attractive in the total energy mix
strong investment in new technologies and research improves energy access
advances alternative energy technologies
Implications for electricity water use intensity
Reduction in energy demand will decrease the demand for water from the energy
sector substantially even if world population, primary energy production, and
electricity generation were to increase.
A shift away from traditional biomass toward less consumptive energy carriers,
as well as the changing energy mix in electricity generation could lead to water
savings.
A favorable outlook for renewables will cause big structural and efficiency shifts
in the choice of technology with variable consequences for water use intensity
and efficiency, depending on the renewable type. For example, an expanding
output of biofuels will lead to a rise in water consumption, whereas a shift
towards photovoltaic solar power or wind energy will lead to a decrease in water
use intensity.

10
Higher energy efficiency could translate into a relatively lower water demand,
improvements in water quality, following high standards that commit industry to
continually improving environmental performance.
Overall, structural & technological changes will result in decreasing water use
intensities in the energy sector. For example the widespread application of
water-saving technologies in the energy sector will significantly reduce the
amount of water used not only for fuel extraction and processing but also for
electricity generation as well
Elements of the SSP storyline relevant for the MANUFACTURING sector
Improved resource-use efficiency
More stringent environmental regulations
Rapid technological change is directed toward environmentally friendly processes
Research & Technology development reduce the challenges of access to safe
water
Risk reduction & sharing mechanism
Implications for manufacturing water use
The importance of the manufacturing sector in the overall economy decreases
further due to the increasing importance of the non-resource using service sector
Manufacturing industries with efficient water use and low environmental
impacts are favored and increase their competitive position against water
intensive industries
Enhanced treatment, reuse of water, and water-saving technologies; Widespread
application of water-saving technologies in industry
SSP2: Middle of the road
Elements of the SSP storyline relevant for the ELECTRICITY sector
Continued reliance on fossil fuels, including unconventional oil and gas
resources
Stabilization of overall energy demand over the long run
Energy intensity declines, with slowly decreasing fossil fuel dependency
Moderate pace of technological change in the energy sector
Intermediate success in improving energy access for the poor
Implications for electricity water use intensity
Reliance on fossil fuels may lead to only minor structural and efficiency shifts in
technology
Stabilization of overall energy demand over the long run will lead to little or no
change in water demand for fuel extraction, processing and electricity generation
A decline in energy intensity will lower water demand
11
A moderate pace in technological change will cause minor structural and
efficiency shifts in technology and ultimately water use intensity will change only
slightly.
Weak environmental regulation and enforcement trigger only slow technological
progress in water use efficiencies.
Regional stress points will increase globally. Power generation in regional stress
points will likely have to deploy more and more technologies fit for water-
constrained conditions to manage water-related risks, though this can involve
trade-offs in cost, energy output and project siting.
In general, if historic trends remain the same, water use intensities will continue
to decrease in the most developed regions. However, there will be slow progress
in Africa, Latin America and other emerging economics.
Elements of the SSP storyline relevant for the MANUFACTURING sector
The SSP2 World is characterized by dynamics similar to historical developments
Moderate awareness of environmental consequences from natural resource use
Modest decline in resource-intensity
Consumption oriented towards material-growth
Technological progress but no major breakthrough
Persistent income inequality (globally & within economies)
Implications for manufacturing water use
Manufacturing GVA further declines in relative terms
Moderate & regionally different decreases of manufacturing water use intensities
Following historic trends water use intensities further decrease in the most
developed regions but less progress in Africa, Latin America and other emerging
economics
Weak environmental regulation and enforcement trigger only slow technological
progress in water use efficiencies
SSP3: Regional Rivalry – A rocky road
Elements of the SSP storyline relevant for the ELECTRICITY sector
Growing resource intensity and fossil fuel dependency
Focus on achieving energy and food security goals within their own region
Barriers to trade, particularly in the energy resource and agricultural markets
Use of domestic energy results in some regions increase heavy reliance on fossil
fuels
Increased energy demand driven by high population growth and little progress in
efficiency.
Implications for electricity water use intensity
Barriers in trade may trigger slow technological progress in water use efficiencies.
A moderate pace in technological change will cause minor structural and

12
efficiency shifts in technology and ultimately water use intensity will change only
slightly.
Reliance on fossil fuels may lead to only minor structural and efficiency shifts in
technology
An increase in energy intensity will increase water demand where as little progress
in efficiency would trigger increased water demand as energy use intensifies
Weak environmental regulation and enforcement hamper technological progress
in water use efficiencies, hence very low progress in water-saving technologies.
Elements of the SSP storyline relevant for the MANUFACTURING sector
Low priority for addressing environmental problems
Resource-use intensity is increasing
Low investment in education and technological development
Persistent income inequality (globally & within economies)
Weak institutions & global governance
Implications for manufacturing water use
Manufacturing GVA in relative terms (% of GDP) declines slower than historic
trends
Weak environmental regulation and enforcement hamper technological progress
in water use efficiencies
Very low progress in water-saving technologies
Water use intensities increase only marginally, primarily in the most developed
regions
SSP4: Inequality – A road divided
Elements of the SSP storyline relevant for the ELECTRICITY sector
Oligopolistic structures in the fossil fuel market leads to underinvestment in new
resources
Diversification of energy sources, including carbon-intensive fuels like coal and
unconventional oil, but also low-carbon energy sources like nuclear power, large-
scale CSP, large hydroelectric dams, and large biofuel plantations
A new era of innovation that provides effective and well-tested energy
technologies
Renewable technologies benefit from the high technology development
Implications for electricity water use intensity
A move towards more water intensive power generation will lead to a rise in water
consumption. However, new technologies in processing primary energy,
especially in the thermal electricity generation as well as an increased use of
renewable energy and improved energy efficiency will have an impact on water
savings.

13
Rapid technical progress could trigger water efficiency improvements in the
energy sector, which then will translate into a decrease in water use intensities.
However the progress will be mainly in richer regions, whereas the energy sector
in low income counties may stagnate, with little progress in decreasing water use
intensities.
Regional stress points will increase globally. Power generation in regional stress
points will likely have to deploy more and more technologies fit for water-
constrained conditions to manage water-related risks, though this can involve
trade-offs in cost, energy output and project siting.
For additional implication: ref. implications for both SSP 1 and 2 depending on
the energy path. Continued use of nuclear power and large scale CSPs, for
instance, will intensify water use.
Elements of the SSP storyline relevant for the MANUFACTURING sector
Increasing inequality in access to education, a well educated elite
Rapid technological progress driven by well-educated elite
Persistent income inequality (globally & within economies)
Labor intensive, low tech economy persists in lower income, poorly educated
regions
Implications for manufacturing water use
Manufacturing GVA in relative terms (% of GDP) declines in economically rich
regions but decreases very slow in poorer regions
Rapid technical progress triggers water efficiency improvements in
manufacturing. However the progress is mainly implemented in rich regions.
The manufacturing sector in low income, poorly educated regions stagnates with
little progress in decreasing water use intensities
SSP5: Fossil-fueled development—Taking the highway
Elements of the SSP storyline relevant for the ELECTRICITY sector
Adoption of energy intensive lifestyles
Strong reliance on cheap fossil energy and lack of global environmental concern
Technological advancements in fossil energy means more access to
unconventional sources
Alternative energy sources are not actively pursued
Implications for electricity water use intensity
The structure of the energy sector is driven by market forces, with water intensive
energy sources and technologies persisting into the future. Nevertheless, a rapid
technological change may lower water use intensities
The combined effect of structural and technological changes results in only
moderate decreases in manufacturing water use intensities

14
The development of unconventional oil and gas resources, which also raises
notable water-quality risks, will increase water use intensity in the energy sector,
especially for fuel extraction and processing
Regional stress points will increase globally. Power generation in regional stress
points will likely have to deploy more and more technologies fit for water-
constrained conditions to manage water-related risks, though this can involve
trade-offs in cost, energy output and project siting.
Elements of the SSP storyline relevant for the MANUFACTURING sector
A continued large role of the manufacturing sector
Adoption of the resource and energy intensive lifestyle around the world
Robust growth in demand for services and goods
Technology, seen as major driver for development, drives rapid progress in
enhancing technologies for higher water use efficiencies in the industrial sector
Local environmental impacts are addressed effectively by technological solutions,
but there is little proactive effort to avoid potential global environmental impacts
Implications for manufacturing water use
Manufacturing GVA in relative terms (% of GDP) declines only slowly
The structure of the manufacturing sector is driven by economics with water
intensive manufacturing industries persisting into the future
Yet, there is rapid technological change in the manufacturing industry
contributing also to lowering the manufacturing water use intensities
The combined effect of structural and technological changes results in only
moderate decreases in manufacturing water use intensities
3.3 Technological change rates: Qualitative and quantitative assessment
A technological change (almost) always leads to improvements in the water use efficiency
and thereby decreases water use intensities in the industry (includes electricity and
manufacturing) and domestic water use sectors. Water use intensities describe the amount
of water required to produce a unit of electricity (m3/GJ) or manufacturing (m3 / Gross
Value Added in Manufacturing).
Examples for technological changes, which improving manufacturing water use
intensities include changing or modifying machinery to use less water, switching to
waterless processes, or treating and reusing water. Other technological improvements
include i) recovering waste heat and use it to heat the facility (instead of cooling hot
machinery); ii) investing in on-site water treatment for re-use; iii) recovering water from
steam boilers.
We first rate qualitatively the level of technological improvement separate for the five
SSPs and four Hydro-Economic regions.
Technological change in the SSP storylines: Strong investments in new technology and
research including technologies directed toward environmentally friendly processes are
key in the narratives of SSP1, 4, and 5. In SSP1 and SSP5 technological progress
15
disseminates globally although driven by different incentives. While the sustainability
paradigm of SSP1 seeks global use of enhanced technologies, the SSP5 economic
development priorities favor water-efficient technologies as the cheapest option. In
contrast in the SSP4 narrative the technological progress developed by well-educated
elites can often not be implemented by poor regions lacking access to investment capital.
Overall we assess the elite-induces technological progress (in SSP4) as somewhat lower
compared to the sustainability (SSP1) and market-driven (SSP5) technological progress.
In SSP2 technological changes proceed at moderate pace, but lack fundamental
breakthroughs. In SSP3 low investments in both R&D and education result in only slow
progress in technological changes.
Technological change in the Hydro-Economic [HE] regions: Limited access to
investment in the poor countries of the Hydro-Economic regions HE-1 and HE-4 is a
major barrier for the implementation of new technologies. However the difficult hydro-
climatic conditions in HE-4 force even poor countries to spend some of their limited
available capital for implementing new technologies leading to higher progress in
technological change compared to HE-1 where water is abundant. The rich countries of
HE-2 and HE-3 have the economic and institutional potential to invest in and transfer to
state-of-the-art technologies. Yet, in countries of the water-scarce region HE-3 the
urgency to implement water-saving technologies result in stronger decreases of water use
intensities driven by technological improvements compared to HE-2, which would also
have the means to implement new technologies but lack the incentive due to sufficient
water resources.
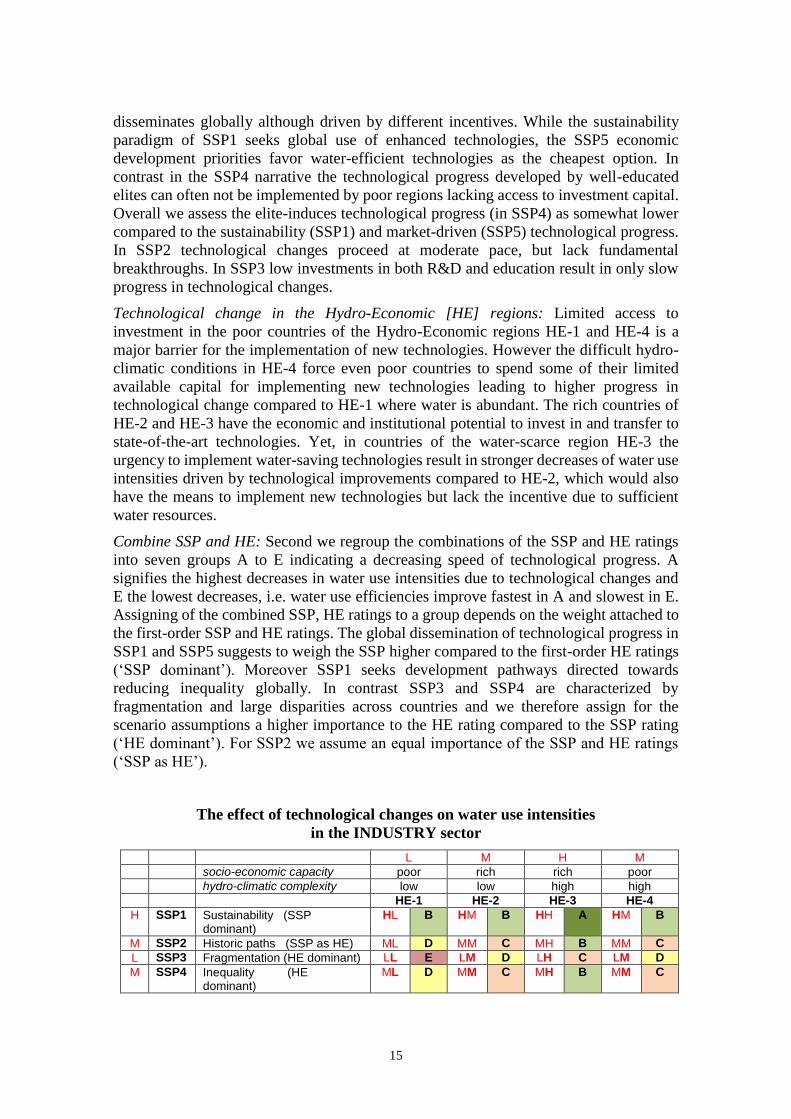
Combine SSP and HE: Second we regroup the combinations of the SSP and HE ratings
into seven groups A to E indicating a decreasing speed of technological progress. A
signifies the highest decreases in water use intensities due to technological changes and
E the lowest decreases, i.e. water use efficiencies improve fastest in A and slowest in E.
Assigning of the combined SSP, HE ratings to a group depends on the weight attached to
the first-order SSP and HE ratings. The global dissemination of technological progress in
SSP1 and SSP5 suggests to weigh the SSP higher compared to the first-order HE ratings
(‘SSP dominant’). Moreover SSP1 seeks development pathways directed towards
reducing inequality globally. In contrast SSP3 and SSP4 are characterized by
fragmentation and large disparities across countries and we therefore assign for the
scenario assumptions a higher importance to the HE rating compared to the SSP rating
(‘HE dominant’). For SSP2 we assume an equal importance of the SSP and HE ratings
(‘SSP as HE’).
The effect of technological changes on water use intensities
in the INDUSTRY sector
L M H M
socio-economic capacity poor rich rich poor
hydro-climatic complexity low low high high
HE-1 HE-2 HE-3 HE-4
H SSP1 Sustainability (SSP dominant)
HL B HM B HH A HM B
M SSP2 Historic paths (SSP as HE) ML D MM C MH B MM C
L SSP3 Fragmentation (HE dominant) LL E LM D LH C LM D
M SSP4 Inequality (HE dominant)
ML D MM C MH B MM C
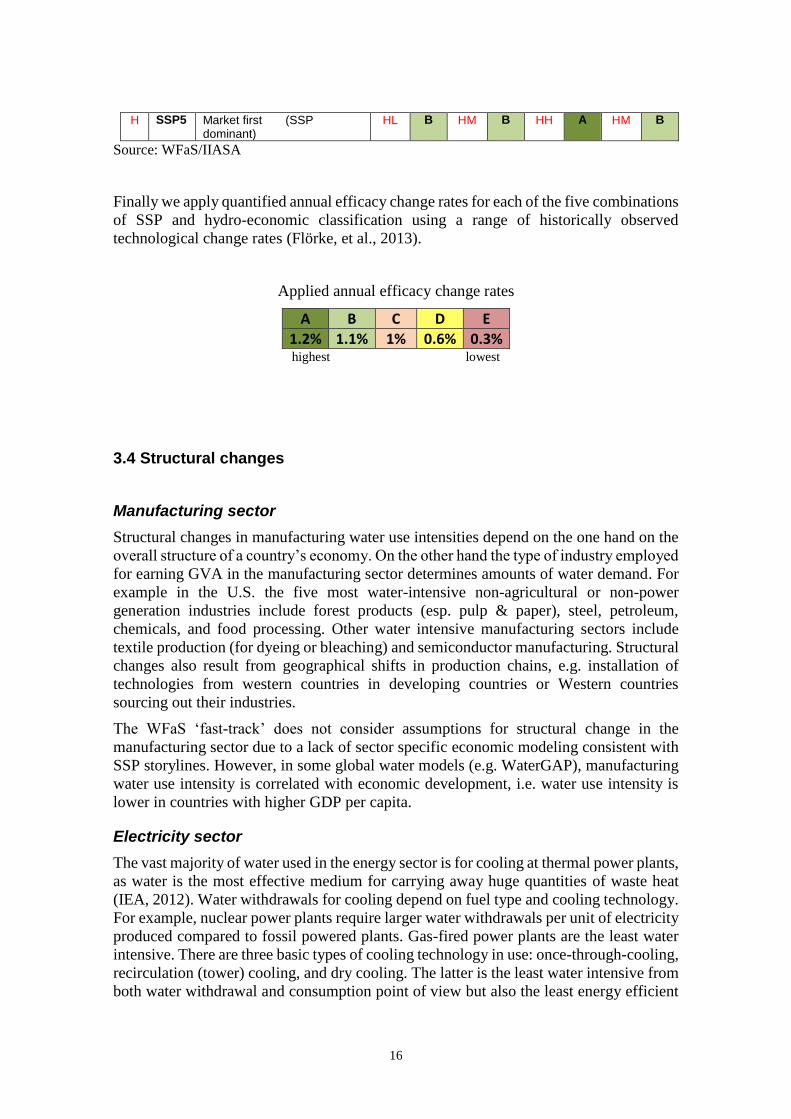
16
H SSP5 Market first (SSP dominant)
HL B HM B HH A HM B
Source: WFaS/IIASA
Finally we apply quantified annual efficacy change rates for each of the five combinations
of SSP and hydro-economic classification using a range of historically observed
technological change rates (Flörke, et al., 2013).
Applied annual efficacy change rates
A B C D E
1.2% 1.1% 1% 0.6% 0.3% highest lowest
3.4 Structural changes
Manufacturing sector
Structural changes in manufacturing water use intensities depend on the one hand on the
overall structure of a country’s economy. On the other hand the type of industry employed
for earning GVA in the manufacturing sector determines amounts of water demand. For
example in the U.S. the five most water-intensive non-agricultural or non-power
generation industries include forest products (esp. pulp & paper), steel, petroleum,
chemicals, and food processing. Other water intensive manufacturing sectors include
textile production (for dyeing or bleaching) and semiconductor manufacturing. Structural
changes also result from geographical shifts in production chains, e.g. installation of
technologies from western countries in developing countries or Western countries
sourcing out their industries.
The WFaS ‘fast-track’ does not consider assumptions for structural change in the
manufacturing sector due to a lack of sector specific economic modeling consistent with
SSP storylines. However, in some global water models (e.g. WaterGAP), manufacturing
water use intensity is correlated with economic development, i.e. water use intensity is
lower in countries with higher GDP per capita.
Electricity sector
The vast majority of water used in the energy sector is for cooling at thermal power plants,
as water is the most effective medium for carrying away huge quantities of waste heat
(IEA, 2012). Water withdrawals for cooling depend on fuel type and cooling technology.
For example, nuclear power plants require larger water withdrawals per unit of electricity
produced compared to fossil powered plants. Gas-fired power plants are the least water
intensive. There are three basic types of cooling technology in use: once-through-cooling,
recirculation (tower) cooling, and dry cooling. The latter is the least water intensive from
both water withdrawal and consumption point of view but also the least energy efficient

17
(Koch & Vögele, 2009). By changing the cooling system of power plants from once-
through systems to closed circuit systems, the vulnerability of power plants to water
shortages can be reduced.
In general, a power plant’s lifetime is about 35 to 40 years (Markewitz & Vögele, 2001).
When economies have sufficient investment potential (i.e. in HE-2 andHE-3) or the
societal paradigm strives for resource-efficient economies (as in SSP1) we assume an
improved water use efficiency due to structural changes. In these scenarios, power plants
are replaced after a service life of 40 years by plants with modern water-saving tower-
cooled technologies. Such replacement policy is in line with the EU’s policy on
“Integrated Pollution Prevention and Control (IPPC) (Commission, 2008). In addition all
new power plants are assumed to have tower-cooling.
4. Domestic water use
Domestic water use includes water use for personal use, i.e. not for industrial production.
The bulk of water consumed for indoor and outdoor private household purposes (e.g.
drinking water, showers, laundry, swimming pool, irrigation of private gardens). In
addition domestic water use includes municipal water use for public services (e.g.
schools) and for small businesses. Main household water uses include drinking, preparing
food, bathing, washing clothes and dishes, brushing your teeth, watering the yard and
garden.
Worldwide domestic water use currently accounts for about 12% of total human water
withdrawal ( (Flörke, et al., 2013). There is a huge regional variation ranging from less
than 4% in some developing countries (e.g. Vietnam, Nepal) to over 90% in e.g. Ireland
(AQUASTAT). The municipal water use per capita also varies greatly. In many
developing countries municipal water use is less than 50 m3/capita/year. About a dozen
of countries withdraw over 200 m3/capita/year including the United States, Canada,
Australia, Singapore, and Qatar.
4.1 Water dimensions
4.1.1 Components of domestic water use
Components of domestic water use differ significantly between industrialized and
developing regions. The main water use contributors in developed countries are toilet
flushing, showering, laundry and outdoor water use. Smaller contributors are drinking
water for consumption, cleaning (dishes, home, car, …) and other.
Toilet flushing
The average frequency for the number of toilet flushes in Dutch homes is ca. 6 per person
per day. A behaviour campaign (in case of water stress) may help to reduce the flushing

18
frequency or flushing amount but a hygiene culture may be difficult to alter. The volume
per flush is 15 Litre for old toilets, 6 Litre with dual flush for new toilets. A development
towards toilets that use more water is perceivable, e.g. one that uses water for extra
cleaning after each flush. Toilets that use no (or very little water) are being developed,
but so far only installed in pilot projects. The replacement of existing toilets will follow
the replacement rate of homes or bathrooms, ca. 40 years (Foekema and van Thiel 2011).
Shower and bath
The use of a shower or bath or public bath for personal hygiene is determined by the
availability of both the water supply (enough water, enough pressure, household
connections) and the drinking water installation (availability of hot water). In poor
countries where no shower is available now, the water use will increase when showers
are becoming more common.
The showering and bathing frequency are determined by culture and climate. There are
differences between neighboring countries. For example, in the UK bathing is popular, in
the Netherlands people take a bath only once per two weeks on average. Behavior
determines the showering duration. In the Netherlands, teenagers take much longer
showers than elderly people.
Technology determines the flow rate (water saving shower head and type of water heater).
More luxurious showers with a high flow rate are on the market and are being installed
in richer countries. In countries where showers are available the installation of water
saving shower heads takes ca. 20 years, when it reaches a ceiling. Note that at the same
time the shower frequency has increased which lead to an increase in water use for the
shower. The shower frequency is related to the average temperature (Foekema and van
Thiel 2011).
Laundry
With a growing economy more people own a washing machine and wash their clothes
more often. These increases will not be endless, but there will be a plateau value. The
frequency of clothes washing with a washing machine is determined by behaviour and
influenced by perception of what needs to be washed.
Technology determines the water volume used per washing cycle. For example, a top
loader washing machine with a vertical axis uses much more water than a front loader
machine with a horizontal axis (where only the bottom half of the machine is filled with
water). The energy use of a washing machine is largely determined by the heating of the
water; less water means less energy use. Energy conservation was a big driver for water
conservation of washing machines. In Western Europe front loaders with energy label
AAA (EU labelling) are most common. In the USA top loaders are still the most common.
In Asia there are top loaders that do not heat the water. New technologies aim at using
less soap and less warm water. However, new cleansing technologies may not require less
water. The replacement of existing washing machines takes ca. 30 years (Foekema and
van Thiel 2011).
Outdoor water use
Outdoor water use is used for watering the garden, swimming pools, washing the car, etc.
Awareness may lead to using alternative sources (rain water, ground water, surface water)
19
or less water (no green grasses needed, re use water in a car wash). Hose pipe bans are
known measures during dry periods.
4.1.2 Drivers for domestic water use
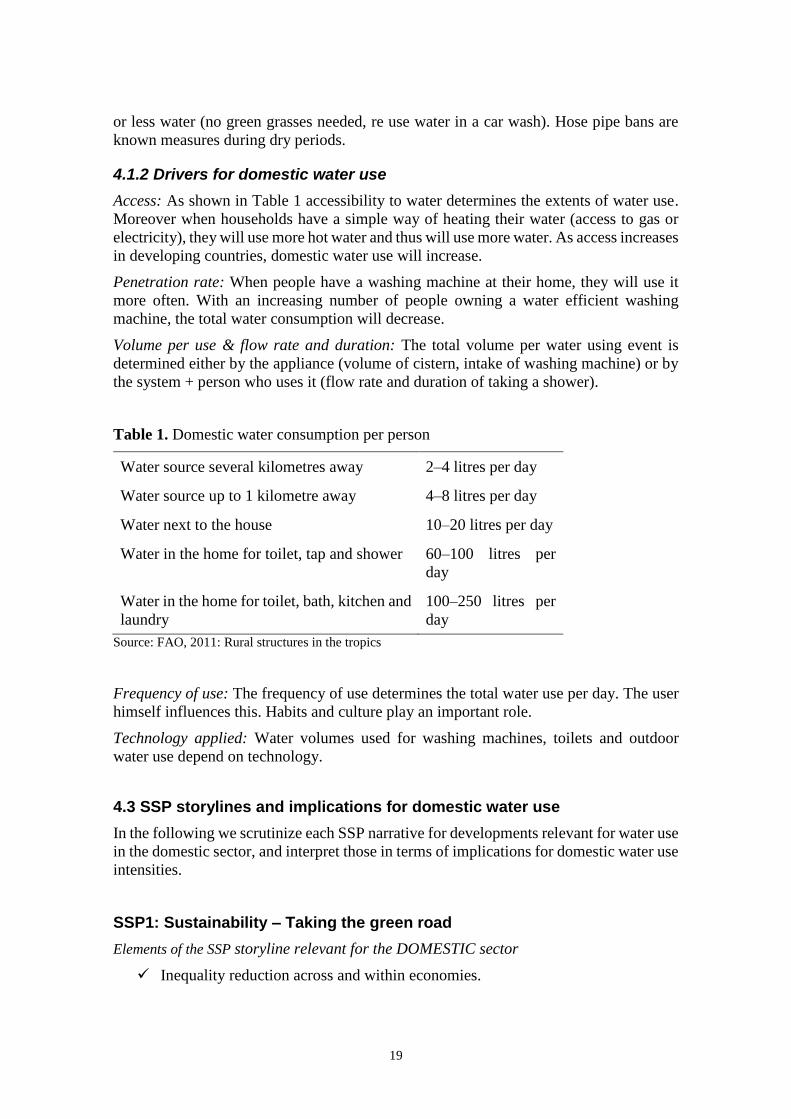
Access: As shown in Table 1 accessibility to water determines the extents of water use.
Moreover when households have a simple way of heating their water (access to gas or
electricity), they will use more hot water and thus will use more water. As access increases
in developing countries, domestic water use will increase.
Penetration rate: When people have a washing machine at their home, they will use it
more often. With an increasing number of people owning a water efficient washing
machine, the total water consumption will decrease.
Volume per use & flow rate and duration: The total volume per water using event is
determined either by the appliance (volume of cistern, intake of washing machine) or by
the system + person who uses it (flow rate and duration of taking a shower).
Table 1. Domestic water consumption per person
Water source several kilometres away 2–4 litres per day
Water source up to 1 kilometre away 4–8 litres per day
Water next to the house 10–20 litres per day
Water in the home for toilet, tap and shower 60–100 litres per
day
Water in the home for toilet, bath, kitchen and
laundry
100–250 litres per
day
Source: FAO, 2011: Rural structures in the tropics
Frequency of use: The frequency of use determines the total water use per day. The user
himself influences this. Habits and culture play an important role.
Technology applied: Water volumes used for washing machines, toilets and outdoor
water use depend on technology.
4.3 SSP storylines and implications for domestic water use
In the following we scrutinize each SSP narrative for developments relevant for water use
in the domestic sector, and interpret those in terms of implications for domestic water use
intensities.
SSP1: Sustainability – Taking the green road
Elements of the SSP storyline relevant for the DOMESTIC sector
Inequality reduction across and within economies.

20
Effective and persistent cooperation and collaboration across the local, national,
regional and international scales and between public organizations, the private
sector and civil society within and across all scales of governance.
Resource use efficiency optimization associated with urbanizing lifestyles.
Changing consumption and investment patterns.
Civil society helps drives the transition from increased environmental
degradation to improved management of the local environment and the global
commons.
Research and technology development reduce the challenges of access to safe
water.
Emphasis on promoting higher education levels, gender equality, access to
health care and to safe water, and sanitation improvements.
Investments in human capital and technology lead to a relatively low population.
Better-educated populations and high overall standards of living confer
resilience to societal and environmental changes with enhanced access to safe
water, improved sanitation, and medical care.
Implications for domestic water use intensity
Management of the global commons will slowly improve if cooperation and
collaboration of local, national, and international organizations and institutions,
the private sector, and civil society is enhanced.
A demographic transition to lower population levels can be achieved if
education and health investments are increased.
Inequality can be reduced both across and within countries if development goals
are achieved.
Sustainability relies on increasing environmental awareness in societies around
the world.
Industrialized countries support developing countries in their development goals
by providing access to human and financial resources and new technologies.
SSP2: Middle of the road
Elements of the SSP storyline relevant for the DOMESTIC sector
Moderate awareness of the environmental consequences of choices when using
natural resources.
There is relatively weak coordination and cooperation among national and
international institutions, the private sector, and civil society for addressing
environmental concerns.
Education investments are not high enough to rapidly slow population growth.
Access to health care and safe water and improved sanitation in low-income
countries makes unsteady progress.
Gender equality and equity improve slowly.

21
Consumption is oriented towards material growth, with growing consumption of
animal products.
Conflicts over environmental resources flare where and when there are high
levels of food and/or water insecurity.
Growing energy demand lead to continuing environmental degradation.
Implications for domestic water use intensity
Weak environmental awareness trigger slow water security and progress in water
use efficiencies.
Global and national institutions lack of cooperation and collaboration make slow
progress in achieving sustainable development goals.
Growing population and intensity of resource leads to environmental systems
degradation.
Lower education investments do not promote slow population growth.
Access to health care, safe water, and sanitation services are affected by
population growth and heterogeneities within countries.
Conflicts over natural resources access and corruption trigger the effectiveness of
development policies.
SSP3: Regional Rivalry – A rocky road
Elements of the SSP storyline relevant for the DOMESTIC sector
Societies are becoming more skeptical about globalization.
Countries show a weak progress in achieving sustainable development goals.
Environmental policies have a very little importance. Serious degradation of the
environment becomes more important.
Cooperation among organizations and institutions is weak. Their leadership is
highly questionable.
Low investments in education and in technology increases socioeconomic
vulnerability.
Growing population and limited access to health care, safe water and sanitation
services challenge human and natural systems.
Gender equality and equity remain stable.
Consumption is material intensive and economic development remains stratified
by socioeconomic inequalities.
Implications for domestic water use intensity
Countries are pushed to focus on domestic issues.
National and regional security issues foster stronger national policies to secure
water resources access and sanitation services.
Consumption is primarily material-intensive and water use important.
A move towards sustainable development goals will lead to authoritarian forms
of government and, consequently to a rise in social water awareness.

22
Water security and environmental systems health is trigger by high levels of water
consumption and limited development on human capital.
National rivalries between the countries in a certain region weak progress toward
development goals and increases competition for natural resources.
SSP4: Inequality – A road divided
Elements of the SSP storyline relevant for the DOIMESTIC sector
Inequalities between and within countries are driven by reduced technology
development and higher education.
Population has limited access to national institutions.
Environmental awareness is limited. Very little attention is given to global
environmental problems and their consequences for poorer social groups.
Decision power is concentrated between certain nations and business.
The most vulnerable groups have little representation. Lack of capacity to
organize themselves challenges their opportunities to access natural resources,
higher levels of education and water security.
Economic opportunities are not generalized and many people have limited
participation opportunities.
Economic uncertainty leads to relatively low fertility and low population growth
in industrialized countries.
In low-income countries, large cohorts of young people result from high fertility
rates.
Lack of access to health translates into high levels of mortality.
People rely on local resources when technology diffusion is uneven.
Socioeconomic inequities trigger governance capacity and challenge progress
towards sustainable goals.
Agriculture is dominated by industrialized agriculture and monoculture
production.
Food trade is global, but access to market is limited.
Challenges to land use management and to adapt to environmental degradation
are high.
Implications for domestic water use intensity
A move towards more domestic water intensive use will lead to a rise in water
consumption and use of local resources.
New technologies and technical progress will have an impact on water coverage
and water sanitation services.
Increasing equality in access to education will favor substantial population
participation in economic activities.
Environmental awareness will be more important if educational gaps are reduced.
Access to effective institutions will foster social adaptation and it will reduce
environmental stress.
SSP5: Fossil-fueled development—Taking the highway

23
Elements of the SSP storyline relevant for the DOMESTIC sector
Global economic growth promotes robust growth in demand for services and
goods.
Developing countries aim to follow the fossil- and resource-intensive
development model of the industrialized countries.
Rise in global institutions and global coordination.
Competitive markets and more effective institutions lead to lower levels of
corruption and strong rule of law.
Social cohesion and gender equality are strengthened, and consequently social
conflicts are decreased.
More important economic cooperation.
Higher education and better health care accelerate human capital development,
and decline fertility levels.
Investments in technological innovation are very high leading to increasing labor
productivity, fossil energy supply, and managing the natural environment.
Implications for domestic water use intensity
Accelerated globalization and rapid development are based on exploitation of
fossil fuel resources and the adoption of resources and energy intensive lifestyles.
Social international mobility increases because of labor markets opening.
Industrialization is driven by high energy demand and engineered infrastructure.
Higher demand for services and goods promote an increase use of fossil resources.
Urbanization leads to more structural investments in technology innovation.
Technological progress translates into strong resilience on fossil fuels and lower
environmental concerns.
4.3 Qualitative and quantitative scenario assumptions
4.3.1 Technological change rates
Technology influences the volume of water required for specific domestic uses (e.g. toilet,
washing machine, dishwasher, shower). Water use intensities decrease with the
availability and speed of introduction of new technologies.
Technological change is an integral part of the economy of a country or region. The legal,
institutional, education and financial systems determine the potential for innovation and
their implementation. Against this background we argue that the interpretation of
technological change in the context of SSPs and position of individual countries in hydro-
economic classes is similar in the industry and domestic sector. Therefore the qualitative
and quantitative scenario assumptions specified in section 2.3 are also valid for the
domestic sector. This approach is compatible with global water use models, which apply
similar technological change rates for the industry and domestic sector.

24
4.3.2 Structural changes: Access and Behavior
Structural changes in the domestic sector refer to the number of people having access to
water sources and behavior. Only in SSP1 (Sustainability Scenario), we assume by 2050
a 20% reduction in domestic water use intensity due to behavioral changes. The WFaS
‘fast-track’ applied global water use models calculate domestic water use at the national
level where access to safe drinking water is not considered.
5. Agricultural water use
At the global level, agriculture is by far the largest user of water accounting for about
70% of the total human water withdrawals. In many developing countries agriculture
accounts for over 90% of total water use. The vast majority of water use in agriculture is
for irrigation. In addition some water use is for raising livestock herds in intensive
production systems (feedlots and finishing systems). Although water uses for direct
animal watering (cooling) and drinking are small, they are rapidly growing and of
importance in selected countries (e.g. Australia, Botswana).
5.1 Water dimensions related to agricultural production
There are various important water dimensions/elements related to agricultural production,
crop productivity and resource use. Of particular interest here are the variables associated
with irrigation development, which have been subdivided into four dimensions:
1) Irrigation cropping intensity: indicates the multiple use of irrigated land within
one year; it is defined as the ratio of [harvested irrigated crop area] to [actually
irrigated land equipped with irrigation].
Cropping intensity on irrigated land generally depends on several factors: (i) the
thermal regime of a location, which determines how many days are available for
crop growth and how many crops in sequence can possibly be cultivated; (ii)
irrigation water availability and reliability of water supply; and (iii) sufficient
availability of inputs, agricultural labor and/or mechanization. In case of terrain
limitations for mechanization and labor shortages, e.g. due to employment outside
agriculture and/or low population growth, such economic reasons may not allow to
realize the climatic potential (e.g., such as has been happening in some eastern
provinces of China where multi-cropping factors have been decreasing in recent
years). In general, however, future changes in irrigation intensity will tend to
increase with warming in temperate zones, but may be limited or even decrease
where seasonal water availability is a major constraint.
2) Utilization intensity of irrigated land: is given by the ratio of [actually irrigated
land] to [land equipped with irrigation].
There are (at least) four factors that may affect actual utilization of areas equipped
for irrigation. First, in a context of increased competitiveness (e.g. due to sector
liberalization) and possibly shrinking land intensity, actually irrigated areas may

25
decrease more than the area equipped for irrigation. Second, in a context where
additional areas are equipped for irrigation to reduce drought risk, i.e. as a safeguard
against ‘bad’ years, the effect could be an increase of area equipped for irrigation
but an overall reduction of utilization of these areas, because such areas would not
be irrigated every year. Third, when water availability deteriorates (or cost of
irrigation/groundwater increases), farmers may be forced to reduce utilization of
areas equipped for irrigation. Fourth, it is conceivable that under poor economic
conditions and incentives some areas equipped for irrigation are not well
maintained and may become unusable.
3) Irrigation efficiency: measures the effectiveness of an irrigation system in terms
of the ratio of [crop irrigation water requirements] over [irrigation water
withdrawals].
Overall irrigation efficiency is a function of the type of irrigation used and the
technology being used within each type. Future changes will largely depend on
investments being made to shift to more efficient irrigation types and to updating
each type’s technology to state-of-the-art, and to some extent will depend on crop
type (for instance, paddy rice needs flood irrigation, for some crops sprinkler
cannot be used, for some drip irrigation may be too expensive) and possibly new
cultivation practices. Therefore, judging about future irrigation efficiency requires
an inventory/estimation of the status quo (current distribution by type of irrigation
and crops irrigated) and a projection of future irrigation systems and related
technology assumptions.
4) Area equipped for irrigation: Area equipped to provide water (via irrigation) to
crops. It includes areas equipped for full/partial control irrigation, equipped
lowland areas, and areas equipped for spate irrigation.
Changes in a country’s area equipped for irrigation will depend on several
economic, technological and political factors, which determine the need, economic
profitability and biophysical viability of irrigation expansion. Key factors included
among these are: (i) availability, reliability and access to water; (ii) irrigation impact
(yield increase and/or reduced variability); (iii) growth of demand for agricultural
produce due to demographic and economic changes; (iv) availability of resources
with rain-fed potential for conversion to agriculture (where available, these might
be preferable and cheaper to develop rather than expanding irrigation); (v) existing
current yield gaps in rain-fed and/or irrigated land; (vi) cost of irrigation; (vii)
profitability and economic means available to invest in irrigation; (viii) state food
security and self-reliance policies.
5.2 SSP storylines and implications for agricultural water use
Here we provide a brief summary of the salient features that characterize different shared
socio-economic development pathways (SSPs) and we indicate some direct and indirect
consequences this may have for the agricultural sector and associated irrigation water use.
SSP1: Sustainability – Taking the green road
In SSP1 the world is gradually moving toward sustainability.

26
Sustainability concerns; more stringent environmental regulation implemented
Rapid technological change
Energy efficiency and improved resource efficiency
Relatively low population growth; emphasis on education
Effective institutions
Wide access to safe water
Emphasis on regional production
Some liberalization of agricultural markets
Risk reduction and sharing mechanisms in place
The above general tendencies of development in the SSP1 World can be interpreted to
have the following agriculture/irrigation related implications:
Improved agricultural productivity and resource use efficiency
Quite rapid reduction of prevailing yield gaps toward environmentally
sustainable and advanced technology yield levels
Improving nutrition with environmentally benign diets with lower per capita
consumption of livestock products
Enforced limits to groundwater over-exploitation
Large improvements of irrigation water use efficiency
Reliable water infrastructure and water sources
Enhanced treatment and reuse of water
Concern for pollution reduction and water quality, implying widespread
application of precision farming and nutrient management
Risk management and related measures implemented to reduce and spread yield
risks
SSP2: Middle of the road
In SSP2 the world is the world is progressing along past trends and paradigms.
Most economies are politically stable
Markets are globally connected but function imperfectly
Slow progress in achieving development goals of education, safe water, health
care
Technological progress but no major breakthrough
Modest decline in resource use intensity
Population growth levels off in second half of century
Urbanization proceeds according to historical trends
Consumption is oriented towards material growth
Environmental systems experience degradation
Significant heterogeneities exist within and across countries
Food and water insecurity remain in areas of low-income countries
Barriers to enter agricultural markets are reduced only slowly
Moderate corruption slows effectiveness of development policies

27
The SSP2 World is characterized by dynamics similar to historical developments. This
would imply continuation of agricultural growth paths and policies, continued protection
of national agricultural sectors, and further environmental damages caused by agriculture:
Modest progress of agricultural productivity
Slow reduction of yield gaps especially in low-income countries
Increasing per capita consumption of livestock products with growing incomes
Persistent barriers and distortions in international trade of agricultural products
No effective halt to groundwater over-exploitation
Some improvements of water use efficiency, but only limited advances in low-
income countries
Some reduction of food insecurity due to trickle down of economic development
Food and water insecurity remain as problems in some areas of low-income
countries
No effective measures to prevent pollution and degradation by agricultural
practices; environmental risks caused by intensive application of fertilizers and
agro-chemicals, and intensive and concentrated livestock production systems
Only moderate success in reducing climate risks and vulnerability
SSP3: Regional rivalry
In SSP3 the world development is stagnating.
Growing concerns about globalization and focus on national/regional issues and
interests
Markets (agriculture, energy) are protected and highly regulated
Global governance and institutions are weak
Low priority for addressing environmental problems
Slow economic growth
Low investment in education and technology development
Poor progress in achieving development goals of education, safe water, health
care
Increase in resource use intensity
Population growth low in developed, high in developing countries; overall large
increase
Urbanization proceeds slowly; disadvantaged continue to move to unplanned
settlements
Serious degradation of environmental systems in some regions
Large disparities within and across countries
Weak institutions contribute to slow development
Development in the SSP3 World will lead to manifold problems in food and agriculture,
with implications for irrigation development and water challenges, characterized by:
Poor progress with agricultural productivity improvements in low-income
countries due to lack of investment and education
Widespread lack of sufficient investment and capacity for yield gap reduction in
developing countries
Growing protection of national agricultural sectors and increasing agricultural
trade barriers

28
Low priority to halt environmental degradation caused by agriculture (erosion,
deforestation, poor nutrient management, water pollution and exploitation)
Widespread pollution and deterioration of ecosystems
Continued deforestation of tropical rain-forests
Only modest improvements of irrigation water use efficiency
Persistent over-exploitation of groundwater aquifers
Widespread lack of access to safe water and sanitation
Unreliable water and energy supply for agricultural producers
Food and water insecurity persist as major problems in low-income countries
High population growth and insufficient development leave behind highly
vulnerable human and environmental systems
SSP4: Inequality – A road divided
In SSP4 inequalities and fragmentation is increasing.
Inequalities within and between countries increase; fragmentation increases
Wealth and income increasingly concentrate at the top
Global governance and institutions are weak
Public expenditures focus on and benefit a small, highly educated elite
Polarization creates a mixed world with income inequality increasing
Political and economic power becomes more concentrated in a small political
and business elite
Increasing price volatility in biomass and energy markets
Well-educated elite induces technical progress and efficiency improvements
A world that works well for the elite but where development stagnates or
decreases opportunities for those left behind
Low fertility in developed countries. High fertility and high urbanization in low
and middle income countries.
Large disparities of incomes and well-being within and across countries
Poor access to institutions by the poor
No adequate protection for those losing out in development; these groups lose
assets and livelihoods
Development in the SSP4 World creates a polarization and unequal societies with small
and well-educated elites and a large share of poor and under-privileged citizens. For
agriculture/irrigation use this may imply:
In part, a trend towards large, technologically advanced and profitable farms. Yet,
at the same time also poor progress of agricultural productivity in low-income
farm households due to lack of investment and education
Land and water grabbing to the benefit of elites and large international agro-
complexes
Efficient irrigation systems used for profitable and internationally traded cash
crops. Little improvements in irrigation efficiencies of the low income farm sector
In low-income countries, food and water insecurity persist as major problems
outside the privileged elites
High population growth in developing countries and polarizing development
leave behind highly vulnerable rural systems

29
No adequate protection for those losing out in development; these groups lose
assets and livelihoods
Co-existence of well-organized agricultural production and marketing chains,
run by the elite, and wide-spread subsistence and landless dwellers in rural areas
SSP5: Fossil-fueled development
In the SSP5 World is living the “development first” paradigm
World is developing rapidly, powered by cheap fossil energy
Economic success of emerging economies leads to convergence of incomes
Decline of income inequality within regions
World views oriented towards market solutions
Developing countries follow the development model of the industrial countries
Rapid rise in global institutions
Strong rule of law; lower levels of corruption
Accelerated globalization and high levels of international trade
Policies emphasizing education and health
Consumerism, resource-intensive status consumption, preference for individual
mobility
Population peaks and declines in 21st century
Strong reduction of extreme poverty
Very high global GDP; continued large role of manufacturing sector
All regions urbanize rapidly
Widespread technology optimism; high investments in technological innovations
Local environmental problems addressed effectively; however, lack of global
environmental concern and solutions
Development in the SSP5 World is rapid and based on consumerism, fossil energy, and
fast technological progress. World views and policies are following an “economics and
development first” paradigm:
Agro-ecosystems become more and more managed in all world regions
Large increases in agricultural productivity; diffusion of resource-intensive
management practices in agriculture
Large improvements of irrigation water use efficiency
Enhanced treatment and reuse of water
High per capita food consumption and meat-rich diets globally
Land and environmental systems are highly managed across the world
Large reduction of agricultural sector support measures
Global agricultural markets are increasingly integrated and competitive
Improved accessibility due to highly engineered infrastructures
Large-scale engineering of water infrastructure to manage and provide reliable
water supply
Economic use of land is given priority over nature protection and sustainability
of ecosystems

30
5.3 Qualitative scenario assumptions
After summarizing the main characteristics and storyline features of each SSP and
interpret their relevance and implication for agricultural production conditions and
irrigated agriculture, we go into a qualitative rating of scenario specific
agricultural/irrigation water dimensions.
5.3.1 Irrigation cropping intensity
As pointed out, changes in cropping intensity on irrigated land – i.e. multiple use of the
land within one year (ideally measured as irrigated cropping days per year) – critically
depends on changes in the thermal (and possibly precipitation) regime of a location.
Water shortage, high economic costs of irrigation and shortage of labor/mechanization
could mean that farmers are not able or do not want to exploit longer thermal growing
seasons (under climate change). Such socio-economic and demographic limitations are
more likely to occur in SSP 1 and SSP 5. According to our definition of hydro-economic
classes, physical and economic water scarcity may limit cropping intensity in the
countries of H-E 3 and H-E 4.
Water Dimension – Irrigation Cropping Intensity Assumptions
SSP/Class
HE-1 HE-2 HE-3 HE-4
T T WL WL
Irrigation Cropping Intensity (harv ha/irrig ha)
SSP 1 EL EL-T EL-T EL-WL EL-WL
SSP 2 T T T T-WL T-WL
SSP 3 T T T T-WL T-WL
SSP 4 T T EL-T T-WL T-WL
SSP 5 EL EL-T EL-T EL-WL EL-WL Source: WFaS, IIASA
In the water dimensions table for ‘Irrigated cropping intensity’ the symbol ‘T’ is used to
indicate ‘according to thermal regime trend’, ‘EL’ to indicate below-potential intensities
due to demographic/economic limitations, and ‘WL’ to mean intensities will be below
the thermal potential due to water limitations.
In sector-specific or comprehensive integrated assessment modeling where all relevant
explanatory factors are simulated, the rationale reflected in the assumptions table can be
incorporated in the simulated cropping and land use decisions. For modeling and
exploratory assessments, where such detail is not possible, the assumptions table can be
condensed into a simple rating table, as given below.
In this table, an ‘A’ rating is used to indicate increase of irrigation cropping intensity
when warming occurs; note, this will still depend on broad climatic characteristics, e.g.
by thermal climate zones (tropics = no increase due to warming; sub-tropics = very
modest increase; temperate zone = significant lengthening of growing season and increase
of multi-cropping with temperature).
Water Dimension – Irrigation Cropping Intensity Rating
SSP/Class
HE-1 HE-2 HE-3 HE-4
T T WL WL
SSP 1 EL B B C C

31
Irrigation Cropping Intensity (harv ha/irrig ha)
SSP 2 T A A B B
SSP 3 T A A B B
SSP 4 T A B B B
SSP 5 EL B B C C Source: WFaS, IIASA
5.3.2 Utilization intensity of area equipped for irrigation
Changes in the actual utilization of ‘areas equipped for irrigation’ will as well depend on
a mixture of agronomic and economic factors including biophysical changes, costs and
profitability, risk mitigation objectives, and capital constraints in rehabilitation and
maintenance. It is worth noting that FAO estimates a 40-year average life time of an
irrigation system, which implies that on average 2.5% of the area equipped has to be
rehabilitated/re-equipped each year. There is only some empirical information available,
estimates of areas actually irrigated are incomplete and only point estimates but no time-
series exist. Therefore, the assumptions table concerning the utilization intensity of areas
equipped for irrigation is somewhat speculative and will benefit from inputs by sector
stakeholders.
Water Dimension – Irrigation Utilization Intensity Assumptions
SSP/Class
HE-1 HE-2 HE-3 HE-4
T R R T
Irrigation Utilization Intensity (irrig ha/equ. ha)
SSP 1 R R-T R R R-T
SSP 2 T T T T-R T
SSP 3 R/T R-T T-R T-R R-T
SSP 4 R R-T R R R-T
SSP 5 T T T-R T-R T Source: WFaS, IIASA
Our assumption concerning different hydro-economic classes is that utilization of
irrigation systems in economically rich countries (HE-2 and HE-3) could decrease (as
indicated by ‘R’) due to the fact that areas may increasingly be equipped to reduce drought
risks, stabilize production and buffer against possible increasing variability. Across SSPs,
we consider conditions and objectives in development path SSP 1 and SSP 4 to possibly
lead to reduced utilization rates. A simplified rating table is presented below where the
‘C’ rating indicates a tendency toward lowering utilization rates whereas an ‘A’ rating
suggests maintaining or even increasing utilization rates of equipped areas.
Water Dimension – Irrigation Utilization Intensity Rating
SSP/Class
HE-1 HE-2 HE-3 HE-4
T R R T
Irrigation Utilization Intensity (irrig ha/equ. ha)
SSP 1 R B C C B
SSP 2 T A A B A
SSP 3 R/T B B B B
SSP 4 R B C C B
SSP 5 T A B B A Source: WFaS, IIASA

32
5.3.3 Irrigation water use efficiency
Overall irrigation water use efficiency is a function of the type of irrigation system being
used and the specific technology available within each type. Future changes will largely
depend on investments being made to shift to more efficient irrigation types and to
updating each type’s technology to state-of-the-art, and to some extent will depend on
crop type (for instance, paddy rice needs flood irrigation and additional irrigation water
for cultivation; for some crops sprinkler cannot be used; for some drip irrigation may be
too expensive). In the assumptions table, the symbol ‘H’ indicates higher economic
capacity (compared to trend) to improve irrigation efficiency, and when used across
hydro-economic classes means high incentive to improve water use efficiency due to
water scarcity and hydrological complexity. The symbols ‘M’ and ‘L’ indicate
respectively ‘average/moderate’ and ‘low’ capability or incentives.
As a general principal, we are assuming that: (i) high hydrological complexity will tend
to induce improvements in irrigation water use efficiency; (ii) high economic growth and
income per capita will allow fast improvements of irrigation efficiency; and (iii) low
income, inefficient institutions and low hydrological complexity will combine to result in
little or no improvement of irrigation water use efficiency.
Water Dimension – Irrigation Water Use Efficiency Assumptions
SSP/Class
HE-1 HE-2 HE-3 HE-4
L M H H
Irrigation Utilization Intensity (irrig ha/equ. ha)
SSP 1 H H-L H-M H H
SSP 2 M M-L M M-H M-H
SSP 3 L L L-M L-H L-H
SSP 4 M M-L M M-H M-H
SSP 5 H H-L H-M H H Source: WFaS, IIASA
The above table has been simplified into a rating table using five classes, rated ‘A’ to ‘E’,
which reflect the combination of economic capacity and magnitude of water challenges
that can be derived from the scenario narratives and hydro-economic classification. The
‘A’ rating is used for the combination of high economic capability, high priority and high
urgency to increase water use efficiency due to limited water availability. On the opposite
side of the rating scale, the ‘E’ rating signals that neither the economic means nor the
urgency exist to prioritize and allow investments in irrigation water use efficiency. Hence,
we expect that the strongest incentives and support to move toward the technically
possible will exist in SSP 1 and SSP 5 and particularly so in water-scarce countries in
HE-3 and HE-4.
Water Dimension – Irrigation Water Use Efficiency Rating
SSP/Class
HE-1 HE-2 HE-3 HE-4
L M H H
Irrigation Utilization
SSP 1 H C B A A
SSP 2 M D C B B
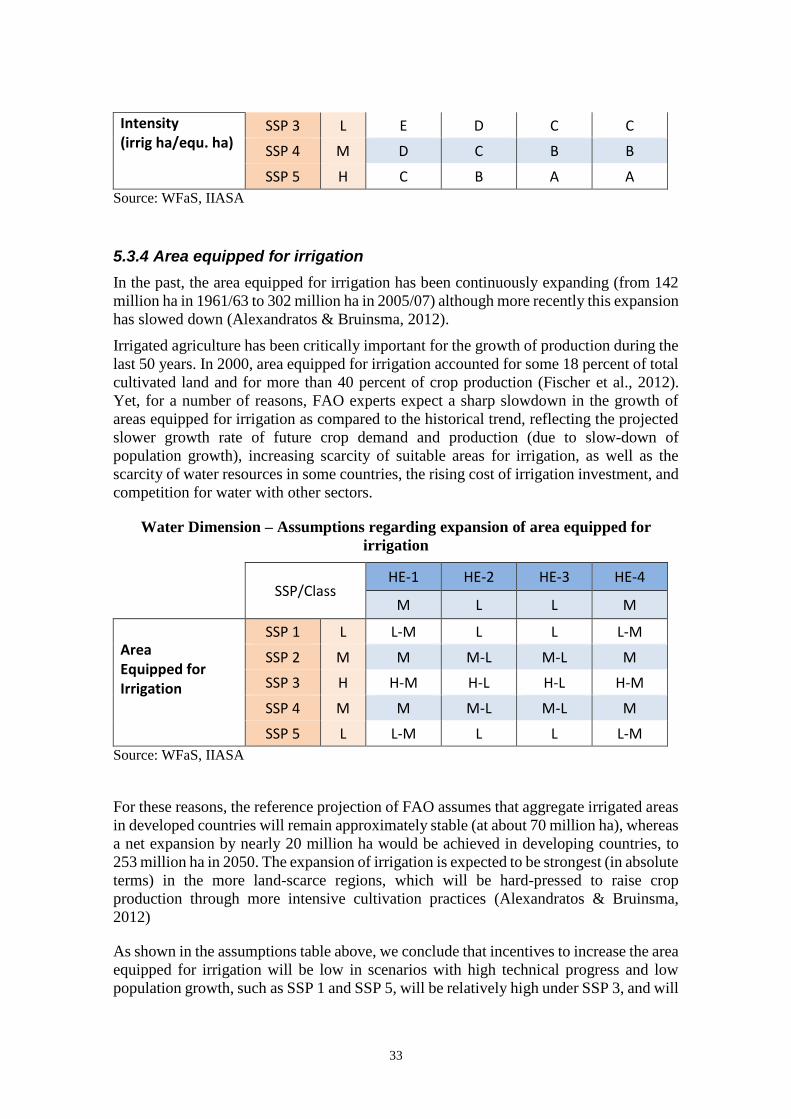
33
Intensity (irrig ha/equ. ha)
SSP 3 L E D C C
SSP 4 M D C B B
SSP 5 H C B A A
Source: WFaS, IIASA
5.3.4 Area equipped for irrigation
In the past, the area equipped for irrigation has been continuously expanding (from 142
million ha in 1961/63 to 302 million ha in 2005/07) although more recently this expansion
has slowed down (Alexandratos & Bruinsma, 2012).
Irrigated agriculture has been critically important for the growth of production during the
last 50 years. In 2000, area equipped for irrigation accounted for some 18 percent of total
cultivated land and for more than 40 percent of crop production (Fischer et al., 2012).
Yet, for a number of reasons, FAO experts expect a sharp slowdown in the growth of
areas equipped for irrigation as compared to the historical trend, reflecting the projected
slower growth rate of future crop demand and production (due to slow-down of
population growth), increasing scarcity of suitable areas for irrigation, as well as the
scarcity of water resources in some countries, the rising cost of irrigation investment, and
competition for water with other sectors.
Water Dimension – Assumptions regarding expansion of area equipped for
irrigation
SSP/Class
HE-1 HE-2 HE-3 HE-4
M L L M
Area Equipped for Irrigation
SSP 1 L L-M L L L-M
SSP 2 M M M-L M-L M
SSP 3 H H-M H-L H-L H-M
SSP 4 M M M-L M-L M
SSP 5 L L-M L L L-M
Source: WFaS, IIASA
For these reasons, the reference projection of FAO assumes that aggregate irrigated areas
in developed countries will remain approximately stable (at about 70 million ha), whereas
a net expansion by nearly 20 million ha would be achieved in developing countries, to
253 million ha in 2050. The expansion of irrigation is expected to be strongest (in absolute
terms) in the more land-scarce regions, which will be hard-pressed to raise crop
production through more intensive cultivation practices (Alexandratos & Bruinsma,
2012)
As shown in the assumptions table above, we conclude that incentives to increase the area
equipped for irrigation will be low in scenarios with high technical progress and low
population growth, such as SSP 1 and SSP 5, will be relatively high under SSP 3, and will

34
be moderate under SSP 2 and SSP 4. When looking across countries in different hydro-
economic classes, incentives for expansion will be moderate in developing countries of
HE-1 and HE-4, but for demographic and economic reasons only low in countries of HE-
2 and HE-3.
For practical use, the above table can be simplified into a rating table using four classes,
rated ‘A’ to ‘D’, which reflect the combination of demand growth, land abundance and
magnitude of water challenges that can be derived from the scenario narratives and hydro-
economic classification. While a ‘D’ rating signals modest decline (or at best stagnation)
of areas equipped for irrigation, the ‘A’ rating indicates conditions under which the area
equipped for irrigation can be expected to increase. Hence, we expect that the strongest
incentives and need to expand the irrigated areas will exist in developing countries under
SSP 3, the least in developed countries (HE-2 and HE-3) especially under SSP 1 and SSP
5.
Water Dimension – Rating the growth of area equipped for irrigation
SSP/Class
HE-1 HE-2 HE-3 HE-4
M L L M
Area Equipped for Irrigation
SSP 1 L C D D C
SSP 2 M B C C B
SSP 3 H A B B A
SSP 4 M B C C B
SSP 5 L C D D C
Source: WFaS, IIASA
It should be noted that the above rating table can provide general guidance only. In a
country’s reality, several and diverse factors will determine the future expansion of land
equipped for irrigation: (1) water availability and reliability, and cost of access; (2)
availability of suitable land resources for conversion to rain-fed agriculture (as an
alternative to irrigated cropping); (3) prevailing yield gaps; (4) demand growth for food
and non-food biomass, and population growth; (5) state security and food self-reliance
policies; (6) economic wealth.
6. Preliminary results of the WFaS 'fast-track' assessment
For the quantification of global scenarios of future water demand an ensemble of three
global water models was used: H08 (Hanasaki, et al., 2008) (Hanasaki, et al., 2008), PCR-
GLOBWB (Wada, et al., 2011) (Wada, et al., 2011) (Wada, et al., 2014), and WaterGAP
(Döll, et al., 2003) (Döll, et al., 2012) (Flörke, et al., 2013).
Note that due to the fact that new SSP scenarios of future land use changes are still being
developed for agricultural sector, we have not yet included irrigation and livestock sector
in this ‘fast-track’ analysis. For a comprehensive assessment of future irrigation under the

35
latest RCP scenarios, we refer to (Wada, et al., 2013) who used a set of seven global water
models to quantify the impact of projected global climate change on irrigation water
demand by the end of this century, and to assess the resulting uncertainties arising from
both the global water models and climate projections.
In addition, due to limited data available for future ecosystem service, we did not include
the assessment of environmental flow requirements. We refer to (Pastor, et al., 2014) for
a comprehensive assessment of global environmental flow requirements. Thus, here we
primarily focus on the industrial (electricity and manufacturing) and domestic sectors.
6.1 Summary of drivers and assumptions
We simulate the characteristic macro-scale behavior of water demand per sector, based
on various input data and associated scenario assumptions described in the former
sections and summarized in Table 2 and 3. Critical water dimensions were evaluated
qualitatively and quantitatively for each SSP and Hydro-Economic class. In the WFaS
‘fast-track’ analysis we’ve selected three SSP based scenarios for the quantification of
spatially explicit global water use until 2050.
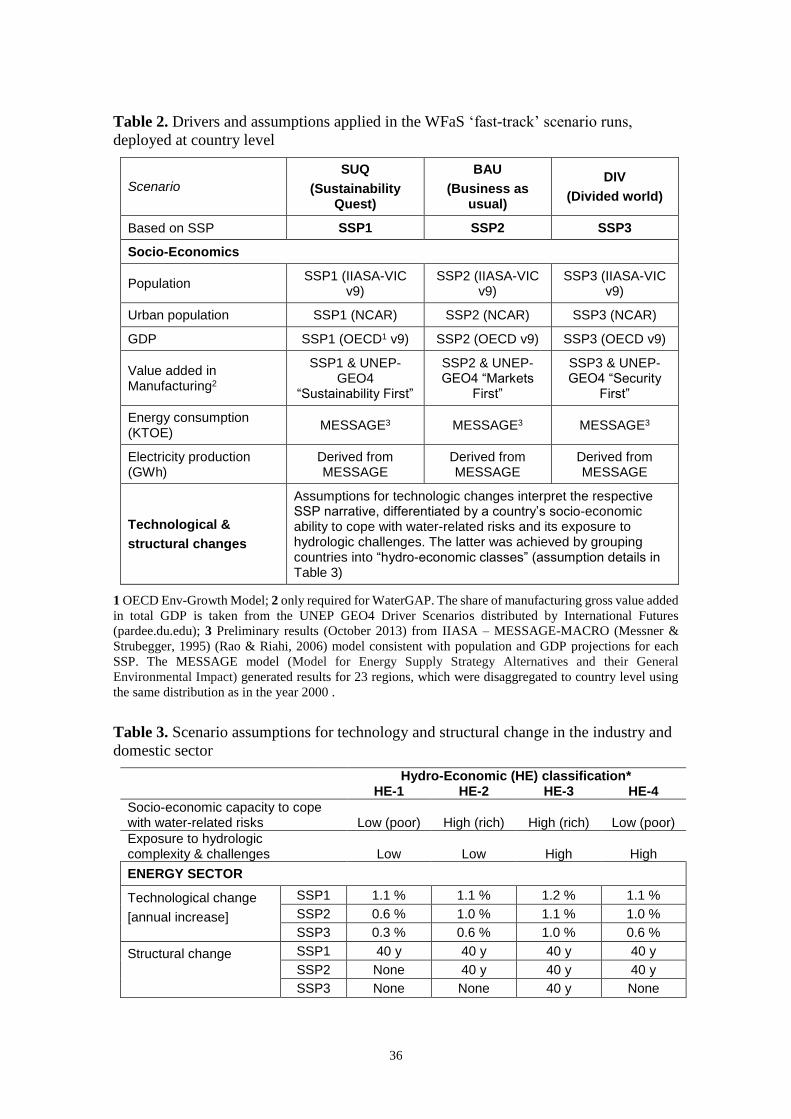
36
Table 2. Drivers and assumptions applied in the WFaS ‘fast-track’ scenario runs,
deployed at country level
Scenario
SUQ
(Sustainability Quest)
BAU
(Business as usual)
DIV
(Divided world)
Based on SSP SSP1 SSP2 SSP3
Socio-Economics
Population SSP1 (IIASA-VIC
v9) SSP2 (IIASA-VIC
v9) SSP3 (IIASA-VIC
v9)
Urban population SSP1 (NCAR) SSP2 (NCAR) SSP3 (NCAR)
GDP SSP1 (OECD1 v9) SSP2 (OECD v9) SSP3 (OECD v9)
Value added in Manufacturing2
SSP1 & UNEP-GEO4
“Sustainability First”
SSP2 & UNEP-GEO4 “Markets
First”
SSP3 & UNEP-GEO4 “Security
First”
Energy consumption (KTOE)
MESSAGE3 MESSAGE3 MESSAGE3
Electricity production (GWh)
Derived from MESSAGE
Derived from MESSAGE
Derived from MESSAGE
Technological &
structural changes
Assumptions for technologic changes interpret the respective SSP narrative, differentiated by a country’s socio-economic ability to cope with water-related risks and its exposure to hydrologic challenges. The latter was achieved by grouping countries into “hydro-economic classes” (assumption details in Table 3)
1 OECD Env-Growth Model; 2 only required for WaterGAP. The share of manufacturing gross value added
in total GDP is taken from the UNEP GEO4 Driver Scenarios distributed by International Futures
(pardee.du.edu); 3 Preliminary results (October 2013) from IIASA – MESSAGE-MACRO (Messner &
Strubegger, 1995) (Rao & Riahi, 2006) model consistent with population and GDP projections for each
SSP. The MESSAGE model (Model for Energy Supply Strategy Alternatives and their General
Environmental Impact) generated results for 23 regions, which were disaggregated to country level using
the same distribution as in the year 2000 .
Table 3. Scenario assumptions for technology and structural change in the industry and
domestic sector
Hydro-Economic (HE) classification* HE-1 HE-2 HE-3 HE-4
Socio-economic capacity to cope with water-related risks
Low (poor)
High (rich)
High (rich)
Low (poor)
Exposure to hydrologic complexity & challenges
Low
Low
High
High
ENERGY SECTOR
Technological change
[annual increase]
SSP1 1.1 % 1.1 % 1.2 % 1.1 %
SSP2 0.6 % 1.0 % 1.1 % 1.0 %
SSP3 0.3 % 0.6 % 1.0 % 0.6 %
Structural change
SSP1 40 y 40 y 40 y 40 y
SSP2 None 40 y 40 y 40 y
SSP3 None None 40 y None

37
MANUFACTURING SECTOR
Technological change
[annual increase]
SSP1 1.1 % 1.1 % 1.2 % 1.1 %
SSP2 0.6 % 1.0 % 1.1 % 1.0 %
SSP3 0.3 % 0.6 % 1.0 % 0.6 %
DOMESTIC SECTOR
Technological change
[annual increase]
SSP1 1.1% 1.1 % 1.2 % 1.1 %
SSP2 0.6% 1.0 % 1.1 % 1.0 %
SSP3 0.3% 0.6 % 1.0 % 0.6 %
Structural change SSP1 20% by 2050
20% by 2050
20% by 2050
20% by 2050
SSP2 None None None None
SSP3 None None None None
* The hydro-economic classification calculates for each country a compound indicator (values 0-1) for
socioeconomic capacity to cope with water-related risks (economic-institutional capacity) and their
exposure to hydrologic challenges and complexity (hydrological complexity). In this way each country was
located in a two-dimensional space and grouped into four hydro-economic classes termed HE-1 to HE-4.
6.2 Industrial water use sector
All three models calculate both water withdrawal and water consumption, the latter
subtracting the return flow to the rivers and groundwater. Industrial water use is generally
calculated for individual countries with subsequent downscaling to a 0.5 degree by 0.5
degree longitude-latitude grid. While H08 downscaling is according to population
distributions, PCR-GLOBWB and WaterGAP downscale to urban areas only.
A major difference among the employed water models relates to the sector details of the
industry sector. H08 and PCR-GLOBWB determine water use for an aggregate industry
sector. H08 calculates water use from total electricity production, while PCR-GLOBWB
use GDP, total electricity production, and total energy consumption. In contrast
WaterGAP separates water use for thermal electricity production and the manufacturing
industry. This requires two additional input variables, thermal electricity production and
manufacturing value added. Although estimates for those variables are consistent with
H08 and PCR-GLOBWB input data (see Table 2 and 3), the results of WaterGAP
simulation can differ substantially. This is particularly true for regions where thermal
electricity production or manufacturing value added have a large share in the industrial
water use compared to those of the other two models.
Ensemble results of global industrial water withdrawal highlight a steep increase in
almost all SSP scenarios (Figure 4).

38
Figure 4. Ensemble of three global industrial water withdrawal (water demand) projections
calculated with the global water models: H08, WaterGAP, and PCR-GLOBWB (PCR) for the
years 2010, 2020, 2030, 2040, and 2050 respectively under three SSPs scenarios (SSP1, SSP2,
and SSP3).
Global amounts reach nearly 2000 km3 yr-1 by 2050, more than doubled compared to the
present industrial water use intensity (850 km3 yr-1). One major difference is a change in
sign in SSP1 where H08 projects a downward trend by about 40% compared to PCR-
GLOBWB and WaterGAP, which project about 50% and 100% increase respectively.
Under the SSP2 and SSP3 scenarios, the results are more consistent. Global industrial
water withdrawals are projected to increase by 70-120% under the ‘business-as-usual’
SSP2 scenario and by 45-120% under the ‘Divided world’ SSP3 scenario. H08 has the
largest range among the SSP projections between -40% decrease (SSP1) and 80%
increase (SSP3). PCR-GLOBWB has relatively a narrow range between 50% increase
(SSP1) and 70% increase (SSP3) and the range is even narrower for WaterGAP with
105% increase (SSP1) and 119% increase (SSP2). By 2050 WaterGAP projects the
largest increase under SSP2, while the other models project that under SSP3.
Figure 5 shows global maps of projected domestic water withdrawals calculated from the
ensemble of three water models. The projected trends and variability among the models
are rather similar under the three SSP scenarios. We therefore show only the projections
under the SSP2 scenario and refer to Annex II for the other projections under the SSP1
and SSP3 scenarios.
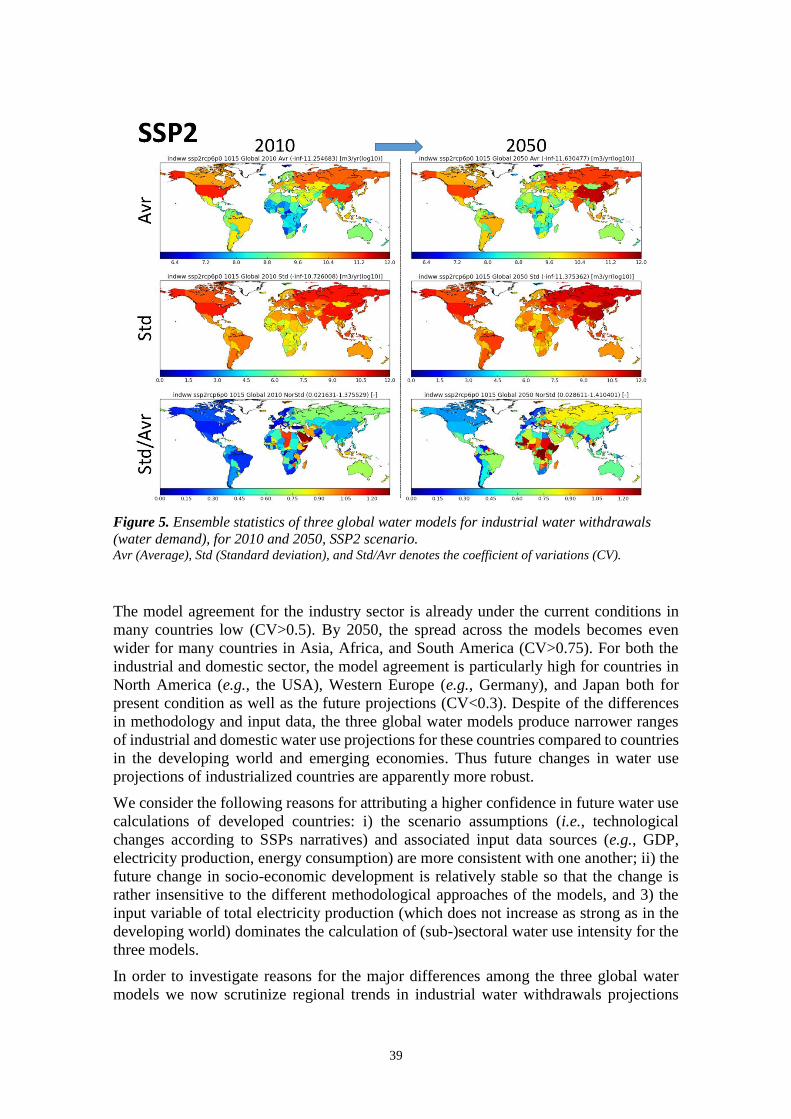
39
Figure 5. Ensemble statistics of three global water models for industrial water withdrawals
(water demand), for 2010 and 2050, SSP2 scenario. Avr (Average), Std (Standard deviation), and Std/Avr denotes the coefficient of variations (CV).
The model agreement for the industry sector is already under the current conditions in
many countries low (CV>0.5). By 2050, the spread across the models becomes even
wider for many countries in Asia, Africa, and South America (CV>0.75). For both the
industrial and domestic sector, the model agreement is particularly high for countries in
North America (e.g., the USA), Western Europe (e.g., Germany), and Japan both for
present condition as well as the future projections (CV<0.3). Despite of the differences
in methodology and input data, the three global water models produce narrower ranges
of industrial and domestic water use projections for these countries compared to countries
in the developing world and emerging economies. Thus future changes in water use
projections of industrialized countries are apparently more robust.
We consider the following reasons for attributing a higher confidence in future water use
calculations of developed countries: i) the scenario assumptions (i.e., technological
changes according to SSPs narratives) and associated input data sources (e.g., GDP,
electricity production, energy consumption) are more consistent with one another; ii) the
future change in socio-economic development is relatively stable so that the change is
rather insensitive to the different methodological approaches of the models, and 3) the
input variable of total electricity production (which does not increase as strong as in the
developing world) dominates the calculation of (sub-)sectoral water use intensity for the
three models.
In order to investigate reasons for the major differences among the three global water
models we now scrutinize regional trends in industrial water withdrawals projections

40
(Figure 6) to highlight the uncertainty in water use projections we selected major water
users with significant different projections across the three models. Each country has been
assigned to a hydro-economic classification, for which a consistent set of assumptions for
technological and structural change has been developed under each SSP (see Table 2 and
3).
In the mature, industrialized economy of the USA and Germany, the projected industrial
water withdrawals exhibit a steadily decreasing trend toward the year 2050 for almost all
projections. However, H08 features an increasing trend (after a sharp drop in 2020) for
both countries under the SSP3 scenario.
For the emerging economies (China, Brazil, and Russia), the ensemble projections show
large differences among the three global water models. WaterGAP projects a much larger
net increase in industrial water withdrawals for China and Brazil by 2050 under all SSPs,
while H08 shows a net decrease under SSP1 (China, Brazil, Egypt and Russia) and SSP2
(Brazil and Russia). PCR-GLOBWB follows a similar trend with WaterGAP for China
and Russia, but shows a much lower net increase for Brazil compared to WaterGAP. For
PCR-GLOBWB and WaterGAP, the relative increase is similar for China and Russia.
However, the use of different datasets at the reference year (2005) results in a large
difference in absolute amounts by 2050. This is particularly obvious for Russia where the
industrial water withdrawals differ by a factor four at the reference year between PCR-
GLOBWB and WaterGAP. Larger volume of industrial water withdrawals estimated by
WaterGAP in emerging economics is often due to manufacturing water use. H08 and
PCR-GLOBWB do not disaggregate the industrial sector into manufacturing and
electricity, which results in a homogeneous response in projected trends among these sub-
sectors. In India, Brazil, and China where the economy is projected to grow rapidly in the
coming decades, industrial water withdrawals is projected to increase by more than a
factor of two by 2050. In Saudi Arabia, the use of different datasets for the reference year
causes a large spread in the ensemble projections.

41
Figure 6. Regional industrial water withdrawal (water demand) projections with three global
water models: H08, WaterGAP, and PCR-GLOBWB (PCR) for the year 2010, 2020, 2030, 2040,
and 2050 respectively under three SSPs scenarios (SSP1, SSP2, and SSP3). HE denotes the hydro-economic classification (see section 2.2)

42
6.3 Domestic water use sector
Contrast to the industrial sector, domestic water use is calculated in a similar manner
among the three global water models, and is driven primarily by population numbers and
per capita water use (or withdrawal). All three models calculate both water withdrawal
and consumptive water us, the latter subtracting the return flow to the rivers and
groundwater. Domestic water use is distributed to a 0.5 degree by 0.5 degree longitude-
latitude grid according to the gridded population numbers for all three models. While H08
and WaterGAP primarily use population numbers and per capita water use as input socio-
economic variables, PCR-GLOBWB additionally considers the change in GDP, total
electricity production, and energy consumption for the calculation of per capita water use
and associated future trend similar to the water use intensity calculation in the industrial
sector.
Figure 7 shows ensembles of global domestic water withdrawal projections. Due to rapid
increase in world population, ensemble results among the three models show a sharp
increase in domestic water withdrawals under all SSP scenarios. Global amount is
projected to reach 700-1500 km3 yr-1 by 2050, which is an increase by 50% to 250%
compared to the present water use intensity (400-450 km3 yr-1).
Figure 7. Global domestic water withdrawal (water demand) projections with three global
water models: H08, WaterGAP, and PCR-GLOBWB (PCR) for the year 2010, 2020, 2030,
2040, and 2050 respectively under three SSPs scenarios (SSP1, SSP2, and SSP3).
All three models project a consistently increasing trend for future domestic water use by
2050, with a minor exception for WaterGAP, which projects a slight decrease in domestic
water use after 2040 under the SSP1 scenario. However, compared to the present water
use, WaterGAP still projects a 70% increase by 2050 under SSP1. One obvious difference
is that PCR-GLOBWB projects a much higher increase in domestic water use by 2050
compared to H08 and WaterGAP. The increase by 2050 ranges between 40% and 70%
(SSP1), 70% and 140% (SSP2), and 90% and 150% (SSP3) for H08 and WaterGAP
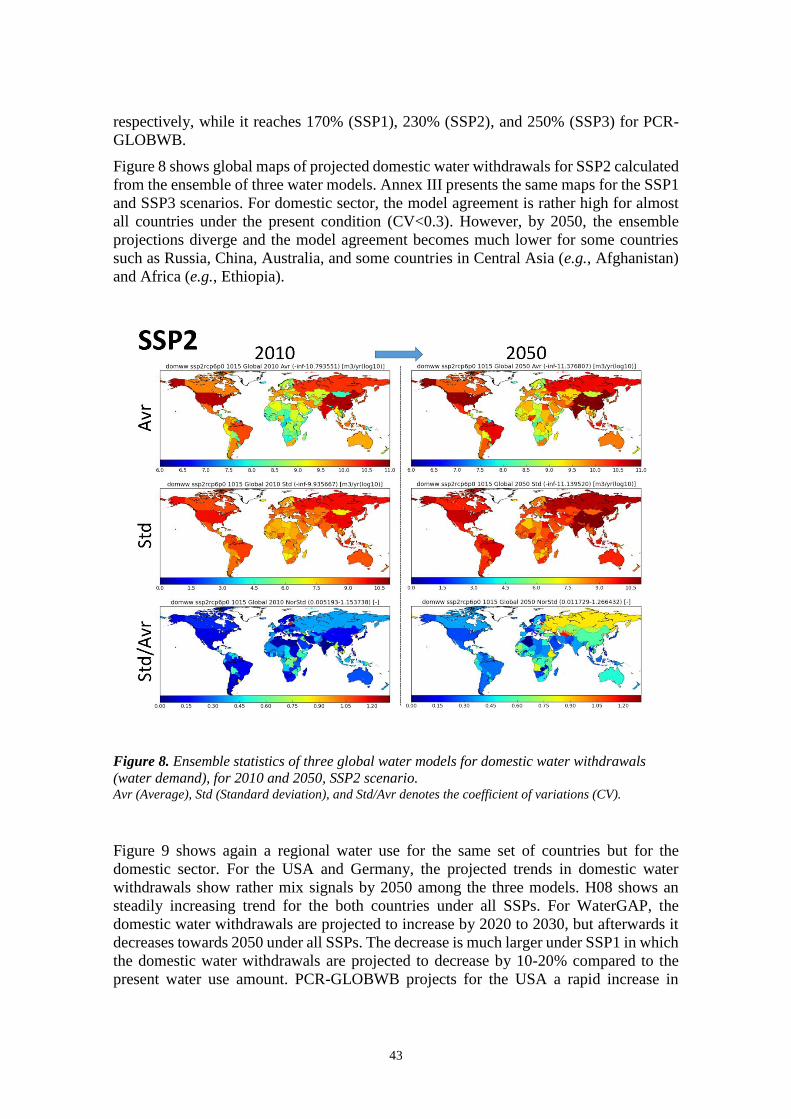
43
respectively, while it reaches 170% (SSP1), 230% (SSP2), and 250% (SSP3) for PCR-
GLOBWB.
Figure 8 shows global maps of projected domestic water withdrawals for SSP2 calculated
from the ensemble of three water models. Annex III presents the same maps for the SSP1
and SSP3 scenarios. For domestic sector, the model agreement is rather high for almost
all countries under the present condition (CV<0.3). However, by 2050, the ensemble
projections diverge and the model agreement becomes much lower for some countries
such as Russia, China, Australia, and some countries in Central Asia (e.g., Afghanistan)
and Africa (e.g., Ethiopia).
Figure 8. Ensemble statistics of three global water models for domestic water withdrawals
(water demand), for 2010 and 2050, SSP2 scenario. Avr (Average), Std (Standard deviation), and Std/Avr denotes the coefficient of variations (CV).
Figure 9 shows again a regional water use for the same set of countries but for the
domestic sector. For the USA and Germany, the projected trends in domestic water
withdrawals show rather mix signals by 2050 among the three models. H08 shows an
steadily increasing trend for the both countries under all SSPs. For WaterGAP, the
domestic water withdrawals are projected to increase by 2020 to 2030, but afterwards it
decreases towards 2050 under all SSPs. The decrease is much larger under SSP1 in which
the domestic water withdrawals are projected to decrease by 10-20% compared to the
present water use amount. PCR-GLOBWB projects for the USA a rapid increase in

44
domestic water withdrawals by 2050 under all SSPs, but for Germany a moderate or
negligible increase under SSP1 and SSP2 and a large increase under SSP3.
For China, Brazil, India, and Egypt where present domestic water use shares altogether
one-third of the global total and population is projected to grow more rapidly than other
countries, ensemble projections show rather a consistent pattern per water model for each
country. H08 projects an increasing trend by 2050 under all SSPs and the increase is much
larger for SSP2 and SSP3 than SSP1. For PCR-GLOBWB, the projections show a steep
increase under all scenarios. There is a pronounced increase in countries with large
population growth (China, India, Egypt, Brazil) where the amount of domestic water
withdrawals is projected to quadruple in almost all scenarios and water models. For
Russia, PCR-GLOBWB projects a pronounced increase similar with China, Brazil, India,
and Egypt under all SSPs, while H08 and WaterGAP shows rather a constant or
decreasing trend towards 2050 under almost all SSPs except H08 projecting a slight
increase under the SSP3 scenario. Similar to the industrial sector, the initial value at the
reference year (2005) has a large difference between PCR-GLOBWB and the other two
models, which results in a large spread in absolute amounts by 2050. This is also the case
for Germany, but between WaterGAP and the other two models. Ensemble projections
show a consistent pattern for Saudi Arabia among the three models under all SSPs, and
the domestic water withdrawals are projected to increase by 100-200% by 2050.

45
Figure 9. Regional domestic water withdrawal (water demand) projections with three global
water models: H08, WaterGAP, and PCR-GLOBWB (PCR) for the year 2010, 2020, 2030,
2040, and 2050 respectively under three SSPs scenarios. HE denotes the hydro-economic classification (see section 2.2)

46
6.4 Discussion: Sensitivity of modelling approaches on the results
Our first global water use model intercomparison shows a remarkable difference among
the three global water models (H08, PCR-GLOBWB, and WaterGAP) used, despite the
harmonized socio-economic drivers (population, economy, and energy use) and
assumptions on technological and structural change. Thus our current capability in
simulating global water use is still uncertain. For the municipal sector, domestic water
uses of the ensemble projections are comparable at the global level, although regional
trends show significant difference for some countries (e.g., China, India, Russia).
Projected industrial water withdrawals are substantially different among the three models.
Here we discuss different sources of the uncertainty causing the large spread in the
ensemble of water use projections.
A major difference among the employed water models relates to the sector details and the
number of input socio-economic variables employed in the calculation procedures.
In general, global water models use more or less different methodological approaches to
estimate sectoral water use. This is also true for the three water models applied in this
study. As previously noted, H08 and PCR-GLOBWB determine water use for an
aggregate industry sector. However, H08 uses primarily total electricity production, while
PCR-GLOBWB uses GDP and total energy consumption in addition to total electricity
production. For H08 and PCR-GLOBWB, these variables are used to estimate the future
change in water use intensity by constructing the future trend, rather than actually
calculating the absolute amount of industrial water use.
In contrast, WaterGAP separates water use for the thermal electricity production and the
manufacturing industry, and uses those for the calculation of absolute amounts of these
sub-sectoral water uses for each year. Therefore more complex functions are used where
either electricity or manufacturing water use can dominate the future change in industrial
water use. For example, projected industrial water use is dominated by the manufacturing
sector in Brazil, Pakistan, Indonesia, and Mexico, and by the electricity sector in China,
the USA, and Canada. In the H08 and PCR-GLOBWB models, detailed changes in
manufacturing or electricity water use cannot be captured as water use is estimated for an
aggregate industry sectors.
Although estimated water use intensity by H08 and PCR-GLOWB has been validated and
compared well with reported statistics (e.g., FAO AQUASTAT, EUROSTAT, country
statistics) for a historical period (e.g., 1960-2010), this may not be suitable for future
assessments which use diverse ranges of scenarios (e.g., SSPs) and associated
assumptions on socio-economic and technological change. A simple approach may
neglect future dynamic changes in sub-sectoral water use within the industrial sector. For
example, SSP scenario narratives correspond to different sources of energy and changes
in the economy including structure of GDP. This may result in large variations of sub-
sectoral water use intensity across countries.
In addition to the different methodological approaches, we found that the use of different
datasets for the reference year (2005) causes a remarkable difference in future amounts
of industrial water use. The reference industrial water use at the present condition is
globally about 10% lower in H08 than that in PCR-GLOBWB and 20% lower in H08
than that in WaterGAP. The difference among the three models is less obvious for the
domestic sector (±5%). Since H08 and PCR-GLOBWB projects the future trend in
industrial water use, the use of different datasets for the reference year (i.e., the starting

47
point) immediately impacts the results and subsequent amounts of future water use. This
was clearly demonstrated in some countries such as Russia and India. Although we
harmonized the driver data on socio-economics (GDP, population, energy) and
assumptions on technological and structural change, the use of the same reference dataset
was not considered in the WFaS ‘fast-track’ assessment. This is partly related due to lack
of available data for much of the world on water withdrawals and consumptive use,
particularly in industry. Locations of water users, water efficiency technological changes
over time, and quantities of water withdrawals are largely unknown, and although the
general factors that influence water demand are known, we often do not have enough
information to show statistical significance.
H08 and PCR-GLOBWB estimate their initial water withdrawal based on the widely used
AQUASTAT data from the FAO. AQUASTAT compiles country reported statistics of
sectoral water use including a quality check. In WaterGAP the initial water use for the
year 2005 is based on own compilation of statistical sources from individual countries.
Reasons for apparent differences between these two approaches, both using statistical
data reported by countries, were not investigated and are therefore unknown.
Improvements in available data could be achieved by bottom-up assessments such as
investigation of individual water uses within the sectors and their influence on total
demand for that sector.
For example, household water uses for toilets, showers, washing machines, dishwashers
can be assessed along with technological changes in the appliances leading to improved
water use efficiency over time, methods that have been investigated by WaterGAP. For
industry the information sources used for water footprinting can be applied to better
estimate water uses for different types of industry. Environmental economic accounting
systems and water extended input-output modelling can provide data sources of water use
intensities across sectors and can be used to assess changes over time in these industries.
However applying this at the global scale may be challenging and involve significant data
compilation work. Nevertheless, the use of the same reference dataset for the starting year
should be considered in a next water use model intercomparison. Improved information
can lead to the use of global water models for policy guidance and assessment of water
management.
Using different sets of driver input socio-economic variables also results in significant
differences. H08 was the only model that projects globally a decreasing trend in future
industrial water use under the SSP1 scenario. PCR-GLOBWB and WaterGAP shows an
opposite trend. H08 relies primarily on total electricity production to estimate the future
trend. PCR-GLOBWB uses GDP and total energy consumption in addition to total
electricity production. WaterGAP uses two more additional input variables, thermal
electricity production and manufacturing value added. Future trends in industrial water
use projections are similar among the three models for those developed countries that
correspond to the HE-2 classification (e.g., USA and Germany). H08 projects a
decreasing trend under SSP1 for those emerging economies that correspond to HE-1 and
HE-4. Apparently, projected increases in total electricity production are counterbalanced
by assumed improvements in water use intensity due to technological changes. In contrast
PCR-GLOBWB and WaterGAP projects a consistently increasing trend under the same
scenario due to increasing GDP. However, it should be noted that the composition of GDP
in the ‘Sustainability’ scenario SSP1 is not known.

48
There are some differences in projected trends between PCR-GLOBWB and WaterGAP,
but this is mainly attributable to the difference in sub-sectoral water uses calculation
(aggregated vs. disaggregated). The use of socio-economic variables such as GDP and
energy consumption makes the different trend in PCR-GLOBWB and WaterGAP
compared to that in H08.This was also the case for the domestic sector in which PCR-
GLOBWB projects much higher increase in water use intensity by 2050. H08 and
WaterGAP primarily uses population numbers and per capita water use. PCR-GLOBWB
additionally use GDP, total electricity production, and energy consumption. GDP
projections in the SSP scenarios increase significantly for almost all countries,
particularly in emerging economies. The increase in total electricity production is much
milder due to improvement in energy use intensity (i.e., higher electricity production per
unit energy use), and technological and structural improvement. The calculation of
(sub-)sectoral water use intensity using different sets of socio-economic variables should
be further investigated.
7. Conclusions
Global water models use simple yet diverse approaches to estimate water use per sector.
The results produced from our first global water use model intercomparison showed a
remarkable difference among the three global water models (H08, PCR-GLOBWB, and
WaterGAP) used in the WFaS ‘fast-track’ analysis. Although we harmonized driver input
data socio-economics and assumptions on technological and structural change, ensemble
projections for the first half of the 21st century water use showed large variability among
the three models and the spread was much larger in the industrial sector compared to the
domestic sector.
At the global level the signal of changes in future water use from the water models is as
strong as the signal from the three scenarios employed. Although there is a high degree
of variability across models and scenarios, all projections indicate significant increases in
future industrial and domestic water uses. Despite of potential model and data limitations,
the WFaS initiative advances an important step beyond earlier work by attempting to
account more realistically for the nature of human water use behavior in the 21st century
and to identify associated uncertainties. Our results can be applied to assess future
sustainability of water use under envisaged population growth and socio-economic
developments.
We also suggest key findings for reducing uncertainty in global water use modeling and
improve the robustness in water use projections in the 21st century. We also address
future perspectives of global water use model intercomparison and possible
improvements for a next step of global water use calculations.
First, the estimates are currently helping to identify hot spots where further investigation
is needed, and in some cases may be used to test the implications of broad management
and policy options, such as efficiency improvements.
Second, the coarseness of current estimates and assumptions produce questionable results
in some areas (e.g., Africa). This makes it very difficult to test and compare benefits of
water management options including areas where solutions are most needed.

49
Third, as greater demands are placed on water resources and they become increasingly
scarce, we will need to improve our estimates to better assess the costs and benefits of a
variety of water, energy, and land management strategies.
Fourth, regarding input driver data, a disaggregation of the SSP scenario GDP projections
into main sectors (agriculture, industry, services) would be of great benefit for improving
the linkages between economic growth and water use.
Fifth, current water use modeling approaches can be improved in the following ways:
(i) Harmonize the reference dataset for a starting year under the present condition;
(ii) Disaggregate industrial sector into thermal electricity and manufacturing sector to
incorporate the future dynamics of sub-sectoral water use; (iii) Improve/gather more
accurate information on present day water use.

50
References
Alexandratos, N. & Bruinsma, J., 2012. World agriculture towards 2030/2050: The
2012 revision, Rome: FAO.
Arnell, N. & Lloyd-Hughes, B., 2014. The global-scale impacts of climate change on
water. Climatic Change, Volume 122, pp. 127-140.
Commission, E., 2008. Directive 2008/1/EC concerning integrated pollution prevention
and control, Brussels: European Commission.
Cosgrove, W. et al., 2015. Conceptual framework for scenarios development in the
Water Futures and Solutions project, Laxenburg: International Insistute for Applied
Systems Analysis (IIASA).
Döll, P. et al., 2012. Impact of water withdrawals from groundwater and surface water
on continental water storage variations. J. Geodyn., Volume 59-60, pp. 143-156.
Döll, P., Kaspar, F. & Lehner, B., 2003. A global hydrological model for deriving water
availability indicators: model tuning and validation. J.Hydrol., Volume 270, pp.
105-134.
Fischer, G., Hizsnyik, E., Tramberend, S. & Wiberg, D., 2015. Towards indicators for
water security - A global hydro-economic classification of hydrological challenges
and socio-economic coping capacity, Laxenburg, Austria: International Institute for
Applied Systems Analysis.
Flörke, M. et al., 2013. Domestic and industrial water uses of the past 60 years as a
mirror of socio-economic development: A global simulation study. Global
Environmental Change, Volume 23, pp. 144-156.
Flörke, M. et al., 2013. Domestic and industrial water uses of the past 60 years as a
mirror of socio-economic development: A global simulation study. Global
Environm. Change, Volume 23, pp. 144-156.
Hanasaki, N. et al., 2013. A global water scarcity assessment under shared socio-
economic pathways—part 2: water availability and scarcity. Hydrol Earth Syst Sci,
Volume 17, pp. 2393-2413.
Hanasaki, N. et al., 2008. An integrated model for the assessment of global water
resources – Part 1: Model description and input meteorological forcing. Hydrol.
Earth Syst. Sci., Volume 12, pp. 1007-1025.
Hanasaki, N. et al., 2008. An integrated model for the assessment of global water
resources – Part 2: Applications and assessments. Hydrol. Earth syst. Sci., Volume
12, pp. 1027-2008.
IIASA, 2015. SSP Database. [Online]
Available at: https://secure.iiasa.ac.at/web-
apps/ene/SspDb/dsd?Action=htmlpage&page=about
Koch, H. & Vögele, S., 2009. Dynamic modelling of water demand, water availability
and adaptation strategies for power plants to global change. Ecological Economics,
Volume 68, pp. 2013-2039.

51
Magnuszewski, P., Grey, D. & Wiberg, D., 2015. Scenario Focus Group Workshop
Report (Paris 4-6 November 2013), Laxenburg, Austria: International Institute for
Applied Systems Analysis.
Markewitz, P. & Vögele, S., 2001. Der Strommarkt in den neuen Bundesländern :
derzeitiger Stand und mögliche Entwicklung bis zum Jahr 2050, Jűlich:
Forschungszentrum Jűlich.
Messner, S. & Strubegger, M., 1995. User's guide for MESSAGE III. WP-95-96,
Laxenburg: International Institute for Applied Systems Analysis (IIASA).
Moss, R. et al., 2010. The next generation of scenarios for climate change research and
assessment. Nature, 463(7282), pp. 747-756.
O’Neill, B. et al., 2011. Meeting Report of the Workshop on the Nature and Use of New
Socioeconomic Pathways for Climate Change Research., Boulder, Colorado, USA:
National Center for Atmospheric Research (NCAR).
O'Neill, B. et al., 2015. The roads ahead: Narratives for shared socioeconomic pathways
describing world futures in the 21st century. Global Environmental Change.
O'Neill, B. et al., 2014. A new scenario framework for climate change research: the
concept of shared socioeconomic pathways. Climatic Change, 122(3), pp. 387-400.
Pastor, A. V. et al., 2014. Accounting for environmental flow requirements in global
water assessments. Hydrol. Earth Syst. Sci., Volume 18, pp. 5041-5059.
Rao, S. & Riahi, K., 2006. The role of non-CO2 greenhouse gases in climate change
mitigation: long-term. Energy J Sepc Issue, Issue 3, pp. 177-200.
van Vuuren, D. et al., 2011. The representative concentration pathways: an overview..
Climatic Change, 109(1), pp. 5-31.
Wada, Y., van Beek, L. & Bierkens, M., 2011. Modelling global water stress of the
recent past: on the relative importance of trends in water demand and climate
variability. Hydrol. Earth Syst. Sci., Volume 15, pp. 3785-3808.
Wada, Y. et al., 2011. Global monthly water stress: II. Water demand and severity of
water,. Water Resour. Res., 47(W07518).
Wada, Y., Wisser, D. & Bierkens, M., 2014. Global modeling of withdrawal, allocation
and consumptive use of surface water and groundwater resources. Earth Syst.
Dynam., Volume 5, pp. 15-40.
Wada, Y. et al., 2013. Multimodel projections and uncertainties of irrigation water
demand under climate change,. Geophys. Res. Lett., pp. 4626-4632.

52
AENNX I - Key elements of Shared Socio-Economics (SSP) storylines
Below key elements from the SSP narratives (O'Neill, et al., 2015) are summarized by main topic. Green color indicates own interpretation
as narratives did not specifically focus on these topics.
SSP1 SSP2 SSP3 SSP4 SSP5
SSP Title Sustainability Taking the green road
Middle of the road
Regional rivalry A rocky road
Inequality A road divided
Fossil-fueled development Taking the highway
Synopsis Gradually move to sustainability
Past trends & paradigms
Resurgent nationalism with uneven cooperation
Increasing inequalities & fragmentation
“Development first” paradigm
POPULATION
Population growth Low, peaks around 2050 and declines
Levels off after 2050 Very high in developing countries
Low growth in developed, high in developing world
Low, peaks around 2050 and declines
Urbanization Rapid Follows historic trends Proceeds slowly Rapid Rapid
Education Large emphasis on education; promotion of higher education levels & gender equality
Some progress but too low investments in low income countries
Low investments in education Esp. in developing education focus is on producing small, highly educated elite
Development policies emphasize education
ECONOMY / TRADE
Economic growth Relatively high, also in developing countries
Moderate growth Slow growth everywhere Relatively high Rapid growth; competitive markets
Trade Markets globally connected, but emphasis on regional production
Markets globally connected but function imperfectly
World had de-globalized, focus on national/regional interests
Limited trade Accelerated globalization; High levels of international trade
Poverty Poverty reduction; Rapid growth of the ‘middle class’
Poverty remains a challenge for many disadvantaged populations
Pockets of extreme poverty persist
Poverty reduces at the global level, but persists or even worsens in some regions; Slow expansion of global middle class
Strong reduction of extreme poverty; Emergent global middle class stabilizes
INSTITUTIONS / GOVERNANCE
Institutions Effective institutions oriented toward cooperation and sustainability principles
Relatively weak coordination & cooperation among national & international institutions
Weak, ineffective institutions; no capacities for global problem solving
Weak / poor access to institutions by low-income regions
Effective institutions foster competitive markets; strong rule of law, low corruption
Global governance Global focus increases social cohesion
Imperfect global governance Lack of cooperation, consensus and effective global leadership
Self-interests dominate Removal of market entry barriers for disadvantaged population groups
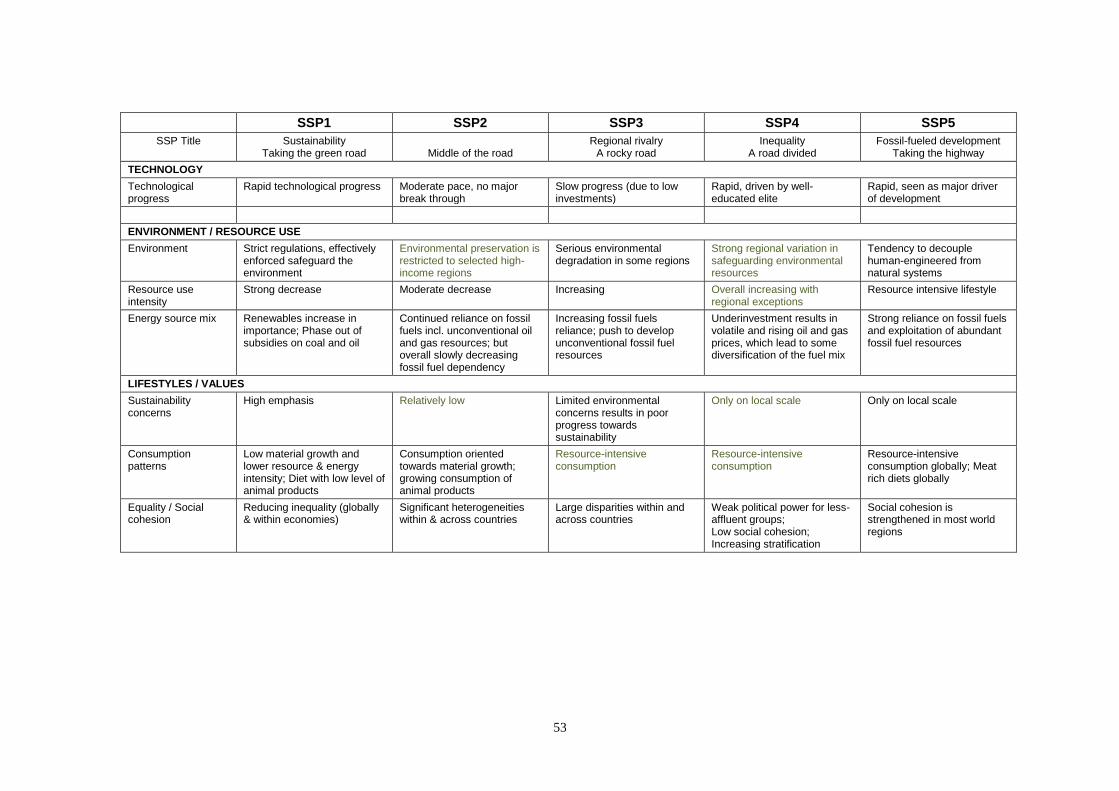
53
SSP1 SSP2 SSP3 SSP4 SSP5
SSP Title Sustainability Taking the green road
Middle of the road
Regional rivalry A rocky road
Inequality A road divided
Fossil-fueled development Taking the highway
TECHNOLOGY
Technological progress
Rapid technological progress Moderate pace, no major break through
Slow progress (due to low investments)
Rapid, driven by well-educated elite
Rapid, seen as major driver of development
ENVIRONMENT / RESOURCE USE
Environment Strict regulations, effectively enforced safeguard the environment
Environmental preservation is restricted to selected high-income regions
Serious environmental degradation in some regions
Strong regional variation in safeguarding environmental resources
Tendency to decouple human-engineered from natural systems
Resource use intensity
Strong decrease Moderate decrease Increasing Overall increasing with regional exceptions
Resource intensive lifestyle
Energy source mix Renewables increase in importance; Phase out of subsidies on coal and oil
Continued reliance on fossil fuels incl. unconventional oil and gas resources; but overall slowly decreasing fossil fuel dependency
Increasing fossil fuels reliance; push to develop unconventional fossil fuel resources
Underinvestment results in volatile and rising oil and gas prices, which lead to some diversification of the fuel mix
Strong reliance on fossil fuels and exploitation of abundant fossil fuel resources
LIFESTYLES / VALUES
Sustainability concerns
High emphasis Relatively low Limited environmental concerns results in poor progress towards sustainability
Only on local scale Only on local scale
Consumption patterns
Low material growth and lower resource & energy intensity; Diet with low level of animal products
Consumption oriented towards material growth; growing consumption of animal products
Resource-intensive consumption
Resource-intensive consumption
Resource-intensive consumption globally; Meat rich diets globally
Equality / Social cohesion
Reducing inequality (globally & within economies)
Significant heterogeneities within & across countries
Large disparities within and across countries
Weak political power for less-affluent groups; Low social cohesion; Increasing stratification
Social cohesion is strengthened in most world regions

54
Annex II. Global maps of industrial water withdrawals
Figure A2. Ensemble statistics of three global water models for industrial water withdrawals
(water demand), 2010 and 2050, SSP1 and SSP3 scenario. Avr (Average), Std (Standard deviation), and Std/Avr denotes the coefficient of variations (CV).

55
Annex III. Global maps of domestic water withdrawals
Figure A3. Ensemble statistics of three global water models for domestic water withdrawals
(water demand), 2010 and 2050, SSP1 and SSP3 scenario. Avr (Average), Std (Standard deviation), and Std/Avr denotes the coefficient of variations (CV).

WATER FUTURES AND SOLUTIONS The Water Futures and Solutions Initiative (WFaS) is a cross-sector, collaborative global initiative which develops the scientific evidence and applies systems analysis to help identify water-related policies and management practices that work together consistently across scales and sectors with the aim to improve human well-being through enhanced water security.
A stakeholder informed, scenario-based assessment of water resources and water demand, employing ensembles of state-of-the-art socio-economic and hydrological models, test the feasibility, sustainability and robustness of portfolios of options that can be implemented today and can be sustainable and robust across a range of possible futures and associated uncertainties we face.
WFaS includes case studies to zoom in on particular issues and regions, and knowledge sharing networks to share policy, management, and technical solutions that have been effective in the bio-physical and socio-economic contexts to which they have been applied, so they can be assessed for application in similar conditions in other regions.