city of alexandria ert employees final report study · 2009-06-19 · the active employee workforce...
TRANSCRIPT

22000088 WWaattssoonn WWyyaatttt CCOOMMPPAARRIISSOONN SSttuuddyy
CCiittyy ooff AAlleexxaannddrriiaa
EERRTT EEmmppllooyyeeeess
FFiinnaall RReeppoorrtt
WWaattssoonn WWyyaatttt WWoorrllddwwiiddee
AApprriill 22000099
CCiittyy ooff AAlleexxaannddrriiaa -- EERRTT EEmmppllooyyeeeess 22000088 CCOOMMPPAARRIISSOONN SSttuuddyy
TTaabbllee ooff CCoonntteennttss
SECTION I. EXECUTIVE SUMMARY............................................................................ 1
Executive Summary .................................................................................................. 2 Overview of Results ................................................................................................. 2 Presentation of Results ............................................................................................ 2
Summary Statistics ................................................................................................... 4
Distribution of Values................................................................................................ 5
Components of Benefit Values................................................................................. 6
SECTION II. DETAILED RESULTS............................................................................... 7
General Methodology............................................................................................... 8 Demographics .......................................................................................................... 9
Total Benefits........................................................................................................... 10
Retirement Plans ..................................................................................................... 11 Summary of Results............................................................................................... 11
Defined Benefit Plan Values............................................................................... 11 Defined Contribution Plan Values....................................................................... 13 Retiree Medical Plan Values............................................................................... 13 Retiree Life Insurance Plan Values .................................................................... 14
Retirement Plan Results ........................................................................................ 15 Defined Benefit Plan Results.................................................................................. 16 Defined Contribution Plan Results ......................................................................... 17 Retiree Medical Plan Results ................................................................................. 18 Retiree Life Insurance Plan Results ....................................................................... 19 Retirement Plans – Plan Provisions Summary....................................................... 20
Defined Benefit Plans - Table 1 .......................................................................... 20 Defined Benefit Plans - Table 2 .......................................................................... 21 Defined Contribution Plans................................................................................. 24 Medical Benefits for Retirees.............................................................................. 26 Life Insurance for Retirees ................................................................................. 28
Health Plans ............................................................................................................. 29 Summary of Results............................................................................................... 29
Medical Plan Values ........................................................................................... 29 Percent of Covered Medical Expenses Paid by the Plan.................................... 30 Dental Plan Values ............................................................................................. 31
Health Benefit Results............................................................................................ 32 Medical Plan Results.............................................................................................. 33

Dental Plan Results................................................................................................ 34 Health Plans – Plan Provisions Summary.............................................................. 35
Medical - Table 1 ................................................................................................ 35 Medical - Table 2 ................................................................................................ 36 Kaiser HMO Plans - Table 1 (Not Valued) .......................................................... 38 Kaiser HMO Plans - Table 2 (Not Valued) .......................................................... 39 Dental ................................................................................................................. 40
Paid Time Off Plans................................................................................................. 42 Summary of Results............................................................................................... 42
Vacation and Holiday.......................................................................................... 42 Sick Leave.......................................................................................................... 42
Paid Time Off Benefit Results ................................................................................ 44 Vacation Plan Results ............................................................................................ 45 Holiday Plan Results .............................................................................................. 46 Sick Leave Plan Results ........................................................................................ 47 Paid Time Off Plans – Plan Provisions Summary .................................................. 48
Vacation and Holiday.......................................................................................... 48 Sick Leave.......................................................................................................... 49
Security Plans.......................................................................................................... 50 Summary of Results............................................................................................... 50
Life Insurance Plan Values................................................................................. 50 Disability Benefit Plan Values............................................................................. 50
Security Benefit Results ......................................................................................... 52 Life Insurance Plan Results.................................................................................... 53 Short Term Disability Plan Results......................................................................... 54 Long Term Disability Plan Results ......................................................................... 55 Security Plans – Plan Provisions Summary ........................................................... 56
Life Insurance..................................................................................................... 56 Short Term Disability .......................................................................................... 57 Long Term Disability........................................................................................... 58
Other Plan Provisions ............................................................................................. 59 Work Life Benefits - Table 1 ............................................................................... 59 Work Life Benefits - Table 2 ............................................................................... 60 Work Life Benefits - Table 3 ............................................................................... 61

This report is intended only for internal use by City of Alexandria.
The employers in the Watson Wyatt COMPARISON Database have agreed to allow their
benefit plan provisions to be used for studies such as this only if the information is
maintained in a confidential manner. This report should not be distributed to others
outside City of Alexandria or relied upon by any other person without prior written
consent from Watson Wyatt Worldwide. The information in this report has been carefully
reviewed for accuracy. However, the accuracy of the information ultimately depends on
accurate descriptions of the benefit plans provided by the participating employers.

SSeeccttiioonn II.. EExxeeccuuttiivvee SSuummmmaarryy

22
Watson Wyatt COMPARISON™ April 2009
CCiittyy ooff AAlleexxaannddrriiaa -- EERRTT EEmmppllooyyeeeess
22000088 CCOOMMPPAARRIISSOONN SSttuuddyy Executive Summary
Watson Wyatt Worldwide has prepared this report at the request of City of Alexandria. The
report presents the results of a comparison of City of Alexandria’s ERT employee benefit plans
with the benefit plans of the following employers:
Arlington County Government - Fire
Fairfax County Government - Fire & EMS
Montgomery County Government - Fire & EMS
Prince William County Government - Fire and Rescue
Overview of Results
Benefit
City of Alexandria's
Value
Comparison Group Average Benefit Value
City of Alexandria's Ranking in
Comparison Group
Benefit Value as a Percentage of City of
Alexandria's Total Program
Total 100 103 4th 100 Retirement 100 105 4th 32 Health 100 103 3rd 27 Paid Time Off 100 106 5th 37 Security 100 58 1st 3
Presentation of Results Results are presented for all benefits combined (total), for related benefits combined (benefit
groups) and for each benefit individually. Benefit groups were created to show the interaction of
various related benefits because in certain areas different employers will provide one form of the
benefit rather than another. For example, one employer may offer a defined contribution plan
rather than a defined benefit plan. These values have been grouped under the retirement heading
to provide a better comparison of the retirement income provided by each employer.

33
Watson Wyatt COMPARISON™ April 2009
For each benefit subsidized by City of Alexandria, the employer-provided value of the benefit is
set to 100. The comparative value of each other employer’s program is then established, using
City of Alexandria as a baseline. For example, if another employer’s employer-provided health
insurance is 2 percent more valuable than City of Alexandria’s program, it will receive a score of
102. The detailed results of the study present City of Alexandria’s position relative to the
comparison employers through description, tables, and graphs.
Additional Information
We expect that the detailed information provided on the following pages will be helpful as a
diagnostic tool to aid in determining if the level of benefits being provided is in line with City of
Alexandria’s benefits strategy. If any further information is desired in connection with this
benefit comparison, or if any questions arise concerning this report, we will be happy to discuss
this with you.

44
Watson Wyatt COMPARISON™ April 2009
CCiittyy ooff AAlleexxaannddrriiaa -- EERRTT EEmmppllooyyeeeess
22000088 CCOOMMPPAARRIISSOONN SSttuuddyy Summary Statistics
Benefit
City of Alexandria's
Value
Comparison Group Average Benefit Value
City of Alexandria’s Ranking in
Comparison Group
Benefit Value as a
Percentage of City of
Alexandria's Total Program
Total 100 103 4th 100 Retirement 100 105 4th 32 Defined Benefit 100 95 2nd 30 Defined Contribution 0 100 Tied for 3rd 0 Retiree Medical 100 254 3rd 2 Retiree Life 100 37 1st 1 Health 100 103 3rd 27 Medical 100 94 Tied for 2nd 27 Dental 0 100 5th 0 Paid Time Off 100 106 5th 37 Vacation 100 105 5th 22 Holiday 100 108 5th 12 Sick 100 106 5th 3 Security 100 58 1st 3 Life Insurance 100 73 2nd 2 STD 100 227 5th 0 LTD 100 10 1st 1

55
Watson Wyatt COMPARISON™ April 2009
CCiittyy ooff AAlleexxaannddrriiaa -- EERRTT EEmmppllooyyeeeess
22000088 CCOOMMPPAARRIISSOONN SSttuuddyy Distribution of Values
The following chart presents the distribution of benefit values by benefit groups. The vertical
line represents the value of the City of Alexandria - ERT benefit, which is set to 100. The
horizontal bars represent the distribution of values for the comparison group. Note that a longer
bar indicates a larger variation in benefit values among the comparison group.
Retirement Health Paid Time Off Security Defined Benefit Medical Vacation Life Insurance
Defined Contribution Dental Holidays STD Retiree Medical Sick LTD
Retiree Life
0 20 40 60 80 100 120 140
Security
Paid Time Off
Health
Retirement
Total
First Quartile
Second Quartile
Third Quartile
Fourth Quartile
City of Alexandria - ERT

66
Watson Wyatt COMPARISON™ April 2009
CCiittyy ooff AAlleexxaannddrriiaa -- EERRTT EEmmppllooyyeeeess
22000088 CCOOMMPPAARRIISSOONN SSttuuddyy Components of Benefit Values
The following graph illustrates the portion of each employer-provided benefit as a percentage of
the total benefit program for City of Alexandria and for an average of the other employers in the
report.
0% 5% 10% 15% 20% 25% 30%
Defined Benefit
Defined Contribution
Retiree Medical
Retiree Life
Medical
Dental
Vacation
Holidays
Sick
Life Insurance
STD
LTD
City of Alexandria - ERT
Other Employers

SSeeccttiioonn IIII.. DDeettaaiilleedd RReessuullttss

88
Watson Wyatt COMPARISON™ April 2009
CCiittyy ooff AAlleexxaannddrriiaa -- EERRTT EEmmppllooyyeeeess
22000088 CCOOMMPPAARRIISSOONN SSttuuddyy General Methodology
The relative values in this report represent the annual cost of each benefit program without
regard to the employer’s funding or experience. A description of the specific methodology used
to value each of the benefits in this report is included later in this section for each benefit group.
A general overview of the valuation approach is provided here.
The cost of providing each benefit is calculated for every employee in the City of Alexandria
workforce. The total cost of each benefit is the sum of the costs calculated for each employee.
Employee costs based on actual employee contributions are subtracted from the total cost to
produce an employer cost. The exception to this is defined contribution plans, where the
employee contribution is the amount that the employee has contributed, and the employer match
is calculated based on that contribution.
This calculation is repeated for each of the comparison employers, using City of Alexandria’s
workforce. That is, we are calculating the cost of the benefit plans of the comparison employers
as if City of Alexandria had adopted the benefit provisions of each of the comparison employers.
The costs calculated reflect the demographics and the assumptions of City of Alexandria. These
values reflect the cost of the benefit, not the value “perceived” by employees.
The values are “normalized” to City of Alexandria’s cost by dividing the cost calculated for each
comparison employer by the cost calculated for City of Alexandria’s benefit plans. The results
are thus presented relative to City of Alexandria’s results. If there is no employer cost for some
of City of Alexandria’s benefits, then those benefits are presented as relative to the average
employer-provided value.
Results are presented first in a table format. Each employer in the study is ranked according to
the value of the employer-provided benefit. The City of Alexandria value is highlighted. To
assist in evaluating the benefits, the employee-provided value and the total value are also listed
in each table. The values in the table also are presented in a bar chart. Additionally, for each
benefit or benefit group other than the total, a pie chart representing that segment’s value as a
percentage of the City of Alexandria benefit program is presented. The benefit(s) being
described appears as an exploded slice.

99
Watson Wyatt COMPARISON™ April 2009
Demographics The active employee workforce data used in this report was supplied by City of Alexandria. The
workforce consists of 62 full time ERT employees as of August 15, 2007. Demographics play a
major role in the COMPARISON valuation and should be considered when reviewing results. A
summary of the workforce follows.
Age Service
Age Range Count % Service Range Count %
Under 25 5 8% Under 1 9 15% 25 – 29 8 13% 1 – 4 17 27% 30 – 34 10 16% 5 – 9 10 16% 35 – 39 13 21% 10 – 14 7 11% 40 – 44 12 19% 15 – 19 10 16% 45 – 49 6 10% 20 – 24 3 5% 50 – 54 8 13% 25 – 29 4 6% 55 – 59 0 0% 30 – 34 2 3% Over 59 0 0% 35 or More 0 0%
Total 62 100% Total 62 100% Average 38.2 Average 10.0
Base Pay Sex
Pay Range Count % Sex Count %
Below $20,000 0 0% Male 40 65% 20,000 – 29,999 0 0% Female 22 35% 30,000 – 39,999 0 0% Total 62 100%
40,000 – 49,999 16 26% 50,000 – 59,999 19 31% 60,000 – 69,999 9 15% 70,000 – 79,999 14 23% 80,000 – 89,999 3 5% 90,000 or More 1 2%
Total 62 100% Average $60,570
1100
Watson Wyatt COMPARISON™ April 2009
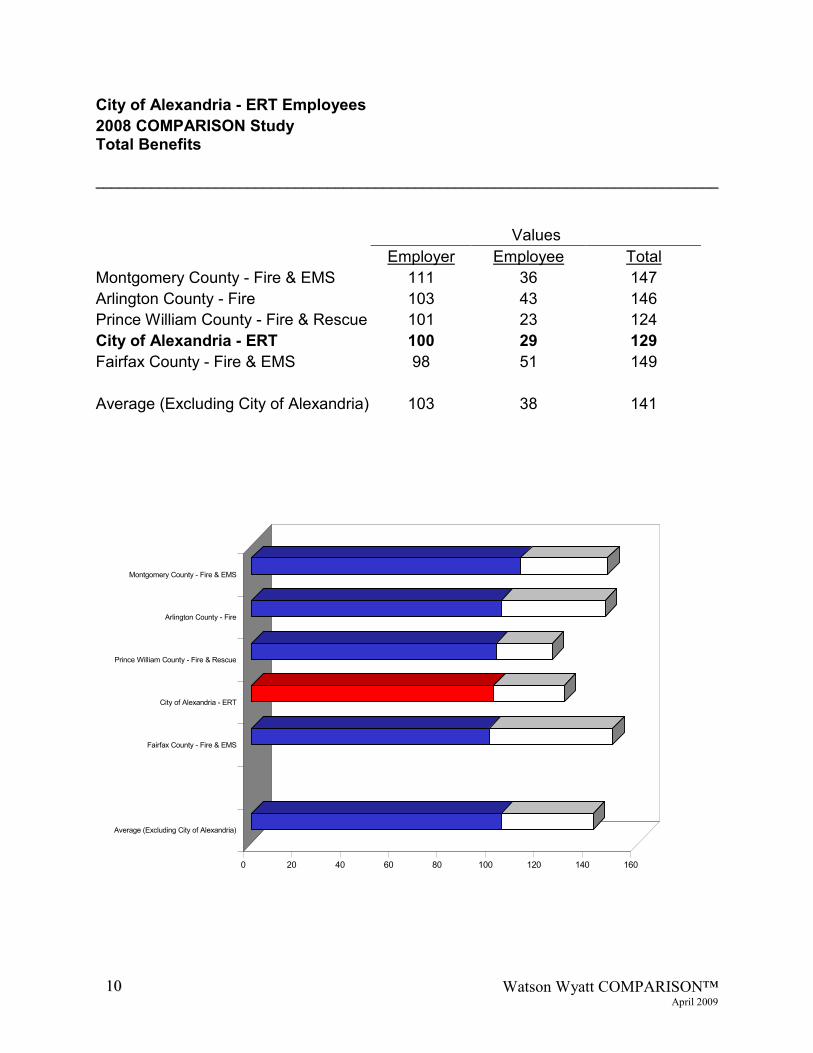
City of Alexandria - ERT Employees 2008 COMPARISON Study Total Benefits
____________________________________________________________________________________________________________________________________________________________
Values Employer Employee Total
Montgomery County - Fire & EMS 111 36 147 Arlington County - Fire 103 43 146 Prince William County - Fire & Rescue 101 23 124 City of Alexandria - ERT 100 29 129 Fairfax County - Fire & EMS 98 51 149 Average (Excluding City of Alexandria) 103 38 141
0 20 40 60 80 100 120 140 160
Montgomery County - Fire & EMS
Arlington County - Fire
Prince William County - Fire & Rescue
City of Alexandria - ERT
Fairfax County - Fire & EMS
Average (Excluding City of Alexandria)

1111
Watson Wyatt COMPARISON™ April 2009
CCiittyy ooff AAlleexxaannddrriiaa -- EERRTT EEmmppllooyyeeeess
22000088 CCOOMMPPAARRIISSOONN SSttuuddyy Retirement Plans
Summary of Results The retirement plans group consists of the defined benefit plan, defined contribution plan, retiree
medical plan and retiree life insurance plan for each employer. City of Alexandria ranks as
follows:
Benefit
City of Alexandria's
Value
Comparison Group
Average Benefit Value
City of Alexandria’s Ranking in
Comparison Group
Benefit Value as a Percentage of
City of Alexandria's Total
Program Retirement 100 105 4th 32 Defined Benefit 100 95 2nd 30 Defined Contribution 0 100 Tied for 3rd 0 Retiree Medical 100 254 3rd 2 Retiree Life 100 37 1st 1
Defined Benefit Plan Values The defined benefit values are calculated using the projected unit credit normal cost method for
each plan. Under this method the present value of benefits accrued this year, taking into account
expected future pay increases, produces the annual plan cost.
In general, the same assumptions are used in valuing all defined benefit plans, providing a
consistent basis of comparison. The value of a cash balance pension plan depends on the interest
rate credits applied to participant balances. For plans that use a fixed rate, that rate is applied.
For plans that use a rate based on the 30-year Treasury Bond, we assume a 5.5 percent annual
interest rate credit. For plans that use a rate based on 5 or 10-year Treasury Bonds, we assume a
rate of 5.0 percent. For plans that use a rate based on a Treasury issue with a maturity less than 5
years, we assume a rate of 4.0 percent.
1122
Watson Wyatt COMPARISON™ April 2009
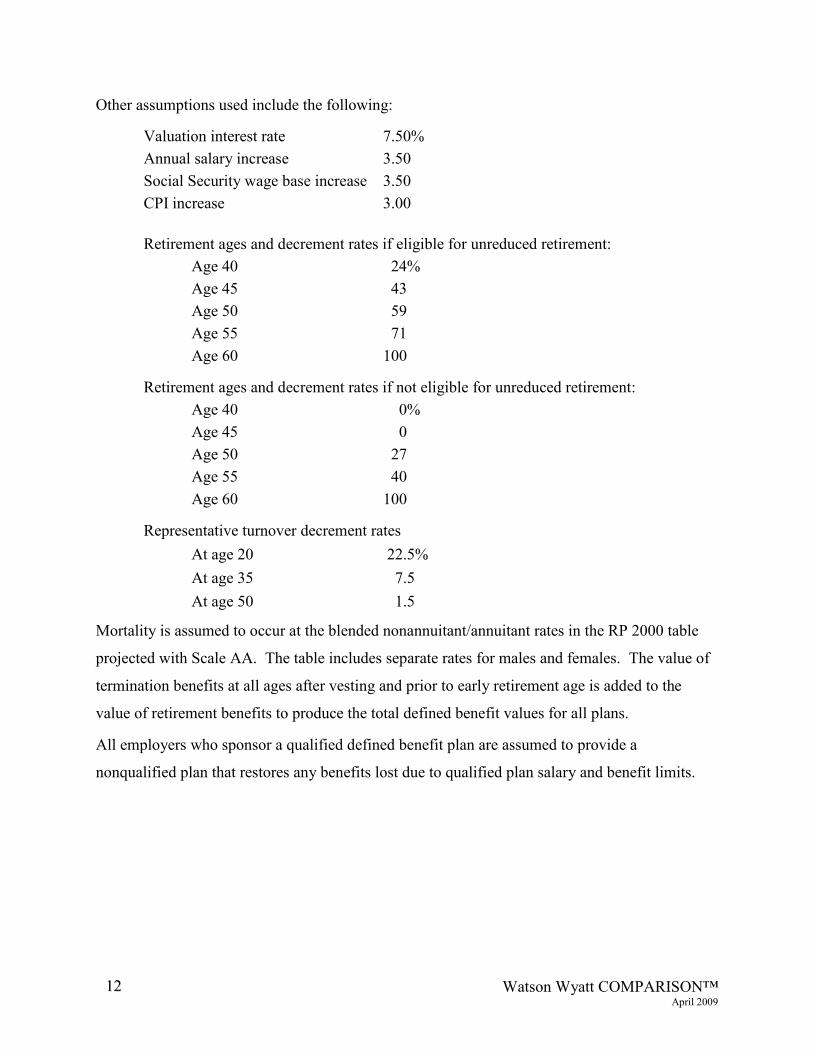
Other assumptions used include the following:
Valuation interest rate 7.50% Annual salary increase 3.50 Social Security wage base increase 3.50 CPI increase 3.00
Retirement ages and decrement rates if eligible for unreduced retirement:
Age 40 24% Age 45 43 Age 50 59 Age 55 71 Age 60 100
Retirement ages and decrement rates if not eligible for unreduced retirement: Age 40 0% Age 45 0 Age 50 27 Age 55 40 Age 60 100
Representative turnover decrement rates At age 20 22.5% At age 35 7.5 At age 50 1.5
Mortality is assumed to occur at the blended nonannuitant/annuitant rates in the RP 2000 table
projected with Scale AA. The table includes separate rates for males and females. The value of
termination benefits at all ages after vesting and prior to early retirement age is added to the
value of retirement benefits to produce the total defined benefit values for all plans.
All employers who sponsor a qualified defined benefit plan are assumed to provide a
nonqualified plan that restores any benefits lost due to qualified plan salary and benefit limits.

1133
Watson Wyatt COMPARISON™ April 2009
Defined Contribution Plan Values Defined contribution plan values are calculated by using assumptions about City of Alexandria’s
employee deferrals. The average contribution rates for various pay levels are shown below.
Annual Salary
Participating Employee Contributions as a
Percent of Pay Percent of Employees
Participating Under $30,000 2.00% 5%
$30,000 - $59,999 4.60% 35% $60,000 - $79,999 6.70% 61% $80,000 - $99,999 8.00% 64% $100,000 and Over 9.00% 65%
The annual employer matching contribution is calculated for each eligible employee.
Contributions not based on matching employee contributions are calculated and included in the
value. Finally, a discount factor is applied reflecting the probability that the employee will leave
the employer before vesting in the employer contributions. This discount factor uses the same
withdrawal assumptions as the defined benefit plan.
All employers who sponsor a qualified defined contribution plan are assumed to provide a
nonqualified plan that restores any employer-provided benefits lost due to qualified plan salary
and benefit limits.
Retiree Medical Plan Values The rates for retiree medical plans are calculated using a simulation model for estimating
medical benefit charges and payments. The model simulates the payment of claims by applying
the detailed provisions of each employer’s early and Medicare-eligible retiree medical plans, less
Medicare payments, to a sample retiree population. These rates are then projected to calculate
the payments over the life span of each current employee’s projected retirement years (including
coverage of surviving dependents, if permitted by the plan). Relative values are calculated by
discounting the value of projected benefits to the date of the valuation and dividing them by each
employee’s projected service at retirement to determine the employee’s annual accrual. This
amount is then allocated to employer and employee-provided value using the projected retiree
contributions. The retiree medical calculations use the same turnover, retirement decrements,
and interest rate assumptions as the defined benefit plan calculations. Additionally, 75 percent of

1144
Watson Wyatt COMPARISON™ April 2009
retirees are assumed to have a spouse in determining retiree medical values. The medical
inflation factor for the current year was assumed to be 9.00 percent, declining to an ultimate rate
of 5.00 percent over a 10-year period.
Retiree Life Insurance Plan Values The rates for retiree life insurance plans are developed using workforce data, the plan provisions
and the same postretirement mortality basis as used for the defined benefit plan. Relative values
are calculated by discounting the values of the expected benefits to the date of the valuation and
dividing them by each employee’s projected service at retirement to determine the employee’s
annual accrual. This amount is then allocated to employer and employee-provided value using
the projected retiree contributions. The retiree life calculations use the same turnover, retirement
decrements, interest rate and salary increase assumptions as the defined benefit plan calculations.
1155
Watson Wyatt COMPARISON™ April 2009
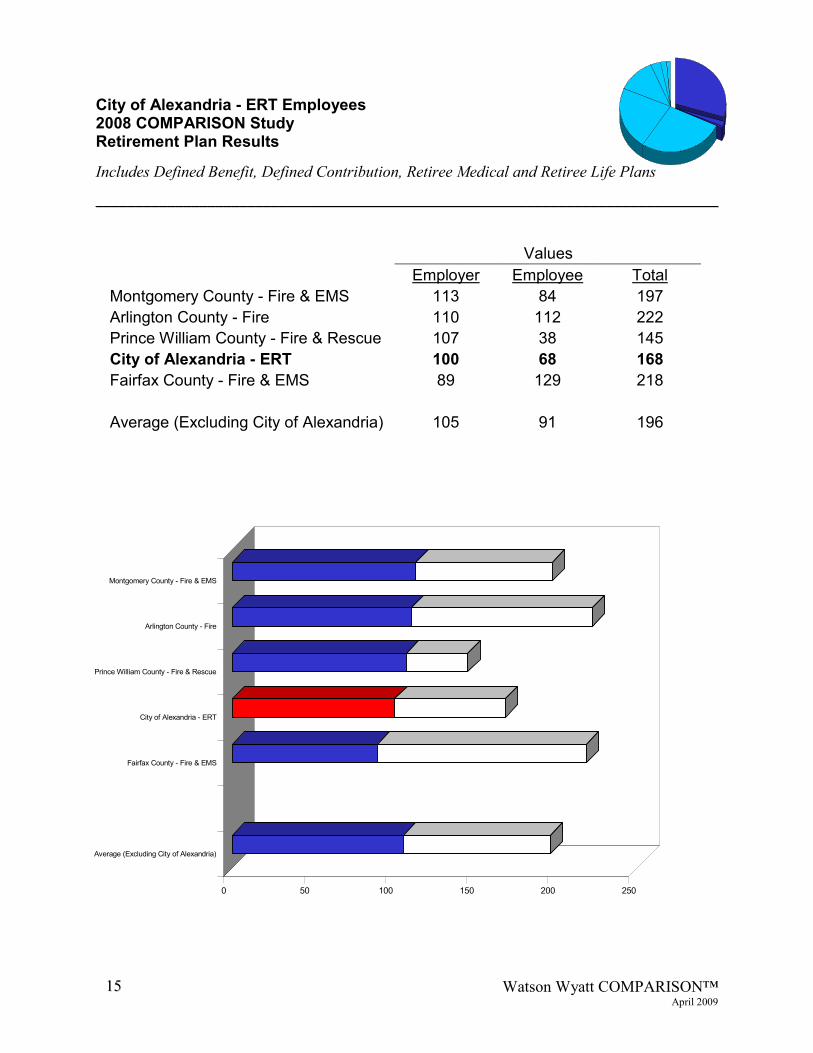
City of Alexandria - ERT Employees 2008 COMPARISON Study Retirement Plan Results
Includes Defined Benefit, Defined Contribution, Retiree Medical and Retiree Life Plans
____________________________________________________________________________________________________________________________________________________________
Values Employer Employee Total
Montgomery County - Fire & EMS 113 84 197 Arlington County - Fire 110 112 222 Prince William County - Fire & Rescue 107 38 145 City of Alexandria - ERT 100 68 168 Fairfax County - Fire & EMS 89 129 218 Average (Excluding City of Alexandria) 105 91 196
0 50 100 150 200 250
Montgomery County - Fire & EMS
Arlington County - Fire
Prince William County - Fire & Rescue
City of Alexandria - ERT
Fairfax County - Fire & EMS
Average (Excluding City of Alexandria)

1166
Watson Wyatt COMPARISON™ April 2009
City of Alexandria - ERT Employees 2008 COMPARISON Study Defined Benefit Plan Results
____________________________________________________________________________________________________________________________________________________________
Values Employer Employee Total
Prince William County - Fire & Rescue 104 12 116 City of Alexandria - ERT 100 0 100 Arlington County - Fire 96 64 160 Fairfax County - Fire & EMS 93 60 153 Montgomery County - Fire & EMS 87 46 133 Average (Excluding City of Alexandria) 95 46 141
0 20 40 60 80 100 120 140 160
Prince William County - Fire & Rescue
City of Alexandria - ERT
Arlington County - Fire
Fairfax County - Fire & EMS
Montgomery County - Fire & EMS
Average (Excluding City of Alexandria)

1177
Watson Wyatt COMPARISON™ April 2009
City of Alexandria - ERT Employees 2008 COMPARISON Study Defined Contribution Plan Results
____________________________________________________________________________________________________________________________________________________________
Values Employer Employee Total
Prince William County - Fire & Rescue 259 1,063 1,322 Arlington County - Fire 141 1,063 1,204 City of Alexandria - ERT 0 1,063 1,063 Fairfax County - Fire & EMS 0 1,063 1,063 Montgomery County - Fire & EMS 0 1,063 1,063 Average (Excluding City of Alexandria) 100 1,063 1,163
0 200 400 600 800 1000 1200 1400
Prince William County - Fire & Rescue
Arlington County - Fire
City of Alexandria - ERT
Fairfax County - Fire & EMS
Montgomery County - Fire & EMS
Average (Excluding City of Alexandria)
1188
Watson Wyatt COMPARISON™ April 2009
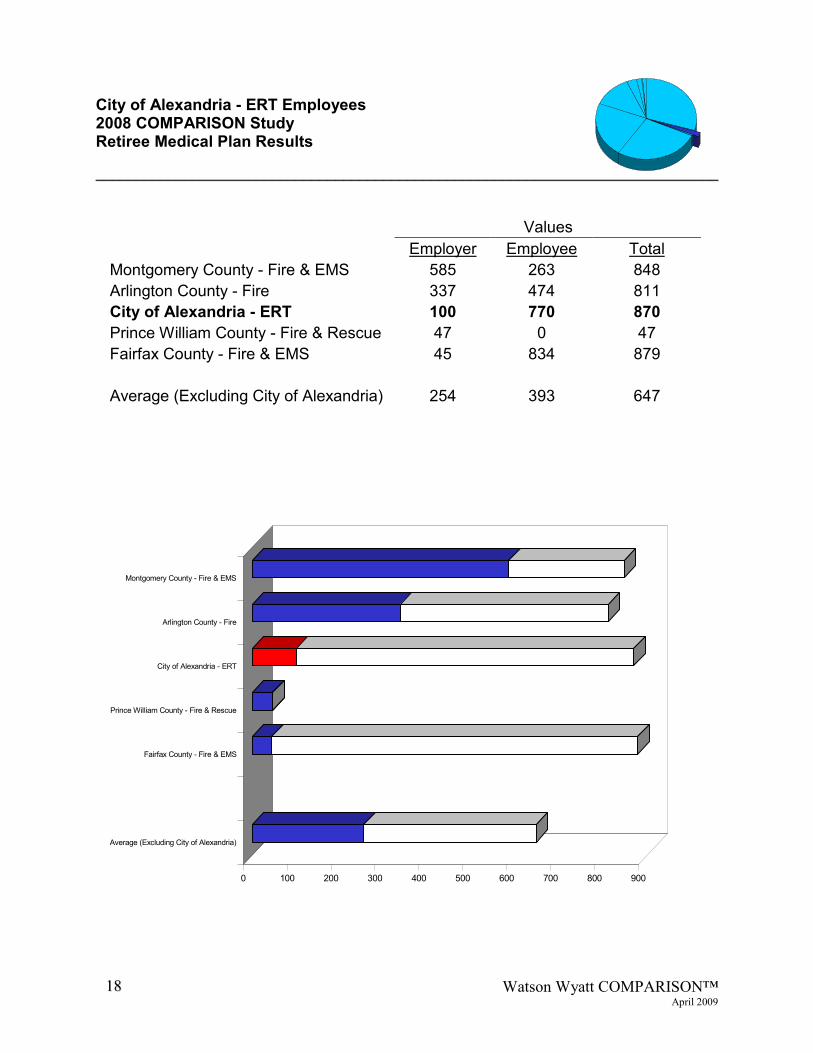
City of Alexandria - ERT Employees 2008 COMPARISON Study Retiree Medical Plan Results
____________________________________________________________________________________________________________________________________________________________
Values Employer Employee Total
Montgomery County - Fire & EMS 585 263 848 Arlington County - Fire 337 474 811 City of Alexandria - ERT 100 770 870 Prince William County - Fire & Rescue 47 0 47 Fairfax County - Fire & EMS 45 834 879 Average (Excluding City of Alexandria) 254 393 647
0 100 200 300 400 500 600 700 800 900
Montgomery County - Fire & EMS
Arlington County - Fire
City of Alexandria - ERT
Prince William County - Fire & Rescue
Fairfax County - Fire & EMS
Average (Excluding City of Alexandria)
1199
Watson Wyatt COMPARISON™ April 2009
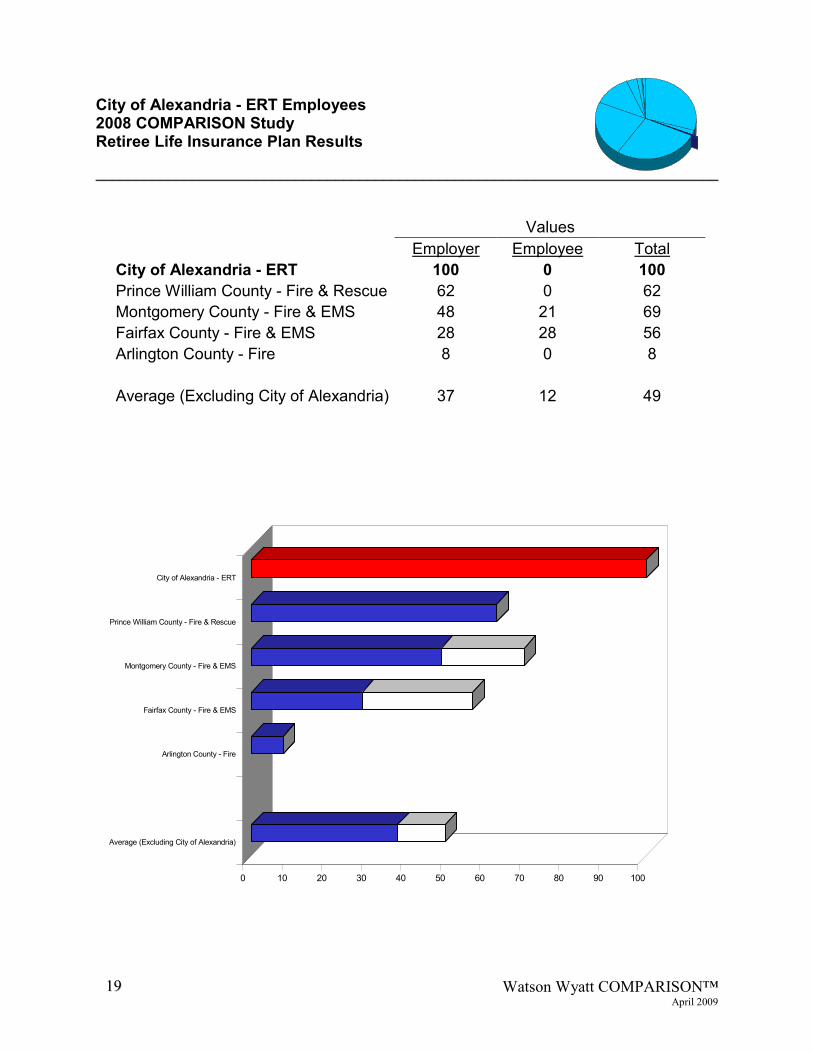
City of Alexandria - ERT Employees 2008 COMPARISON Study Retiree Life Insurance Plan Results
____________________________________________________________________________________________________________________________________________________________
Values Employer Employee Total
City of Alexandria - ERT 100 0 100 Prince William County - Fire & Rescue 62 0 62 Montgomery County - Fire & EMS 48 21 69 Fairfax County - Fire & EMS 28 28 56 Arlington County - Fire 8 0 8 Average (Excluding City of Alexandria) 37 12 49
0 10 20 30 40 50 60 70 80 90 100
City of Alexandria - ERT
Prince William County - Fire & Rescue
Montgomery County - Fire & EMS
Fairfax County - Fire & EMS
Arlington County - Fire
Average (Excluding City of Alexandria)

20 Watson Wyatt COMPARISON™
AApprriill 22000099
Retirement Plans – Plan Provisions Summary
Defined Benefit Plans - Table 1 Employer Type of Plan Eligibility Vesting Schedule Normal Form of
Benefit Definition of Pay Employee Contributions
City of Alexandria - ERT Traditional defined benefit plan
Any age and any service Benefit service commences at date of participation.
5 years of service: 100% Single: Life only Married: Life only
Bonus not included in definition of pay Final average pay: 3 years
None
Arlington County Government - Fire
Traditional defined benefit plan
Any age and any service Benefit service commences at date of participation.
5 years of service: 100% Single: No default Married: No default
Bonus not included in definition of pay Final average pay: 3 years
7.5% of pay
Fairfax County Government - Fire & EMS
Traditional defined benefit plan
Any age and any service Benefit service commences at date of hire.
5 years of service: 100% Single: Life only Married: No default
Bonus not included in definition of pay Final average pay: 3 years
7.08% of pay
Montgomery County Government - Fire & EMS
Traditional defined benefit plan
Any age and any service Benefit service commences at date of participation.
5 years of service: 100% Single: Life only Married: Life only
Bonus not included in definition of pay Final average pay: 3 years
5.50% of pay up to the Social Security wage base plus 9.25% of pay over the Social Security wage base; upon the 25th year from your leave accrual date, 4.75% of pay up to the Social Security wage base plus 8.5% of pay over the Social Security wage base. Note: Employee contributions earn 4% interest
Prince William County Government - Fire and Rescue
Traditional defined benefit plan
Any age and any service Benefit service commences at date of hire.
5 years of service: 100% Single: Life only Married: Joint and 100% survivor
Bonus not included in definition of pay Final average pay: 3 years
1.37% of pay

21 Watson Wyatt COMPARISON™
AApprriill 22000099
Defined Benefit Plans - Table 2 Employer Retirement Rules Normal Retirement Benefit Early Retirement Benefit Supplemental
Benefit
City of Alexandria - ERT Unreduced benefit: Age 50 with 30 years of service; age 65 with 5 years of service Reduced benefit: Age 50 with 10 years of service; age 55 with 5 years of service
State plan: 1.7% of final average pay times service. COLA: On July 1 of second calendar year of retirement increased by CPI up to 3% plus half of each percentage increase from 3% to 7% (not to exceed 5% annually). Increases may be made yearly after that (increases are assumed to occur each year for COMPARISON purposes). City supplement: 0.6% of final average pay times service for the first 5 years plus 0.9% of final average pay times service from 5 to 15 years plus 1.0% of final average pay times service from 15 to 30 years. Unreduced benefit available at age 65 with 5 years of service or age 50 with 25 years of service. Reduced benefit available at age 55 with 5 years of service.
State plan: Accrued benefit reduced 6% per year for the first 5 years and 4.8% for each additional year prior to meeting unreduced age or service eligibility requirements (whichever is less). If age 50 with at least 10 years of service but less than 20 years of service, benefit is reduced by age 55 reduction and then by 7.2% per year prior to age 55. If age 50 with 20 to 30 years of service, reduced by service reduction and then by 7.2% per year prior to age 55. City supplement: Accrued benefit reduced 6.67% per year for first 5 years and 3.33% per year for next 5 years.
None
Arlington County Government - Fire
Unreduced benefit: Age 52 with 5 years of service; any age with 25 years of service Reduced benefit: Age 42 with 5 years of service
As of 01/04/2009 (new hires): 2.7% of final average pay times service up to 30 years. COLA: After retirement, benefits are increased annually by CPI up to 3% plus 50% of CPI increase in excess of 3% up to a maximum benefit increase of 7.5%.
Accrued benefit reduced 6% per year prior to unreduced eligibility.
None
Fairfax County Government - Fire & EMS
Unreduced benefit: Any age with 25 years of service; age 55 with 6 years of service Reduced benefit: Any age with 20 years of service
2.5% of final average pay times service. Benefit is then increased by 3%. COLA: Effective July 1 and based on the change in the CPI for the Washington Metropolitan Area for the year ending in March, up to a maximum of 4%. If there is an actuarial surplus an additional 1% may be added.
Representative rates: Years of Service Age 20 21 22 23 24 50 69.42% 74.92% 80.72% 86.83% 93.25% 45 71.89% 76.98% 82.34% 87.95% 93.83% 40 73.84% 78.61% 83.60% 88.84% 94.30%
Age/service requirements: Age 55 with 6 years of service or any age with 20 years of service Age when supplement terminates: SSNRA Benefit formula: 0.3% of final average pay times service. Benefit is then increased by 3.0%; reduced by plan early retirement factors.

22 Watson Wyatt COMPARISON™
AApprriill 22000099
Employer Retirement Rules Normal Retirement Benefit Early Retirement Benefit Supplemental Benefit
City of Alexandria - ERT Unreduced benefit: Age 50 with 30 years of service; age 65 with 5 years of service Reduced benefit: Age 50 with 10 years of service; age 55 with 5 years of service
State plan: 1.7% of final average pay times service. COLA: On July 1 of second calendar year of retirement increased by CPI up to 3% plus half of each percentage increase from 3% to 7% (not to exceed 5% annually). Increases may be made yearly after that (increases are assumed to occur each year for COMPARISON purposes). City supplement: 0.6% of final average pay times service for the first 5 years plus 0.9% of final average pay times service from 5 to 15 years plus 1.0% of final average pay times service from 15 to 30 years. Unreduced benefit available at age 65 with 5 years of service or age 50 with 25 years of service. Reduced benefit available at age 55 with 5 years of service.
State plan: Accrued benefit reduced 6% per year for the first 5 years and 4.8% for each additional year prior to meeting unreduced age or service eligibility requirements (whichever is less). If age 50 with at least 10 years of service but less than 20 years of service, benefit is reduced by age 55 reduction and then by 7.2% per year prior to age 55. If age 50 with 20 to 30 years of service, reduced by service reduction and then by 7.2% per year prior to age 55. City supplement: Accrued benefit reduced 6.67% per year for first 5 years and 3.33% per year for next 5 years.
None
Montgomery County Government - Fire & EMS
Unreduced benefit: Age 55 with 15 years of service; any age with 20 years of service Reduced benefit: N/A
Benefit payable to SSNRA: 2.5% of final 3-year average pay times service up to 20 years plus 2.0% of final 3-year average pay times service for 21 to 31 years plus 2.0% of final 3-year average pay times sick leave credits used for credited service in excess of 20 years up to 2 years (sick leave credits not valued for COMPARISON purposes). Benefit payable after SSNRA: 1.71875% of final 3-year average pay up to Social Security Covered Compensation (SSCC) times service up to 20 years plus 1.3750% of final 3-year average pay up to SSCC times service for 21 to 31 years plus 1.3750% of final 3-year average pay times sick leave credits used for credited service in excess of 20 years up to 2 years (sick leave credits not valued for COMPARISON purposes); plus 2.5% of final 3-year average pay over SSCC times service up to 20 years plus 2.0% of final 3-year average pay over SSCC times service for 21 to 31 years. COLA: After retirement the benefit will be increased by CPI up to 3% and 60% of CPI over 3%. (For retirees under age 65, maximum increase is 7.5% per year).
No reduced benefits payable. Age/service requirements: Eligible for retirement Age when supplement terminates: SSNRA Benefit formula: Social Security bridge benefit is the difference between benefit payable to SSNRA and the benefit payable after SSNRA described under normal retirement benefit.

23 Watson Wyatt COMPARISON™
AApprriill 22000099
Employer Retirement Rules Normal Retirement Benefit Early Retirement Benefit Supplemental Benefit
City of Alexandria - ERT Unreduced benefit: Age 50 with 30 years of service; age 65 with 5 years of service Reduced benefit: Age 50 with 10 years of service; age 55 with 5 years of service
State plan: 1.7% of final average pay times service. COLA: On July 1 of second calendar year of retirement increased by CPI up to 3% plus half of each percentage increase from 3% to 7% (not to exceed 5% annually). Increases may be made yearly after that (increases are assumed to occur each year for COMPARISON purposes). City supplement: 0.6% of final average pay times service for the first 5 years plus 0.9% of final average pay times service from 5 to 15 years plus 1.0% of final average pay times service from 15 to 30 years. Unreduced benefit available at age 65 with 5 years of service or age 50 with 25 years of service. Reduced benefit available at age 55 with 5 years of service.
State plan: Accrued benefit reduced 6% per year for the first 5 years and 4.8% for each additional year prior to meeting unreduced age or service eligibility requirements (whichever is less). If age 50 with at least 10 years of service but less than 20 years of service, benefit is reduced by age 55 reduction and then by 7.2% per year prior to age 55. If age 50 with 20 to 30 years of service, reduced by service reduction and then by 7.2% per year prior to age 55. City supplement: Accrued benefit reduced 6.67% per year for first 5 years and 3.33% per year for next 5 years.
None
Prince William County Government - Fire and Rescue
Unreduced benefit: Age 60 with 5 years of service; age 50 with 25 years of service Reduced benefit: Age 50 with 5 years of service
1.85% of final average pay times service. COLA: On July 1 of second calendar year of retirement increased by CPI up to 3% plus half of each percentage increase from 3% to 7% (not to exceed 5% annually). Increases may be made yearly after that (increases are assumed to occur each year for COMPARISON purposes).
Accrued benefit reduced 6% per year for the first 5 years and 4.8% for each additional year prior to meeting unreduced age or service eligibility requirements (whichever is less).
Age/service requirements: 20 years of hazardous duty service Age when supplement terminates: SSNRA Benefit formula: Determined by the Virginia General Assembly every other year, currently $11,508 per year

24 Watson Wyatt COMPARISON™
AApprriill 22000099
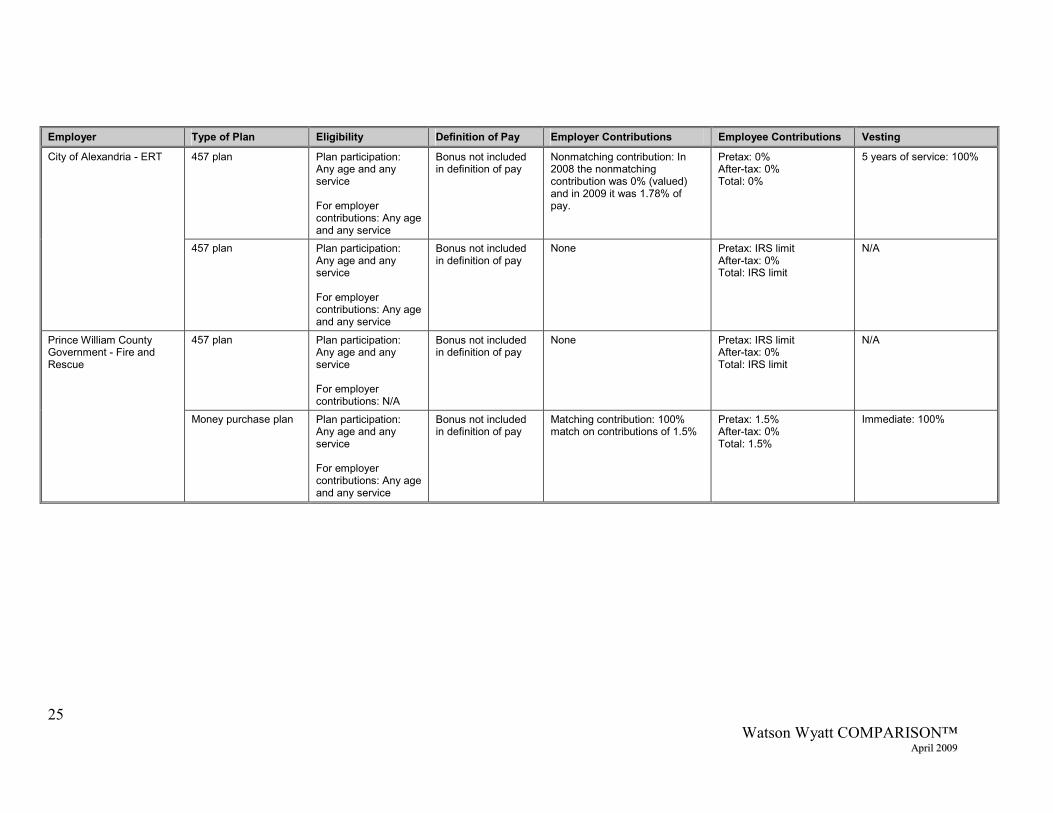
Defined Contribution Plans Employer Type of Plan Eligibility Definition of Pay Employer Contributions Employee Contributions Vesting
City of Alexandria - ERT 457 plan Plan participation: Any age and any service For employer contributions: Any age and any service
Bonus not included in definition of pay
Nonmatching contribution: In 2008 the nonmatching contribution was 0% (valued) and in 2009 it was 1.78% of pay.
Pretax: 0% After-tax: 0% Total: 0%
5 years of service: 100%
457 plan Plan participation: Any age and any service For employer contributions: Any age and any service
Bonus not included in definition of pay
None Pretax: IRS limit After-tax: 0% Total: IRS limit
N/A
Arlington County Government - Fire
401(a) plan Plan participation: Any age and any service For employer contributions: N/A
Bonus not included in definition of pay
None Pretax: 0% After-tax: 100% Total: 100%
N/A
457 plan Plan participation: Any age and any service For employer contributions: Any age and any service
Bonus not included in definition of pay
Matching contribution: 100% match on contributions of up to $20 per pay period (26 pay periods) up to a calendar year maximum of $520. Match is deposited into the 401(a) plan.
Pretax: 100% After-tax: 0% Total: 100%
Immediate: 100%
Fairfax County Government - Fire & EMS
457 plan Plan participation: Any age and any service For employer contributions: N/A
Bonus included in definition of pay
None Pretax: 100% After-tax: 0% Total: 100%
N/A
Montgomery County Government - Fire & EMS
457 plan Plan participation: Any age and any service For employer contributions: N/A
Bonus not included in definition of pay
None Pretax: IRS limit After-tax: 0% Total: IRS limit
N/A
25 Watson Wyatt COMPARISON™
AApprriill 22000099
Employer Type of Plan Eligibility Definition of Pay Employer Contributions Employee Contributions Vesting
City of Alexandria - ERT 457 plan Plan participation: Any age and any service For employer contributions: Any age and any service
Bonus not included in definition of pay
Nonmatching contribution: In 2008 the nonmatching contribution was 0% (valued) and in 2009 it was 1.78% of pay.
Pretax: 0% After-tax: 0% Total: 0%
5 years of service: 100%
457 plan Plan participation: Any age and any service For employer contributions: Any age and any service
Bonus not included in definition of pay
None Pretax: IRS limit After-tax: 0% Total: IRS limit
N/A
Prince William County Government - Fire and Rescue
457 plan Plan participation: Any age and any service For employer contributions: N/A
Bonus not included in definition of pay
None Pretax: IRS limit After-tax: 0% Total: IRS limit
N/A
Money purchase plan Plan participation: Any age and any service For employer contributions: Any age and any service
Bonus not included in definition of pay
Matching contribution: 100% match on contributions of 1.5%
Pretax: 1.5% After-tax: 0% Total: 1.5%
Immediate: 100%

26 Watson Wyatt COMPARISON™
AApprriill 22000099
Medical Benefits for Retirees Employer Groups Provided
Benefits Age or Service Requirements
Under Age 65 Coverage Provisions
Age 65 and Over Coverage Provisions
Monthly Retiree Contributions
City of Alexandria - ERT All retirees Eligibility for plan access: Age 50 with 10 years of service; age 55 with 5 years of service Eligibility for any employer subsidy: Age 50 with 10 years of service; age 55 with 5 years of service
Same as active plan HMO plan Deductible: None OOP limit: $3,500/$9,400 Inpatient: 100% Office visit: 100%/$15 Drug coverage: Same as active plan Medicare coordination: Traditional coordination of benefits (pays up to 100% reimbursement from plan and Medicare combined)
City contributes $260 per month toward the cost of the plan. This is a fixed amount subject to review each year. For COMPARISON purposes this amount is assumed not to increase with inflation. Limit on employer contribution: $260 per month
Arlington County Government - Fire
All retirees Eligibility for plan access: Age 42 with 5 years of service; any age with 25 years of service Eligibility for any employer subsidy: Age 42 with 5 years of service; any age with 25 years of service
Same as active plan Medicare Access Plus Rx Deductible: None OOP limit: $1,500 per person Inpatient: 100%/$100 copay per admission Office visit: 100%/$10 Drug coverage: Generic: $10 Brand on formulary: $20 Brand not on formulary: $40 Tier 4 (brand and generic high cost drugs over $600, not valued): $40 Catastrophic coverage (after $4,350 in true out-of-pocket costs): 95% Medicare coordination: Medicare Advantage
Percent of pay varies based on service: < 65 65 + Service Ret Ret + Sp Ret Ret + Sp < 10 years 84% 84% 82% 82% 10 to 14 68% 69% 64% 64% 15 to 19 52% 53% 46% 46% 20 to 22 36% 38% 28% 28% 23 to 24 26% 28% 17% 17% 25 + 20% 22% 10% 10% Limit on employer contribution: $960 per month

27 Watson Wyatt COMPARISON™
AApprriill 22000099
Employer Groups Provided Benefits
Age or Service Requirements
Under Age 65 Coverage Provisions
Age 65 and Over Coverage Provisions
Monthly Retiree Contributions
City of Alexandria - ERT All retirees Eligibility for plan access: Age 50 with 10 years of service; age 55 with 5 years of service Eligibility for any employer subsidy: Age 50 with 10 years of service; age 55 with 5 years of service
Same as active plan HMO plan Deductible: None OOP limit: $3,500/$9,400 Inpatient: 100% Office visit: 100%/$15 Drug coverage: Same as active plan Medicare coordination: Traditional coordination of benefits (pays up to 100% reimbursement from plan and Medicare combined)
City contributes $260 per month toward the cost of the plan. This is a fixed amount subject to review each year. For COMPARISON purposes this amount is assumed not to increase with inflation. Limit on employer contribution: $260 per month
Fairfax County Government - Fire & EMS
All retirees Eligibility for plan access: Any age and any service Eligibility for any employer subsidy: Age 55 with 5 years of service
Same as active plan Same as active plan Medicare coordination: Maintenance of benefits (subtracts Medicare payments from covered charges before calculating benefits)
Varies based on age and service: Retirees under age 55: Retiree-pay-all Retirees age 55 + receive a monthly subsidy from employer: Service Subsidy 5 to 9 years $30 10 to 14 $65 15 to 19 $155 20 to 24 $190 25 + $220
Montgomery County Government - Fire & EMS
All retirees Eligibility for plan access: Age 45 with 15 years of service; age 41 with 20 years of service Eligibility for any employer subsidy: Age 45 with 15 years of service; age 41 with 20 years of service
Same as active plan Same as active plan Medicare coordination: Traditional coordination of benefits (pays up to 100% reimbursement from plan and Medicare combined)
Average retiree contribution is 31% of premium
Prince William County Government - Fire and Rescue
All retirees Eligibility for plan access: Any age with 15 years of service Eligibility for any employer subsidy: N/A
Stipend only Stipend only All retirees: $5.50 times years of service up to 30 Limit on employer contribution: Employer stipend amount is assumed not to increase with inflation
28 Watson Wyatt COMPARISON™
AApprriill 22000099
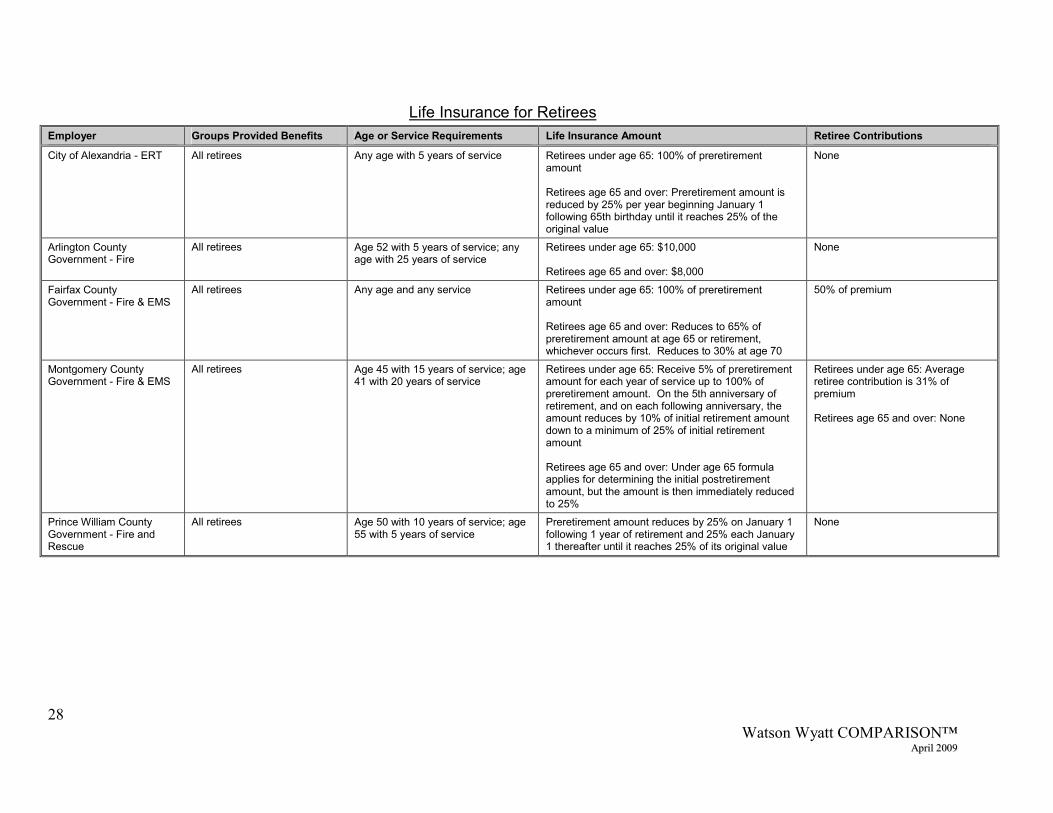
Life Insurance for Retirees Employer Groups Provided Benefits Age or Service Requirements Life Insurance Amount Retiree Contributions
City of Alexandria - ERT All retirees Any age with 5 years of service Retirees under age 65: 100% of preretirement amount Retirees age 65 and over: Preretirement amount is reduced by 25% per year beginning January 1 following 65th birthday until it reaches 25% of the original value
None
Arlington County Government - Fire
All retirees Age 52 with 5 years of service; any age with 25 years of service
Retirees under age 65: $10,000 Retirees age 65 and over: $8,000
None
Fairfax County Government - Fire & EMS
All retirees Any age and any service Retirees under age 65: 100% of preretirement amount Retirees age 65 and over: Reduces to 65% of preretirement amount at age 65 or retirement, whichever occurs first. Reduces to 30% at age 70
50% of premium
Montgomery County Government - Fire & EMS
All retirees Age 45 with 15 years of service; age 41 with 20 years of service
Retirees under age 65: Receive 5% of preretirement amount for each year of service up to 100% of preretirement amount. On the 5th anniversary of retirement, and on each following anniversary, the amount reduces by 10% of initial retirement amount down to a minimum of 25% of initial retirement amount Retirees age 65 and over: Under age 65 formula applies for determining the initial postretirement amount, but the amount is then immediately reduced to 25%
Retirees under age 65: Average retiree contribution is 31% of premium Retirees age 65 and over: None
Prince William County Government - Fire and Rescue
All retirees Age 50 with 10 years of service; age 55 with 5 years of service
Preretirement amount reduces by 25% on January 1 following 1 year of retirement and 25% each January 1 thereafter until it reaches 25% of its original value
None

2299
Watson Wyatt COMPARISON™ April 2009
CCiittyy ooff AAlleexxaannddrriiaa -- EERRTT EEmmppllooyyeeeess
22000088 CCOOMMPPAARRIISSOONN SSttuuddyy Health Plans
Summary of Results
The health plans group consists of the medical plan and dental plan for each employer. City of
Alexandria ranks as follows:
Benefit
City of Alexandria's
Value
Comparison Group Average Benefit Value
City of Alexandria’s Ranking in
Comparison Group
Benefit Value as a Percentage of City
of Alexandria's Total Program
Health 100 103 3rd 27 Medical 100 94 Tied for 2nd 27 Dental 0 100 5th 0
With managed care plans, interpreting the value of medical plans to employees is complex. In
addition to the standard relative cost values, this study includes a report on the percent of
covered expenses that are paid by the plan as an additional measure of the value of the medical
plan. These values are included with the medical plan rankings on page 33. For an explanation
on how these values are calculated, refer to page 30.
Medical Plan Values Medical plan assumptions are determined by using the actual employee medical elections
summarized in the following table.
Medical Coverage Count Percent of Employees
Employee Only 15 24% Employee + Family 43 69%
No Coverage 4 6% TOTAL 62 100%
Medical plan values are calculated by using a simulation model that estimates medical costs by
paying claims using the benefit provisions of each employer. The model is based on recent

3300
Watson Wyatt COMPARISON™ April 2009
claims data that reflect current charge and utilization patterns in employer based plans. The
claims database is derived from commercial data representing approximately four million
covered lives and tracks medical service utilization in over 60 service categories.
The model uses the detailed provisions of each employer’s medical plan and the demographic
characteristics used for the client (age, gender and medical election) to develop the estimated
claims and payments for each of the medical plans valued.
These costs vary with plan provisions such as individual and family deductibles, plan payment
percentages, employee copays, individual and family out-of-pocket limits, plan maximums and
prescription drug coverage provisions.
Generally, the same claims and assumptions are used for all medical plans except the level of
medical management is assumed to be lower in fee for service plans than in the other plan types.
The in-network utilization assumption is 90% for Preferred Provider Plans and 95% for Point of
Service plans. Out-of-area benefits are not valued.
The employer value is equal to the total value of the plan minus the employee value. The
employee value is the contribution required for plan participation. The employee value does not
include payments by the employee for deductibles or required copayments. If the employer has
reported their employee contribution as a percentage of plan costs, then that percentage is used to
compute the employee contribution. If the percent of the cost paid by the employee is not
known, then the dollar value of the required employee contribution is used.
As with the other benefits valued by COMPARISON, the medical plan values represent
COMPARISON calculations of idealized employer cost, not the value perceived by the
employee.
For employers that pay employees who decline medical coverage, the employer value of the
medical plan for these employees is equal to the amount of the opt out credit.
Percent of Covered Medical Expenses Paid by the Plan To assist in evaluating medical plans, an additional column of information is included on the
medical table on page 33. This is the percent of covered expenses that are paid by the plan, or
the benefit ratio. For example, a benefit ratio of 84 percent would indicate that of the total
medical claims, 84 percent of the cost is paid by the medical plan. The remaining 16 percent

3311
Watson Wyatt COMPARISON™ April 2009
represents amounts paid by the employee for deductibles, coinsurance, copayments and charges
not covered by the plan.
These values are intended to accurately reflect the differences in the plan designs and have not
been calibrated to reflect City of Alexandria’s experience.
Dental Plan Values Dental plan values are calculated using a proprietary model developed by Watson Wyatt
Worldwide. The model estimates the expected charges in a number of significant categories and
applies each plan’s provisions to determine the plans’ expected benefit payments. The model is
calibrated to utilization norms by service category from large national dental carriers, as well as
Watson Wyatt Worldwide survey data on premiums for employer-sponsored plans.
The total value of each dental plan equals the sum of the rates calculated for each eligible
employee. The employer value is equal to this total value minus the employee contributions
required for participation. The employee value is the contribution required for plan participation.
The employee value does not include payments by the employee for deductibles or required
copayments. If the employer has reported their employee contribution as a percentage of plan
costs, then that percentage is used to compute the employee contribution. If the percent of the
cost paid by the employee is not known, then the dollar value of the required employee
contribution is used.
The medical plan coverage status (i.e., employee only, employee plus spouse, employee plus
child, and employee plus family) is also used to determine coverage status under the dental plan.
For employers that pay employees who decline dental coverage, the employer value of the dental
plan for these employees is equal to the amount of the opt out credit. Employees who declined
medical coverage are assumed to also decline dental coverage.

3322
Watson Wyatt COMPARISON™ April 2009
City of Alexandria - ERT Employees 2008 COMPARISON Study Health Benefit Results
Includes Medical and Dental Plans
____________________________________________________________________________________________________________________________________________________________
Values Employer Employee Total
Montgomery County - Fire & EMS 118 30 148 Fairfax County - Fire & EMS 108 33 141 City of Alexandria - ERT 100 24 124 Arlington County - Fire 97 26 123 Prince William County - Fire & Rescue 87 38 125 Average (Excluding City of Alexandria) 103 32 135
0 20 40 60 80 100 120 140 160
Montgomery County - Fire & EMS
Fairfax County - Fire & EMS
City of Alexandria - ERT
Arlington County - Fire
Prince William County - Fire & Rescue
Average (Excluding City of Alexandria)

3333
Watson Wyatt COMPARISON™ April 2009
City of Alexandria - ERT Employees 2008 COMPARISON Study Medical Plan Results
____________________________________________________________________________________________________________________________________________________________
Values Percent of Employer Employee Total Claims Paid
Montgomery County - Fire & EMS 105 26 131 94.2% Fairfax County - Fire & EMS 100 26 126 90.3% City of Alexandria - ERT 100 11 111 90.6% Arlington County - Fire 87 23 110 90.2% Prince William County - Fire & Rescue 83 32 115 85.3% Average (Excluding City of Alexandria) 94 27 121 90.0%
0 20 40 60 80 100 120 140
Montgomery County - Fire & EMS
Fairfax County - Fire & EMS
City of Alexandria - ERT
Arlington County - Fire
Prince William County - Fire & Rescue
Average (Excluding City of Alexandria)

3344
Watson Wyatt COMPARISON™ April 2009
City of Alexandria - ERT Employees 2008 COMPARISON Study Dental Plan Results
____________________________________________________________________________________________________________________________________________________________
Values Employer Employee Total
Montgomery County - Fire & EMS 145 38 183 Arlington County - Fire 114 31 145 Fairfax County - Fire & EMS 83 83 166 Prince William County - Fire & Rescue 57 73 130 City of Alexandria - ERT 0 151 151 Average (Excluding City of Alexandria) 100 56 156
0 20 40 60 80 100 120 140 160 180 200
Montgomery County - Fire & EMS
Arlington County - Fire
Fairfax County - Fire & EMS
Prince William County - Fire & Rescue
City of Alexandria - ERT
Average (Excluding City of Alexandria)

35 Watson Wyatt COMPARISON™
AApprriill 22000099
Health Plans – Plan Provisions Summary
Medical - Table 1 Employer Most Representative Plan Eligibility Monthly Opt Out Credit Employee Monthly Contributions
City of Alexandria - ERT Health Maintenance Organization (HMO) First of month following 30 days of service No credit EE: 10% EE + family: 10%
Arlington County Government - Fire
Health Maintenance Organization (HMO) First of month following date of hire No credit EE: 19% EE + spouse: 23% EE + child(ren): 22% EE + family: 23%
Fairfax County Government - Fire & EMS
Point of Service (POS) Immediate No credit EE: 15% EE + 1: 25% EE + 2: 25%
Montgomery County Government - Fire & EMS
Point of Service (POS) Immediate No credit EE: 20% EE + 1: 20% EE + 2: 20%
Prince William County Government - Fire and Rescue
Preferred Provider Organization (PPO) First of month following date of hire No credit EE: 18% EE + spouse: 36% EE + child(ren): 36% EE + family: 36%
36 Watson Wyatt COMPARISON™
AApprriill 22000099
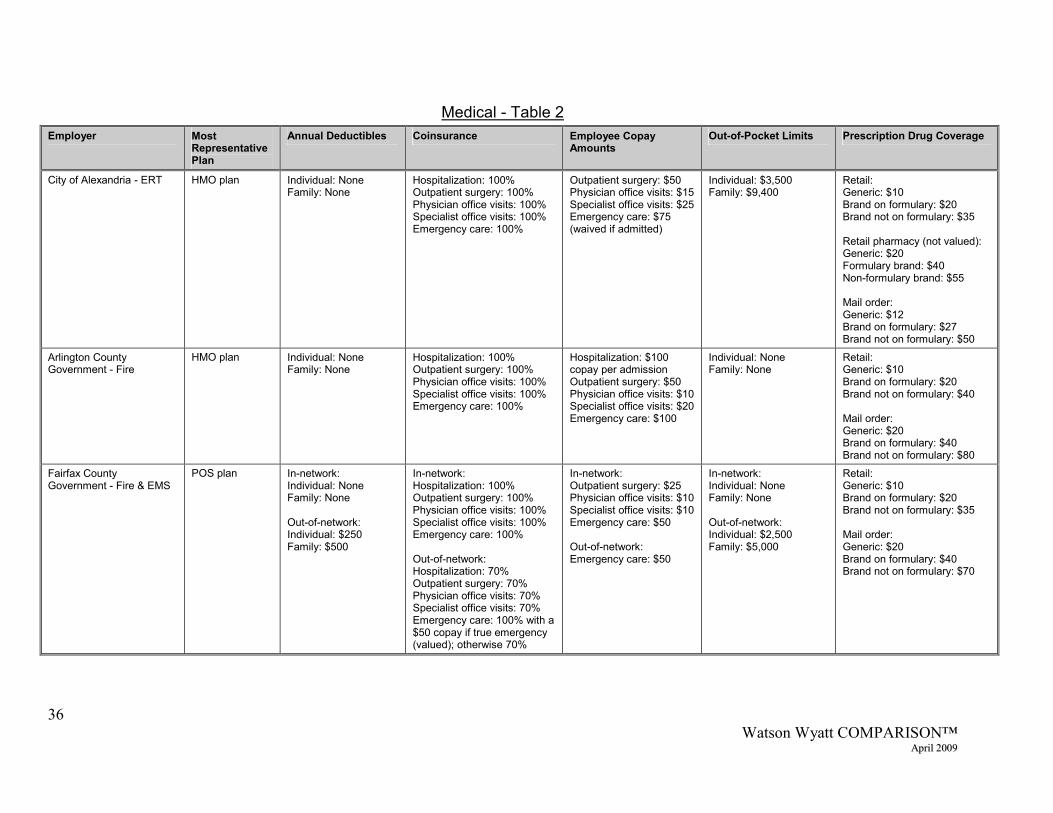
Medical - Table 2 Employer Most
Representative Plan
Annual Deductibles Coinsurance Employee Copay Amounts
Out-of-Pocket Limits Prescription Drug Coverage
City of Alexandria - ERT HMO plan Individual: None Family: None
Hospitalization: 100% Outpatient surgery: 100% Physician office visits: 100% Specialist office visits: 100% Emergency care: 100%
Outpatient surgery: $50 Physician office visits: $15 Specialist office visits: $25 Emergency care: $75 (waived if admitted)
Individual: $3,500 Family: $9,400
Retail: Generic: $10 Brand on formulary: $20 Brand not on formulary: $35 Retail pharmacy (not valued): Generic: $20 Formulary brand: $40 Non-formulary brand: $55 Mail order: Generic: $12 Brand on formulary: $27 Brand not on formulary: $50
Arlington County Government - Fire
HMO plan Individual: None Family: None
Hospitalization: 100% Outpatient surgery: 100% Physician office visits: 100% Specialist office visits: 100% Emergency care: 100%
Hospitalization: $100 copay per admission Outpatient surgery: $50 Physician office visits: $10 Specialist office visits: $20 Emergency care: $100
Individual: None Family: None
Retail: Generic: $10 Brand on formulary: $20 Brand not on formulary: $40 Mail order: Generic: $20 Brand on formulary: $40 Brand not on formulary: $80
Fairfax County Government - Fire & EMS
POS plan In-network: Individual: None Family: None Out-of-network: Individual: $250 Family: $500
In-network: Hospitalization: 100% Outpatient surgery: 100% Physician office visits: 100% Specialist office visits: 100% Emergency care: 100% Out-of-network: Hospitalization: 70% Outpatient surgery: 70% Physician office visits: 70% Specialist office visits: 70% Emergency care: 100% with a $50 copay if true emergency (valued); otherwise 70%
In-network: Outpatient surgery: $25 Physician office visits: $10 Specialist office visits: $10 Emergency care: $50 Out-of-network: Emergency care: $50
In-network: Individual: None Family: None Out-of-network: Individual: $2,500 Family: $5,000
Retail: Generic: $10 Brand on formulary: $20 Brand not on formulary: $35 Mail order: Generic: $20 Brand on formulary: $40 Brand not on formulary: $70
37 Watson Wyatt COMPARISON™
AApprriill 22000099
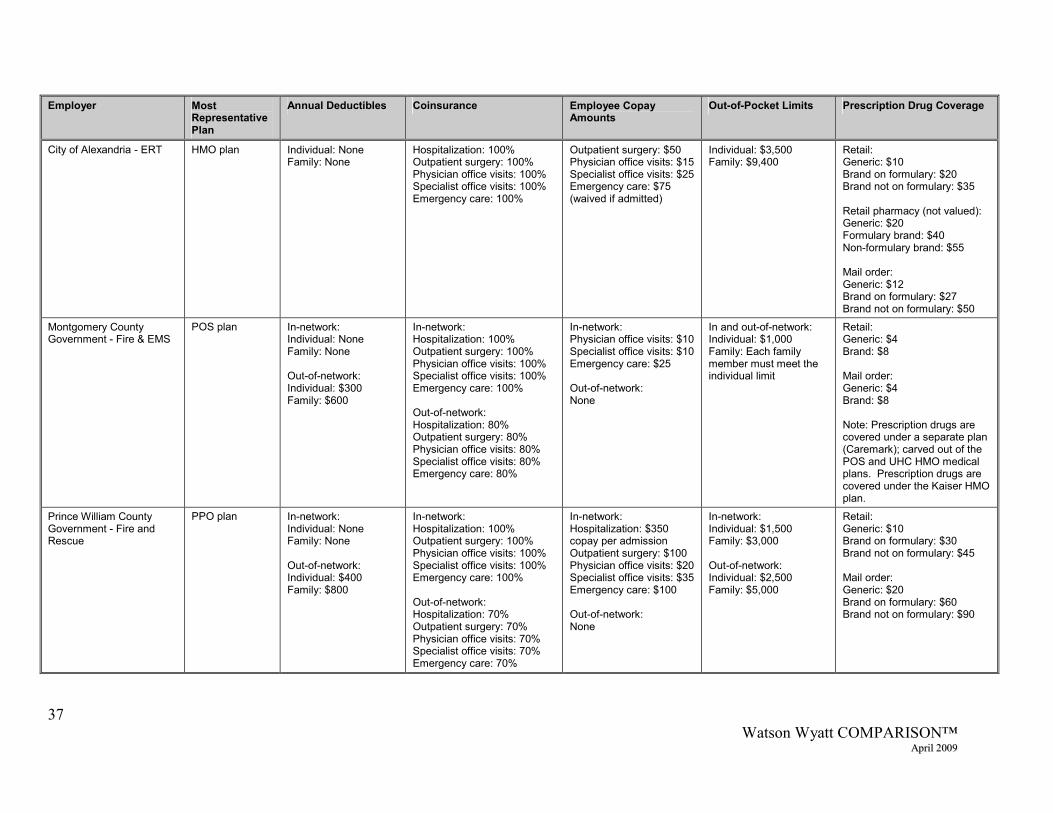
Employer Most Representative Plan
Annual Deductibles Coinsurance Employee Copay Amounts
Out-of-Pocket Limits Prescription Drug Coverage
City of Alexandria - ERT HMO plan Individual: None Family: None
Hospitalization: 100% Outpatient surgery: 100% Physician office visits: 100% Specialist office visits: 100% Emergency care: 100%
Outpatient surgery: $50 Physician office visits: $15 Specialist office visits: $25 Emergency care: $75 (waived if admitted)
Individual: $3,500 Family: $9,400
Retail: Generic: $10 Brand on formulary: $20 Brand not on formulary: $35 Retail pharmacy (not valued): Generic: $20 Formulary brand: $40 Non-formulary brand: $55 Mail order: Generic: $12 Brand on formulary: $27 Brand not on formulary: $50
Montgomery County Government - Fire & EMS
POS plan In-network: Individual: None Family: None Out-of-network: Individual: $300 Family: $600
In-network: Hospitalization: 100% Outpatient surgery: 100% Physician office visits: 100% Specialist office visits: 100% Emergency care: 100% Out-of-network: Hospitalization: 80% Outpatient surgery: 80% Physician office visits: 80% Specialist office visits: 80% Emergency care: 80%
In-network: Physician office visits: $10 Specialist office visits: $10 Emergency care: $25 Out-of-network: None
In and out-of-network: Individual: $1,000 Family: Each family member must meet the individual limit
Retail: Generic: $4 Brand: $8 Mail order: Generic: $4 Brand: $8 Note: Prescription drugs are covered under a separate plan (Caremark); carved out of the POS and UHC HMO medical plans. Prescription drugs are covered under the Kaiser HMO plan.
Prince William County Government - Fire and Rescue
PPO plan In-network: Individual: None Family: None Out-of-network: Individual: $400 Family: $800
In-network: Hospitalization: 100% Outpatient surgery: 100% Physician office visits: 100% Specialist office visits: 100% Emergency care: 100% Out-of-network: Hospitalization: 70% Outpatient surgery: 70% Physician office visits: 70% Specialist office visits: 70% Emergency care: 70%
In-network: Hospitalization: $350 copay per admission Outpatient surgery: $100 Physician office visits: $20 Specialist office visits: $35 Emergency care: $100 Out-of-network: None
In-network: Individual: $1,500 Family: $3,000 Out-of-network: Individual: $2,500 Family: $5,000
Retail: Generic: $10 Brand on formulary: $30 Brand not on formulary: $45 Mail order: Generic: $20 Brand on formulary: $60 Brand not on formulary: $90
38 Watson Wyatt COMPARISON™
AApprriill 22000099
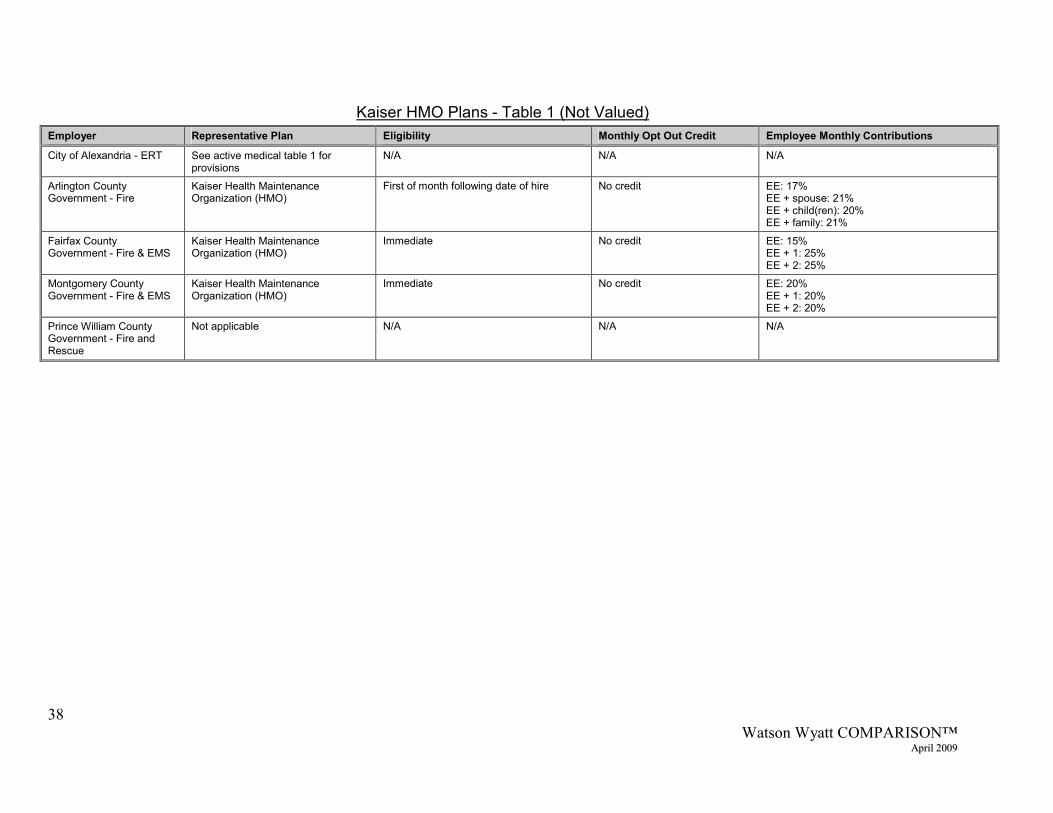
Kaiser HMO Plans - Table 1 (Not Valued) Employer Representative Plan Eligibility Monthly Opt Out Credit Employee Monthly Contributions
City of Alexandria - ERT See active medical table 1 for provisions
N/A N/A N/A
Arlington County Government - Fire
Kaiser Health Maintenance Organization (HMO)
First of month following date of hire No credit EE: 17% EE + spouse: 21% EE + child(ren): 20% EE + family: 21%
Fairfax County Government - Fire & EMS
Kaiser Health Maintenance Organization (HMO)
Immediate No credit EE: 15% EE + 1: 25% EE + 2: 25%
Montgomery County Government - Fire & EMS
Kaiser Health Maintenance Organization (HMO)
Immediate No credit EE: 20% EE + 1: 20% EE + 2: 20%
Prince William County Government - Fire and Rescue
Not applicable N/A N/A N/A
39 Watson Wyatt COMPARISON™
AApprriill 22000099
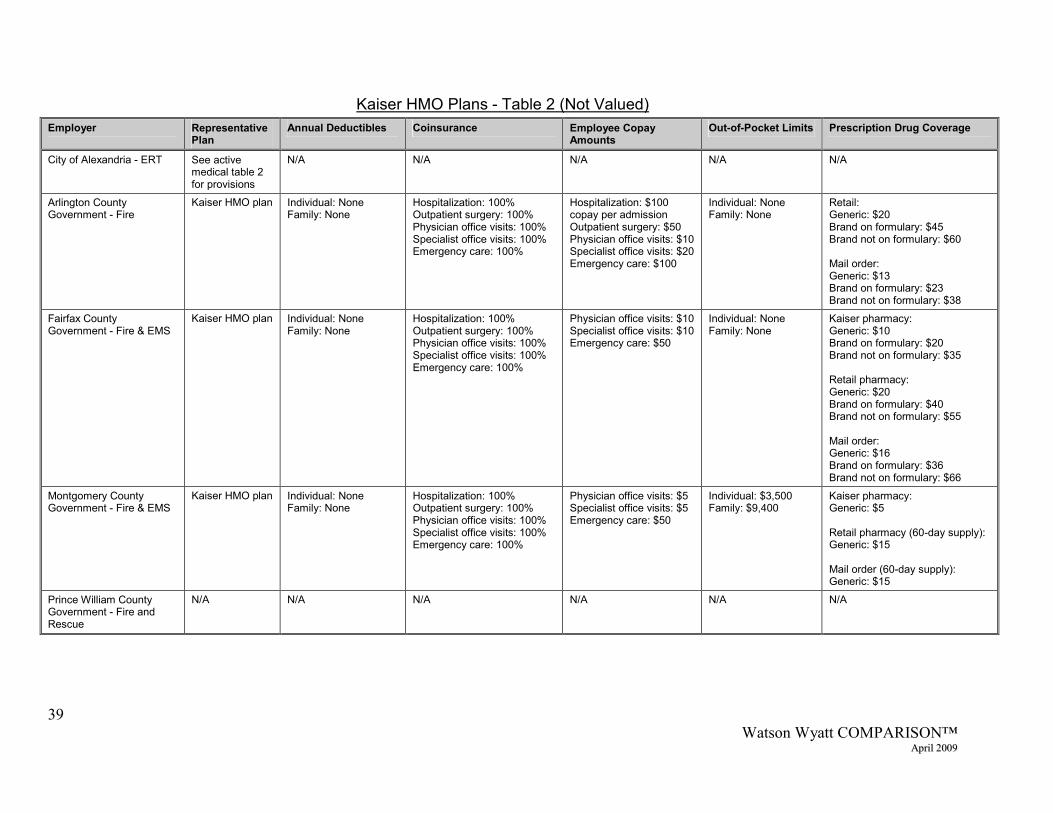
Kaiser HMO Plans - Table 2 (Not Valued) Employer Representative
Plan Annual Deductibles Coinsurance Employee Copay
Amounts Out-of-Pocket Limits Prescription Drug Coverage
City of Alexandria - ERT See active medical table 2 for provisions
N/A N/A N/A N/A N/A
Arlington County Government - Fire
Kaiser HMO plan Individual: None Family: None
Hospitalization: 100% Outpatient surgery: 100% Physician office visits: 100% Specialist office visits: 100% Emergency care: 100%
Hospitalization: $100 copay per admission Outpatient surgery: $50 Physician office visits: $10 Specialist office visits: $20 Emergency care: $100
Individual: None Family: None
Retail: Generic: $20 Brand on formulary: $45 Brand not on formulary: $60 Mail order: Generic: $13 Brand on formulary: $23 Brand not on formulary: $38
Fairfax County Government - Fire & EMS
Kaiser HMO plan Individual: None Family: None
Hospitalization: 100% Outpatient surgery: 100% Physician office visits: 100% Specialist office visits: 100% Emergency care: 100%
Physician office visits: $10 Specialist office visits: $10 Emergency care: $50
Individual: None Family: None
Kaiser pharmacy: Generic: $10 Brand on formulary: $20 Brand not on formulary: $35 Retail pharmacy: Generic: $20 Brand on formulary: $40 Brand not on formulary: $55 Mail order: Generic: $16 Brand on formulary: $36 Brand not on formulary: $66
Montgomery County Government - Fire & EMS
Kaiser HMO plan Individual: None Family: None
Hospitalization: 100% Outpatient surgery: 100% Physician office visits: 100% Specialist office visits: 100% Emergency care: 100%
Physician office visits: $5 Specialist office visits: $5 Emergency care: $50
Individual: $3,500 Family: $9,400
Kaiser pharmacy: Generic: $5 Retail pharmacy (60-day supply): Generic: $15 Mail order (60-day supply): Generic: $15
Prince William County Government - Fire and Rescue
N/A N/A N/A N/A N/A N/A

40 Watson Wyatt COMPARISON™
AApprriill 22000099
Dental Employer Eligibility Annual Deductibles Dental Coverage Annual Dental
Maximum Orthodontic Coverage
Employee Monthly Contribution
City of Alexandria - ERT First of month following date of hire
In-network: Individual: None Family: None Out-of-network (not valued): Individual: $50 Family: $150
In-network: Diagnostic: 100% Minor restorative: 60% to 80% (an average of 70% valued) Endodontic: 60% Other major restorative: 60% Out-of-network (not valued): Diagnostic: 100% Minor restorative: 75% Endodontic: 50% Other major restorative: 50% Note: There is a $10 copay per office visit.
In-network: None Out-of-network (not valued): $1,000
In-network: 40% with no lifetime maximum Out-of-network (not valued): No coverage
EE: 100% EE + 1: 100% EE + 2: 100% Opt out: No credit
Arlington County Government - Fire
First of month following date of hire
In and out-of-network: Individual: $55 Family: $110 Deductible applies to minor restorative, endodontic and major restorative services.
In and out-of-network: Diagnostic: 100% Minor restorative: 80% Endodontic: 80% Other major restorative: 50%
In and out-of-network: $1,290
In and out-of-network: 50% with a lifetime maximum of $1,250
EE: 21% EE + spouse: 24% EE + child(ren): 19% EE + family: 21% Opt out: No credit
Fairfax County Government - Fire & EMS
First of month following date of hire
In and out-of-network: Individual: $50 Family: Each family member must meet the individual deductible up to a maximum of 3 Deductible applies to all services except diagnostic.
Dental coverage is a three tier PPO: In-network: Diagnostic: 100% Minor restorative: 90% Endodontic: 60% Other major restorative: 60% In-network premier network (not valued): Diagnostic: 100% Minor restorative: 80% Endodontic: 50% Other major restorative: 50% Out-of-network (not valued): Diagnostic: 80% Minor restorative: 80% Endodontic: 50% Other major restorative: 50%
In and out-of-network: $2,000
In-network: 50% with a lifetime maximum of $2,000 Out-of-network (not valued): 35% with a lifetime maximum of $2,000
EE: 50% EE + 1: 50% EE + 2: 50% Opt out: No credit

41 Watson Wyatt COMPARISON™
AApprriill 22000099
Employer Eligibility Annual Deductibles Dental Coverage Annual Dental Maximum
Orthodontic Coverage
Employee Monthly Contribution
City of Alexandria - ERT First of month following date of hire
In-network: Individual: None Family: None Out-of-network (not valued): Individual: $50 Family: $150
In-network: Diagnostic: 100% Minor restorative: 60% to 80% (an average of 70% valued) Endodontic: 60% Other major restorative: 60% Out-of-network (not valued): Diagnostic: 100% Minor restorative: 75% Endodontic: 50% Other major restorative: 50% Note: There is a $10 copay per office visit.
In-network: None Out-of-network (not valued): $1,000
In-network: 40% with no lifetime maximum Out-of-network (not valued): No coverage
EE: 100% EE + 1: 100% EE + 2: 100% Opt out: No credit
Montgomery County Government - Fire & EMS
Immediate Individual: $50 Family: $150 Deductible applies to all services except diagnostic.
Diagnostic: 100% Minor restorative: 80% Endodontic: 80% Other major restorative: 60%
$2,000 60% with a lifetime maximum of $1,000
EE: 20% EE + 1: 20% EE + 2: 20% Opt out: No credit
Prince William County Government - Fire and Rescue
First of month following date of hire
Core and enhanced plan: Individual: $50 Family: $150 Deductible applies to minor restorative, endodontic and major restorative services.
Core plan: Diagnostic: 80% Minor restorative: 70% Endodontic: 70% Other major restorative: 50% Enhanced: Diagnostic: 100% Minor restorative: 70% Endodontic: 70% Other major restorative: 50% Note: 50% of employees are in the Core plan and 50% are in the Enhanced plan. For COMPARISON purposes, both plans are valued with equal weight.
Core plan: $1,000 Enhanced plan: $2,000
Core plan: 50% with a lifetime maximum of $1,000 Enhanced plan: 50% with a lifetime maximum of $2,000
Core plan: EE: 49% EE + 1: 49% EE + 2: 50% Enhanced plan: EE: 61% EE + 1: 60% EE + 2: 61% Opt out: No credit

4422
Watson Wyatt COMPARISON™ April 2009
CCiittyy ooff AAlleexxaannddrriiaa -- EERRTT EEmmppllooyyeeeess
22000088 CCOOMMPPAARRIISSOONN SSttuuddyy Paid Time Off Plans
Summary of Results The paid time off plans group (PTO) consists of the vacation plan, the holiday plan and the sick
leave plan for each employer. City of Alexandria ranks as follows:
Benefit
City of Alexandria's
Value
Comparison Group Average Benefit Value
City of Alexandria’s Ranking in
Comparison Group
Benefit Value as a Percentage of City
of Alexandria's Total Program
Paid Time Off 100 106 5th 37 Vacation 100 105 5th 22 Holiday 100 108 5th 12 Sick 100 106 5th 3
Vacation and Holiday Vacation and holiday plan values are calculated by multiplying each eligible employee’s daily
pay rate by the number of days that the employee receives under the plan. It is assumed that
employees take all leave or receive cash for the current year’s accrual.
Sick Leave
Values for all disability benefit programs (sick leave, STD and LTD) are calculated together and
then allocated to the individual benefits based on the following definitions:
Type of Disability Duration Sick Leave First 10 working days STD From day 11 through the sixth month LTD After the sixth month
This breakdown is used in order to eliminate differences in plan values that result from
terminology. The value of sick leave plans is then included in the Paid Time Off (PTO) group to
facilitate comparison with the plans of employers that have paid time off programs that include
additional vacation days in lieu of sick leave. Sick leave carryover is not valued, since the

4433
Watson Wyatt COMPARISON™ April 2009
benefit cost is attributable to the current year. STD and LTD values are included in the Security
group (see p. 50).

4444
Watson Wyatt COMPARISON™ April 2009
City of Alexandria - ERT Employees 2008 COMPARISON Study Paid Time Off Benefit Results
Includes Vacation, Holiday and Sick Leave Plans
____________________________________________________________________________________________________________________________________________________________
Values Employer Employee Total
Arlington County - Fire 107 0 107 Montgomery County - Fire & EMS 107 0 107 Prince William County - Fire & Rescue 107 0 107 Fairfax County - Fire & EMS 104 0 104 City of Alexandria - ERT 100 0 100 Average (Excluding City of Alexandria) 106 0 106
0 20 40 60 80 100 120
Arlington County - Fire
Montgomery County - Fire & EMS
Prince William County - Fire & Rescue
Fairfax County - Fire & EMS
City of Alexandria - ERT
Average (Excluding City of Alexandria)

4455
Watson Wyatt COMPARISON™ April 2009
City of Alexandria - ERT Employees 2008 COMPARISON Study Vacation Plan Results
____________________________________________________________________________________________________________________________________________________________
Values Employer Employee Total
Arlington County - Fire 106 0 106 Prince William County - Fire & Rescue 106 0 106 Montgomery County - Fire & EMS 105 0 105 Fairfax County - Fire & EMS 104 0 104 City of Alexandria - ERT 100 0 100 Average (Excluding City of Alexandria) 105 0 105
0 20 40 60 80 100 120
Arlington County - Fire
Prince William County - Fire & Rescue
Montgomery County - Fire & EMS
Fairfax County - Fire & EMS
City of Alexandria - ERT
Average (Excluding City of Alexandria)
4466
Watson Wyatt COMPARISON™ April 2009
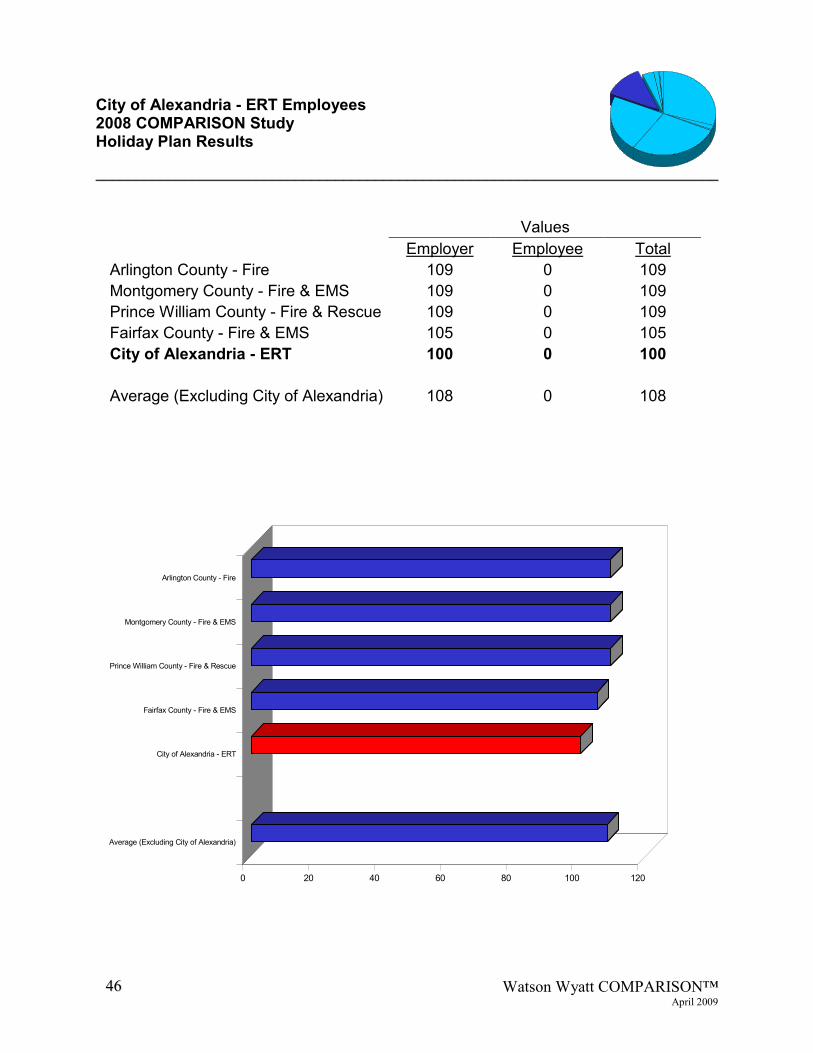
City of Alexandria - ERT Employees 2008 COMPARISON Study Holiday Plan Results
____________________________________________________________________________________________________________________________________________________________
Values Employer Employee Total
Arlington County - Fire 109 0 109 Montgomery County - Fire & EMS 109 0 109 Prince William County - Fire & Rescue 109 0 109 Fairfax County - Fire & EMS 105 0 105 City of Alexandria - ERT 100 0 100 Average (Excluding City of Alexandria) 108 0 108
0 20 40 60 80 100 120
Arlington County - Fire
Montgomery County - Fire & EMS
Prince William County - Fire & Rescue
Fairfax County - Fire & EMS
City of Alexandria - ERT
Average (Excluding City of Alexandria)
4477
Watson Wyatt COMPARISON™ April 2009
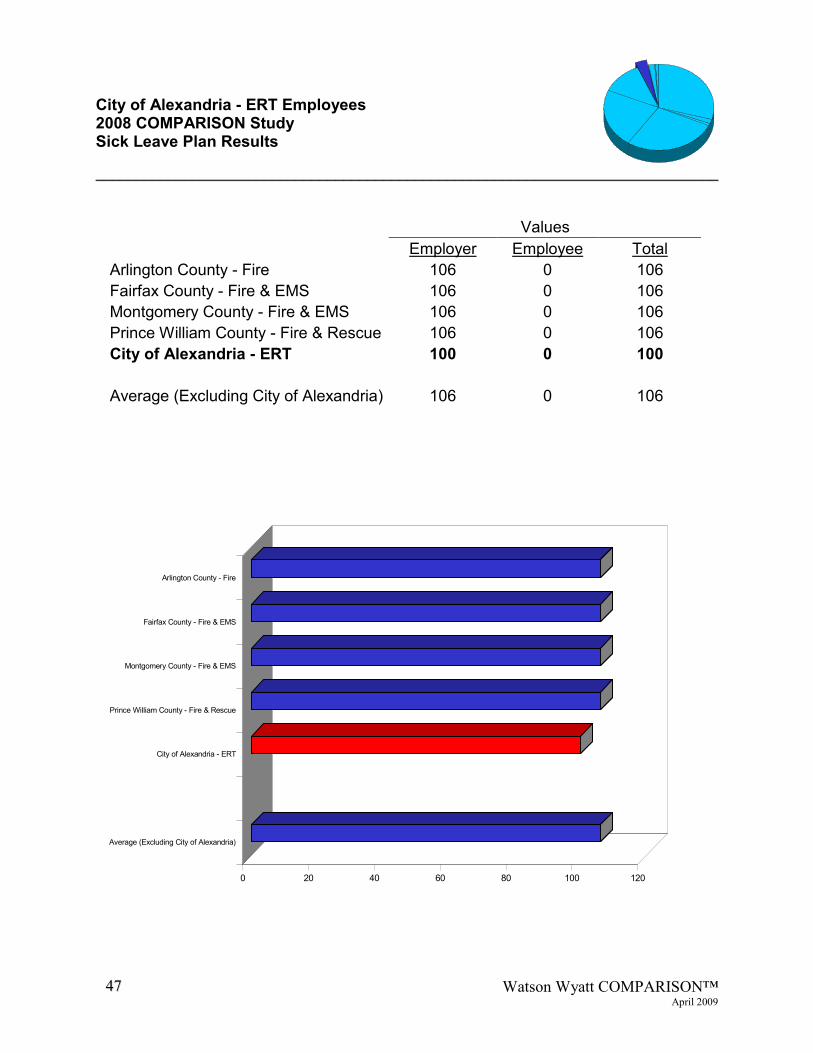
City of Alexandria - ERT Employees 2008 COMPARISON Study Sick Leave Plan Results
____________________________________________________________________________________________________________________________________________________________
Values Employer Employee Total
Arlington County - Fire 106 0 106 Fairfax County - Fire & EMS 106 0 106 Montgomery County - Fire & EMS 106 0 106 Prince William County - Fire & Rescue 106 0 106 City of Alexandria - ERT 100 0 100 Average (Excluding City of Alexandria) 106 0 106
0 20 40 60 80 100 120
Arlington County - Fire
Fairfax County - Fire & EMS
Montgomery County - Fire & EMS
Prince William County - Fire & Rescue
City of Alexandria - ERT
Average (Excluding City of Alexandria)

48 Watson Wyatt COMPARISON™
AApprriill 22000099
Paid Time Off Plans – Plan Provisions Summary
Vacation and Holiday Employer Vacation Eligibility Vacation Schedule for One or More Years of Service Fixed Holidays Floating Holidays or Personal
Days
City of Alexandria - ERT Immediate 1 year: 13 days 2 years: 14 days 3 years: 15 days 4 years: 16 days 5 years: 17 days 6 years: 18 days 7 years: 19 days 8 years: 20 days 9 years: 21 days 10 years: 22 days 11 years: 23 days 12 or more years: 24 days
11 days None
Arlington County Government - Fire
Immediate 1 to 2 years: 13 days 3 to 5 years: 16.25 days 6 to 8 years: 19.50 days 9 to 11 years: 22.75 days 12 or more years: 26 days
12 days None
Fairfax County Government - Fire & EMS
Immediate 1 to 2 years: 13 days 3 to 14 years: 19.5 days 15 or more years: 26 days
11.5 days None
Montgomery County Government - Fire & EMS
Immediate 1 to 3 years: 15 days 4 to 15 years: 20 days 16 or more years: 26 days
9 days 3 floating holidays/personal days
Prince William County Government - Fire and Rescue
Immediate 1 to 2 years: 13 days 3 to 5 years: 16.25 days 6 to 8 years: 19.50 days 9 to 11 years: 22.75 days 12 or more years: 26 days
12 days None

49 Watson Wyatt COMPARISON™
AApprriill 22000099
Sick Leave Employer Eligibility Number of Sick Leave Days per Year with One or More Years of Service
City of Alexandria - ERT Immediate 8 days
Arlington County Government - Fire Immediate 13 days
Fairfax County Government - Fire & EMS
Immediate 13 days
Montgomery County Government - Fire & EMS
Immediate 15 days
Prince William County Government - Fire and Rescue
Immediate 13 days Employees may also contribute leftover sick days to a sick leave bank to be used for short term disability. There is a 45 day waiting period before days from the sick leave bank can be used. Note: Not valued for COMPARISON purposes.
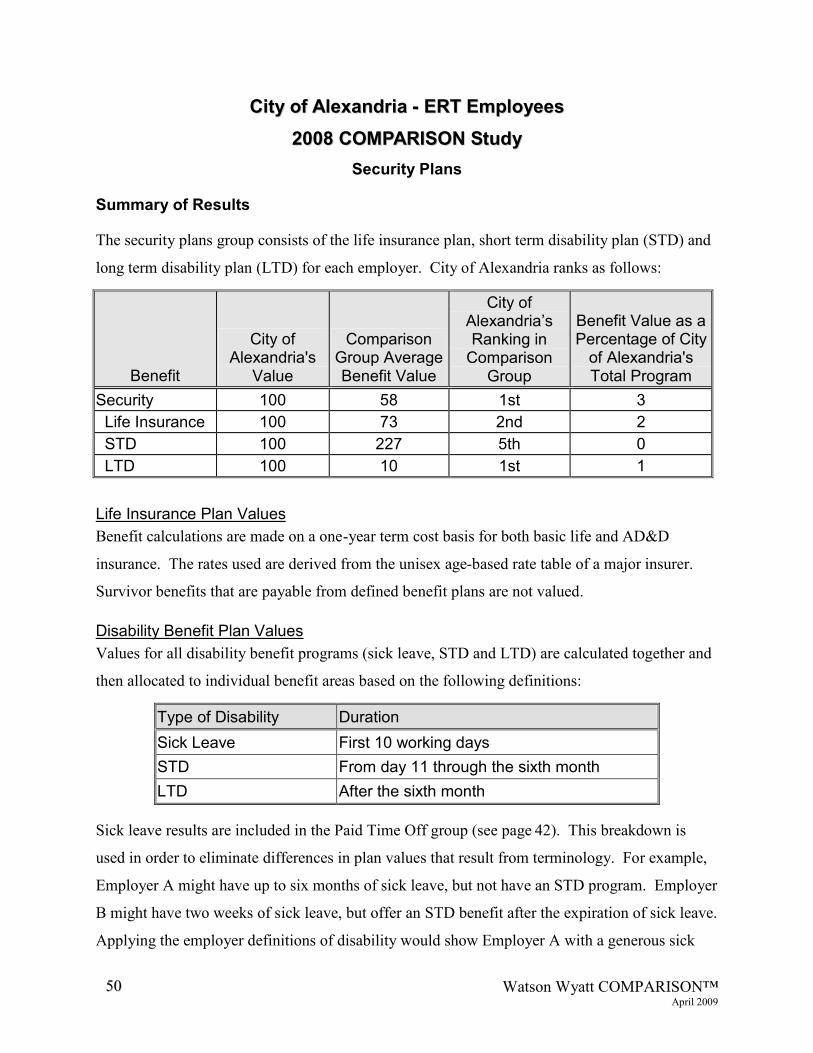
5500
Watson Wyatt COMPARISON™ April 2009
CCiittyy ooff AAlleexxaannddrriiaa -- EERRTT EEmmppllooyyeeeess
22000088 CCOOMMPPAARRIISSOONN SSttuuddyy Security Plans
Summary of Results
The security plans group consists of the life insurance plan, short term disability plan (STD) and
long term disability plan (LTD) for each employer. City of Alexandria ranks as follows:
Benefit
City of Alexandria's
Value
Comparison Group Average Benefit Value
City of Alexandria’s Ranking in
Comparison Group
Benefit Value as a Percentage of City
of Alexandria's Total Program
Security 100 58 1st 3 Life Insurance 100 73 2nd 2 STD 100 227 5th 0 LTD 100 10 1st 1
Life Insurance Plan Values Benefit calculations are made on a one-year term cost basis for both basic life and AD&D
insurance. The rates used are derived from the unisex age-based rate table of a major insurer.
Survivor benefits that are payable from defined benefit plans are not valued.
Disability Benefit Plan Values Values for all disability benefit programs (sick leave, STD and LTD) are calculated together and
then allocated to individual benefit areas based on the following definitions:
Type of Disability Duration Sick Leave First 10 working days STD From day 11 through the sixth month LTD After the sixth month
Sick leave results are included in the Paid Time Off group (see page 42). This breakdown is
used in order to eliminate differences in plan values that result from terminology. For example,
Employer A might have up to six months of sick leave, but not have an STD program. Employer
B might have two weeks of sick leave, but offer an STD benefit after the expiration of sick leave.
Applying the employer definitions of disability would show Employer A with a generous sick
5511
Watson Wyatt COMPARISON™ April 2009
leave plan, but the STD value would be zero. Employer B would have a substantially lower sick
leave value, but would have an STD value. Applying the functional definitions listed above
eliminates this variance in values that is solely due to the terminology a particular employer uses
to describe benefits.
The one-year term cost for disability values is calculated based on a Society of Actuaries table
that provides rates based on the age and sex of each employee. The benefit value is reduced by
the value of the individual or family Social Security benefit starting at 26 weeks. Plans offset by
individual Social Security typically rank higher than plans offset by family Social Security since
the employer must pay a greater share of the allowed benefit.
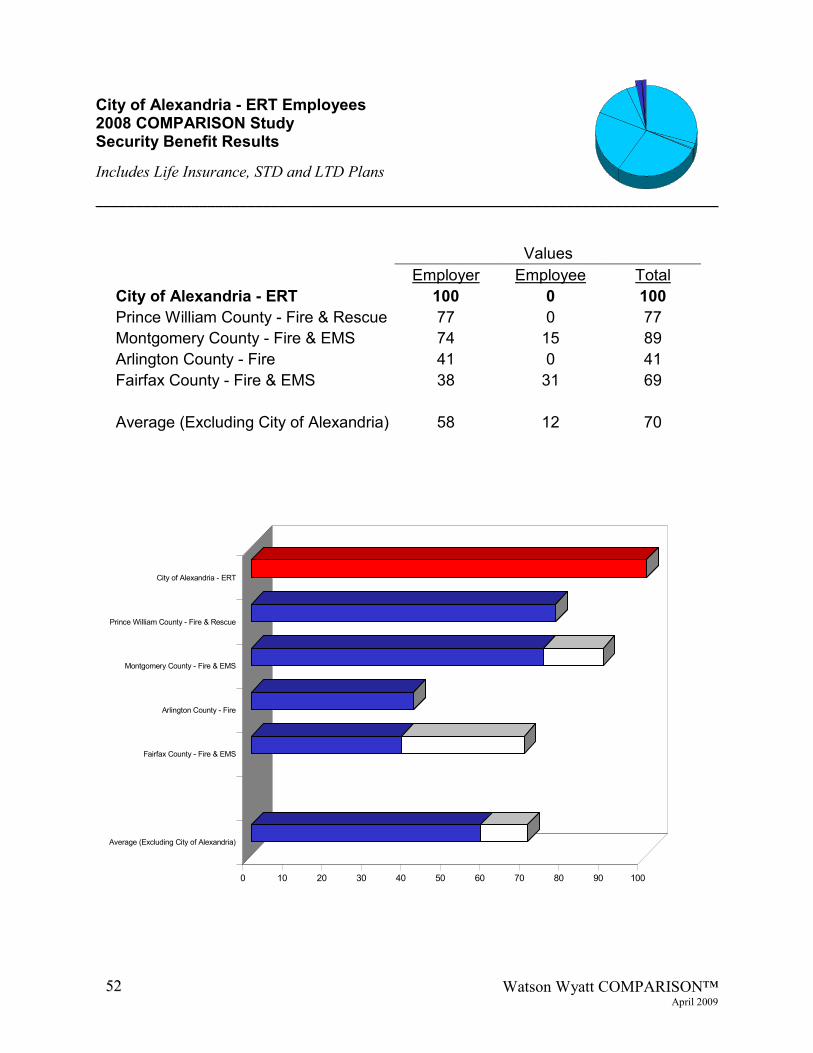
5522
Watson Wyatt COMPARISON™ April 2009
City of Alexandria - ERT Employees 2008 COMPARISON Study Security Benefit Results
Includes Life Insurance, STD and LTD Plans
____________________________________________________________________________________________________________________________________________________________
Values Employer Employee Total
City of Alexandria - ERT 100 0 100 Prince William County - Fire & Rescue 77 0 77 Montgomery County - Fire & EMS 74 15 89 Arlington County - Fire 41 0 41 Fairfax County - Fire & EMS 38 31 69 Average (Excluding City of Alexandria) 58 12 70
0 10 20 30 40 50 60 70 80 90 100
City of Alexandria - ERT
Prince William County - Fire & Rescue
Montgomery County - Fire & EMS
Arlington County - Fire
Fairfax County - Fire & EMS
Average (Excluding City of Alexandria)
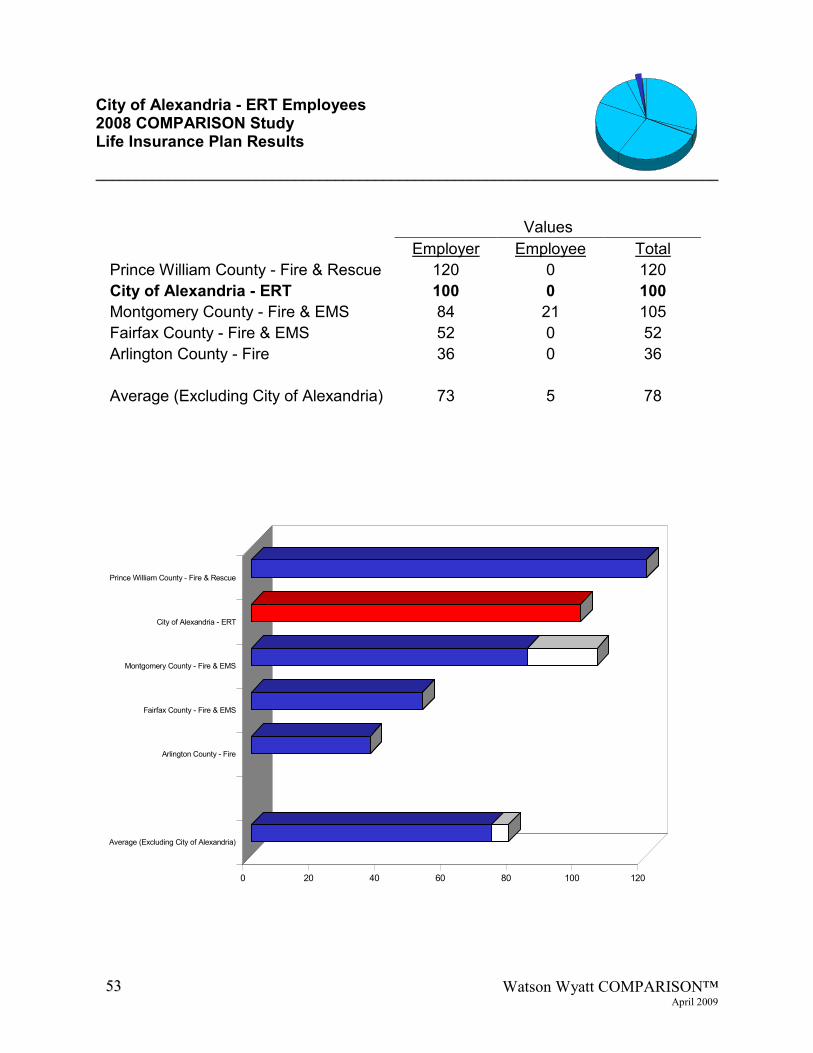
5533
Watson Wyatt COMPARISON™ April 2009
City of Alexandria - ERT Employees 2008 COMPARISON Study Life Insurance Plan Results
____________________________________________________________________________________________________________________________________________________________
Values Employer Employee Total
Prince William County - Fire & Rescue 120 0 120 City of Alexandria - ERT 100 0 100 Montgomery County - Fire & EMS 84 21 105 Fairfax County - Fire & EMS 52 0 52 Arlington County - Fire 36 0 36 Average (Excluding City of Alexandria) 73 5 78
0 20 40 60 80 100 120
Prince William County - Fire & Rescue
City of Alexandria - ERT
Montgomery County - Fire & EMS
Fairfax County - Fire & EMS
Arlington County - Fire
Average (Excluding City of Alexandria)

5544
Watson Wyatt COMPARISON™ April 2009
City of Alexandria - ERT Employees 2008 COMPARISON Study Short Term Disability Plan Results
____________________________________________________________________________________________________________________________________________________________
Values Employer Employee Total
Arlington County - Fire 329 0 329 Montgomery County - Fire & EMS 271 6 277 Fairfax County - Fire & EMS 154 321 475 Prince William County - Fire & Rescue 154 0 154 City of Alexandria - ERT 100 0 100 Average (Excluding City of Alexandria) 227 82 309
0 50 100 150 200 250 300 350 400 450 500
Arlington County - Fire
Montgomery County - Fire & EMS
Fairfax County - Fire & EMS
Prince William County - Fire & Rescue
City of Alexandria - ERT
Average (Excluding City of Alexandria)
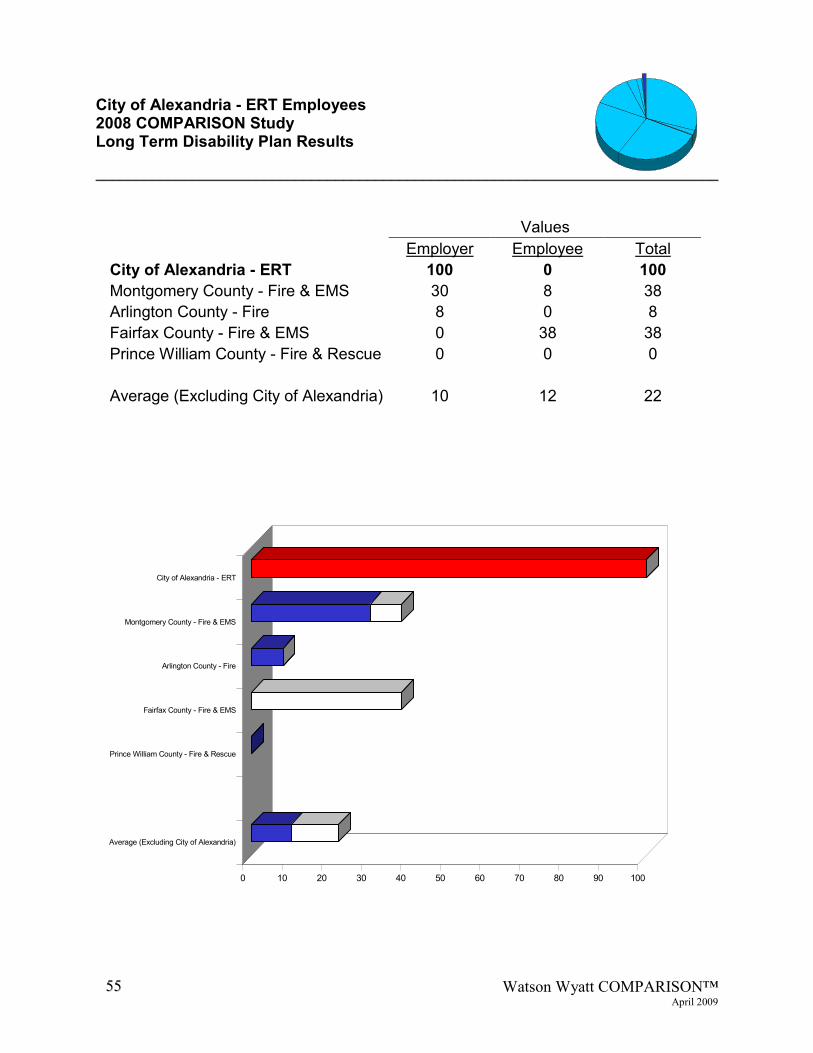
5555
Watson Wyatt COMPARISON™ April 2009
City of Alexandria - ERT Employees 2008 COMPARISON Study Long Term Disability Plan Results
____________________________________________________________________________________________________________________________________________________________
Values Employer Employee Total
City of Alexandria - ERT 100 0 100 Montgomery County - Fire & EMS 30 8 38 Arlington County - Fire 8 0 8 Fairfax County - Fire & EMS 0 38 38 Prince William County - Fire & Rescue 0 0 0 Average (Excluding City of Alexandria) 10 12 22
0 10 20 30 40 50 60 70 80 90 100
City of Alexandria - ERT
Montgomery County - Fire & EMS
Arlington County - Fire
Fairfax County - Fire & EMS
Prince William County - Fire & Rescue
Average (Excluding City of Alexandria)
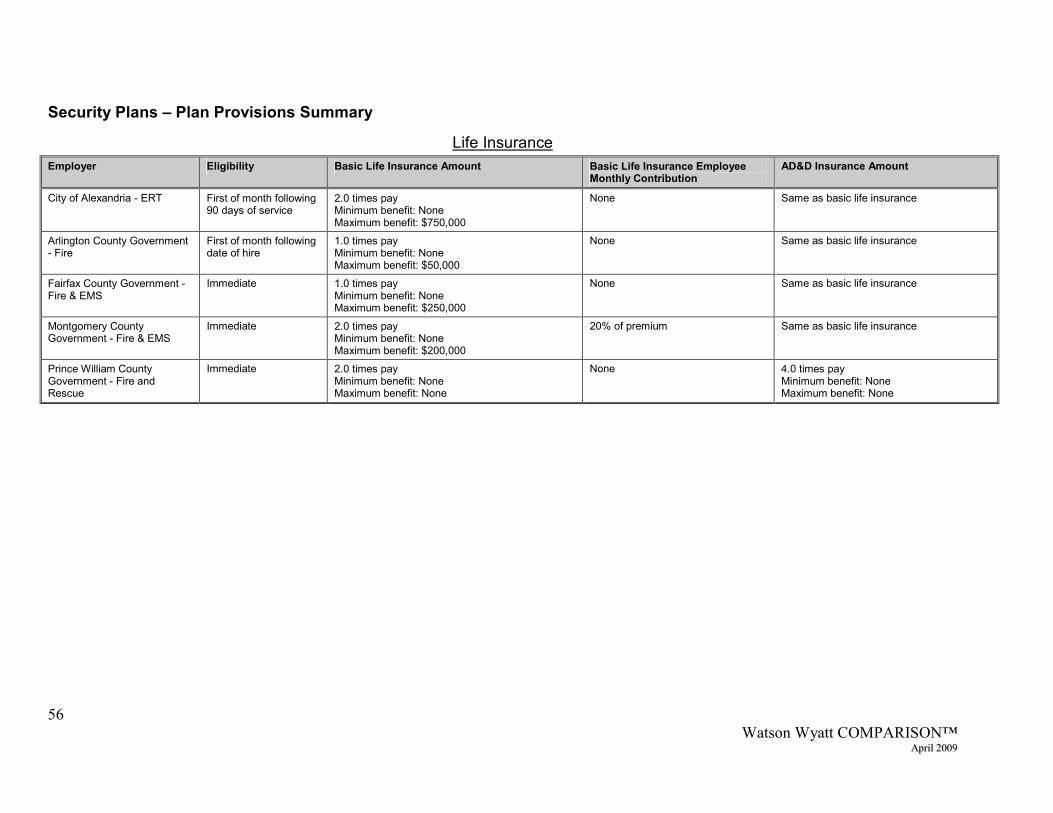
56 Watson Wyatt COMPARISON™
AApprriill 22000099
Security Plans – Plan Provisions Summary
Life Insurance Employer Eligibility Basic Life Insurance Amount Basic Life Insurance Employee
Monthly Contribution AD&D Insurance Amount
City of Alexandria - ERT First of month following 90 days of service
2.0 times pay Minimum benefit: None Maximum benefit: $750,000
None Same as basic life insurance
Arlington County Government - Fire
First of month following date of hire
1.0 times pay Minimum benefit: None Maximum benefit: $50,000
None Same as basic life insurance
Fairfax County Government - Fire & EMS
Immediate 1.0 times pay Minimum benefit: None Maximum benefit: $250,000
None Same as basic life insurance
Montgomery County Government - Fire & EMS
Immediate 2.0 times pay Minimum benefit: None Maximum benefit: $200,000
20% of premium Same as basic life insurance
Prince William County Government - Fire and Rescue
Immediate 2.0 times pay Minimum benefit: None Maximum benefit: None
None 4.0 times pay Minimum benefit: None Maximum benefit: None

57 Watson Wyatt COMPARISON™
AApprriill 22000099
Short Term Disability Employer Eligibility Elimination Period Weekly STD Benefit Benefit Duration Employee Monthly
Contribution
City of Alexandria - ERT No plan N/A N/A N/A N/A
Arlington County Government - Fire
1 year of service Accident: 90 days Sickness: 90 days Hospitalization: 90 days
Benefit: 66 2/3% Minimum benefit: None Maximum benefit: $841 Social Security offset: 100% total (individual and family)
52 weeks None
Fairfax County Government - Fire & EMS
No plan N/A N/A N/A N/A
Montgomery County Government - Fire & EMS
No plan N/A N/A N/A N/A
Prince William County Government - Fire and Rescue
See sick leave provisions
N/A N/A N/A N/A

58 Watson Wyatt COMPARISON™
AApprriill 22000099
Long Term Disability Employer Eligibility Elimination Period Monthly LTD Benefit Employee Monthly
Contribution
City of Alexandria - ERT 4 months of service 4 months Benefit: 60% of pay Minimum benefit: $100 Maximum benefit: $5,000 Social Security offset: 100% individual Definition of pay does not include bonus
None
Arlington County Government - Fire
No plan N/A N/A N/A
Fairfax County Government - Fire & EMS
Immediate 60 days Benefit: 60% of pay Minimum benefit: $100 or 10% of benefit prior to reductions Maximum benefit: $3,500 Social Security offset: 100% total (individual and family) Definition of pay does not include bonus
Employee-pay-all
Montgomery County Government - Fire & EMS
6 months of service 5 months Benefit: 60% of pay Minimum benefit: $100 Maximum benefit: $2,500 Social Security offset: 100% total (individual and family) Definition of pay does not include bonus
20% of premium
Prince William County Government - Fire and Rescue
No plan N/A N/A N/A
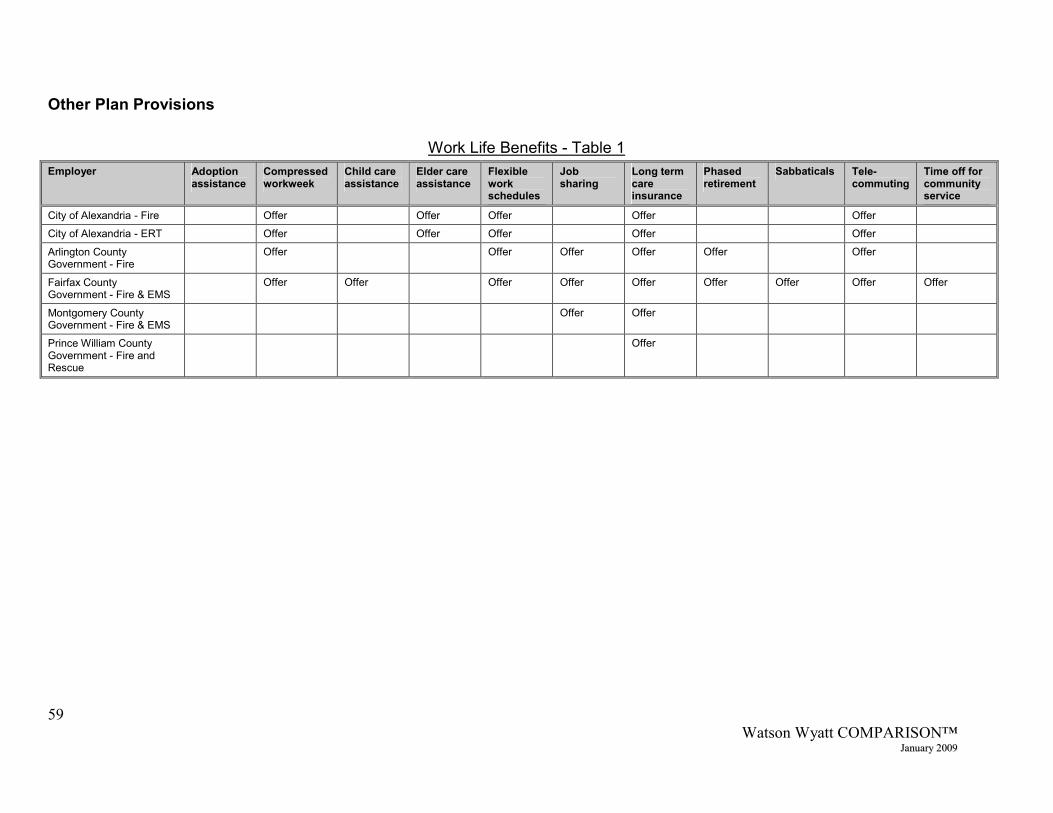
59 Watson Wyatt COMPARISON™
JJaannuuaarryy 22000099
Other Plan Provisions
Work Life Benefits - Table 1 Employer Adoption
assistance Compressed workweek
Child care assistance
Elder care assistance
Flexible work schedules
Job sharing
Long term care insurance
Phased retirement
Sabbaticals Tele-commuting
Time off for community service
City of Alexandria - Fire Offer Offer Offer Offer Offer
City of Alexandria - ERT Offer Offer Offer Offer Offer
Arlington County Government - Fire
Offer Offer Offer Offer Offer Offer
Fairfax County Government - Fire & EMS
Offer Offer Offer Offer Offer Offer Offer Offer Offer
Montgomery County Government - Fire & EMS
Offer Offer
Prince William County Government - Fire and Rescue
Offer
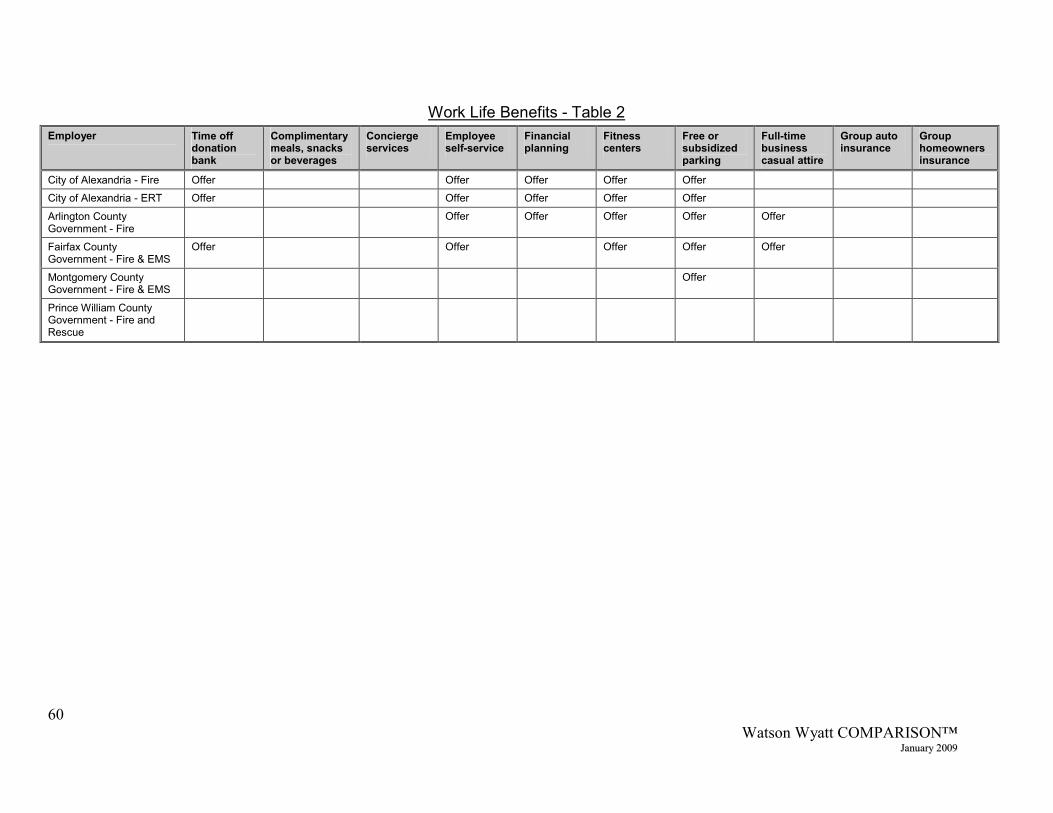
60 Watson Wyatt COMPARISON™
JJaannuuaarryy 22000099
Work Life Benefits - Table 2 Employer Time off
donation bank
Complimentary meals, snacks or beverages
Concierge services
Employee self-service
Financial planning
Fitness centers
Free or subsidized parking
Full-time business casual attire
Group auto insurance
Group homeowners insurance
City of Alexandria - Fire Offer Offer Offer Offer Offer
City of Alexandria - ERT Offer Offer Offer Offer Offer
Arlington County Government - Fire
Offer Offer Offer Offer Offer
Fairfax County Government - Fire & EMS
Offer Offer Offer Offer Offer
Montgomery County Government - Fire & EMS
Offer
Prince William County Government - Fire and Rescue

61 Watson Wyatt COMPARISON™
JJaannuuaarryy 22000099
Work Life Benefits - Table 3 Employer Lactation
Rooms Disease Management
Lap top computers for personal use
Personal digital assistant
Pre tax transportation account
Prepaid legal Tuition assistance
Other
City of Alexandria - Fire Offer Offer Offer
City of Alexandria - ERT Offer Offer Offer
Arlington County Government - Fire
Offer Offer Offer Offer
Fairfax County Government - Fire & EMS
Offer Offer Employee assistance program Credit union
Montgomery County Government - Fire & EMS
Offer Offer
Prince William County Government - Fire and Rescue
Credit union Employee assistance program