europeansmallbusiness financeoutlook · in the first half-year of 2017, pe investments amounted to...
TRANSCRIPT

EIF Research & Market Analysis
Working Paper 2017/46
European Small BusinessFinance Outlook
December 2017
Helmut Kraemer-Eis �Antonia Botsari �
Salome Gvetadze �Frank Lang �
Wouter Torfs �

i

ii
Helmut Kraemer-Eis heads EIF’s Research & Market Analysis division.
Contact: [email protected] Tel.: +352 248581 394
Antonia Botsari is Research Officer in EIF’s Research & Market Analysis division.
Contact: [email protected] Tel.: +352 248581 546
Salome Gvetadze is Research Officer in EIF’s Research & Market Analysis division.
Contact: [email protected] Tel.: +352 248581 360
Frank Lang is Senior Manager in EIF’s Research & Market Analysis division.
Contact: [email protected] Tel.: +352 248581 278
Wouter Torfs is Research Officer in EIF’s Research & Market Analysis division.
Contact: [email protected] Tel.: +352 248581 752
Editor: Helmut Kraemer-Eis, Head of EIF’s Research & Market Analysis, Chief Economist Contact: European Investment Fund 37B, avenue J.F. Kennedy, L-2968 Luxembourg Tel.: +352 248581 394 http://www.eif.org/news_centre/research/index.htm Luxembourg, December 2017
Scan above to obtain a PDF version of this working paper

iii
Disclaimer: This Working Paper should not be referred to as representing the views of the European Investment Fund (EIF) or of the European Investment Bank Group (EIB Group). Any views expressed herein, including interpretation(s) of regulations, reflect the current views of the author(s), which do not necessarily correspond to the views of EIF or of the EIB Group. Views expressed herein may differ from views set out in other documents, including similar research papers, published by EIF or by the EIB Group. Contents of this Working Paper, including views expressed, are current at the date of publication set out above, and may change without notice. No representation or warranty, express or implied, is or will be made and no liability or responsibility is or will be accepted by EIF or by the EIB Group in respect of the accuracy or completeness of the information contained herein and any such liability is expressly disclaimed. Nothing in this Working Paper constitutes investment, legal, or tax advice, nor shall be relied upon as such advice. Specific professional advice should always be sought separately before taking any action based on this Working Paper. Reproduction, publication and reprint are subject to prior written authorisation of the authors.

iv
Executive summary1
This European Small Business Finance Outlook (ESBFO) provides an overview of the main markets relevant to EIF (equity2, guarantees, securitisation, microfinance). It is an update of the June 2017 ESBFO edition.
We start by discussing the general market environment, then look at the main aspects of equity finance and guarantees/SME Securitisation (SMESec)3. Finally, before we conclude, we briefly highlight important aspects of microfinance in Europe and – for the first time and due to the rising importance of the segment – we complement our analysis by a chapter on Fintech.
Market Environment:
The global economic outlook improved significantly over the past six months. The materialised growth rate for 2016 proved to be higher than expected; in particular the investment rate outperformed the forecasts. Growth predictions for 2017 and 2018 have been updated accordingly.
The positive economic outlook is reflected in the SME business climate. SMEs have become significantly more optimistic about the future, in particular with respect to costumer demand.
While Euro Area borrowing costs continued to hit record lows, the deleveraging process that set in following the crisis has not yet reversed, as the amount of outstanding loans to NFCs has stagnated for over four years now.
New volume in small business lending in the Euro Area, however, continued to pick up pace, with the share of small loans in total loans staying roughly constant. A country-level analysis shows vast differences in countries’ share of small loans in total lending.
The interest rate on large long term loans has increased in recent months, for the first time in years. This was not the case for the interest rate charged on small long term loans. This contrasting evolution could be an indication that SME investment is still lagging.
The interest rates charged on small loans differ vastly between countries, as does the interest rate spread between small and large loans. Over the past semester, however, the size spread has declined in most countries.
The percentage of SMEs that rank access to finance as a highly important issue has declined over the past years, but remains high, with 1 in 4 SMEs reporting access to finance to be a significant problem. Also here, significant country-level heterogeneity exists.
The most recent waves of the ECB’s BLS and SAFE surveys brought to light some mixed evidence with regards to SMEs’ financing situation. While the SAFE survey seems to
1 This paper benefited from comments and inputs by many EIF colleagues, for which we are very grateful; we would like to express particular thanks to Alicia Boudeau, Remi Charrier, Graham Cope, Andrea Crisanti, Cindy Daniel, Per-Erik Eriksson, Oscar Farres, Giovanni Inglisa, Carsten Just, Marco Natoli, Christine Panier, George Passaris, Elitsa Pavlova, Simone Signore, Arnaud Vanbellingen and Johannes Virkkunen. We would also like to thank colleagues from AECM, Coller Capital, ECB, EMN, Euler Hermes, Experior Venture Fund, GEM, the Invest Europe research team, Go4Venture Advisers, the UEAPME study unit, and the University of Trier for their support. All errors are of the authors. 2 We are using the term “equity finance” to combine semantically the areas of Venture Capital and Private Equity. However, if we refer here to equity activities, we mainly consider those of EIF’s investment focus, which includes neither Leveraged Buyouts (LBOs) nor Public Equity. The reader is also referred to the Private Equity glossary in Annex 1. 3 The term SME Securitisation (SMESec) comprises transactions backed by SME loans, leases, etc.
v
suggest that financing conditions improved in most countries over the first semester of 2017 (with the notable exception of Greece), the BLS survey gap indicator showed an increasing financing gap in the majority of countries for the second half of 2017.
Despite significantly increased public support for SMEs, including by the EIB Group, SMEs continue to perceive a lack of public support to be a deterrent for access to finance.
Private Equity:
The severe crash of the European private equity (PE) activity in 2008/2009 was followed by a partial rebound, although the recovery has shown some setbacks and PE investments have not yet reached their pre-crisis levels.
In 2016, investments by PE funds in European portfolio companies declined moderately by 2% to EUR 52.5bn, according to Invest Europe statistics. While buyout and growth capital investments declined, investments in the venture capital (VC) market segment, which is of particular importance for the financing of young innovative companies with high growth potential, increased by 2% to EUR 4.3bn. The VC activity levels are still far below their pre-crisis highs, but some of the remaining gaps have been filled by business angels.
In the first half-year of 2017, PE investments amounted to EUR 29.6bn (+12% compared to the second half-year of 2016), according to preliminary data. This was mainly driven by the strong surge of buyout and VC investments, while growth capital investments declined.
Total amounts raised by PE funds in Europe increased strongly by 38% to EUR 73.8bn in 2016. VC fundraising rose by 17% to EUR 6.4bn. While government agencies have continued to support the market recovery in order to incentivise additional deal flow and attract further private investment, the share of government investors’ contributions to VC funds is lower than during the crisis when it had reached record highs.
In HY1/2017, total PE fundraising increased by 37% compared to HY2/2016 to an amount of EUR 50.4bn, which is even slightly above the pre-crisis levels of 2007 and 2008. This strong development was again largely induced by rising activities in the buyout market segment, but fundraising in the other sectors increased as well considerably.
The exit markets and company valuations have shown remarkable strength over the 2013 to 2015 period. Despite a 15% drop to EUR 38.5bn, divestments were still at relatively high levels in 2016. In the first half-year of 2017, PE divestments amounted to EUR 19.8bn (+5% compared to HY1/2016).
Europe has become more attractive as an investment destination over the past five years, according to a new Invest Europe survey. Pricing/valuations are currently the most important concerns for the PE markets (Preqin, 2017a).
SME Guarantees:
Credit guarantees “remain the most wide-spread instrument in use across countries” to ease SME access to finance (OECD, 2018b).
AECM statistics show that Italy and France exhibit the largest volume and number of outstanding SME guarantees. Related to GDP, Italy, Hungary and Portugal have the largest markets. According to the OECD (2013), guarantees are particularly relevant “in

vi
those countries where a network of local or sectoral guarantee institutions is well established”.
In the first half-year of 2017, AECM reports an increase in new guarantee issuance and outstanding guarantees. The growth in new guarantee activity was particularly strong in Romania, Hungary and Austria.
SME Securitisation:
The visible issued volume of SME deals in HY1/2017 was only EUR 9.2bn, representing 8.4% of the overall securitisation issuance.4 Despite a significant increase compared to the same period one year before, in terms of new issuances the SMESec market is still relatively weak. Moreover, the retention rate was close to 100%.
Overall, the SMESec market in Europe is underdeveloped and strengthening this market can be an effective way to facilitate the flow of funds to the real economy, while not creating too much distortion.
Despite the financial and sovereign crisis, the European securitisation market has performed relatively well, with the SME segment showing low default rates.
The new regulation regime introduces significant changes to the market’s framework, including the important step of a signalling approach via simple, transparent, and standardised (STS)-labelled securitisations - which receive preferential regulatory treatment.
Although some precisions of the new regime still need to be provided, the fog around the future regulation design has lifted – which is good in order to reduce uncertainty. However, implementation will still take time (possibly 1 to 2 years).
It remains to be seen if the new regime is going to be a success, but it has potential to significantly support the revival of the market in Europe. However, such revival depends not only on the regulatory framework, but also on the market conditions, including the overall monetary policy.
Microfinance:
Microenterprises are important contributors to employment. Especially in countries with high unemployment rates, microenterprises act as a driving force fostering job creation. However, their overall business environment remains relatively unfavourable compared to their larger peers.
According to the data from the latest ECB SAFE survey, microenterprises have perceived a slight decrease in the external financing gap indicator. However, the share of enterprises which see access to finance as their most important problem remained higher among microenterprises than among their larger peers.
Microenterprises are often discouraged to apply for a bank loan mainly because of high interest rates, but also because of “too much paperwork”.
Access to finance is crucial not only for existing microenterprises, but also for those who are eager to create a business in order to escape poverty or unemployment and
4 As explained in the text, there is a significant part of this market that is not visible in the statistics (e.g. unrated bilateral transactions).

vii
contribute to job creation. Aside the financial support, unemployed people are often in need of acquiring the necessary skills for success through coaching and mentoring.
Microfinance is an important tool to overcome the effects of the crisis for some specific groups and in particular to support inclusive growth. Aside from these financial products and services, many European MFIs provide non-financial services as well.
The latest EMN-MFC survey reports a remarkable growth both in the overall total value and the number of microloans provided by the surveyed Microfinance Institutions.
Fintechs:
Investments in Fintechs have grown exponentially over the past decade, but are characterised by a high degree of volatility.
Venture Capital investments in Fintech have been on the rise in recent years and make up an important part of the total volume in Fintech investments.
While total deal value on the European VC Fintech market has increased over the past quarters, total deal count has been declining, possibly indicating a consolidation is taking place.
While entrant Fintechs are generally considered to be disruptors, they are often found to commence symbiotic relationship with incumbent players, which can come to the benefit of the entrant and the incumbent, as well as the consumer.

viii
Table of contents
Executive summary ...................................................................................................... iv
Table of contents ...................................................................................................... viii
1 Introduction .......................................................................................................... 1
2 Economic Outlook ................................................................................................ 3
3 SME business environment ..................................................................................... 6
3.1 The EIF SME Access to Finance Index .......................................................................6
3.2 Loan volumes and borrowing costs ..........................................................................7
3.3 SME financing from a supply perspective ................................................................ 11
3.4 SME financing from a demand perspective ............................................................. 14
4 Private equity ..................................................................................................... 19
4.1 Investment activity ............................................................................................... 19 4.1.1 Private equity funds ........................................................................................................... 19 4.1.2 Business angels ................................................................................................................ 29
4.2 Fundraising activity ............................................................................................. 33
4.3 Divestment activity .............................................................................................. 37
4.4 Lower mid-market and hybrid debt/equity finance: An important market segment .......... 40
4.5 PE prospects ...................................................................................................... 42 4.5.1 Current situation, risks and market actors’ concerns ............................................................. 42 4.5.2 Structural challenges affecting European PE and VC ............................................................ 45 4.5.3 Policy intervention in European PE and VC: Findings from recent studies ............................... 48 4.5.4 Policy intervention in European PE and VC: A practical approach ......................................... 49
5 SME guarantees and SME Securitisation in Europe ................................................. 52
5.1 SME guarantees ................................................................................................. 52 5.1.1 Market failure and policy response ..................................................................................... 52 5.1.2 Market size and activity in 2016 ......................................................................................... 57
5.2 SME Securitisation .............................................................................................. 61 5.2.1 SMESec market activity ...................................................................................................... 63 5.2.2 SMESec prospects ............................................................................................................. 71
6 Microfinance market ........................................................................................... 76
6.1 Microfinance and social inclusion ......................................................................... 76 6.1.1 What is Microfinance? ...................................................................................................... 76 6.1.2 A support tool for necessity-driven business creation ............................................................ 77
6.2 The demand for microfinance: microenterprises and their finance decisions ................. 82
6.3 The supply of microfinance: a sector characterised by significant diversity .................... 83

ix
6.4 The microenterprise financing gap ........................................................................ 85
6.5 Microfinance prospects ....................................................................................... 89
7 Fintechs ............................................................................................................. 91
7.1 What are Fintechs? ............................................................................................. 91
7.2 European Fintech market size ............................................................................... 91
7.3 Crowdfunding in Europe ...................................................................................... 93
7.4 Fintechs: complements or disruptors? .................................................................... 95
8 Concluding remarks ............................................................................................ 97
ANNEX .................................................................................................................. 101
Annex 1: Private Equity Glossary ................................................................................... 101
Annex 2: Securitisation Glossary ................................................................................... 104
Annex 3: List of acronyms ............................................................................................ 105
References ............................................................................................................. 109
About … ................................................................................................................ 119
… the European Investment Fund ............................................................................. 119
… EIF’s Research & Market Analysis .......................................................................... 119
… this Working Paper series .................................................................................... 119
EIF Working Papers ................................................................................................. 120

1
1 Introduction
The European Investment Fund (EIF) is the European Investment Bank (EIB) Group’s specialist provider of risk financing for entrepreneurship and innovation across Europe, delivering a full spectrum of financing solutions through financial intermediaries (i.e. equity instruments, guarantee and credit enhancement instruments, as well as microfinance). Figure 1 illustrates the range of EIF’s activities:
Figure 1: EIF tool kit for SMEs
Source: EIF
The EIF focuses on the whole range of Small and Medium sized Enterprises (SMEs), starting from the pre-seed, seed-, and start-up-phase (technology transfer, business angel financing, microfinance, early stage VC) to the growth and development segment (formal VC funds, mezzanine funds, portfolio guarantees/credit enhancement).
Public support to SMEs is crucial given their importance for the European economy. SMEs are defined by the European Commission5 as firms having no more than 250 employees. In addition, they are required to have an annual turnover below EUR 50m, or a balance sheet total of no more than EUR 43m (see Table 1).
5 Commission Recommendation of 6 May 2003.

2
Table 1: EU definition of SMEs6
Employees Turnover Balance sheet total
Micro <10 ≤ EUR 2m ≤ EUR 2m
Small <50 ≤ EUR 10m ≤ EUR 10m
Medium-sized <250 ≤ EUR 50m ≤ EUR 43m
Source: European Commission (2016)
Small and medium-sized enterprises contribute significantly to European job creation and economic growth (Figure 1). In 2016, nearly 24 million SMEs in the European Union made up 99.8% of all non-financial enterprises, employed around 93 million people (66.6% of total employment) and generated 56.8% of total added value (EUR 4,030bn).
Figure 2: SMEs, employment and value added in the EU, 2016
Source: Authors, based on European Commission (2017a)
The European Small Business Finance Outlook (ESBFO) provides an overview of the main SME financing markets relevant to EIF (equity7, guarantees, securitisation, microfinance and Fintech). The present edition is an update of the ESBFO June 2017.
We start by discussing the general market environment, then look at the main aspects of equity finance and SME guarantees, specifically the SME Securitisation (SMESec) markets. Finally, we briefly highlight important aspects of microfinance in Europe, as well as of the emerging Fintech area.
6 In the context of defining enterprise categories, often also the category of mid-caps is mentioned in between the categories of SMEs and corporates. We define mid-caps as enterprises with a minimum of 250 and a maximum of 2,999 employees; moreover, there is the sub-category of small mid-caps, with a maximum of 500 employees. 7 Please see footnote 2 concerning the term “equity finance”.
21%
18%
18%
42%
30%
21% 17%
33%
93%
6%
1% Micro Small Medium Large
Number of enterprises
Number of employees
Value added at factor costs

3
2 Economic Outlook
Over the past six months, the global economic outlook improved substantially. The IMF (2017) increased its economic growth predictions by 0.1 percentage point for both 2017 and 2018, to 3.6 and 3.7 percent respectively. Also the European Commission updated its forecasts accordingly (EC, 2017a). The 2017 growth forecasts for the EU were revised upwards even more, by 0.4 percentage points to 2.3 percent. Also for 2018 the EC remains optimistic and expects economic growth to reach 2.1 percent. The investment rate has finally picked up, after lagging behind for many years: gross fixed capital formation growth for 2016 materialised at 3.4 percent, 0.9 percentage points higher than initially expected. This trend is projected to continue over the next years. While inflation for 2016 was still below historical standards, 2017 forecasts indicate that inflation will reach 1.7 percent, nearing the ECB’s 2 percent target. This could signal a strategy reversal in the near future, as it becomes more likely that the ECB will take its first steps towards normalisation of monetary policy.
Table 2: European Commission spring 2017 forecast for the EU
Source: European Commission (2017a)
The recent recovery of the European economy is also reflected in the evolution of European insolvencies (Figure 3): per 2016, insolvencies have decreased or stagnated in most European countries (Euler Hermes, 2017). Especially in Hungary (-24%), Portugal (-23%) and Slovakia (-20%) insolvencies decreased significantly. Insolvencies increased significantly in Poland, Luxembourg, Lithuania and Denmark8.
8 Note that the strong increase in Danish insolvencies (+66%) finds its roots in an administrative factor and is not reflective of a deterioration of the Danish economy.
(Real annual percentage change, unless otherwise stated)
Autumn 2017 estimates
2014 2015 2016
2017 2018 2019
GDP 1.8 2.3 1.9 2.3 2.1 1.9
Private consumption 1.1 2.1 2.4 2.0 1.8 1.6
Public consumption 0.2 0.3 0.3 1.2 1.5 1.3
Gross fixed capital formation 3.0 3.5 3.4 3.8 3.7 3.1
Employment 1.0 1.2 1.3 1.4 1.0 0.8
Unemployment rate (a) 10.2 9.4 8.6 7.8 7.3 7.0
Inflation (b) 0.5 0.0 0.3 1.7 1.7 1.8
Government balance (actual, % GDP) -3.0 -2.4 -1.7 -1.2 -1.1 -0.9
Gross government debt (% GDP) 88.5 86.5 84.8 83.5 81.6 79.8
Contribution to change in GDP
Private and Public Consumption 0.9 1.5 1.6 1.3 1.3 1.2
Investment and Inventories 0.9 0.8 0.7 0.8 0.7 0.6
Net exports -0.1 0.1 -0.4 0.2 0.1 0.1
(a) Percentage of the labour force. (b) Harmonised index of consumer prices (HICP), annual percentage change.

4
Figure 3: Rate of change in insolvency, 2016-2017(f)-2018(f)
Note: 2017 and 2018 are forecasted values Source: Euler Hermes (2017)
Figure 4: SME Business Climate Index
Source: Authors, based on UEAPME Study Unit (2017)
UEAPME’s semi-annual EU Craft and SME Barometer (UEAPME, 2017) provides more information on the current and future economic environment, specifically for SMEs. In line with the general economic predictions of the EC and Euler Hermes, UEAPME reports that the SME business climate continued to improve over the first 6 months of 2017 and expects this trend to continue throughout
-40%
-20%
0%
20%
40%
60%
80%
100%
2016 2017f 2018f
80.2
82.1
75.5
0
5
10
15
20
25
30
35
50
55
60
65
70
75
80
85
%
EU-wide Index North South Neutral Level

5
the year, in the North/Centre9 of the EU, as well as in the Southern/Vulnerable10 regions. The North-South gap, however, is expected to increase marginally to 6.6 percentage points.
Figure 5 plots net responses11 on the attitude of SMEs vis-a-vis a series of different economic indicators contained in UEAPME’s semi-annual EU Craft and SME Barometer, such as the overall economic situation, turnover, employment, prices, investments and orders. For the first semester of 2017, SMEs were generally positive towards all factors considered. Overall, expectations formed one semester earlier were widely exceeded, and this held true especially with regards to turnover and investments.
Figure 5: Main Results of the EU Craft and SME Barometer HY2/2017
Source: Authors, based on UEAPME Study Unit (2017)
9 Austria, Belgium, Bulgaria, Czech Republic, Denmark, Estonia, Finland, France, Germany, Hungary, Latvia, Lithuania, Luxembourg, Netherlands, Poland, Romania, Slovakia, Sweden and UK. 10 Croatia, Cyprus, Greece, Ireland, Italy, Malta, Portugal, Slovenia and Spain. 11 The net response is calculated as the share of positive minus negative responses.
-15%
-10%
-5%
0%
5%
10%
15%
20%
25%
Overall Turnover Employment Prices Investments Orders
HY1/2014 HY2/2014 HY1/2015 HY2/2015
HY1/2016 HY2/2016 HY1/2017 HY2exp/2017

6
3 SME business environment
3.1 The EIF SME Access to Finance Index
The discussion of the SME business environment is introduced by the EIF SME Access to Finance (ESAF) Index. The ESAF Index is a composite indicator that summarises the state of SME financing in 28 EU countries. It was first introduced in the June-edition of 2016 (Kraemer-Eis et al., 2016a) and gets updated on an annual basis. The index is composed out of four subindices, three of which are related to different financing instruments (loans; equity; credit and leasing), while the fourth covers factors related to the general macro-economic environment. The methodology underlying the construction of the index is elaboration upon in Gvetadze et al. (2018, forthcoming).
The results of the most recent update (June 2016)12 are presented in Figure 6, which illustrates the 2016 value of the composite indicator (red dot) for each of the EU-27 countries and its evolution since 2013 (grey dots). Neither the left-hand nor the right-hand tail of the distribution reveals big surprises, with countries like Sweden, Finland, Germany, and the UK leading the ranking, while Greece, Cyprus, Hungary and Italy are lagging it. However, the results reveal some interesting findings when considering the evolution of the index over time. Greece, for example, has experienced a gradual but consistent deterioration of its index value. Comparing 2015 to 2016, the countries experiencing the biggest set-back were Latvia, the United Kingdom and Luxembourg. The biggest improvements were recorded for the Czech Republic, Denmark and Bulgaria.
Figure 6: The EIF SME Finance Index: Country comparison and evolution over time
Source: Gvetadze et al. (2018, forthcoming)
12 See Kraemer-Eis et al. (2017) for a more detailed elaboration of the June 2016 index results.
0
0.1
0.2
0.3
0.4
0.5
0.6
0.7
0.8
Swed
en
Finl
and
Ger
man
y
Uni
ted
King
dom
Fran
ce
Belg
ium
Aus
tria
Den
mar
k
Cze
ch R
epub
lic
Pola
nd
Mal
ta
Luxe
mbo
urg
Net
herla
nds
Irela
nd
Spai
n
Bulg
aria
Lith
uani
a
Esto
nia
Slov
akia
Latv
ia
Slov
enia
Portu
gal
Rom
ania
Cro
atia
Italy
Hun
gary
Cyp
rus
Gre
ece
2013 2014 2015 2016

7
3.2 Loan volumes and borrowing costs
Figure 7 illustrates how borrowing costs and outstanding loans to non-financial corporations (NFCs) evolved from their pre-crisis levels to where they are now. Borrowing costs for NFCs remain historically low: per September 2017, the ECB’s composite borrowing cost indicator13 reached a record low of 1.72%. As of yet, this did not significantly impact the evolution of outstanding loans: the deleveraging process that set in following the financial crisis has stagnated for over three years now and the amount of outstanding loans to NFCs has fluctuated around EUR 4.1tr since mid-2014.
Figure 7: Outstanding loans and composite cost-of-borrowing indicator for non-financial corporations in the Euro Area (until September 2017)
Source: Authors, based on ECB Data Warehouse
Figure 7 refers to total business lending to NFCs. Unfortunately, data on SME lending specifically is not readily available. Therefore, we proxy SME lending by using data on loans below the EUR 0.25m threshold (see Huerga et al., 2012).14 Figure 8 plots the evolution of small loans’ new business volumes in the Euro Area starting from June 2010. It shows how small lending first contracted, after which it picked up pace again early 2014 and has been rising ever since, totalling EUR 34.7bn in September 2017.15 The graph also depicts the share of small loans in total lending. During the contraction of small business lending that took place prior to 2014, the share of small loans in total new business volumes declined, implying that the contraction was more pronounced in the small loans business segment. However, during the recovery thereafter, the share of small loans in total new business volumes increased significantly, to plateau around 16.7 percent mid-2016. Hence, the SME lending segment presumably recovered stronger vis-à-vis their larger counterparts. 13 The composite borrowing indicator is a volume weighted average of borrowing cost of loans from different maturities. For an elaborate description of the methodology, see ECB (2013). It was constructed “to assess the effectiveness of the monetary policy pass-through across the euro area countries”. 14 To better reflect lending conditions to SMEs specifically, rather than small loans in general, the data excludes interest rates on revolving loans and overdraft, since these instruments are arguably used independent of firm size. 15 Calculated as a 12 month backwards moving average to abstract from the strong monthly fluctuations typically found in lending new business volumes.
1%
2%
3%
4%
5%
6%
7%
2.0
2.5
3.0
3.5
4.0
4.5
5.0
tr E
UR
Loans to NFCs (LHS)Composite cost-of-borrowing indicator (RHS)

8
Figure 8: Small loans to NFCs (< EUR 0.25m), new business volumes in the Euro Area (12m moving averages)
Source: Authors, based on ECB Data Warehouse
Figure 9 reveals large country-level differences in the small loan share. Per July 2017 (latest available data with wide country-level coverage), small loans made up anywhere between 2.8 percent (Austria) and 40 percent (Spain). It appears that small lending is relatively more important in vulnerable economies. Figure 9 also illustrates how the small loan share has evolved since June 2010, the earliest available data. Small lending has lost relative importance in just a handful of countries, like France, Slovakia, Ireland, or Cyprus. For all other countries, the share of small loans increased in line with the European trend. For some countries this increase has been rather dramatic. Take Lithuania, for example, where it rose nearly 6-fold over the course of 7 years, from just 3 percent in June 2010 to 19 percent in July 2017. Also in Spain the share nearly doubled to 40 percent.
Figure 9: Small loans (< EUR 0.25m) as a share of total NFC lending (NBV), by country
Source: Authors, based on ECB Data Warehouse
12%
13%
14%
15%
16%
17%
20000
24000
28000
32000
36000
40000Ju
n-20
10
Sep-
2010
Dec
-201
0
Mar
-201
1
Jun-
2011
Sep-
2011
Dec
-201
1
Mar
-201
2
Jun-
2012
Sep-
2012
Dec
-201
2
Mar
-201
3
Jun-
2013
Sep-
2013
Dec
-201
3
Mar
-201
4
Jun-
2014
Sep-
2014
Dec
-201
4
Mar
-201
5
Jun-
2015
Sep-
2015
Dec
-201
5
Mar
-201
6
Jun-
2016
Sep-
2016
Dec
-201
6
Mar
-201
7
Jun-
2017
Sep-
2017
mEU
R
Share of new business volumes < EUR 0.25m in total new business volume (RHS)Loans < EUR 0.25m - new business volume (LHS)Loans < EUR 0.25m - new business volume - 12m moving av (LHS)
0%5%
10%15%20%25%30%35%40%45%
Jun-2010Jul-2016Jul-2017

9
Borrowing costs are an important driver of the evolution of lending volumes. Figure 10 illustrates the evolution of borrowing costs for three different loan size categories: small loans (<EUR 0.25m), medium-sized loans (EUR 0.25m – EUR 1m) and large loans (>EUR 1m). Interest rate data is further subdivided according to loan maturity. Over the past 6 months, interest rates decreased for all but one loan category. Only for long term (> 10 years) large loans interest rates have increased. This is consistent with the documented rise in the overall investment rate in Europe (see section 2). An increase in investment is generally associated with a rise in the demand for long term loans, pushing up the price (interest rate) in this particular loan segment. Note, however, that the interest rate on small long term loans did not increase, a possible indication that investment by SMEs might still be lagging behind.
Figure 10: Interest rates by loan size and maturity, and the interest rate size spread – April 2015 to April 2017
*The graph depicts the 12 month backward moving average floating interest rates charged by banks on loans to NFCs (new business volumes, other than revolving loans and overdraft)
Source: Authors, based on ECB Data Warehouse
A more general finding arising from Figure 10 relates to the observation that, regardless of maturity, small loans are burdened with higher interest rates, a phenomenon referred to as the size-spread hereafter. This is somewhat surprising, as traditional finance theory suggests that, ceteris paribus, the risk of default increases with loan size (Stiglitz, 1972). A number of factors could explain why the inverse relationship between loan size and the interest rate breaks down for bank lending to NFCs. First, in the presence of fixed screening costs, small loans will carry a higher interest rate. Second, smaller lenders could possess different characteristics (Moore and Craigwell, 2003), or use the borrowed funds for different financing purposes, such as funding working capital, instead of long term investment projects. The fact that the size spread is particularly high for short term loans provides some support for this argument. Third, it is possible that banks possess a higher degree of power in the small loan market segment, putting an upward pressure on the price of small loans. Note that the size spread on long term loans has continued to converge towards zero, driven by the increase in the price of large long term loans, as discussed above.
0%
1%
1%
2%
2%
3%
3%
4%
Sep
15N
ov 1
5Ja
n 16
Mar
16
May
16
Jul 1
6Se
p 16
Nov
16
Jan
17M
ar 1
7M
ay 1
7Ju
l 17
Sep
17
Oct
15
Dec
15
Feb
16Ap
r 16
Jun
16Au
g 16
Oct
16
Dec
16
Feb
17Ap
r 17
Jun
17Au
g 17
Sep
15N
ov 1
5Ja
n 16
Mar
16
May
16
Jul 1
6Se
p 16
Nov
16
Jan
17M
ar 1
7M
ay 1
7Ju
l 17
Sep
17
< 3 months 3 - 5 years > 10 years
spread small-large < 0.25m 0.25-1m > 1m

10
Figure 10 also exposes an anomaly in the maturity spread of small loans. As a general rule, liquidity decreases with loan maturity. Long term loans would therefore be expected to carry higher interest rates. This reasoning indeed holds true for medium-sized and large loans. For small loans however, short term lending is actually more expensive. This can be interpreted as evidence for the presence of a fixed lending costs element, related to screening, or the specific characteristics of small loans.
Figure 11: Euro Area country-level interest rates on small loans and the loan size spread*
* The spread is calculated as the percentage point difference between loans exceeding EUR 1m and loans smaller than EUR 0.25m. 12months backwards moving averages were used to eliminate the influence of monthly outliers and focus on the underlying trend. Countries for which no sufficient data was available are omitted.
Source: Authors, based on ECB Data Warehouse
While overall financing costs for Euro Area NFCs might be decreasing, Figure 11 indicates that the aggregates enfold significant country-level heterogeneity.16 It plots the 12-month moving average of the interest rate charged to NFCs on loans not exceeding EUR 0.25m for a selection of countries for which data was available. It also depicts the size spread, defined as the excess interest rate charged on loans smaller than EUR 0.25m compared to loans with a value exceeding EUR 1m. A high size-spread indicates a disadvantaged competitive position for small firms vis-à-vis larger borrowers. Between September 2016 and September 2017, the interest rates charged on small loans in the Euro Area decreased in all but two countries, Slovakia and Estonia. This is a continuation of the trend documented in the previous edition of the ESBFO (Kraemer-Eis et al., 2017). In Slovakia, also the size spread increased for the second consecutive semester, indicating the increase in the price of small loans is not a secular increase for the entire lending market, rather an evolution specific to the small loans segment.
16 See also Wagenvoort et al. (2011) who show that the European market integration for small loans, in particular with a short rate fixation, has not yet been achieved, explaining the non-uniformity of bank lending rates on small loans across European nations.
0%
1%
2%
3%
4%
5%
6%
Belg
ium
Fran
ce
Aus
tria
Spai
n
Euro
Are
a
Lith
uani
a
Ger
man
y
Slov
enia
Finl
and
Esto
nia
Latv
ia
Cyp
rus
Slov
akia
Irela
nd
Gre
ece
interest rates on loans < EUR 0.25m - Sep-2016 interest rates on loans < EUR 0.25m - Sep-2017
size spread - Sep-2016 size spread - Sep-2017

11
Small loans became significantly cheaper in Spain. This was also accompanied by a strong decline in the size spread. Spain continues its path towards the left side of the distribution (see Kraemer-Eis et al., 2016b). Borrowing costs for SMEs were lowest in Belgium and France. At the other side of the distribution, SMEs faced the least favourable lending conditions in Ireland and Greece. Noteworthy is the high size spread in Ireland, compared to the size spread in Greece. This indicates that Irish SMEs find themselves in a disadvantaged position vis-à-vis Irish large firms. In Greece, interest rates are high both for small and large loans, implying a general unfavourable financing environment, likely caused by high risk in general.
While cross-country heterogeneity in interest rates on small loans could be explained by difference in the individual risk-profile of SMEs located in those respective countries, a recent study investigating the differences in cross-country interest rate variations on small loans found that such factors held little explanatory power (Caroll and McCann, 2016). Controlling for individual risk factors of SMEs, the authors conclude that national interest rate differences for SME lending are associated with institutional characteristics of the country such as, among others, recoverability of collateral and lack of competition in the banking sector. This latter explanatory factor appears to be particularly relevant for explaining the interest rate size-spread documented in Figure 10 and Figure 11. Large firms have greater bargaining power, vis-à-vis SMEs, which leads to lower interest rates on larger loans and hence, a lower size spread vis-à-vis smaller loans (Berger and Udell, 2006; see also Affinito and Farabullini, 2009).
3.3 SME financing from a supply perspective
The ECB’s latest Bank Lending Survey (ECB, 2017a) provides an overview of the current state of the SME lending market from the perspective of the banks. It is conducted quarterly and asks banks about the credit standards they uphold vis-à-vis corporate borrowers, among other things. Figure 12 plots the quarterly net change17 in credit standards and illustrates how banks’ perception of credit standards upheld to NFCs has changed since the beginning of the financial crisis.18 A positive value indicates that banks tightened credit standards, whereas a negative value indicated an easing of standards. Figure 12 shows that credit standards continued to ease during the last two quarters of 2017, although to a greater extent for large firms, compared to SMEs.
The different factors driving the changes in credit standards are illustrated in Figure 13. All factors considered contributed to the loosening of credit standards. Especially banks’ comfortable liquidity position and a general optimism about the overall economic situation were reported to be important determinants. Over the last quarter of 2017, banks also considered the risk on collateral demanded to have decreased.
17 The net change is calculated as the difference between the sum of the percentages of banks responding “tightened considerably” and “tightened somewhat”, and the sum of the percentages of banks responding “eased somewhat” and “eased considerably”, for loans to firms from different size classes. 18 Banks are requested to answer the following question: ‘Over the past three months how have your banks' credit standards as applied to the approval of loans or credit lines to enterprises changed?’

12
Figure 12: Net changes in credit standards applied to the approval of loans or credit lines to enterprises (SMEs versus large enterprises)
Source: Authors, based on ECB Bank lending survey (ECB, 2017a)
Figure 13: Factors contributing to changes in credit standards to SMEs19
Source: Authors, based on ECB Bank lending survey (ECB, 2017a)
Finally, the supply side section concludes by illustrating how banks themselves perceive the SME financing gap to have evolved over the final quarter of 2017. It does so by combining the answers of two BLS survey questions in Figure 14. The first question, the answers of which are mapped on the Y-axis, asks banks to what extent they have tightened SME credit standards. The values plotted in Figure 14 represent the net percentage20 of banks that have tightened credit standards in a 19 Banks are asked the following question: Over the past three months, how have the following factors affected your bank's credit standards as applied to the approval of loans or credit lines to enterprises? The graph reports net percentage contribution of each factor to the tightening or easing or credit standards. The net percentage is defined as the difference between the percentage of banks reporting that the given factor contributed to a tightening and the percentage reporting that it contributed to an easing. 20 The net percentage is calculation using the diffusion index weighting system. “The diffusion index refers to the weighted difference between the share of banks reporting an increase in loan demand and the share of banks reporting a decline. The diffusion index is constructed in the following way: lenders who have answered “considerably” are given a weight twice as high (score of 1) as lenders having answered “somewhat” (score of 0.5).” (ECB, 2017a)
-10%
0%
10%
20%
30%
40%
50%
60%
70%SMEs Large Enterprises
-25%
-20%
-15%
-10%
-5%
0%
5%
10%
access tomarket
financing
bankcompetition
bank's risktolerance
capitalposition
generaleconomic
activity
industry orfirm specific
situation
liquidityposition
marketfinancing
competition
non-bankcompetition
risk oncollateral
demanded
Q1/2016 Q2/2016 Q3/2016 Q4/2016 Q1/2017 Q2/2017 Q3/2017 Q4/2017

13
given country. A positive value implies tighter credit conditions. The X-axis proxies demand and uses the answer to the question whether banks have experienced increased or decreased bank loan demand. A positive value implies higher loan demand. This then combines to a plot area consisting out of four quadrants. The North-Western quadrant represents a situation one would expect to occur during a period of economic contraction, where decreased loan demand is accompanied by tightening credit conditions. This is reportedly the case for Lithuania. At the opposite side of the diagram, the South-Eastern quadrant, containing only Germany, represents a situation consistent with economic expansion, where loan demand increases and credit conditions imposed by banks loosen. In neither situation one can make clear predictions about the direction in which the SME financing gap will evolve, as it depends on the relative magnitude of the two forces at hand, which is impossible to determine based on just the survey answers. For SMEs operating in countries situated in the other two quadrants, or on the bordering axes, however, it is possible to infer predictions about the financing gap they are facing. For the North-Eastern quadrant, one distinguishes three possible situations. First, banks in countries located within the red quadrant (Austria) to have tightened credit supply while experiencing an increase in credit demand. Second, banks in countries located on the positive portion of the Y-axis (Spain, Italy) also reported tightened credit conditions, albeit at a constant demand for loans. Third, banks in countries situated on the positive portion of the X-axis (Luxembourg, Estonia, Belgium, Cyprus, Greece, Slovenia and Latvia) left credit standards unchanged, but reportedly faced higher loan demand. Hence, for all countries belonging to one of the three groups, the SME financing gap necessarily increased. Note that in the opposite corner, following similar reasoning, the South-Western quadrant implies a shrinking financing gap.
Figure 14: The SME financing gap from a supply perspective (Q4/2017)
Source: Authors, based on ECB Bank lending survey (ECB, 2017a)
AT
DE
EE, BE, CY, GR
IE
ES, IT
LT
LU LV
PT
SI
-15
-10
-5
0
5
10
15
-60 -40 -20 0 20 40 60
Loan Demand
Credit Standards
increasing loan demand tightening supply
increasing loan demand easing supply
decreasing loan demand easing supply
decreasing loan demand tightening supply

14
3.4 SME financing from a demand perspective
Having discussed the banks’ supply side perspectives of the lending market, this section turns to the demand side and reports the most important results of the latest Survey on Access to Finance of Enterprises (SAFE). First, we use the information contained in the SAFE survey (ECB, 2017b) to illustrate the relative importance of different financing instruments (Figure 15).
The relative importance of the different financing instruments remained roughly constant between the second half of 2016 and the first half of 2017. Bank products (loans and overdraft) are still the most popular financing instruments for SMEs, followed by leasing and hire-purchase. Equity and factoring make up just a small fraction of overall SMEs’ external financing needs. Unfortunately, the SAFE survey does not include alternative financing instruments, such as Fintech or crowdfunding, as a possible answer, even though they have gained popularity in SMEs’ financing mix over the past years. Chapter 7 elaborates on the growing importance of crowdfunding as a source of external financing for European SMEs.
Figure 15: Sources of external financing of Euro Area SMEs
Source: Authors, based on ECB SAFE (ECB, 2017b)
0%
10%
20%
30%
40%
50%
60%
70%
80%
90%
100%
HY2
/201
6
HY1
/201
7
HY2
/201
6
HY1
/201
7
HY2
/201
6
HY1
/201
7
HY2
/201
6
HY1
/201
7
HY2
/201
6
HY1
/201
7
HY2
/201
6
HY1
/201
7
bank loans equity factoring leasingor hire-
purchase
overdraft tradecredit
do not know
not applicable
did not use but relevant
used
15
Figure 16: Percentage of SMEs ranking access to finance as a highly important issue
Source: Authors, based on ECB SAFE (ECB, 2017b)
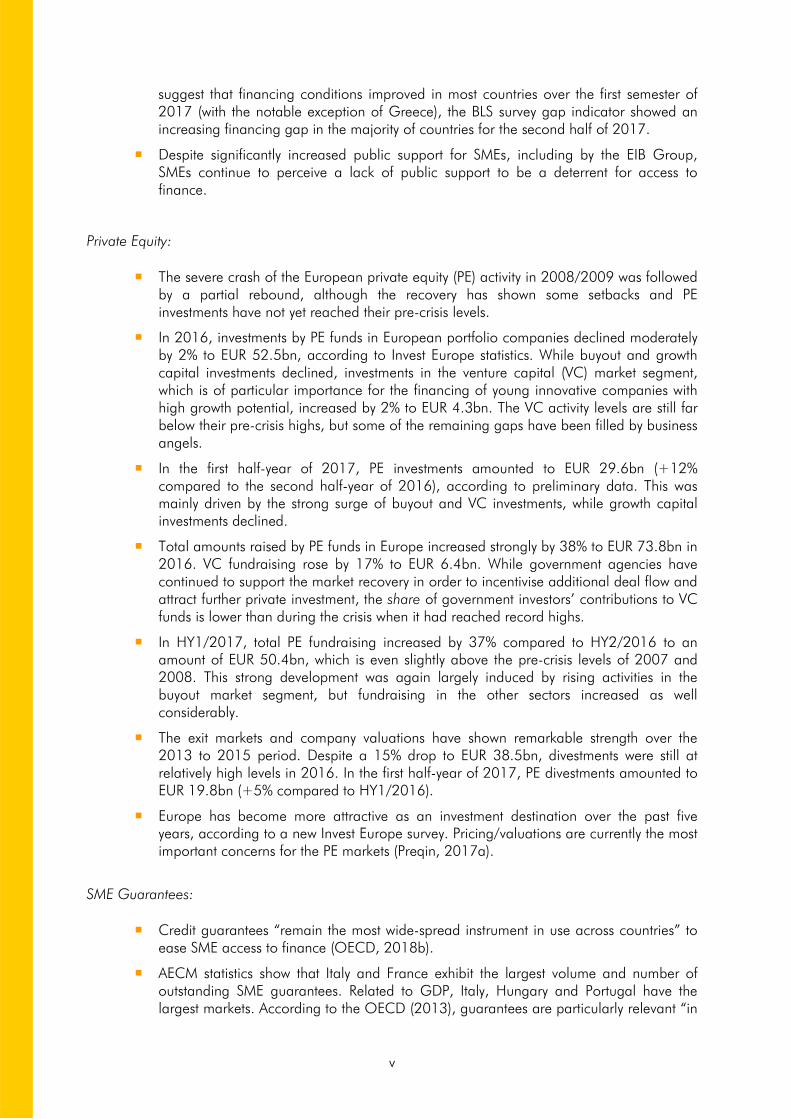
The ECB SAFE survey also asks SMEs how they perceive their external financing situation. Over the first semester of 2017, the share of Euro Area SMEs that considers access to finance to be a highly important problem21 has declined for the 10th consecutive semester (Figure 16, left panel). Despite this favourable evolution, over 1 in 4 Euro Area SMEs still report to be finance constrained. The right panel of Figure 16 shows that this percentage varies significantly by country. In Greece, 60 percent of SMEs had significant issues accessing finance, up two percentage point since one semester earlier. Also Portuguese SMEs reported a minor deterioration of their finance situation. In most other countries the SME financing situation improved, considerably so in Finland and Spain.
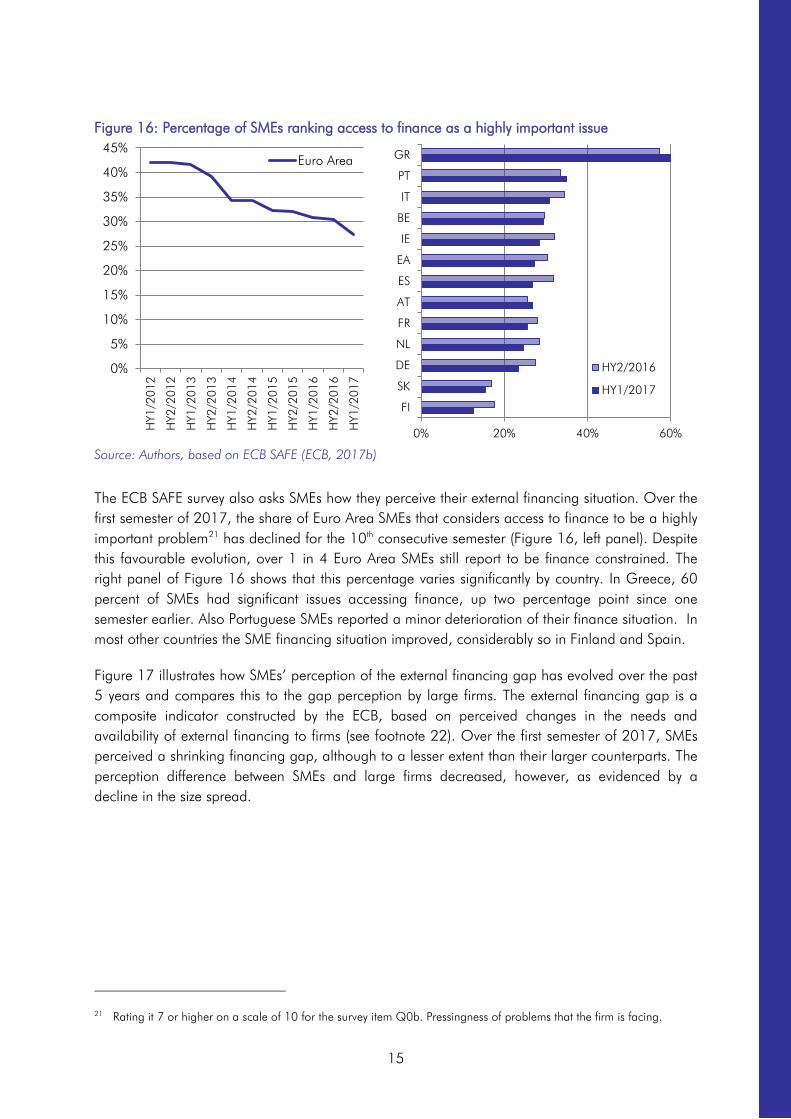
Figure 17 illustrates how SMEs’ perception of the external financing gap has evolved over the past 5 years and compares this to the gap perception by large firms. The external financing gap is a composite indicator constructed by the ECB, based on perceived changes in the needs and availability of external financing to firms (see footnote 22). Over the first semester of 2017, SMEs perceived a shrinking financing gap, although to a lesser extent than their larger counterparts. The perception difference between SMEs and large firms decreased, however, as evidenced by a decline in the size spread.
21 Rating it 7 or higher on a scale of 10 for the survey item Q0b. Pressingness of problems that the firm is facing.
0%
5%
10%
15%
20%
25%
30%
35%
40%
45%H
Y1/2
012
HY2
/201
2
HY1
/201
3
HY2
/201
3
HY1
/201
4
HY2
/201
4
HY1
/201
5
HY2
/201
5
HY1
/201
6
HY2
/201
6
HY1
/201
7
Euro Area
0% 20% 40% 60%
FI
SK
DE
NL
FR
AT
ES
EA
IE
BE
IT
PT
GR
HY2/2016
HY1/2017
16
Figure 17: Perceived change in the perception of the external financing gap by SMEs and large firms22
Source: Authors, based on ECB SAFE (ECB, 2017b)
Figure 18 illustrates the country-level heterogeneity underlying Figure 17. During the first semester of 2017, SMEs in France and Greece perceived the financing gap to be growing. The situation in Greece did improve significantly compared to one semester earlier and the gap perception indicator more than halved from 23.6 percent to 11.5 percent. In Belgium, SMEs reported the financing gap to have remained constant, while in all other countries, the gap was perceived to have decreased. The strongest decrease was reported by Portuguese SMEs, which is peculiar, since the share of Portuguese SMEs that reported access to finance to be a highly relevant problem increased (Figure 16).
22 For each of the five financing instruments (bank loans, trade credit, equity, debt securities, bank overdraft), an indicator change in a perceived financing gap takes the value of 1 (-1) if the need increases (decreases) and availability decreases (increases). If firms perceive only a one-sided increase (decrease) in the financing gap, the variable is assigned a value of 0.5 (-0.5). The composite indicator illustrating the perception of firms’ financing gap is the weighted average of the financing gap related to the five instruments. A positive value of the indicator suggests an increasing financing gap. Values are multiplied by 100 to obtain weighted net balances in percentages. The size spread depicts the percentage point difference (in absolute terms) between the perceived financing gap as reported by SMEs and the gap reported by large firms.
-15%
-10%
-5%
0%
5%
10%
15%
HY2/2012 HY1/2013 HY2/2013 HY1/2014 HY2/2014 HY1/2015 HY2/2015 HY1/2016 HY2/2016 HY1/2017
SMEs large size spread

17
Figure 18: Perceived change in the external financing gap by SMEs at the country-level
*The marker denotes the average level of the index throughout the four semesters of 2011 and 2012.23
Source: Authors, based on ECB SAFE (ECB, 2017b)
Figure 19: Factors driving the availability of external financing to Euro Area SMEs
Source: ECB SAFE (ECB, 2017b)
The SAFE survey also asks about the factors which SMEs believe are driving the availability of external financing. Figure 19 illustrates how responses evolved during the last two years. Over the first semester of 2017, all but one factor contributed positively to the availability of external finance. SMEs still feel that limited access to public financial support, such as guarantees, hampers external finance availability, although the extent to which this is the case has decreased since one semester earlier. Factor that contributed most to finance availability were firm-specific economic outlook, a favourable own capital position and a positive credit history. SMEs also reported that
23 2011-2012 is the period in the aftermath of the crisis in which SMEs reported the highest values of the perceived change in the financing gap.
-20%
-10%
0%
10%
20%
30%
40%
50%
PT ES NL DE SK FI AT EA IT IE BE FR GR
HY1/2016 HY2/2016 HY1/2017 mean 2011-2012
-15%
-10%
-5%
0%
5%
10%
15%
20%
25%
access topublic financial
supportincluding
guarantees
willingness ofinvestors to
invest in yourenterprise
willingness ofbusiness
partners toprovide trade
credit
generaleconomicoutlook, to
obtain externalfinancing
willingness ofbanks to
provide credit
credit history own capital firm-specificoutlook
HY2/2015 HY1/2016 HY2/2016 HY1/2017

18
banks become more willing to provide credit. Noteworthy is also the positive evolution of the general economic outlook, in line with the predictions outlined in section 2.
The general economic outlook improved significantly since the publication of the previous European Small Business Financing Outlook in June 2017. Monetary policy further drove borrowing costs for NFCs to record lows, but the interest rate spread between small and large loans remains significant. The positive economic outlook had a favourable impact on SMEs’ financing conditions during the first half of 2017, according to the SAFE survey. The BLS supply side survey, however, provided some evidence that the SME financing gap could have increased during the second half of 2017. Not all European SMEs experienced improvements in their business and financing environment. Greek SMEs, for example, reported an increase in their perceived financing gap, indicating the positive evolution reported on in the ESBFO June 2017 (Kraemer-Eis et al, 2017) did not constitute a definite trend reversal.
19
4 Private equity
4.1 Investment activity
4.1.1 Private equity funds
Over the past 20 years, the European private equity (PE) activity exhibited booms and busts. The most famous peak periods were observed in 2000 and 2006, when the total amounts raised by PE funds located in Europe reached EUR 48bn and EUR 112bn, respectively, according to the statistics of Invest Europe (see Figure 20; Box 1 provides more information on the Invest Europe data).
In the same years, the overall PE investment levels were at EUR 35bn and EUR 71bn (and even increased further to 78bn in 2007). However, both booms were followed by significant downturns, i.e. the “dotcom crisis” in the early noughties and the financial and economic crisis from 2007 onwards. The severe crash of the European PE activity in 2008/2009 was followed by a partial rebound, although the recovery has shown some setbacks and neither fundraising nor investments have yet reached their pre-crisis levels.
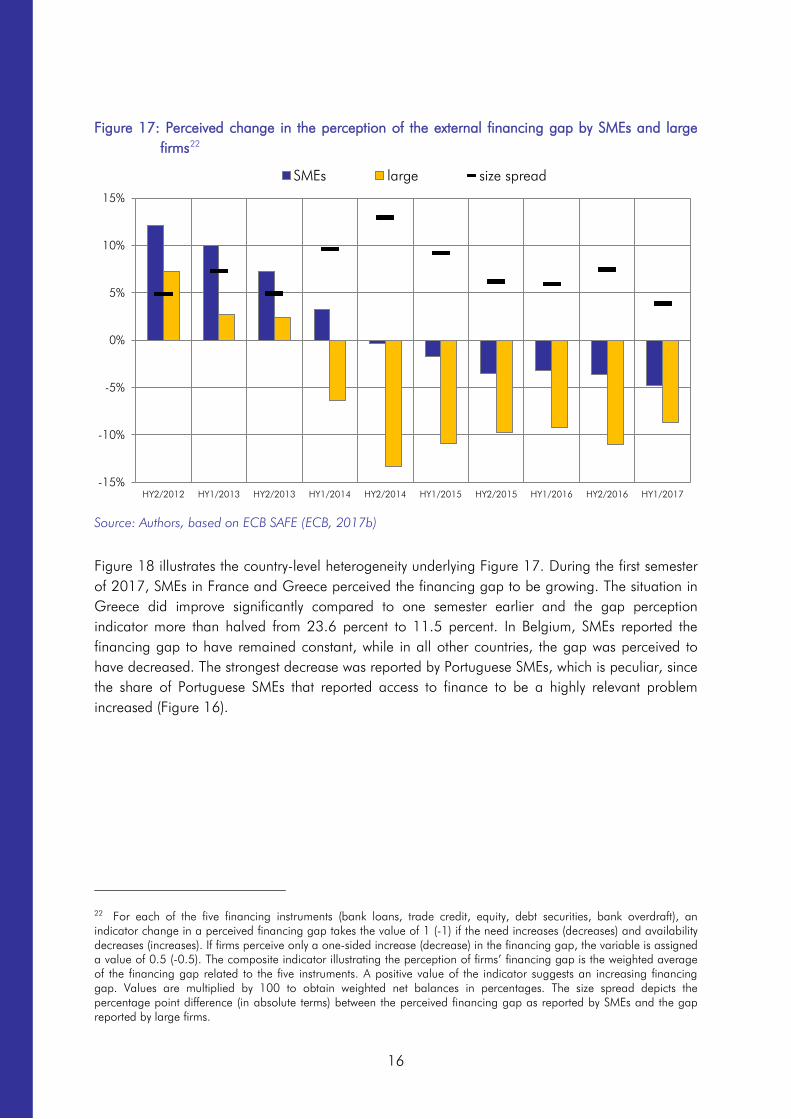
Box 1: Introductory information on Invest Europe data In this chapter, numbers, diagrams and statements are to a large extent built on statistics from Invest Europe (formerly EVCA, the European Private Equity & Venture Capital Association), and we would like to thank our colleagues from the Invest Europe research team for their support. Please note that data for HY1/2017 is preliminary.
Please do also note that Invest Europe private equity (PE) statistics do not include infrastructure funds, real estate funds, distressed debt funds, primary funds-of-funds, secondary funds-of-funds and PE/VC-type activities that are not conducted by PE funds. Further, activities of business angels and hedge funds as well as corporate acquisitions outside of dedicated corporate venture programmes are not included in the statistics.
Invest Europe statistics can differ from the numbers reported by other data providers for the reasons just mentioned and due to, e.g., differences in methodology, definitions and interpretations of the PE fund and investment stages and geographical definitions (e.g. of “Europe”).24
In 2017, Invest Europe released its statistics for the first time based on a new database. All data since 2007 was restated and complemented with additional information. With data on more than 1,200 European PE firms, the latest statistics cover 88% of the EUR 600bn in capital under management in Europe.
See, also for more details, Invest Europe (2017a) and the Invest Europe website (www.investeurope.eu).
24 With regard to PE and VC, there is in general a lack of data and its consistency, given, inter alia, the lack of data disclosure. Therefore, it is “difficult to paint in definitive terms the level of investment activity and fund performance”, as recently stated by Kaplan and Lerner (2016). However, the authors also highlight that “the quality of information available has increased in recent years and can be expected to continue to do so going forward”.

20
Figure 20: Fundraising, investment and divestment amounts by PE firms located in Europe25
Source: Authors, based on data from Invest Europe
In 2016, the PE investment amounts remained rather stable. PE funds located in Europe (statistics based on the “industry approach”; see Figure 20)25 invested EUR 53.4bn, which means a small decrease by 1.3% compared to the previous year. At the same time, investments by PE funds from all over the world (including Europe) in portfolio companies based in Europe (“market approach”)26 declined by 2.1% to EUR 52.5bn (see Figure 21). The number of European companies financed decreased by 7.9% to 5,899. In the first half-year of 2017, PE investments amounted to EUR 29.6bn (+12% compared to the second half-year of 2016), according to preliminary Invest Europe data.
Figure 21: PE investment in European portfolio companies26
Source: Authors, based on data from Invest Europe (data for HY1/2017 is preliminary)
25 This diagram shows data based on the “industry approach” (or “office approach”), i.e. by PE firms located in Europe (in contrast to the “market approach”, which shows investments and divestments based on the location of the portfolio companies). 26 Investment activity by PE firms in portfolio companies based in Europe (“market approach”). All investment figures are equity value, i.e. excluding leverage.
0
20
40
60
80
100
120
bn E
UR
Funds raised Investments Divestments
74.7
58.0
25.6
43.8 47.6
39.7 40.6 45.9
53.6 52.5
6,231
6,631 5,904
6,279 6,303 6,380 6,319 6,798 6,403 5,899
0
1,000
2,000
3,000
4,000
5,000
6,000
7,000
8,000
0
10
20
30
40
50
60
70
80
2007 2008 2009 2010 2011 2012 2013 2014 2015 2016 2017
bn E
UR
Investments HY1 Investments HY2
Investments, full year Number of companies financed, full year

21
A differentiation by stage focus (Box 2 provides an overview of the Invest Europe investment stage definitions) reveals that investments decreased in the two largest parts of the PE market, i.e. in the buyout (–2% to EUR 36.5bn) and the growth capital (–8% to EUR 9.7bn) segments in 2016 (see Figure 22). Strong positive growth rates were recorded for rescue/turnaround (+23% to EUR 0.4bn) and replacement capital (+67% to EUR 1.6bn) investments. Venture Capital (VC) investments increased by 2% to EUR 4.3bn (in contrast, VC investments declined in the US in 2016; see OECD, 2017b). In terms of number of companies financed, the VC segment accounted for the majority of PE investments (3,124 out of 5,899). The increase in total PE investments in the first half-year of 2017 was mainly driven by the strong surge of buyout (+20% compared to HY2/2016) and VC investments (+26%), while growth capital investments declined by 19%.
Figure 22: PE investments in European portfolio companies by stage focus
Source: Authors, based on data from Invest Europe
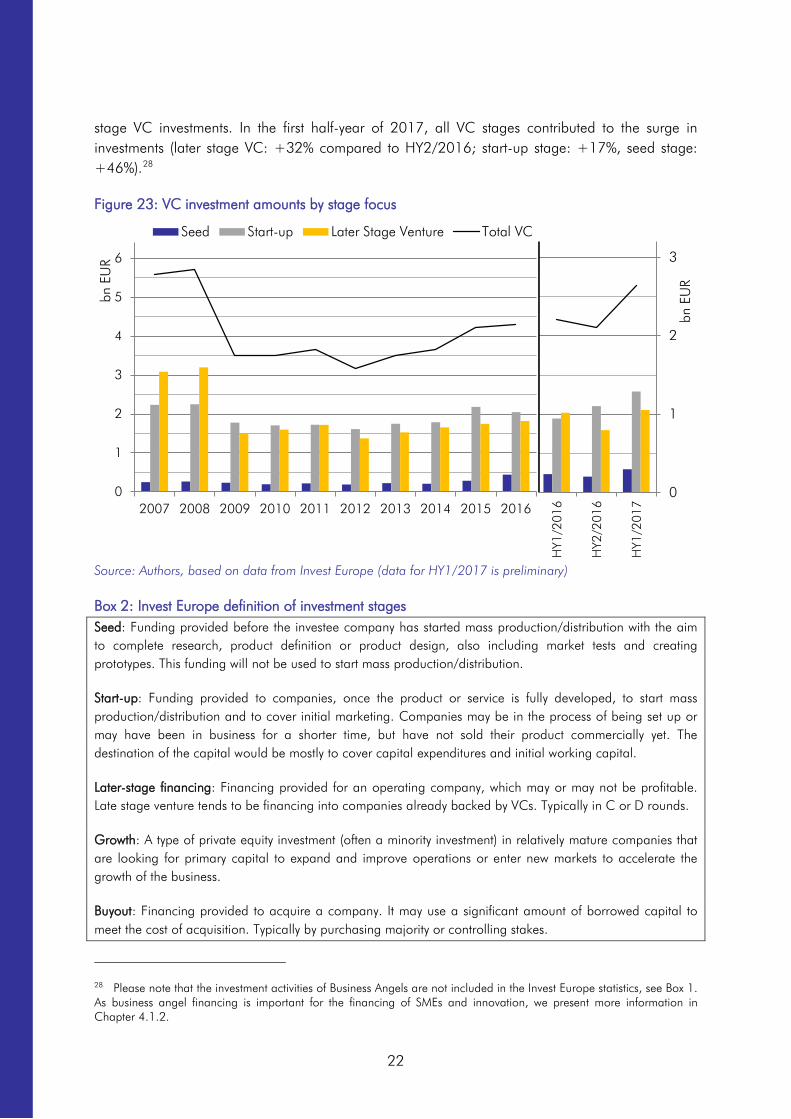
Within the VC market segment, investments with a focus on the seed stage surged by 54% to EUR 0.4bn in 2016.27 Following their continuous improvement over the preceding 3 years, start-up investments exhibited a decrease by 6% to EUR 2.0bn (see Figure 23). Later stage venture activities increased by 4% to EUR 1.8bn. Before the crisis, later stage venture was the driver of VC investment, but it is now far away from these activity values; in 2016, it was still 43% below its 2007 level. In contrast, since 2009, investments at the start-up stage have been higher than later
27 With regard to seed investments, equity investments in Technology Transfer (TT) activities can contribute to reducing early-stage (pre-seed, seed and post-seed) funding gaps and sustain viable TT structures while generating over time financial returns for investors (EIF, 2016). Moreover, they contribute to ensuring a strong and continuous deal flow in the venture capital market (EIF, 2017). In the field of TT and the commercialisation of research results, the EIF has undertaken a particular market development effort also in geographies with an emerging VC ecosystem. TT activities encourage collaboration between research organisations and industry, the licensing of intellectual property rights, and the creation of start-up businesses and university spin-out companies. As a part of its TT activities, the EIF supports business incubators. In the context of a cooperation with the University of Trier, EIF also contributed to a recent research project on incubator business models in Europe; an overview is provided in a previous ESBFO issue (see Kraemer-Eis, Lang, Torfs and Gvetadze, 2015b).
0
10
20
30
40
50
60
70
2007 2008 2009 2010 2011 2012 2013 2014 2015 2016
bn E
UR
Buyout Replacement capital Rescue/TurnaroundGrowth capital Venture capital Total PE
22
stage VC investments. In the first half-year of 2017, all VC stages contributed to the surge in investments (later stage VC: +32% compared to HY2/2016; start-up stage: +17%, seed stage: +46%).28
Figure 23: VC investment amounts by stage focus
Source: Authors, based on data from Invest Europe (data for HY1/2017 is preliminary)
Box 2: Invest Europe definition of investment stages Seed: Funding provided before the investee company has started mass production/distribution with the aim to complete research, product definition or product design, also including market tests and creating prototypes. This funding will not be used to start mass production/distribution.
Start-up: Funding provided to companies, once the product or service is fully developed, to start mass production/distribution and to cover initial marketing. Companies may be in the process of being set up or may have been in business for a shorter time, but have not sold their product commercially yet. The destination of the capital would be mostly to cover capital expenditures and initial working capital.
Later-stage financing: Financing provided for an operating company, which may or may not be profitable. Late stage venture tends to be financing into companies already backed by VCs. Typically in C or D rounds.
Growth: A type of private equity investment (often a minority investment) in relatively mature companies that are looking for primary capital to expand and improve operations or enter new markets to accelerate the growth of the business.
Buyout: Financing provided to acquire a company. It may use a significant amount of borrowed capital to meet the cost of acquisition. Typically by purchasing majority or controlling stakes.
28 Please note that the investment activities of Business Angels are not included in the Invest Europe statistics, see Box 1. As business angel financing is important for the financing of SMEs and innovation, we present more information in Chapter 4.1.2.
0
1
2
3
HY1
/201
6
HY2
/201
6
HY1
/201
7
bn E
UR
0
1
2
3
4
5
6
2007 2008 2009 2010 2011 2012 2013 2014 2015 2016
bn E
UR
Seed Start-up Later Stage Venture Total VC
23
Box 2 continued:
Rescue / Turnaround: Financing made available to an existing business, which has experienced financial distress, with a view to re-establishing prosperity.
Replacement capital: Minority stake purchase from another private equity investment organisation or from another shareholder or shareholders.
Source: Invest Europe (2015, 2017a)
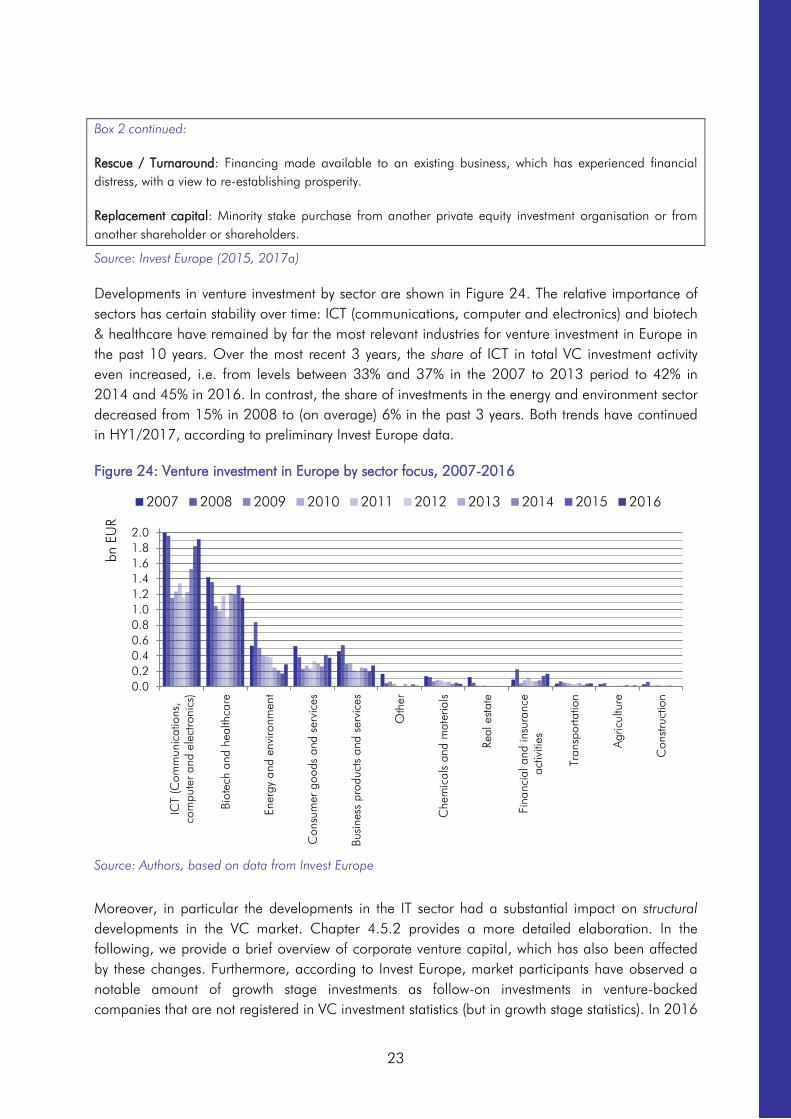
Developments in venture investment by sector are shown in Figure 24. The relative importance of sectors has certain stability over time: ICT (communications, computer and electronics) and biotech & healthcare have remained by far the most relevant industries for venture investment in Europe in the past 10 years. Over the most recent 3 years, the share of ICT in total VC investment activity even increased, i.e. from levels between 33% and 37% in the 2007 to 2013 period to 42% in 2014 and 45% in 2016. In contrast, the share of investments in the energy and environment sector decreased from 15% in 2008 to (on average) 6% in the past 3 years. Both trends have continued in HY1/2017, according to preliminary Invest Europe data.
Figure 24: Venture investment in Europe by sector focus, 2007-2016
Source: Authors, based on data from Invest Europe
Moreover, in particular the developments in the IT sector had a substantial impact on structural developments in the VC market. Chapter 4.5.2 provides a more detailed elaboration. In the following, we provide a brief overview of corporate venture capital, which has also been affected by these changes. Furthermore, according to Invest Europe, market participants have observed a notable amount of growth stage investments as follow-on investments in venture-backed companies that are not registered in VC investment statistics (but in growth stage statistics). In 2016
0.00.20.40.60.81.01.21.41.61.82.0
ICT
(Com
mun
icat
ions
,co
mpu
ter
and
elec
troni
cs)
Biot
ech
and
heal
thca
re
Ener
gy a
nd e
nviro
nmen
t
Con
sum
er g
oods
and
ser
vice
s
Busi
ness
pro
duct
s an
d se
rvic
es
Oth
er
Che
mic
als
and
mat
eria
ls
Real
est
ate
Fina
ncia
l and
insu
ranc
eac
tiviti
es
Tran
spor
tatio
n
Agr
icul
ture
Con
stru
ctio
n
bn E
UR
2007 2008 2009 2010 2011 2012 2013 2014 2015 2016

24
about 10% of the EUR 9.7bn in growth stage investments was received by venture-backed companies, according to Invest Europe. Against the background of the scale up issue in Europe (see, inter alia, chapter 0) this is a positive sign. However, further flagship initiatives to support risk capital – covering various investment stages and sectors – will be necessary (AFME, 2017c). This will also support the creation and growth of innovative enterprises in Europe; Box 3 provides more insight into the value of innovation for EIF-backed startups.
Box 3: The value of innovation for EIF-backed startups Patents are an essential element of innovative SMEs’ toolbox. Patents not only increase start-ups’ competitive position by protecting start-ups’ innovations, they also reduce information asymmetries between a start-up and potential investors and thereby serve as a signalling device to attract external funding. Therefore, a recent EIF Working Paper (Signore and Torfs, 2017) analysed the patenting behaviour of EIF-backed VC start-ups between 1996 and 2012 to document EIF’s support to innovation in Europe and beyond.29
Figure B1.1: EIF Patent portfolio
a) Evolution b) Technology field distribution
(1) Cardiovascular, hematology, traumatology pathologies (2) Neurology, psychiatry pathologies
29 The working paper analysed the number of innovations patented by EIF-backed VC start-ups. The concept of an ‘innovation’ is different from that of a patent in that one innovation can be protected by several, related patents, also referred to as a ‘patent family’.
0
200
400
600
800
1000
1200
1996
1997
1998
1999
2000
2001
2002
2003
2004
2005
2006
2007
2008
2009
2010
2011
2012
Post EIF-backing
While in EIF-portfolio
1%
1%
2%
2%
3%
3%
3%
4%
5%
5%
5%
5%
5%
5%
6%
6%
7%
9%
10%
13%
0.00% 5.00% 10.00% 15.00%
Construction & architecture
IT security, Fintech
Lasers
Cardiovascular, etc (1)
Other pathologies
Alternative energy sources
Nutrition, botanics
Autoimmune diseases
Infectious diseases
Audio & video
Innovative materials
Transports
Mobile technologies
IT network, ubiquitous computing
Broadcasting
Neurology, etc (2)
Medtech
Electronic devices
Metabolic disorders
Oncology
25
Box 3, continued:
EIF’s VC patent production grew at an exponential rate in the years prior to 2001 (see figure B1.1a). The crisis invoked by the Dotcom bubble led to a slowdown in patent growth in the subsequent period. Later, in 2011, an increase in patent renewal fees at the European Patent Office further reduced start up’s incentives to patent. Patent generation predominantly took place in the Life Science and IT sectors, whose investees owned 95 percent of all EIF-supported patents. However, emerging fields like Green Technologies have been gradually gaining importance in recent years. Oncology emerged as the most patented field (see figure BX.1b, for the complete distribution). The inventor teams behind EIF-supported innovation have become increasingly internationalised, so that around 1 in 4 inventor teams had at least 1 international scientist among their members. The share of female scientists in EIF supported research teams remained relatively low throughout the entire period, hovering close to, but never exceeding 20 percent, although significant field- and country-level differences exist.
The spatial distribution of EIF-supported innovations obviously closely reflects the spatial distribution of VC investees, which in turn is highly correlated with Europe’s urbanisation pattern. VC investees seek to protect their innovation mainly in the market in which they are located, which implies that about 4 in 5 innovations are protected on the European continent. Also the Americas are an important market for European VC investees (65 percent).
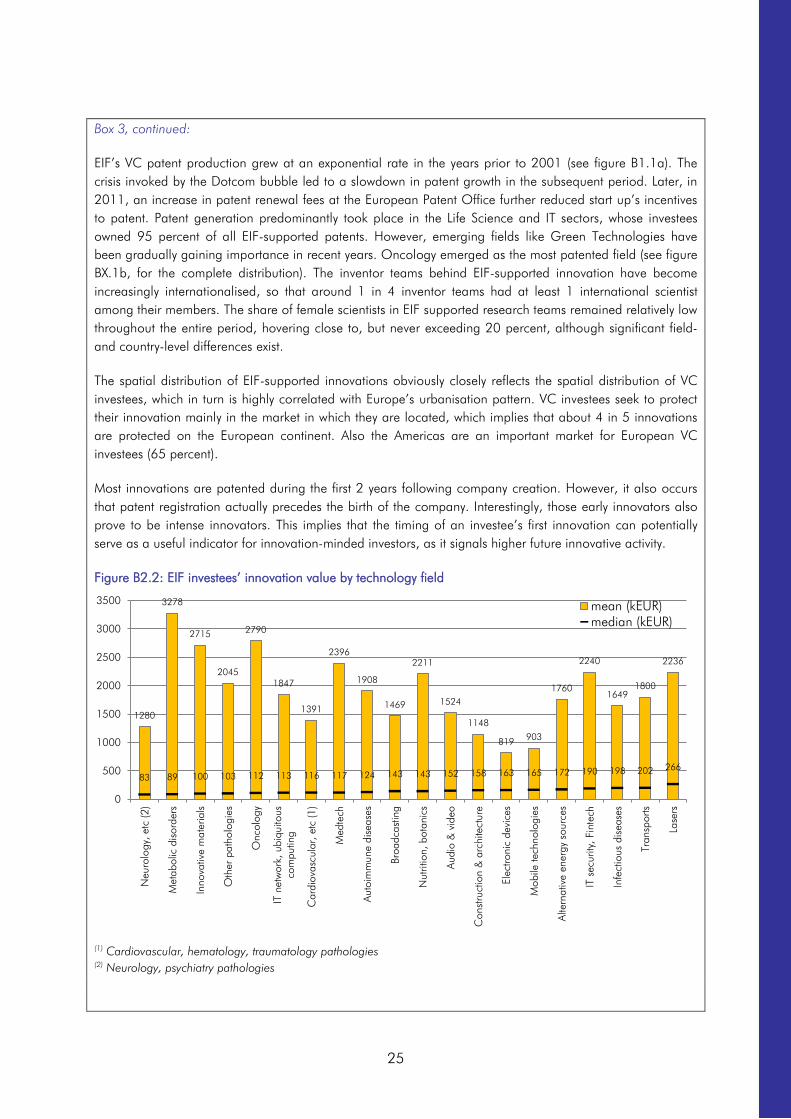
Most innovations are patented during the first 2 years following company creation. However, it also occurs that patent registration actually precedes the birth of the company. Interestingly, those early innovators also prove to be intense innovators. This implies that the timing of an investee’s first innovation can potentially serve as a useful indicator for innovation-minded investors, as it signals higher future innovative activity.
Figure B2.2: EIF investees’ innovation value by technology field
(1) Cardiovascular, hematology, traumatology pathologies (2) Neurology, psychiatry pathologies
1280
3278
2715
2045
2790
1847
1391
2396
1908
1469
2211
1524
1148
819 903
1760
2240
1649 1800
2236
83 89 100 103 112 113 116 117 124 143 143 152 158 163 165 172 190 198 202 266
0
500
1000
1500
2000
2500
3000
3500
Neu
rolo
gy, e
tc (2
)
Met
abol
ic d
isor
ders
Inno
vativ
e m
ater
ials
Oth
er p
atho
logi
es
Onc
olog
y
IT n
etw
ork,
ubi
quito
usco
mpu
ting
Car
diov
ascu
lar,
etc
(1)
Med
tech
Auto
imm
une
dise
ases
Broa
dcas
ting
Nut
ritio
n, b
otan
ics
Audi
o &
vid
eo
Con
stru
ctio
n &
arc
hite
ctur
e
Elec
troni
c de
vice
s
Mob
ile te
chno
logi
es
Alte
rnat
ive
ener
gy s
ourc
es
IT s
ecur
ity, F
inte
ch
Infe
ctio
us d
isea
ses
Tran
spor
ts
Lase
rs
mean (kEUR)median (kEUR)

26
Box 3, continued:
When considering only investees’ first patented innovation, 60 percent are registered before the first investment year, which could imply investors indeed use patents as an investment indicator. However, when considering overall innovation count, the statistics revealed that the vast majority of innovations (86 percent) were registered following the first investment year. This supports the notion of a dual relationship between VC and patenting, where on the one hand patents function as a signalling device to attract VC funding, and on the other hand VC funding enables start-ups to continue innovating and patenting their inventions once funding has been made available.
The second part of the EIF Working Paper estimates the value of 11,597 EIF-supported innovations. Importantly, these findings relate to the private value of patent protection. The private value of a patent is the additional financial return an investee receives from protecting the underlying invention from copy right infringements. As such, our estimates are likely to represent the lower bound of the total social return, which would also include externalities, such as non-appropriable knowledge-spillovers.
The value of individual innovations is characterised by a large degree of heterogeneity, with values ranging from just a few hundred Euros to outliers exceeding EUR 400m, with a median and mean of EUR 140k and EUR 2.2m, respectively. Figure B2.2 illustrates the mean and median of the value of VC investees’ innovations by technology field. Inventions in Life sciences’ core fields, such as oncology, metabolic disorders and infectious disease treatments, all show high average innovation values, but low medians. Conversely, the median invention in technology fields related to ICT and electronics is much more valuable, but the average values are significantly lower. Finally, EIF-supported financing is compared to start-ups’ innovative output, by introducing the concept of an innovation multiplier. This back-of-the-envelope multiplier-analysis reveals that for every Euro of VC financing flowing into EIF-backed start-ups, investees created 2.47 EUR of private value through patenting innovations. Overall, this work evidences the magnitude of EIF’s support to innovation through its VC investments in Europe, and beyond.
Source: Signore and Torfs (2017)
Corporate venture capital
A segment that is not covered under the Invest Europe PE activity statistics are, inter alia, corporate acquisitions outside of dedicated corporate venture programmes. However, corporate venture capital (CVC), which typically can serve both an investing corporation’s financial and strategic goals (e.g. to enhance its innovative capacity or to tap into new markets), has gained importance in recent years.
CVC can take various forms. The most common practice is that a corporate invests through a VC fund, but the number of dedicated CVC units, accelerators and other CVC manifestations has also increased over the past three years (see Mawson et al., 2017). In particular large companies in innovation-intensive industries are active in this field, most prominently in the US (Brigl et al., 2016; Andonov, 2017). For example, companies like Google invest in start-ups in the fields of life science, healthcare, artificial intelligence, robotics, transportation, cybersecurity, and agriculture (Saunders-Calvert, 2017). The relatively low cost of capital has driven more corporates to become part of the game in the last years (Mankins et al., 2017). Available information points to strong growth of the sector. “Global Corporate Venturing”, a media publication and data provider for the

27
CVC industry, estimates that, in 2016, USD 83bn were invested by 965 corporate investors in 1,961 CVC deals worldwide, which would account for two thirds of global venture capital investments, based on a VC definition that is broader than Invest Europe’s (Mawson et al., 2017).30 Despite a stronger focus on contributing to the corporate’s strategic goals instead of pursuing purely financial objectives, CVC investors meanwhile also hold shares in European unicorns (Madhvani et al., 2017).
CVC investment could contribute to the scaling up of European companies with high growth potential to become global leaders. However, “Europe’s corporations are not benefiting from the success of European scale-ups” (Mawson et al., 2017). Only a comparatively small share of high-growth companies‘ finance is provided by CVC investors in Europe. Despite a strong increase over the past three years, there are still fewer EU corporations active in CVC than in the US and Asia, where the CVC activity also exhibited higher growth. In 2016, 201 corporate investors invested in 252 CVC deals in Europe (compared to, e.g., 384 CVC investors and 1,065 deals in the US). Roughly half of the deals of European CVC investors were made in Europe, while the “home bias” is much stronger in the US, where the number of domestic deals account for approximately three quarters of all investments (Mawson et al., 2017). Moreover, European tech companies are often acquired by non-EU buyers, which “raises the issue of whether the missing scale-up phenomenon in Europe could be linked to the lack of serial tech buyers, that is, incumbents in highly innovative and competitive sectors” (Prencipe, 2017).31 However, corporate investors have started to supply more financing to European scale-ups than in the past (Go4Venture, 2017; see also Slush & Atomico, 2017).
The geographical fragmentation of the European VC market
The European VC market has remained fragmented and is geographically far less homogenous than its US counterpart. Whilst the traditional core markets in Europe (Ireland, the UK and Scandinavia) have still a relatively high market activity after the crisis and others have recently caught up (e.g., Hungary), other countries continue to struggle with the size of their domestic VC market which is in no relation to their share in the aggregate GDP of the EU (e.g., Italy); Figure 25 provides an overview of VC investments as a share of GDP for European and selected OECD countries as well as a European average. Sizable differences in the development of the VC markets prevail, and several markets not only suffer from subcritical size but equally from EU’s very fragmented institutional investor base.
However, when looking into the geographic dispersion of European VC activity in more detail, the picture becomes more complex. It seems that VC investors tend to target tech “hubs” rather than certain regions, based on the expertise developed in those hubs. A start-up’s location is likely to
30 Data on corporate venture capital is scarce, in particular for Europe, but, for example, information presented by http://www.globalcorporateventuring.com/ can give a flavour of the market developments. Additional information is also presented in Giese (2014), a thesis prepared in cooperation with EIF RMA in fulfilment of the “Business Administration” M.Sc. at the University of Trier. 31 For example, the enterprises in the Tech Tour Growth 50 list of promising growth equity backed companies have the following characteristics: The average number of active investors per company is 7.5; 52% of the companies have at least one US investor; 48% of the companies have at least one individual investor (BA); the average first funding round size is USD 5.7bn; the average latest funding round size is USD 65.7m; the average valuation is USD 338m. See Tech Tour (2017) for details.
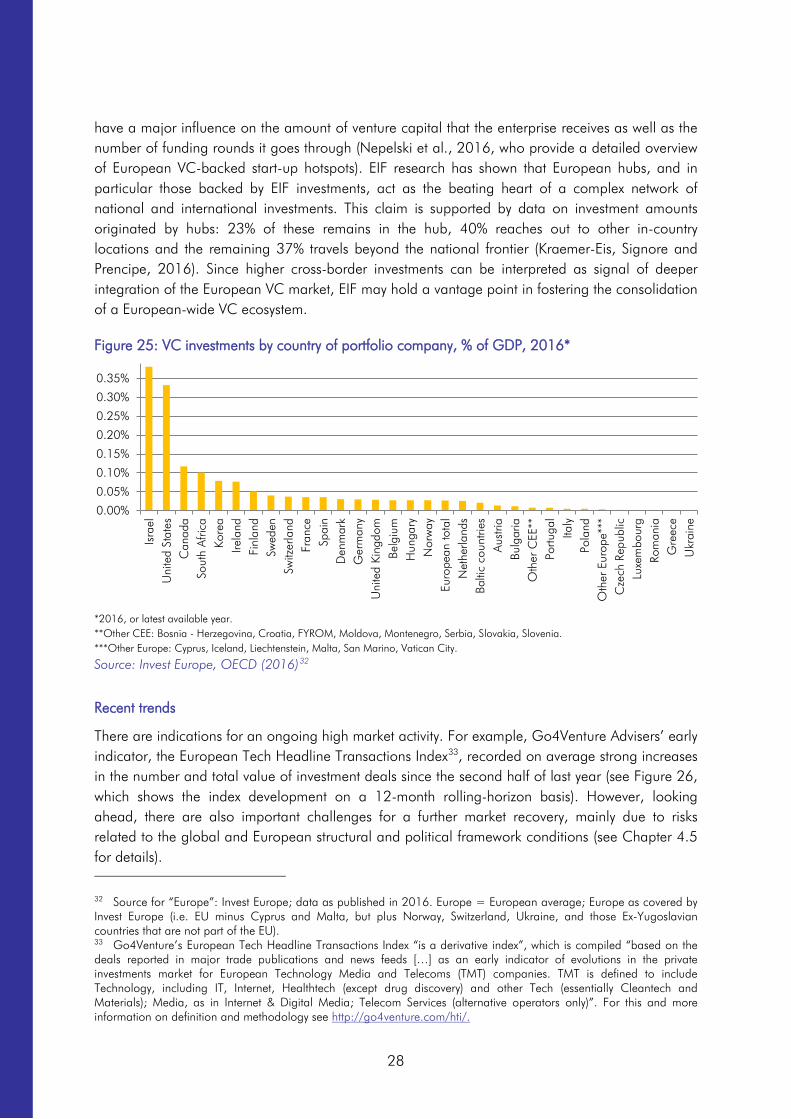
28
have a major influence on the amount of venture capital that the enterprise receives as well as the number of funding rounds it goes through (Nepelski et al., 2016, who provide a detailed overview of European VC-backed start-up hotspots). EIF research has shown that European hubs, and in particular those backed by EIF investments, act as the beating heart of a complex network of national and international investments. This claim is supported by data on investment amounts originated by hubs: 23% of these remains in the hub, 40% reaches out to other in-country locations and the remaining 37% travels beyond the national frontier (Kraemer-Eis, Signore and Prencipe, 2016). Since higher cross-border investments can be interpreted as signal of deeper integration of the European VC market, EIF may hold a vantage point in fostering the consolidation of a European-wide VC ecosystem.
Figure 25: VC investments by country of portfolio company, % of GDP, 2016*
*2016, or latest available year. **Other CEE: Bosnia - Herzegovina, Croatia, FYROM, Moldova, Montenegro, Serbia, Slovakia, Slovenia. ***Other Europe: Cyprus, Iceland, Liechtenstein, Malta, San Marino, Vatican City.
Source: Invest Europe, OECD (2016)32
Recent trends
There are indications for an ongoing high market activity. For example, Go4Venture Advisers’ early indicator, the European Tech Headline Transactions Index33, recorded on average strong increases in the number and total value of investment deals since the second half of last year (see Figure 26, which shows the index development on a 12-month rolling-horizon basis). However, looking ahead, there are also important challenges for a further market recovery, mainly due to risks related to the global and European structural and political framework conditions (see Chapter 4.5 for details). 32 Source for “Europe”: Invest Europe; data as published in 2016. Europe = European average; Europe as covered by Invest Europe (i.e. EU minus Cyprus and Malta, but plus Norway, Switzerland, Ukraine, and those Ex-Yugoslavian countries that are not part of the EU). 33 Go4Venture’s European Tech Headline Transactions Index “is a derivative index”, which is compiled “based on the deals reported in major trade publications and news feeds […] as an early indicator of evolutions in the private investments market for European Technology Media and Telecoms (TMT) companies. TMT is defined to include Technology, including IT, Internet, Healthtech (except drug discovery) and other Tech (essentially Cleantech and Materials); Media, as in Internet & Digital Media; Telecom Services (alternative operators only)”. For this and more information on definition and methodology see http://go4venture.com/hti/.
0.00%
0.05%
0.10%
0.15%
0.20%
0.25%
0.30%
0.35%
Isra
elU
nite
d St
ates
Can
ada
Sout
h A
frica
Kore
aIre
land
Finl
and
Swed
enSw
itzer
land
Fran
ceSp
ain
Den
mar
kG
erm
any
Uni
ted
King
dom
Belg
ium
Hun
gary
Nor
way
Euro
pean
tota
lN
ethe
rland
sBa
ltic
coun
tries
Aus
tria
Bulg
aria
Oth
er C
EE**
Portu
gal
Italy
Pola
ndO
ther
Eur
ope*
**C
zech
Rep
ublic
Luxe
mbo
urg
Rom
ania
Gre
ece
Ukr
aine

29
Figure 26: European tech headline investment transactions (12-month rolling horizon)34
Source: Authors’ calculations, based on Go4Venture Advisers data
4.1.2 Business angels
As already mentioned, the Invest Europe activity data cover fundraising, investment and divestment from PE and VC firms in Europe. Certain segments outside the definition that Invest Europe applies for the collection of its activity statistics are not covered, e.g. business angels’ activities. However, business angel financing has gained importance in recent years as a financing source for early-stage start-ups.
Business Angels (BAs) represent an important class of private equity investors, primarily consisting of high-net-worth individuals, usually with business or managerial experience.35 According to a study by Slush & Atomico (2016), 22% of all tech-related business founders invest as angels, with repeat entrepreneurs more active than first-time founders. BAs tend to invest their own money, either individually or in formal or informal syndicates, in businesses which are not publicly traded, commonly in exchange for convertible debt or ownership equity. (See, also for a general description of BA financing, Kraemer-Eis and Schillo, 2011; OECD, 2016; OECD, 2011; BAND, 2016; a more recent overview is provided in OECD, 2017b.)
In a recent European Commission survey among European BAs, the large majority of respondents were male (89%) and the average age was 55 years (European Commission, 2017c). However, in Central and Eastern Europe (CEE), BAs tend to be younger (average age of 43 years) and the share of female BAs is larger. The average period of respondents’ investment experience as a BA was 7.5 years; however, there are large differences by country. Among the surveyed BAs 98% hold at least a bachelor’s degree (or equivalent) and the vast majority (87%) have experience in senior management.
34 In the two lines in the diagram, each data point shows the sum of the total value of deals (blue line) and the sum of the total number of deals (yellow line) observed in the month to which the respective data point is related and over the 11 months prior to that data point. For example, in July 2013, the total value of deals observed during the period from August 2012 to July 2013 amounted to EUR 4.1bn, and a total number of 480 deals were observed during the same period. 35 See Tech Tour (2017) for outstanding examples of European entrepreneurs that have turned into BAs, backing promising growth equity backed companies.
300
600
900
1200
2
6
10
14Ja
n-11
Apr
-11
Jul-1
1
Oct
-11
Jan-
12
Apr
-12
Jul-1
2
Oct
-12
Jan-
13
Apr
-13
Jul-1
3
Oct
-13
Jan-
14
Apr
-14
Jul-1
4
Oct
-14
Jan-
15
Apr
-15
Jul-1
5
Oct
-15
Jan-
16
Apr
-16
Jul-1
6
Oct
-16
Jan-
17
Apr
-17
Jul-1
7
Oct
-17
bn E
UR
value (lhs) number (rhs)

30
BAs differ from VC funds, which primarily invest third parties’ funds (e.g. institutional investors’). Angel-financed companies are typically in earlier stages of their development and the holding periods of BA investments are typically shorter than the corresponding periods in VC funds (Kraemer-Eis and Schillo, 2011). BAs’ transaction costs are relatively low, which allows them to invest on a lower scale. They are geographically more dispersed than VCs and often invest in local markets. Moreover, BAs tend to be very ‘hands-on’ investors, providing also services beyond financing (e.g. mentoring, business advice and access to networks), hence they can play a central role in the start-up ecosystem, in particular for innovative firms (OECD, 2016). According to several studies, BAs have a positive impact on the growth of the firms they invest in, their performance, and survival (Lerner et al., 2015; OECD, 2016). The success of the investees seems to be strongly based on the services beyond financing that BAs provide (Kerr et al., 2011). There is evidence that BAs are relatively resilient to changing market cycles (OECD, 2016), and angel investments in early-stage high-growth companies tended to increase during the crisis, as VC funds migrated to less risky investments (Kraemer-Eis, Lang and Gvetadze, 2013).
An increasing majority of BAs co-invest with other early stage investors in order to diversify risks (OECD, 2016) and/or to improve their skillset and experience (Capizzi, 2015). Moreover, vehicles like crowdfunding platforms are used more often by BAs – in particular by younger and less experienced ones – as tools to find investment opportunities, thereby allowing them to make investments in a wider geographical area (OECD, 2016).
However, there are difficulties in measuring the size of the business angel community, the main ones being identification and definition. BAs often stay anonymous and the details on their investments are rarely disclosed. Further, nothing can prevent an individual from identifying oneself as a ‘virgin’ angel, although he/she may have never actually invested. Others may have occasionally acted as angels, but are no longer looking for investment opportunities. Moreover, the so called “invisible market” makes a precise estimation of the angel market difficult. There are studies that the invisible part of the market is up to seven times greater than the visible part (CSES, 2012), while others estimate even a multiplier of around ten (see, e.g., EBAN, 2014 and 2017). Such difficulties must be borne in mind when describing the market.
Currently there is no robust and consistent data available on the Business Angel market in Europe; published data is typically imprecise and can only be used as indication or very rough estimate (see also OECD, 2017a; OECD, 2017b). For the visible market segment, data is collected by angel associations from angel groups and networks. In addition, ad-hoc surveys contribute to increasing the available level of information on BAs in Europe (see, for example, European Commission, 2017c). In the following, we use such statistics, as currently no better information is available. However, it is important to note the shortcomings of these statistics, which we take from the related EBAN disclaimer that we show in Box 4. Information on angel investing in different European countries can also be found in BAE (2015).

31
Box 4: Introductory information on EBAN data Due to its nature, the early stage investment market and especially the BA segment is difficult to quantify. An important part of the total investments is informal and not publicly reported. The estimate of the percentage of the invisible market is based on a study commissioned by the European Commission to CSES about the Business Angels market in Europe. In some countries, the deals done through the ‘visible market’ (BANs, Federations) are not published, so in some cases the estimates may not correspond to the exact amounts invested by BAs. However, EBAN matched information from different sources, to validate the estimates for each particular market in order to have a higher degree of confidence on the data that is published.
Knowing the underlying limitations, the main objective of the EBAN statistics is to provide a better understanding of the European early stage market. The EBAN publication comprises information collected through direct surveys from BA networks, national federations and other early stage investors. Additional data were collected from different sources, namely Zephyr, Crunchbase, market reports, EC and national publications, press articles and research papers, as well as other early-stage actors in Europe.
Source: EBAN (2017)
At a European level, the European Business Angel Network (EBAN), reported an increase in BA investment by 10%, compared to the year before, to a record amount of EUR 6.7bn in Europe in 2016 (EBAN, 2017; more recent data is not yet available). However, this number is based on the assumption that the visible market, for which EBAN reports investments of EUR 667m, represents 10% of the whole market.36 The estimated number of investments increased by 16% to 38.2k. The number of BAs is estimated at 312.5k, which represents an increase by 3% compared to 2015. The number of BA networks (BANs) in Europe was at 474 in 2016. From 2003 to 2012 the number of BANs had grown at an average rate of 17%, but began to level off in 2013. Since 2013, the number has remained stable, growing only by 1.3% from 2013 till 2016, which demonstrates a certain consolidation in the market as networks became more formalised (EBAN, 2017).
Most of the BA activity within the EU is happening in the UK, Spain, Finland, Germany and France. When compared to GDP, total BA investment amounts are relatively high in Estonia and Finland. In 2016 only 8% of BA deals (most recent investments) targeted companies outside their home country, but a considerable share of BAs stated that they would invest abroad if legal and fiscal legislations facilitated such activities (European Commission, 2017c). In some countries BA co-investment funds, tax break or grant schemes do not support or not even allow investment abroad (EBAN, 2016, 2017).
In 2016 investments per individual European angel and funding round varied between EUR 10k and EUR 500k with its average increasing by 13% to EUR 22.5k (EBAN, 2017). In contrast, the average amount invested per company decreased by 10% to EUR 166k in 2016, following an average annual growth of 6% over the preceding two years. This is well in line with the results of
36 The assumption that visible BA investments constitute a share of 10% of the whole (visible plus invisible) BA market is based on CSES (2012) and was also used in EBAN statistics for previous years. The visible market encompasses activity undertaken by investors gathered in BA networks and either having a direct relation with EBAN or those reporting through a federation. It also comprises networks from which access to information is limited but its existence and activity is known by other players of the industry (EBAN, 2017).

32
other studies (e.g. CSES (2012)), which estimated that BAs provided on average around EUR 100k to 200k per deal. In the US, investment per deal is much higher, i.e. at 330k USD (EBAN, 2017).
ICT and other technological sectors continued to be by far the most attractive target sector for BA deals (European Commission, 2017c). Within the Tech sector, FinTech, BioTech and MedTech receive most investment given their strong growth and scalability potential (EBAN, 2017). With regard to the investee companies’ development stages pre-seed and seed phase companies receive the largest attraction.
While co-investments with other BAs are still the most common deal form, the relevance of investments alongside early-stage funds has increased (EBAN, 2017; see also European Commission, 2017c). In some countries, governments created such funds with favourable terms for BAs’ co-investment, inter alia supported by the European Angel Fund (EAF), an initiative advised by the EIF, which provides equity to BAs and other non-institutional investors for financing innovative companies in the form of co-investments.37 Syndication among angels has also increased, inter alia due to co-investment schemes, in which the threshold amounts are relatively high for a single BA (EBAN, 2016, 2017).
As explained, the invisible part of the market is dominant – therefore, data availability for general statements is limited. However, it can be assumed that BAs behaviour did not move in the same direction like bank lending or venture capital supply during the crisis (OECD, 2017a). Mason and Harrison (2013), e.g., showed for the UK that angel investment activity has held up since the onset of the crisis and they emphasise the economic significance of this market segment. Moreover, they underline the need for ongoing government support. However, policy measures have to be well targeted to the specific nature of BA investors. For example, based on the assumption that the supply of BA capital depends on investors who have already been successful entrepreneurs, Hellmann and Thiele (2017) identify a rationale for funding policies (a tax credit in their model) that allow entrepreneurs to retain a larger ownership fraction and create more entrepreneurial wealth in order to increase the future supply of capital and to create a long-term impact on entrepreneurial activity. Findings by Hellmann, Schure and Vo (2015) also suggest that public support for start-up financing should go beyond an exclusive support of (formal) venture capital, because additional policy measures for angel investors “would reach a different set of entrepreneurial companies that develop outside of the reach of venture capitalists”. Hence, “the central role of BAs is increasingly recognised by policy makers […], and initiatives to support angel activities have expanded in recent years as part of a broader shift towards policies that aim to make equity-type instruments more widely available for start-ups and SMEs” (OECD, 2016). According to the OECD (2016), public-private co-investment schemes are able to catalyse the private market, “but only if the existing angel market is sufficiently well developed, so that a sufficient number of investor-ready deals can be financed and the government does not have to be overly engaged in matching supply and demand for early-stage equity”. However, despite initiatives for more policy support and better framework conditions, including under the CMU action plan (see Kraemer-Eis and Lang, 2017, for details), the market is still underdeveloped. It is estimated that US BAs “invest in twice as many US companies as their EU counterparts in EU
37 See www.eif.org/eaf for more information about the EAF.

33
businesses” and “the size of US angels-backed transactions is approximately 1.7 times higher than EU transactions” (AFME, 2017c). A recent overview of barriers to BA financing in Europe and recommendations how these could be mitigated are provided in AFME (2017c).
4.2 Fundraising activity
In 2016, total funds raised by PE firms located in Europe strongly increased by 38%, compared to the year before, to EUR 73.8bn, which constitutes the highest value since 2008 (see Figure 27). This was mainly due to the 71% increase of the amount raised by funds with a focus on buyouts38 (EUR 56.3bn), but also fundraising in the growth capital segment slightly increased (+1.2% to EUR 3.9bn). In contrast, reduced fundraising amounts were reported for funds focussing on mezzanine capital (–81% to EUR 0.7bn) and for funds with a generalist focus (–17% to EUR 6.5bn). In the first half-year of 2017, total PE fundraising increased by 37% compared to HY2/2016 to an amount of EUR 50.4bn, which is even slightly above the pre-crisis levels of 2007 and 2008. This strong development was again largely induced by rising activities in the buyout market segment (+33%), but fundraising in the other sectors increased as well considerably.
Figure 27: Amounts raised by PE funds located in Europe
Note: Incremental amounts raised during period. Data for HY1/2017 is preliminary
Source: Authors, based on data from Invest Europe
Box 5: Invest Europe’s definitions of fund stage foci Buyout fund: Funds acquiring companies by purchasing majority or controlling stakes, financing the transaction through a mix of equity and debt.
Early-stage fund: Venture capital funds focused on investing in companies in the early stages of their lives.
Generalist fund: Funds investing in all stages of private equity.
Growth fund: Funds that make private equity investments (often minority investments) in relatively mature companies that are looking for primary capital to expand and improve operations or enter new markets to accelerate the growth of the business.
38 Box 5 provides an overview of the Invest Europe fund stage foci definitions.
82.3 82.6
20.4 25.5
42.4 27.0
59.1 52.5 53.5
73.8 37.0 36.7
50.4
0
10
20
30
40
50
0
20
40
60
80
100
2007 2008 2009 2010 2011 2012 2013 2014 2015 2016 HY1/2016
HY2/2016
HY1/2017
bn E
UR
bn E
UR annual (lhs) half-yearly (rhs)

34
Box 5, continued:
Later-stage fund: Venture capital funds providing capital for an operating company which may or may not be profitable. Typically in C or D rounds.
Mezzanine fund: Funds using a hybrid of debt and equity financing, comprising of equity-based options (such as warrants) and lower-priority (subordinated) debt.
Venture fund: Venture capital funds focused on both early and later stage investments.
Source: Invest Europe (2015, 2017a)
In the venture capital segment, fundraising increased by 17% to EUR 6.4bn (see Figure 28). This was the highest amount since 2008. While funds with a focus on the early stage (–17% to EUR 1.5bn) and later stage venture (–70% to EUR 0.3bn) raised less volumes, a remarkable increase was recorded for venture funds with a focus on both early and later stage investments (+65% to EUR 4.7bn). In the first half-year of 2017, VC fundraising was at EUR 4.2bn, which is the second highest level since the start of the time series in 200739. Final closings (amounts raised since inception) reached a record high (EUR 3.1bn) in HY1/2017.
Figure 28: Amounts raised by VC funds located in Europe
Note: incremental amounts raised during period; lhs = annual amounts; rhs = half-yearly amounts. Data for HY1/2017 is preliminary
Source: Authors, based on data from Invest Europe
In 2016, the average VC fund size has remained relatively steady at EUR 85m (see Figure 29), i.e. only 0.4% lower than the record high reached in 2015, according to the Invest Europe statistics, which started to report VC fund sizes in 2007. However, while the average sizes of funds focussing either on the early stage (–37% to EUR 49m) or on later stage venture (–43% to EUR 128m) decreased substantially, those funds with a focus on both stages showed a further increase by 57% to EUR 106m. The number of final fund closings remained almost stable at 45 in 2016 (46 in 2015). Final closings of funds with a primary focus on the early or later stage decreased, while
39 Invest Europe started publishing fundraising by fund stage focus in 2007.
3.0
1.7 1.1 0.9
1.7 1.7 1.0
2.2 1.8 1.5
0.8 1.3 0.3 0.4 0.8 0.2 0.5 0.2 0.9 0.3
3.9 3.0
1.8 2.3 1.9 1.8
2.3 2.6 2.8
4.7
1.2 0.3
1.0 0.3 0.01 0.1
3.2
1.5
3.1
7.7
6.1
3.2 3.6 4.5
3.7 3.8
5.1 5.5
6.4
4.6
1.8
4.2
0
1
2
3
4
0
2
4
6
8
2007 2008 2009 2010 2011 2012 2013 2014 2015 2016 HY1/2016
HY2/2016
HY1/2017
bn E
UR
bn E
UR
early-stage later stage venture venture all stages focus total venture
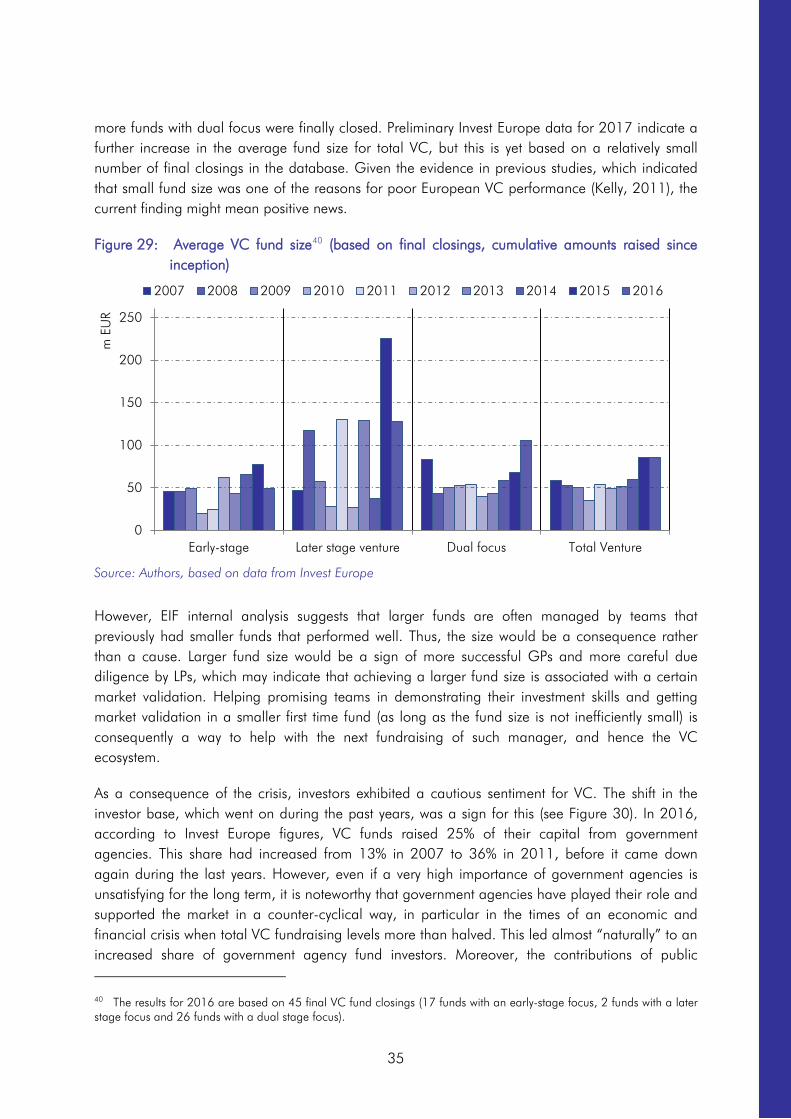
35
more funds with dual focus were finally closed. Preliminary Invest Europe data for 2017 indicate a further increase in the average fund size for total VC, but this is yet based on a relatively small number of final closings in the database. Given the evidence in previous studies, which indicated that small fund size was one of the reasons for poor European VC performance (Kelly, 2011), the current finding might mean positive news.
Figure 29: Average VC fund size40 (based on final closings, cumulative amounts raised since inception)
Source: Authors, based on data from Invest Europe
However, EIF internal analysis suggests that larger funds are often managed by teams that previously had smaller funds that performed well. Thus, the size would be a consequence rather than a cause. Larger fund size would be a sign of more successful GPs and more careful due diligence by LPs, which may indicate that achieving a larger fund size is associated with a certain market validation. Helping promising teams in demonstrating their investment skills and getting market validation in a smaller first time fund (as long as the fund size is not inefficiently small) is consequently a way to help with the next fundraising of such manager, and hence the VC ecosystem.
As a consequence of the crisis, investors exhibited a cautious sentiment for VC. The shift in the investor base, which went on during the past years, was a sign for this (see Figure 30). In 2016, according to Invest Europe figures, VC funds raised 25% of their capital from government agencies. This share had increased from 13% in 2007 to 36% in 2011, before it came down again during the last years. However, even if a very high importance of government agencies is unsatisfying for the long term, it is noteworthy that government agencies have played their role and supported the market in a counter-cyclical way, in particular in the times of an economic and financial crisis when total VC fundraising levels more than halved. This led almost “naturally” to an increased share of government agency fund investors. Moreover, the contributions of public 40 The results for 2016 are based on 45 final VC fund closings (17 funds with an early-stage focus, 2 funds with a later stage focus and 26 funds with a dual stage focus).
0
50
100
150
200
250
Early-stage Later stage venture Dual focus Total Venture
m E
UR
2007 2008 2009 2010 2011 2012 2013 2014 2015 2016

36
investors to VC funds increased not only in relative but also in absolute terms, i.e. from an average EUR 0.6bn p.a. in 2007-2009 to EUR 1.0bn thereafter. It remains to be seen if the percentages reported for government agencies in 2015 and 2016 will be confirmed in later issues of the Invest Europe statistics, i.e. when the relatively high shares of yet unclassified fund investors will be more properly identified.
Theoretical evidence and EIF’s own research suggests that public VC support is relatively well targeted and achieving positive effects in Europe. In a study of investment patterns of different VC investor types, Bertoni, Colombo and Quas (2015) find that governmental VC (GVC) investors in Europe specialise in investments that do not attract private investors due to high information asymmetries and high failure risk, i.e. in particular in young, small seed-stage companies, and in certain sectors such as biotechnology and pharmaceuticals, in which time to market are long and new product development is very costly. This indicates that “in Europe, GVC has filled the entrepreneurial financing gap left by private VC investors”.
In order to put EIF’s activity in context, some calculations can be taken into account that were performed for a recent EIF Working Paper by Kraemer-Eis, Signore and Prencipe (2016), which shed more light on the impact of EIF on the VC ecosystem. The authors estimate, inter alia, that the VC investment activity backed by EIF represented 41% of total VC investments in Europe in 2014 (29% in 2007). The share directly attributable to EIF amounts to 10% (5% in 2007), which hints to the significant leverage that characterises EIF-backed investments. With regard to fundraising, the authors estimate that volumes backed by EIF in 2014 amount to 45% of the overall volumes collected by European VC investors (36% in 2007), against a share directly attributable to EIF totalling 12% (5% in 2007). A longer summary is provided in a previous ESBFO edition (Kraemer-Eis, Lang, Torfs and Gvetadze, 2016a).
Moreover, EIF is supporting a relatively high number of first-time teams, and many VC funds in which EIF invested successfully managed to close with their full target size. It is also important to see that many of the more established VC funds being the pillars of Europe's VC market today would not be there without having been kick-started by EIF. This clearly indicates EIF’s catalytic role for European VC, rather than a crowding-out effect. This view was confirmed in an Unquote Intelligence (2014) survey among General Partners (GPs) and Limited Partners (LPs), which found that “the overriding benefit of [public funding bodies’] (PFB) money is the crucial role it plays in attracting other investors”. Moreover, “[h]aving PFB money in a fund does not deter other LPs from committing”.

37
Figure 30: Investor base: Share of government agencies in VC fundraising41
Source: Authors, based on data from Invest Europe
4.3 Divestment activity
Over the past years, the exit markets have shown remarkable strength. From 2013 to 2015, total PE divestments of European portfolio companies rose to the largest amounts ever reached in the Invest Europe statistics. Despite a 15% drop to EUR 38.5bn in 2016, divestments were still at relatively high levels (see Figure 31).42 In the first half-year of 2017, PE divestments amounted to EUR 19.8bn (+5% compared to HY1/2016).
41 % of incremental amounts raised during year (in contrast to final closings only). Note: Excludes capital gains. Unclassified sources of funds have been extrapolated. The data in this diagram (as well as in others) may differ from those in previous ESBFO issues, because Invest Europe released its statistics for the first time based on a new database in 2017. All data since 2007 was restated and complemented with additional information. 42 Invest Europe statistics show divestment amounts at cost, i.e. the total amount divested is shown as the total amount that had been previously invested, hence not including any profit on the investment.
0%
5%
10%
15%
20%
25%
30%
35%
40%
2007 2008 2009 2010 2011 2012 2013 2014 2015 2016
Government agencies
Family offices & Privateindividuals
Corporate investors
Insurance companies
Banks
Pension funds
Fund of funds & Other assetmanagers
Academic Inst. / Endowments/ Foundations
Capital markets
Sovereign wealth funds
012345678
2007 2008 2009 2010 2011 2012 2013 2014 2015 2016
bn E
UR New funds raised
(excluding capital gains)
Classified
Unclassified
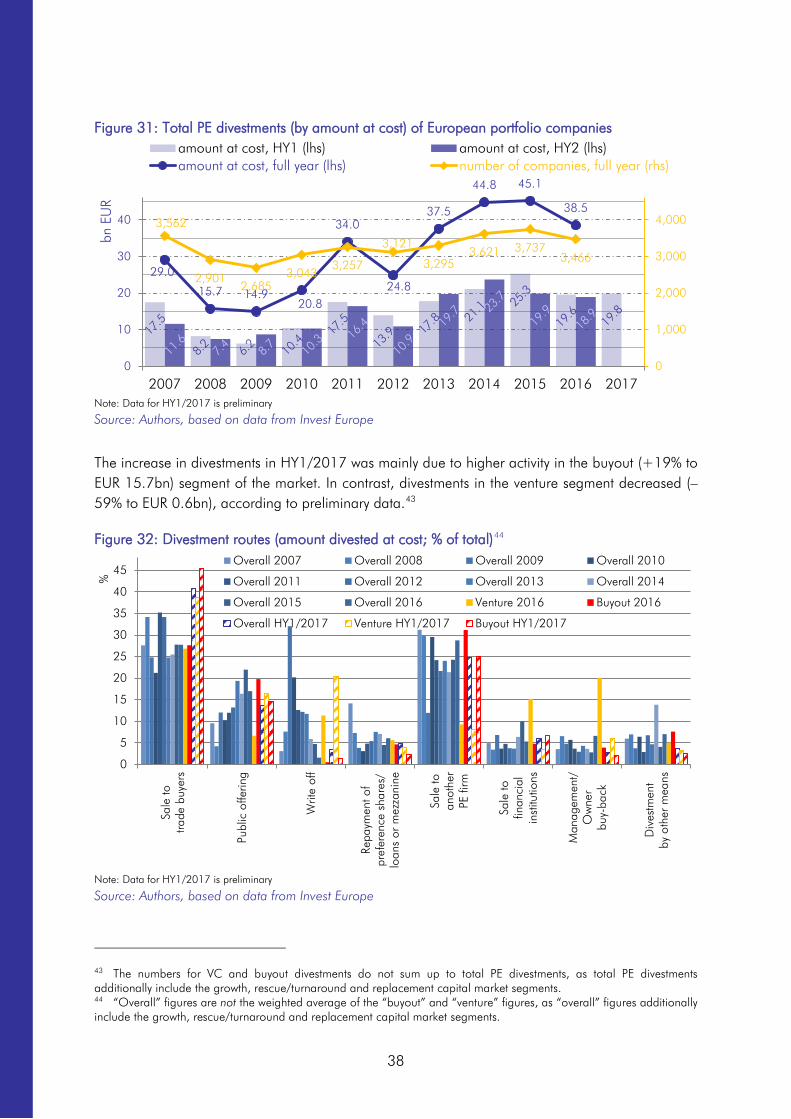
38
Figure 31: Total PE divestments (by amount at cost) of European portfolio companies
Note: Data for HY1/2017 is preliminary
Source: Authors, based on data from Invest Europe
The increase in divestments in HY1/2017 was mainly due to higher activity in the buyout (+19% to EUR 15.7bn) segment of the market. In contrast, divestments in the venture segment decreased (–59% to EUR 0.6bn), according to preliminary data.43
Figure 32: Divestment routes (amount divested at cost; % of total)44
Note: Data for HY1/2017 is preliminary
Source: Authors, based on data from Invest Europe
43 The numbers for VC and buyout divestments do not sum up to total PE divestments, as total PE divestments additionally include the growth, rescue/turnaround and replacement capital market segments. 44 “Overall” figures are not the weighted average of the “buyout” and “venture” figures, as “overall” figures additionally include the growth, rescue/turnaround and replacement capital market segments.
29.0
15.7 14.9 20.8
34.0
24.8
37.5
44.8 45.1
38.5 3,562
2,901 2,685
3,043 3,257
3,121
3,295 3,621 3,737
3,466
0
1,000
2,000
3,000
4,000
0
10
20
30
40
2007 2008 2009 2010 2011 2012 2013 2014 2015 2016 2017
bn E
UR
amount at cost, HY1 (lhs) amount at cost, HY2 (lhs)amount at cost, full year (lhs) number of companies, full year (rhs)
0
5
10
15
20
25
30
35
40
45
Sale
totra
de b
uyer
s
Publ
ic o
fferin
g
Writ
e of
f
Repa
ymen
t of
pref
eren
ce s
hare
s/lo
ans
or m
ezza
nine
Sale
toan
othe
rPE
firm
Sale
tofin
anci
alin
stitu
tions
Man
agem
ent/
Ow
ner
buy-
back
Div
estm
ent
by o
ther
mea
ns
%
Overall 2007 Overall 2008 Overall 2009 Overall 2010
Overall 2011 Overall 2012 Overall 2013 Overall 2014
Overall 2015 Overall 2016 Venture 2016 Buyout 2016
Overall HY1/2017 Venture HY1/2017 Buyout HY1/2017

39
A closer look at the details of the Invest Europe divestment statistics shows the remarkable strength of the exit markets in the past years. As regards overall PE, the relative importance of write-offs continuously decreased from 2011 to 2016. Despite an increase in HY1/2017, the share of write-offs over total divestments was still below the 2015 values (see Figure 32). Trade sales and sales to another PE house together account for far more than half of the total divestment amounts. The share of public offerings decreased in 2016 and HY1/2017, but is still at higher levels than during the years 2007 to 2012.45 In the VC market, the relative importance of write-offs had also continuously declined since its peak in 2012, but increased in HY/2017.
Box 6: Invest Europe definition of exit routes First Divestment following Flotation (IPO): The sale or distribution of a private company’s shares to the public for the first time by listing the company on the stock exchange.
Management/ Owner buy-back: The buyer of the company is its management team.
Repayment of preference shares/ loans or mezzanine: If the private equity firm provided loans or bought preference shares in the company at the time of investment, then their repayment according to the amortisation schedule represents a decrease of the financial claim of the firm into the company, and hence a divestment.
Sale of quoted equity post flotation: It includes sale of quoted shares only if connected to a former private equity investment, e.g. sale of quoted shares after a lock-up period.
Sale to another private equity firm: The buyer of the portfolio company is a private equity firm.
Sale to financial institution: A financial institution is an entity that provides financial services for its clients:
- Depositary Institutions: deposit-taking institutions that accept and manage deposits and make loans, including banks, building societies, credit unions, trust companies, and mortgage loan companies
- Contractual Institutions: Insurance companies and pension funds
- Investment Institutes other than direct private equity firms.
Trade sale: The sale of a company's shares to industrial investors.
Write-off: The value of the investment is eliminated and the return to investors is zero or negative.
Source: Invest Europe (2015, 2017a)
Besides that, EIF insight suggests that the number of “fast” exits on the VC side (less than 2 years holding period) have tended to increase over recent years. This could be explained by fund managers tending to privilege a quick divestment due to still high valuations, combined with prevalent downside risks, instead of longer term buy and build strategy. Recent updates for 2017 however indicate a potential slowdown of this trend, with a return to longer holding periods of exited companies. This remains to be confirmed in future analyses though.
45 In the Invest Europe data, the category “Public Offerings” includes first divestment following flotation (IPO) and sale of quoted equity post flotation.
40
4.4 Lower mid-market and hybrid debt/equity finance: An important market segment
Following EIF’s definition (see EIF, 2016), the lower mid-market (LMM) covers fund strategies targeting equity and mezzanine investments at growth and buyout stages with a particular focus on SMEs and mid-caps. EIF provides its core LMM products (equity, hybrid debt-equity46 and private debt) as alternative sources of long-term finance to established businesses and later-stage technology companies (see Box 7 for more information on private debt financing). In the current market context, a full range of equity products combined or not with a debt component continue to prove successful, particularly for shareholding reorganisation, organic and external growth, restructuring or expansion.
In 2017 the EIF has been observing the continuation of the trend already identified during the past two years insofar as the lower-mid and mezzanine markets are concerned: relatively high levels of confidence in the business climate, availability of a diverse set of investors to allocate liquidity to the private equity market, a growing deal flow and still high exit activity, effectively confirming the recovery path observed since 2015. As a matter of fact, record distributions from private equity funds in recent years led to high levels of investor satisfaction, with much of the capital returned to investors being redeployed in private equity. This has led, together with a backdrop of strong European macroeconomic data, to a very active fundraising environment, where managers with a sound track record are able to complete the fundraising of funds in a shorter timeframe than observed before. Nevertheless, first time teams are having more difficulties fundraising, leading to capital being more concentrated. However, as mentioned in chapters 4.1 and 4.2, the PE market in general and the mid-market in particular continue to be prone to the risk of high valuations and potential overheating, which is caused by the ample liquidity in the markets. Unsurprisingly, in this environment the leverage used in European equity capital transactions has increased in the third quarter of 2017 (Argos Soditic and Epsilon Research, 2017). However, experienced managers are still able to invest in less visible mid-market opportunities and to provide added value in order to have companies becoming more attractive and sustainable. Moreover, in a recent Coller Capital survey among LPs, lower mid-market buyouts and growth/expansion capital ranked highest in terms of expected high-quality fund investment opportunities for the coming 3 years among the different strategies targeting PE’s developed markets (Coller Capital, 2017).47
46 Hybrid debt-equity/mezzanine finance is a diverse asset class in between traditional senior debt and equity instruments. According to the OECD (2014b), “this form of finance has not received as much public attention as venture capital or specialised exchanges for SMEs, but it holds potential to respond to […] critical problems in SME finance.” 47 Coller Capital’s Global Private Equity Barometer is published twice-yearly and intends to give an overview of the plans and opinions of institutional PE investors (LPs) based in North America, Europe and Asia-Pacific (incl. the Middle East). The 27th edition (winter 2017-18) of the Global PE Barometer captured the views of 110 PE investors from round the world (of which 40% are based in Europe), surveyed in September-October 2017.

41
Box 7: Private debt and debt funds48 Private debt and debt funds have gained importance as an alternative asset class for investors and a new financing source for SMEs and mid-caps in recent years. Similar to private equity (PE), “specialised loan funds” operate through a manager, typically unconnected to a banking institution, which originates SME lending opportunities pursued through a fund and managed similarly to a PE operation, except that it provides funding in the form of debt, rather than equity, finance. These managers or “alternative lenders” are a diverse and expanding group that includes asset managers, subsidiaries of larger financial institutions, and even, more recently in the US, Fintech enterprises.
Private debt has both, similarities and differences, with bank financing. Commercial banks tend to operate on the low risk (low yield) end of the spectrum, while alternative lenders cover the entire spectrum. Private debt markets are better placed to deal with liquidity risks than banks, due to the latter’s exposure to withdrawals of bank deposits in difficult market conditions. Private debt also deals better with funding risks, through the imposition of long-term funding commitments for investors or “lock-up periods” which restrict redemption of invested funds. However, firms tend to blend these two sources of finance to close their financing gaps, indicating that banks can utilise alternative lenders to meet customers’ financing needs without depleting their own resources or increasing their risk exposure. In addition, this allows banks to provide less capital-intensive products and services, which is an added source of revenue, as well as to retain the primary customer relationship.
Between 2006 and 2015, the global private debt industry nearly tripled in size; with assets under management increasing from USD 152bn to USD 440bn. Almost one-third of this market consisted of “dry powder” (unused capital commitments), meaning that substantial funds for new investments are at hand. This market has expanded steadily, with no visible slackening during the crisis. The largest single market is still the US (around 60% of the world total), but Europe exhibits the fastest growth, as its world market share has grown from 10% in 2010 to 30% at the end of 2015. Within Europe, the largest market is the UK, but substantial activity is also observed in France and Germany; some growth has recently also been observed in Italy, although the activity remains relatively sparse. The growth of this market segment has greater significance for the supply of capital to SMEs in Europe than in the US, where several channels for alternative debt are already operating. For similar reasons, Italy and Spain can be seen as markets with better than average prospects for expansion.
The private debt market which originally arose as an appendage of the PE market is becoming a stand-alone market section. Until recently, virtually all of the private debt market was “sponsored”, which means that it was the leverage component of a PE operation containing both equity (provided by a PE fund) and debt. However, in the past two years the sponsor-less share of total transactions has been rising. In the third quarter of 2016, the sponsor-less portion of total transactions in Europe stood at 27%, but many analysts expect further increases in sponsor-less deals as this part of the market becomes better known. The private debt market could conceivably compete with more traditional parts of the debt market, although the high levels of fees in this market constitute a barrier to expansion at this time.
In Europe, the EIF aims at enhancing the access to finance of SMEs, inter alia through debt funds. See Kraemer-Eis (2014) and Box 2 in Kraemer-Eis, Lang, Torfs and Gvetadze (2016a) for more information on this topic.
48 The content of this text box is mainly based on OECD (2017b) and OECD (2018a).

42
4.5 PE prospects
4.5.1 Current situation, risks and market actors’ concerns
Following the severe crisis of European private equity and venture capital markets in the years 2008-2009 and beyond, remarkable positive developments have been observed in the recent past, at least in some parts of the markets. However, it remains still an open question if a sustainable longer-term positive trend can become prevalent. While in some cases an improvement in performance has indeed been driven by fundamental economic value, part of the upside performance may also be due to higher demand due to the ample liquidity in the markets. All this is to be looked at with caution. It is then, however, important to support those companies in their continued growth that have well-developing economic fundamentals, and to also help, through the support of financial intermediaries, additional and complementary businesses to maintain and strengthen the backbone of the European VC market, i.e. a strong and continued supply of new innovative companies. In addition, the VC ecosystem is developing, including the emergence of more and more successful incubators and accelerators. Should these trends continue, the potential returns of early-stage companies would have significantly positive impacts on the performance of VC investing. Moreover, Europe is even perceived as a global leader in some areas, in particular in its commitment to sustainability and the environment, according to a new international investment decision makers’ survey (Invest Europe, 2017b). Other strengths of the region are the rule of law and corruption prevention, the availability of high-skilled workforce, social and political stability, transport infrastructure, the regulatory climate and the availability of government incentives. However, the perceptions differ to a large extent by the location of the survey respondents. See Box 8 for a more detailed overview of the key results.
Box 8: Global investors’ attitudes towards Europe as an investment destination In the following we present an excerpt of a study that measured the attitudes of international investment decision makers (i.e. from France, Germany, the UK, the USA, and China) towards Europe as an investment destination. It was commissioned by Invest Europe to Ipsos Mori. The fieldwork was completed in September-October 2017. See Invest Europe (2017b) for more information.
In comparison with the USA and China, Europe is seen as a clear leader on sustainability and the environment. Around half also say Europe is the strongest performer among the three investment destinations on social stability, political stability, rule of law, transport infrastructure, availability of a highly skilled workforce, availability of investment incentives and regulatory climate.
Over half say that Europe has become more attractive as an investment destination over the past five years, with sentiment particularly positive in China and the USA. Eurozone stability and economic growth are the main drivers of positivity for those who say Europe has become more attractive as an investment destination over the past five years. Around half see Europe as the global leader in the energy and the environment, and biotech and healthcare sectors.

43
Box 8, continued:
On the subject of the Brexit, respondents are split on the impact that it will have on their propensity to invest in the UK. The majority of German and French respondents are less likely to invest, while the majority of those from the USA are unchanged. Notable, Chinese respondents are more likely to say It will increase their likelihood to invest, which is indicative of their overall positivity towards investment in the region and may reflect the potential for new trade relations between the UK and other international markets. Regarding the impact of Brexit on investment in the EU, the majority do not feel that this decision will influence their propensity to invest in the region.
Lower taxes are the most frequently cited means of boosting the attractiveness of Europe as an investment destination, mentioned by a third of respondents. Bearing in mind regulatory barriers to entry, Chinese and American respondents are more likely to look for investment incentives. Unsurprisingly, UK respondents are more likely to be looking for a swift resolution to Brexit talks – an issue which those from China are notably less concerned about. Among those respondents who say Europe has become less attractive over the past 5 years, 47% say Europe can make itself more attractive with tax cuts. For those who say investment is likely to increase over the next five years the availability of investment incentives and closer integration of the Single Market have greater prominence.
Respondents are optimistic that investment in Europe will increase over the next five years, with respondents from China and the USA especially bullish. Closely linked to this, the majority of respondents believe that European policymakers are committed to attracting investment.
Source: Invest Europe (2017b)
However, the recent favourable developments in the PE/VC market might become contested by risks related to the current economic, monetary and political environment. According to a recent Preqin survey49, pricing/valuations were still perceived as the biggest challenge investors were facing (Preqin, 2017a). The proportion of investors that raised this concern (86%) has even increased compared to the previous wave (70%). Investors were also much more concerned about the deal flow (51%) than half a year earlier (41%); see Figure 33. In contrast, the importance of regulation (16%) and ongoing uncertainty in global markets (11%) decreased. Among venture capital investors, pricing/valuations (73%), the exit environment (51%) and performance (45%) were the most frequently stated challenges. However, these issues are still less of a concern in Europe than in, e.g., the US, as the European PE market “still has room to grow” (Bain & Company, 2017).
49 The latest (i.e. September 2017) issue of the “Preqin Investor Outlook: Alternative Assets” is based, inter alia, on a series of interviews with institutional investors from around the world, of which 33% are located in Europe. The interviews were conducted in June 2017 (Preqin, 2017a, 2016c).
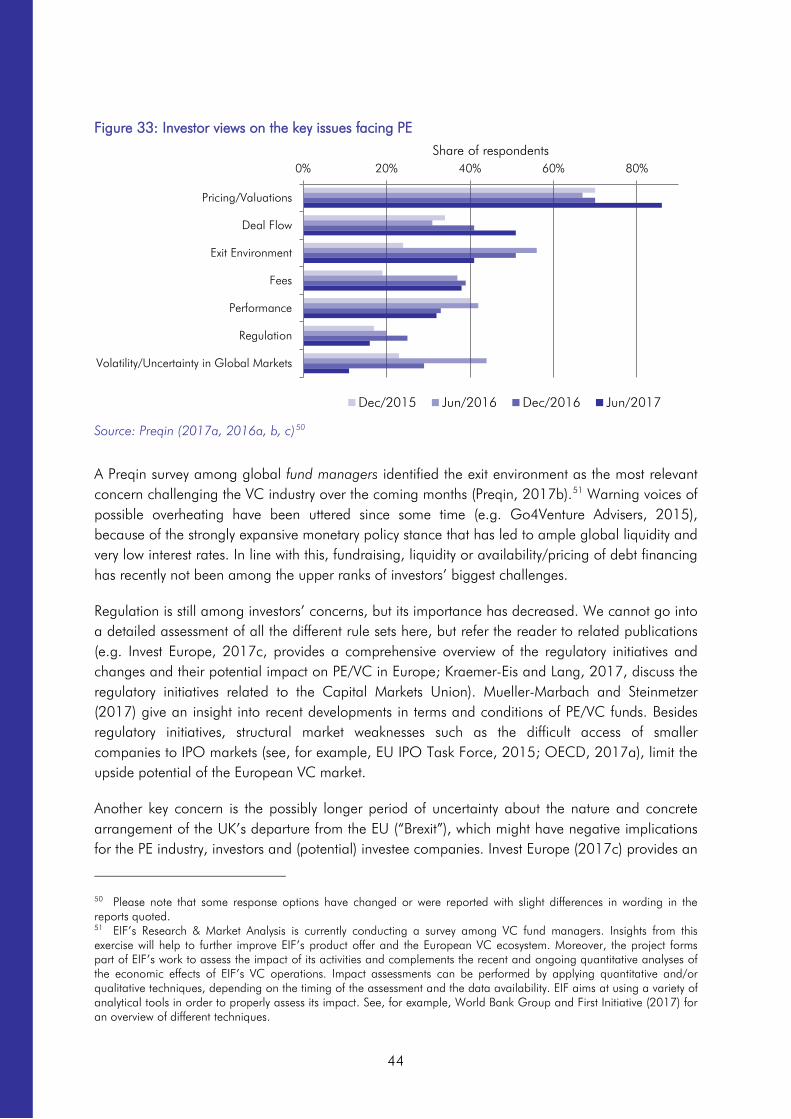
44
Figure 33: Investor views on the key issues facing PE
Source: Preqin (2017a, 2016a, b, c)50
A Preqin survey among global fund managers identified the exit environment as the most relevant concern challenging the VC industry over the coming months (Preqin, 2017b).51 Warning voices of possible overheating have been uttered since some time (e.g. Go4Venture Advisers, 2015), because of the strongly expansive monetary policy stance that has led to ample global liquidity and very low interest rates. In line with this, fundraising, liquidity or availability/pricing of debt financing has recently not been among the upper ranks of investors’ biggest challenges.
Regulation is still among investors’ concerns, but its importance has decreased. We cannot go into a detailed assessment of all the different rule sets here, but refer the reader to related publications (e.g. Invest Europe, 2017c, provides a comprehensive overview of the regulatory initiatives and changes and their potential impact on PE/VC in Europe; Kraemer-Eis and Lang, 2017, discuss the regulatory initiatives related to the Capital Markets Union). Mueller-Marbach and Steinmetzer (2017) give an insight into recent developments in terms and conditions of PE/VC funds. Besides regulatory initiatives, structural market weaknesses such as the difficult access of smaller companies to IPO markets (see, for example, EU IPO Task Force, 2015; OECD, 2017a), limit the upside potential of the European VC market.
Another key concern is the possibly longer period of uncertainty about the nature and concrete arrangement of the UK’s departure from the EU (“Brexit”), which might have negative implications for the PE industry, investors and (potential) investee companies. Invest Europe (2017c) provides an
50 Please note that some response options have changed or were reported with slight differences in wording in the reports quoted. 51 EIF’s Research & Market Analysis is currently conducting a survey among VC fund managers. Insights from this exercise will help to further improve EIF’s product offer and the European VC ecosystem. Moreover, the project forms part of EIF’s work to assess the impact of its activities and complements the recent and ongoing quantitative analyses of the economic effects of EIF’s VC operations. Impact assessments can be performed by applying quantitative and/or qualitative techniques, depending on the timing of the assessment and the data availability. EIF aims at using a variety of analytical tools in order to properly assess its impact. See, for example, World Bank Group and First Initiative (2017) for an overview of different techniques.
0% 20% 40% 60% 80%
Pricing/Valuations
Deal Flow
Exit Environment
Fees
Performance
Regulation
Volatility/Uncertainty in Global Markets
Share of respondents
Dec/2015 Jun/2016 Dec/2016 Jun/2017

45
overview of issues under discussion that might have an impact on PE. According to a Coller Capital (2016b) survey, 37% of LPs expect a negative effect on European PE returns in case of a “hard” Brexit, while only 6% expect a positive effect. In case UK business founders already perceived negative effects, they were mainly affected by increased difficulties in “talent and hiring”, but also in “investment and fundraising” (Slush & Atomico, 2017).
4.5.2 Structural challenges affecting European PE and VC
Moreover, the PE and VC markets are challenged by economic developments of the last years that have resulted in significant structural changes in the global and European economic landscape. The digitalisation of the economy has led to a differentiation of market segments. On the one hand, companies in research-intensive sectors continue to follow more traditional growth models with capital-intensive development stages at the beginning of their life. On the other, companies in the digital space are able to start their activities with very limited resources but are exposed to unprecedented needs for funding in the internationalisation and globalisation of their business models. As a result, and depending on the sector and the business models of the companies, time-spans from start-up to global leader have shortened considerably and require companies to scale quickly to sustain the risk of seeing their business model being out-dated before they capture a significant market share. However, in Europe, too few start-ups survive beyond the critical phase of 2-3 years. Compared to the US, a much larger share of firms remains static and fewer companies manage to grow into large firms (European Commission, 2016; Bravo-Biosca, 2011).
On a global level, the VC market has adapted to the new diversity of its target sectors. This has led to a bifurcation of the market between sometimes relatively small funds with the aim of scouting emerging business models whilst a new class of giant VC funds has expanded globally from the US, providing large scale capital to businesses in their global market expansion. In the large scale technology growth capital space Europe has very few established players, which explains why European funding rounds especially in digital technology growth capital have typically been led by US VC growth capital funds. However, a number of European growth stage VC funds have successfully completed their fundraising and hence, going forward aim to play the lead role in funding rounds of, for example, digital economy companies in Europe on their pathway to global category leaders.
In the shadow of companies driving or directly affected by the “digital revolution”, SMEs and mid-caps in traditional industries are reshaping their strategies for competing in a rapidly changing economic environment and are in need of flexible funding instruments with growth equity, mezzanine debt and hybrid debt to classical debt features. Moreover, EIF market insight shows that growth-stage companies are experiencing a serious lack of growth (follow-on) funding in order to accelerate their international expansion and to strengthen their position against global competitors (see also McGrath, 2017, for a related overview). A comparison of PE statistics confirms that the gap between the VC markets in the US and in Europe is particularly high at the later stage (AFME, 2017c; Echiksone 2017). Moreover, in the growth capital segment, the amounts invested in the US exceed those in Europe by 3 times. These differences are also reflected by substantial distinctions in fund and deal sizes: While at the start-up stage there is relatively little difference in terms of fund size (US vs Europe), US companies are funded by significantly larger funds at the scale-up stage. Moreover, in the period 2007–2015, the average VC-backed US company received five times

46
higher amounts than its EU counterpart, i.e. EUR 6.3m compared to EUR 1.3m (AFME, 2017c; Kraemer-Eis and Lang, 2017). Duruflé, Hellmann and Wilson (2017) identify the creation of larger venture funds and a venture debt market, a reinvigoration of tech IPOs, improved markets for secondary shares and avoiding to sell companies too early as main elements of a strategy that would help Europe in catching up to the US in terms of scale-up funding. (We looked into venture debt in Europe in the June 2017 ESBFO edition, i.e. Kraemer-Eis, Lang, Torfs and Gvetadze, 2017; see chapter 4.1 for an overview of corporate venture capital, which can also be a tool to improve the financing for scale-ups.)
Moreover, in order to strengthen investment capacities, co-investment can be a promising feature of the PE market. On a global level, the proportion of LPs that co-invest with GPs has risen considerably over the last decade (Coller Capital 2017) and most investors expect this phenomenon “to remain a fixed feature of the PE landscape” (Coller Capital, 2015). Moreover, a large majority of LPs reported “that their co-investments have outperformed their overall PE portfolios in recent years” (Coller Capital, 2016a). In an EIF survey among VC fund managers in Germany, two thirds of the participants saw a benefit from the availability of stable providers of co-investment capacity when addressing potential investment opportunities (source: EIF). This is even more relevant, as the large majority of LPs seems to believe “that the LP community lacks the necessary investment skills, experience and processes to make successful co-investments” (Coller Capital, 2015). Time constraints, a limited understanding of co-investment performance drivers, and the inability to recruit staff with the requisite skills were cited as “the main challenges preventing LPs from making successful co-investments”. However, the markets have started to develop and investors believe that the economics of co-investing will further change, e.g. by the occurrence of more co-investment opportunities coming with fees and carried interest in the future (Coller Capital, 2016b).
A challenge to the PE and VC markets that we have not analysed so far is the underrepresentation of women in the industry. We look into this in Box 9 below.
Box 9: Women in Venture Capital Women represent only a small proportion (21%) of all VC employees worldwide. The largest share (36%) of women in VC is reported for junior-level positions, followed by mid-level positions (29%), and senior-level positions (11%). Moreover, only 6% of all VC board representatives are women (Preqin, 2017d). However, this latter share is even higher for VC than for PE (4.1%) as a whole (Preqin, 2017c). While the share of female employees as a proportion of total employees is broadly similar for Europe and the world, the shares of women employees in mid-level (26%) and senior positions (9%) in Europe are lower than, for example, in the US (34% and 13%, respectively); see Preqin (2017c) and Preqin (2017d). Among the European countries with the largest VC markets, France has the highest share (22%) of female senior employees as a proportion of total senior employees in VC firms (Preqin, 2017c). In terms of investments by women-owned VC firms, North America is by far the most active region both in terms of number of deals (366, Jan.-Oct. 2017) and aggregate value (USD 4.6bn). In contrast, only 43 VC deals by women-owned firms, representing a deal value of USD 0.7bn, were reported for Europe (Preqin, 2017d).

47
Box 9, continued:
The underrepresentation of women in VC contrasts sharply with the perception of the respondents (75% male and 25% female) in a recent Slush & Atomico (2017) survey among the “tech community” (founders, VCs, start-up employees and others), in which more than half of the respondents (53% in the case of VCs) stated that gender diversity is positively reflected in their company’s employee composition and hiring (with a higher share of respondents confirming this view among female than among male respondents).
The low representation of women in VC, and even more so in PE, is partly due to the fact that many firms are still being run by the generation of their (typically male) founders. “It is no contradiction to say that a comparatively young industry looks rather old fashioned when it comes to the matter of gender” (Naydenova and Roberts, 2017). Being relatively small businesses in terms of employee numbers, often run by the founder generation and a relatively conservative senior management, it can be more difficult to implement modern corporate structures in such firms. Indeed, new firms have a considerably larger representation of female partners (Teare, 2017). Moreover, smaller firms typically find it more difficult, at least for senior positions, to implement measures that would allow for combining career and family (Naydenova and Roberts, 2017). In a recent Coller Capital (2017) survey, LP respondents stated a better work-life balance and different recruitment and promotion practices as the most important reasons why there are more senior women at LPs than at GPs. The lack of female role models may be another reason for the underrepresentation of women in PE and VC. “This could explain why talented young women, if in doubt, decide to enter other industries where they presume that there are better opportunities for career progression and a more open working culture” (Naydenova and Roberts, 2017). Indeed, there are indications that also the share of female applicants is comparatively low in the industry.
In addition, also on the level of (potential) investee companies, the underrepresentation of women is increasingly regarded as an aspect to be addressed and many governmental SME support policies or programmes include a focus on the support of female entrepreneurs (OECD, 2017a). For example, in a study for the US, 15% of those companies that had a woman on the executive team were able to receive a VC investment in the 2011-13 period. The share of total VC investment amounts invested was at 21% in 2011. Companies that have women executives in the team and receive VC funding are likely to be larger, which might explain why the average amount invested per company with a woman in the management team was 50% higher than for other companies (Brush et al., 2014).
An increasing number of investors have started initiatives to better support female talent. Moreover, networks are being formed with the objective to mentor PE managers and an increasing number of conferences focussing on the topic is organised (see, for example, Brush et al., 2014; according to Gompers et al., 2014, the implementation of formal feedback mechanisms is an important feature that helps to improve career opportunities for women in VC firms).52 PE firms have also started to shift their hiring process more strongly away from investment banks to companies in the real economy and consulting firms, which traditionally have a higher share of women than the financial sector (Naydenova and Roberts, 2017).
52 See http://wa4e.businessangelseurope.com/SitePages/default.aspx for information on the EU-funded Women Business Angels for Europe’s Entrepreneurs (wa4e) project. Its aim is to “increase the number of Women Business Angels by 10% and to generate EUR 2.5m EUR fresh investment in start-ups across Europe” by deploying awareness raising, training and mentoring actions. See chapter 4.1.2 for more information on BAs, including the gender composition of the supply side of the BA market.

48
Box 9, continued:
There are also examples of firms that incorporated gender diversity values into their business models. Apart from relatively large shares of female founders and/or investment partners, this can include a particular focus on investments in female-led companies or specific principles of driving and developing female talent in the industry (Preqin, 2017d). In the context of recent sexual misconduct allegations, prominent VCs have called for action. Some of them adopted a set of moral guidelines, while others argued that this is not enough to motivate change in the industry (Preqin, 2017d; see also Teare, 2017). However, some see the observation that the actual number of women employed by VCs at investing partner level increased from April 2016 to October 2017 as a first sign of a turnaround (Teare, 2017).
4.5.3 Policy intervention in European PE and VC: Findings from recent studies
The challenges described in the preceding two chapters continue to create access to funding problems in the European VC market. The difficulties for young innovative companies to access seed and early stage finance increased during the crisis, as VCs became more risk-averse and focussed more on later stage investments (Wilson, 2015b; Nepelski et al., 2016). This supports a view that public backing is needed in order to strengthen the market. We had outlined recent OECD findings on policy measures taken by governments to support seed and early-stage financing in previous issues of the ESBFO. Indeed, an Unquote Intelligence (2014) survey found that “public money remains absolutely critical to the European venture industry and is likely to remain so for the next five years”, and this has been particularly true for new funds, as most public funding bodies support first-time funds, while this is true for only approximately half of private investors. Besides the additional funding volumes, public investors’ participation in a PE/VC fund can also have a positive signalling effect on private investors, e.g. due to perceived strong due diligence requirements and an assumed relatively high stability of public LPs’ commitment to a fund. These advantages seem to outweigh the potential disadvantages (e.g. a possibly negative impact on speed and responsiveness or imposed restrictions in the investment strategy of the fund) of public investors’ participation. Moreover, Bertoni, D’Adda and Grilli (2016) show that in “thin” VC markets with low supply, which might be a good characterisation for many continental European markets, governmental VCs, by increasing the deal flow, can raise competition among investee companies and thereby elevate expected profits of independent VCs53 with purely financial investment objectives. This may attract additional investors and trigger “the virtuous cycle of VC market development”.
However, for public policy intervention in the VC market, the relationship between private VC activities and governmental support is as well important; it was analysed in several empirical studies: According to Colombo, Cumming and Vismara (2014), the design of a public VC investment scheme is relevant for their impact. In particular, governmental VC schemes seem to have been more successful when they acted alongside private investors, which would favour a governmental fund-of-funds set-up over direct public investments. Indeed, the focus of support instruments “has shifted from government equity funds investing directly to more indirect models such as co-investments funds and fund-of-funds” in OECD countries (Wilson, 2015b). Moreover, Brander, Du and Hellmann (2014), in a continuation of their 2010-study, find that enterprises 53 Independent VC fund managers act as general partner in a limited partnership in which the fund investors invest as limited partners. This is the most common legal structure for VC funds in Europe.

49
funded by both governmental VC and private VC obtain more investment than enterprises funded purely by private VCs, and much more than those funded purely by governmental support. There is also a positive association between mixed governmental/private funding and successful exits, as measured by initial public offerings and acquisitions, attributable largely to the additional investment (see also Dubovik and Steegmans, 2017, for a brief overview). Dubovik and Steegmans (2017) find evidence that public sponsoring of privately managed VC funds creates better exit performance than public management of VC funds. Cumming, Grilli and Martinu (2014) show a higher likelihood of a positive exit for companies backed by independent and governmental VCs together than for companies that are backed by one of the two investor groups only. Morever, Bertoni and Tykvová (2012) conclude “that syndicates between private and governmental venture capital investors, in which the private investor takes the lead, are the most efficient form in terms of innovation production that outperforms all other forms.” However, as said earlier, public policy in the area of venture capital should go beyond an exclusive support of VC funds (see Hellmann, Schure and Vo, 2015), but rather aim to attract equity financing to Europe also from other sources, such as angel investors and crowdfunding (see Wilson, 2015a; see also Aubrey et al., 2015, for related policy recommendations to support growth firms).
4.5.4 Policy intervention in European PE and VC: A practical approach
In all, Europe therefore needs an integrated portfolio of funding instruments in support of the various segments of its start-up54, SME and mid-cap landscape to foster the recovery from the financial and economic crisis and to unleash the full potential of EU companies’ competitiveness and their contribution to Europe’s economic growth and innovation. Instruments should be complementary to existing initiatives in terms of sector, stage or geographic focus. However, the dynamics of recent economic developments e.g. in the area of the digital economy, has made the segmentation between early stage and late stage VC somewhat redundant. Policy instruments that create artificial boundaries of development stages of businesses could be prohibitive to an efficient VC market. Moreover, EU’s VC markets show different development stages and so require different policy instruments. In less developed markets instruments may need to work strongly together with the actors in the informal VC markets (BAs, Incubators, TT Centres) and be complemented by flexible co-investment products to grow the domestic VC market. However, companies with global ambitions compete globally. Instruments investing in future industry leaders compete for investors who seek exposure to the best companies on a global scale, not with respect to a given geography. Therefore, giving flexibility in the geographic boundaries of policy instruments is not only key in retaining EU-based businesses in Europe but may attract non-EU based businesses to relocate to Europe. Based on these considerations, it appears vital to offer a flexibility of instruments adapted to diverse market conditions in the various geographies of the EU. Large-scale venture initiatives need however be associated with the knowledge of how to grow businesses to larger scale to make a desired impact on the EU’s competitiveness.
54 In order to shed some more light on the relationship between VC and start-ups, Brinckmann (2015) and Raves (2017) analysed, in cooperation with EIF RMA, the effect of entrepreneurs’ profiles on the performance of VC-backed start-ups. We presented key parts of the former paper in a previous ESBFO issue (see Kraemer-Eis, Lang, Torfs and Gvetadze, 2015b).

50
Measures aiming at regulatory simplification, harmonization and promoting cross-border investment (e.g. the so-called pan-European passport for VC investors, which aims at ensuring that VC funds established in any EU Member State invest freely in other Member States, and its extensions and complementary measures under the initiatives related to the Capital Markets Union; see Chapter 8, Concluding remarks and Kraemer-Eis and Lang 2017 for an overview) are steps in the right direction, as intensive policy action is needed to overcome the fragmentation of the European VC market (Bertoni, Colombo and Quas, 2015; see also chapter 4.1). Two recent initiatives, the EIF NPI equity platform and the Pan-European Venture Capital Fund(s)-of-Fund (FoF) programme, aim at contributing to this.55
Europe needs a seamless funding infrastructure for supporting the full corporate financing escalator, i.e. an EU equity flagship facility to ensure a sizeable mass of home-grown risk capital finance with a long-term perspective. The issue is not only about the availability of funding; it is about the type of funding: the “growth stage trap” is very different in nature from the “early stage gap” and requires new tools and means to address it (see Kraemer-Eis and Lang, 2017). However, public backing of the European VC market should aim at crowding-in private investors and catalysing private sector investments in order to support development of an integrated European VC market, which is originated by venture capitalists and other key actors as market-oriented professionals, such as business angels (BAs).
In times of scarcity of private capital, the temptation grows to construct policy instruments that substitute the private sector. However, there is in fact a need to use public sector resources with the primary objectives of mobilising private sector capital, as clearly demonstrated, for example, by the leverage factor built in the Investment Plan for Europe (see Chapter 8, Concluding remarks for more details) and other instruments implemented by the EIF. One way to attract private investors to the VC market is a fund-of-funds approach (Acevedo et al., 2016), which is pursued by the EIF. We describe a new EIF initiative to bring in private investments into the European VC market in Box 10. As a reference catalytic investor in European venture and growth capital funds, EIF is actively working in the direction outlined above: EIF has increased its counter-cyclical role by providing financing solutions to boost entrepreneurship and innovation. In the coming years, EIF will continue to act as a cornerstone investor across the spectrum from technology transfer through venture capital to the lower mid-market and mezzanine financing; moreover, EIF’s activity in the equity sphere also includes the launch and extension of new and pilot initiatives. This will contribute, inter alia, to the EC’s “Start-up and Scale-up Initiative”, which stated access to finance to be one of the biggest barriers to scaling-up businesses (see European Commission, 2016).
55 See the EIF website www.eif.org and Kraemer-Eis, Lang, Torfs and Gvetadze, 2016b, for more information. See in this context as well Stönder (2017) for a discussion of how to get national and EU measures of VC support in sync.

51
Box 10: EIF launches new EUR 2bn Asset Management Umbrella Fund to support European SMEs In December 2017, the EIF announced a new EUR 2bn Asset Management Umbrella Fund (AMUF) to attract additional risk capital investments for SMEs across Europe over the next three years. The new AMUF will help to increase the amount of risk capital available for investment activity in Europe, whilst maximising investments from institutional sources. The fund structure responds to Institutional Investor’s requests to EIF to enable access to European Private Equity/Venture Capital markets and to reach Europe’s best performing managers. By offering a cost-efficient investment vehicle and benefiting from EIF’s unique market position and track record in European PE/VC investments, investors can access this high performing asset class.
Investors into the fund will include European Institutional Investors (Insurance Companies, Pension Funds) and Sovereign Wealth Funds. The first Institutional Investor in the vehicle will be Cassa Forense, one of the largest private pension funds in Italy, which committed to invest EUR 175m into European PE/VC funds via EIF’s AMUF. Additional investors will be announced soon.
EIF’s new AMUF will create additional SME financing options for Institutional Investors across Europe. Moreover, it will be instrumental in catalysing private sector investments looking to identify the next leading innovators, whilst further strengthening the European start-up ecosystem. The new fund benefits from EIF’s proven expertise capabilities and allows institutional investors to allocate their resources according to their individual risk/return profile.
Source: EIF (More information: http://www.eif.org/what_we_do/institutional-asset-management/index.htm)

52
5 SME guarantees and SME Securitisation in Europe
5.1 SME guarantees
5.1.1 Market failure and policy response
Information asymmetries in the credit market: the rationale for public sector involvement
Public CGSs are used in many developed and developing economies to alleviate the constraints facing SMEs in accessing finance. Indeed, financial institutions are usually reluctant to extend uncollateralised credit to SMEs, even at high interest rates, in part because of the high costs of obtaining and assessing adequate information on the true credit quality of small, typically young companies. Many of these firms do not have the necessary amount and type of assets that could serve as collateral for the loan. As a result, many SMEs with economically viable projects cannot obtain the necessary financing from the regular system of financial intermediation.
This phenomenon is often referred to as the SME financing gap: an insufficient supply of external financing to SMEs (OECD, 2006), the existence of which is driven by a market failure typical for the credit market: information asymmetries.56 Information asymmetries can lead to credit rationing through either moral hazard problems or an adverse selection of low quality borrowers (Akerlof, 1970). Adverse selection occurs when banks cannot differentiate between good and bad projects, and therefore cannot charge each a different interest rate to reflect inherent differences in risk. Higher interest rates will discourage businesses with the least risky projects to take out loans. If good borrowers self-select out of the market, this in turn implies that, for any given interest rate, inherently riskier projects will be overrepresented in the loan application pool (Jaffee and Russell, 1976; Stiglitz and Weiss, 1981). Moral hazard problems occur when limited liability in the event of default provides borrowers with an incentive to take up excessive risk.57 This means that in the presence of asymmetric information, banks are reluctant to use higher interest rates, because it reduces equilibrium profits. As a consequence, their rational response is to keep the supply of credit below demand, rather than to increase the interest rate charged on loans.
Credit rationing is particularly prevalent in the market for lending to SMEs, for two reasons. The first reason relates to their lack of collateral: the availability of collateral provides a way for borrowers to directly eliminate the asymmetric information problem. Pledging collateral in a loan-agreement enables firms to bindingly signal their true credit worthiness. However, firms do not always possess the required collateral. This holds especially true for small and medium sized enterprises (SMEs). The credit rationing result is therefore particularly relevant for this segment of firms, where failure to meet lenders’ collateral requirements aggravates access to finance problems. In addition, the use of collateral comes with a number of drawbacks. For one, the collateral may be worth more to the borrower than to the financial institution providing the loan. In addition, the use of collateral increases the cost of borrowing, as it generally involves legal and other administrative procedures. The ECB/EC Survey on the Access to Finance of Enterprises (ECB,
56 See OECD (2018b) for an overview of market failures in SME lending and mitigation techniques. 57 Both the adverse selection as well as the moral hazard argument crucially hinge on the insight that higher interest rates reduce the borrower’s stake in the project underlying the loan (Tirole, 2006), which is an illustration of the typical principal-agent problem (Arrow, 1985).

53
2017b) confirms the argument that the insufficient availability of collateral and guarantees continues to be an important reason why SMEs consider bank loans not relevant for them (see Figure 34). The second reason SMEs are more affected by credit rationing than larger companies relates to the fact that credit market information asymmetries are more pronounced for small firms and that the cost of monitoring them is higher. Large firms are required to adhere to corporate norms, legal standards, formal reporting requirements etc., whereas business decision-making processes, transparency rules, dividing lines between company and personal assets are less defined for SMEs. SMEs are often young organisations, so that credit history and operational track records are, by construction, shorter compared to their larger counterparts. Market failures in the bank-lending market therefore imply that many SMEs with economically viable projects will not be able to obtain the necessary financing from the regular system of financial intermediation.
Figure 34: Reasons why bank loans are not a relevant source of financing for euro area SMEs (HY1/2017)
Source: ECB Data Warehouse
Recently, two factors have contributed to a worsening of the SME financing gap. First, a number of studies have put forward the conclusion that credit constraint issues are further deepened by increasing market concentration in the banking sector. Ryan et al. (2014), for example, show how bank market power is associated with an increase in financing constraints, and thus leads to lower levels of SME investment levels. This conclusion is confirmed by Chong et al. (2013) who show that lowering market concentration in the banking sector indeed alleviates financing constraints. Given the strong consolidation in the European banking sector (Uhde and Heimeshoff, 2009; ECB, 2016), these observations are particularly relevant for SMEs in Europe. Second, the sharp drop in real estate prices negatively impacted the credit availability to SMEs, who often use property assets as collateral (OECD, 2012).
0%
1%
2%
3%
4%
5%
6%
7%
insufficient collateralor guarantee
interest rates or pricetoo high
no bank loansavailable
too much paper work
large
SMEs

54
Information asymmetries exist to a lesser degree if a strong relationship between lender and borrower has been established. Hence, unsurprisingly, most SMEs have a close relationship with one (sometimes two) “house bank(s)” (EBF, 2015). A close relationship with a lender makes the borrower well aware of what information needs to be provided, including the amount of collateral required (support in this regard is also given by third parties like, for instance, chambers of commerce and guarantee societies with specific knowledge of the local SME market). In addition, it enables the lender to know well not only the hard but also the soft facts of the borrower. Thus, through due diligence/lenders’ examination (screening) and by a firm’s ability to signal its credit worthiness (incl. an institutional assessment or rating by an independent agency and the provision of collateral), information asymmetries can be reduced. However, this means that new or young firms with a lack of collateral and, by definition, without a track record, are the ones with the greatest degree of difficulty in accessing debt capital. These financing obstacles can also negatively affect productivity in the economy.
Given the strategic importance of SMEs as drivers of economic growth and innovation, it is of crucial importance to address the consequences or credit market failures in order to exploit the externalities from entrepreneurial dynamism (Honohan, 2010).
Using CGSs to alleviate the supply shortage
Guarantee mechanisms, “whereby should the borrower default the guarantor compensates a pre-defined share of the outstanding loan” (OECD, 2015), are a commonly used response to address the consequences of these kinds of market failures, as guarantees reduce the risk of lenders and favour the provision of financing to viable businesses that are constrained in their access to finance. Credit guarantee schemes (CGSs) “are used widely across economies as important tools to ease financial constraints for SMEs and start-ups” (OECD, 2013), in order to alleviate market failures in SME financing.
Moreover, loan guarantee programs expanded substantially in the years 2007-2011, as governments responded to the financial crisis. Carefully designed guarantee schemes have positive macroeconomic effects, meaning that the costs for the tax payers due to default payments are outweighed by the positive stimulating effects (such as on employment and tax revenue) of guarantees for the economy. Therefore, credit guarantee schemes “remain the most wide-spread instrument in use across countries” to ease SME access to finance (OECD, 2018b). Moreover, guarantees are “increasingly targeting young and innovative firms in an effort to boost employment and value added” (OECD, 2016). While CGSs do not alleviate information asymmetries directly, and hence do not address the root of the market failure,58 they can increase the incentives of lenders to supply credit to SMEs by providing a substitute for collateral, and if designed correctly, increase overall welfare. Some studies have investigated the welfare effects of CGS policies and
58 This would only be the case to the extent that CGSs have a comparative advantage in screening activities, vis-à-vis traditional credit institutions. The way in which CGSs function in reality indicates this is likely not the case: in practice the credit appraisal of the borrower is still executed by the lender and CGSs often guarantee full portfolios of loans and therefore do not maintain a personal relationship with the borrower. However, certain guarantee schemes can form a real expertise for specific types of projects, when they are requested by banks to participate in a large number of such projects in order to analyse and identify the projects that can be financed (such as SIAGI in France for the transfer of operations of small firms).

55
documented the superiority of CGSs compared to other instruments to alleviate welfare losses associated with credit market failures.
Arping et al. (2010) examine the conditions under which CGSs are socially preferred over government co-funding, using a moral hazard model in the spirit of Holmstrom and Tirole (1997). They conclude that provided entrepreneurs are not substituting public for private collateral, a welfare-maximising strategy prefers CGSs over government co-funding of investment projects. Government involvement in the establishment and funding of CGSs can also be motivated by resolving coordination failure between private-sector entities, which prevents them from pooling their resources. Anginer et al. (2014) argue that when lenders are risk averse, efficient provision of guarantees may not occur on a private-sector basis due to collective action problems, i.e. although the stakeholders are all aware of the problem, the lack of action comes from the misalignment of the private interests with those of the society. They also stress that the incentives for collective action are even weaker in economies with less developed financial systems. The state, on the contrary, is able to resolve the collective action frictions that get in the way of risk spreading. However, to achieve this objective, the state has to maintain the incentives for lenders to monitor projects efficiently, and to deter the borrower from excessive risk-taking. This can be done by pricing guarantees in a way that ensures the expected losses being covered by the fees charged, and promotes the risk being shared with the private sector.
In addition, CGSs hold other advantages. First, the final lending decision stays with a market-based, private-sector entity – the bank –, which has the expertise and the necessary technology to evaluate credit applications and projects. This is likely to ensure a more efficient selection among borrowers than if the task is done by a public agency, since – given that the guarantee is partial – it leaves part of the risk with the privately operating lender. Second, compared to direct lending programmes, CGSs have much lower initial cash flow needs, and as such, have a leverage component. As a consequence, they can also be used when fiscal constraints are tight. However, the small initial cash outlay of credit guarantee schemes also has disadvantages. Honohan (2010) notes that, as a large number of borrowers can be reached with only relatively small initial costs in the short run59, political incentives exist for the public sector to supply guarantees generously, while concealing the true long-term fiscal costs of a programme behind the uncertainty around the expected long-term losses on the guarantee portfolio. This can result in unexpected fiscal costs further down the road. Third, supranational CGSs can contribute to an efficient geographic distribution of credit. Results from a recent EIB and EIF survey on European CGSs (see Chatzouz et al., 2017; a summary is provided in a previous ESBFO issue, i.e. Kraemer-Eis, Lang, Torfs and Gvetadze 2016b) highlight that all but one existing CGSs choose to operate within the national borders of the country they are headquartered in. This can be explained by the existence of cross-border information frictions related to national legal frameworks that govern the functioning of CGSs, and obvious practical difficulties to assess risks in different cultural, linguistic and business contexts. Supranational CGSs can therefore contribute to an efficient cross-border allocation of credit.
59 Other short-term effects might include the fiscal income generated by the supported projects as well as their positive impact on social benefits programs due to created or maintained jobs.

56
Box 11: Developing a Toolkit for Impact Evaluation of Public Credit Guarantee Schemes for SMEs The increased popularity of CGSs as a policy tool around the world has triggered greater demand for evidence on their impact, in particular with respect to the quality, efficiency and effectiveness of CGSs. CGSs are established to improve access to finance for SMEs and in some cases to deliver other important results such as investment and jobs. Whether or not these results are actually achieved is a crucial public policy question yet one that is not often examined.
To provide guidance to CGS managers, policymakers and stakeholders on how an impact evaluation of CGSs could be designed and implemented, the World Bank Group and the FIRST Initiative60 in partnership with a task force of experts representing CGS associations around the world have developed a Toolkit. It reviews a variety of existing impact evaluation techniques and proposes a selection process for an impact evaluation framework, which follows the objective of being “rigorous, credible, and at the same time practical, straightforward, and relatively inexpensive to implement”. The consultative document provides good guidance and a well-structured overview of the state of the art in impact assessment. Leveraging on its activity and experience with the topic, EIF’s Research & Market Analysis (RMA) commented on the consultative document, inter alia, on the good practices to select the most appropriate methodological approach, as well as contributing to the debate on how to carry out an impact assessment exercise (i.e. in-house, externally or joint approach).
Sources: World Bank Group and First Initiative (2017) and EIF
The importance of credit guarantee schemes has been confirmed, inter alia, in two recent studies by the EIB Group on the use of CGSs in Europe (see Chatzouz et al., 2017; VIWGCGS, 2014) and in a joint Working Paper of the EIF and the European Commission (Asdrubali and Signore, 2015; a summary can also be found in a previous ESBFO issue – Kraemer-Eis, Lang and Gvetadze, 2015a). Based on an analysis of the Multi-Annual Programme for enterprises and entrepreneurship (MAP) EU SME Guarantee Facility and focussing on Central, Eastern and South Eastern Europe (CESEE) countries, Asdrubali and Signore (2015) find significant positive effects of this EU guarantee programme on the beneficiary firms. By breaking down the sample by country, signature year, size and age classes, the authors find that micro and young SMEs have benefited the most from MAP-guaranteed loans in terms of economic additionality. Schich et al. (2017) give an overview of evaluations of CGSs for SMEs.61 This study, which is based on a literature review
60 The Financial Sector Reform and Strengthening (FIRST) Initiative is a multi-donor grant facility that provides short- to medium-term technical assistance to promote sounder, more efficient, and inclusive financial systems. FIRST is currently supported by five donors: the Department for International Development of the United Kingdom (DFID), Germany’s Federal Ministry of Economic Cooperation and Development (BMZ), the Ministry of Finance of Luxembourg, the Ministry of Foreign Affairs of the Netherlands (MFA), and the State Secretariat for Economic Affairs of Switzerland (SECO), as well as the World Bank Group (WBG) and the International Monetary Fund (IMF). (Source and more information: https://www.firstinitiative.org/.) 61 Furthermore, in early December 2017, the European Court of Auditors published a Special Report analysing whether EU loan guarantees supported SMEs’ growth and innovation by enabling them to access finance. They examined the two centrally managed instruments currently in operation, namely the InnovFin SME Guarantee Facility and the Loan Guarantee Facility. The European Commission has overall responsibility for the programmes, while the EIF is entrusted with their implementation. The results from an econometric study conducted for France in the context of this audit suggest that loan guarantee instruments helped beneficiary companies grow more in terms of total assets, sales, employee numbers and productivity; while the effects were higher for smaller and younger businesses. These findings were in line with the results of the earlier study by Asdrubali and Signore (2015) that formed the role model for this assessment. At the same time, based on their entire sample covering nine Member States, the auditors call for improvements in the implementation of these instruments, including better targeting of businesses that are more innovative and lack sufficient access to finance, and coordination with national and regional funded instruments. Both the European Commission and the EIF disagree with certain aspects of the Report’s empirical design and resulting conclusions. The EIF emphasises that
57
and an OECD/EC survey, concludes that not all CGSs are properly evaluated. In case such assessments are performed at all, they are often focussed on financial and not on economic additionality. A toolkit for impact evaluation of public CGSs for SMEs was developed by the World Bank Group and First Initiative (2017); see Box 11.
The EIF plays an important role in alleviating problems experienced by SMEs in accessing finance. Through a wide range of financial intermediaries, such as banks, leasing companies, guarantee funds, mutual guarantee institutions, promotional banks, and other financial intermediaries, the EIF effectively provides both financing to SMEs and guarantees for SME financing. Apart from EIF guarantees for securitised SME financing instruments (see Chapter 5.2), the EIF offers guarantees/counter-guarantees for portfolios of microcredits, SME loans or leases.62
5.1.2 Market size and activity in 2016
Market information concerning CGS in Europe is gathered by AECM, the European Association of Guarantee Institutions.63 In the following, we provide information about the use of guarantees in countries with at least one AECM member to show the state and development of this important market segment.
According to the OECD (2013), guarantees are particularly relevant “in those countries where a network of local or sectoral guarantee institutions is well established”. Key figures, based on outstanding guarantees on SME loan portfolios (as at 30.06.2017 or latest available data), are presented in Table 3 (page 59). The countries with the highest activity remain Italy (EUR 33.9bn), France (EUR 19.3bn), Turkey (EUR 8.4bn), Germany (EUR 5.6bn) and Spain (EUR 4bn). Italy also has the highest total number of outstanding guarantees (1,066,665), followed by France (686,462) and Turkey (470,794). The total number of SME beneficiaries in the portfolios of the AECM members amounted to 2.85m, nearly half of which (almost 1.4m) are located in Italy.
As shown in Figure 35, Italy also leads the ranking in terms of the relative importance of guarantees compared to the value of economic activity (2.02 percent of GDP). The top three is completed by Hungary (1.89 percent) and Portugal (1.85 percent).
SMEs need to satisfy strict eligibility criteria to benefit from the guarantees; and that such programmes enable SMEs not only to access finance but also to obtain better credit terms. 62 See for more information the EIF website www.eif.org. 63 We thank our colleagues from AECM for their support. AECM has currently 42 members in 22 EU Member States plus Bosnia and Herzegovina, Russia, Serbia and Turkey. In the AECM member countries, the AECM members cover all or almost all SME guarantee activity. Some AECM members are national associations or networks and thus have their own member organisations. AECM has purely private, mutual, public, and public-private mixed members. Source: AECM.

58
Figure 35: Volumes of outstanding guarantees in portfolio scaled by GDP*
*As at 30.06.2017 or latest available data
Sources: Authors, based on data from AECM (provisional figures), Eurostat and World Bank
As can be seen in Table 4 (page 60) in the first half-year of 2017, new guarantee activity by AECM members has, on average, increased – albeit moderately. Compared to the previous half-year, the total volume of new guarantees provided by the AECM members increased by 1.8 percent; compared to the first half-year of 2016, the increase was slightly more pronounced (+2.2%). The total new guarantee activity in the first half-year of 2017 constitutes 17.8 percent of the total volume of outstanding guarantees for the same period; while two thirds of this new guarantee activity can be attributed to the three biggest AECM members, namely Italy, France and Turkey.
Significant variation in the growth rates of new guarantee activity is documented across EU countries. For example, new guarantee activity between the first half-year of 2017 and the previous half-year increased strongly in Romania (+30.8%), Hungary (+24.8%) and Austria (+18.5%); while, on the other hand, new granted guarantees decreased significantly in Serbia (-46%), Bosnia-Herzegovina (-26%) and the Netherlands (-25.2%).
0.0%
0.5%
1.0%
1.5%
2.0%
2.5%
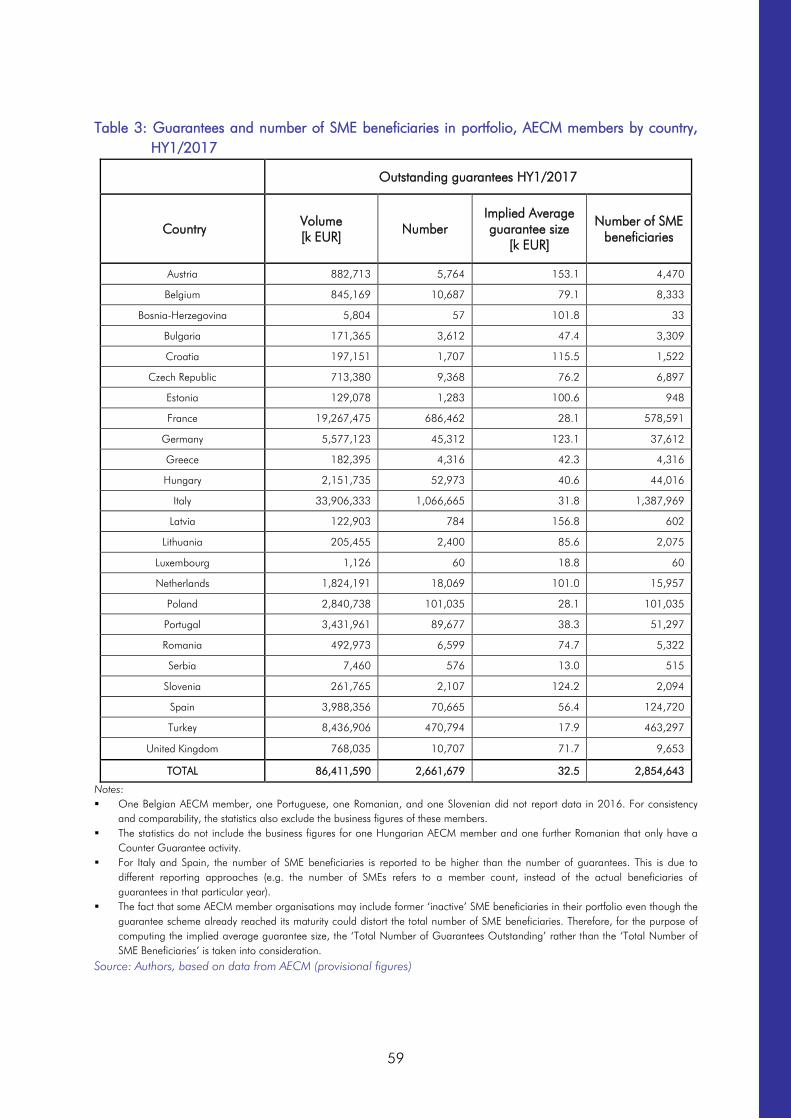
59
Table 3: Guarantees and number of SME beneficiaries in portfolio, AECM members by country, HY1/2017
Outstanding guarantees HY1/2017
Country Volume [k EUR]
Number Implied Average guarantee size
[k EUR]
Number of SME beneficiaries
Austria 882,713 5,764 153.1 4,470
Belgium 845,169 10,687 79.1 8,333
Bosnia-Herzegovina 5,804 57 101.8 33
Bulgaria 171,365 3,612 47.4 3,309
Croatia 197,151 1,707 115.5 1,522
Czech Republic 713,380 9,368 76.2 6,897
Estonia 129,078 1,283 100.6 948
France 19,267,475 686,462 28.1 578,591
Germany 5,577,123 45,312 123.1 37,612
Greece 182,395 4,316 42.3 4,316
Hungary 2,151,735 52,973 40.6 44,016
Italy 33,906,333 1,066,665 31.8 1,387,969
Latvia 122,903 784 156.8 602
Lithuania 205,455 2,400 85.6 2,075
Luxembourg 1,126 60 18.8 60
Netherlands 1,824,191 18,069 101.0 15,957
Poland 2,840,738 101,035 28.1 101,035
Portugal 3,431,961 89,677 38.3 51,297
Romania 492,973 6,599 74.7 5,322
Serbia 7,460 576 13.0 515
Slovenia 261,765 2,107 124.2 2,094
Spain 3,988,356 70,665 56.4 124,720
Turkey 8,436,906 470,794 17.9 463,297
United Kingdom 768,035 10,707 71.7 9,653
TOTAL 86,411,590 2,661,679 32.5 2,854,643
Notes: One Belgian AECM member, one Portuguese, one Romanian, and one Slovenian did not report data in 2016. For consistency
and comparability, the statistics also exclude the business figures of these members. The statistics do not include the business figures for one Hungarian AECM member and one further Romanian that only have a
Counter Guarantee activity. For Italy and Spain, the number of SME beneficiaries is reported to be higher than the number of guarantees. This is due to
different reporting approaches (e.g. the number of SMEs refers to a member count, instead of the actual beneficiaries of guarantees in that particular year).
The fact that some AECM member organisations may include former ‘inactive’ SME beneficiaries in their portfolio even though the guarantee scheme already reached its maturity could distort the total number of SME beneficiaries. Therefore, for the purpose of computing the implied average guarantee size, the ‘Total Number of Guarantees Outstanding’ rather than the ‘Total Number of SME Beneficiaries’ is taken into consideration.
Source: Authors, based on data from AECM (provisional figures)
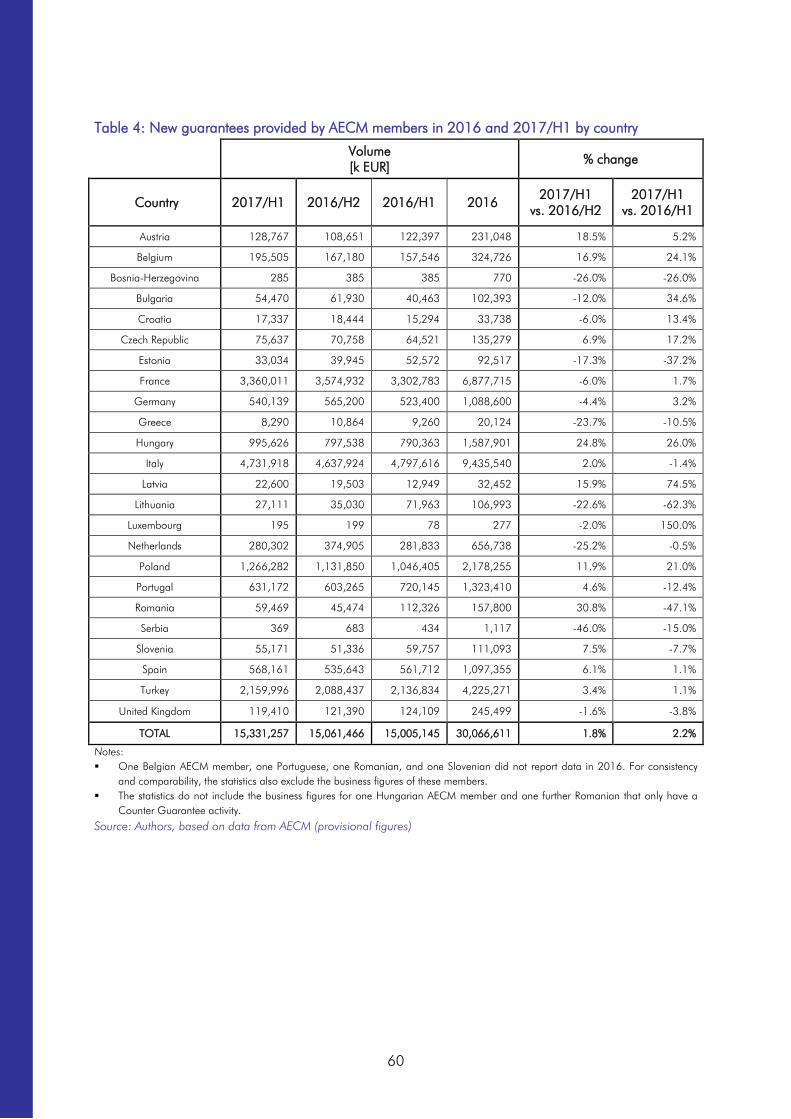
60
Table 4: New guarantees provided by AECM members in 2016 and 2017/H1 by country
Volume [k EUR]
% change
Country 2017/H1 2016/H2 2016/H1 2016 2017/H1
vs. 2016/H2 2017/H1
vs. 2016/H1
Austria 128,767 108,651 122,397 231,048 18.5% 5.2%
Belgium 195,505 167,180 157,546 324,726 16.9% 24.1%
Bosnia-Herzegovina 285 385 385 770 -26.0% -26.0%
Bulgaria 54,470 61,930 40,463 102,393 -12.0% 34.6%
Croatia 17,337 18,444 15,294 33,738 -6.0% 13.4%
Czech Republic 75,637 70,758 64,521 135,279 6.9% 17.2%
Estonia 33,034 39,945 52,572 92,517 -17.3% -37.2%
France 3,360,011 3,574,932 3,302,783 6,877,715 -6.0% 1.7%
Germany 540,139 565,200 523,400 1,088,600 -4.4% 3.2%
Greece 8,290 10,864 9,260 20,124 -23.7% -10.5%
Hungary 995,626 797,538 790,363 1,587,901 24.8% 26.0%
Italy 4,731,918 4,637,924 4,797,616 9,435,540 2.0% -1.4%
Latvia 22,600 19,503 12,949 32,452 15.9% 74.5%
Lithuania 27,111 35,030 71,963 106,993 -22.6% -62.3%
Luxembourg 195 199 78 277 -2.0% 150.0%
Netherlands 280,302 374,905 281,833 656,738 -25.2% -0.5%
Poland 1,266,282 1,131,850 1,046,405 2,178,255 11.9% 21.0%
Portugal 631,172 603,265 720,145 1,323,410 4.6% -12.4%
Romania 59,469 45,474 112,326 157,800 30.8% -47.1%
Serbia 369 683 434 1,117 -46.0% -15.0%
Slovenia 55,171 51,336 59,757 111,093 7.5% -7.7%
Spain 568,161 535,643 561,712 1,097,355 6.1% 1.1%
Turkey 2,159,996 2,088,437 2,136,834 4,225,271 3.4% 1.1%
United Kingdom 119,410 121,390 124,109 245,499 -1.6% -3.8%
TOTAL 15,331,257 15,061,466 15,005,145 30,066,611 1.8% 2.2%
Notes: One Belgian AECM member, one Portuguese, one Romanian, and one Slovenian did not report data in 2016. For consistency
and comparability, the statistics also exclude the business figures of these members. The statistics do not include the business figures for one Hungarian AECM member and one further Romanian that only have a
Counter Guarantee activity.
Source: Authors, based on data from AECM (provisional figures)

61
5.2 SME Securitisation64
European SMEs heavily rely on bank lending; Figure 36 provides an indication based on IMF data. As outlined in more detail in Kraemer-Eis (2014), this ratio is moving towards more capital market action: Cour-Thimann and Winkler (2013) state that external financing of the non-financial corporate sector (financing other than retained earnings) is dominated by bank financing (in the euro area). However, as the authors point out, this split refers to the stock - in terms of flows the figures fluctuate significantly: in particular as the corporate sector can to some extent substitute bank lending with other sources of finance. For SMEs, this possibility exists only to a very limited extent. During the crisis, part of the declining bank lending was offset by an increase in capital market funding (see Figure 37): debt securities issued by corporations (but also quoted shares issued) increased. But, “such substitution is primarily possible for large corporations; it is less so for small and medium-sized firms, which constitute the bulk of employment and activity in the euro area” (Cour-Thimann and Winkler, 2013).
Figure 36: Reliance on bank financing by non-financial corporations (in %)
Source: Authors, based on IMF (2012) and updated information (as per YE/2016)
64 The term SME Securitisation (SMESec) comprises transactions backed by SME loans, leases, etc. It is important not only to look at banks/lending when analysing SMESec, but equally at leasing companies, which form part of the securitisation market. Given that bank financing is and will be less available for leasing companies post-crisis, it can be expected that SMESec will be particularly relevant in the leasing area. In particular, securitisation can help smaller originators to make use of the capital market (Moody’s, 2017a). For more information on the importance of leasing for SME finance, see Kraemer-Eis and Lang (2012 and 2014).

62
Given that SMEs have no direct access to the capital markets, a functioning securitisation market can transform illiquid loans to SMEs into an asset class with adequate market liquidity and can as such provide an indirect access to capital markets for SMEs.
Figure 37: Funding of non-financial corporations in the euro area and the United States (shares in accumulated debt transactions)
Source: Authors, based on Cour-Thimann and Winkler (2013), with updated data (as per end of Q2/2017)
Empirical literature shows that securitisation can strengthen the capacity of banks to supply new loans (Altunbas et al., 2007); as it can mitigate credit supply frictions, securitisation has the potential of having positive real effects on investment, sales, and employment (Berg et al., 2015). It is sometimes stated that securitisation might lead to higher risk taking by banks (or lower lending standards). This is neither confirmed by performance data, nor by research. Kara et al. (2015) analysed data from the euro-denominated syndicated loan market. They found out that, in the run up to the financial crisis, banks, relying on securitisation, did not lower their lending standards more than other institutions. Albertazzi et al. (2017) used credit register data for loans to Italian SMEs and tested for the presence of asymmetric information in the securitisation market by looking at the correlation between securitisation and default probability. They found that, despite the presence of asymmetric information, securitisation did not lead to lax credit standards. Rather, they found, that the quality of securitised loans is better than the one of non-securitised loans, i.e. a positive selection effect that takes place.
As we stated already in our previous publications: securitisation per se is not good or bad - it is a toolbox, an instrument, a technique. As such it is value-free; but its aggressive, opaque, and overly complex use by some market participants has negative consequences for ultimately both issuers as well as investors. Negative repercussions are however also created by an overly simplified discussion where everything related to structured finance is lumped together and sometimes dismissed or branded as “toxic”. The instrument is neither “toxic” nor is the underlying asset (in the case of SMESec: SME loans/leases) “toxic waste”.
0%
20%
40%
60%
80%
100%
2002-2008 2002-Q2/2017 2002-2008 2002-Q2/2017
Euro Area United States
Bank Non-bank

63
On the contrary - loans to SMEs are a key driver for the functioning of the economy and, properly applied, the securitisation technique is a replicable tool that can enhance access to finance for SMEs. Using this instrument in developed capital markets, public sector support for SMEs (e.g. guaranteeing mezzanine tranches) can create multiplier effects - and hence it is an efficient use of public resources, which is especially important against the background of scarce financial resources for public support and a high public debt burden in many key countries. ”Taken together, strengthening SME securitisation may be one of the most effective ways to facilitate the flow of funds to the real economy, while not creating too much distortion” (Kaya, 2014).
Also the ECB is interested in securitisation, including SMESec, mainly based on three reasons (Mersch, 2017): Firstly, as the ABS market acts as one of the transmission channels of the ECB monetary policy (facilitating the provision of credit to the real economy). Secondly, ABS form an important part of the collateral framework in the Eurosystem. The third reason for ECB’s motivation to be strongly interested in securitisation is that this technique can transfer risk away from the banking sector, which may support monetary policy.
The reputation of the SME securitisation market segment is continuously improving; a de-stigmatisation is happening, and the general perception is shifting from one of “toxic waste” to a means that could help overcome the negative effects of the crisis. However, as we will see later, SMESec placed with investors currently represents only a very small portion of the total issuance and there is for the time being only a very limited primary market.
5.2.1 SMESec market activity65
The European securitisation market had grown steadily from the beginning of the previous decade until the outbreak of the crisis. However, it is much smaller than its US peer (see Figure 38). During the crisis, issuance remained initially at high levels (compared to pre-crisis values) in Europe, but these volumes were almost exclusively driven by the eligibility of ABS as collateral for ECB liquidity operations;66 then the overall market activity decreased to the 2003/2004 levels.
To date, public issuance is still hindered in particular by the regulatory environment (and related uncertainties, a problem that now starts to downsize), by the availability of cheap funding for banks driven by the ultra-loose monetary policy, as well as by ECB eligibility rules under the repo-collateral framework that favour alternative instruments, such as sovereign bonds or secured or unsecured bank debt.67
Securitisation is a technique that needs significant know-how and sophisticated actors on the supply and demand side. However, in line with the shrinking activity volumes, the number of active market participants is also declining: there are a reduced number of active securitisation professionals, i.e. at investors, issuers, agents, etc.
65 If not flagged otherwise, the data source is AFME, the Association for Financial Markets in Europe. 66 The ECB’s asset repurchase or "repo" facility allows (among other assets) Asset Backed Securities to be used as collateral for funding. 67 The funding share of securitised loans to corporates was in Q1/2017 only around 4.2% and decreased by one quarter since mid-2011 (Moody’s, 2017a).

64
Issuance
In HY1/2017, the most active markets in terms of overall securitisation issuance were the UK (market share: 30%), France (18%), and Belgium (16%). The overall market activity in HY1/2017 (EUR 109bn) was around 18% lower than in HY1/2016 (EUR 132.3bn).68
SMESec issuance is still suffering from the crisis and remains at low levels. However, the overall issued volume of SME deals in HY1/2017 (EUR 9.2bn) was significantly higher than in the same period 2016 values (EUR 5.3bn, see Figure 39). The market share of SMESec in overall securitisation issuance rose (with some volatility) from 6% in 2001 to 18% (of total yearly issuance) in 2012, the highest value ever registered in Europe. This, however, came about due to the base effect, as the overall activity went down (while SMESec activity decreased slightly less). In HY1/2017, the share of SMESec was 8.4%, slightly higher than 2016 (same period and overall). We observe that total European ABS issuance volumes have roughly been stable during 2014 to 2016, while the specific weights of the different asset classes have been shifting. SMESec has been decreasing year to year due to a lower origination activity and to shrinking SME stocks in the financial intermediaries’ loan books.
Figure 38: Securitisation issuance Europe versus US (annual issuance 2000 – Q3/2017, bn EUR)
Source: Authors, based on data from AFME
68 This summary mainly covers HY1/2017 as detailed breakdowns for Q3 were not yet available at the time of preparing this chapter. In the first three quarters of 2017 securitisation issuance in Europe was 8% lower compared to the same period 2016 (EUR 159bn compared to EUR 172bn).
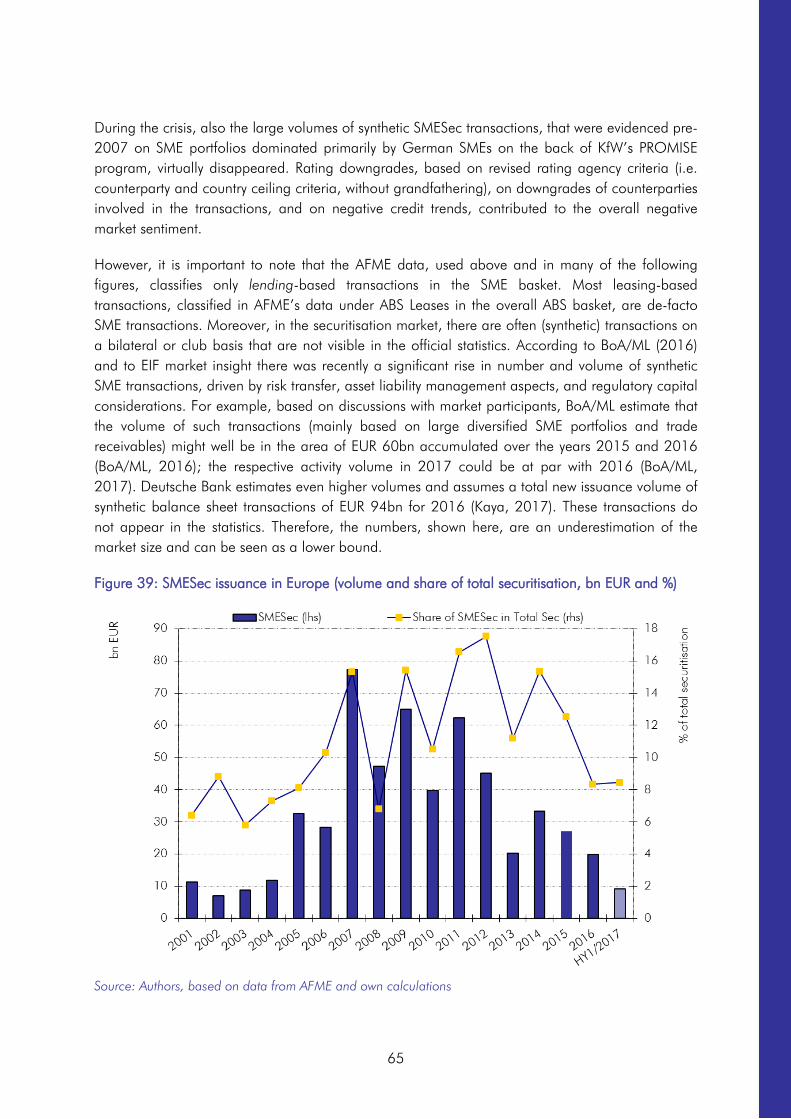
65
During the crisis, also the large volumes of synthetic SMESec transactions, that were evidenced pre-2007 on SME portfolios dominated primarily by German SMEs on the back of KfW’s PROMISE program, virtually disappeared. Rating downgrades, based on revised rating agency criteria (i.e. counterparty and country ceiling criteria, without grandfathering), on downgrades of counterparties involved in the transactions, and on negative credit trends, contributed to the overall negative market sentiment.
However, it is important to note that the AFME data, used above and in many of the following figures, classifies only lending-based transactions in the SME basket. Most leasing-based transactions, classified in AFME’s data under ABS Leases in the overall ABS basket, are de-facto SME transactions. Moreover, in the securitisation market, there are often (synthetic) transactions on a bilateral or club basis that are not visible in the official statistics. According to BoA/ML (2016) and to EIF market insight there was recently a significant rise in number and volume of synthetic SME transactions, driven by risk transfer, asset liability management aspects, and regulatory capital considerations. For example, based on discussions with market participants, BoA/ML estimate that the volume of such transactions (mainly based on large diversified SME portfolios and trade receivables) might well be in the area of EUR 60bn accumulated over the years 2015 and 2016 (BoA/ML, 2016); the respective activity volume in 2017 could be at par with 2016 (BoA/ML, 2017). Deutsche Bank estimates even higher volumes and assumes a total new issuance volume of synthetic balance sheet transactions of EUR 94bn for 2016 (Kaya, 2017). These transactions do not appear in the statistics. Therefore, the numbers, shown here, are an underestimation of the market size and can be seen as a lower bound.
Figure 39: SMESec issuance in Europe (volume and share of total securitisation, bn EUR and %)
Source: Authors, based on data from AFME and own calculations

66
In terms of countries, the market activity is concentrated: The SME related issuance in HY1/2017 occurred mainly in Belgium (EUR 5.7bn, 61% of SME issuance), Italy (EUR 2bn, 22%), and Portugal (EUR 1.2bn, 13%). Minor activity happened as well in Germany – see as well Figure 40 for an overview of the SMESec issuance by country over time.
Typical originators are large banks or banking groups – some of them are active as originators in several countries (e.g. UniCredit, Raiffeisen, ING Group), but as well mid-sized banks. Moreover, in particular in the field of leasing, non-bank asset finance providers are active as originators (for instance, Alba Leasing in Italy and the small and medium size asset-finance providers in the UK which are the primary target recipients of the British Business Bank’s ENABLE program)69.
As already mentioned, it is important to note that only a very small fraction of the issuance has been placed with investors – the investor base has not recovered (see Figure 41): the nature of the SMESec market changed from a developing market (pre-crisis, with most transactions placed in the primary market) to a purely retained/ECB repo-driven market during the crisis (with almost no placement on the primary market). This shift led to liquidity drying up and originators accepting higher all-in costs as, in addition to the credit enhancement, the repos envisage considerable haircuts to the face value of the notes.
Figure 40: European SMESec issuance during the crisis (by country, in bn EUR)
Source: Authors, based on data from AFME
69 See for more information e.g. http://british-business-bank.co.uk/become-a-partner/wholesale-solutions/.

67
Figure 41: European SMESec by retention (bn EUR and %)
Source: Authors, based on data from AFME
Outstanding
Due to low new activity levels, the volume of total outstanding securitisation transactions (see Figure 42) is on a downward trend (negative net supply). RMBS continues to be the most dominant securitisation type (by collateral). Compared to the end of 2015, until end of 2016, the total securitisation outstanding decreased further by around 2%. Since then, until the end of HY1/2017 a continued decrease by almost 2.6% happened. The overall decrease of volume in total outstanding securitisation transactions since the end of 2009 is 45%. During the same period, the volume of outstanding SMESec transactions decreased even stronger – it almost halved (minus 49%), from EUR 168bn to EUR 86.2bn (end of HY1/2017).
Breaking down SMESec volumes per end of HY1/2017 by country shows, that the main three countries together represent more than 63% in terms of outstanding: Belgium (EUR 20.5bn/23.8%), Spain (EUR 17.9bn, 20.8%), and Italy (EUR 16.2bn, 18.8%), see Figure 43. These countries are followed by Greece (8.6%), Germany (8.1%), UK (7.9%), and Portugal (5.9%).
46.8%
69.9%
99.6% 96.3% 98.0% 97.8%
86.1%
94.9% 92.0%
85.7%
99.6%
0%
10%
20%
30%
40%
50%
60%
70%
80%
90%
100%
0
10
20
30
40
50
60
70
80
90
100
bn E
UR
SMESec Placed (lhs) SMESec Retained (lhs) Retained as % of Total Issued (rhs)
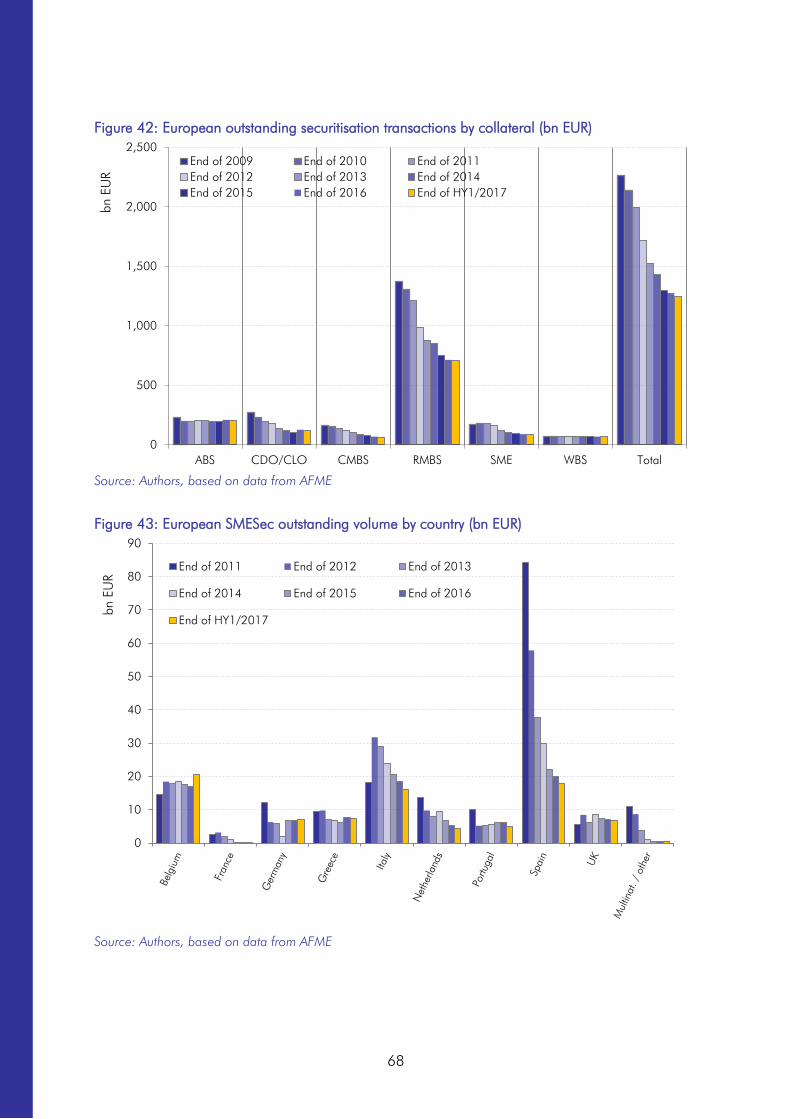
68
Figure 42: European outstanding securitisation transactions by collateral (bn EUR)
Source: Authors, based on data from AFME
Figure 43: European SMESec outstanding volume by country (bn EUR)
Source: Authors, based on data from AFME
0
500
1,000
1,500
2,000
2,500
ABS CDO/CLO CMBS RMBS SME WBS Total
bn E
UR
End of 2009 End of 2010 End of 2011End of 2012 End of 2013 End of 2014End of 2015 End of 2016 End of HY1/2017
0
10
20
30
40
50
60
70
80
90
bn E
UR
End of 2011 End of 2012 End of 2013
End of 2014 End of 2015 End of 2016
End of HY1/2017
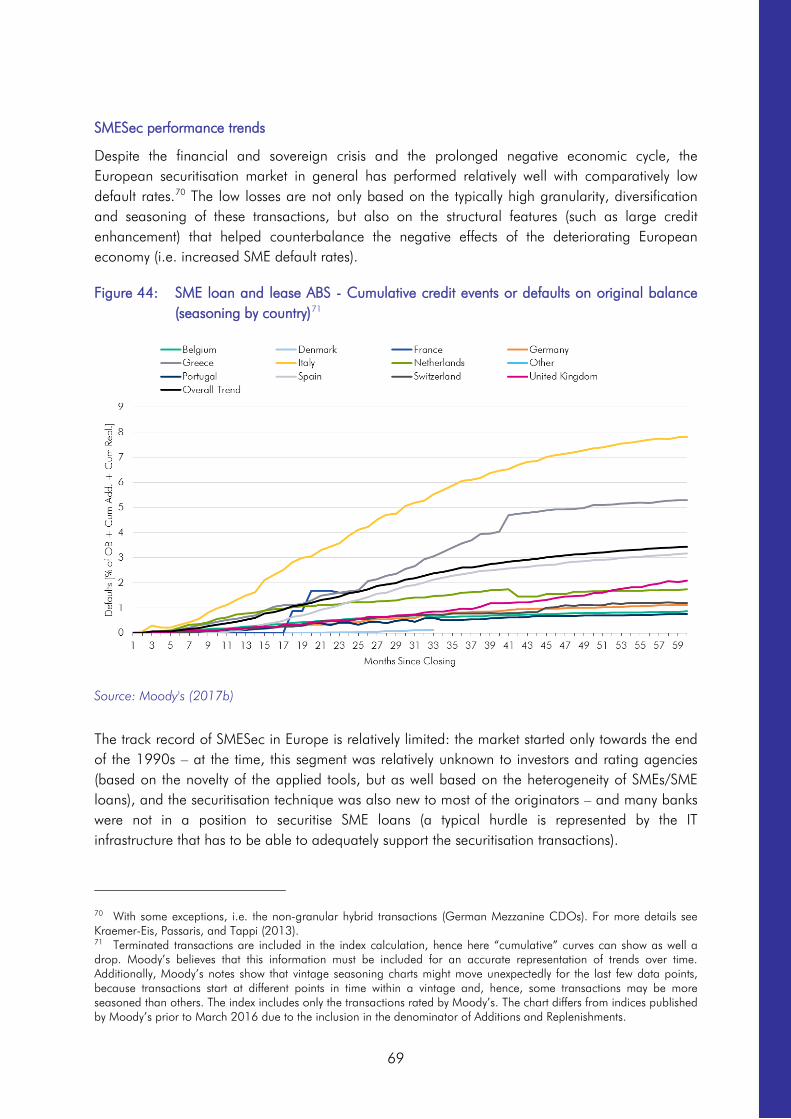
69
SMESec performance trends
Despite the financial and sovereign crisis and the prolonged negative economic cycle, the European securitisation market in general has performed relatively well with comparatively low default rates.70 The low losses are not only based on the typically high granularity, diversification and seasoning of these transactions, but also on the structural features (such as large credit enhancement) that helped counterbalance the negative effects of the deteriorating European economy (i.e. increased SME default rates).
Figure 44: SME loan and lease ABS - Cumulative credit events or defaults on original balance (seasoning by country)71
Source: Moody's (2017b)
The track record of SMESec in Europe is relatively limited: the market started only towards the end of the 1990s – at the time, this segment was relatively unknown to investors and rating agencies (based on the novelty of the applied tools, but as well based on the heterogeneity of SMEs/SME loans), and the securitisation technique was also new to most of the originators – and many banks were not in a position to securitise SME loans (a typical hurdle is represented by the IT infrastructure that has to be able to adequately support the securitisation transactions).
70 With some exceptions, i.e. the non-granular hybrid transactions (German Mezzanine CDOs). For more details see Kraemer-Eis, Passaris, and Tappi (2013). 71 Terminated transactions are included in the index calculation, hence here “cumulative” curves can show as well a drop. Moody’s believes that this information must be included for an accurate representation of trends over time. Additionally, Moody’s notes show that vintage seasoning charts might move unexpectedly for the last few data points, because transactions start at different points in time within a vintage and, hence, some transactions may be more seasoned than others. The index includes only the transactions rated by Moody’s. The chart differs from indices published by Moody’s prior to March 2016 due to the inclusion in the denominator of Additions and Replenishments.

70
On the one hand, before the crisis started, SMESec volumes were small compared to the overall securitisation market – and the market had not had much time to develop. On the other hand, the limited track record was one of the reasons for the relatively conservative SMESec structures which could explain the good SMESec performance in Europe compared to other segments of the European securitisation market and to the US.72 Figure 44 and Figure 45 show the cumulative credit events or defaults on original balance by country and by vintage (of the SME transactions in the EMEA region rated by Moody’s).
As explained in more detail in our previous working papers, the SMESec market has also been hit by a wave of downgrades due to weaker (crisis-driven) performance effects in the underlying portfolios, as well as rating methodology changes. Typically, AAA tranches show strong rating stability, but during the crisis also AAA and AA tranches migrated downward. This was mostly driven by downgrades of the respective country/sovereign ratings, and the limitation by the country ceilings, or they may be driven by downgrades of (not replaced) counterparties (whose rating is in turn affected by the respective sovereign ratings).
Figure 45: SME loan and lease ABS - Cumulative credit events or defaults on original balance (seasoning by vintage)73
Source: Moody's (2017b)
72 According to Standard & Poor’s (2014), only 1.58% of European Structured Finance notes (rated by Standard & Poor’s) outstanding in mid-2007 had defaulted by mid-2014. The cumulative default rate for SMESec transactions was at 0.55% – for comparison: the cumulative default rate for US Structured Finance notes was at 19.3%, the one for CDO of ABS was at 41.08%. Fitch (2017a) expects the total losses for pre-crisis vintage European structured finance transactions (2000 to 2008, transactions rated by Fitch) to be in the area of 0.9% (ABS: 0.2%), compared to 6.5% for the US. See also EBA (2014) for an analysis of historical credit performance of the securitisation market. 73 The chart differs from indices published by Moody’s prior to March 2016 due to the inclusion in the denominator of Additions and Replenishments.

71
The rating transition data shows that the downgrade pressure for SME transactions persists across all tranche levels. The example below (Table 6) shows the rating migration of SME Collateralised Loan Obligation (CLO) transactions (rated by Fitch, migration since transaction closing). For example, of all the tranches initially rated AAA, 68% (by number74) have paid in full (pif), 15% are still AAA, 5% moved down to AA etc.
Table 5: Fitch European SMEs Rating Transition Matrix (October 2017)75
% of tranches Current rating
PIF AAAsf AAsf Asf BBBsf BBsf Bsf CCCsf CCsf Csf
Initi
al R
atin
gs
AAAsf 68% 15% 5% 13% 0% 0% 0% 0% 0% 0%
AAsf 37% 4% 44% 7% 7% 0% 0% 0% 0% 0%
Asf 23% 4% 8% 58% 4% 4% 0% 0% 0% 0%
BBBsf 9% 0% 4% 9% 39% 9% 9% 0% 17% 4%
BBsf 0% 0% 0% 0% 8% 54% 8% 8% 23% 0%
Bsf 0% 0% 0% 8% 0% 25% 67% 0% 0% 0%
CCCsf 0% 0% 0% 0% 0% 14% 0% 14% 29% 43%
CCsf 0% 0% 0% 0% 0% 0% 0% 0% 0% 100%
Csf 0% 0% 0% 0% 0% 0% 0% 0% 0% 0%
Source: Fitch (2017b)
5.2.2 SMESec prospects
In general, a well-functioning securitisation market can be essential in helping financial intermediaries broaden their funding base, achieve capital relief and ultimately, increase their SME financing. However, the SMESec market in Europe is still underdeveloped. There are many advantages of SMESec – for banks, for investors, and – most importantly - for the SMEs (see for a detailed discussion Kraemer-Eis, Schaber, and Tappi (2010), Wehinger and Nassr (2015), Aiyar et al. (2015), Singh (2017) or the joint statement of eight leading trade associations: AFME et al. (2016)).
A recovery and development of the primary securitisation markets could play a role in unlocking credit supply and economic recovery. Moreover, in addition to the direct effects of the SMESec markets, there are indirect benefits to SMEs from the development of other securitisation segments that free up space on bank balance sheets to allow for further SME lending (AFME et al., 2016). However, this will only be to the benefit of SMEs if the freed-up capital / fresh liquidity is going to be used to finance the real economy (i.e. for new SME lending).
As described, even many years after the start of the financial crisis, the European SMESec has still not recovered. Several indirect76 support measures are aiming at a market revival, amongst which
74 Relative to the number of tranches in a given initial rating category. 75 The addition sf indicates a rating for structured finance transactions. 76 For example, in November 2014, the ECB started its Asset Backed Purchase Programme (ABSPP). The overall objective is to enhance the transmission of the monetary policy, support the provision of credit to the Euro Area economy and, as a result, to provide further monetary policy accommodation. The ECB’s support of the ABS market in general, and the SMESec market in particular, is a positive step. However, the programme has so far not achieved significant
72
are important regulatory adjustments (see Box 12 below for details). The envisaged signalling approach via simple, transparent, and standardised (STS)-labelled securitisations (incl. SMESec) - which receive preferential regulatory treatment – is an important step.77 In this context, the European Commission states that “[T]he development of a simple, transparent and standardised securitisation market constitutes a building block of the Capital Markets Union (CMU) and contributes to the Commission’s priority objective to support job creation and a return to sustainable growth. A high quality framework for EU securitisation can promote integration of EU financial markets, help diversify funding sources and unlock capital, making it easier for credit institutions and lenders to lend to households and business” (European Commission, 2015).78
Box 12: New regulation regime for securitisation – main aspects for SMESec The EC proposed a framework and started a legislative process; important milestones can be summarised as follows:
• On 08.12.2016, the ECON Committee of the European Parliament voted on its compromise text for the draft STS securitisation legislation. This text was an amended version of the original European Commission text and was then brought together with the Council text agreed last December. The securitisation package, which includes STS and a revised regulatory framework for capital charges for credit institutions and investment firms originating, sponsoring or investing in securitisation products (CRR amendments) subsequently entered into a reconciliation process involving the European Commission, the European Council, and the European Parliament – the “Trilogue negotiation”.
•The Trilogue negotiation started in January 2017 under the Maltese Presidency of the EU Council. On 30.05.2017, the presidency of the Council of the EU reached an agreement with European Parliament representatives on the “securitisation package”, comprising STS and a revised capital charges framework for credit institutions and investment firms originating, sponsoring or investing in securitisation products (CRR amendments).
The agreement covers two regulations: The first one brings together rules that apply to all securitisations, including STS, which are currently scattered amongst different legal acts. It aims at ensuring “consistency and convergence across sectors (such as banking, asset management and insurance), and streamlines and simplifies existing rules” (Council of the EU 2017a). In addition, it establishes a general and cross-sector regime to define and set rules related to STS securitisation. It is important to highlight that the STS concept does not refer to the quality of the underlying assets involved, but to the process by which the securitisation is structured (Council of the EU 2017a).
volumes, moreover, as it is based on publicly placed transactions, there is almost no direct impact on the SME segment on the market. As per end of September 2017, EUR 24.076bn have been bought by the ECB (mainly in the secondary market), compared to around EUR 231.314bn under the Covered Bond Purchase Programme (source: ECB). 77 We use here STS as term – in the discussion, also other terminologies were and are used in the same context, e.g. HQS (high quality securitisation) or STC (simple, transparent and comparable) securitisation, used by BCBS-IOSCO, or SST (simple, standard and transparent) securitisation, used by the European Banking Authority. The STS acronym will prevail in European regulation. 78 For more information on the relation between CMU and SME financing see section 8 in the Concluding Remarks of this working paper. See as well Kraemer-Eis and Lang (2017) for a detailed overview.
73
Box 12, continued:
The other part of the agreement amends regulation 575/2013 (Capital Requirements Regulation, “CRR”) on bank capital requirements. It sets out capital requirements for positions in securitisation, which aims at providing for “a more risk-sensitive regulatory treatment for STS securitisations” (Council of the EU 2017a). One of the main political issues resolved relates to the risk retention requirement.
The May 30th Trilogue agreement that followed intensive negotiations between the three parties introduced a number of changes in the securitisation regulation, amongst which:
• A reversion on the hierarchy of approaches to measuring capital requirements. The new Art. 254 of the CRR will provide the option for financial intermediaries to apply the three-tier hierarchy of approaches in the following order: SEC-IRBA, SEC-SA, SEC-ERBA79. There are however circumstances whereby the institutions will be able to keep on using the existing hierarchy order (i.e. SEC-ERBA ahead of SEC-SA), should that be more advantageous for them. Amongst the various consequences of this change, it is noteworthy pointing out the fact that non-IRB banks, by being allowed to use a formula-based approach (the SEC-SA), may be in a position to use synthetic securitisation for regulatory capital relief purposes.
• Risk retention will remain set at 5%, even though EBA/ESMA will need to provide an RTS (regulatory technical standard) addressing further details of the technical implementation. The requirement will ensure that securitised products are not created solely for the purpose of distribution to investors.
• Particular emphasis has been given to securitisation transactions that would have an impact to the real economy and more specifically to the European SMEs. Agreed language under the amendments in the CRR allow synthetic securitisation transactions for SME portfolios under certain conditions, to benefit from the lower capital charges that are reserved for STS deals.
Other elements of the agreement include the creation of a data repository system for securitisation transactions, which will increase market transparency, and a light-touch authorisation process for third parties that assist in verifying compliance with STS securitisation requirements. The aim of the latter is to prevent conflicts of interest. The text makes clear that, even when a third party is involved in the STS certification process, liability for compliance with the rules remains completely with originators, sponsors, original lenders and securitisation special purpose entities (Council of the EU 2017a).
On 26th October, the European Parliament voted in favour of the STS- and the CRR-regulation. The European Council adopted the securitisation rules on the 20th November (Council of the EU, 2017b). All in all, the regime brings out important features of the future STS securitisation market segment. The fog around the future regulation design is lifting – which is good in order to reduce uncertainty. We note that the requirements of the STS regulation consist of a “light” set of high quality criteria, which in turn translates in a marginal (rather than substantial) reduction in the risk-weights.
According to the European Commission (2017b), “the swift implementation of the securitisation package could unlock up to EUR 150bn of additional funding to the real economy”.
Interpreting the effects of the new regulations, it has to be borne in mind that the proposed risk weights for STS will still result in increased capital requirements for IRB banks compared to today.
79 SEC-IRBA and SEC-SA are approaches based on formulae whose inputs refer to the underlying portfolio. SEC-ERBA is an approach predetermined, raring-dependent, risk-weights. See for an explanation of the different approaches under Basel III Kraemer-Eis, Passaris, Tappi, Inglisa (2015).

74
Moreover, another perspective regarding STS - mentioned by some market participants - is that it can even circumvent a proper securitisation market recovery if “everything but STS” is still seen as being toxic. It remains to be seen if the new regime is going to be a success, but it has potential to significantly support the revival of the market in Europe. Implementation will start from January 2019 onwards. Some precisions of the new regimes still need to be provided by EBA (partially in cooperation with ESMA and EIOPA) in the form of technical standards (Moeglich, 2017).
An area that still has to be calibrated is the Solvency II capital rules. High charges on securitisations are preventing insurance companies from providing long-term investment capital to the securitisation markets. This has a negative impact of the potential revival of the investor base. In addition, a revival of the securitisation market also depends on the overall monetary policy of the ECB and related quantitative tapering. “Put bluntly, so long as financial actors can obtain free money from their central bank there will remain little incentive to access more expensive funding sources such as securitisation” (Bell, 2017).
As mentioned above, from the perspective of direct public support, strengthening the SME securitisation market can be an effective way to facilitate the flow of funds to the real economy, while not creating too much distortion. Integrated EU capital markets (and their need for transparency and standardisation) and the relative complexity of securitisation techniques require considerable know-how and show the necessity for specialised institutions. As an established and respected player in the European market, EIF, also in close cooperation with the EIB, plays an important role via market presence, reputation building, and signalling. Its securitisation activities, as well as initiatives and latest developments are explained in detail in Kraemer-Eis, Passaris, Tappi and Inglisa (2015).
Over the recent past, EIF has been involved in a number of diverse and innovative transactions. Market appetite has been especially strong with respect to synthetic securitisation EIF has provided guarantees to Italian, Austrian, German, French and Spanish financial intermediaries, allowing them to partially release regulatory capital absorbed by the securitised portfolios. In Italy, EIF is rolling out the SME Initiative, a programme aimed at guaranteeing existing portfolio, in exchange for the financial intermediary’s commitment to lend to SMEs in the following three years at a discounted interest rate.80 On the funding front, mezzanine transactions have dominated the scene, with EIF providing guarantees on mezzanine tranches purchased by institutional investors, including the members of the below defined ENSI platform. In general, EIF sees slightly increasing interest by private investors in the senior parts of funding transactions that come to the market, and therefore looks more at mezzanine transactions in order to support the market revival.81
We expect synthetic deals to represent an important portion of our future pipeline. Moreover, new types of transactions are appearing on the market, and new initiatives are emerging. We presented recently (Kraemer-Eis et al., 2016a) an example of a new type of transaction (SBOLT-2016-1) that can be seen as a milestone in the area of marketplace lending securitisation. This transaction shows that the securitisation technique can be applied to new types of originators. Furthermore, a platform as cooperation between EIF and National Promotional Institutions (NPIs), the EIF-NPIs 80 SME Initiative Italy: http://www.eif.org/what_we_do/guarantees/sme_initiative/smei_italy/index.htm 81 EIF’s ambition is to incentivise private investors and not to crowd them out.

75
Securitisation Initiative (ENSI), has been launched and is active.82 In addition, Italy recently opted-in to the so-called SME Initiative as the first country to implement the securitisation instrument.83 Last, but not least, an envisaged intensified use of the resources of the European Fund for Strategic Investments for securitisation transactions might give additional boost to the revival of the European SMESec market (see the Concluding Remarks of this Working Paper for details about EFSI).
82 The ENSI partner institutions are EIF, EIB, bpifrance (FR), British Business Bank (BBB, UK), Cassa Depositi e Prestiti (CDP, IT), Kreditanstalt für Wiederaufbau (KfW, DE), Instituição Financeira de Desenvolvimento (IFD, PT), Instituto de Credito Oficial (ICO, ES), Malta Development Bank Working Group (MT), and the European Bank for Reconsturction and Development (EBRD). For more details see: http://www.eif.org/what_we_do/guarantees/ENSI/index.htm 83 For more information see: http://www.eif.org/what_we_do/guarantees/sme_initiative/index.htm.
76
6 Microfinance market
6.1 Microfinance and social inclusion
6.1.1 What is Microfinance?
“Microcredit is generally recognised […] as an effective financing channel for job creation and social inclusion, which can attenuate the adverse effects of the current financial crisis while contributing to entrepreneurship and economic growth in the EU” (European Commission, 2012). In Europe, microfinance consists mainly of small loans (less than EUR 25,000) that are tailored to microenterprises (see Box 13 for an elaboration on some definitions) and people who aspire self-employed but face difficulties in accessing the traditional banking system. Throughout the EU, 93 percent of all SMEs are microenterprises and they account for 30 percent of total employment.
Box 13: Microfinance and Inclusive Finance
A microenterprise is any enterprise with fewer than 10 employees and a turnover below EUR 2m (as defined in the Commission Recommendation 2003/361/EC of 6 May 2003, as amended).
A microfinance institution (MFI) is an organisation/financial intermediary that provides microfinance services. There is a wide spectrum of different MFI business models in Europe.
Microcredit in general is defined by the European Commission as a loan or lease under EUR 25,000 to support the development of self-employment and microenterprises. It has a double impact: (1) an economic impact, as it allows the creation of income generating activities, and (2) a social impact, as it contributes to the financial inclusion and, thus, to the social inclusion of individuals.
Microfinance, as a general term, is traditionally defined as the provision of basic financial services to poor (low-income) people who traditionally lack access to banking and related services (CGAP Definition, Consultative Group to Assist the Poor). However, more and more often, the definition is used in a wider sense, also to include financial services to existing microenterprises. This wider concept is used in the present text and in order to achieve a pragmatic approach, we follow a differentiation introduced by EMN (2012):
Microenterprise lending = micro-lending to existing enterprises. Organisations that implement the lending model of microenterprise lending tend to focus on the upper end market of microfinance, providing loans to bankable or nearly bankable microenterprises that have difficulties accessing loans up to 25,000 EUR from commercial banks due to risk aversion or lacking liabilities. The average volume of the provided loans is markedly higher than in the model of social inclusion lending, meant to support the start or stabilisation of microenterprises with a growth perspective. The maximum loan sizes go up to 25,000 EUR (or even higher in some cases).
Social inclusion lending = lending to self-employed individuals that are excluded from banking services, due to their socioeconomic status of being socially excluded or (long term) unemployed and/or belonging to financially excluded population groups like ethnic minorities or young people. The average loan sizes are relatively low, meant to support basic income creating activities.
Inclusive Finance = Inclusive Finance is the range of financial and non-financial products and services provided to unemployed people or clients from other vulnerable groups who are facing difficulties in accessing the conventional banking services, due to their socioeconomic status, and more broadly to social-enterprises who provide e.g. work-integration opportunities or services to groups deemed vulnerable from a socioeconomic standpoint.

77
The microfinance market in Europe remains highly fragmented and diverse, with no common business model (see for example, Kraemer-Eis and Conforti (2009) and Bruhn-Leon, Eriksson and Kraemer-Eis (2012)). Part of this fragmentation has geographical roots, as the role of microfinance is seen very differently across Europe. In Western Europe, microfinance is considered to be a social policy tool, as it serves businesses that are not commercially attractive for the mainstream financing providers, but nevertheless are able to create social value. In Eastern Europe on the other hand, microfinance is seen more as a business activity, which targets viable microenterprises that are financially excluded because the traditional credit market remains underdeveloped (for a discussion on the principles driving credit rationing, see section 5.1.1).
6.1.2 A support tool for necessity-driven business creation
Microfinance is an essential tool to facilitate necessity-driven business creation, which arises when entrepreneurship is driven by push-factors that originate from adverse conditions in the labour market. That is, when a combination of poor labour market prospects and poverty drives people to start new businesses. This is not to say that every unemployed individual would be eligible to become a successful entrepreneur, but it does imply that countries faced with adverse labour market conditions provide a fertile ground for necessity-driven entrepreneurial activity. Therefore, this section discusses some important indicators related to unemployment, poverty and social exclusion.
Figure 46: People at risk of poverty or social exclusion (percentage of total population)
Source: Authors, based on data from Eurostat
In the context of the Europe 2020 social inclusion targets, Eurostat has constructed the “people at risk of poverty or social exclusion” indicator84, depicted in Figure 46. The indicator corresponds to the sum of individuals who are at risk of poverty, after social transfers, are severely materially deprived, or are living in households with very low work intensity.85 Per 2016, nearly one fourth of
84 See the Eurostat internet site on the Europe 2020 indicators at: http://epp.eurostat.ec.europa.eu/portal/page/portal/europe_2020_indicators/headline_indicators. 85 Individuals are only counted once, even if they are present in several sub-indicators. At risk-of-poverty are persons with an equivalised disposable income below the risk-of-poverty threshold, which is set at 60 % of the national median
23.5
0
10
20
30
40
50% 2015 2016
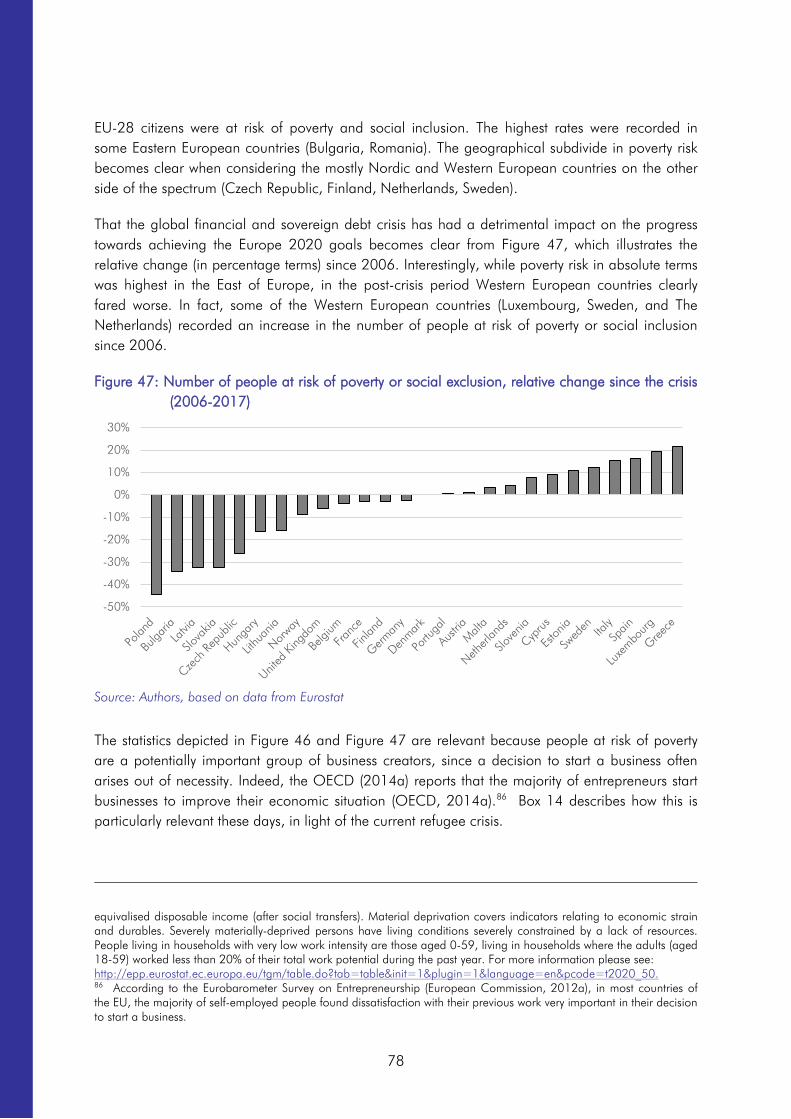
78
EU-28 citizens were at risk of poverty and social inclusion. The highest rates were recorded in some Eastern European countries (Bulgaria, Romania). The geographical subdivide in poverty risk becomes clear when considering the mostly Nordic and Western European countries on the other side of the spectrum (Czech Republic, Finland, Netherlands, Sweden).
That the global financial and sovereign debt crisis has had a detrimental impact on the progress towards achieving the Europe 2020 goals becomes clear from Figure 47, which illustrates the relative change (in percentage terms) since 2006. Interestingly, while poverty risk in absolute terms was highest in the East of Europe, in the post-crisis period Western European countries clearly fared worse. In fact, some of the Western European countries (Luxembourg, Sweden, and The Netherlands) recorded an increase in the number of people at risk of poverty or social inclusion since 2006.
Figure 47: Number of people at risk of poverty or social exclusion, relative change since the crisis (2006-2017)
Source: Authors, based on data from Eurostat
The statistics depicted in Figure 46 and Figure 47 are relevant because people at risk of poverty are a potentially important group of business creators, since a decision to start a business often arises out of necessity. Indeed, the OECD (2014a) reports that the majority of entrepreneurs start businesses to improve their economic situation (OECD, 2014a).86 Box 14 describes how this is particularly relevant these days, in light of the current refugee crisis.
equivalised disposable income (after social transfers). Material deprivation covers indicators relating to economic strain and durables. Severely materially-deprived persons have living conditions severely constrained by a lack of resources. People living in households with very low work intensity are those aged 0-59, living in households where the adults (aged 18-59) worked less than 20% of their total work potential during the past year. For more information please see: http://epp.eurostat.ec.europa.eu/tgm/table.do?tab=table&init=1&plugin=1&language=en&pcode=t2020_50. 86 According to the Eurobarometer Survey on Entrepreneurship (European Commission, 2012a), in most countries of the EU, the majority of self-employed people found dissatisfaction with their previous work very important in their decision to start a business.
-50%
-40%
-30%
-20%
-10%
0%
10%
20%
30%
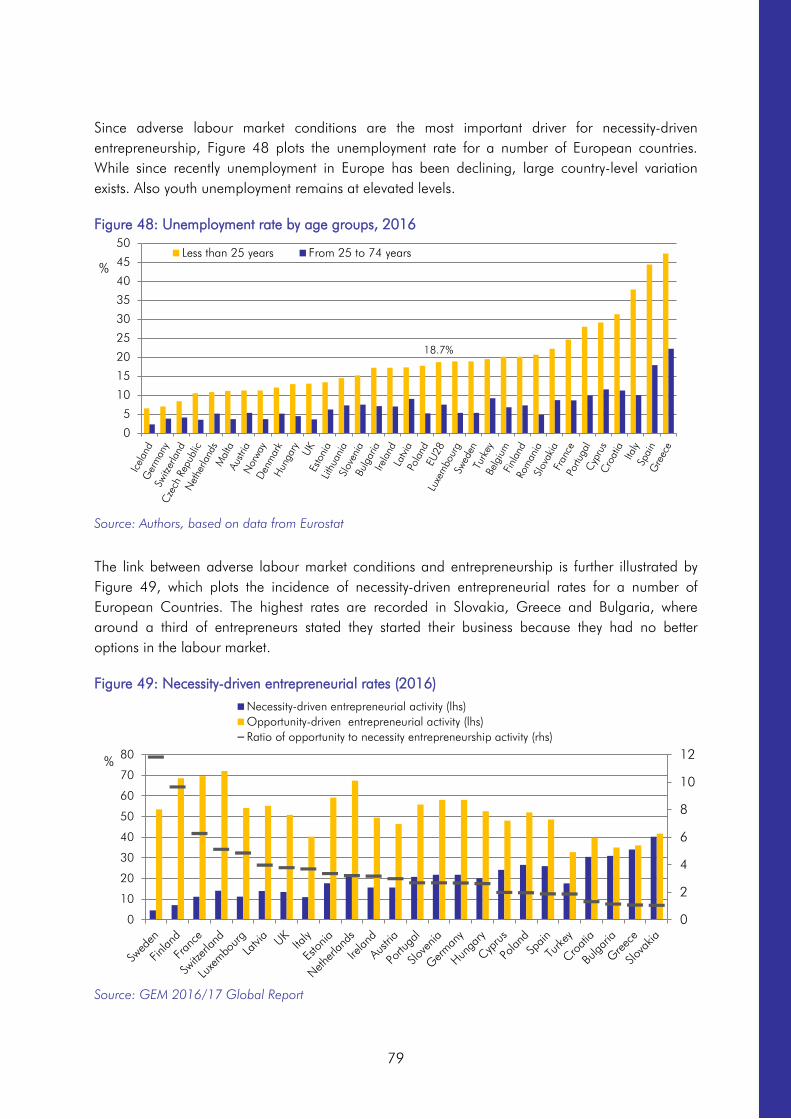
79
Since adverse labour market conditions are the most important driver for necessity-driven entrepreneurship, Figure 48 plots the unemployment rate for a number of European countries. While since recently unemployment in Europe has been declining, large country-level variation exists. Also youth unemployment remains at elevated levels.
Figure 48: Unemployment rate by age groups, 2016
Source: Authors, based on data from Eurostat
The link between adverse labour market conditions and entrepreneurship is further illustrated by Figure 49, which plots the incidence of necessity-driven entrepreneurial rates for a number of European Countries. The highest rates are recorded in Slovakia, Greece and Bulgaria, where around a third of entrepreneurs stated they started their business because they had no better options in the labour market.
Figure 49: Necessity-driven entrepreneurial rates (2016)
Source: GEM 2016/17 Global Report
18.7%
0
5
10
15
20
25
30
35
40
45
50
% Less than 25 years From 25 to 74 years
0
2
4
6
8
10
12
0
10
20
30
40
50
60
70
80%
Necessity-driven entrepreneurial activity (lhs)Opportunity-driven entrepreneurial activity (lhs)Ratio of opportunity to necessity entrepreneurship activity (rhs)
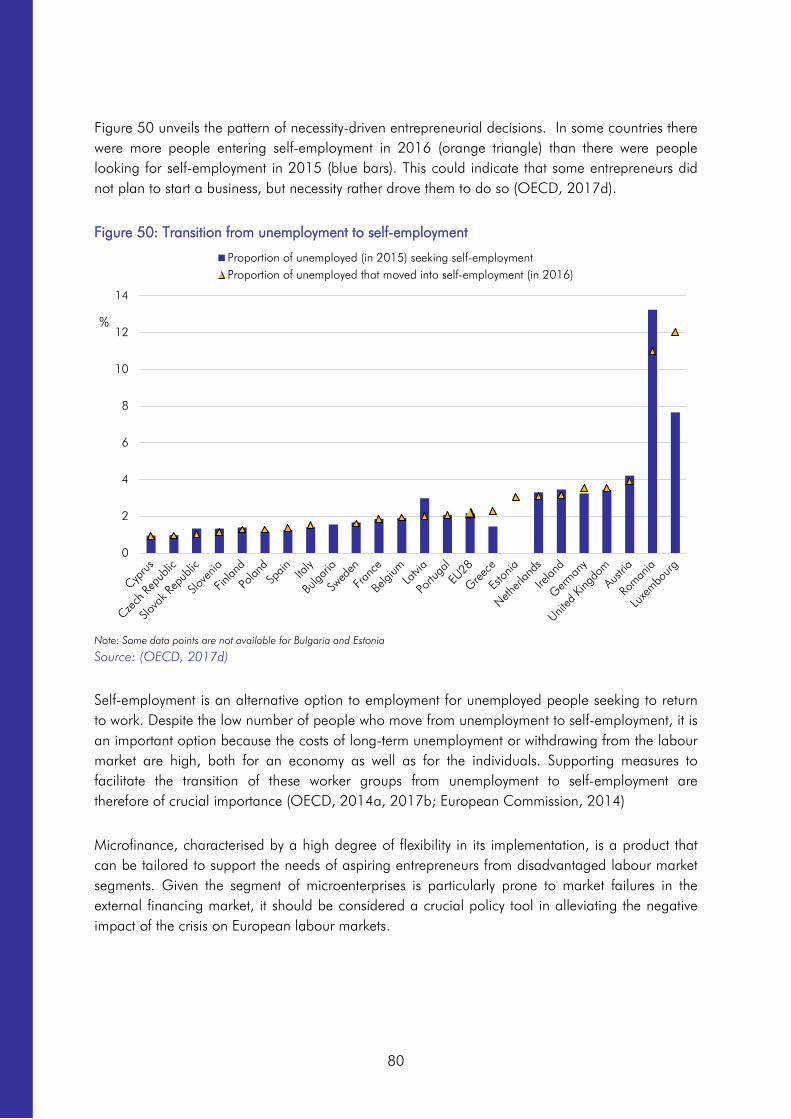
80
Figure 50 unveils the pattern of necessity-driven entrepreneurial decisions. In some countries there were more people entering self-employment in 2016 (orange triangle) than there were people looking for self-employment in 2015 (blue bars). This could indicate that some entrepreneurs did not plan to start a business, but necessity rather drove them to do so (OECD, 2017d).
Figure 50: Transition from unemployment to self-employment
Note: Some data points are not available for Bulgaria and Estonia
Source: (OECD, 2017d)
Self-employment is an alternative option to employment for unemployed people seeking to return to work. Despite the low number of people who move from unemployment to self-employment, it is an important option because the costs of long-term unemployment or withdrawing from the labour market are high, both for an economy as well as for the individuals. Supporting measures to facilitate the transition of these worker groups from unemployment to self-employment are therefore of crucial importance (OECD, 2014a, 2017b; European Commission, 2014)
Microfinance, characterised by a high degree of flexibility in its implementation, is a product that can be tailored to support the needs of aspiring entrepreneurs from disadvantaged labour market segments. Given the segment of microenterprises is particularly prone to market failures in the external financing market, it should be considered a crucial policy tool in alleviating the negative impact of the crisis on European labour markets.
0
2
4
6
8
10
12
14
%
Proportion of unemployed (in 2015) seeking self-employmentProportion of unemployed that moved into self-employment (in 2016)
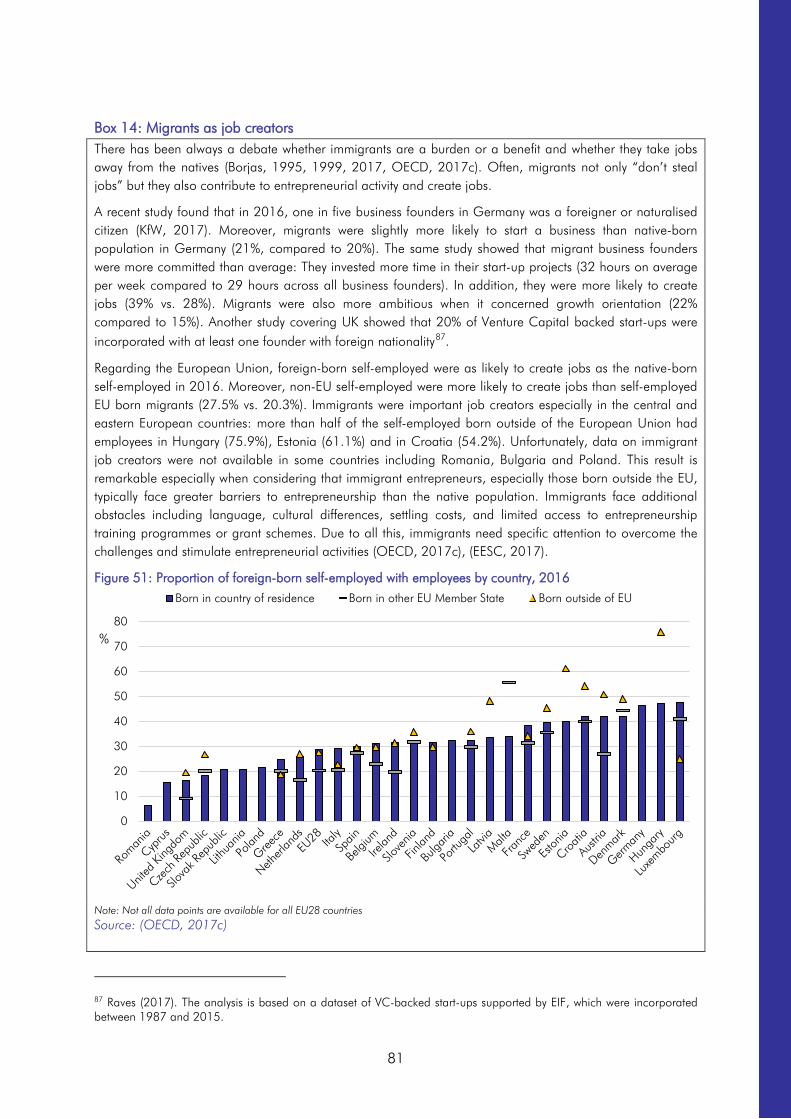
81
Box 14: Migrants as job creators There has been always a debate whether immigrants are a burden or a benefit and whether they take jobs away from the natives (Borjas, 1995, 1999, 2017, OECD, 2017c). Often, migrants not only “don’t steal jobs” but they also contribute to entrepreneurial activity and create jobs.
A recent study found that in 2016, one in five business founders in Germany was a foreigner or naturalised citizen (KfW, 2017). Moreover, migrants were slightly more likely to start a business than native-born population in Germany (21%, compared to 20%). The same study showed that migrant business founders were more committed than average: They invested more time in their start-up projects (32 hours on average per week compared to 29 hours across all business founders). In addition, they were more likely to create jobs (39% vs. 28%). Migrants were also more ambitious when it concerned growth orientation (22% compared to 15%). Another study covering UK showed that 20% of Venture Capital backed start-ups were incorporated with at least one founder with foreign nationality87.
Regarding the European Union, foreign-born self-employed were as likely to create jobs as the native-born self-employed in 2016. Moreover, non-EU self-employed were more likely to create jobs than self-employed EU born migrants (27.5% vs. 20.3%). Immigrants were important job creators especially in the central and eastern European countries: more than half of the self-employed born outside of the European Union had employees in Hungary (75.9%), Estonia (61.1%) and in Croatia (54.2%). Unfortunately, data on immigrant job creators were not available in some countries including Romania, Bulgaria and Poland. This result is remarkable especially when considering that immigrant entrepreneurs, especially those born outside the EU, typically face greater barriers to entrepreneurship than the native population. Immigrants face additional obstacles including language, cultural differences, settling costs, and limited access to entrepreneurship training programmes or grant schemes. Due to all this, immigrants need specific attention to overcome the challenges and stimulate entrepreneurial activities (OECD, 2017c), (EESC, 2017).
Figure 51: Proportion of foreign-born self-employed with employees by country, 2016
Note: Not all data points are available for all EU28 countries Source: (OECD, 2017c)
87 Raves (2017). The analysis is based on a dataset of VC-backed start-ups supported by EIF, which were incorporated between 1987 and 2015.
0
10
20
30
40
50
60
70
80%
Born in country of residence Born in other EU Member State Born outside of EU

82
6.2 The demand for microfinance: microenterprises and their finance decisions
Microenterprises, making up 93% of all European businesses, are important contributors to employment and account for 30% of total employment. Micro-businesses seem to be relatively more important in countries with elevated unemployment levels. In Spain, Portugal and Italy employment by microenterprises accounts for more than 40% of total employment and in Greece this amounts to almost 60% (Figure 52).
Figure 52: Relative employment share by microenterprises compared to other enterprise size classes, 2016
Source: European Commission, 2017a
While microenterprises are an important element in the European economic fabric, they generally face more challenging conditions compared to their larger counterparts. This is evidenced by Figure 53, which illustrates microenterprises’ perception about the current economic climate and compares it to larger firms’ perception. For the second half of 2017, microenterprises are on balance expecting a positive change (17.3%) in their overall situation, thereby being less optimistic than their larger counterparts. The UEAPME survey furthermore reveals that they expect their investment climate to worsen (UEAPME, 2017).
Microenterprises, on balance, reported almost no change in needs for bank loans. Almost half of the microenterprises indicated that bank loans were relevant sources of financing. However, only 12% used bank loans, presumably due to difficult access to finance. Figure 54 shows that the usage of different financing sources on average typically increases with the size of the SME. 20% of microenterprises reported they applied for a bank loan, out of which almost one third applied for microloans (more on the outcome of the applications, see subchapter 6.4)
0%
10%
20%
30%
40%
50%
60%
70%
80%
90%
100%
Gre
ece
Italy
Slov
akia
Spai
n
Portu
gal
Cyp
rus
Pola
nd
Slov
enia
Belg
ium
Hun
gary
Fran
ce
Latv
ia
Mal
ta
Cro
atia
Cze
ch R
epub
lic
Esto
nia
Bulg
aria
EU28
Irela
nd
Lith
uani
a
Net
herla
nds
Swed
en
Aus
tria
Finl
and
Rom
ania
Ger
man
y
Den
mar
k
Luxe
mbo
urg
Uni
ted
King
dom
micro small medium large

83
Figure 53: Overall situation of European microenterprises compared to other size classes
Source: UEAPME Study Unit (2017)
Figure 54: Different financing sources used by enterprises (by enterprise size class), HY1/2017
Source: Authors, based on ECB SAFE (2017b) data
6.3 The supply of microfinance: a sector characterised by significant diversity
European microfinance providers are very diverse across Europe. In addition to commercial banks that target microenterprises as part of their general SME lending activity, the spectrum of European microcredit developers includes many profit-oriented and non-profit associations: microfinance associations, credit unions, cooperatives, Community Development Financial Institutions (CDFIs), non-bank financial institutions (NBFIs), government bodies, religious institutions and Non-Governmental Organisations (NGOs). The focus of MFIs’ activities changes from Western to Eastern Europe. Most of the MFIs in Eastern Europe are mainly focused on micro-lending. In contrast, Western European MFIs provide a more diversified set of financial products, not only to microenterprises but to bigger enterprises as well. Moreover, Eastern European MFIs are more
-25-20-15-10-505
1015202530%
Microenterprises Small Enterprises Medium-sized Enterprises
0
5
10
15
20
25
30
35
40
45
50
Micro Small Medium Large
%
Bank loan
Bank overdraft
Trade credit
Leasing or hire-purchase
Factoring

84
focused on providing financial products and services, while Western European MFIs provide both, financial and non-financial products and services. The duality indicates that the development process of the microfinance sector is highly dependent on the geographic market under consideration.
According to the latest survey by EMN-MFC88, almost two thirds of all surveyed MFIs reported that their main mission was financial inclusion (72%), followed by job creation (70%), and social inclusion and poverty reduction (59%).
The latest market data show that, per 2015, a minimum of 747,265 microenterprises and start-ups received support by the surveyed organisations, an increase of 13% compared to 2014. Over that same period, total lending volume increased by 15% and reached EUR 2.5 billion. Average loan size remained roughly stable over the last 2 years (EUR 6,104 in 2014 and EUR 6,072 in 2015).
The average loan sizes adjusted by the GNI per capita are higher in Eastern European countries than in Western European countries, meaning that western clients are relatively poorer. It again indicates the fundamental difference in the role of microfinance between these two regions of Europe.
Figure 55: Microcredit conditions in Europe per 2015
Note: AIR is average interest rate, GNI is Gross National Income
Source: Authors, based on data from EMN-MFC (2016)
The average sizes of microloans are also quite different for business and personal consumption: in 2015, the average business loans were almost five times higher than the average personal microloans (EUR 7,947 versus EUR 1,697). The average interest rate charged by the surveyed MFIs for business consumption purpose was 10.7% with an average loan term of 41 months, while the average interest rate charged for personal consumption purpose was 19% with an average loan term of 30 months (EMN-MFC, 2016).
88 The European Microfinance Network (EMN) and Microfinance Center (MFC)’s Overview of the microcredit sector in Europe for the period 2014-2015 is based on a survey among 149 MFIs in 22 countries.
0%
20%
40%
60%
80%
100%
120%
0%
5%
10%
15%
20%
25%
30%AIR (lhs) Average loan size, % of GNI per capita (rhs)

85
Moreover, the characteristics of microloans for business purposes differ strongly between countries (Figure 55). According to the recent EMN-MFC survey for the period 2014-2015, the average interest rate among the surveyed microfinance providers amounted to 10.7% in 2015, but ranged from 3% in Poland and Finland, to as high as 18% in Bulgaria and Romania, and even higher in non-EU Balkan states.
Next to geographical diversity, the microfinance sector is also characterised by diversity across different MFI types. For example, interest rates on business loans charged by NBFIs are on average higher than those charged by NGOs and Government bodies. The level of the interest rate charged by MFIs depends on their funding structure, among other things. For example, in Poland, where the average interest rate is the lowest, 30% of funding sources come from grants, while in Bulgaria, Romania and in non-EU Balkan countries the surveyed MFIs don’t depend on grants at all.
Microloan amounts and terms also vary greatly across and within the types of MFIs. The average loan size as a percentage of GNI per capita reported by NGOs is significantly higher than reported by NBFIs (52.2% versus 29.6%). Moreover, NGOs in Eastern Europe reported 74.6%, while their western counterparts reported 17.3%, on average. Regarding the average microloan term, NGOs reported 46 months, while NBFIs reported 37. Within the surveyed NGOs, terms varied from 5 to 96 months (EMN-MFC, 2016).
The differences in average interest rates are typically related to differences in the legal framework, MFI business models, pricing policies, refinancing cost, cost structure and the subsidy levels. Micro-loans are usually offered with a special focus on social inclusion. Higher interest rates (“high” compared to “standard” lending business) for micro-loans typically reflect the non-subsidised, cost-covering business models (often MFIs in the central-eastern part of the EU), while the lower interest rates are reflecting higher prevalence of social microfinance, corporate social responsibility initiatives, and MFIs with subsidised, partly grant-dependent business models (often in the western part of the EU). Typically, for-profit institutions charge higher interest rates (cost coverage) and grant larger loans (economies of scale). However, it is important to note that profit orientation is consistent with a socially-oriented investment strategy. In fact, the microloan business model, if operated on sustainable terms in the long run, inherently requires relatively high interest rates (Bruhn-Leon, Eriksson, and Kraemer-Eis, 2012).
6.4 The microenterprise financing gap
The challenges for microenterprises to access external financing are even greater than for other (bigger) types of SMEs. Almost by construction, these are young firms without prior track record or formal reporting obligations. In addition, necessity-driven entrepreneurs, again by definition, are highly unlikely to meet the required collateral requirements often demanded by traditional finance market players (OECD/ European Commission, 2014). This implies that credit rationing becomes particularly relevant for this sub segment of the market.89 This section discusses some indicators that illustrate how access to finance often is restricted for vulnerable labour market segments and microenterprises.
89 For a full discussion on the mechanisms underlying finance market failures and credit rationing, see 5.1.1.
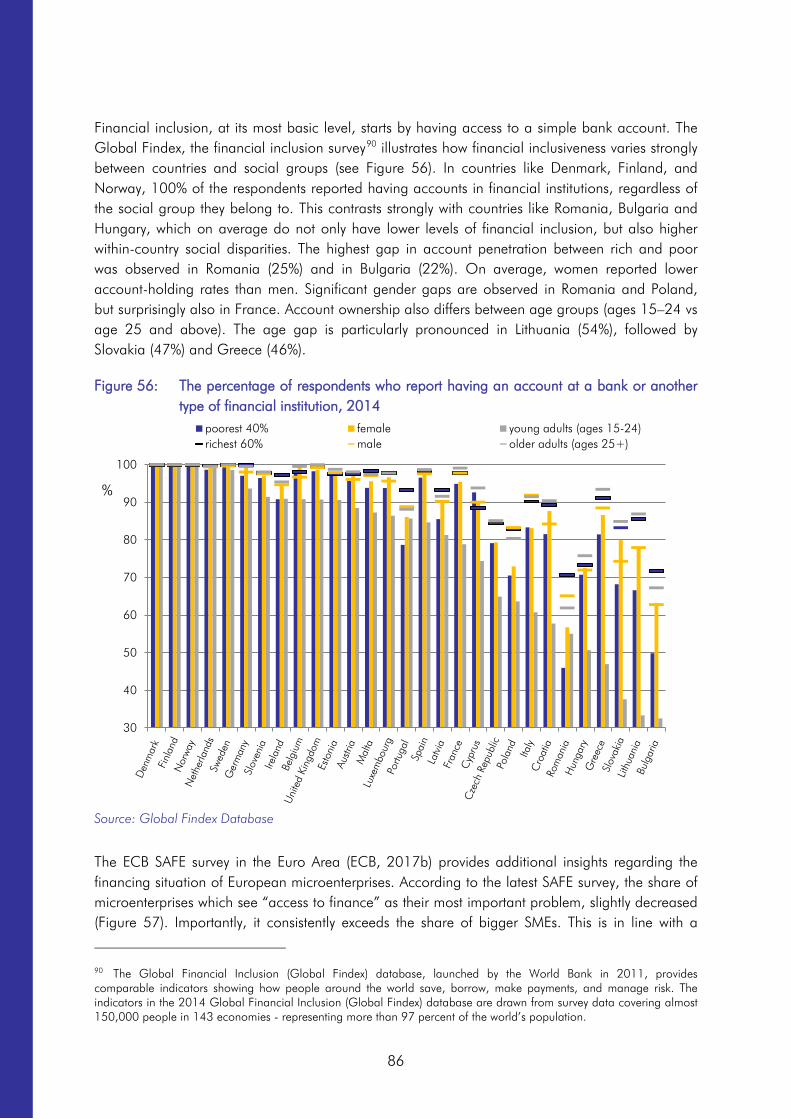
86
Financial inclusion, at its most basic level, starts by having access to a simple bank account. The Global Findex, the financial inclusion survey90 illustrates how financial inclusiveness varies strongly between countries and social groups (see Figure 56). In countries like Denmark, Finland, and Norway, 100% of the respondents reported having accounts in financial institutions, regardless of the social group they belong to. This contrasts strongly with countries like Romania, Bulgaria and Hungary, which on average do not only have lower levels of financial inclusion, but also higher within-country social disparities. The highest gap in account penetration between rich and poor was observed in Romania (25%) and in Bulgaria (22%). On average, women reported lower account-holding rates than men. Significant gender gaps are observed in Romania and Poland, but surprisingly also in France. Account ownership also differs between age groups (ages 15–24 vs age 25 and above). The age gap is particularly pronounced in Lithuania (54%), followed by Slovakia (47%) and Greece (46%).
Figure 56: The percentage of respondents who report having an account at a bank or another type of financial institution, 2014
Source: Global Findex Database
The ECB SAFE survey in the Euro Area (ECB, 2017b) provides additional insights regarding the financing situation of European microenterprises. According to the latest SAFE survey, the share of microenterprises which see “access to finance” as their most important problem, slightly decreased (Figure 57). Importantly, it consistently exceeds the share of bigger SMEs. This is in line with a
90 The Global Financial Inclusion (Global Findex) database, launched by the World Bank in 2011, provides comparable indicators showing how people around the world save, borrow, make payments, and manage risk. The indicators in the 2014 Global Financial Inclusion (Global Findex) database are drawn from survey data covering almost 150,000 people in 143 economies - representing more than 97 percent of the world’s population.
30
40
50
60
70
80
90
100
%
poorest 40% female young adults (ages 15-24)richest 60% male older adults (ages 25+)

87
report of the ECB (2017b) that states that bank loan rejection rate is still the highest for microenterprises (7.2%), compared to 4.7% for small firms and 2.1% for medium-sized firms. Consequently, the share of microenterprises that did not apply for a loan due to fear of rejection (discouraged borrowers) remains high at 7%. 46% of the SMEs did not use bank loans because it was not a relevant source of financing. Among them, proportionally more microenterprises indicated “interest rates or price too high” and “too much paperwork” is involved (see Figure 58).
Figure 57: Share of enterprises reporting access to finance as their most important problem
Source: Authors, based on data from ECB (2017b), Statistical Data Warehouse
Figure 58: Reasons for bank loans being not relevant (by enterprise size class), HY1/2017
Source: Authors, based on ECB SAFE (2017b) data
When microenterprises do decide to apply for a bank loan, they are more likely to be rejected than their larger peers. Unsurprisingly, microenterprises have better chances to receive microloans than bigger loans, implying that microenterprises with high funding needs face persistent barriers to growth (see Figure 59).
6%
8%
10%
12%
14%
16%
18%
20%
22%microenterprises SMEs without microenterprises
0123456789
insufficient collateral orguarantee
interest rates or price toohigh
no bank loans available too much paper work
%
medium
small
micro

88
Figure 59: Application status of bank loans requested by microenterprises (by loan size), HY1/2017
Note: the figure is based on responses from 637 microenterprises who applied for bank loans in the past six month. The numbers inside the bars refer to the number of respondents per category
Source: Authors, based on ECB SAFE (2017b) data
Figure 60: Perceived change in the external financing gap (by firm size)
Source: Authors, based on ECB SAFE (2017b), Statistical Data Warehouse
Figure 60 shows how microenterprises report on changes in their perceived financing gap and compares this to other company size classes. Also here it becomes apparent that microenterprises believe they operate in a more challenging environment than larger firms: they are consistently less positive about their financing situation.
19
42
75
156
120
3
9
8
14
4
12
3
20
13
3
9
13
29
9
2 3
5
8
20
11
0% 20% 40% 60% 80% 100%
over EUR 1 million
more than EUR 250,000 and up to EUR 1 million
more than EUR 100,000 and up to EUR 250,000
more than EUR 25,000 and up to EUR 100,000
up to EUR 25,000
Received everything Received 75% and aboveReceived below 75% Application is still pendingRefused because the cost was too high Was rejected
-15
-10
-5
0
5
10
15
20
25SMEs ALL Large
Medium Micro Small

89
6.5 Microfinance prospects
Microenterprises in general, and workers from vulnerable labour market segments that cherish entrepreneurial ambitions specifically, are still burdened by significant difficulties in accessing financial resources from traditional credit channels. Microenterprises still face a tight credit supply by mainstream banks with a high risk aversion and increasing need to de-leverage their balance sheets. Disadvantaged groups, such as long term unemployed, or workers with a migrant background, lack the necessary collateral to secure loans from traditional loan providers. In this environment, lending might be allocated away from small, young and opaque firms as they are perceived to be more risky than their larger peers and have smaller financing needs which are difficult to cover in a cost-efficient manner by mainstream funding providers.
Financial inclusion of potential business creators is especially important in countries with high unemployment numbers. In addition to the financial support, unemployed people or clients from other vulnerable groups are often in need of acquiring the necessary skills for success through coaching and mentoring. The technical assistance is crucial for entrepreneurs to succeed and decrease the risk of default. Nevertheless, the technical assistance provided during the loan term is often limited91. Aside from the financial products and services, many European MFIs provide non-financial services as well, but without public support cost-free non-financial services may become a burden for MFIs (EMN-MFC, 2016).
Against the background of the current difficult conditions, support on a European level has become of central importance – via funding, guarantees and technical assistance to a broad range of financial intermediaries, from small non-bank financial institutions to well-established microfinance banks – in order to make microfinance a fully-fledged segment of the European financial sector. Bruhn-Leon, Eriksson and Kraemer-Eis (2012) discuss the rationale for public support in the microfinance area and explain how European policy – through the EIF - currently supports the microfinance sector under the Progress Microfinance mandate. The intervention logic is based on the market structure of the microfinance sector and its characterising diversity. It seeks to maximise outreach through a flexible investment approach in terms of eligible types of investments and types of financial intermediaries. The key target group are non-bank MFIs, but the range of financial intermediaries is extended also to banks with good outreach to microfinance clients, such as cooperative banks or micro-banks.
Results show so far that non-bank MFIs have been the most active lenders over the first five years of Progress Microfinance, as their main focus is micro-lending, unlike banks. Moreover, many non-bank MFIs have made use of the flexibility under Progress Microfinance to provide funding and risk coverage denominated in local currency. Progress Microfinance that was launched in 2010 has in April 2016 reached the end of the investment period. It has reached micro-borrowers across 23 countries within EU-28. It is estimated that Progress Microfinance will mobilise more than EUR 500m of new micro financing to around 60,000 micro-borrowers, most of which are start-ups.
In mid-2015 the Progress Microfinance successor program, the program for Employment and Social Innovation (EaSI) was launched. It has a wider geographical scope within Europe and also
91 Source: Based on interim results from an ongoing research project on “Measuring Microfinance Impact in the EU”.

90
targets lending to social enterprises. EaSI contributes to the Europe 2020 strategy by supporting the EU's objective of high level employment, adequate social protection, fighting against social exclusion and poverty and improving working conditions. By mid-2017 EIF had signed 42 EaSI guarantee agreements covering 21 countries (including Albania, Montenegro and Serbia outside of EU-28). Over time these guarantee agreements will mobilise around EUR 800m of new financing to micro-borrowers and social enterprises. Around 43% of the EaSI guarantee agreements had been entered into with non-banks.

91
7 Fintechs
7.1 What are Fintechs?
Fintechs have been attracting considerable attention in recent years. The term Fintechs generally refers to companies that pursue a business model of innovation aiming at disrupting mechanisms in the traditional financial service sector. However, sometimes it refers more generally to innovations implemented in the financial sector as a whole that is, including the established market players. The distinction might seem trivial but could prove to be important for policy makers. If policy aims to promote the former type, it will stimulate disruption in the financial sectors’ market structure by boosting entrants’ ability to challenge incumbents, potentially increasing competitive pressures in the market, driving down prices. Such policy can turn out to be challenging, however, as it is a priori difficult to identify which small company has the potential to become a worthy industry challenger, as each investment will be characterised by a large degree of uncertainty. On the other hand, if policy makers aim to promote innovation in the financial sector as a whole, this could prove to benefit mostly larger players, who have the financial capacity to invest heavily in the research and development activities that go hand in hand with such capital intensive technologies. While this may lead to a more rapid pace of technological development, it can also lead to an increasing degree of consolidation within the financial service sector, which eventually will not be to the benefit of consumers.
The Basel Committee on Banking Supervision defines Fintechs as “Technologically enabled financial innovation that could result in new business models, applications, processes, or products with an associated material effect on financial markets and institutions and the provision of financial services” and therefore leans more to the more general overarching second definition of Fintech.
Financial technology innovations could have applications in a variety of financial subsectors or business processes, such as the payments/transactions industry (Distributed ledger technology), insurance (Insurtech), corporate lending (Peer-to-peer platforms, Robo-advisors), compliance mechanisms (Regtech), to name but a few.
We also see new blending solutions emerging, in particular in the fields of crowdfunding (both for lending as for equity), such as combinations of microfinance and crowd lending, Business Angel/Venture Capital financing and crowd investing, or banks using marketplace lenders as distribution channels. Fintech market players can potentially play an important role in enhancing access to finance for SMEs, as counterparts in SMESec transactions, as well as final beneficiaries/investee companies. Moreover, Fintechs might help to reduce the pronounced asymmetric information problem in small business lending, through technological advances in information processing, such as the increasing ability to handle and process ‘big data’.
7.2 European Fintech market size
Consistent statistics on Fintechs are hard to come by, but from whichever perspective one approaches the Fintech phenomenon, it is hard to argue against the observation that investments in Fintechs have increased exponentially over the past decade.

92
Figure 61 depicts total European investment activity in Fintech companies since 2010, as illustrated in KPMG’s quarterly ‘Pulse of Fintech’ report. In 2010, the number of Fintech deals in Europe, combined for VC, PE and M&A totalled 109. This gradually increased over the following years to over 400 in 2016 (KPMG, 2017). This resulted in a total deal value of around EUR 4bn. This was already exceeded by the third quarter of 2017, with a total yearly deal value nearing EUR 5bn.
Figure 61: European Fintech investment activity – total (VC+PE+M&A)
Source: KPMG (2017)
Figure 62: European Fintech investment activity - VC
Source: KPMG (2017)

93
More recently, investment activity in Fintech seems to have stalled. Interestingly, according to KPMG’s statistics, total deal value dropped back significantly since the second quarter of 2016, while deal volume remained roughly constant. Starting Q3/2016, quarterly deal value picked up again, while the number of deals took a nose dive. The recent decline in total deal value was mainly driven by a drop in PE and M&A activity, while VC proved more resilient and even recorded two of its strongest quarters in Q1 and Q2/2017 (Figure 62). This went hand in hand with a declining deal count, indicating a consolidation taking place in the European VC Fintech market. In this respect, the European market merely caught up with the US, where the declining trend in VC deal count already set in around 2015 (KPMG, 2017). The coming quarters will need to provide the decisive answer as to whether these recent events concern a true trend reversal, or just a glitch in the highly volatile Fintech market.
7.3 Crowdfunding in Europe
Within the Fintech ecosystem, of particular interest to SMEs are Crowdfunding (CF) platforms. CF Fintechs open up an entire new spectrum of external financing possibility to SMEs. They have partly filled up the void in SME financing left by the traditional banking sectors in the wake of the global financial crisis. In addition, equity-based CF platforms have opened up SME equity investing to the masses.
The growing importance of crowdfunding platforms for SME financing is reflected in the statistics presented in the European Alternative Finance Industry Report, a periodical publication on Europe’s CF market published by the Cambridge Centre for Alternative Finance (Wardrop et al., 2016). The report shows that 45 percent of the total transaction volume in the online crowdfunding market was accounted for by P2P business lending, equity-based CF or invoice trading (Wardrop et al., 2016). While the number of SMEs that raised funding on CF platforms also increased strongly (Figure 63), it did so at a slower pace than the total funding volume, implying a significant increase in the average amount per funding round, from EUR 40,938 in 2013, to EUR 56,767 in 2015.

94
Figure 63: The evolution of business-related transaction volume on the crowdfunding market from all platform types in Europe (ex-UK) and the number of fundraising SMEs.
Source: Cambridge Centre for Alternative Finance (2016)
In 2015, the vast majority (EUR 349m) of business finance was raised on platforms following lending models, such as peer-to-peer business lending, balance sheet business lending, invoice trading, or debt-based securities. Equity-based platforms ranked second with a total of EUR 159m raised. Since 2013, debt-based platforms have gained in relative importance, having grown consistently faster than the equity-platforms between 2013 and 2015 (Figure 64).
Figure 64: Business financing on equity and debt- based crowdfunding platforms: transaction volumes raised on equity vs debt-based models (mEUR)
Source: Cambridge Centre for Alternative Finance (2016)
In contrast with the global nature of the internet, CF is still predominantly a national matter. In 2015, more than three out of four platforms relied for more than 90 percent on intra-national flows. On the other side of the platform, outflows tend to focus predominantly on domestic projects as well. Less than 1 in 4 platforms funded minimum one cross-border project, mostly of negligible size vis-à-vis domestic investments (CCAF, 2016).
2858
5801
9442
117 201
536
0
100
200
300
400
500
600
700
800
900
1000
0
1000
2000
3000
4000
5000
6000
7000
8000
9000
10000
2013 2014 2015
mEUR
SMEs (number, lhs) Business transaction volume (mEUR, rhs)
EUR 60m; 56%
EUR 48m; 44%
2013
EUR 136m; 62%
EUR 83m; 38%
2014
debt equity
EUR 349m; 69%
EUR 159m; 31%
2015

95
The economic viability of commercial CF platforms often requires a critical mass which cannot be attained in smaller economies. Hence, the lack of cross-border CF flows will disproportionally affect SMEs in smaller Member States, and will hinder future growth prospects of the European CF sector in general. Zetzsche and Preiner (2017) argue that these problems are predominantly rooted in legislative issues, as differences in national legislation can drive platforms’ decision to focus solely on the domestic market. A unified European regulation could therefore promote further growth in the sector.
7.4 Fintechs: complements or disruptors?
Fintechs are often regarded to be a disruptive force that poses a threat to incumbent market players, but this needs not to be the case necessarily. In this context, a study by the World Economic Forum (WEF, 2017) concluded that while “Fintechs have materially changed the basis of competition in financial services, [they] have not yet materially changed the competitive landscape. They play a critical role in defining the pace and direction of innovation across the sector but have struggled to overcome the scale advantages of large financial institutions.”
The failure to truly disrupt is driven by two reasons. First, it has proven hard to break the hegemony of incumbents because consumers lack the willingness to switch away from their trusted financial institutions. Second, so far, Fintechs have not succeeded in scaling up to a sufficient degree in order to compete with the traditional ecosystems and infrastructure. The second reason is of course to a large extent connected to the first, which is evidenced by the fact that Fintech entrants did succeed in scaling up in geographies where incumbent service provides did not yet exist (WEF, 2017).
Many Fintechs, after developing a successful and possibly disrupting innovation, are at a later stage acquired by incumbents. A recent survey brought to light that around 1 in 5 European banks would consider Fintechs as possible technology acquisitions (BI Intelligence, 2016). As mentioned earlier, while such a dynamic may indeed lead to efficiency gains and cost reductions, it can also lead to an increasing consolidation within the financial service sector.
Instead of being acquired, Fintechs will also form collaborative relationship with their larger counterparts. The benefits of such a relationship are mutual. One the one hand, it allows for a technology transfer that innovates or streamlines the incumbents’ production process. On the other hand, through the existing distribution network of the incumbent, it provides the smaller Fintech firms with market access to which they would not have had access if they would operate independently.
In addition to being acquisition targets or collaborators to large financial players, Fintech(s) will often address a segment of the market that went previously unserved. Take CF, for example, which is often touted as a substitute to traditional external finance markets (D’Ambrosio and Gianfrate, 2016). In reality, however, CF tends to complement traditional financing sources. Hornuf & Schwienbacher (2014), for example, argue that equity CF fills funding gaps at the lower end of the market and is often used side-by-side angel funding, where the funding of the crowd complements the investment savviness of angel investors (see also chapter 4.1.2). In this context, a recent study found that the participation of qualified investors such as VCs or BAs in the initial offering on CF

96
platforms is strongly correlated with companies’ long term survival prospects (Signori and Vismara, 2017). Hence, participation of experienced investors can serve as a quality signal to the larger crowd.
While it is too early to draw definite conclusions on their contribution to the economy, it is undisputable that Fintechs are becoming an integral part of the SME financing landscape. Apart from being drivers for new business models, they are often start-ups and SMEs themselves, facing themselves severe challenges in securing access to external finance sources. It is therefore important for policy makers to pre-emptively design the appropriate policy measures (i.e. framework conditions) to ensure their contribution to the evolution of the financial service sector reaches its full potential.
97
8 Concluding remarks
The economic outlook for Europe remains positive, confirmed by the recent increased growth forecasts by the European Commission. Also the financing outlook of European SMEs has further improved since the publication of the last ESBFO in June 2017. However, these improvements do not necessarily translate into more financing for SMEs. For example, new credit flows to SMEs do not improve in many countries (OECD, 2018b). Reasons can be both demand- and supply-side driven. In several countries, there is still a high degree of uncertainty as regards the economic development – with a negative impact on investment behaviour. Worries about the general economic outlook weigh on firms’ investment decisions and in several countries there is a low growth trap. The impact of Brexit, with downside risks for both, the UK and the EU27, is highly uncertain. Moreover, despite positive developments, a significant proportion of European SMEs still experience barriers in access to finance. This proportion varies strongly from country to country. In general, in particular microenterprises, start-ups, young SMEs, and highly innovative firms continue to have access to finance problems (OECD, 2018b).
For EIF, it is a key priority to help establish a well-functioning, liquid equity market that attracts a wide range of private sector investors. In doing so, EIF aims at leveraging its market assistance and seizing market opportunities in all areas of the equity eco-system which are relevant to the sustainable development of the industry. EIF has increased – as the key catalytic investor in European venture and growth capital funds – its counter-cyclical role in providing financing solutions to boost entrepreneurship and innovation. In the coming years, EIF will continue to act as a cornerstone investor across the spectrum of Technology Transfer through Venture Capital to the Lower Mid-Market and mezzanine financing. This also includes the launch and extension of new/pilot initiatives.
In the areas of credit guarantees and securitisations, EIF cooperates with a wide range of financial intermediaries. They include: banks, leasing companies, guarantee funds, mutual guarantee institutions, promotional banks, and other financial institutions that provide financing or financing guarantees to SMEs, such as debt funds. Given that SMEs have no direct access to the capital markets, banks are typically the most important source of external SME finance. Hence, funding limitations of banks have direct impact on SME lending capacity. For loans to SMEs, a standardised, highly transparent and quality-controlled securitisation market could transform these illiquid loans into an asset class with adequate market liquidity.
Finally, microfinance is an important contribution to overcoming the effects of the crisis, and in particular to supporting inclusive growth. EIF provides funding, guarantees and technical assistance to a broad range of financial intermediaries, from small non-bank financial institutions to well-established microfinance banks to make microfinance a fully-fledged segment of the European financial sector. Moreover, EIF intends to sustain its support of microcredit, social investments, and participation in the increasing number of social finance institutions that are being established in the EU Member States.
An area that we covered due to its rising importance in a new chapter in this report is Fintech. Fintechs are attracting considerable attention – and while it is probably too early at this stage to

98
draw conclusions on the overall contribution to the economy of these structures, it is a fact that Fintechs are becoming an integral part of the SME financing landscape. They are drivers for new business models, new financing channels, and not least they are often successful start-ups and SMEs themselves. Established market players have various ways to react to the Fintech challenge, i.e. they can imitate (e.g. introduction of dedicated own platforms), they can go for cooperation/partnerships (joint ventures, common platforms), or they can go the M&A route and integrate such companies. New blending solutions are emerging, in particular in the fields of crowdfunding (both, lending and equity) – examples are combinations of microfinance and crowd lending, Business Angel/Venture Capital financing and crowd investing, or banks using marketplace lenders as distribution channels. Fintech market players can potentially play an important role in enhancing access to finance for SMEs, as counterparts in SMESec transactions, and as well as final beneficiaries/investee companies. Moreover, Fintechs might help to reduce not only the pronounced asymmetric information problem in small business lending, through technological advances in information processing, such as the increasing ability to handle and process ‘big data’, but also to mitigate the problem of high fixed costs for (small) loans.
Given their growing importance in the financing landscape, EIF is stepping up its involvement in Fintech transactions by investing in, or providing guarantees to, Fintech entities. The latest developments on the Fintech market and EIF’s related involvement and support are perfectly in line with the spirit of the European Commission’s plan to establish a Capital Markets Union and to diversify the financing possibilities for SMEs. In this context EIF observes that Fintechs are often faced with limitations in relation to their cross-border business as they are often prevented from carrying out lending activities as a result of local law licensing requirements. As part of the Capital Markets Union, allowing Fintechs to operate seamlessly within the European Union by creating a pass-porting and licensing framework would go a long way towards creating a pan-European Fintech market.92
As shown above, despite significantly increased public support for SMEs, including by the EIB Group, many SMEs continue to perceive issues in accessing external finance. In this context, the relevance of the Investment Plan for Europe (IPE)93 cannot be overstated. The IPE is based on three pillars, mobilising finance for investment, making finance reach the real economy, and improved investment environment, see Figure 65.
92 A detailed overview regarding the CMU and how it can support SME financing is provided in Kraemer-Eis & Lang (2017). 93 See http://www.eib.org/efsi/index.htm and http://www.eif.org/what_we_do/efsi/index.htm.

99
Figure 65: Pillars of the IPE
Source: European Commission
As part of the IPE’s pillar one, the European Fund for Strategic Investments (EFSI) aims at unlocking additional investments of at least EUR 315bn over a three year period by addressing market gaps and mobilising private resources. EFSI is a strategic partnership between the EC and the EIB Group. The EIB Group contributes EUR 5bn to the initiative alongside a EUR 16bn guarantee from the EU budget. EFSI has two components (see as well Figure 64):
• the Infrastructure and Innovation Window (IIW, EUR 15.5bn), deployed through the EIB, and
• the SME Window (SMEW, EUR 5.5bn), implemented through EIF. The financial instruments used for the purposes of the EFSI SME Window are mainly guarantees and equity investments.
The resources under EFSI enable EIF to deploy its existing support for SMEs at a higher and faster rate than initially planned to satisfy strong demand of support to SME access to finance. At the beginning, initial EFSI resources under the SME Window are being used to accelerate and enhance the deployment of existing EU flagship programmes which EIF manages – i.e. COSME, InnovFin and EaSI – and to significantly increase the Risk Capital Resources (RCR) mandate for equity investments, which EIB has entrusted to EIF. Thanks to EFSI, the RCR equity mandate has been increased by EUR 2.5bn.
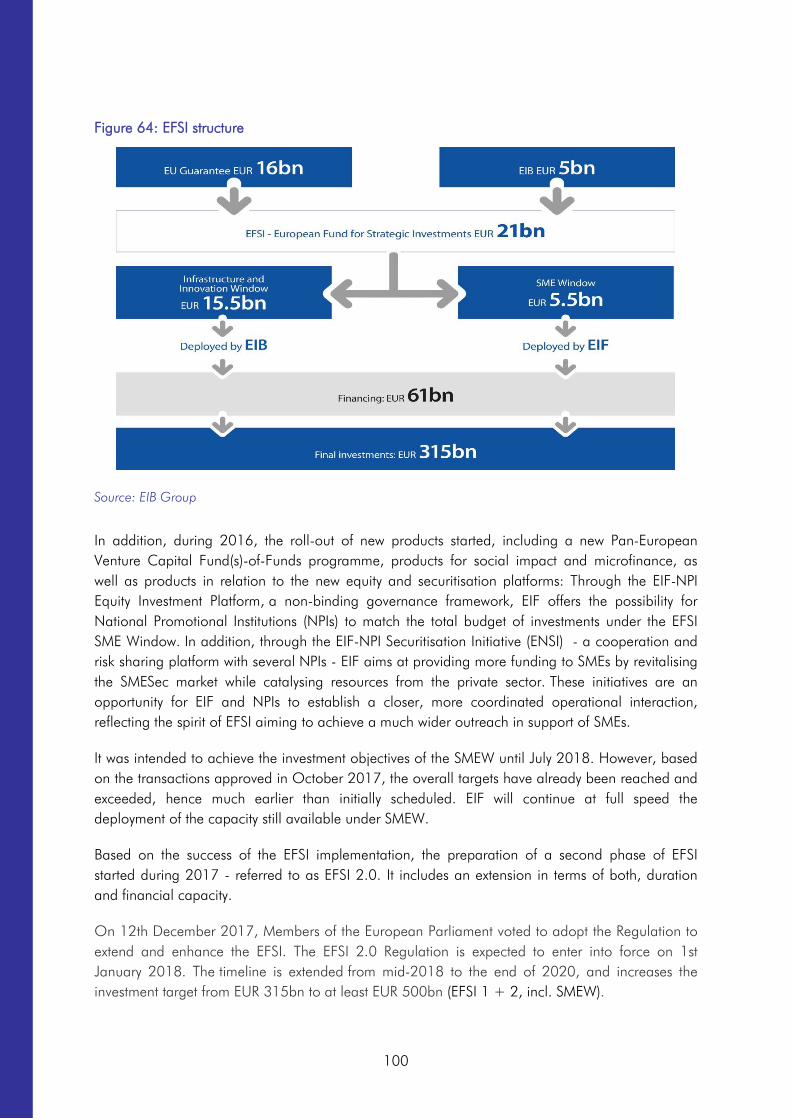
100
Figure 64: EFSI structure
Source: EIB Group
In addition, during 2016, the roll-out of new products started, including a new Pan-European Venture Capital Fund(s)-of-Funds programme, products for social impact and microfinance, as well as products in relation to the new equity and securitisation platforms: Through the EIF-NPI Equity Investment Platform, a non-binding governance framework, EIF offers the possibility for National Promotional Institutions (NPIs) to match the total budget of investments under the EFSI SME Window. In addition, through the EIF-NPI Securitisation Initiative (ENSI) - a cooperation and risk sharing platform with several NPIs - EIF aims at providing more funding to SMEs by revitalising the SMESec market while catalysing resources from the private sector. These initiatives are an opportunity for EIF and NPIs to establish a closer, more coordinated operational interaction, reflecting the spirit of EFSI aiming to achieve a much wider outreach in support of SMEs.
It was intended to achieve the investment objectives of the SMEW until July 2018. However, based on the transactions approved in October 2017, the overall targets have already been reached and exceeded, hence much earlier than initially scheduled. EIF will continue at full speed the deployment of the capacity still available under SMEW.
Based on the success of the EFSI implementation, the preparation of a second phase of EFSI started during 2017 - referred to as EFSI 2.0. It includes an extension in terms of both, duration and financial capacity.
On 12th December 2017, Members of the European Parliament voted to adopt the Regulation to extend and enhance the EFSI. The EFSI 2.0 Regulation is expected to enter into force on 1st January 2018. The timeline is extended from mid-2018 to the end of 2020, and increases the investment target from EUR 315bn to at least EUR 500bn (EFSI 1 + 2, incl. SMEW).

101
ANNEX
Annex 1: Private Equity Glossary (selection, from EVCA/Invest Europe)
Buyout: A buyout is a transaction financed by a mix of debt and equity, in which a business, a business unit or a company is acquired with the help of a financial investor from the current shareholders (the vendor).
Buyout fund: Funds whose strategy is to acquire other businesses; this may also include mezzanine debt funds which provide (generally subordinated) debt to facilitate financing buyouts, frequently alongside a right to some of the equity upside.
Capital weighted average IRR: The average IRR weighted by fund size.
Carried interest: A share of the profit accruing to an investment fund management company or individual members of the fund management team, as a compensation for the own capital invested and their risk taken. Carried interest (typically up to 20% of the profits of the fund) becomes payable once the limited partners have achieved repayment of their original investment in the fund plus a defined hurdle rate.
Closing: A closing is reached when a certain amount of money has been committed to a private equity fund. Several intermediary closings can occur before the final closing of a fund is reached.
Commitment: A limited partner’s obligation to provide a certain amount of capital to a private equity fund when the general partner asks for capital.
Deal flow: The number of investment opportunities available to a private equity house.
Disbursement: The flow of investment funds from private equity funds into portfolio companies.
Distribution: The amount disbursed to the limited partners in a private equity fund.
Divestment: See exit.
Drawdown: When investors commit themselves to back a private equity fund, all the funding may not be needed at once. Some is used as drawn down later. The amount that is drawn down is defined as contributed capital.
Early stage: Seed and start-up stages of a business.
Early stage fund: Venture capital funds focused on investing in companies in the early part of their lives.
Exit: Liquidation of holdings by a private equity fund. Among the various methods of exiting an investment are: trade sale; sale by public offering (including IPO); write-offs; repayment of preference shares/loans; sale to another venture capitalist; sale to a financial institution.
Expansion capital: Also called development capital. Financing provided for the growth and expansion of a company, which may or may not break even or trade profitably. Capital may be used to: finance increased production capacity; market or product development; provide additional working capital.
Follow-on investment: An additional investment in a portfolio company which has already received funding from a private equity firm.
Fund: A private equity investment fund is a vehicle for enabling pooled investment by a number of investors in equity and equity-related securities of companies (investee companies). These are generally private companies whose shares are not quoted on any stock exchange. The fund can take the form either of a company or of an unincorporated arrangement such as a limited partnership. See limited partnership.

102
Fund of Funds: A fund that takes equity positions in other funds. A fund of fund that primarily invests in new funds is a Primary or Primaries fund of funds. One that focuses on investing in existing funds is referred to as a Secondary fund of funds.
Fund size: the total amount of capital committed by the limited and general partners of a fund.
Fundraising: The process in which venture capitalists themselves raise money to create an investment fund. These funds are raised from private, corporate or institutional investors, who make commitments to the fund which will be invested by the general partner.
General Partner: A partner in a private equity management company who has unlimited personal liability for the debts and obligations of the limited partnership and the right to participate in its management.
General Partner’s commitment: Fund managers typically invest their personal capital right alongside their investors’ capital, which often works to instil a higher level of confidence in the fund. The limited partners look for a meaningful general partner investment of 1% to 3% of the fund.
Generalist fund: Funds with either a stated focus of investing in all stages of private equity investment, or funds with a broad area of investment activity.
Holding period: The length of time an investment remains in a portfolio. Can also mean the length of time an investment must be held in order to qualify for Capital Gains Tax benefits.
Horizon IRR: The Horizon IRR allows for an indication of performance trends in the industry. It uses the fund’s net asset value at the beginning of the period as an initial cash outflow and the Residual Value at the end of the period as the terminal cash flow. The IRR is calculated using those values plus any cash actually received into or paid by the fund from or to investors in the defined time period (i.e. horizon).
Hurdle rate: A return ceiling that a private equity fund management company needs to return to the fund’s investors in addition to the repayment of their initial commitment, before fund managers become entitled to carried interest payments from the fund.
Inception: The starting point at which IRR calculations for a fund are calculated; the vintage year or date of first capital drawdown.
Institutional investor: An organisation such as a bank, investment company, mutual fund, insurance company, pension fund or endowment fund, which professionally invest, substantial assets in international capital markets.
Internal rate of return (IRR): The IRR is the interim net return earned by investors (Limited Partners), from the fund from inception to a stated date. The IRR is calculated as an annualised effective compounded rate of return using monthly cash flows to and from investors, together with the Residual Value as a terminal cash flow to investors. The IRR is therefore net, i.e. after deduction of all fees and carried interest. In cases of captive or semi-captive investment vehicles without fees or carried interest, the IRR is adjusted to create a synthetic net return using assumed fees and carried interest. For the avoidance of doubts: IRR means the financial IRR and not the economic IRR, i.e. it does not account for any externalities.
IPO (Initial public offering): The sale or distribution of a company’s shares to the public for the first time. An IPO of the investee company’s shares is one the ways in which a private equity fund can exit from an investment.
Later stage: Expansion, replacement capital and buyout stages of investment.
Leverage buyout (LBO): A buyout in which the New Company’s capital structure incorporates a particularly high level of debt, much of which is normally secured against the company’s assets.
Limited Partnership: The legal structure used by most venture and private equity funds. The partnership is usually a fixed-life investment vehicle, and consists of a general partner (the management firm, which has unlimited liability) and limited partners (the investors, who have limited liability and are not involved in the day-to-day operations). The general partner receives

103
a management fee and a percentage of the profits. The limited partners receive income, capital gains, and tax benefits. The general partner (management firm) manages the partnership using policy laid down in a Partnership Agreement. The agreement also covers, terms, fees, structures and other items agreed between the limited partners and the general partner.
Management fees: Fee received by a private equity fund management company from its limited partners, to cover the fund’s overhead costs, allowing for the proper management of the company. This annual management charge is equal to a certain percentage of the investors’ commitments to the fund.
Mezzanine finance: Loan finance that is halfway between equity and secured debt, either unsecured or with junior access to security. Typically, some of the return on the instrument is deferred in the form of rolled-up payment-in-kind (PIK) interest and/or an equity kicker. A mezzanine fund is a fund focusing on mezzanine financing.
Multiples or relative valuation: This estimates the value of an asset by looking at the pricing of “comparable” assets relative to a variable such as earnings, cash flows, book value or sales.
Pooled IRR: The IRR obtained by taking cash flows from inception together with the Residual Value for each fund and aggregating them into a pool as if they were a single fund. This is superior to either the average, which can be skewed by large returns on relatively small investments, or the capital weighted IRR which weights each IRR by capital committed. This latter measure would be accurate only if all investments were made at once at the beginning of the funds life.
Portfolio company: The company or entity into which a private equity fund invests directly.
Pre seed stage: The investment stage before a company is at the seed level. Pre-seed investments are mainly linked to universities and to the financing of research projects, with the aim of building a commercial company around it later on.
Private Equity: Private equity provides equity capital to enterprises not quoted on a stock market. Private equity can be used to develop new products and technologies (also called venture capital), to expand working capital, to make acquisitions, or to strengthen a company’s balance sheet. It can also resolve ownership and management issues. A succession in family-owned companies, or the buyout and buying of a business by experienced managers may be achieved by using private equity funding.
Private Equity Fund: A private equity investment fund is a vehicle for enabling pooled investment by a number of investors in equity and equity-related securities of companies. These are generally private companies whose shares are not quoted on a stock exchange. The fund can take the form of either a company or an unincorporated arrangement such as a Limited Partnership.
Quartile: The IRR which lies a quarter from the bottom (lower quartile point) or top (upper quartile point) of the table ranking the individual fund IRRs.
Rounds: Stages of financing of a company. A first round of financing is the initial raising of outside capital. Successive rounds may attract different types of investors as companies mature.
Secondary investment: An investment where a fund buys either, a portfolio of direct investments of an existing private equity fund or limited partner's positions in these funds.
Seed stage: Financing provided to research, assess and develop an initial concept before a business has reached the start-up phase.
Start-up: Companies that are in the process of being set up or may have been in business for a short time, but have not sold their product commercially.
Target company: The company that the offeror is considering investing in. In the context of a public-to-private deal this company will be the listed company that an offeror is considering investing in with the objective of bringing the company back into private ownership.
Top Quarter: Comprises funds with an IRR equal to or above the upper quartile point.

104
Track record: A private equity management house’s experience, history and past performance.
Venture Capital: Professional equity co-invested with the entrepreneur to fund an early-stage (seed and start-up) or expansion venture. Offsetting the high risk the investor takes is the expectation of higher than average return on the investment. Venture capital is a subset of private equity.
Venture Capitalist: The manager of private equity fund who has responsibility for the management of the fund’s investment in a particular portfolio company. In the hands-on approach (the general model for private equity investment), the venture capitalist brings in not only moneys as equity capital (i.e. without security/charge on assets), but also extremely valuable domain knowledge, business contacts, brand-equity, strategic advice, etc.
Vintage year: The year of fund formation and first drawdown of capital.
Volatility: The volatility of a stock describes the extent of its variance over time.
Write-off: The write-down of a portfolio company’s value to zero. The value of the investment is eliminated and the return to investors is zero or negative.
Annex 2: Securitisation Glossary
Attachment Point: The attachment point is the level of subordination that a particular tranche has beneath it. The attachment point is a proxy of percentage of the transaction that will absorb losses before the senior tranche is adversely affected.
Credit Default Swap: An agreement used in synthetic securitisations where the originator (protection buyer) sells the credit risk of an underlying portfolio to a counterparty (protection seller) without transferring the ownership of the assets.
Credit Enhancement: Refers to one or more measures taken in a securitisation structure to enhance the security, the credit quality or the rating of the securitised instrument, e.g. by providing a third party guarantee (such as the EIF guarantee). The credit enhancement could be provided in the form of:
(i) Structural credit enhancement (tranching of the transaction in senior, mezzanine and junior tranches);
(ii) Originator credit enhancement (cash collateral, profit retention, interest sub-participation);
(iii) Third party credit enhancement (e.g. EIF or monoline insurers).
Credit Linked Notes (CLN): A security issued by an SPV (or directly from the balance-sheet of the originator) credit-linked to the default risk of an underlying portfolio of assets. Usually used in synthetic securitisations for the mezzanine tranches of a transaction.
Collateralised loan obligations (CLOs) are a form of securitisation where payments from multiple middle sized and large business loans are pooled together and passed on to different classes of owners in various tranches.
First Loss Piece (FLP): Part of a securitisation transaction which is usually kept by the originator (as an “equity piece”) and which covers the risk of first loss in the portfolio. Its size is a function of the historical losses, so as to protect the investors against the economic risk (estimated loss) of the transaction.
Issuer: Refers to the SPV which issues the securities to the investors.
Kirb: means the sum of the expected loss and regulatory capital that a financial intermediary assigns to an exposure (a portfolio) by using an Internal Rating Based (IRB) approach.
Mezzanine Risk: Risk or tranche which is subordinated to senior risk, but ranks senior to the FLP.

105
Originator: The entity assigning receivables in a securitisation transaction (funded transaction) or seeking credit risk protection on the assets (unfunded transaction).
Primary market: The market in which securities are issued.
Secondary market: The market where issued securities are traded.
Senior: The class of securities with the highest claim against the underlying assets in a securitisation transaction. Often they are secured or collateralised, or have a prior claim against the assets. In true sale structures they rank senior in the cash flow allocation of the issuer’s available funds.
Servicer: Refers to the entity that continues to collect the receivables, enforcement of receivables, etc. Generally, the originator is also the servicer.
Special Purpose Vehicle (SPV): Issuing entity holding the legal rights over the assets transferred by the originator. An SPV has generally a limited purpose and/or life.
Subordinated: The classes of securities with lower priority or claim against the underlying assets in a securitisation transaction. Typically, these are unsecured obligations. They are also called Junior (or Mezzanine) notes and bonds.
Synthetic securitisation: A transaction where the assets are not sold to an SPV but remain on balance sheet; and where only the credit risk of the assets is transferred to the market through credit default swaps or credit linked notes.
Tranche: A piece, a portion or slice within a structured transaction.
Portfolio Tranched Cover: The technique by which an Originator can buy protection on a portfolio. Such protection is only activated when the losses exceed a given threshold (Attachment Point).
True sale: It refers to the separation of the portfolio risk from the risk of the originator, i.e. there is a non-recourse assignment of assets from the originator to the issuer (special purpose vehicle). To be contrasted with synthetic securitisations where only the underlying credit risk is transferred.
Whole Business Securitisation (WBS): Securitisation of the general operating cash flow arising from a certain line or area of the business of the originator over the long term.
Annex 3: List of acronyms
ABCP: Asset Backed Commercial Paper ABSPP: Asset Backed Securities Purchase Programme AECM: European Association of Mutual Guarantee Societies AFME: Association for Financial Markets in Europe AIFMD: Alternative Investment Fund Managers Directive AIR: Average interest rate AMUF: Asset Management Umbrella Fund BA: Business Angel BAE: Business Angels Europe BAN: Business Angels Network BCBS-IOSCO: Basel Committee on Banking Supervision-Board of the International
Organisation of Securities Commissions BiH: Bosnia and Herzegovina BIS: Bank for International Settlements BLS: Bank Lending Survey bn: billion bp: basis point(s) CDFIs: Community Development Financial Institutions
106
CDO: Collateralised Debt Obligation CDP: Cassa Depositi e Prestiti, Italy CEE (countries): (countries in) Central and Eastern Europe CESEE (countries): (countries in) Central, Eastern and South-Eastern Europe CF: Crowdfunding CGAP: Consultative Group to Assist the Poor CGS: Credit Guarantee Scheme CLN: Credit Linked Note CLO: Collateralised Loan Obligation CMU: Capital Markets Union COM: European Commission (also: EC) COSME: Programme for the Competitiveness of enterprises and SMEs (COSME) 2014-2020 CRD: Capital Requirements Directive CRR: Capital Requirements Regulation CVC: Corporate Venture Capital EAF: European Angels Fund EaSI: The European Commission’s Programme for Employment and Social Innovation EBA: European Banking Authority EBAN: European Business Angels Network EBF: European Banking Federation EC: European Commission (also: COM) ECB: European Central Bank EFSI: European Fund for Strategic Investments EIB: European Investment Bank EIF: European Investment Fund EIOPA: European Insurance and Occupational Pensions Authority ELTIF: European Long-Term Investment Fund EMEA: Europe, Middle East, and Africa EMN: European Microfinance Network ENSI: EIF-NPIs Securitisation Initiative EREM: EIB Group Risk Enhancement Mandate ESBFO: European Small Business Finance Outlook ESIF: European Structural and Investment Fund ESMA: European Securities and Markets Authority EU-28: the 28 EU Member States EUR: Euro EuVECA: European Venture Capital Fund Regulation EVCA: European Private Equity & Venture Capital Association FIRST (Initiative): Financial Sector Reform and Strengthening (Initiative) FLP: First Loss Piece FLPG: First Loss Portfolio Guarantee FoF: Fund of Fund(s) FYROM: Former Yugoslav Republic of Macedonia GDP: Gross Domestic Product GEM: Global Entrepreneurship monitor GNI is Gross National Income GP: General Partner GVC: governmental VC investor HICP: Harmonised index of consumer prices HQS: High Quality Securitisation HY: Half Year ICT: Information and communications technologies IIF: Institute for International Finance IIW: Infrastructure and Innovation Window IMF: International Monetary Fund InnovFin: EU Finance for Innovators

107
IORP: Institutions for Occupational Retirement Provision IPE: Investment Plan for Europe IPO: Initial Public Offering IRB: Internal Ratings Based IRR: Internal Rate of Return IT: Information Technology IVC: independent VC investor k: thousand KfW: Kreditanstalt für Wiederaufbau, Germany Kirb: IRB capital requirements for the underlying pool of securitised assets LBO: Leveraged buy out lhs: left-hand side LP: Limited Partner M&A: mergers and acquisitions m: million MAP: Multi Annual Programme for Enterprise and Entrepreneurship MFC (Microfinnace Center) MFI (in the context of ECB): Monetary Financial Institutions MFI (in the context of microfinance): Microfinance Institution MiFID: Markets in Financial Instruments Directive MiFIR: Markets in Financial Instruments Regulation NBFIs: Non-bank Financial Institutions NFC: Non-financial corporation NGO: Non-Governmental Organisation NPI: National Promotional Institution NPL: Non-performing loan OECD: Organisation for Economic Co-Operation and Development PCS: Prime Collateralised Securities PE: Private Equity PFB: Public Funding Body pif: paid in full Q: Quarter QE: Quantitative Easing RCR: Risk Capital Resources rhs: right-hand side RMA: Research and Market Analysis RMBS: Residential mortgage backed securities RSI: Risk-Sharing Instrument for Innovative and Research oriented SMEs and small mid-caps SAFE: Survey on the Access to Finance of Enterprises SEC-SA: Securitisation Standardised Approach SEC-ERBA: Securitisation External Ratings Based Approach SEC-IRBA: Securitisation Internal Ratings Based Approach sf: Structured Finance SFA: Supervisory Formula Approach SIA: Social Impact Accelerator SME: Small and medium sized enterprise SMESec: SME Securitisation (comprising transactions based on SME loans, leases etc.) SMEW: SME Window SPV: Special Purpose Vehicle SSM: Single Supervisory Mechanism SST: simple, standard and transparent STC: simple, transparent and comparable STS: simple, transparent and standardised TMT: Technology, Media, Telecom TT: Technology transfer UEAPME: European Association of Craft, Small and Medium-sized Enterprises

108
UK: United Kingdom US: United States USD: US dollar VC: Venture Capital WBS: Whole Business Securitisation WEF: World Economic Forum

109
References
Acevedo, M.F., Adey, M., Bruno, C., del Bufalo, G., Gazaniol, A., Lo, V., Metzger, G., Perez, B.N., van der Schans, D., and Thornary, B. (2016). France, Germany, Italy, Spain and the United Kingdom – Building Momentum in Venture Capital across Europe. Published by Bpifrance, CDP, ICO, British Business Bank, KfW. December 2016.
Affinito, M., & Farabullini, F. (2009). Does the law of one price hold in euro-area retail banking? An empirical analysis of interest rate differentials across the monetary union. International Journal of Central Banking, 5(1), pp. 5-37.
AFME (2017a). Securitisation data report Q2/2017 (and earlier reports). https://www.afme.eu/en/reports/Statistics/
AFME (2017b). AFME Securitisation Data Snapshot Q3/2017 (and earlier reports). https://www.afme.eu/en/reports/Statistics/
AFME (2017c). The Shortage of Risk Capital for Europe’s High Growth Businesses. March 2017. https://www.afme.eu/globalassets/downloads/publications/afme-highgrowth-2017.pdf?dm_i=3TYX,6744,2TUGLS,LD00,1
AFME, EBF, eurofinas, Leaseurope, DSA, efama, ICMA, Pensions Europe (2016). The importance of securitisation for jobs and growth in Europe. October 2016. http://www.ebf-fbe.eu/wp-content/uploads/2016/10/Importance-of-Securitisation-in-Europe-10-October-2016-Final.pdf
Aiyar, S., Al-Eyd, A., Barkbu, B., and Jobst, A. (2015). Revitalizing Securitization for Small and Medium-Sized Enterprises in Europe. IMF Staff Discussion Note SDN/15/07. May 2015. http://www.imf.org/external/pubs/cat/longres.aspx?sk=42859
Akerlof, G. (1970). The market for “lemons”: Quality uncertainty and the market mechanism. The Quarterly Journal of Economics, 84 (3), 488–500.
Albertazzi, U., Bottero, M., Gambacorta, L., and Ongena, S. (2017). Asymmetric information and the securitisation of SME loans. BIS Working Paper No. 601. http://www.bis.org/publ/work601.htm; a more recent version can be found here: http://www.greta.it/credit/credit2017/PAPERS/Friday/09_Bottero_Gambacorta_Ongena_%20KRAEMER-EIS.pdf
Altunbas, Y., Gambarcota, L, and Marques, D. (2007). Securitisation and the bank lending channel. ECB Working Paper Series No 838, December 2007. https://www.ecb.europa.eu/pub/pdf/scpwps/ecbwp838.pdf?70138e7635cf1dc3bf7dfee4b32db1cf
Anginer, D., De la Torre, A. and Ize, A. (2014). Risk-bearing by the state: When is it good public policy? Journal of Financial Stability, 10, 76-86.
Argos Soditic and Epsilon Research (2017). Argos Index: The Mid-Market Eurozone Index. September 2017.
Arping, S., Lóránth, G. and Morrison, A. (2010). Public initiatives to support entrepreneurs: Credit guarantees versus co-funding. Journal of Financial Stability, 6, 26-35.
Arrow, K. (1985). Informational structure of the firm. The American Economic Review, 75 (2), 303–307.
Asdrubali, P. and Signore, S. (2015). The Economic impact of EU Guarantees on credit to SMEs: Evidence from CESEE countries. European Commission’s European Economy Discussion Paper 002 and EIF Working Paper 2015/29. http://ec.europa.eu/economy_finance/publications/eedp/pdf/dp002_en.pdf and http://www.eif.org/news_centre/publications/eif_wp_29_economic-impact-guarantees_july15_fv.pdf
Aubrey, T., Thillaye, R., and Reed, A. (2015). Supporting investors and growth firms: A bottom-up approach to a Capital Markets Union. Policy Network. 9 June 2015. http://www.policy-network.net/publications/4916/Supporting-Investors-and-Growth-Firms

110
BAE (2015). The European business angels market – an approximation. http://www.businessangelseurope.com/Knowledge%20Centre/Research%20%20Data/BAE,%20The%20European%20Business%20Angel%20Market.pdf
Bain & Company (2017). Global Private Equity Report 2017. 27.2.2017. http://www.bain.com/publications/articles/global-private-equity-report-2017.aspx
BAND (2016). BANDquartal: How to explore the landscape of Angel Investing in Europe. Issue 1/2016. http://www.business-angels.de/wp-content/uploads/2016/07/BANDquartal-1_16.pdf
Bell, Ian (2017). STS – the end of a long march, maybe the start of a new dawn. PCS newsletter. 26.10.2017.
Berg, T., Streitz, D., and Wedow, M. (2015). Real Effects of Securitization. BAFFI CAREFIN Centre Research Paper No. 2015-14. ftp://ftp.unibocconi.it/pub/RePEc/baf/papers/cbafwp1514.pdf
Berger, A. N., & Udell, G. F. (2006). A more complete conceptual framework for SME finance. Journal of Banking & Finance, 30(11), 2945-2966.
Bertoni, F. and Tykvová, T. (2012). Which form of venture capital is most supportive of innovation? ZEW Discussion Papers. No. 12-018. http://ftp.zew.de/pub/zew-docs/dp/dp12018.pdf
Bertoni, F., Colombo, M.G., and Quas, A. (2015). The patterns of venture capital investment in Europe. Small Business Economics, 45(3), 543-560.
Bertoni, F., D’Adda, D., and Grilli, L. (2016). Cherry-picking or frog-kissing? A theoretical analysis of how investors select entrepreneurial ventures in thin venture capital markets. Small Business Economics, 46(3), 391-405.
BI Intelligence (2016). 1 in 5 European bank would buy fintech startups. Business Insider. Retreived from: http://www.businessinsider.com/1-in-5-european-banks-would-buy-fintech-startups-2016-6.
BoA/ML (2016). European SF 2016-2017: on the threshold of an watershed year. Bank of America/Merrill Lynch, 30.11.2016.
BoA/ML (2017). European SF weekly: A market on mute? Bank of America/Merrill Lynch, 17.11.2017.
Borjas G.J., (1995), "The economic benefits from immigration", Journal of Economic Perspectives, 9 (2), 3 22.
Borjas G.J., (1999), "Heaven’s door: immigration policy and the American economy", Princeton University Press.
Borjas G.J., (2017), “The Earnings of Undocumented Immigrants”, NBER Working Paper No. 23236.
Brander, J.A., Du, Q., and Hellmann, T. (2014). The effects of government-sponsored venture capital: international evidence. Review of Finance (2014). 17.03.2014. http://rof.oxfordjournals.org/content/early/2014/03/17/rof.rfu009.abstract
Bravo-Biosca, A. (2011). A look at business growth and contraction in Europe. Nesta Working paper 11/02. December 2011. www.nesta.org.uk/wp11-02
Bruhn-Leon, B., Eriksson, P.-E., and Kraemer-Eis, H. (2012). Progress for microfinance in Europe. EIF Research & Market Analysis. Working Paper 2012/013. January 2012. http://www.eif.org/news_centre/research/index.htm
Brush, C.G., Greene, P.G., Balachandra, L., and Davis, A.E. (2014). Diana Report Women Entrepreneurs 2014: Bridging the Gender Gap in Venture Capital. September 2014. Executive Summary. http://www.babson.edu/Academics/centers/blank-center/global-research/diana/Documents/diana-project-executive-summary-2014.pdf
Capizzi, V. (2015). The Returns of Business Angels’ Investments and Their Major Determinants. In: Venture Capital: An International Journal of Entrepreneurial Finance. Vol. 17, No. 4, 2015.
Carroll, J., & McCann, F. (2016). Understanding SME interest rate variation across Europe. Quarterly Bulletin Articles, 60-76.
CCAF (2016) Sustaining momentum. The 2nd European alternative finance industry report, Cambridge Centre for Alternative finance, 9, 2016.

111
Chatzouz, M., Gereben, A., Lang, F. and Torfs, W. (2017). Credit Guarantee Schemes for SME lending in Western Europe. EIB Working Paper 2017/02 and EIF Working Paper 2017/42. http://www.eif.org/news_centre/publications/eif_wp_42.pdf
Chong, T. T. L., Lu, L., and Ongena, S. (2013). Does banking competition alleviate or worsen credit constraints faced by small-and medium-sized enterprises? Evidence from China. Journal of Banking & Finance, 37(9), 3412-3424.
Coller Capital (2015). Global Private Equity Barometer. Summer 2015. June 2015.
Coller Capital (2016a). Global Private Equity Barometer. Summer 2016. June 2016.
Coller Capital (2016b). Global Private Equity Barometer. Winter 2016-17. December 2016.
Coller Capital (2017). Global Private Equity Barometer. Winter 2017-18. December 2017.
Colombo, M.G., Cumming, D.J., and Vismara, S. (2014). Governmental Venture Capital for Innovative Young Firms. July 25, 2014. Available at SSRN. http://ssrn.com/abstract=2471469 or http://dx.doi.org/10.2139/ssrn.2471469
Council of the EU (2017a). Capital markets union: agreement reached on securitisation. Press release 314/17. 30.05.2017. http://www.consilium.europa.eu/en/press/press-releases/2017/05/30-capital-markets-union-securitisation/
Council of the EU (2017b). Capital markets union: Council adopts securitisation rules. Press release. 20.11.2017. http://www.consilium.europa.eu/en/press/press-releases/2017/11/20/capital-markets-union-agreement-reached-on-securitisation/#
Cour-Thimann, P. and Winkler, B. (2013). The ECB’s non-standard monetary policy measures. The role of institutional factors and financial structure. ECB Working Paper Series. No 1528. April 2013. http://www.ecb.europa.eu/pub/pdf/scpwps/ecbwp1528.pdf
CSES (2012). Evaluation of EU Member States’ Business Angel Markets and Policies. Final Report. October 2012.
Cumming, D.J., Grilli, L. and Murtinu, S. (2014). Governmental and independent venture capital investments in Europe: A firm-level performance analysis. In: Journal of Corporate Finance. In Press, Corrected Proof. Available online 24 October 2014. http://dx.doi.org/10.1016/j.jcorpfin.2014.10.016
D’Ambrosio, M., & Gianfrate, G. (2016). Crowdfunding and Venture Capital: Substitutes or Complements?. The Journal of Private Equity, 20(1), 7-20.
Dubovik, A., and Steegmans, J. (2017). The Performance of Publicly Managed Venture Capital Funds. CPB Discussion Paper No. 355. https://www.cpb.nl/en/publication/the-performance-of-publicly-managed-venture-capital-funds
Duruflé, G., Hellmann, T. and Wilson, K. (2017). From Start-up to Scale-up: Examining Public Policies for the Financing of High-Growth Ventures. Prepared for the CEPR/Assonime Programme on “Restarting European Long Term Investment Finance”. Date Written: 01.09.2016. Saïd Business School WP 2017-05. Available at SSRN: https://ssrn.com/abstract=2913512
EBA (2014). EBA Discussion Paper on simple standard and transparent securitisation. European Banking Authority. 14.10.2014. https://www.eba.europa.eu/documents/10180/846157/EBA-DP-2014-02+Discussion+Paper+on+simple+standard+and+transparent+securitisations.pdf
EBAN (2014). Statistics Compendium. http://www.eban.org/wp-content/uploads/2014/09/13.-Statistics-Compendium-2014.pdf
EBAN (2016). European Early Stage Market Statistics 2015. May 2016. http://www.eban.org/wp-content/uploads/2016/06/Early-Stage-Market-Statistics-2015.pdf
EBAN (2017). EBAN Statistics Compendium 2016: European Early Stage Market Statistics. November 2017. http://www.eban.org/eban-2016-statistics-compendium
EBF (2015). Financial Dialogue. Fostering financial knowledge among European SMEs. http://www.ebf-fbe.eu/publications/thematic-publications/
ECB (2013) Cost of borrowing indicators: methodological note. DG Statistics, ECB Public. 2013.
ECB (2016). Report on financial structures. October 2016. https://www.ecb.europa.eu/pub/pdf/other/reportonfinancialstructures201610.en.pdf

112
ECB (2017a). The Euro Area bank lending survey. Third quarter 2017. November 2017. https://www.ecb.europa.eu/stats/ecb_surveys/bank_lending_survey/html/index.en.html
ECB (2017b). Survey on the access to finance of enterprises in the Euro Area. April 2017 to September 2017. https://www.ecb.europa.eu/stats/ecb_surveys/safe/html/index.en.html
Echiksone, W. (2017). Step aside Silicon Valley, there is a new tech hub in town. World Economic Forum; published in collaboration with Project Syndicate. 19.4.2017. https://www.weforum.org/agenda/2017/04/step-aside-silicon-valley-there-is-a-new-tech-hub-in-town
EIF (2016). Annual Report 2015. Supporting smart, sustainable and inclusive economic growth for SMEs. 02.05.2016. http://www.eif.org/news_centre/publications/eif_annual_report_2015.pdf
EIF (2017). Annual Report 2016. Supporting smart, sustainable and inclusive growth for SMEs. 25.04.2017. http://www.eif.org/news_centre/publications/EIF_annual_report_2016.htm
EMN (2012). Bendig, M., Unterberg, M., and Sarpong, B. (2012). Overview of the Microcredit Sector in the European Union 2010-2011. European Microfinance Network (EMN).27.12.2012. http://www.mikrofinanz.net/fileadmin/user_upload/dateien/pdf/overview2010-2011-final.pdf
EMN (2014). Bendig, M., Unterberg, M., and Sarpong, B. (2014). Overview of the Microcredit Sector in the European Union 2012-2013. European Microfinance Network. September 2014. http://www.europeanmicrofinance.org/docs/emn_publications/emn_overview/Overview2012-2013_Nov2014.pdf
EMN-MFC (2016). Microfinance in Europe: A Survey of EMN-MFC Members. Report 2014-2015. 2016. http://www.europeanmicrofinance.org/index.php?rub=publications&pg=microfinance-overview-surveys&spg=survey_report_2014_2015
EU IPO Task Force (2015). EU IPO Report. Rebuilding IPOs in Europe: Creating jobs and growth in European capital markets. European Issuers, EVCA, FESE. March 2015. http://www.europeanissuers.eu/_mdb/spotlight/44en_Final_report_IPO_Task_Force_20150323.pdf
European Commission (2012). Report from the Commission to the European Parliament and the Council on the application of Directive 2006/48/EC to microcredit. COM (2012) 769 final. 18.12.2012.
European Commission (2015).Proposal for a regulation of the European Parliament and of the Council laying down common rules on securitisation and creating a European framework for simple, transparent and standardised securitisation and amending Directives 2009/65/EC, 2009/138/EC, 2011/61/EU and Regulations (EC) No 1060/2009 and (EU) No 648/2012. COM(2015)472 final. 2015/0226(COD). http://eur-lex.europa.eu/legal-content/EN/TXT/PDF/?uri=CELEX:52015PC0472&from=EN
European Commission (2016). Europe’s next leaders: the Start-up and Scale-up Initiative. Communication from the Commission to the European Parliament, the Council, the European Economic and Social Committee and the Committee of the Regions. COM(2016) 733 final. 22.11.2016.
European Commission (2017a). Annual Report on European SMEs 2016/2017 – Focus on self-employment. November 2017. http://ec.europa.eu/growth/smes/business-friendly-environment/performance-review-2016_en#annual-report
European Commission (2017b). Commission welcomes European Parliament vote on extension and reinforcement of the European Fund for Strategic Investments (EFSI), the heart of the Juncker Plan. European Commission - Press release. 15.05.2017. http://europa.eu/rapid/press-release_IP-17-1327_en.htm
European Commission (2017c). Understanding the Nature and Impact of the business angels in funding Research and Innovation. A study funded by the European Commission. Final Report. December 2017.
European Council (2017). Investment plan for Europe: EFSI extension approved by Council. Press Release. http://www.consilium.europa.eu/en/press/press-releases/2017/11/08/investment-plan-for-europe-efsi-extension-approved-by-council/
113
European Court of Auditors (2017). EU-funded loan guarantee instruments: positive results but better targeting of beneficiaries and coordination with national schemes needed. Special Report No 20/2017. https://www.eca.europa.eu/Lists/ECADocuments/SR17_20/SR_SMEG_EN.pdf
European Economic and Social Committee, EESC (2017), “Assessment of the effectiveness of the EU SME policies 2007-2015”.
FitchRatings (2017a). Global Structured Finance Losses: 2000 – 2016 Issuance. Special Report. 13.09.2017.
FitchRatings (2017b). SME CLO Compare. October 2017.
GEM (2017). 2016/17 Global Report. Global entrepreneurship monitor.
Giese, V. (2014). Characteristics of European Corporate Venture Capital Investments – A Quantitative Analysis across Selected Industries. Master thesis, University of Trier. 4.11.2014. Mimeo.
Gloukoviezoff, G. (2016). Evaluating the impact of European microfinance: The foundations. EIF Working Paper 2016/033. EIF Research & Market Analysis. 11.01.2016. http://www.eif.org/news_centre/research/index.htm
Go4Venture (2017). European Scaleup Index Report, Q3 2017. November 2017. http://go4venture.com/wp-content/uploads/2017/11/Go4Venture-Q3-2017-Report.pdf
Go4Venture Advisers (2015). European Venture & Growth Equity Market Monthly Bulletin. March 2015. 02.05.2015. http://www.go4venture.com/bulletin/
Gompers, P.A., Mukharlyamov, V., Weisburst, E., and Xuan, Y. (2014). Gender Effects in Venture Capital. May 2014. Available at SSRN: https://ssrn.com/abstract=2445497 or http://dx.doi.org/10.2139/ssrn.2445497
Gvetadze, S., Lang, F., Prencipe, D., Signore, S., and Torfs, W. (2018) The EIF SME Access to Finance Index. EIF Working Paper, forthcoming, January 2018.
Hellmann, T., and Thiele, V. (2017). Fostering Entrepreneurship: Promoting Founding or Funding? Saïd Business School Research Papers RP 2017-04. Available at SSRN: Hellmann, Thomas F. and Thiele, Veikko, Fostering Entrepreneurship: Promoting Founding or Funding? (January 31, 2017). Available at https://ssrn.com/abstract=2908955 or http://dx.doi.org/10.2139/ssrn.2908955
Hellmann, T., Schure, P., and Vo, D. (2015). Angels and Venture Capitalists: Substitutes or Complements? (February 23, 2015). Available at http://ssrn.com/abstract=2602739 or http://dx.doi.org/10.2139/ssrn.2602739
Holmstrom, B. and Tirole, J. (1997). Financial intermediation, loanable funds and the real sector. The Quarterly Journal of Economics, 112 (3), 663–691.
Honohan, P. (2010). Partial credit guarantees: Principles and practice. Journal of Financial Stability, 6, 1-9.
Hornuf, L., & Schwienbacher, A. (2014). Crowdinvesting–Angel Investing for the masses? Handbook of Research on Venture Capital: Volume 3. Business Angels, Forthcoming.
Huerga, J., Puigvert, J. and Rodriguez C., (2012). Enhancements on ECB MFI interest rate statistics. In: OECD – The statistics newsletter. Issue No. 55. March 2012.
IMF (2012). Global Financial Stability Report. April 2012. http://www.imf.org/external/pubs/ft/gfsr/2012/01/pdf/text.pdf
IMF (2017). World Economic Outlook, October 2017: Seeking sustainable growth: short-term recovery, long-term challenges.
Invest Europe (2015). About Research, Glossary. Retrieved from: https://www.investeurope.eu/research/about-research/glossary/
Invest Europe (2017a). 2016 European Private Equity Activity. Statistics on Fundraising, Investments & Divestments. 15.5.2017. https://www.investeurope.eu/media/651727/invest-europe-2016-european-private-equity-activity-final.pdf
Invest Europe (2017b). Global Investment Decision Makers Survey. November 2017. Conducted by Ipsos MORI. https://www.investeurope.eu/media/687062/Invest-Europe_Global-Investment-Decision-Makers-Survey_Nov-2017.pdf
114
Invest Europe (2017c). Public Affairs Overview. Invest Europe members only. Edition Autumn 2017. September 2017.
Jaffee, D. and Russell, T. (1976). Imperfect information, uncertainty, and credit rationing. The Quarterly Journal of Economics, 90 (4), 651–666.
Kaplan, S.N., and Lerner, J. (2016). Venture Capital Data: Opportunities and Challenges. NBER Working Paper 22500. August 2016. http://www.nber.org/papers/w22500 Published in: Haltiwanger, J., Hurst, E., Miranda, J., and Schoar, A. (eds.): Measuring Entrepreneurial Businesses: Current Knowledge and Challenges. 2017.
Kara, A., Marques-Ibanez, D., and Ongena, S. (2015). Securitization lending standards: evidence from the European wholesale loan market. International Finance Discussion Papers 1141. August 2015. http://www.federalreserve.gov/econresdata/ifdp/2015/files/ifdp1141.pdf
Kaya, O (2017). Synthetic securitisation. Making a silent comeback. Deutsche Bank Research. 21.02.2017. https://www.dbresearch.com/PROD/RPS_EN-PROD/PROD0000000000441788/Synthetic_securitisation%3A_Making_a_silent_comeback.PDF
Kaya, O. (2014). SME financing in the Euro Area. New solutions to an old problem. EU Monitor – Global Financial Markets. Deutsche Bank Research. 14.10.2014. https://www.dbresearch.com/PROD/DBR_INTERNET_EN-PROD/PROD0000000000344173/SME+financing+in+the+euro+area%3A+New+solutions+to+an+old+problem.PDF
Kelly, R. (2011). The performance and prospects of European Venture Capital. EIF Working Paper 2011/009. May 2011. http://www.eif.org/news_centre/research/index.htm
Kerr W.R., Lerner, J., and Schoar, A. (2011). The Consequences of Entrepreneurial Finance: Evidence from Angel Financings. Review of Financial Studies. Vol. 27, No. 1. Pp. 20-55. http://rfs.oxfordjournals.org/content/early/2011/10/08/rfs.hhr098.full
KfW (2017). “Gründungen durch Migranten:Gründungsfreude trifft Ambition”. KfW Research. Volkswirtschaft Kompakt. Nr. 146, 14. September 2017.
KPMG (2017). The Pulse of Fintech Q3 2017, global analysis of investment in fintech. KPMG Report. 27 April 2017.
Kraemer-Eis (2017). SME Securitisation in Europe – a short summary. In: Securitisation and Structured Finance Handbook 2018. September 2017. http://www.eif.org/news_centre/publications/SMESec_EIF_SSF_2018_P51-58.pdf
Kraemer-Eis, H. (2014). Institutional non-bank lending and the role of Debt Funds. With contributions from F. Battazzi, R. Charrier, M. Natoli, M. Squilloni. EIF Working Paper 2014/25. October 2014. http://www.eif.org/news_centre/publications/eif_wp_25.pdf
Kraemer-Eis, H. and Conforti, A. (2009). Microfinance in Europe. A market overview. EIF Working Paper 2009/001. http://www.eif.org/news_centre/research/index.htm
Kraemer-Eis, H. and Lang, F. (2012). The importance of leasing for SME finance. EIF Working Paper 2012/15. 22.08.2012. http://www.eif.org/news_centre/research/index.htm
Kraemer-Eis, H. and Lang, F. (2014). The importance of leasing for SME financing. In: World Leasing Yearbook 2014. Euromoney. January 2014. http://www.eif.org/news_centre/research/eif_euromoney_importance-of-leasing-for-smes_fv.pdf
Kraemer-Eis, H. and Lang, F. (2017). Access to funds: How could CMU support SME financing? In: Kotz, H.-H., and Schäfer, D. (2017). EU Capital Markets Union – alluring opportunity or blind alley? DIW Vierteljahrshefte zur Wirtschaftsforschung (Quarterly Journal of Economic Research). October 2017.
Kraemer-Eis, H. and Passaris, G. (2015). SME Securitization in Europe. In: The Journal of Structured Finance, Vol. 20, No. 4, Winter 2015.
Kraemer-Eis, H. and Schillo, M. (2011). Business Angels in Germany - EIF's initiative to support the non-institutional financing market. EIF Working Paper 2011/011. November 2011. http://www.eif.org/news_centre/research/index.htm
115
Kraemer-Eis, H., Lang, F., and Gvetadze, S. (2013). Bottlenecks in SME financing. In: Kolev, A., Tanayama, T., and Wagenvoort, R. (ec. eds.) (2013). Investment and Investment Finance in Europe. EIB Economics Department. Pp. 277ff. http://www.eif.org/news_centre/publications/Bottlenecks-in-SME-financing.htm
Kraemer-Eis, H., Lang, F., and Gvetadze, S. (2015a). European Small Business Finance Outlook. EIF Working Paper 2014/28. EIF Research & Market Analysis. June 2015. http://www.eif.org/news_centre/publications/eif_wp_28.pdf
Kraemer-Eis, H., Lang, F., Torfs, W., and Gvetadze, S. (2015b). European Small Business Finance Outlook. EIF Working Paper 2015/32. EIF Research & Market Analysis. December 2015. http://www.eif.org/news_centre/research/index.htm
Kraemer-Eis, H., Lang, F., Torfs, W., and Gvetadze, S. (2016a). European Small Business Finance Outlook. EIF Working Paper 2016/35. EIF Research & Market Analysis. June 2016. http://www.eif.org/news_centre/research/index.htm
Kraemer-Eis, H., Lang, F., Torfs, W., and Gvetadze, S. (2016b). European Small Business Finance Outlook. EIF Working Paper 2016/37. EIF Research & Market Analysis. December 2016. http://www.eif.org/news_centre/research/index.htm
Kraemer-Eis, H., Lang, F., Torfs, W., and Gvetadze, S. (2017). European Small Business Finance Outlook. EIF Working Paper 2017/43. EIF Research & Market Analysis. June 2017. http://www.eif.org/news_centre/research/index.htm
Kraemer-Eis, H., Passaris, G., and Tappi, A. (2013). SME loan securitisation 2.0 – Market assessment and policy options. EIF Working Paper 2013/019. EIF Research & Market Analysis. October 2013.http://www.eif.org/news_centre/publications/EIF_Working_Paper_2013_19.htm
Kraemer-Eis, H., Passaris, G., Tappi, A., and Inglisa, G. (2015). SME Securitisation – at a crossroads? EIF Working Paper 2013/031. EIF Research & Market Analysis. December 2015. http://www.eif.org/news_centre/publications/eif_wp_31.pdf
Kraemer-Eis, H., Schaber, M., and Tappi, A. (2010). SME loan securitisation. An important tool to support European SME lending. EIF Working Paper 2010/007. EIF Research & Market Analysis. October 2010. http://www.eif.org/news_centre/publications/eif-wp_2010_007_smesec.pdf
Kraemer-Eis, H., Signore, S., and Prencipe, D. (2016). The European venture capital landscape: an EIF perspective. Volume I: The impact of EIF on the VC ecosystem. EIF Working Paper 2016/34. EIF Research & Market Analysis. June 2016. http://www.eif.org/news_centre/research/index.htm
Lerner, J., Schoar, A., Sokolinski, S., and Wilson, K. (2015). The Globalisation of Angel Investment. Bruegel Working Paper 2015/09. August 2015. http://bruegel.org/wp-content/uploads/2015/09/WP-2015-091.pdf
Mason, C.M. and Harrison, R.T. (2013). Business angel investment activity in the financial crisis: UK evidence and policy implications. July 2013. http://www.gla.ac.uk/media/media_286594_en.pdf
McGrath, C. (2017). European tech companies need money to scale up, not just start up. Financial Times Special Report “The Connected Business”. 3.5.2017. https://www.ft.com/content/57ba6236-f766-11e6-bd4e-68d53499ed71
Mersch, Yves (2017). Securitisation revisited. Keynote speech at the Euro Finance Week, 16.11.2017. Frankfurt/M.
Moeglich, A.-K. (2017). ABS & Structured Credits. DZ Bank. 22.08.2017.
Moody’s (2017a). Securitisation is a relevant source of funding for the European economy. Sector in-depth, Securitisation – Europe. 25.09.2017.
Moody’s (2017b). SME loan and lease ABS - Europe: Performance Update. June 2017. 24.10.2017.
Moore, W., & Craigwell, R. (2003). The relationship between commercial banks' interest rates and loan sizes: evidence from a small open economy. Applied Financial Economics, 13(4), pp. 257-266.

116
Mueller-Marbach, M., and Steinmetzer, R. (2017). The latest on terms & conditions for PE/VC funds: what’s hot – and what’s not … Fund structures blog. 25.5.2017. http://www.fundstructuresblog.com/latest-terms-conditions-pevc-funds-whats-hot-whats-not/
Naydenova, E., and Roberts, S. (2017). Transforming the private equity business model. In: Preqin (2017a). P. 7.
Nepelski, D., Piroli, G., and De Prato, G. (2016). European Start-up Hotspots: An Analysis based on VC-bakced Companies. Joint Research Centre, JRC Scientific and Policy Report. EUR 28021 EN. doi:10.2791/39207.
OECD (2006). The SME Financing Gap. Vol. 1. Theory and Evidence. http://www.oecd-ilibrary.org/finance-and-investment/the-sme-financing-gap-vol-i_9789264029415-en
OECD (2011). Financing high-growth firms. The role of angel investors. December 2011.
OECD (2012), Financing SMEs and Entrepreneurs. An OECD Scoreboard 2012, OECD Publishing, Paris. http://www.oecd-ilibrary.org/industry-and-services/financing-smes-and-entrepreneurship_9789264166769-en
OECD (2013). SME and Entrepreneurship Financing: The Role of Credit Guarantee Schemes and Mutual Guarantee Societies in supporting finance for small and medium-sized enterprises. Final Report. CFE/SME(2012)1/FINAL. Unclassified. 30.01.2013. http://www.oecd.org/officialdocuments/publicdisplaydocumentpdf/?cote=CFE/SME(2012)1/FINAL&docLanguage=En
OECD (2014a). Entrepreneurship at a Glance 2014. http://www.oecd-ilibrary.org/industry-and-services/entrepreneurship-at-a-glance-2014_entrepreneur_aag-2014-en.
OECD (2014b). Financing SMEs and Entrepreneurs 2014. An OECD Scoreboard, OECD Publishing, Paris.
OECD (2015). New Approaches to SME and Entrepreneurship Financing: Broadening the Range of Instruments. https://www.oecd.org/cfe/smes/New-Approaches-SME-full-report.pdf
OECD (2016). Financing SMEs and Entrepreneurs 2016. An OECD Scoreboard. April 2016. http://www.oecd-ilibrary.org/industry-and-services/financing-smes-and-entrepreneurs-2016_fin_sme_ent-2016-en
OECD (2017a). Financing SMEs and Entrepreneurs 2017. An OECD Scoreboard. April 2017. http://dx.doi.org/10.1787/fin_sme_ent-2017-en
OECD (2017b). Recent Trends in SME and Entrepreneurship Finance. Draft chapter 4.10.2017. In: Financing SMEs and Entrepreneurs 2018: An OECD Scoreboard. Forthcoming 2018.
OECD (2017c). International Migration Outlook 2017.
OECD (2017d). The Missing Entrepreneurs 2017 Policies for Inclusive Entrepreneurship. December 2017. http://www.oecd.org/industry/the-missing-entrepreneurs-2017-9789264283602-en.htm
OECD (2018a). Alternative Financing Instruments for SMEs and Entrepreneurs: The Case of Capital Market Finance. OECD Publishing. Paris. Forthcoming.
OECD (2018b). Financing SMEs and Entrepreneurs 2018. An OECD Scoreboard, Forthcoming.
OECD/The European Commission (2014). The Missing Entrepreneurs: Policies for inclusive entrepreneurship in Europe. 2014.
Prencipe, D. (2017). Liquidity events and returns of EIF-backed VC investments. The European venture capital landscape: an EIF perspective. Volume III. EIF Working Paper 2017/41. 10.4.2017. http://www.eif.org/news_centre/research/index.htm
Preqin (2016a). Preqin Investor Outlook: Alternative Assets H1 2016. https://www.preqin.com/docs/reports/Preqin-Investor-Outlook-Alternative-Assets-H1-2016.pdf
Preqin (2016b). Preqin Investor Outlook: Alternative Assets H2 2016. https://www.preqin.com/docs/reports/Preqin-Investor-Outlook-Alternative-Assets-H2-2016.pdf
Preqin (2016c). Preqin Investor Outlook: Alternative Assets H1 2017. February 2017. https://www.preqin.com/docs/reports/Preqin-Investor-Outlook-Alternative-Assets-H1-2017.pdf

117
Preqin (2017a). Preqin Investor Outlook: Alternative Assets H2 2017. September 2017. https://www.preqin.com/docs/reports/Preqin-Investor-Outlook-Alternative-Assets-H2-2017.pdf
Preqin (2017b). Preqin Special Report: Venture Capital Fund Manager Outlook H2 2017. September 2017. https://www.preqin.com/docs/reports/Preqin-Special-Report-Venture-Capital-Fund-Manager-Outlook-H2-2017.pdf
Preqin (2017c). Preqin Special Report: Women in Alternative Assets. October 2017. http://docs.preqin.com/reports/Preqin-Special-Report-Women-in-Alternative-Assets-October-2017.pdf
Preqin (2017d). Private equity & venture capital spotlight. Vol. 13, issue 8. November 2017. http://docs.preqin.com/newsletters/pe/Preqin-Private-Equity-and-Venture-Capital-Spotlight-November-2017.pdf
Raves, P. (2017). “Influence of entrepreneurs’ human and social capital on the performance of start-ups in Ireland and United Kingdom” Master Thesis. Delivered at the University of Trier. 21.11.2017. Mimeo.
Ryan, R., O’Toole, C. and McCann, F. (2014). Does bank market power affect SME financing constraints? Journal of Banking & Finance, 49, 495-505.
Saunders-Calvert, L. (2017). Global Venture Capital.
Schich, S., Cariboni, J., Naszodi, A., Maccaferri, S. (2017). Evaluating Publicly Supported Credit Guarantee Programmes for SMEs https://www1.oecd.org/finance/Evaluating-Publicly-Supported-Credit-Guarantee-Programmes-for-SMEs.pdf
Signore, S. (2016). Growth patterns of EIF-backed startups. The European venture capital landscape: an EIF perspective. Volume II. EIF Working Paper 2016/38. 16.12.2016. http://www.eif.org/news_centre/research/index.htm
Signore, S. and Torfs, W. (2017). The value of innovation for EIF-backed startups. The European venture capital landscape: an EIF perspective. Volume IV. EIF Working Paper 2017/45. 13.12.2017. http://www.eif.org/news_centre/research/index.htm
Signori, A. & Vismara, S. (2017) Does success bring success? The post-offering lives of equity-crowdfunded firms. Journal of Corporate Finance, forthcoming.
Singh, Permith (2017). Funding Unlocked. In: The Treasurer. May 2017.
Slush and Atomico (2016). The State of European Tech. 2016 edition. November 2016. www.atomico.com/InventedHere
Slush and Atomico (2017). The State of European Tech 2017. November 2017. www.stateofeuropeantech.com
Standard & Poor’s (2014). Seven years on, the cumulative default rate for European Structured Finance is only 1.6%. S&P Credit Research. 26.08.2014.
Ständer, P. (2017). Public policies to promote venture capital: how to get national and EU measures in sync. Jacques Delors Institut Berlin. Policy Paper No. 203. 31.08.2017. http://www.institutdelors.eu/media/publicpoliciestopromoteventurecapital-stnder-august17.pdf?pdf=ok
Stiglitz, J. and Weiss, A. (1981). Credit rationing in markets with imperfect information. The American Economic Review, 71 (3), 393–410.
Stiglitz, J. E. (1972). Some aspects of the pure theory of corporate finance: bankruptcies and take-overs. The Bell Journal of Economics and Management Science, pp. 458-482.
Teare, G. (2017). Announcing The 2017 Update To The Crunchbase Women in Venture Report. 4.10.2017. https://news.crunchbase.com/news/announcing-2017-update-crunchbase-women-venture-report/?utm_source=cb_weekend&utm_medium=email&utm_campaign=20170930& utm_content=sub-hero&utm_term=link_womeninventure
Tech Tour (2017). Tech Tour Growth 50 2017. http://www.techtourgrowth50.com/
Tirole, J. (2006). The theory of corporate finance. Princeton University Press.
UEAPME Study Unit (2017). The EU Craft and SME Barometer 2017/H2. October 2017.

118
Uhde, A. and Heimeshoff, U. (2009). Consolidation in banking and financial stability in Europe: Empirical evidence. Journal of Banking & Finance, 33 (7), 1299-1311.
Unquote Intelligence (2014). The Role of Public Funding Bodies in European Venture Capital. Q2 2014.
VIWGCGS (2014). Credit Guarantee Schemes for SME lending in Central, Eastern and South-Eastern Europe. A report by the Vienna Initiative Working Group on Credit Guarantee Schemes. November 2014. http://www.eib.org/infocentre/publications/all/viwg-credit-guarantee-schemes-report.htm
Wagenvoort, R. J., Ebner, A., & Borys, M. M. (2011). A factor analysis approach to measuring European loan and bond market integration. Journal of Banking & Finance, 35(4), pp. 1011-1025.
WEF (2017). Beyond Fintech: a pragmatic assessment of disruptive potential in financial services. World Economic Forum.
Wehinger, G. and Nassr, I (2015). Unlocking SME finance through market-based debt: Securitisation, private placements and bonds, In: OECD Journal: Financial Market Trends. April 2015. http://www.oecd.org/daf/fin/financial-markets/Unlocking-SME-finance-through-market-based-debt.pdf
Wilson, K. (2015a). How to unleash the financing of high growth firms in Europe: 10 recommendations for catalysing growth. Bruegel blog. 27 May 2015. http://www.bruegel.org/nc/blog/detail/article/1636-how-to-unleash-the-financing-of-high-growth-firms-in-europe/
Wilson, K. (2015b). Policy Lessons from Financing Innovative Firms. OECD Science, Technology and Industry Policy Papers, No. 24. OECD Publishing, Paris. 24 June 2015. http://dx.doi.org/10.1787/5js03z8zrh9p-en
World Bank Group and First Initiative (2017). Task Force for the Development of a Toolkit for Impact Evaluation of Public Credit Guarantee Schemes for SMEs. Consultative Document Prepared by the Secretariat of the Task Force. August 2017. https://consultations.worldbank.org/consultation/toolkit-impact-evaluation-public-credit-guarantee-schemes-smes
Zetzsche D. & Preiner, C. (2017) Cross-border crowdfunding – Towards a single crowdfunding market for Europe. European Business Organization Law Review, forthcoming.

119
About …
… the European Investment Fund
The European Investment Fund (EIF) is Europe’s leading risk finance provider for small and medium sized enterprises (SMEs) and mid-caps, with a central mission to facilitate their access to finance. As part of the European Investment Bank (EIB) Group, EIF designs, promotes and implements equity and debt financial instruments which specifically target the needs of these market segments.
In this role, EIF fosters EU objectives in support of innovation, research and development, entrepreneurship, growth, and employment. EIF manages resources on behalf of the EIB, the European Commission, national and regional authorities and other third parties. EIF support to enterprises is provided through a wide range of selected financial intermediaries across Europe. EIF is a public-private partnership whose tripartite shareholding structure includes the EIB, the European Union represented by the European Commission and various public and private financial institutions from European Union Member States and Turkey. For further information, please visit www.eif.org.
… EIF’s Research & Market Analysis
Research & Market Analysis (RMA) supports EIF’s strategic decision-making, product development and mandate management processes through applied research and market analyses. RMA works as internal advisor, participates in international fora and maintains liaison with many organisations and institutions.
… this Working Paper series
The EIF Working Papers are designed to make available to a wider readership selected topics and studies in relation to EIF´s business. The Working Papers are edited by EIF´s Research & Market Analysis and are typically authored or co-authored by EIF staff, or written in cooperation with EIF. The Working Papers are usually available only in English and distributed in electronic form (pdf).

120
EIF Working Papers
2009/001 Microfinance in Europe – A market overview. November 2009.
2009/002 Financing Technology Transfer. December 2009.
2010/003 Private Equity Market in Europe – Rise of a new cycle or tail of the recession?
February 2010. 2010/004 Private Equity and Venture Capital Indicators – A research of EU27 Private Equity and Venture Capital Markets. April 2010. 2010/005 Private Equity Market Outlook.
May 2010. 2010/006 Drivers of Private Equity Investment activity. Are Buyout and Venture investors really so different? August 2010 2010/007 SME Loan Securitisation – an important tool to support European SME lending.
October 2010. 2010/008 Impact of Legislation on Credit Risk – How different are the U.K. and Germany?
November 2010. 2011/009 The performance and prospects of European Venture Capital.
May 2011. 2011/010 European Small Business Finance Outlook.
June 2011. 2011/011 Business Angels in Germany. EIF’s initiative to support the non-institutional
financing market. November 2011. 2011/012 European Small Business Finance Outlook 2/2011.
December 2011. 2012/013 Progress for microfinance in Europe.
January 2012. 2012/014 European Small Business Finance Outlook.
May 2012. 2012/015 The importance of leasing for SME finance.
August 2012. 2012/016 European Small Business Finance Outlook.
December 2012. 2013/017 Forecasting distress in European SME portfolios.
May 2013. 2013/018 European Small Business Finance Outlook.
June 2013.
121
2013/019 SME loan securitisation 2.0 – Market assessment and policy options. October 2013.
2013/020 European Small Business Finance Outlook. December 2013.
2014/021 Financing the mobility of students in European higher education. January 2014.
2014/022 Guidelines for SME Access to Finance Market Assessments. April 2014.
2014/023 Pricing Default Risk: the Good, the Bad, and the Anomaly. June 2014.
2014/024 European Small Business Finance Outlook. June 2014.
2014/025 Institutional non-bank lending and the role of debt funds. October 2014.
2014/026 European Small Business Finance Outlook. December 2014.
2015/027 Bridging the university funding gap: determinants and consequences of university seed funds and proof-of-concept Programs in Europe.
May 2015. 2015/028 European Small Business Finance Outlook.
June 2015. 2015/029 The Economic Impact of EU Guarantees on Credit to SMEs - Evidence from CESEE
Countries. July 2015. 2015/030 Financing patterns of European SMEs: An Empirical Taxonomy
November 2015 2015/031 SME Securitisation – at a crossroads?
December 2015. 2015/032 European Small Business Finance Outlook.
December 2015. 2016/033 Evaluating the impact of European microfinance. The foundations.
January 2016 2016/034 The European Venture Capital Landscape: an EIF perspective.
Volume I: the impact of EIF on the VC ecosystem. June 2016. 2016/035 European Small Business Finance Outlook.
June 2016. 2016/036 The role of cooperative banks and smaller institutions for the financing of SMEs and
small midcaps in Europe. July 2016. 2016/037 European Small Business Finance Outlook.
December 2016. 2016/038 The European Venture Capital Landscape: an EIF perspective. Volume II: Growth
patterns of EIF-backed startups. December 2016.
122
2017/039 Guaranteeing Social Enterprises – The EaSI way. February 2017.
2017/040 Financing Patterns of European SMEs Revisited: An Updated Empirical Taxonomy and Determinants of SME Financing Clusters. March 2017.
2017/041 The European Venture Capital landscape: an EIF perspective. Volume III: Liquidity events and returns of EIF-backed VC investments. April 2017.
2017/042 Credit Guarantee Schemes for SME lending in Western Europe. June 2017.
2017/043 European Small Business Finance Outlook. June 2017.
2017/044 Financing Micro Firms in Europe: An Empirical Analysis September 2017
2017/045 The European venture capital landscape: an EIF perspective. Volume IV: The value of innovation for EIF-backed startups. December 2017.
2017/046 European Small Business Finance Outlook. December 2017.

123
This page is left intentionally blank.

124