quasi-experiments. the basic nonequivalent groups design (negd) l key feature: nonequivalent...
TRANSCRIPT

Quasi-ExperimentsQuasi-Experiments

The Basic Nonequivalent Groups Design The Basic Nonequivalent Groups Design (NEGD)(NEGD)
Key Feature: Nonequivalent Key Feature: Nonequivalent assignmentassignment
N O X ON O O

What Does Nonequivalent Mean?What Does Nonequivalent Mean?
Assignment is nonrandom.Assignment is nonrandom. Researcher didn’t control assignment.Researcher didn’t control assignment. Groups Groups maymay be different. be different. Group differences Group differences maymay affect outcomes. affect outcomes.

EquivalenceEquivalence
““Equivalent” groups are not necessarily Equivalent” groups are not necessarily identical on any pre-test measure.identical on any pre-test measure.
Merely implies that if the random Merely implies that if the random assignment procedure was repeated, assignment procedure was repeated, the groups would tend toward the groups would tend toward equivalence.equivalence.

Non-EquivalenceNon-Equivalence
Non-equivalent groups do not necessarily Non-equivalent groups do not necessarily differ on any pre-test measure.differ on any pre-test measure.
Merely implies that If the same non-Merely implies that If the same non-random assignment procedure was random assignment procedure was repeated, the groups would tend to toward repeated, the groups would tend to toward non-equivalence.non-equivalence.
If assignment to groups was based partly If assignment to groups was based partly on income, then groups would tend to on income, then groups would tend to have different expected mean levels of have different expected mean levels of income – but any two groups you picked income – but any two groups you picked might well be similar in income levels.might well be similar in income levels.

The PointThe Point
Equivalence or non-equivalence is Equivalence or non-equivalence is defined by the defined by the selection procedureselection procedure..
Even if the difference in pre-test Even if the difference in pre-test means across groups is “small,” means across groups is “small,” this does not imply that the groups this does not imply that the groups are equivalent. are equivalent. – Small differences can introduce big threats.Small differences can introduce big threats.

Quasi- vs. Natural vs. ExperimentQuasi- vs. Natural vs. Experiment
In a true experiment, the researcher performs In a true experiment, the researcher performs the random assignmentthe random assignment– Can be in a lab or the fieldCan be in a lab or the field
In a natural experiment, someone else In a natural experiment, someone else assigns through a “random” process.assigns through a “random” process.
In a quasi-experiment, assignment is not In a quasi-experiment, assignment is not random, introducing selection threats.random, introducing selection threats.– Much stronger if the selection is not done by the Much stronger if the selection is not done by the
cases themselves (exogenous sorting).cases themselves (exogenous sorting).

What is a Natural ExperimentWhat is a Natural Experiment
Strict Definition: Strict Definition: – Some truly natural process, such as rainfall Some truly natural process, such as rainfall
or weather patterns, assigns IV.or weather patterns, assigns IV.
Definition we all use in our own work:Definition we all use in our own work:– Some exogenous process, rather than our Some exogenous process, rather than our
cases, ourselves, or a causal process cases, ourselves, or a causal process relevant to our theory, assigns IV.relevant to our theory, assigns IV.

Genres of Natural ExperimentsGenres of Natural Experiments
The natural border or The natural border or natural disasternatural disaster
– Jared Diamond’s islandsJared Diamond’s islands– Dan Posner’s rivers Dan Posner’s rivers – Caroline Hoxby’s streamsCaroline Hoxby’s streams– Settler mortality Settler mortality
(Acemoglu, Johnson, and (Acemoglu, Johnson, and Robinson)Robinson)
– Hurricane KatrinaHurricane Katrina
– Strength is that nature Strength is that nature doesn’t care about your doesn’t care about your cases or IV cases or IV
The Rule ChangeThe Rule Change
– House seniority system House seniority system (Crooks and Hibbing)(Crooks and Hibbing)
– GAVEL amendment in GAVEL amendment in ColoradoColorado
– Connecticut speeding lawConnecticut speeding law– New Zealand electoral New Zealand electoral
reformreform– PropositionsPropositions
– Relatively easy to spot, Relatively easy to spot, hard to defendhard to defend

Genres of Natural ExperimentsGenres of Natural Experiments
The Court DecisionThe Court Decision
Roe V. Wade for Levitt Roe V. Wade for Levitt and Donohueand Donohue
Iowa item veto decisionIowa item veto decision
Strength is that court is Strength is that court is not a blatant political not a blatant political actor responding to actor responding to societal shifts or societal societal shifts or societal pressurespressures
The LotteryThe Lottery
James Fowler’s use of James Fowler’s use of Canadian bill introduction Canadian bill introduction privilegeprivilege
US House Clerk conducts a US House Clerk conducts a randomization of the order randomization of the order in which members choose in which members choose officeoffice
Strength is true Strength is true randomness in first step, randomness in first step, but human action in 2ndbut human action in 2nd
Genres of Natural ExperimentsGenres of Natural Experiments
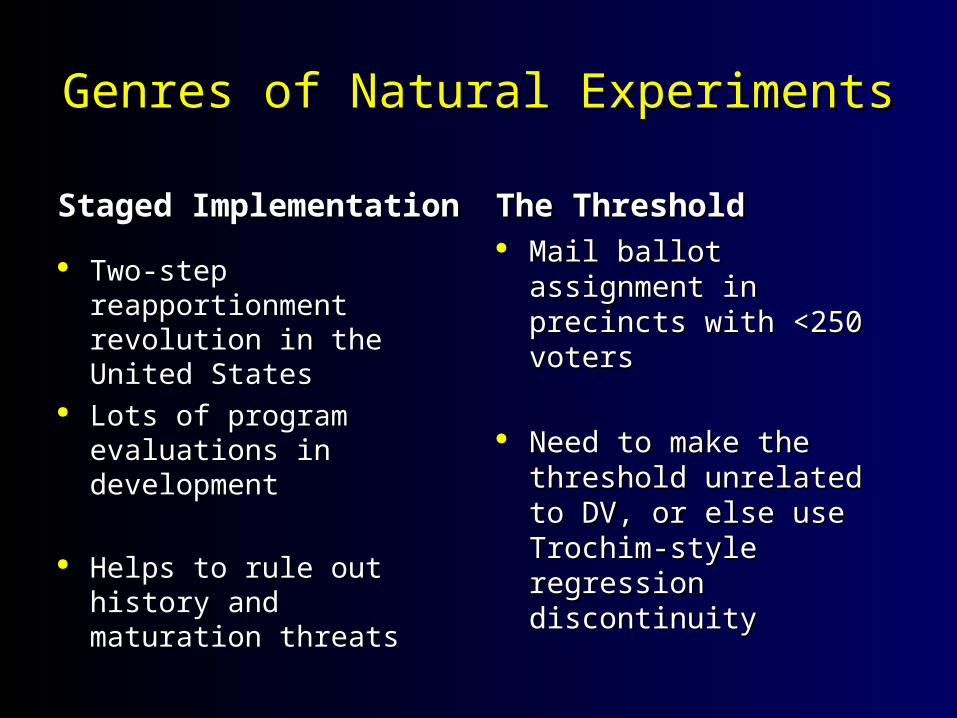
Staged ImplementationStaged Implementation
Two-step Two-step reapportionment reapportionment revolution in the United revolution in the United StatesStates
Lots of program Lots of program evaluations in evaluations in developmentdevelopment
Helps to rule out history Helps to rule out history and maturation threatsand maturation threats
The Threshold The Threshold Mail ballot assignment in Mail ballot assignment in
precincts with <250 precincts with <250 votersvoters
Need to make the Need to make the threshold unrelated to threshold unrelated to DV, or else use Trochim-DV, or else use Trochim-style regression style regression discontinuitydiscontinuity

What Makes a Convincing Natural What Makes a Convincing Natural Experiment?Experiment?
You can show that the process of selection You can show that the process of selection was not related to characteristics of the cases was not related to characteristics of the cases that are relevant to your DVthat are relevant to your DV
In a cross-sectional experiment, demonstrate In a cross-sectional experiment, demonstrate that the two groups are quite similarthat the two groups are quite similar
In a time-series experiment, demonstrate that In a time-series experiment, demonstrate that little else changed when the treatment took little else changed when the treatment took place. place.
In a word, show equivalenceIn a word, show equivalence

Any purported causal test of needs to take Any purported causal test of needs to take into consideration all of the two-group into consideration all of the two-group
threats to validity.threats to validity.
R X OR O
N X ON O
Can be a valid causal test.
Fully exposed to threats.

NEGD Design has Multiple Groups AND NEGD Design has Multiple Groups AND Multiple MeasuresMultiple Measures
N O X ON O O
This helps rule out (or at least recognize)
threats.

Pre-Tests v. CovariatesPre-Tests v. Covariates
N O X ON O O
N O1 X O2
N O1 O2
Proxy Pre-Test Design: First observations are
covariates on which you collect data.
Pre- Post-Test Design:Observations are tests
you administer.

Problems of Internal Validity in Problems of Internal Validity in NEGDsNEGDs

Internal ValidityInternal Validity NN OO XX OONN OO OO
Selection-historySelection-maturation
Selection-testingSelection-instrumentation
Selection-regressionSelection-mortality
All designs suffer from threats to validity.In addition to all the single group threats,
quasi-experiments are particularly likely to sufferfrom multi-group threats.

The Bivariate DistributionThe Bivariate Distribution
807060504030
90
80
70
60
50
40
30
Pretest
Post
test

The Bivariate DistributionThe Bivariate Distribution
807060504030
90
80
70
60
50
40
30
pretest
Post
test
Program Group has a5-point pretest
advantage.

The Bivariate DistributionThe Bivariate Distribution
807060504030
90
80
70
60
50
40
30
pretest
Post
test
Program group has a5-point pretest
advantage,
Programgroupscores
15-pointshigher
onPosttest.
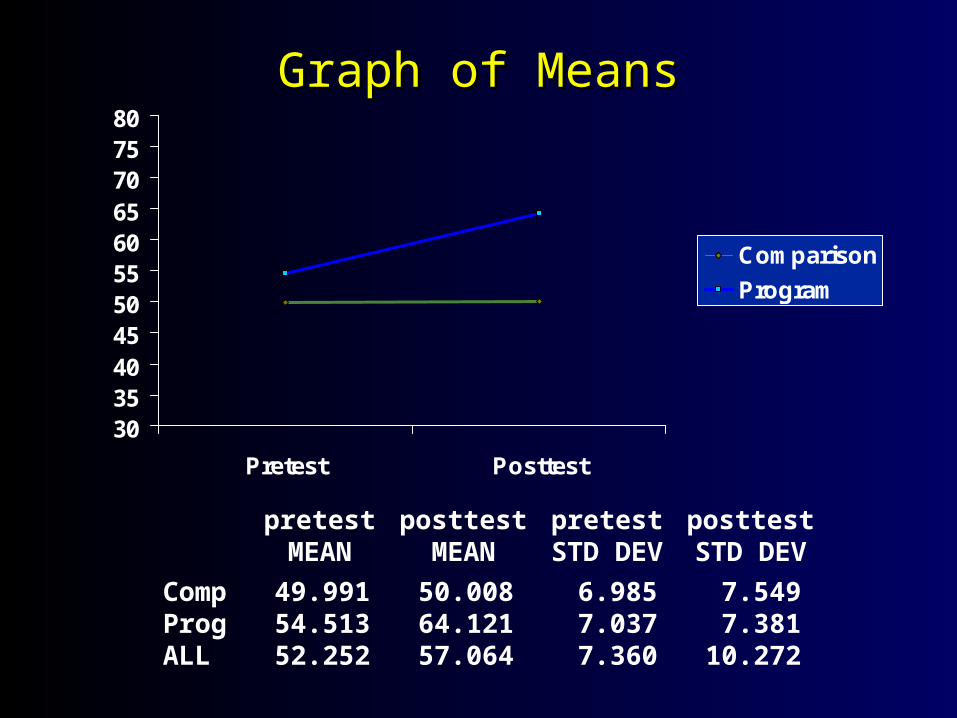
Graph of MeansGraph of Means
3035404550556065707580
Pretest Posttest
Comparison
Program
pretest posttest pretest posttestMEAN MEAN STD DEV STD DEV
Comp 49.991 50.008 6.985 7.549Prog 54.513 64.121 7.037 7.381ALL 52.252 57.064 7.360 10.272

Possible Outcome #1Possible Outcome #1
Possible: local eventPossible: local event Possible: PG initially higherPossible: PG initially higher Unlikely: no change in CGUnlikely: no change in CG Possible: scale effectsPossible: scale effects Unlikely: expect change in CGUnlikely: expect change in CG Possible: PG loses low scorers Possible: PG loses low scorers
40
45
50
55
60
65
70
Pretest Posttest
Comparison
Program
Selection-historySelection-maturation
Selection-testingSelection-instrumentation
Selection-regressionSelection-mortality

Possible Outcome #2Possible Outcome #2
Likely: PG initially higherLikely: PG initially higher Likely: PG initially higherLikely: PG initially higher PossiblePossible PossiblePossible Unlikely: expect change in CGUnlikely: expect change in CG Possible: both lose low scorers Possible: both lose low scorers
40
45
50
55
60
65
70
Pretest Posttest
Comparison
Program
Selection-historySelection-maturation
Selection-testingSelection-instrumentation
Selection-regressionSelection-mortality

Possible Outcome #3Possible Outcome #3
Possible: local eventPossible: local event Unlikely: no change in CGUnlikely: no change in CG Unlikely: no change in CGUnlikely: no change in CG Possible: scale effectsPossible: scale effects LikelyLikely Possible: PG loses high Possible: PG loses high
scorersscorers
40
45
50
55
60
65
70
Pretest Posttest
Comparison
Program
Selection-historySelection-maturation
Selection-testingSelection-instrumentation
Selection-regressionSelection-mortality

Possible Outcome #4Possible Outcome #4
Possible: local eventPossible: local event Unlikely: no change in CGUnlikely: no change in CG Unlikely: no change in CGUnlikely: no change in CG Possible: scale effectsPossible: scale effects Very LikelyVery Likely Possible: PG loses low scorers Possible: PG loses low scorers
40
45
50
55
60
65
70
Pretest Posttest
Comparison
Program
Selection-historySelection-maturation
Selection-testingSelection-instrumentation
Selection-regressionSelection-mortality

Possible Outcome #5Possible Outcome #5
““And you should be so lucky…”And you should be so lucky…”
40
45
50
55
60
65
70
Pretest Posttest
Comparison
Program
Selection-historySelection-maturation
Selection-testingSelection-instrumentation
Selection-regressionSelection-mortality

Analysis RequirementsAnalysis Requirements
Pre-post (or covariates)Pre-post (or covariates) Two-groupTwo-group Treatment-control (dummy = 0, 1)Treatment-control (dummy = 0, 1)
N O X ON O O

Analysis of Covariance (ANCOVA)Analysis of Covariance (ANCOVA)
yyii = = outcome score for the ioutcome score for the ithth unit unit
00 == coefficient for the coefficient for the interceptintercept
11 == pretest coefficientpretest coefficient
22 == mean difference for treatmentmean difference for treatment
XXii == covariatecovariate
ZZii == dummy variable for treatment(0 = control, 1= treatment)dummy variable for treatment(0 = control, 1= treatment)
eeii == residual for the iresidual for the ithth unit unit
yi = 0 + 1Xi + 2Zi + ei
where:

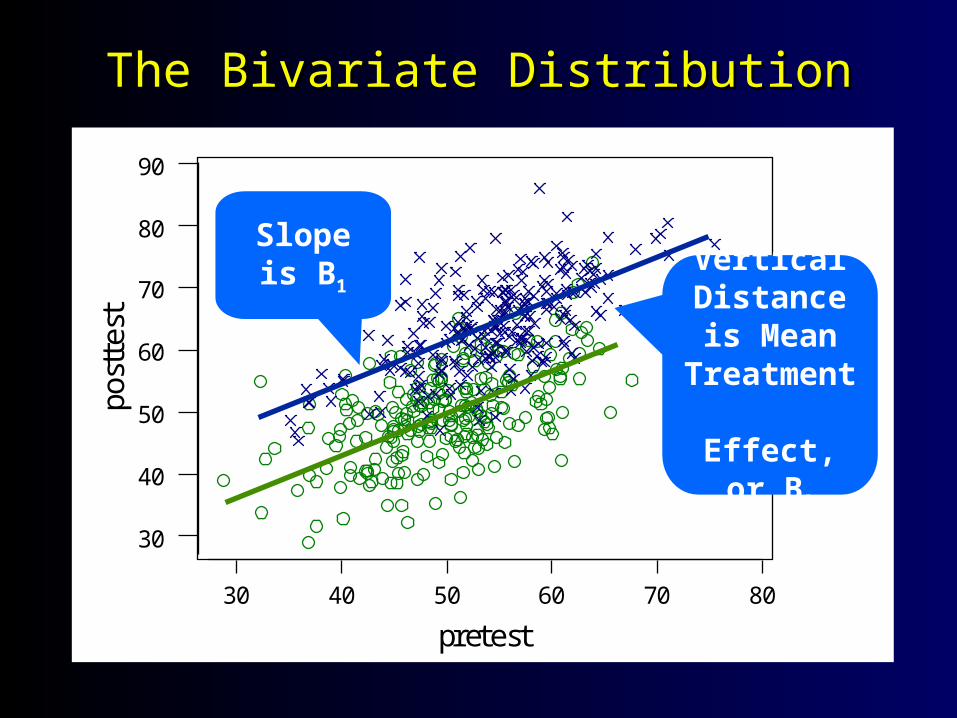
The Bivariate DistributionThe Bivariate Distribution
807060504030
90
80
70
60
50
40
30
pretest
post
test
Program group has a5-point pretest
Advantage.
Programgroupscores
15-pointshigher
onPosttest.
The Bivariate DistributionThe Bivariate Distribution
807060504030
90
80
70
60
50
40
30
pretest
post
test
Slope is B1 Vertical
Distance is Mean
Treatment Effect, or
B2

Why Add Covariates to Analysis?Why Add Covariates to Analysis?
ANCOVA can include more than one ANCOVA can include more than one pretest or “control” variable.pretest or “control” variable.
Additional pretests further adjust for Additional pretests further adjust for initial group differences.initial group differences.
Ideally, in the absence of any treatment Ideally, in the absence of any treatment effect, the covariates would perfectly effect, the covariates would perfectly predict the posttest. predict the posttest.
Additional covariates will often improve Additional covariates will often improve the accuracy of the estimate of the the accuracy of the estimate of the treatment effect.treatment effect.

Irrelevant CovariatesIrrelevant Covariates
Adding pretests that are completely Adding pretests that are completely unrelated to the posttest, however, unrelated to the posttest, however, actually decreases precision. actually decreases precision.
““Irrelevant covariates” contribute Irrelevant covariates” contribute nothing to the analysis, but subtract a nothing to the analysis, but subtract a degree of freedom from the error term. degree of freedom from the error term.
This reduces the efficiency of the This reduces the efficiency of the estimate.estimate.

Omitted CovariatesOmitted Covariates
Covariates that are related to the posttest but Covariates that are related to the posttest but not to the treatment can be ignored without not to the treatment can be ignored without biasing the estimate of the treatment effect.biasing the estimate of the treatment effect.
Covariates that are related to the posttest and Covariates that are related to the posttest and the treatment but that are omitted will bias the the treatment but that are omitted will bias the estimate of the treatment effect.estimate of the treatment effect.
We can safely omit control variables even if We can safely omit control variables even if they are highly correlated with the posttest as they are highly correlated with the posttest as long as they do not correlate with the long as they do not correlate with the treatment.treatment.
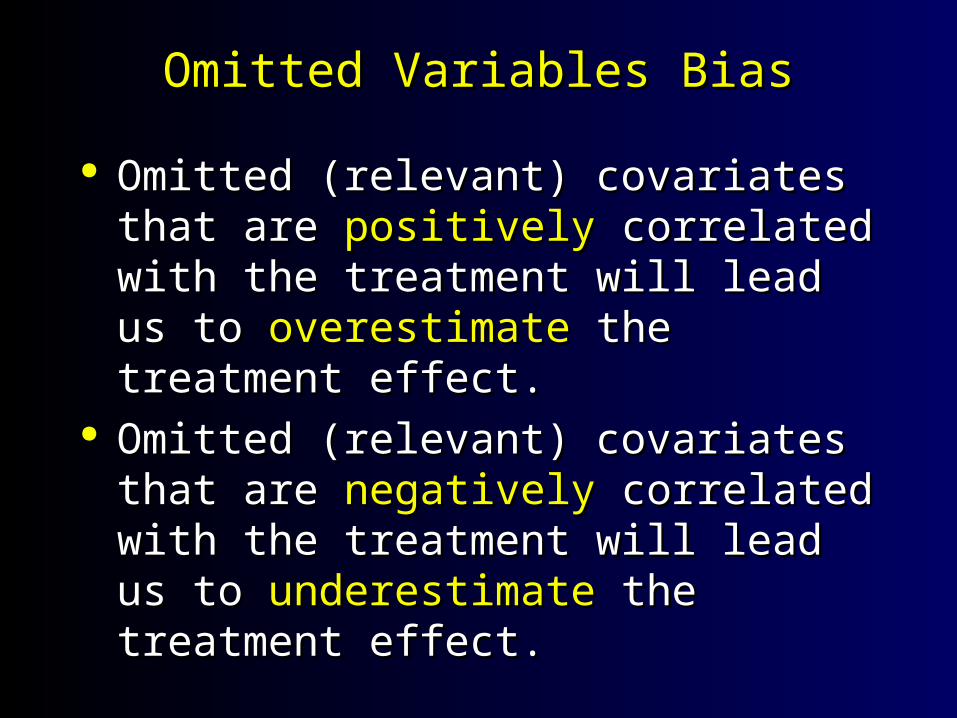
Omitted Variables BiasOmitted Variables Bias
Omitted (relevant) covariates that are Omitted (relevant) covariates that are positivelypositively correlated with the treatment correlated with the treatment will lead us to will lead us to overestimateoverestimate the the treatment effect.treatment effect.
Omitted (relevant) covariates that are Omitted (relevant) covariates that are negativelynegatively correlated with the treatment correlated with the treatment will lead us to will lead us to underestimateunderestimate the the treatment effect.treatment effect.

Bottom LineBottom Line
We should always try to include omitted We should always try to include omitted relevant covariates, exceptrelevant covariates, except
When the omitted covariate is itself a When the omitted covariate is itself a consequence of the treatment.consequence of the treatment.
If cannot include a relevant covariate, If cannot include a relevant covariate, we can at least predict the direction if we can at least predict the direction if not magnitude of the likely bias.not magnitude of the likely bias.

But…What about measurement error?But…What about measurement error?
With multiple covariates, measurement With multiple covariates, measurement error does not always lead to a pseudo-error does not always lead to a pseudo-effect.effect.
As measurement error in any single As measurement error in any single variable increases, it becomes “as if” variable increases, it becomes “as if” the variable is not included in the the variable is not included in the ANCOVA. ANCOVA.
This then mimics an omitted variables This then mimics an omitted variables problem, and the direction of bias problem, and the direction of bias depends upon the relationship between depends upon the relationship between the “noisy” covariate and the treatment.the “noisy” covariate and the treatment.
Other Quasi-Experimental DesignsOther Quasi-Experimental Designs

Separate Pre-Post SamplesSeparate Pre-Post Samples
Groups with the same subscript come from the same Groups with the same subscript come from the same context.context.
Here, NHere, N11 might be people who were in the program at might be people who were in the program at
Agency 1 Agency 1 last yearlast year, with those in N, with those in N22 at Agency 2 last year. at Agency 2 last year. This is like having a proxy pretest on a different group.This is like having a proxy pretest on a different group.
N1 ON1 X ON2 ON2 O

Separate Pre-Post SamplesSeparate Pre-Post Samples
Take Take random samplesrandom samples at two times of people at two at two times of people at two nonequivalent agencies.nonequivalent agencies.
Useful when you routinely measure with Useful when you routinely measure with surveyssurveys.. You can assume that the pre and post samples are You can assume that the pre and post samples are
equivalentequivalent, but the two agencies may not be., but the two agencies may not be.
R1 OR1 X OR2 OR2 O
NN
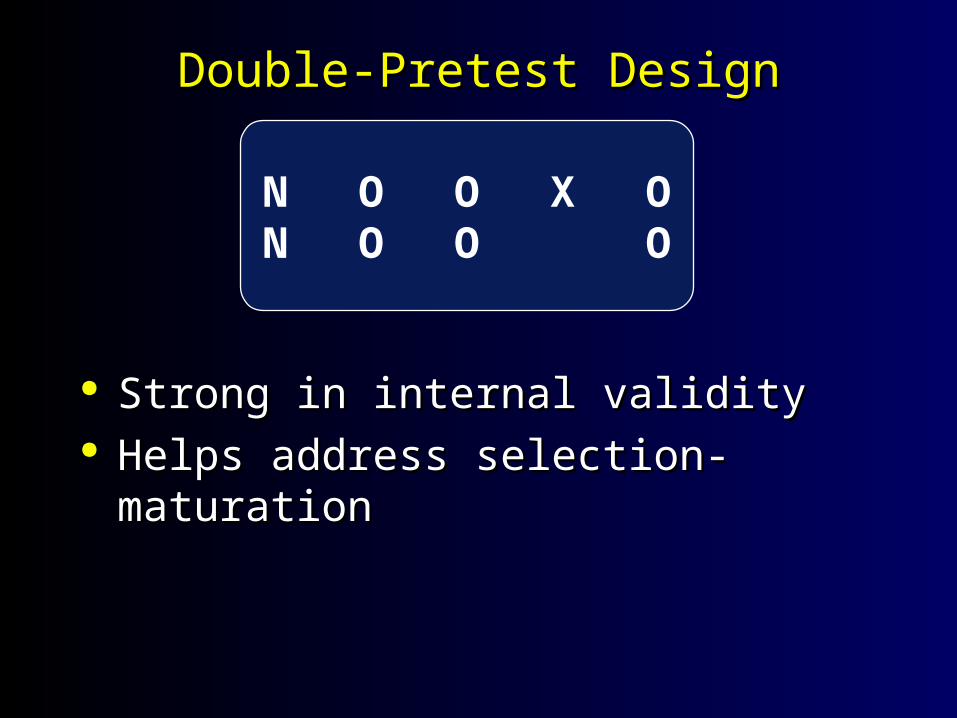
Double-Pretest DesignDouble-Pretest Design
Strong in internal validityStrong in internal validity Helps address selection-maturationHelps address selection-maturation
N O O X ON O O O
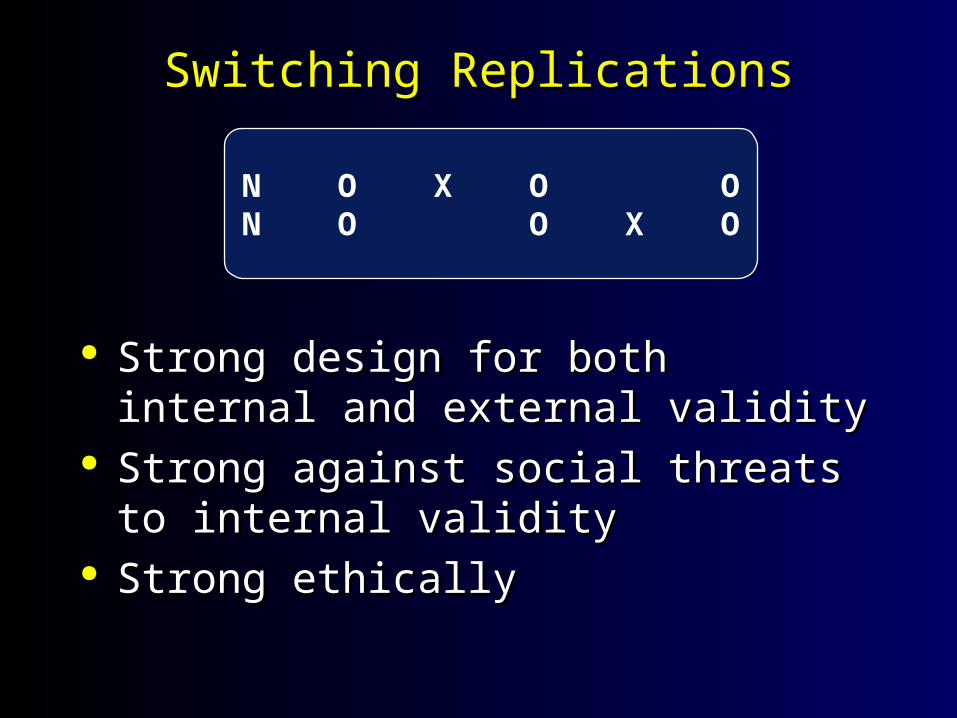
Switching ReplicationsSwitching Replications
Strong design for both internal and Strong design for both internal and external validityexternal validity
Strong against social threats to internal Strong against social threats to internal validityvalidity
Strong ethicallyStrong ethically
N O X O ON O O X O

Nonequivalent Dependent Variables Design (NEDV)Nonequivalent Dependent Variables Design (NEDV)
The variables have to be similar enough that The variables have to be similar enough that they are affected the same way by they are affected the same way by all threatsall threats..
The program has to The program has to target one variabletarget one variable and and not the other.not the other.
In simple form, weak internal validity.In simple form, weak internal validity.
N O1 X O1
O2 O2

NEDV ExampleNEDV Example
Only works if we can assume that geometry scores Only works if we can assume that geometry scores show what show what would have happenedwould have happened to algebra if to algebra if untreated.untreated.
The The variablevariable is the control. is the control. Note that there is Note that there is no control groupno control group here.here.
40
50
60
70
80
Pre Post
Algebra
Geometry

NEDV Pattern MatchingNEDV Pattern Matching
Have Have manymany outcome variables. outcome variables. Have theory that tells Have theory that tells how affectedhow affected
(from most to least) each variable will (from most to least) each variable will be by the program.be by the program.
MatchMatch observed gains with predicted observed gains with predicted ones.ones.
With pattern, NEDV can be extremely With pattern, NEDV can be extremely powerful.powerful.

NEDV Pattern MatchingNEDV Pattern Matching
A “A “ladderladder” graph.” graph.
0
20
40
60
80
Exp Obs
Algebra
Geometry
Arithmetic
Reasoning
Analogies
Grammar
Punctuation
Spelling
Comprehension
Creativity
r = .997

NEDV: Lake and O’Mahony 2006NEDV: Lake and O’Mahony 2006
A Simple Pattern-Matching Design
0
10
20
30
40
50
60
1815-1914 1918-1941 1945-1989
Period
Issue
s tha
t Gen
erate
d In
tersta
te W
ars (
Perc
ent)
Territory-Related
Foreign Interests
Economic Interests
Realpolitik
Hypothesis:As territorydeclines invalue in 20th
century(measured byaverage statesize), wars fought over
territory shoulddecline in
frequency. There should be no
pattern in otherIssues.