saurabhsrivastava”
TRANSCRIPT

7/28/2019 saurabhsrivastava”
http://slidepdf.com/reader/full/saurabhsrivastava 1/80
ON
“A Comparative study of Chocolate
Market in India”
Submitted for the partial fulfillment of the requirement
For the Degree
Of
Master of Business Administration
FROM
U.P. TECHNICAL UNIVERSITY
UNDER THE GUIDANCE OF SUBMITTED BY
1
7/28/2019 saurabhsrivastava”
http://slidepdf.com/reader/full/saurabhsrivastava 2/80
Table of Contents
PrafacePraface
Acknowledgement Acknowledgement
1. Executive summery
2. Chocolate Industry in India
3. Major Players
4. Amul
5. Nestle
6. Cadbury
7. Market share8. problem definition
9. Research Methodology
10.Analysis and interpretation
11.findings
12.Suggestion
13.conclusion
14.limitation15.Bibliography
2

7/28/2019 saurabhsrivastava”
http://slidepdf.com/reader/full/saurabhsrivastava 3/80
PREFACEPREFACE
This project report has been prepared with the objective for the
fulfillment of the degree of master's in business administration, a requisite
requirement.
The report contains all the finding deducted during the analysis process.
The title of the project is “A Comparative study of Chocolate Market in
India” It consists of research work conducted, tabulation & analysis of data
collected, which ends in the effective & impressive suggestion &
conclusion.
I hereby divided this Project Report into different sections in which contain
different information’s about Chocolate Industry and details about my
project work.
3

7/28/2019 saurabhsrivastava”
http://slidepdf.com/reader/full/saurabhsrivastava 4/80
ACKNOWJEDEMENT
A large number of individuals have contributed directly and indirectly in
this project. I am thankful to all of them for their help and encouragement.
I express my sincere thanks to my parents & friends for their constant
support and suggestions to accomplish my goals.
Last but not the least I thank God for his love and grace that enabled
me to complete this project.
Thank You.
4

7/28/2019 saurabhsrivastava”
http://slidepdf.com/reader/full/saurabhsrivastava 5/80
5

7/28/2019 saurabhsrivastava”
http://slidepdf.com/reader/full/saurabhsrivastava 6/80
THE CHOCOLATE INDUSTRY IN INDIA
The chocolate industry in India has a size of 20000 tones and is worth
about Rs 400 crores. The chocolate market has been growing by nearly 35
%. However there has been some slowdown in the last two years.
The chocolate market is predominantly urban with coverage of 95 %. The
sales volume has decreased by 5% in the last year and the chocolate
market had declined with the average consumption coming down by 25%
from 16000 tones to the current level of 125000 tones
Chocolate consumption in India is extremely low. Per capita consumption
is around 160gms in the urban areas, compared to 8-10kg in the
developed countries. In rural areas, it is even lower. Chocolates in India
are consumed as indulgence and not as a snack food. A strong volume
growth was witnessed in the early 90's when Cadbury repositioned
chocolates from children to adult consumption. The biggest opportunity is
likely to stem from increasing the consumer base. Leading players like
Cadbury and Nestle have been attempting to do this by value for money
offerings, which are affordable to the masses.
Cadbury, a subsidiary of Cadbury Schweppes is a dominating player in the
Indian chocolate market with strong brands like Dairy Milk, Five Star, Perk,
and Gems etc. Dairy milk is the largest chocolate brand in India.
Chocolates & Confectionery contribute to 75% of Cadbury’s turnover.
Cadbury also has a strong brand Bourn vita in the malted health drinkcategory, which accounts for 24% of turnover. The parent Cadbury
Schweppes during 2001 made an open offer for acquiring the 49% non-
promoter holding in the company. It has already acquired over 90% of the
equity and proposes to buy back the balance equity and delist the stock
from Indian bourses.
6

7/28/2019 saurabhsrivastava”
http://slidepdf.com/reader/full/saurabhsrivastava 7/80
THE FLIGHT WHICH FAILED TO TAKE OFF
Gujarat cooperative milk marketing federation limited (Amul)
Amul is the third player in the chocolate market in India. The brand doesn’t
have any international lineage and is miniscule in terms of market share in
chocolates and compared to the two other players Cadburys and nestle.
Amul had an extremely focused
positioning of a gift for someone you
love albeit not target to a single group
however Amul failed to capitalize on it
seemingly due to the following
reasons.
a. Chocolates have never been Amul’s main products and hence there
was lack of organizational commitment. The company has never really
supported or pushed its chocolates. This reflects on the drastic cutback
on
advertisement
expenditure for its
chocolates
which has
negativelyaffected its top of
the mind
awareness level
7

7/28/2019 saurabhsrivastava”
http://slidepdf.com/reader/full/saurabhsrivastava 8/80
b. The company has enjoyed a high customer equity and pulls in butter
and so it offered a very low retailer margin of 3.1 % as against the
industry average of around 7-8 % Amul tried the same technique in
chocolates too. However since it was neither leader nor enjoyed a
customer pull like in butter the company got very little support for its
chocolates
c. Amul chocolates have shown a very limited product differentiation and
have not really given any important additional benefit to the consumers.
The product line also suffered
d. in comparison to the portfolios of the competitor Cadbury and nestles.
Its only strength was its low price
Following are the major
brands of Amul
Amul premium Milk
♦ Amul badam bar
♦ Amul orange♦ Amul fruit and nut
♦ Amul crisp
8

7/28/2019 saurabhsrivastava”
http://slidepdf.com/reader/full/saurabhsrivastava 9/80
Nestle India limited
Nestle is a strong player in the chocolates world wide but it entered the
Indian market much later in (1991) than one of its global competitor
Cadbury. Nestle initial foray into the Indian market was not very successful.
The problem was in the formulation of the product. They were soft
chocolates with high fat content which were unsuitable to the Indian
climate. Also the distribution focus has been on the larger cities and urban
areas which limited their customer base.
It was with the launch of Chitchat that the company’s strategy changed with
respect to both product and distribution. It increased its distribution network
to cover small towns and interiors as well so as to increase the customer
base .It also modified the formulation of Moulded chocolate to suit the
Indian condition. The company used three layers of foil packaging so that
Kitkat could survive the summer heat.
Today nestle poses a formidable threat to Cadbury. Kitkat has captured asizeable chunk of the market within a short span of launch. Nestle, as in
2002-2003 has around 24 % market share with Kitkat alone accounting for
12% market share points. Nestle Bar One is another brand with a market
share of 6%. Nestle recently withdrew its Nestle bitter chocolate brand. The
other brands of nestle are nestle milky bar and nestle crunch.
Nestle have also entered the sugar confectionery market in direct Compton
with Cadbury by offering Allen’s splash and Allen’s coffees and Allen’s
Butterscotch. Amul has also entered into another foray of the confectionery
team that being ice creams. The distribution of this has been pretty good
with Amul ice-cream being available all around India.
9

7/28/2019 saurabhsrivastava”
http://slidepdf.com/reader/full/saurabhsrivastava 10/80
The advertising for the company in India is being handled by love lint’s.
Nestle has been increasing its adverting figure the latest being in 2002 RS
25 crores.
Major Chocolate Products
Crunch: Crunch Chocolate is one of the best-loved foods everywhere in
the world. It is one of life's little pleasures. The attractive tastes and
textures of
chocolate
andchocolate
products
delight the
senses of all ages.
Introduced in 1938, today Crunch is Nestlé’s third largest confectionary
brand sold in about 40 countries worldwide. Nestlé Crunch is available in
the following varieties: Nestlé Crunch, Nestlé White Crunch, Nestlé CrunchPieces, Nestlé Bunch Crunch and new products Nestlé Crunch with
caramel and Nestlé Crunch assorted minis.
Launched in 1938 in the USA, Crunch was the first chocolate bar to
combine milk chocolate and crunchy crisps. Crunch is a unique
combination of smooth Nestlé chocolate and crisped rice, which delivers an
exciting eating sensory experience of distinctive taste, texture and sound.
10

7/28/2019 saurabhsrivastava”
http://slidepdf.com/reader/full/saurabhsrivastava 11/80
Kitkat: Kitkat Chocolate is one of the best-loved foods everywhere in the
world. It is one of life's little pleasures. The attractive tastes and textures of
chocolate and
chocolate
products delight
the senses of allages.
The product, developed as Wafer Crisp, was initially launched in London,
UK in September 1935 as Rowntree's Chocolate Crisp. It became 'Kitkat' in
1937, two years before the Second World War.
Within two years of launch Kitkat was established as Rowntree's leading
product, a position that it has maintained ever since. During the Second
World War Rowntree Kitkat was seen as a valuable wartime food and
advertising described the brand as 'What active people need'.
For most of its life Rowntree Kitkat has appeared in the well-known red and
white wrapper. It did, however, change to a blue wrapper in 1945, when it
was produced with a plain chocolate covering due to a shortage of milk
following the war. This blue packaging was withdrawn in 1947 when the
standard milk chocolate Kitkat was reintroduced.
No one can be absolutely sure where the name Kitkat came from but it is
believed to be from the famous 1920's Kitkat Club in South East London
which had some influence. As the building had very low ceilings, it could
only accommodate paintings which were wide and not very high. In the art
world, these paintings were known as 'Kats'. It's believed that Kitkat
derived its name from paintings, which had to be snapped off to fit into the
rooms with the low ceilings.
Reinventing Nestle
A detail analysis by the companies management to turnaround nestle
11

7/28/2019 saurabhsrivastava”
http://slidepdf.com/reader/full/saurabhsrivastava 12/80
Top line growth, bottom-line contribution, difficult market situations. Nestle
India's trademark `renovate and innovate' strategy is churning with action.
Catalyst finds out more.
JUST how much can a housewife influence a Rs 1,688-crore company?
She's someone whose needs we anticipate
Take, for example, the exhaustive experimental kitchen and sensory
laboratory at the plush corporate headquarters of Nestle India at Gurgaon.
It's obviously a first-of-its-kind facility and research centre for any food
company in India.
The objective? Consistent product development. Also, achieving a
preference ratio of 60:40 for every Nestle product as opposed to
competition. The kitchen comprises a panel of application groups and 15
professional tasters checking out new products for consistency in quality
and product evolution on a regular basis.
The exercise, has resulted in the creation of two different flavors of Maggi
noodles (curry and tomato), Fruitips candy, besides new formulations of
Nescafe and Bar One chocolate in recent months. "And this research
model isn't a substitute for consumer research, or regular test-marketing
with the real consumer.
Based on an international research and development model proprietary to
Nestle SA, the kitchen is just one component of the Rs 3,000 crore
allocated for a centralized research and development cell for the foods
conglomerate worldwide, against Rs 2,500 crore spent on the same earlier.
Another component is the third in a series of multi-cuisine recipe
collections cutting across all Nestle products, in place of the two earlier
ones which centered on Milkmaid and Maggi.
The Nestle `renovate and innovate' mantra, meanwhile, is on in full swing.
Four existing brands - Nescafe, Milo, Bar One chocolates and Maggi super
seasonings - have been re-launched in new tastes, packaging and pack
12

7/28/2019 saurabhsrivastava”
http://slidepdf.com/reader/full/saurabhsrivastava 13/80
sizes. And another variant of Kitkat - white chocolate - has just been rolled
out.
On the launch block a month from now are 10 new product variants spread
across the culinary and confectionery segments. The restructuring exercise
of Excelcia Foods Ltd - the joint venture company in which Nestle acquired
management control following Dabur India's decision to exit non-core
areas - has neared completion. Following that, Nestle proposes to enter
fresh product categories such as biscuits in the forthcoming months.
But it's the food major's most keenly awaited venture - ice-cream - that's
got the FMCG industry abuzz. They are very much interested in the
domestic ice-creams market. Of course, that requires putting in place a
cold chain, besides stabilizing its milk and UHT businesses first.
Meanwhile, though there's no confirmation from Nestle, the industry
grapevine suggests that Nestle has begun negotiations with Vadilal for
manufacturing and marketing ice-cream.
Another category where Nestle could give Hindustan Lever a run for its
money is candy. The company has recently rolled out a candy brand by the
name of Fruitips.
On the beverage front, following the introduction of chocolate-and-coffee
formulation Choc Cafe and Frappe under the Nescafe umbrella, Nestle has
been setting up slosh-type vending machines for iced tea in two flavors -
peach and lemon. In an economy that's in a downturn, Nestlé’s
performance has been impressive. Net sales for third quarter this year
were Rs 533 crore against Rs 469 crore in the same period last year,
recording a growth of 13.5 per cent. While domestic sales grew at 11.4 per
cent in value terms, export sales for the quarter increased by 24.6 per cent.Sales during the first nine months of the year improved by 17.4 per cent,
with a net profit increase of 28.6 per cent over the same period last year.
Despite excellent top line and impressive bottom-line contribution, the
uncertain and difficult domestic and international market environment,
13

7/28/2019 saurabhsrivastava”
http://slidepdf.com/reader/full/saurabhsrivastava 14/80
coupled with seasonality factors, will affect their performance in the fourth
quarter. Market analysts warn that incremental selling and advertising
expenditure on new launches would dampen margins and that it would
take time before the new products begin contributions to turnover or
profitability.
While the success of the new variants is yet to be gauged, Nestlé’s star
performers remain Nescafe, baby food Cerelac, Maggi and Everyday.
Nestlé’s biggest strength lies in creating brands with distinct positioning.
Hence, Nescafe is generic to coffee, just the way Maggi has become
generic to instant noodles. Maggi noodles face no direct competition, with
Top Ramen barely managing to hold ground in the instant noodles
category. Another winner has been Maggi ketchup, which, FMCG analysts
say, has been built from scratch to market leadership position,outperforming Kissan.
While Nestle has done exceptionally well in Western food categories such
as ketchup, condensed milk, noodles, coffee and weaning foods, the
company hasn't been able to handle Indian product categories such as
pickles and tea too well. No one is really making money in pickles. Not only
is the unorganized and made-at-home sector too well-entrenched, even the
consumer shows no brand loyalty towards pickles. What drives her
purchase pattern is new taste and not brand preference.
The market for ready-to-cook mixes and soups too has been largely
fragmented with a distinct skew towards the unorganized sector.
In chocolates, while Cadbury India continues its stranglehold of the market,
Nestlé’s Kitkat, Bar One, Munch and Classic have been performing
reasonably. Two recent entrants to this category have been ChocoStickand Milky bar Chocolate, the latter soft chewy fudge in stick format priced
at Rs 5.
In the chilled dairy segment, Nestle dahi has recently been extended to
Mumbai and Pune. While the market for this continues to be very small
14

7/28/2019 saurabhsrivastava”
http://slidepdf.com/reader/full/saurabhsrivastava 15/80
with only Mother Dairy and Amul giving Nestle competition in the organized
sector, milk in cartons is a concept that's yet to go down well with the
Indian consumer. Apart from being expensive, the Indian consumer is still
not ready to consume milk without boiling it. And research has proved that
three-fourths of Indians prefer hot milk. On the pricing front, Nestle
continues to target the premium segment. They make inroads into marketswhich represent not only potential for consumption, but also potential for
bottom-line. Nestlé’s premium pricing strategy is a strength that's worked in
most categories it operates in.
Fruitips, therefore, occupies price points of 50 paisa and Re 1 per unit
against HLL's Max which attacks the unorganized sector with an extremely
aggressive 25 paisa per unit price.
It's the association with quality that works in Nestlé’s favour in most
product categories. That this hasn't really worked in case of Nestlé’s
bottled water brand, Pure Life, is more distribution-related, feel industry
watchers. Pure Life, launched earlier this year at a price point of Rs 12, has
been a lukewarm performer compared to Coca-Cola's Kinley and Pepsi
Aquafina besides, of course, market leader Bisleri. Discounting at the trade
level has been a problem area with bottled water.
According to the A&M Annual survey on India's top 200 ad and marketing
spenders, Nestle was the country's sixth largest advertising spender in
2005-06, recording an ad spend of Rs 128.46 crore which amounts to a
13.6 per cent growth over the previous year.
NESTLE BUSINESS Nestle has a presence in the following categories -
Baby Food, Milk products, Beverages (Coffee, malted beverage), Chocolates &
confectionery and other processed food products. Category wise turnover breakup
and growth
15

7/28/2019 saurabhsrivastava”
http://slidepdf.com/reader/full/saurabhsrivastava 16/80
% contribution
to turnover
2006
Rs mn.
2005
Rs mn. % yoy
Milk Products 43 8159 7375 10.6%
Beverages 29 5627 4903 14.8%
Culinary Products 14 2764 2310 19.7%
Chocolate & Confectionery 14 2646 2179 21.5%
Total 19197 16768 14.5%
Chocolates & Confectionery
Nestle forayed into chocolates & confectionery in 1990 and has cornered a
fourth share of the chocolate market in the country. The category
contributes 14% to Nestle‘s turnover. It has expanded its products range to
all segments of the market The Kitkat brand is the largest selling chocolate
brand in the world. Other brands include Milky Bar, Marbles, Crunch,
Nestle Rich Dark, Bar-One, Munch etc. The sugar confectionery portfolio
consists of Polo, Soothers, Frootos and Milkybar Éclairs. All sugar
confectionery products are sold under the umbrella brand Allen's. Nestle
has also markets some of its imported brands like Quality Street, Lions and
After Eight . New launches such as Nestle Choco Stick and Milky Bar Chooat attractive price points to woo new consumers. Chocolate confectionery
sales registered a strong 21.5% yoy growth in 2001 aided by good volume
growth in Munch, Kitkat and Classic sales.Nestle re-launched Bar-One
during year
Future prospects Nestle is focused on product expansion and
improvement of distribution efficiency. The Dairy business is being
expanded and is expected to drive growth in the long run, although short-
term profitability may be impacted in the investment stage. The company’s
entry into the mineral water segment is a concern, as the segment is
16

7/28/2019 saurabhsrivastava”
http://slidepdf.com/reader/full/saurabhsrivastava 17/80
already overcrowded and the company faces stiff competition especially
from the Cola manufacturers. Acquisition of an established brand could
catapult Nestlé’s position in the segment. In categories like beverages,
culinary products and chocolate confectionery, the company is looking at
driving growth through launch of smaller SKU’s, thus enabling affordability
to a wide section of the population.
Earnings sensitivity factors
♦ Success of new category launches (Milk and Mineral Water) which
involve considerable investment for promotional schemes and ad-
spend and yield returns only after a few years.
♦ Continued exports to Russia, Nestlé’s main market for coffee
exports.
♦ Good monsoon ensures adequate availability of raw materials,
which are mainly agricultural in nature. Raw material prices have
significant influence on margins.
♦ Government policies in terms of licensing, duties, movement of
agricultural commodities etc.
♦ Market growth driven by overall economic growth and urbanization.
♦ Rupee depreciation improves export realizations
Nestle
17

7/28/2019 saurabhsrivastava”
http://slidepdf.com/reader/full/saurabhsrivastava 18/80
THE NESTLE India stock has been bubbling with activity in an otherwise
listless equity market.
Till date, the stock has surged 77 per cent from its low of Rs 304 in May
2005 and now commands a valuation 39 times the expected earnings for
2000. This is steep by FMCG standards.
The recent surge in the stock is partly driven by the announcement by the
parent, Nestle SA, that it would use the creeping acquisition route to mop
up another five per cent in Nestle India through open-market purchases.
But improving the stock's valuation can also be traced to good financial
performance in a market starved of healthy earnings numbers.
On a comeback trail
The resumption of its coffee exports to Russia and a favourable input price
environment pepped up Nestle India's net profit growth to 28 per cent in
the first nine months of 2005. Sales growth in this period was 10.4 per
cent, with domestic sales rising 9.8 per cent and export sales 13.8 per
cent. In reality, the growth in sustainable net profits was higher than
reported as the company took an additional one-time charge of Rs 14.70
crore in the first nine months of 2000 for provisions against contingencies.
Unusually, low input prices may have contributed considerably to margin
expansion. Continuing surpluses in global production have pushed both
coffee and cocoa prices (the two key inputs for Nestle India, apart from
milk) to historic lows in 2005. While coffee prices are hovering close to their
seven-year lows, cocoa prices recently bounced off their lowest levels in
three decades.
With global agencies forecasting high carry-in stocks for the next season,
the soft input price advantage could be with Nestle for the time being. Does
this mean Nestle India will sustain its healthy earnings performance over
the next couple of years? This will depend on its ability to revive sales
growth in its domestic product categories.
18

7/28/2019 saurabhsrivastava”
http://slidepdf.com/reader/full/saurabhsrivastava 19/80
Greener pastures at home?
Nestlé’s 10.4 per cent sales growth in the first nine months of 2005 is partly
magnified by the low base of comparison. The cessation of coffee exports
to Russia due to the economic crisis there, led to a 38 per cent drop inexport sales (and a 5 per cent drop in net sales) for Nestle India in 2002.
Instant coffee exports to Russia resumed this year, but the business
remains poor because realizations have fallen in line with green coffee
prices. Since realizations in the export market are unlikely to look up in the
next year, Nestle will continue to look to its domestic product portfolio to
sustain earnings growth.
In recent times, as with other FMCG companies, Nestle India's top line
growth in the domestic market was unimpressive, at around 8 per cent in
1999 and 9.8 per cent in the first nine months of 2005. In the domestic
market, Nestle India has traditionally derived its revenues from five product
baskets -- coffee (Nescafe Select, Sunrise); milk products (Milkmaid
condensed milk and ready mixes, Coffeemate coffee creamer, Everyday
Dairy Whitener); weaning foods for infants (Cerelac, Nestum, Lactogen);
chocolates/confectionery and malted beverages (Milo, Kitkat, Charge,Munch, Polo); and food products (Maggi noodles, soups). .
Nestle India has also shied away from the mass market for liquid milk in
plastic pouches, and instead restricted itself to ultra heat treated (UHT)
milk in Tetra packs. The product is priced at a substantial premium to the
other local brands.
Investment outlook: Nestlé’s new product forays are into extremely
competitive markets and investments in the new businesses are likely to be
high over the next few years. In this respect, the advantage of soft input
prices, high cash flows available from the stable businesses (such as
weaning cereals and coffee) and the financial might of the parent, Nestle
SA, will stand Nestle India in good stead.
19

7/28/2019 saurabhsrivastava”
http://slidepdf.com/reader/full/saurabhsrivastava 20/80
The royalty to the parent should ensure that Nestle India continues to enjoy
ungrudging access to the parent's product portfolio. In many respects, in
India Nestle is pitted against its key adversaries worldwide -- Group
Danone and Unilever. In the foods business at the global level, both
companies are considerably smaller than Nestle SA.
But marketing prowess, rather than size is likely to determine the success
of Nestle India's new product forays in the next couple of years. Since the
high growth rates of this are partly on account of the low base of last year,
the growth rates are likely to reach more moderate levels next year. The
stock continues to be a good investment option for investors with a three-
year horizon. But since the recent uptrend is partly on account of factors
unrelated to the fundamentals, there could be some downside to the stock
in the near-term.
Sales growth in 2001 led by a robust 20% growth in
volumes
Nestlé’s domestic sales registered a 18.5% volume growth during the first
9 months of 2006. Exports registered a 31% yoy volume growth. In value
terms, domestic sales grew by 15.8% yoy to Rs12.1bn, while Exports grew
by 26.4% yoy to Rs2.4bn.
Pressure on prices
Jan-Sep Jan-Sep % yoy
Average Realizations (Rs/kg) 2006 2005
Domestic 115 117 -2.3
Exports 181 188 -3.7
Segment wise realization decline has been the highest in Beverages. Milk
product and culinary product prices have been more or less maintained at
previous year’s level, while the company has been able to improve
realizations on its chocolate & confectionery portfolio.
20

7/28/2019 saurabhsrivastava”
http://slidepdf.com/reader/full/saurabhsrivastava 21/80
CategoryRealizations (Rs/kg)
% yoy2006 2005
Milk & Nutrition Products 112 113 -1.4
Beverages 202 238 -15.1
Culinary Products 70 69 1.9
Chocolates & Confectionery 152 143 6.8
Beverages leading volume growth, value growth being led by culinary
segment
Beverage sales have grown at a fast pace of 42% in the first 9 months of
2001 driven by rising exports and revised pricing strategy in domestic
market. Growth in value terms is however lower due to a sharp 15%
decline in realizations. Culinary product sales grew by 20% in volumes and
22% in value. Volume growth in chocolate & confectionery segment was
12%, which was higher then market leader and average industry growth,
signifying that the company has been able to improve market share in the
category.
Turnover Contribution
by
Growth
Volume Value Volume Value Realizatio
ns
21

7/28/2019 saurabhsrivastava”
http://slidepdf.com/reader/full/saurabhsrivastava 22/80
Milk & Nutrition Products 47 43 15 13 -1.4
Beverages 18 29 42 21 -15.1
Culinary Products 24 14 20 22 1.9
Chocolates &
Confectionery
11 14 12 20 6.8
Milk products, which account for a significant 43% of Nestlé’s revenues,
have grown at steady 15% in volume terms. Turnover contribution of
beverages is 29%, while culinary products and chocolate & confectionery
each contribute 14% to Nestle Rs14.5bn turnover in the first 9 months of
2006….
Profit Margin
Operating margins have improved from 18.1% to 18.5% in 2006 driven by
lower material cost. Raw material cost declined from 44.4% of sales in
F12/05 to 43.1% of sales in F12/06.
Operating Margins 2006 2005
EBITDA 18.5 18.1
Adjusted EBITDA 18.5 17.7
Improved working capital and asset management The company has
been able to improve working capital management. Operating cash flow
has registered a CAGR of 15% in the last 4 years. Fixed asset turnover
has also gradually improved over the last 3 years. Net indebtedness (total
financial liabilities net of liquid assets) has declined from a high 2.5x in
1998 to 0.3z currently.
2003 2004 2006 2006-Sep
Operating Cash Flow 1743 2391 2420 1966
Rotation of Operating Net Working
Capital7.1 9.6 14.7 18.1
Rotation of Fixed Assets 4.0 3.9 4.2 4.7
22

7/28/2019 saurabhsrivastava”
http://slidepdf.com/reader/full/saurabhsrivastava 23/80
Net Indebtedness 2.5 1.0 0.9 0.3
"India Infoline Ltd (IIL) and India Infoline Securities Ltd (IISL) do not have
any positions in any
DIRECTORS' REPORT (7th March, 2006)
1. Operations:
Domestic Sales grew by 7% in value and 15% in volume terms, during the
year. Export Sales grew by 16% in value and 32% in volume. Profit after
Tax grew by 20% from Rs985mn to Rs1186mn.
The market and economic growth continued to be sluggish during 2005.
Concerted efforts of the management to maintain the price of products (in
some cases even reduction of prices), better working capital management,
continuous improvement of supply chain and a focus on flagship brands,
contributed significantly towards the above profitability. The favourable
impact of the commodity prices during parts of the year and the product
mix, also contributed significantly towards improvement in profitability.
During the year, the Company retired certain fixed assets from active use
at various locations and the impairment loss on such fixed assets has been
charged to the Profit and Loss Account.
Out of business prudence, the Company supplemented the Contingency
Provision with further amount in 2005 of Rs295mn (net) to provide for
various contingencies resulting from matters mainly relating to issues
under litigation, dispute and management discretion.
Your Company's overall sales and profit progression during 2005 can be
considered satisfactory and in line with the expectations.
The current year has commenced as per plan in the domestic market and
your Directors are hopeful of continued good results. However, with the
current level of inflation and economic indicators pointing towards a
sluggish market, it would be difficult for the Company to maintain the level
23

7/28/2019 saurabhsrivastava”
http://slidepdf.com/reader/full/saurabhsrivastava 24/80
of earnings unless the Company takes price increase on finished products
which would depend on market conditions and competitor activities.
2. Exports:Export Sales for the year at Rs2655mn have grown by 32% in
volume terms, over the last year. This has been mainly due to the higher
exports of NESCAFE to Russia, buoyant sales of Instant Tea and good
performance of the culinary products. However, depressed green coffee
prices in domestic and international markets kept the export realizations
low. Measures taken for tapping new market and product opportunities
have also contributed to this growth. The export competitiveness of value
added instant coffee manufactured in India continues to be adversely
affected by the purchase tax levied on green coffee. Efforts continue to tap
new market and product opportunities.
3. Dividends:Interim dividend of Rs. 8.00 per equity share, including
Rs4.50 per equity share out of undistributed profits of the previous financial
years, was paid during 2005.
Your Directors are pleased to recommend to the Annual General Meeting a
final dividend of Rs6.00 per equity share. The dividend, if approved, shall
be payable to the shareholders registered in the books of the Company
and beneficial owners furnished by the Depositories, determined with
reference to the book closure from 16th June, 2006.
4. Business Development:In line with the Company's objective to provide
superior value in every product category and market sector, efforts were
focused to provide quality products to customers at attractive price points.
While the Company continued to generally maintain price points across all
the product categories, the pricing of some products were also reduced to
meet consumer expectations.
MAGGI Noodles re launched in 1999 in response to popular consumer
taste preference, continued to boost sales during 2000 in the culinary
segment. New flavour profiles were introduced in the bouillon business.
24

7/28/2019 saurabhsrivastava”
http://slidepdf.com/reader/full/saurabhsrivastava 25/80
The market continued to react positively to the initiatives taken in the
recent past to grow the consumption of instant coffee in the domestic
market. The new NESCAFE pricing and bringing the popular SUNRISE
brand under NESCAFE umbrella to benefit from its association continued
to strengthen the category. NESCAFE Frappe a blend of coffee, mocha
and vanilla, which makes a delicious frothy cold coffee, was launched inselect metropolitan cities in the third quarter. This was another strategic
launch and seeks to address consumer with preference for cold drinks.
NESCAFE Frappe has received encouraging response.
In the area of Chocolate and Confectionery NESTLE MUNCH Crisp wafer
biscuit with chocolayer, which was launched in select markets in1999, was
rolled out nationally during 2000 and had good growth. Continuing with the
efforts to meet consumer expectation on price points, the pricing of KITKATwas also reduced during the later half of the year. Moulded Chocolates and
Éclairs also showed satisfactory growths. This has also helped in
improving the infrastructure and distribution reach of the Company in the
Chocolate and Confectionery segment.
In the milk and cereal categories, EVERYDAY Dairy Whitener and cereals
had satisfactory growth. NESTLE Growing up Milk; a new product offering
superior nutrition, launched in 1999 was rolled out nationally during theyear.
Your Company has also entered the Chilled Dairy business with the recent
launch of NESTLE Dahi in select cities of the North. The initial response
has been very encouraging and your Company is working on plans to
further leverage the international expertise of Nestle Group, Switzerland in
the area of Chilled Dairy.
The performances of other products were generally in line with
expectations. A few products whose performance was not considered
satisfactory are under constant review for corrective action.
25

7/28/2019 saurabhsrivastava”
http://slidepdf.com/reader/full/saurabhsrivastava 26/80
Your directors are pleased to report the implementation of the two new
projects undertaken by the Company during 2000 packaged milk and
packaged drinking water. Both the projects seek to leverage the worldwide
experience and knowledge of Nestle Group, Switzerland who are the
leaders in these product categories.
In line with its objective of long term growth and entry in significant value
added food segments, the Company forayed into the Ultra Heat Treated
(UHT) liquid milk business in April 2000 by launch in Mumbai. Packaged
UHT milk seeks to address growing consumer concerns on adulteration
and product safety and brings with it reliability, complete hygiene and
safety. It offers convenience to the consumer, in terms of a shelf life
without any deterioration in the product quality and easy usage without
refrigeration or boiling. UHT Milk has received encouraging response andhas been rolled out in select cities of the West, South and North.
The project for bottled water was implemented at the Samalkha factory and
water launched in February, 2001 under the brand NESTLE PURE LIFE
and is available in select cities. NESTLE PURE LIFE contains a balance of
essential minerals and a light pleasant taste and is manufactured under
stringent quality control. The packaging has been specially designed to
maximize safety for the consumer and protect from possible tampering.
The new categories like bottled water and liquid milk are lower margin
categories and will require considerable investments. Your Company sees
them as strategic and as requiring support on a sustained basis.
The two new Sales Branches at Bangalore and Chandigarh set up in 1999
to further strengthen the flexibility of the Sales organization and for
speedier response to the market conditions, have started showing positive
results during the year. With a view to expand distribution and increase
penetration in smaller towns, a concerted drive was undertaken to make
products affordable and accessible to consumers. An initiative taken
includes more penetrative pricing and smaller packs covering brands such
26

7/28/2019 saurabhsrivastava”
http://slidepdf.com/reader/full/saurabhsrivastava 27/80
as EVERYDAY Dairy Whitener, MAGGI Noodles, MILO Chocolate Energy
Drink and NESCAFE Instant Coffee. The response has been encouraging.
The Alternative Trade Channel unit created in 1999 undertook initiatives to
tap the opportunities for out of home consumption, particularly for instant
coffee and chocolate and confectionery and to extend availability of
product to nontraditional outlets. The outcome of these initiatives has been
encouraging and is being consolidated.
Availability of NESCAFE has been enhanced through an expansion of the
vending machine network and new consumption opportunities for
Chocolates and Confectionery were identified and developed in areas like
railway platforms, college canteens and major events.
On the manpower development front, programmes during the year continued to be focused on the operational front more particularly sales
and production.
To support the growth plans and distribution strategy, and simultaneously
improve the operational efficiency, the thrust on strengthening supply chain
continued to receive attention during the year. In addition to consolidating
the improvements made over the last two years, significant progress was
recorded in following areas:
a) Reduction in finished goods inventory pipeline to improve freshness of
stocks and reduce working capital.
b) Control of distribution costs through innovative measures, despite steep
increases in cost of fuel.
c) Sustained improvement in customer service level to improve product
availability across all geographies and channels.
d) Reduction in obsolescence of materials.
5. New Head Office:The Company moved into its new Head Office at
Gurgaon. The new Head Office has been designed to provide the
27

7/28/2019 saurabhsrivastava”
http://slidepdf.com/reader/full/saurabhsrivastava 28/80
employees with work environment that enhances white collar productivity.
The new Office design seeks to stimulate improved internal communication
and enhance transparency in working. State of the art facilities for training,
tasting, and a fully equipped test kitchen, have been made available that
will facilitate the efforts for innovation and renovation.
6. Technology from Nestle:The Company being a part of Nestle Group,
Switzerland benefits from its access to proprietary technology, technical
and non technical expertise and the fruits of the extensive centralized
Research and Development. The diversified knowledge and expertise have
contributed significantly to the operations of your Company over the years.
Some of the key areas, which have benefited are:
a) Manufacture of products of truly international quality. Product quality,
which encompasses taste, appearance, convenience and overall value for
money, is a critical factor in consumer choice and in a competitive market
like India could determine the very survival of the products. The high
quality of products of your Company is borne out by the position and image
the products enjoy in the market and your Company continuing to be a
leading exporter of value added Instant Coffee in the country.
b) Benchmarking of products against competition to achieve an advantage
in product quality, for increasing competitiveness.
c) Access to latest technological developments, such as Spear point
Technology for Cocoa based products implemented during 2000 which
would improve product quality and competitiveness and the MUCH
technology for instant coffee manufacture implemented during 1999, which
would enhance the productivity by increased extraction of coffee solids
from coffee beans.
d) Implementation of project for bottled drinking water.
e) Product innovation and renovation some illustrations are MUNCH Crisp
wafer biscuit with chocolayer; Nestle Dahi; Nestle Milk (UHT); Junior
28
7/28/2019 saurabhsrivastava”
http://slidepdf.com/reader/full/saurabhsrivastava 29/80
Foods; NESCAFE Frappe; KITKAT Milky; new and improved flavours
profiles of bouillons; and re-launch of MAGGI Noodles.
f) Enhancement of skill and competence of Company personnel due to the
training received.
g) Implementation of environmentally sound business practices.
h) Technical expertise in various forms including Information Technology,
which has enabled the business of your Company to grow and sustain.
I) Providing assistance by way of improved technical and quality standards
to local manufacturers, who have contract manufacturing arrangements
with your Company.
7. Moga Milk District:Your Company which started milk collection in Mogain 1961 with a daily collection of 510 kg of milk from 180 farmers has
expanded its operations to an average daily collection of 540,000 kg of milk
with total yearly collection of around 200 million. Kg of milk from nearly
81,000 farmers in its milk district. The Company owns no farms or cattle
but through its Agricultural Services world wide initiative of Nestle Group,
works closely with the farmers to obtain the highest quality raw material.
Recognized as "Partners in Progress", Nestle Agricultural Services at
Moga factory has contributed its mite to the up-liftment of the milk district.
Some significant steps taken by the Company in the recent past are:
a) Installation of farm coolers.
b) Milk Collection Centers provided with new and improved equipment to
enable on the spot testing of quality.
c) Initiation of mechanization of large dairy farms.
d) Farmer development programmes.
The Company has over the past decades been providing facilities and
support to the dairy farmers in areas such as veterinary services, breed
29

7/28/2019 saurabhsrivastava”
http://slidepdf.com/reader/full/saurabhsrivastava 30/80
improvement; balanced cattle feed mixture, feeding for dairy herds, fodder
seeds and training for improved farm management practices.
The milk district is a reflection of your Company's commitment to nurturing
quality, technology and improved systems in the community and the
company's initiatives to improve living in the region.
9. Information Technology:Your Company continued to make significant
investments in the Information Services of Technology area to cope with
the growing information needs necessary to manage operations more
effectively in a complex supply chain environment.
10. Community Health:Recognizing its responsibility to the community in
which it operates, the Company over the years has been taking initiatives
in the area of community health at locations around its factories. Some of the initiates taken in the recent past are:
a) Provide Government and village schools with facilities for toilets and
hygiene drinking water including deep bore wells, where necessary.
b) Support to health officials in Pulse Polio programmes.
C) Sponsorship of treatment of TB patients at clinic runs by NGO.
d) Healthcare Programmes with focus being on well being of employees
and their families covering vaccination, awareness programmes and health
check up.
THE
LEADER
30

7/28/2019 saurabhsrivastava”
http://slidepdf.com/reader/full/saurabhsrivastava 31/80
Cadbury, a subsidiary of Cadbury Schweppes is a dominating player in the
Indian chocolate market with strong brands like Dairy Milk, Five Star, Perk,
etc. Dairy milk is in fact the largest chocolate brand in India. Cadbury India
now stands only second to Cadbury UK in sales of Dairy Milk. The
company is pushing the gifting segment, through occasion linked gifts.
Chocolates contribute to 64%of Cadbury’s turnover. Confectionery sales’,
accounting for 12% of turnover, is contributed largely by Éclairs. The
company attempted expanding its confectionery product portfolio, with
launch of sugar based confectionery Googly and Frutus, without much
success. Cadbury also has a strong brand Bourn vita in the malted health
drink category, which accounts for 24% of turnover.
Chocolate consumption: in India is extremely low. Per
capita consumption is around 160gms in the urban areas, compared to 8-10kg in the developed countries. In rural areas, it is even lower. Chocolates
in India are consumed as indulgence and not as a snack food. A strong
volume growth was witnessed in the early 90's when Cadbury repositioned
31

7/28/2019 saurabhsrivastava”
http://slidepdf.com/reader/full/saurabhsrivastava 32/80
chocolates from children to adult consumption. The biggest opportunity is
likely to stem from increasing the consumer base.
Competition: Cadbury continues to dominate the chocolate market
with about 69% market share. Nestle has emerged as a significant
competitor with about 20% market share. Key competition in the chocolatesegment is from co-operative owned Amul and Campco, besides a host of
unorganized sector players. There exists an even larger unorganized
market in the confectionery segment. Cadbury holds 4% of the market
share in this segment. Leading national players are Nutrine, Parry's,
Ravalgaon, Candico, Parle’s, Joyco India and Perfetti. The MNC’s such as
Joyco and Perfetti have aggressively expanded their presence in the
country in the last few years.
Malted food drinks: Category consists of white drinks and
brown drinks. White drinks account for almost two-thirds of the 82,000 ton
market. South and East are large markets for food drinks, accounting for
the largest proportion of all India sales. Cadbury’s Bourn vita is the leader
in the brown drink (cocoa based) segment. In the white drink segment,
SmithKline’s Horlicks is the leader. Other significant players are Heinz
(Complan), Nestle (Milo), GCMMF (Nutramul ) and other SmithKline brands(Boost, Maltova, Viva). Cadbury holds 14% market share in food drinks
segment.
Performance: Despite tough market conditions & increasedcompetition Cadbury managed to
record a double digit (11%) top
line growth in 2005. The
company achieved a volume
32

7/28/2019 saurabhsrivastava”
http://slidepdf.com/reader/full/saurabhsrivastava 33/80
growth of 5.2%. This was achieved through innovative marketing strategies
and focused advertising campaigns for flagship brand Dairy Milk... Net
profit rose sharply by 41.8% to Rs520mn. Reduced material and energy
costs and tighter control over working capital and capital expenditure
enabled the company to improve profitability. Company added 8mn new
consumers and saw its outlets grow to 4.5 lakhs and consumers to 60mn.
Outlook: The Cadbury management has cut down on its growth target
by setting a 10% average volume growth target for the next three years (as
against previous growth target of 12% volume growth and 20% value
growth). Coupled with inflationary price increases, this could translate into
a top line growth of 14-15%. This target also appears difficult to achieve
given the consumer slowdown and the fact that the company is dependent
on a single category – Chocolates to drive growth. In the malted fooddrinks category the company faces stiff competition from SmithKline
Beecham, and market share has been stagnant at around 14% despite the
company’s efforts and investments in repositioning the brand. Efforts at
expanding confectionery portfolio have also not yielded desired results.
The management has declared its intention to focus only on Éclairs (which
form a major portion of its 4% share in the confectionery segment) for the
time being in this category. In chocolates too, the onus remains on the 2-3
key brands such as CDM, Perk and Éclairs, which have supported growth
in the past.
CADBURY’S AD CAMPAIGN
Kuch meetha ho jaye suggests Cadbury India, its brand
ambassador Amitabh Bachchan smiling down the
hoardings lined along Mumbai's Marine Drive right down
to the company's corporate head office at Mahalakshmi.
While the chocolate major is waiting for Diwali to see a
turnaround in its business after the worms controversy, at
33

7/28/2019 saurabhsrivastava”
http://slidepdf.com/reader/full/saurabhsrivastava 34/80
the moment it's all about driving growth for the category which has seen a
decline since the first quarter of this year.
Being the market leader in chocolates with a 70 per cent share, the
company has attempted to stretch the boundaries within chocolate
confectionery. It has also been adventurous in unleashing a brand new
category within chocolate early this year. Introducing the concept of sweet
snacking, it launched Cadbury Bytes in the south with the positioning
`Snacking ka meetha funda.' The product is a crunchy wafer pillow with a
choco-cream centre and is being rolled out nationally.
Explaining the need to introduce this new category, Bharat Puri, Managing
Director, Cadbury India, says, "While we were sure of our core
competencies, there was need for innovation to deliver double-digit growth.
What we found was that we were under-represented in the area of
snacking on the go and that there was a need for a light crunchy snack."
While entry into salted snacks was ruled out, sweet snacks were the
obvious choice, and Bytes is unique to the chocolate major's Indian
portfolio.
Getting the right product and packaging was a challenge for the company.
It has sub-contracted the product to get the volumes and is poised for a
national launch. Adds Puri, "After all this was the first category anywhere in
the world that Cadbury was entering and we did not have the expertise. So
the best way was to test-market the product and today we find that it has
already bagged five per cent of the chocolate market."
The company has no apprehensions of cannibalization of its chocolate
brands. It believes that while its chocolates are more of indulgence
products, Bytes is about snacking when one is hungry and can be treated
as a snack in between meals.
In the past when Cadbury tried out a biscuit brand, Chocobix, there was
fear about some amount of cannibalization. After all, it was simply a biscuit
34

7/28/2019 saurabhsrivastava”
http://slidepdf.com/reader/full/saurabhsrivastava 35/80
coated in chocolate, and was perceived to be another chocolate brand in
Cadbury's portfolio.
Stresses Puri, "Cadbury Bytes is adjacent to chocolates and in the markets
that we have launched it, there has been no cannibalization. Chocolates
are largely an indulgence product while Bytes is about between-meals
snacking. A product which is consumed when one is feeling hungry or
peckish."
Another thrust area Cadbury has been re-evaluating is confectionery.
While growth rates in this segment are healthier compared to chocolates, it
has always been a difficult market to crack. Cadbury's own experiences
have led it to withdraw certain brands but now with Warner's Lambert's
international kitty under its fold, there are chances of reconsidering the
segment once again.
"Through the acquisition of Warner Lambert, there is a great set of brands
already available to us. We are still examining which are the right brands
for the Indian market," says Puri. Cadbury has already identified Halls as
the strongest brand in Warner Lambert's portfolio and re-launched the
brand early this year. Adds Puri, "Halls was not doing well for a while so we
re-launched it this year. When you have the existing assets, it is necessary
to get them right first. Halls is the first brand that we have revived and it is
now doing well."
In April 2003, Cadbury India's foreign parent acquired Pfizer's interests in
the confectionery business for $4.2 billion. That included the Warner-
Lambert product portfolio, known best for Halls, Clorets and Chiclets. The
acquisition is now poised to become a growth area for Cadbury India,
whose confectionery brands include Éclairs and Googly. But instead of
selling confectionery through its existing chocolate network, Cadbury has
set up an entirely new network.
While Halls has been revived with new packaging, there has been no
change in the status of its other brands. Chiclets had been discontinued
35

7/28/2019 saurabhsrivastava”
http://slidepdf.com/reader/full/saurabhsrivastava 36/80
long before it belonged to Cadbury and Clorets continues to sell with a
small franchise. But now Cadbury is looking closely at Warner Lambert's
gums portfolio (it is one of the world's largest gum manufacturers) and is
considering its viability for the Indian market. Sugarless gum brands such
as Dentyne Ice and Trident White have been known for their functional
benefits worldwide but steep pricing may be a deterrent to their entry intothe country.
"The gum market has not done well in India. But gum has functional
properties and is not merely a breath freshener. We are now evaluating
whether there is a market for them in India and whether it is going to be
worth our while," says Puri.
The confectionery market may be huge in volumes but making money on it
remains a tough task with its low margins. Governed by price points, one
can sell at only at a Re 1 or 50 paisa unit price. "The issue is not of
garnering volumes but making money out of those volumes. The offer
should be one which can get you both top and bottom lines," states Puri.
Having shifted focus from Googly, Cadbury had been tasting success with
its age-old Éclairs which continue to bag almost 50 per cent of the market.
"There is scope in the market. Our Éclairs has been growing and this has
been evident in our past numbers," claims Puri. At the same time the sugar
confectionery market is highly competitive and it's all about finding the right
consumer proposition and a business model that can deliver both top line
and bottom-line growth.
In spite of the new categories being explored by Cadbury, its star brand
remains Cadbury Dairy Milk (CDM) which continues to corner almost 30
per cent of the chocolate market. It is followed by brands such as 5-star,
Perk and Gems. Each of these has been revamped over the years to
generate excitement for the category. For instance, recently Perk was
rejuvenated as a crunchier wafer while CDM came up as a white-and-
brown variant in the market.
36

7/28/2019 saurabhsrivastava”
http://slidepdf.com/reader/full/saurabhsrivastava 37/80
"The chocolates category thrives on excitement. It's all about giving the
consumer a choice and taste which they enjoy," adds Puri. For instance, in
beverages, in spite of its malted food brand Bourn vita, Cadbury decided to
introduce a milk additive brand such as Delite, just to give its consumers
the real taste of chocolate. Delite has added flavours such as strawberry
and mango and is not expected to encroach upon Bourn vita’s shares. According to Puri, "There is still a large section of people who do not add
anything to milk. This will apply to children for whom milk is a problem and
having an additive will make it a pleasurable experience."
Making changes in its distribution network, Cadbury split its sales and
marketing team between its mass (confectionery) and core brands last
year. "Chocolates needed to get retailed at larger and better outlets while
all the products below Rs 3 needed a different distribution network," saysPuri. Today Cadbury's distribution network reaches out to six lakhs outlets
each for its confectionery and chocolate brands.
With the worm’s episode behind it, there are other issues bothering the
company, especially which of the rising input costs of cocoa sugar and
milk. Although Cadbury has been able to maintain prices, it is still grappling
with the upward trend in prices for its basic raw materials. But its challenge
remains that of growing the chocolate market in spite of the odds. Postinga turnover of Rs 729 crore last year, Cadbury is waiting for Diwali to make
a turnaround for both itself and the category which has been through
troubled times.
Getting growth should not be an issue, according to analysts tracking
the company. As Nikhil Vora, Senior Vice-President (Research), SSKI
Securities, observes, "Considering the company was getting growth
before the infestation episode occurred, it should not be a tall order
to get back to those levels. The company should be able to record a
15 per cent compounded rate of growth over the next few years." That
would be a sweet recovery indeed for Cadbury.
Cadbury follows small packs strategy
37

7/28/2019 saurabhsrivastava”
http://slidepdf.com/reader/full/saurabhsrivastava 38/80
Small has indeed proved to be beautiful for Cadbury. The company, after
finding exceptional success in the launch of small packs of Perk chocolate,
has now launched Picnic in small
packs of 26 Gms. priced at Rs
10. The 43-gm packs are still
available and are priced at Rs 15.
Cadbury has embarked on a
strategy which involves increased
consumption of its products
through enhanced reach, affordability and visibility, which it feels can be
attained by creating new markets, widening the depth of its distribution
network and working towards a comprehensive portfolio with brands across
all price segments.
On the distribution front, the company aims to increase the number of its
distribution outlets from the present 4 lakhs to 5 lakhs by the year 2000.
To attain the objectives of affordability, over the past two years Cadbury
has been changing its product portfolio from pure chocolate items to
confectionery which includes caramel, nuts, raisins and wafers. The aim is
to bring down the price line and enter other markets than the purely urban
ones.
In line with this, it launched Googly in early 1997, and followed it up with
products like Mocka and English Toffee.
The strategy of the company has been to launch one major product and
follow it up with smaller products, for instance, the launch of Picnic was
followed by Cadbury Gold and a couple of sugar confectionery launches.
Intense competition from Nestle is one of the reasons Cadbury has
reworked its product range and made efforts to enter the mass product
segment. In 1998, the company moved into smaller sized versions of Diary
Milk and Perk and found to its delight that the introduction of economy
priced models led to more people eating chocolate. In the same year, small
38

7/28/2019 saurabhsrivastava”
http://slidepdf.com/reader/full/saurabhsrivastava 39/80
packs increased chocolate volumes of Cadbury by 19 per cent and market
share to 70 per cent from 69 per cent in the previous year.
Cadbury now has a market share of 70 per cent of the chocolates market.
It manufactures chocolates, sugar confectionery and malted drinks.
Chocolates constitute 71 per cent of the total turnover, malted drinks 22
per cent, and sugar confectionery 7 per cent.
Nestle, with a 20 per cent share in the chocolates market, is expected to
respond with Munch, a chocolate brand meant to counter Picnic.
Cadbury’s Business
Cadbury dominates the Indian chocolate market with a 65% market share.
Besides, it has a 4% market share in the organized sugar confectionery
market and a 15% market share in milk/ malted foods segment.
Changing product mix
Contribution to turnover
1994
Contribution to turnover
2003
39

7/28/2019 saurabhsrivastava”
http://slidepdf.com/reader/full/saurabhsrivastava 40/80
Chocolate 59% 65%
Sugar Confectionery 9% 10%
Food Drinks 32% 24%
Current market shares
Chocolate 69.2%
Sugar Confectionery 4.0%
Food Drinks 14.2%
Expanding distribution reach
2100+ distributors
450000 retail outlets
60mn Consumers
FUTURE STRATEGY
• Maintain dominance in chocolate confectionery and market
leadership in brown drinks.
• New channels such as Gifting, child connectivity and Value for
Money offerings to be the ley growth drivers
• Grow volume sales at 10% pa over the next three years.
• Achieve the goal of best manufacturing location in Cadbury
Schweppes world for Dairy Milk and Éclairs
40

7/28/2019 saurabhsrivastava”
http://slidepdf.com/reader/full/saurabhsrivastava 41/80
• One new major product launch every year
Chocolates and confectionery products (75% of turnover) For more
than five decades now, Cadbury has enjoyed leadership position in the
Indian chocolate market to the extent that 'Cadbury ’ has become a generic
name for chocolate products. Cadbury has leading brands in all the
segments viz bars (Dairy Milk, Crackle, Temptations), count lines (5 star,
Milk Treat ), panned confectionery (Gems) and wafer chocolates (Perk ),
éclairs (Cadburys' Éclairs), toffees (English Toffee).
During 2001, Cadbury’s chocolate sales (65% turnover) registered a 9%
value growth, aided primarily by growth in the flagship brand Dairy Milk .
Dairy Milk contributes an estimated 30% to Cadbury’s sales. Gems and
Five Star were re-launched during the year to stem their de-growth. Perk
registered a de-growth during 2001 despite launch of new variants. New
brand initiatives included the launch of Temptations in the premium
segment and Chocki a low priced chocolate confectionery targeted at
children.
Cadbury entered the hard-boiled sugar confectionery market with the
launch of Googly in 1996. In 1997, the company launched a coffee based
sugar confectionery product Mocka. Cadbury has a 4% market share in the
confectionery segment, largely contributed by Éclairs. Other confectionery
brands such as Gollum, Frutus, Nice Cream, etc launched in the last two
years did not receive a good market response and the company has
decided to minimize focus on those brands. Éclairs was re-launched with
unique packaging in cartons during 2001.
Food drinks (25% of turnover) Cadbury’s Bourn vita is the leading brand
in the brown drinks segment of milk/ malted food products. Overall share in
the malted food drinks market is estimated at 15%. Brown drinks earlier
positioned as taste enhancers were losing market to white drinks during
the last few years. Cadbury re-launched Bourn vita with a new formulation
and advertising campaign positioning it on the health benefit platform to
compete with white drinks. The brand was re-launched in the South – the
41

7/28/2019 saurabhsrivastava”
http://slidepdf.com/reader/full/saurabhsrivastava 42/80
largest food drink market in the country, during 2001. Bourn vita sales
registered a 12% growth in value terms in 2001 to Rs, contributing 24% to
total turnover.
Cadbury’s other products include Cadbury’s Drinking Chocolate and
Cadbury’s Cocoa powder . These account for only 1% of Cadbury’s
turnover.
Distribution Cadbury's distribution network encompasses 2100
distributors and 450,000 retailers. The company has a total consumer base
of over 65mn. Besides use of IT to improve distribution logistics, Cadbury
is also attempting to improve distribution quality. To address the issues of
product stability, it has installed Visi coolers at several outlets. This helps in
maintaining consumption in summer, when sales usually dip due to the fact
that the heat affects product quality and thereby off take.
Strategy ncreasing the consumer base by focusing on the twin proposition
of affordability and availability is being followed to drive future growth.
Small affordable priced packs have been launched, which have helped
improve penetration. Also advertising for chocolates is aimed at changing
consumer perception and eating habits by creating new reasons for
consumption.
Cadbury's Market Segments he marketplace for any product is
comprised of many different segments of consumers, each with different
needs and wants. Market segmentation can be defined in a number of
ways, such as:
• demographic variables (e.g. consumers' age groups, gender, maritalstatus, income etc)
• the lifestyle of consumers (i.e. their interests and activities)
42

7/28/2019 saurabhsrivastava”
http://slidepdf.com/reader/full/saurabhsrivastava 43/80
• The benefits which consumers look for in a product or n the
occasions when the product might be consumed.
Cadbury takes into account all of these factors when producing a range of
products. It targets different segments within the market, such as the:
• break segment - products which are normally consumed as a
snatched break and often with tea or coffee, for example Cadbury's
Timeout and Snack range
• Impulse segment - these products are most often purchased on
impulse, eating there and then. They include products such as
Cadbury's Twirl, Moro, Star bar, Crunchie, Fuse and Dairy milk
• take-home segment - this describes products that are normally
purchased in supermarkets, taken home and consumed at a later stage
Gift segment - boxes of chocolates and other products purchased for gift
occasions
Earnings sensitivity factors
Cocoa bean prices: Domestic as well as international prices of key raw
material - cocoa have significant impact on margins.
Excise duties: Changes in excise levied on malt and chocolate influences
end product prices and thereby volume growth as well as margins.
Changes in custom duties and foreign exchange fluctuations, as 20% of
raw material is imported.
Competition from MNCs like Nestle as well as imported brands.
Increasing competition puts pressure on advertisement budget and
margins. However on the positive side, it helps in expanding the
market.
CADBURYS FAILURES:
43

7/28/2019 saurabhsrivastava”
http://slidepdf.com/reader/full/saurabhsrivastava 44/80
How Cadburys positioning went haywire with `gems`
Gems present an unusual case of how a textbook-perfect, ultra-sharp
positioning can actually become a disadvantage
At 34, Gems is one brand in the
Cadbury’s portfolio that refuses togrow up. Of course, that is not such a
liability now that children play a key
role as consumers.
What it does mean, however, is that Cadbury has to constantly work at
keeping its ageing brand forever young. How has it managed so far? Gems
was a sluggish performer in the late nineties and its market share slid
dramatically. Now, the brand appears to be regaining some of its toddler
energy and a campaign that is scheduled to break in 2003 is expected to
help further.
Gems presents an unusual case of how a textbook-perfect ultra-sharp
positioning can actually become a disadvantage. Of course, Cadbury
doesn’t consider this a problem yet. Cadbury actually consider Gems one
of our power or advantage brands simply because it was specifically
developed for the kids segment. And it has no competition at all in India.
Cadbury’s problem is that Gems — which is technically called a “sugar-
panned” confectionery item that comes in colourful little buttons — has
traditionally been so sharply targeted at children below ten years that it did
not lend itself readily to brand stretch as its target audience grew older.
Even as Cadbury successfully extended its appeal from children to adults
from 1996 onwards for its regular chocolates, the company learnt a bitter
lesson when it tried doing the same with Gems.
Through the seventies and eighties, Gems was one of the few options
available to the Indian consumer, and more specifically the child, in terms
44

7/28/2019 saurabhsrivastava”
http://slidepdf.com/reader/full/saurabhsrivastava 45/80
of chocolate brands, the others being CDM, Cadbury’s Five Star and Amul
chocolates.
The other major advantage that Gems enjoyed probably created problems
for Cadbury’s later — the fact that it never faced competition. Nestle and
Mars never brought their global brands — Smarties and M&M respectively.
This was because, both the international brands are not developed keeping
the climatic rigours of India in mind. So as against Gems, which is a
product formulated specifically for India, the sugar shells of Smarties and
M&M cracked easily in a tropical climate.
The result was that Cadbury’s never had the chance to benchmark its
performance as far as Gems was concerned. Other than ads in storybooks
and comics like Champak, Tinkle and Amar Chitra Katha, there was little
focus on advertising till the late eighties.
The first significant commercial for Gems broke in 1989. This “Gems Bond”
campaign was an animated commercial based on the character of James
Bond, which was used in promotional stickers. However, the campaign was
taken off in the early nineties.
It was actually the storyline and the animation that was working. Thecharacter was not for the child.
The early nineties saw the emergence of pester power. Strangely, Cadbury
did not capitalize on this trend. What made Cadbury sit up was the entry of
brands in the early nineties, like Wrigley’s, Freshmint, Boomer’s, Big
Babool and candies from Perfetti, Candico and Parle Products, all of which
were priced at Re 1 or Rs 2 compared with Rs 5 for a 20 gm pack of
Gems.
So it was no longer just chocolates vying for the child’s attention but chips,
candy, and sugar boiled sweets, bubblegum, all of which were upping their
noise levels. This was worrying for Cadbury’s, as almost half Gems’ sales
came from impulse purchase.
45

7/28/2019 saurabhsrivastava”
http://slidepdf.com/reader/full/saurabhsrivastava 46/80
Meanwhile, international players like Nestle were expected to enter the
scene with brands like Kit-Kat and Milkybar. In 1994, Cadbury re-launched
Dairy Milk with the theme line “The real taste of Life”, positioning it as
chocolate with universal appeal.
Just as Cadbury flanked Perk to target young adults and reworked
Cadbury Dairy Milk’s appeal to include adults, in 1996 it attempted to
extend Gems’ appeal to teenagers. The new campaign was pegged on the
baseline — “Smart, very smart” — derived from Mad magazine. The
trouble was that this campaign was not backed by product changes, so
teenagers, who were always edgy about being associated with a children’s
brand, were unimpressed.
By 1997, the overall slowdown in the fast moving consumer durables
market had affected the chocolate segment. In spite of the re-launch,
Cadbury’s net profit dropped by 5 per cent to Rs 18.6 crore. Perk had not
overtaken Kit-Kat as expected. The only Cadbury brand doing reasonably
well was the low-priced sugar boiled confectionery — Googly — which
went on to become a Rs 15-crore brand in its first year.
Gems had staggered down to a growth rate of 3 to 5 per cent and its
market share slipped to 6 or 7 per cent from 10 to 12 per cent in the earlynineties.
In 1998, the company went back to Gems’ imagery of a children’s brand. A
new campaign was launched to target the urban child. It now included a
whole range of Chocogem characters, who were supposed to symbolize a
child’s partners in fun (Masti ka partner). Also, for the first time, the
communication emphasized the chocolate content.
However, this re-launch did not really contribute to the brand’s revival
simply because the brand still lacked excitement. This was when the
company decided to look at market trends abroad.
46

7/28/2019 saurabhsrivastava”
http://slidepdf.com/reader/full/saurabhsrivastava 47/80
Internationally, brands targeted at younger children sold because they
offered value-ads like toys. Also consumer research revealed that the
chocolate flavour and CDM’s equity was not being utilized fully.
So the company decided to constantly change the packaging and include
add-ons like play value around Gems core proposition. The problem was
that in the Indian market, promotions like toys on smaller stock keeping
units (SKUs) at low cost can be very difficult. So the company had to opt
for innovations on pack sizes and formats first.
In early 2001, the company introduced Re 1 packs, with four buttons, solely
to increase penetration. Later, tube packs priced at Rs 15 with flip tops and
a maze-ball game on the top were also introduced. Then in early 2002,
new cricket ball packs were introduced. This combined play value along
with low costs.
INDUSTRY STRUCTURE AND DYNAMICS
With Cadbury cornering almost 65 % market share and nestle getting
another 24 % industry has all the characteristics of a duple. This industry is
characterized by a near total absence of unorganized sector as compared
to its substitutes like ice creams chips etc. Various internationally famous
brands such as mars Hershey etc are either imported in a very small
47

7/28/2019 saurabhsrivastava”
http://slidepdf.com/reader/full/saurabhsrivastava 48/80
quantity or are smuggled to avoid high import duty. Other chocolates like
Toblerone Twix snickers are being imported through California foods in
India. These help in expanding the premium imported segment of the
chocolate market. As these brands have miniscule volumes and high price
they are not giving any serious competition to Indian brands.
The market has been stable over a long period of time with two major
companies Cadbury and nestle occupying the major share in the market. .
However with the threat of entry of new competitors and also the broad
basing of the market the repositioning of the entire chocolate eating
concept we foresee a lot of action in the market. This is already seen in the
war of perk and Kitkat, which had very nearly taken on the intensity of cola
wars. Nestle has started threatening the long enjoyed lead of Cadbury and
Cadbury is all set to defend its territory.
There have not been many changes in the competitive strategies,
Marketing practices product modification of different brands till 1994. All
major brands have been repositioned once or twice only. But with the
maturing market the new marketing strategy is to target a new breeds of
consumer the consenting adult rather then the indulged child. In keepingwith this market redefinition a lot of brands have been repositioned onto a
new plank the most successful plank being Cadbury diary milk which led to
an increase in 20 % of consumption.
Till now frequency of the new product development was also very low but
after the launch of Kitkat this industry is experiencing a lot of action.
Cadbury came with perk in response to Kitkat in a very share time frame.
Cadbury had also launched relish a brand in count line bar segment therehas not been significant technological development in India in chocolate.
But to create excitement and growth in the category Cadbury has launched
many new products, which led to change in consumer taste and
48

7/28/2019 saurabhsrivastava”
http://slidepdf.com/reader/full/saurabhsrivastava 49/80
preferences. These products are based on strong international R &D
capability of the chocolate majors.
Kit Kat is manufactured in a newly commissioned plant in go and due to
cumulative production volume nestle is not likely to enjoy the benefits of
learning curve. But apart from relative cost advantage Cadbury has
pursued vigorously product differentiation strategy. Apart from
manufacturing products suitable for Indian taste and distribution Cadbury
has established strong brand equity and brand loyalty among Indian
consumers.
Seasonal factors like weather festival etc do affect the demand for
chocolates. In summers due to lack of cold chain at all places chocolate
are not able to bear the heat and humid condition. Thus retailer do not
stock them this shows high bargaining power of the retailers.
Chocolates have emerged as a gift item to be used during traditional Indian
festivals like deepawali and New Year. Companies like Cadbury come with
special gift packs thus demands shoot up during festival season Demand is
also sensitive to economic factors like recession in economy or substantial
increase in price of chocolates. However in the year 1997, chocolate
manufacturers were spending only 80 % of the festival budget ascompared to the previous year. Advertisements spent across corporate
India were pruned in the last festival seasons which led to a fall in demand.
Companies are hopeful of being able to reverse the trend for the current
year.
Entry barriers
• Brand image
• Requirement of specialized machinery
• Lack of raw materials (cocoa) in sufficient quantities
49

7/28/2019 saurabhsrivastava”
http://slidepdf.com/reader/full/saurabhsrivastava 50/80
• Government regulation in the form of excise duties
50

7/28/2019 saurabhsrivastava”
http://slidepdf.com/reader/full/saurabhsrivastava 51/80
RESEARCH METHODOLOGY
For comparative study of chocolate market in India:
A good research work requires a clean scientific methodology
51

7/28/2019 saurabhsrivastava”
http://slidepdf.com/reader/full/saurabhsrivastava 52/80
because only through the application of correct methodology in selection of
sampling techniques, appropriate tools of data collection a well-defined
conclusion can be drawn on the phenomenon under consideration.
PROBLEM DEFINITION
The major objective is comparative study of chocolate market in India
and study the Marketing Share of Chocolate and:
To find out what is the potential market of each brand and mostly
consumers belong to which class like lower, middle and upper class. What
are their preference about each brand and who mostly influence their
buying decision.
To understand the Consumer Buying Behavior of Chocolate
And also to study the Industry Structure and Dynamics
.
Sample Units: Three of the Number One brands in India namely Cadbury,
Nestle and Amul respectively, were chosen on the basis of their market
shares. These three industries were chosen on the basis of the usage of
the products, as the usage of FMCG’s and is high and noticeable
52

7/28/2019 saurabhsrivastava”
http://slidepdf.com/reader/full/saurabhsrivastava 53/80
Sample Design: Non-probability sampling was resorted to and the
methods used is Convenience sampling and Judgment sampling.
Data Collection: Data was collected from Secondary data. Secondary
data was soured from various published sources which include magazines
like Business India and Business World. Newspapers like Brand Equity,
Brand Wagon and The Times of India were also used. Annual Report of
Cadburys and Nestle were also referred
Data Analysis Techniques used are:
Modal Value
Correlation
Simple Average
Percentage
Data was analyzed manually and with the help of computer.
Research Design
The design in such studies is rigid and not flexible and must focus
attention on the following:
1) Formulating the objective of the study.
2) Designing the methods of data collection.
3) Selecting the sample.
4) Collecting the data.
5) Processing and analyzing the data.
6) Reporting the findings.
Data Sources:
53

7/28/2019 saurabhsrivastava”
http://slidepdf.com/reader/full/saurabhsrivastava 54/80
Secondary Data: - several magazines, newspapers, press monitors
and other secondary sources of data were referred. The Manuals in
the organiazation were also consulted.
ANALYTICAL TOOLS USED
The term analysis refers to the computation of certain measures along
with searching for patterns of relationship that exists among data group.
Analysis is essential for a scientific study and for ensuring that we have all
relevant data for making contemplated comparisons. Therefore, I have
used Tabulation, Graphs & Charts in my project.
54

7/28/2019 saurabhsrivastava”
http://slidepdf.com/reader/full/saurabhsrivastava 55/80
Analysis of data:
55

7/28/2019 saurabhsrivastava”
http://slidepdf.com/reader/full/saurabhsrivastava 56/80
Age Group:
5-14 15-19 20-24 25-35
23%
32%
35%
10%
5-14,
23%
15-19,
32%
20-24, 35%
25-35, 10% 5-14
15-1920-24
25-35
Gender :
56

7/28/2019 saurabhsrivastava”
http://slidepdf.com/reader/full/saurabhsrivastava 57/80
Male Female
23% 77%
0%
20%40%
60%
80%
PERCENT
AGE
Male
Female
GENDER
Series1
OCCUPATION:
57

7/28/2019 saurabhsrivastava”
http://slidepdf.com/reader/full/saurabhsrivastava 58/80
Student Employee Businessman Other
22%
27%
18%33%
0
0.05
0.1
0.15
0.2
0.25
0.30.35
Student Businessman
Series1
Series2
Status :
58

7/28/2019 saurabhsrivastava”
http://slidepdf.com/reader/full/saurabhsrivastava 59/80
Lower class Middle class Upper class
28%
17% 37%
Lower
class, 28%
Middle
class, 17%
Upper
class, 37%
Lower class
Middle class
Upper class
1.Do you like to consume chocolate?
59

7/28/2019 saurabhsrivastava”
http://slidepdf.com/reader/full/saurabhsrivastava 60/80
(A)Yes…………………,(B)No……………………
0
20
40
60
80
Yes No
Series1
2.If yes, which brand you prefer?
Yes No
70 30
60

7/28/2019 saurabhsrivastava”
http://slidepdf.com/reader/full/saurabhsrivastava 61/80
(A)Foreign……………,(B)National………………
Foreign,
23%
National,
77%
Foreign
National
Foreign National
23% 77%
61

7/28/2019 saurabhsrivastava”
http://slidepdf.com/reader/full/saurabhsrivastava 62/80
3.If national which one of below?
(A)Amul……….....,(B)Cadbury………….,(C)
Nestle…………
Amul Cadbury Nestle
32% 48% 30%
0%
10%
20%
30%
40%
50%
Amul Cadbury Nestle
Series1
62

7/28/2019 saurabhsrivastava”
http://slidepdf.com/reader/full/saurabhsrivastava 63/80
4.How frequently you consume chocolate?
(A)Daily……….,(B)Weekly…………,
(C)Monthly…………..,(D)Occasionally…………..
Daily Weekly Monthly Occasionally
22% 20% 18% 40%
Daily
Weekly
Monthly
Occasionally
63

7/28/2019 saurabhsrivastava”
http://slidepdf.com/reader/full/saurabhsrivastava 64/80
5.On what basis you select the chocolate brand?
(A)Brand…………,(B)Taste…………,
(C)Price…………..,(D)Quality……………
Brand Taste Price Quality
22% 27% 18% 33%
Brand
Taste
Price
Quality
64

7/28/2019 saurabhsrivastava”
http://slidepdf.com/reader/full/saurabhsrivastava 65/80
6.Which type of chocolate you prefer?
(A)Wafers………….,(B)Milky…………..
0%
20%
40%
60%
80%
Wafers Milky
Series1
Wafers Milky
33% 67%
65

7/28/2019 saurabhsrivastava”
http://slidepdf.com/reader/full/saurabhsrivastava 66/80
7.How do you come to know about particular brand?
(A)TV Advertisement…….,(B)Newspaper……..,
(C)Print media…….,(D)Word of mouth................
TV
Advertisement
Newspaper Print Media Word of
Mouth42% 27% 18% 13%
TV
Advertisement
Newspaper
Print Media
Word of
Mouth
66

7/28/2019 saurabhsrivastava”
http://slidepdf.com/reader/full/saurabhsrivastava 67/80
8.You consume chocolate for the purpose of?
(A)To fulfill a snack need……………
(B)Just for taste………………
(C)Source of energy………………..,
(D)gift for all age……………..
To fulfill a
Snack need
Just for
taste
Source of
energy
Gift for all
ages22% 27% 28% 23%
0
0.05
0.1
0.15
0.2
0.25
0.3
To fulfill
a
Just for Source
of
Gift for all
ages
Series2
Series1
67

7/28/2019 saurabhsrivastava”
http://slidepdf.com/reader/full/saurabhsrivastava 68/80
9.Who mostly influence the selection?
(A)Myself…,(B)Children……..,
(C)Seller……,(D)Friend…………
Myself Children Seller Friend
22% 37% 18% 23%
WHO INFLUENCE
Myself
22%
Children
37%
Seller
18%
Friend
23% Myself
Children
Seller
Friend
68

7/28/2019 saurabhsrivastava”
http://slidepdf.com/reader/full/saurabhsrivastava 69/80
Analysis and Interpretation:
1. The person who mostly consume chocolate is age between 20-
24 at second position children age between 5-14 and after that
teenagers and the percentage of adults is very few which is 10%.
2. The percentage of female in consumption of chocolate is 77%
and of male is 23%.
3. Mostly others like student and housewife purchase the
chocolate and after that employee and at third place student and
businessman has lowest percentage.4. Upper class people who have higher income level have highest
percentage to purchase chocolate and after that6 middle class
and at the last lower class
5. 70% people like to consume chocolate and rest 30% not
because4 of some personal reason.
6. Mostly people like to purchase national brand that is 77% and
rest 23% purchase foreign brand because of status and other
reason.
7. peole mostly like Cadbury because of taste and qualitythat6 is
48% and after that they like Amul that is 32% and Nestle capture
the little market segment that is 30%
8. Mostly people consume chocolate occasionally that is 40% ,daily
22% weekly 20% and monthly 18%.
9. People select the chocolate brand on the basis of taste 27%,on
the basis of quality 33%,on the basis of brand 22% and on theprice is 18% .Thus pople mostly faver the taste
10.Consumer prefers the milky and temptation chocolate like 5Star
and Barone in comparison to wafers like perks and munch.
69

7/28/2019 saurabhsrivastava”
http://slidepdf.com/reader/full/saurabhsrivastava 70/80
11.Mostly consumer come to know about a particular brand through
TV Advertisement after that through newspaper than print media
and at last through word of mouth.
12.Consumer consume chocolate for the purpose of to fulfill the
snack need is 22%,just for food is 27%, like source of energy is28% and for the purpose of gi9ft is 23%
13.Mostly children influence the buyer’s selection that has 37%
,after that friend that is 23%, myself is 22% and seller 18%.
70

7/28/2019 saurabhsrivastava”
http://slidepdf.com/reader/full/saurabhsrivastava 71/80
71

7/28/2019 saurabhsrivastava”
http://slidepdf.com/reader/full/saurabhsrivastava 72/80
FINDINGS• Research and Development :With increasing competition in the industry
R&D may become an important and critical factor for success in newly
emerging segments of the market. Indian players like Amul are not able to
launch chocolates in fast growing count line wafers segment of the market,
as they don’t have appropriate technology. But still moulded chocolates
which constitute 62 % of the market do not require any special R&D.
• Price Price can be used as a basis for competition in the industry. In
1995 perk was launched at a price Rs 4 less than Kitkat was. This brand
was specially produced for Indian markets and successfully competed with
internationally famous Kitkat. But low on price without brand equity may not
really help as Amul and various regional brands are priced lower then
category leaders without having much success.
• International Lineage The international image associated with
chocolates acts as a propeller for the sales considering the significance
of user imagery and aspirational aspect of this product category. The
lead can be attributed to the international lineage despite the higher
price compared to the price of perk However this has to be taken into
consonance with the price factor considering that the Indian consumer
is price sensitive.
• Product Quality Product quality per se may not be critical success
factor. But many instances prove that poor product supported with high
decibel advertising is; likely to be a failure Cadbury has constantly
improved the product quality along with rest of the marketing mix as a tool
to create growth in the category.
72

7/28/2019 saurabhsrivastava”
http://slidepdf.com/reader/full/saurabhsrivastava 73/80
• Distribution Chocolate being an impulse purchase wide and
heterogeneous distribution channels are important so that the
consumers have it within arms length of desire. In India distribution of
chocolates gain special significance due to very hot weather condition
during summer months
73

7/28/2019 saurabhsrivastava”
http://slidepdf.com/reader/full/saurabhsrivastava 74/80
SUGGESTIONS
Looking at the Future
The consumption of chocolates in India is among the lowest in the world. A
comparison with the world wide industry average is an eye opener. In India
the average per capita consumption is a mere 20 gm compared to the
world average per capita consumption of 2.24kg. Moreover data on world
wide chocolate consumption indicates that – in the mature markets this
figure is as high as 9.36kg, while even the emerging markets total up to
1.16 kg. While looking at the consolidated averages –would be misleading,
even the consumption among the potential consumers of chocolates is
extremely low as compared to the world average.
Potential Chocolate Consumers
Income
Groups
(Rs`000 p.a.)
Age Groups
Total5-14 15-19 20-24 25-34
Rural
(Millions)
62-86 2.2 0.8 0.7 1.2 4.9>86 13.5 4.8 4.3 7 29.6
Total 15.7 5.6 5 8.2 34.562-86 7.0 2.5 2.2 3.7 15.4>86 18.8 4.9 4.4 7.2 30.2Total 20.8 7.4 6.6 10.8 45.7
Total 36.5 13.0 11.7 19.0 80.2
Using the figures as mentioned in the table above one can arrive at a
rough estimate of the potential consumers of chocolate in the country. For
this purpose the populations in the age groups of 5 yrs to 35 yrs falling in
the income groups having an annual household income of Rs 62000and
above have been reconsidered. The total population in this group is about
80 million split into 45 million urban consumers and 35 million rural
consumers.
74

7/28/2019 saurabhsrivastava”
http://slidepdf.com/reader/full/saurabhsrivastava 75/80
As the consumption of chocolates is skewed towards the urban
consumers, it can be estimated that 80 % of the chocolate consumed is in
urban areas. Using these figures the per capita consumption for the
relevant target population is as given in the table below
Chocolate Consumption
Share of
market
Tonnag
e
Relevant target
population
(millions)
Gms. per
consumer
Urban
Sales
80 % 12800 45.7 280
Rural
Sales
20 % 3200 34.5 40
Total 100 % 16000 80.2 200
As eating habits of large parts of Indian society are becoming consistent with the
rest of the world; the category is poised for a significant growth. The wafer wars
between Perk and Kit Kat is an interesting indication of the times to come and it
has reached almost the same intensity as the cola wars!! As these new players
and existing companies introduce new type of chocolates, distinction between
chocolates, biscuits, ice-cream will become less and many hybrids product will
grow. Along with this the potential to expand the consumer base by incorporating
a wider array of taste and needs of the consumers. Segmentation of market
based on consumer age is increasingly becoming irrelevant. There are expected
to be many products target at specific new segments. This is very obvious with
the emerging segmentation policy of using the ego states. A shift in media
strategy of various companies can also be estimated. Instead of present use of
mass media, specialized media targeted at different segment will catch the fancy
of media planners. At the same time one can see an increasing association
between the brands and various highly published events in order to increase the
brand equity in the minds of all the stake holders .Further there will be lot of
improvement in packaging and modification of products as per Indian
conditions.
75

7/28/2019 saurabhsrivastava”
http://slidepdf.com/reader/full/saurabhsrivastava 76/80
CONCLUSION
The objective of the study was to study the Marketing Segmentation of
Amul, Nestle, and Cadbury, Consumer Buying Behavior of Chocolate
Industry and also to study the Industry Structure and Dynamics.
a. Advertising plays an important role in creating brand awareness, brand
recall and brand recognition which are important in helping a customer
make purchase decision of that brand.
b. Brand should adopt itself to the local culture.
c. Brand should be kept alive.
d. The styles and code to the brand should change as clientele advance
and grow.
e. Brand should continuously evolve with the culture and the product
should innovate.
Thus, we can say that companies which want to make their brands No. 1
should adopt the above findings in their brand building exercise. However
for generalization of the results, a study needs to be undertaken based on
a larger sample across different industries.
76

7/28/2019 saurabhsrivastava”
http://slidepdf.com/reader/full/saurabhsrivastava 77/80
LIMITATIONS
• Due to shortage of time , it was not possible for me to
pass more time on collecting & analyzing the data.
• Limitation of non responsiveness of customers..
• Company do not provide all real & complete
information so all data is considered as accurate.
77
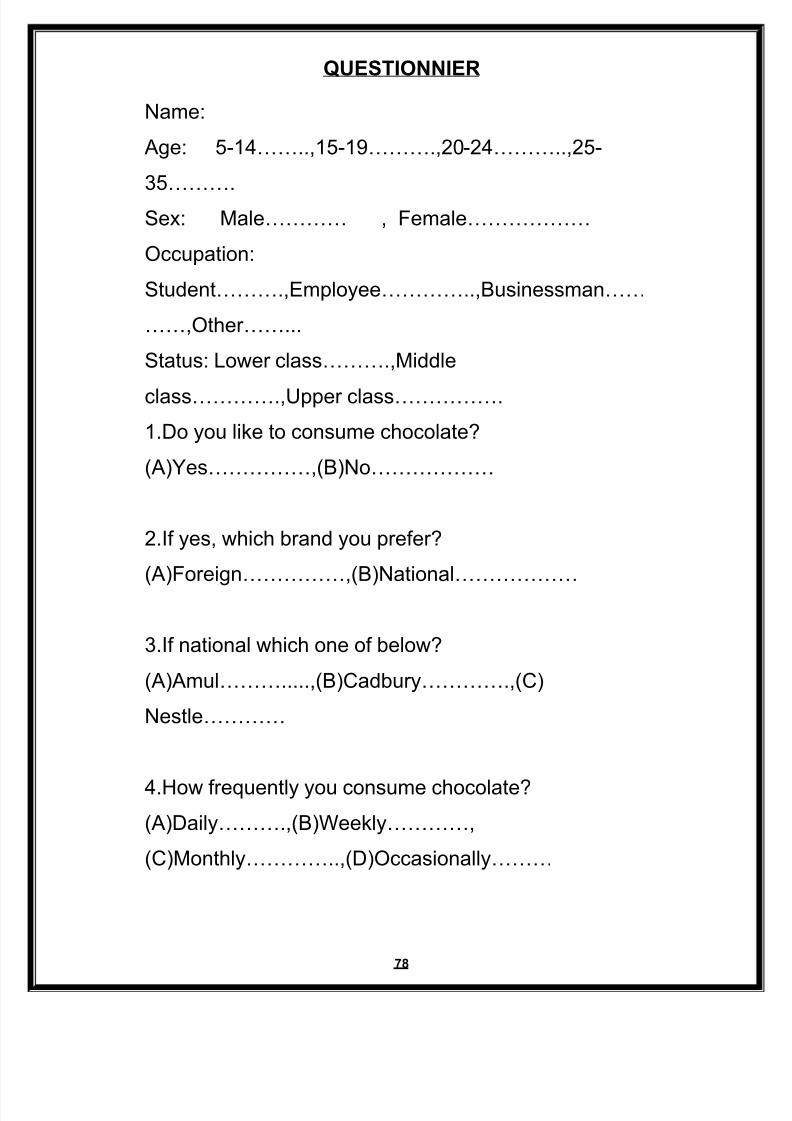
7/28/2019 saurabhsrivastava”
http://slidepdf.com/reader/full/saurabhsrivastava 78/80
QUESTIONNIER
Name:
Age: 5-14……..,15-19……….,20-24………..,25-
35……….
Sex: Male………… , Female………………
Occupation:
Student……….,Employee…………..,Businessman……
……,Other……...
Status: Lower class……….,Middle
class………….,Upper class…………….1.Do you like to consume chocolate?
(A)Yes……………,(B)No………………
2.If yes, which brand you prefer?
(A)Foreign……………,(B)National………………
3.If national which one of below?
(A)Amul……….....,(B)Cadbury………….,(C)
Nestle…………
4.How frequently you consume chocolate?(A)Daily……….,(B)Weekly…………,
(C)Monthly…………..,(D)Occasionally………
78

7/28/2019 saurabhsrivastava”
http://slidepdf.com/reader/full/saurabhsrivastava 79/80
5.On what basis you select the chocolate brand?
(A)Brand…………,(B)Taste…………,
(C)Price…………..,(D)Quality……………
6. Which type of chocolate you prefer?
(A)Wafers………….,(B)Milky…………..
7.How do you come to know about particular brand?
(A)TV Advertisement…….,(B)Newspaper……..,
(C)Print media…….,(D)Word of mouth................
8.You consume chocolate for the purpose of?
(A)To fulfill a snack need……………,(B)Just for
taste………………
(C)Source of energy………………..,(D)gift for all
age……………..
9. Who mostly influence the selection?
(A)Myself………,(B)Yourself…………..,
(C)Seller……….,(D)Friend…………
79

7/28/2019 saurabhsrivastava”
http://slidepdf.com/reader/full/saurabhsrivastava 80/80
BIBLIOGRAPHY
• www.cadbury.co.in
• www.business-standard.com
• www.financialexpress.com
• www.economictimes.com
•
www.hinduonline.com
• www.indiaserver.com
• www.indiainformer.com
• www.india-today.com