these are the tenets we believe in - gul ahmed...
TRANSCRIPT


These are the tenets we believe in& our beliefs are what make all the difference
because our beliefs are what make us
GUL AHMED
02

03


07


We believe in customerservice
We believe in excellence
20

We believe in progress
We believe in technology
21

We believe in distinction
We believe in beingenvironmentally friendly
22

We believe in celebratingour nation
We believe all mothersshould be celebrated
23

We believe inenabling women
We believe in bringingchange
24

We believe in empoweringwomen
We believe in health& education
25

26

Objectives
Strategies
Tactics
27

ETHICAL DECISION MAKING
COMPLIANCE WITH LAWS, POLICIES AND PROCEDURES
INTEGRITY AND RESPECT FOR OTHERS
CONFIDENTIALITY
AVOIDING CONFLICT OF INTEREST
28

INSIDER TRADING
COMPANY RECORDS AND INTERNAL CONTROLS
DEALING WITH VARIOUS STAKEHOLDERS
1. Customers
29
2. Employees
3. Suppliers of Goods and Services
4. Communities
5. Competitors
6. Governments and Regulators
30
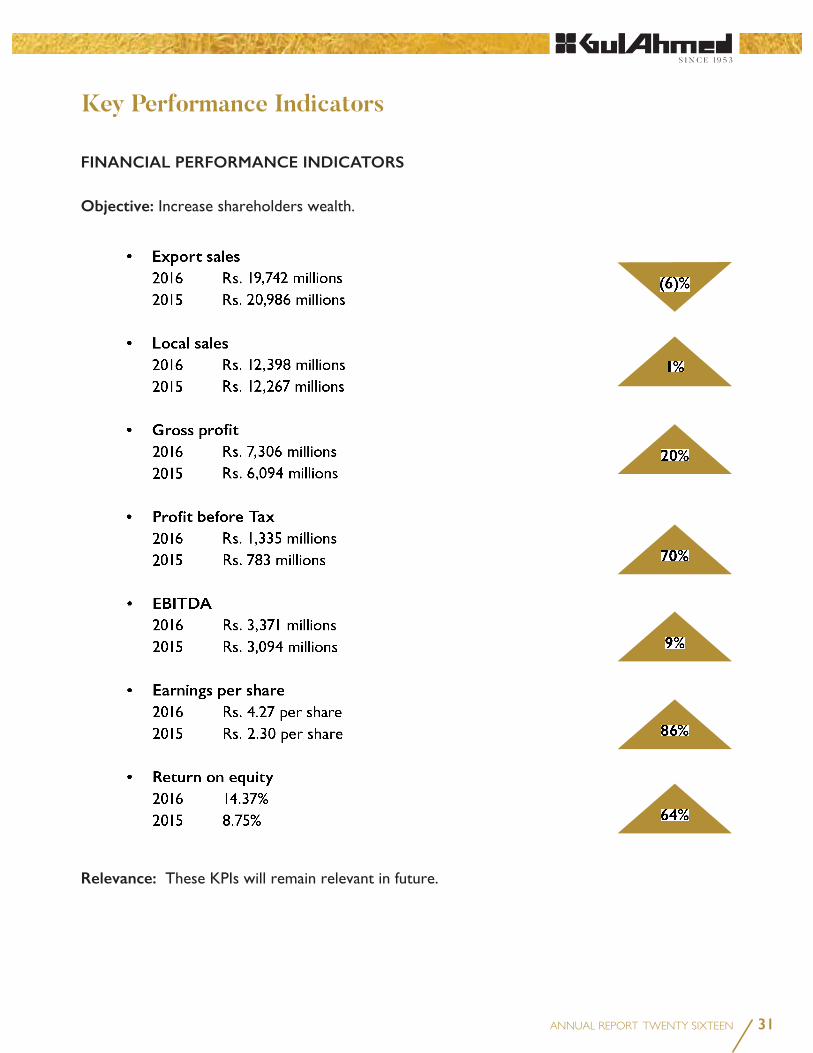
FINANCIAL PERFORMANCE INDICATORS
Objective:
Relevance:
31

I. Internal Efficiency and Effectiveness
Objective:
Objective:
Relevance:
II. Long-Term Development and Innovation
Objective:
Relevance:
Non-financial Performance Indicators
32

Group Structure
Association
Mills Limited
100%
(Pvt.) Ltd.
67.10%
100%
GTM (Europe) Ltd. UK
100%
GTM USA Corp. USA
33

PRODUCT STEWARDSHIP
PRODUCT PORTFOLIO
product varieties.
Yarn
Fabric
Made-ups
34

35
Consular positions include;
36

37

AUDIT COMMITTEE
1. Composition
2. Terms of Reference
38

HUMAN RESOURCE AND REMUNERATION COMMITTEE
3. Composition
4. Terms of Reference
39

40
ECONOMIC AND INDUSTRIAL OVERVIEW
PERFORMANCE OVERVIEW
Financial position analysis

41
Rs. in millions
Gross profit 303 242 25%
CAPITAL STRUCTURE
FUNDS MANAGEMENT
Spinning
Weaving
Rs. in millions
Gross profit 219 480 -21%

42
MATERIALITY APPROACH
RISK MANAGEMENT AND OPPORTUNITIES
Policies and procedures:
Information and monitoring system:
Internal audit:
HUMAN RESOURCE (HR)
INFORMATION TECHNOLOGY (IT)
IT Governance Policy
Gross profit 6,784 5,373 26.27%
Rs. in millions

43
SAFETY OF RECORDS
HOLDING COMPANY
CODE OF CORPORATE GOVERNANCE (CCG)

44
CONFLICT OF INTERESTS
REVIEW OF RELATED PARTY TRANSACTIONS
ROLE OF CHAIRMAN AND CEO
ISSUES RAISED IN LAST ANNUAL GENERAL MEETING (AGM)

45
AUDITORS
CONSOLIDATED FINANCIAL STATEMENTS
FORWARD LOOKING STATEMENT
FUTURE OUTLOOK
ACKNOWLEDGEMENT

46

47

48
52

49
71
6970
27

50

51

52
Education
Tournament
Special Persons
Conservation of Resources
Combined Cycle Gas Turbine
Pollution Prevention and Control

53
INTERNAL AUDIT

54
EXTERNAL AUDITORS
55
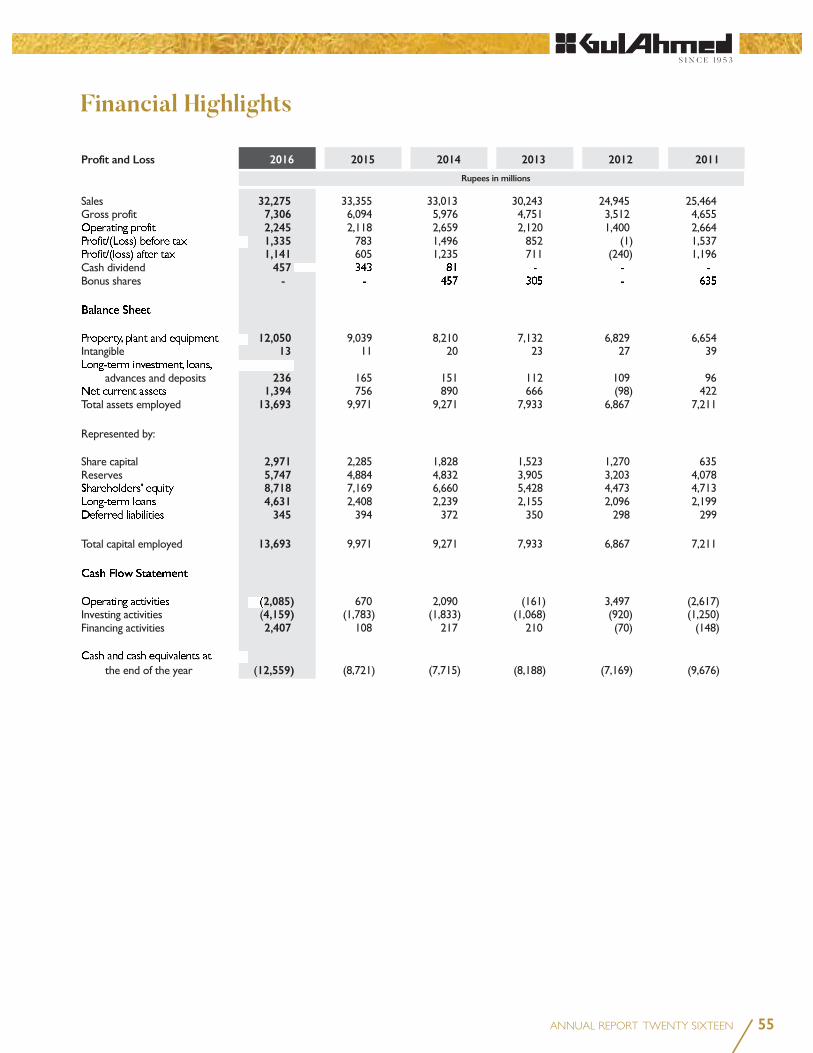
Profit and Loss 2016 2015 2014 2013 2012 2011
32,275 7,306
2,245 1,335 1,141
457 -
12,050
13
236 1,394
13,693
2,971 5,747
8,718 4,631
345
13,693
2,085)
4,159) 2,407
12,559)
Rupees in millions

56
22.64 (1.86) 10.43 3.54
14.37 18.97
1.08
0.26 0.02 (0.06)
Capital structure ratios
2.06 0.04
0.53 2.47
Turnover ratios 184 1.99
24 15.09
120 3.38 2.68 1.00
88
4.27 8.47 1.24
29.35
36.19 53.20 32.99
3,371
Profitabiltiy ratios 2016 2015 2014 2013 2012 2011

57
2011 2012 2013 2014 2015 2016
Turnover ratios
2011 2012 2013 2014 2015 2016
2011 2012 2013 2014 2015 2016
Capital structure ratios
2011 2012 2013 2014 2015 2016
Investor ratios
Profitability ratios
2011 2012 2013 2014 2015 2016
2011 2012 2013 2014 2015 2016

58
2011 2012 2013 2014 2015 2016
Assets 2015
Assets 2016
2011 2012 2013 2014 2015 2016
2011 2012 2013 2014 2015 2016
2011 2012 2013 2014 2015 2016
2011 2012 2013 2014 2015 2016
Gross profit
2011 2012 2013 2014 2015 2016
59

60
61
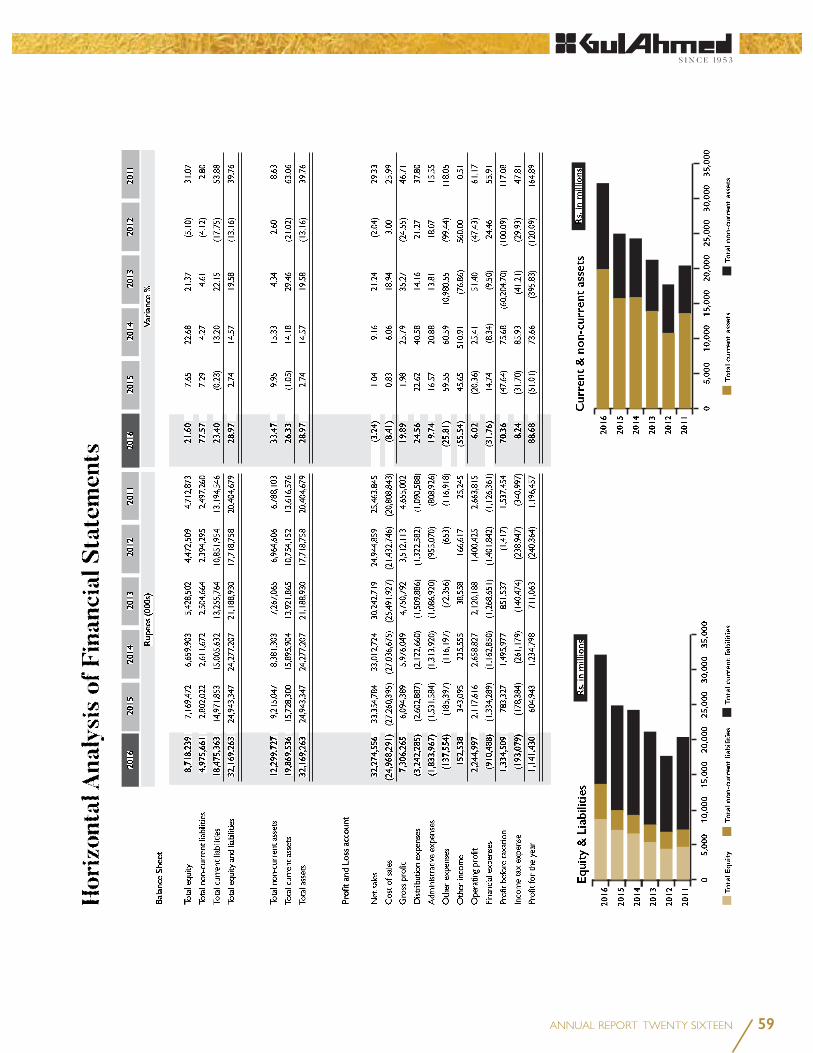
Non-current Liabilities
Current Liabilities
ASSETS
Non-current Assets
Current Assets
PROFIT AND LOSS
Sales and Cost of Sales
Gross Profit
Operating Profit
CASH FLOWS

62
RATIO ANALYSIS
Profitability Ratios
Turnover Ratios
Capital Structure Ratios

63
Dupont Analysis 2016 2015 2014 2013 2012 2011
14.37 1.00
4.05 3.54%
0.59 0.86
6.96
AssetTurnover
1.34
ROE8.75%
Leverage3.61
Margin 6.35%
Interest
0.370.77
ProfitMargin1.81%
AssetTurnover
1.00
ROE14.37%
Leverage4.05
Margin 6.96%
Interest
0.590.86
ProfitMargin3.54%

64
2016 2015 Rupees (000s) % Rupees (000s) %
Value addition
32,750,413 99.54
152,538 0.46
32,902,951 100.00
Value distribution
19,530,837 59.36
3,587,638 10.90
6,513,630 19.80
1,220,782 3.71
895,881 2.72
799,831 2.43
12,753 0.04
341,599 1.04
32,902,951 100.00
1.54%0.24%
65.46%
0.04%3.84%
3.74%
8.64%
16.50%
1.04%
59.36%
0.04%2.43%
2.72%3.71%
19.80%
10.90%

65
2016 2015
Rupees in millionsRupees in millionsRupees in millionsRupees in millionsRupees in millions
5,941 7,815 8,508 10,010 32,275
1,252 1,946 2,159 1,949 7,306
475 964 1,054 878 3,371
(91) 514 496 223 1,142
Total
(0.40) 2.25 2.17 0.25 4.27
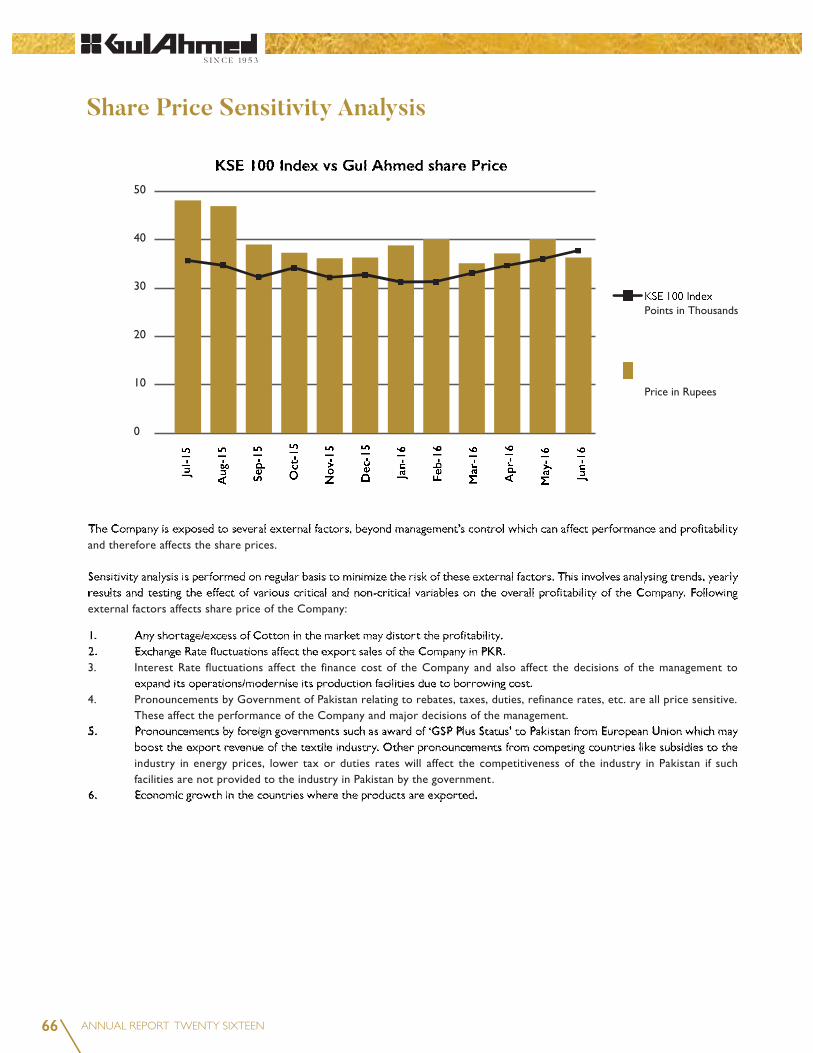
66

67
STAKEHOLDER ENGAGEMENT
Employees
Customers
Suppliers and Partners
General Public and Local Community

68
INVESTOR RELATIONS
Annual General Meeting
Financial Reporting
Media
Website

69
THREATS
STRENGTHS
OPPORTUNITIES
WEAKNESSES

70
Political Factors
Economic Factors
T
Environmental Factors
Legal Factors
Social Factors

71

Succession Planning
Employee benefits
Training and Development
Managing employee grievances
Employee Privacy
Harassment Policy
Diversity
72

73

74
Guiding Principles
Procedure – Raising Protected Disclosure
Handling Protected Disclosures

75
Annual General Meeting
Period
Period Financial Results Dividend Payment (if any)
Announcement of Financial Results
Web Reference
Investor Relation Contact

76
“Resolved
“Resolved
Option 1
77
Option 2
ITEM (4) OF THE AGENDA
ITEM (5) OF THE AGENDA

78
NOTES :

79

80

(
(
81

82

83

84
Independent Directors

85

86

87

Rupees (000s)
20152016
Note
EQUITY AND LIABILITIES
SHARE CAPITAL AND RESERVES
2,970,796
5,747,443
8,718,239 7
NON-CURRENT LIABILITIES
4,630,604 2
309,308 3
35,749
345,057 3
4,975,661 2
CURRENT LIABILITIES
5,007,102 5
114,368 2
12,866,493 8
487,400 7
18,475,363 1
CONTINGENCIES AND COMMITMENTS
32,169,263
MOHOMED BASHIR
88

ASSETS
NON-CURRENT ASSETS
12,050,465
13,474
58,450
21,820
155,518
2,299,727
CURRENT ASSETS
903,447
3,854,292
,364,302
715,875
18,928
75,709
911,957
17,249
07,777
9,869,536
2,169,263
Rupees (000s)
20152016
Note
MOHAMMED ZAKI BASHIR
89

Rupees (000s)
20152016
Note
32,274,556
24,968,291
7,306,265
,242,285
,833,967
37,554
,213,806
,092,459
52,538
,244,997
10,488
,334,509
93,079
,141,430
.27
90
MOHOMED BASHIR
MOHAMMED ZAKI BASHIR

Profit after taxation 1,141,430
Other comprehensive income
Items that will not be reclassified to profit and loss
account subsequently
8,376
952)
,424
Total comprehensive income ,148,854
Rupees (000s)
20152016
Note
91
MOHOMED BASHIR
MOHAMMED ZAKI BASHIR

Rupees (000s)
20152016
CASH FLOWS FROM OPERATING ACTIVITIES
1,334,509
1,120,417
,189
4,342
10,488
4,645
4,825
1,014
-
-
10,917)
8,843
,128,846
,463,355
219,030)
2,570,474)
485,255)
361,751)
122,130)
144,310)
6,812
3,886,138)
205,509)
4,091,647)
628,292)
34,168)
1,002,601)
349,154)
8,961)
61,946)
1,456,830)
2,085,122)
Note
92

Rupees (000s)
20152016
Note
CASH FLOWS FROM INVESTING ACTIVITIES
(4,210,709)
(7,182)
8,655
-
-
-
4,159,236)
6,244,359)
CASH FLOWS FROM FINANCING ACTIVITIES
,681,678
685,414)
,199,744
789,492)
,406,516
3,837,843)
8,720,873)
12,558,716)
93
MOHOMED BASHIR
MOHAMMED ZAKI BASHIR

MOHOMED BASHIR
MOHAMMED ZAKI BASHIR
Balance as at June 30, 2014 Transactions with owners Total comprehensive income for the year ended June 30, 2015 Balance as at June 30, 2015 Transactions with owners Total comprehensive income for the year ended June 30, 2016 Balance as at June 30, 2016 2,970,796 514,176 ,480,000 753,267 5,747,443 8,718,239
94
Rupees (000s)
1 LEGAL STATUS AND ITS OPERATIONS
2 BASIS OF PREPERATION 2.1 Basis of measurement
2.2 Statement of compliance
2.3 Functional and presentation currency
2.4 Critical accounting estimates and judgments
a) Defined benefit plan
b) Contingencies
c) Useful lives, pattern of economic benefits and impairments
95
d) Intangibles
e) Impairment of investment in subsidiary company
f) Provision for obsolescence and slow moving spare parts and loose tools
g) Stock-in-trade
h) Provision against trade debts, advances and other receivables
i) Taxation
2.5 Adoption of new and revised standards and interpretations
(a) New and amended Standards and Interpretations became effective:
IFRS 10 ‘Consolidated Financial Statements’
IFRS 11 ‘Joint Arrangements’
96
IFRS 12 ‘Disclosure of Interest in Other Entities’
IFRS 13 ‘Fair Value Measurement’
(b) Standards, Interpretations and Amendments not yet effective
IAS 12 'Income Taxes' (Effective for annual periods beginning on or after January 01, 2017)
IAS 7 'Statement of Cash Flows' (Effective for annual periods beginning on or after January 01, 2017)
Amendments to IAS 16 ‘Property, Plant and Equipment’ and IAS 38 ‘Intangible Assets’ (Effective for
annual periods beginning on or after January 01, 2016)
97

Amendments to IAS 16 ‘Property, Plant and Equipment’ and IAS 41 ‘Agriculture’ - Bearer Plants
(Effective for annual periods beginning on or after January 01, 2016)
IAS 27 (Revised 2011) – ‘Separate Financial Statements’ (Effective from accounting period beginning on
or after January 01, 2016)
IAS 28 (Revised 2011) – ‘Investments in Associates and Joint Ventures’ (Effective from accounting period beginning on or after January 01, 2016)
IFRS 2 ‘Share-based Payment’ (Effective from accounting period beginning on or after January 01, 2016)
IFRS 9 ‘Financial Instruments’ (Effective from accounting period beginning on or after February 01, 2015)
98

IFRS 14 ‘Regulatory Deferral Accounts’ (Effective from accounting period beginning on or after January 01, 2016)
IFRS 15 ‘Revenue from Contracts with Customer’ (Effective from accounting period beginning on or after January 01, 2018)
IFRS 16 ‘Leases’ (Effective from accounting period beginning on or after January 01, 2019)
(c) Amendments to standards as a result of annual improvements to IFRSs 2012–2014 cycle that are not yet effective:
IFRS 5 ‘Non-current Assets Held for Sale and Discontinued Operations’ - Changes in methods of disposal (Effective from accounting period beginning on or after January 01, 2016)
IFRS 7 ‘Financial Instruments: Disclosures’ (Effective from accounting period beginning on or after January 01, 2016)
IAS 19 ‘Employee Benefits’ - Discount rate regional market issue (Effective from accounting period beginning on or after January 01, 2016)
99

IAS 34 ‘Interim Financial Reporting’ - Disclosure of information 'elsewhere in the interim financial report' (Effective from accounting period beginning on or after January 01, 2016)
New Standards issued by IASB but not yet been notified by SECP
International Financial Reporting Standards (IFRSs) IASB effective date annual periods beginning on or after
3 SIGNIFICANT ACCOUNTING POLICIES
3.1 Foreign currency transactions and translation
3.2 Staff retirement benefits
Defined benefit plan
Defined contribution plan
100

3.3 Accumulated employee compensated absences
3.4 Provisions and contingencies
3.5 Taxation
Current
Deferred
3.6 Borrowings
3.7 Borrowing cost
3.8 Trade and other payables
3.9 Property, plant and equipment Operating fixed assets
101

Capital work-in-progress
3.10 Intangible assets
3.11 Investments
a) Investment at fair value through profit and loss
b) Investment in subsidiary
3.12 Loans and receivables
3.13 Stores, spare parts and loose tools
Capital work-in-progress
3.10 Intangible assets
3.11 Investments
a) Investment at fair value through profit and loss
b) Investment in subsidiary
3.12 Loans and receivables
3.13 Stores, spare parts and loose tools
102

3.14 Stock-in-trade
3.15 Trade debts
3.16 Revenue recognition
3.17 Financial Instruments
3.18 Derecognition of Financial Instruments
3.19 Impairment Financial assets
3.14 Stock-in-trade
3.15 Trade debts
3.16 Revenue recognition
3.17 Financial Instruments
3.18 Derecognition of Financial Instruments
3.19 Impairment Financial assets
103

Non-Financial assets
3.20 Derivative financial instruments
3.21 Offsetting of financial assets and liabilities
3.22 Cash and cash equivalents
3.23 Dividend and appropriation to reserves
3.24 Segment reporting
104
2015
2015
2015
2015
Number of SharesNumber of Shares
2016
20162016
Number of Shares
2016Note
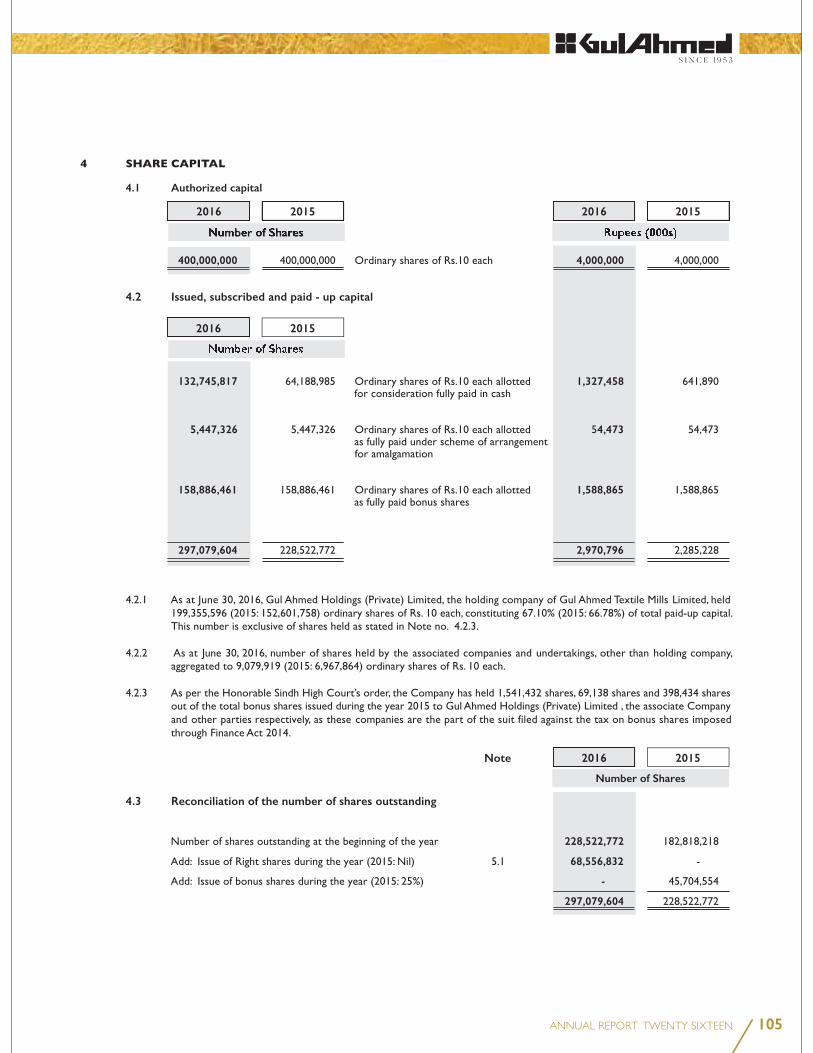
4.1 Authorized capital
400,000,000 4,000,000
4.2 Issued, subscribed and paid - up capital
132,745,817 1,327,458 5,447,326 4,473
158,886,461 1,588,865
297,079,604 2,970,796
4.3 Reconciliation of the number of shares outstanding
228,522,772
68,556,832
-
297,079,604
Number of Shares
105
Rupees (000s)
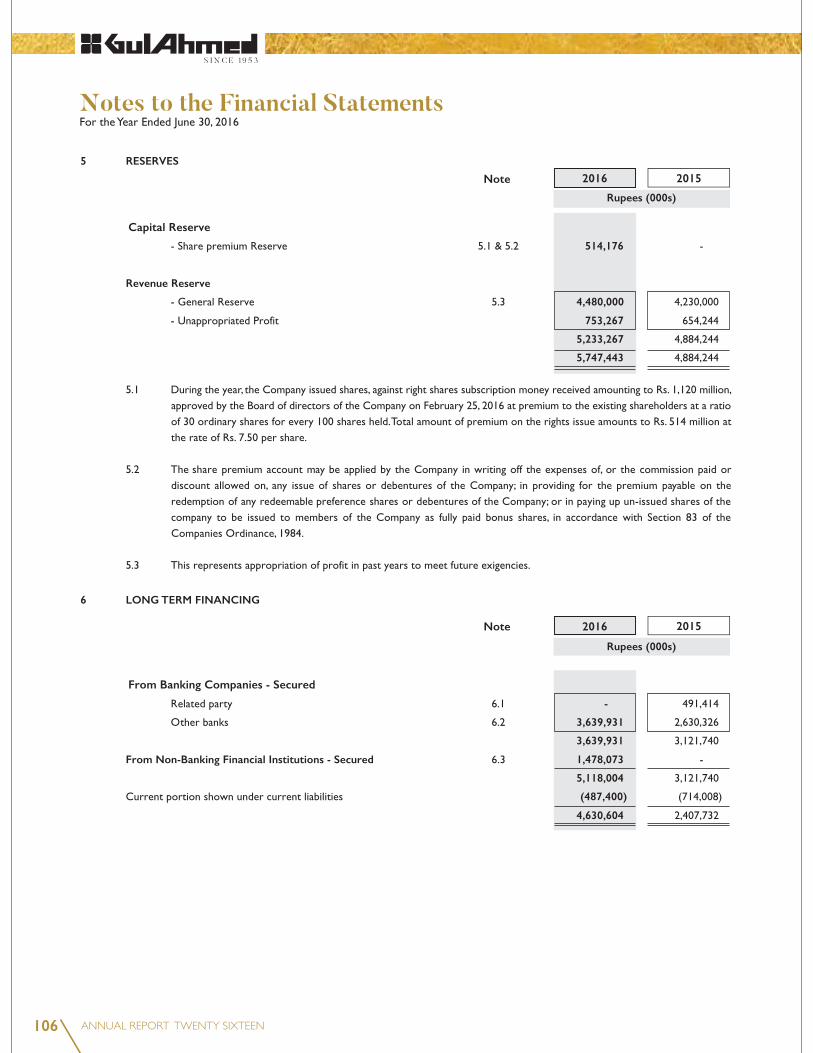
201520165 RESERVES
Capital Reserve
514,176
Revenue Reserve
4,480,000
753,267
5,233,267
5,747,443
6 LONG TERM FINANCING
From Banking Companies - Secured
-
3,639,931
3,639,931
From Non-Banking Financial Institutions - Secured 1,478,073
5,118,004
(487,400)
4,630,604
106
Note
Rupees (000s)
2016 2015Note

20152016
Rupees (000s)Particulars
Installmentamount
Rs. (000s)
Number ofinstallments andcommencement
month
Mark-up rateper annum
6.1 Related party - Bank
-
-
-
-
-
-
-
-
-
-
-
-
-
-
-
-
-
Total from related party -
107

20152016
Rupees (000s)Particulars
Installmentamount
Rs. (000s)
Number ofinstallments andcommencement
month
Note Mark-up rateper annum
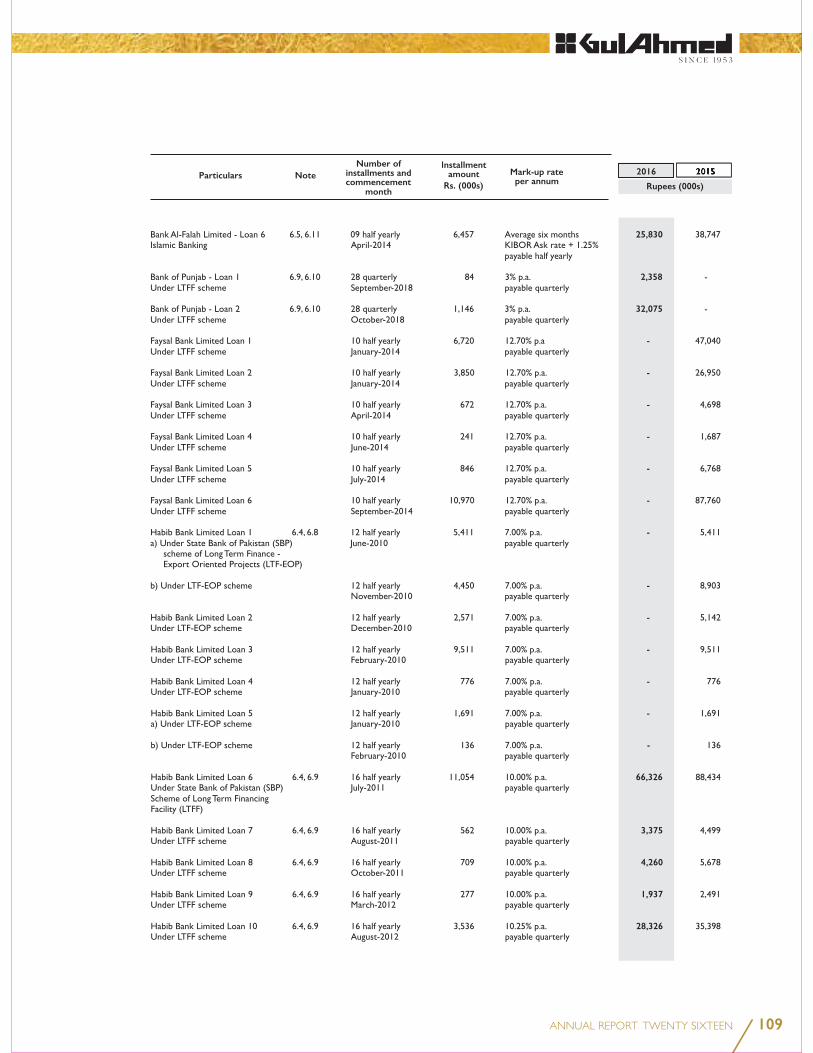
6.2 Other Banks
74,058
166,920
58,578
21,325
1,259
47,675
29,935
26,005
50,842
33,871
2,680
5,030
147,820
-
5,736
7,361
40,859
51,425
37,755
108
109
2016ParticularsInstallment
amountRs. (000s)
Number ofinstallments andcommencement
month
Note Mark-up rateper annum
25,830 2,358 32,075 - - - - - - - - - - - - - 66,326 3,375 4,260
1,937 28,326
201520152016
Rupees (000s)
2015Particulars
Installmentamount
Rs. (000s)
Number ofinstallments andcommencement
month
Note Mark-up rateper annum
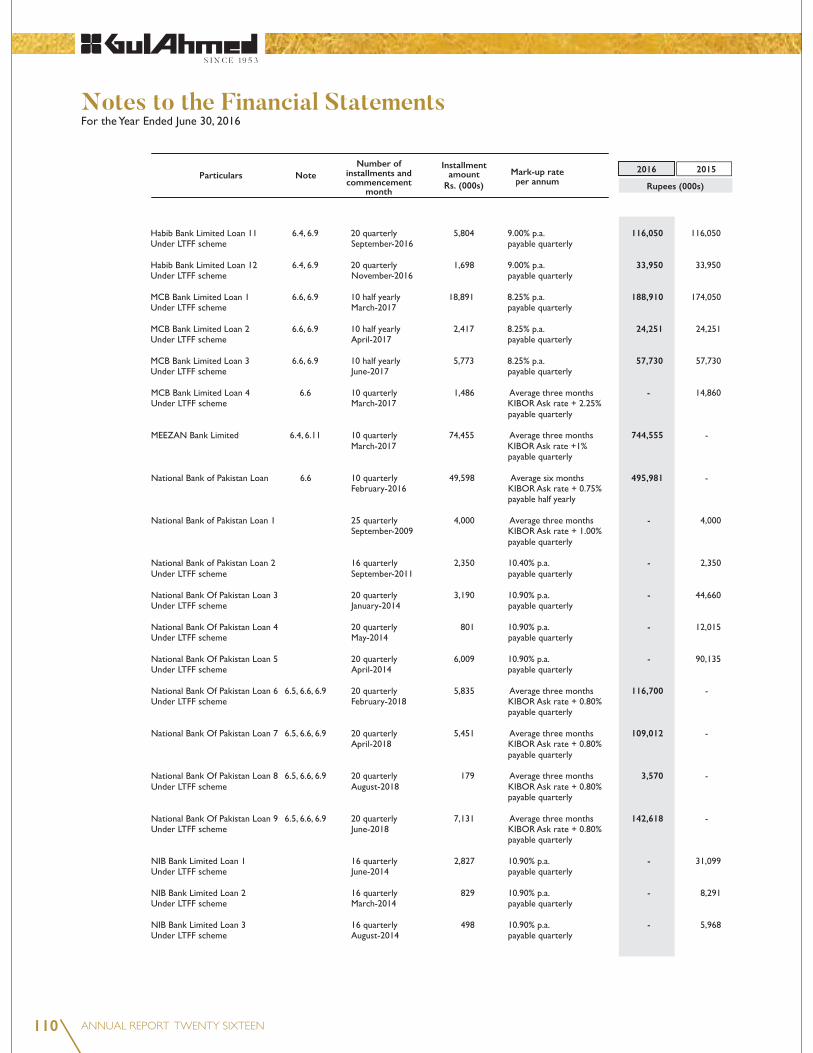
116,050 33,950 188,910 24,251 57,730 - 744,555 495,981 - - - - - 116,700 109,012 3,570 142,618 - - -
2016
Rupees (000s)
110

20152016
Rupees (000s)Particulars
Installment
Rs. (000s)
Number ofinstallments andcommencement
month
Note Mark-up rateper annum
4,975
22,619 - - - - - - 2,023 - - 231,310 - - - - - - - - - -
InstallmentInstallmentInstallmentamountamountamount
111

20152016Particulars
Installmentamount
Rs. (000s)
Number ofinstallments andcommencement
month
Note Mark-up rateper annum
-
1,612
7,411
35,792
-
-
83,387
18,020
3,985
2,150
1,020
23,850
890
3,187
41,822
18,270
9,546
121,114
-
-
Total from Other Banks 3,639,931
112

20152016
Rupees (000s)Particulars
Installmentamount
Rs. (000s)
Number ofinstallments andcommencement
month
Note Mark-up rateper annum
137,000
136,150
322,990
79,340
38,970
265,986
26,120
13,330
458,187
Total from Non-Banking Financial Institutions 1,478,073
113

2016 2015
Rupees (000s)
2016 2015
7 DEFERRED TAXATION
350,339 (41,983)
952 309,308
Deferred tax arises due to:
352,990
(4,062)
(26,477)
(13,143) (43,682)
309,308
8 STAFF RETIREMENT BENEFITS
8.1 Reconciliation of the present value of defined benefit obligation and movement in net defined benefit liability
43,951 34,342
(8,376) (34,168)
35,749
8.2 Charge for the year recognized in profit and loss account
31,722 -
2,620
34,342
8.3 Significant actuarial assumptions used
7.25% p.a
6.25 % p.a 5 years
SLIC 2001-2005
Set back 1 Year
Rupees (000s)
114
Note
Note

8.5 General Description
8.6 Sensitivity Analysis
34,171
37,543
37,543
34,142
9 TRADE AND OTHER PAYABLES
46,679
2,465,508
2,512,187
1,941,938
328,988
75,029
27,235
2,140
9,473
71,378
14,270
24,464
5,007,102
2016 2015
Rupees (000s)
115
Note
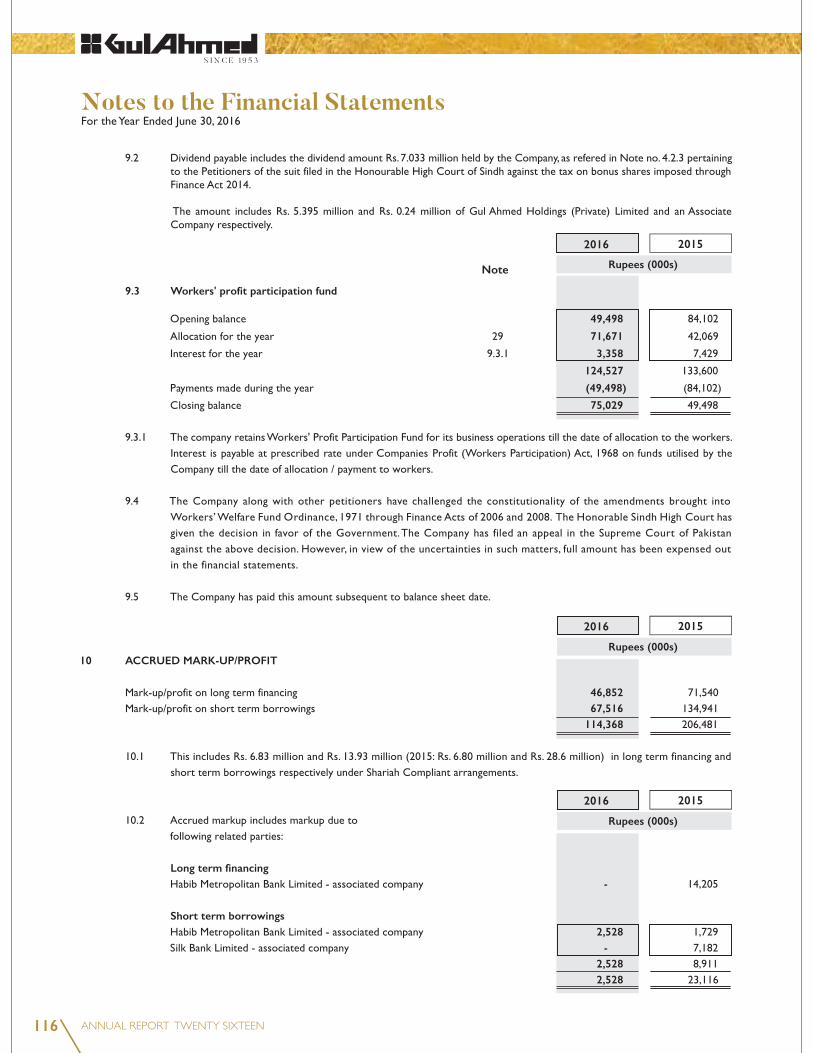
9.3 Workers' profit participation fund
49,498
71,671
3,358
124,527
(49,498)
75,029
10 ACCRUED MARK-UP/PROFIT
46,852
67,516
114,368
Long term financing -
Short term borrowings 2,528
-
2,528
2,528
Rupees (000s)
2016 2015
Rupees (000s)
2016 2015
Rupees (000s)
2016 2015
116
Note
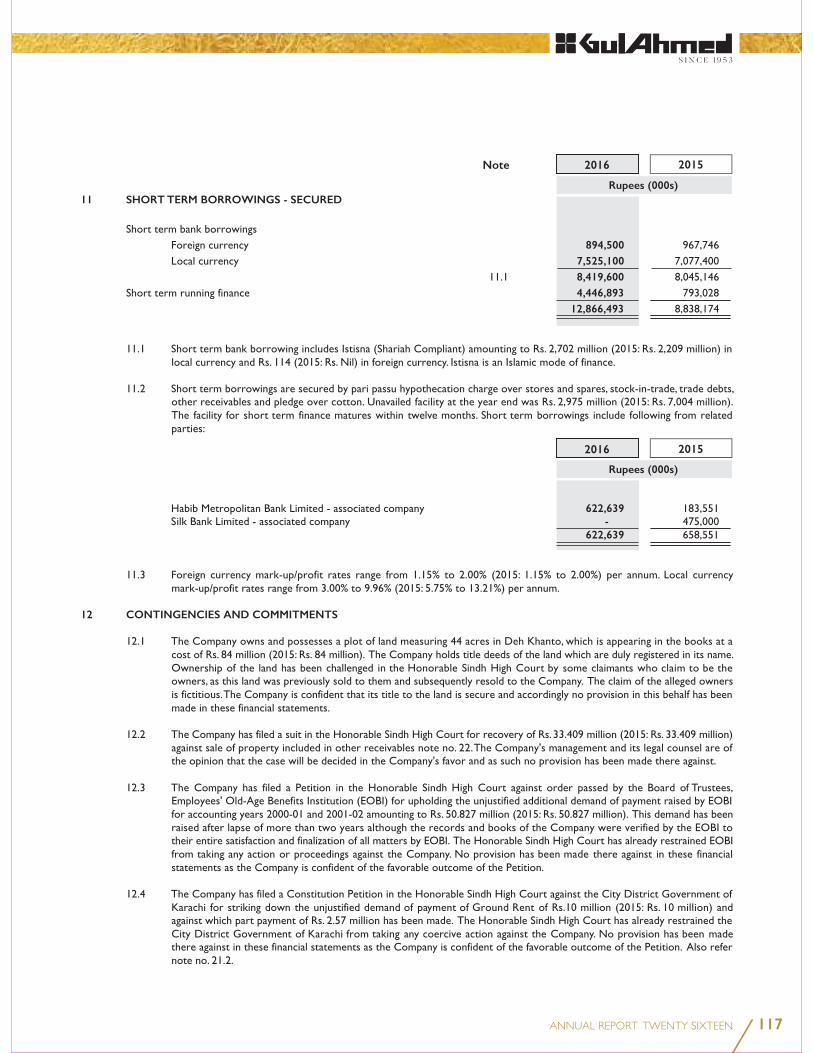
11 SHORT TERM BORROWINGS - SECURED
894,500
7,525,100
8,419,600
4,446,893
12,866,493
622,639 -
622,639
12 CONTINGENCIES AND COMMITMENTS
117
Rupees (000s)
2016 2015
Rupees (000s)
2016 2015
Note

Rupees (000s)
2016 2015
12.8 Guarantees
12.9 Commitments
497,517
1,670,611
994,367
3,162,495
13 PROPERTY, PLANT AND EQUIPMENT
10,505,376
1,545,089
12,050,465
118
Note

Rupees (000s)
2016
119
13.1 Operating fixed assets
Movement in net book value during the year ended June 30, 2016
Closing net book value 227,564 1,980,100 7,542,247 50,732 233,014 471,719 10,505,376
Net book value as at June 30, 2016
Net book value 227,564 1,980,100 7,542,247 50,732 233,014 471,719 10,505,376
Movement in net book value during the year ended June 30, 2015
Closing net book value
Net book value as at June 30, 2015
Net book value
Depreciation rate % per annum
854,834
154,214
111,369
1,120,417
Leasehold
land
Rupees
Buildingsand
structureson
leaseholdland
Plantand
machinery
Furnitureand
fixtures
Officeequipment Vehicles Total
Note
120
Modeof
disposal
Written downvalue
CostParticulars of assets Particulars of buyersSaleproceeds
(Loss)/gainon disposal
Rupees (000s)
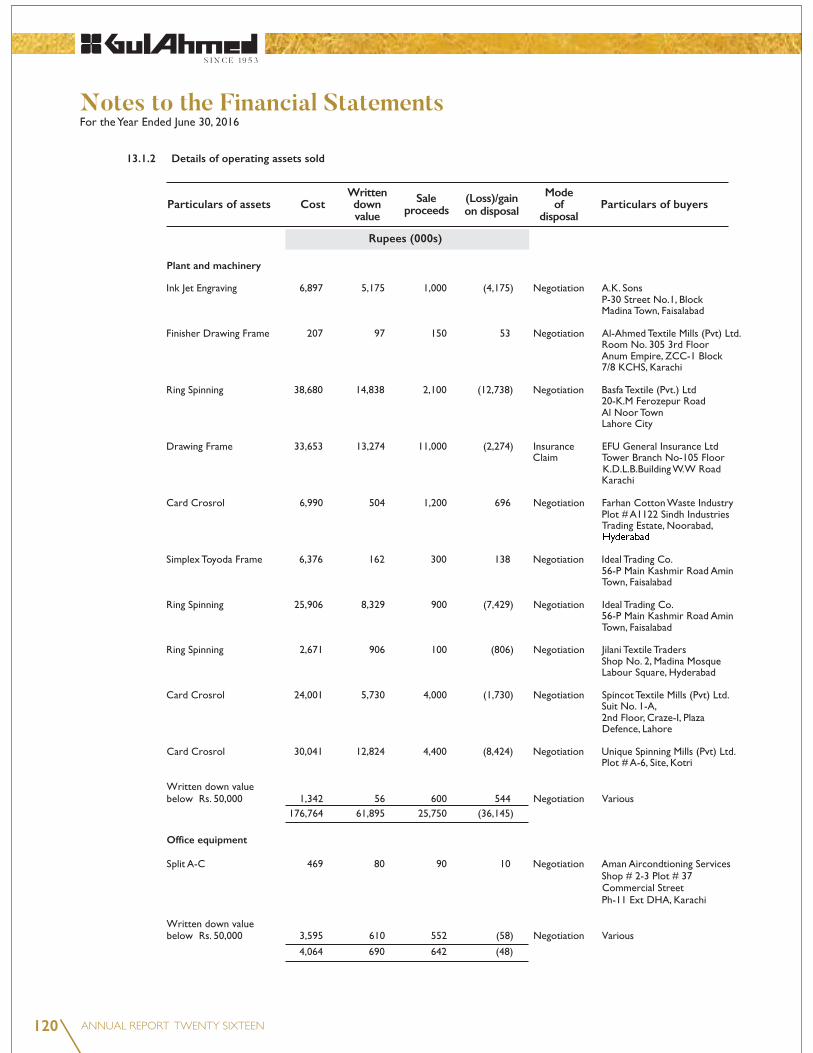
Plant and machinery
Office equipment
13.1.2 Details of operating assets sold

121
Modeof
disposal
Written downvalue
CostParticulars of assets Particulars of buyersSaleproceeds
(Loss)/gainon disposal
Rupees (000s)
Vehicles

122
Modeof
disposal
Written downvalue
CostParticulars of assets Particulars of buyersSaleproceeds
(Loss)/gainon disposal
Rupees (000s)

123
Modeof
disposal
Written downvalue
CostParticulars of assets Particulars of buyersSaleproceeds
(Loss)/gainon disposal
Rupees (000s)

124
2016 239,931 77,498 58,655 (18,843)
Modeof
disposal
Written downvalue
CostParticulars of assets Particulars of buyersSaleproceeds
(Loss)/gainon disposal
Rupees (000s)

125
2016 2015
Rupees (000s)
13.1.3 Details of net loss on sale of property, plant and equipment
18,791
(37,634)
(18,843)
2016 2015
Rupees (000s)
14 INTANGIBLE ASSETS
Computer Software Net carrying value basis as at June 30
11,481
7,182 (5,189)
13,474
Gross carrying value as at June 30
175,120 (161,646)
13,474
507
4,682
5,189
13.2 Capital work in progress
Cost as at end
June 2016 June 2015
Rupees (000s)
Note
Note

126
2016 2015
Rupees (000s)
2016 2015
Rupees (000s)
2016 2015
Rupees (000s)
2016 2015
Rupees (000s)
58,450
35,618 2,185
37,803
(15,122)
(861) (15,983)
21,820
16.2 Reconciliation of carrying amount of loans to executives
20,725 28,344
-
(13,451)
35,618
17 LONG TERM DEPOSITS
Considered good 149,964 5,335
219
155,518
Note
Note

127
2016 2015
Rupees (000s)
2016 2015
Rupees (000s)
18 STORES, SPARE PARTS AND LOOSE TOOLS
564,426
450,956
3,749 1,019,131
(115,684)
903,447
18.1 Movement in provision for slow moving/obsolete items
101,039 14,645
115,684
19 STOCK-IN-TRADE 2,337,553
230,825
11,285,914 13,854,292
20 TRADE DEBTS Export debtors - secured 1,516,559
Local debtors - unsecured 847,743
233,035 1,080,778
2,597,337
(233,035) 2,364,302
Export debtors - secured 28,032 380,881
51,519
460,432 Local debtors - unsecured 2,587 463,019
Note
Note

128
As at June 20161-6 monthsUpto 1 month
28,032 - - 28,032
378,227 1,082 125 379,434
51,519 - - 51,519
1,160 - 1,427 2,587
458,938 1,082 1,552 461,572
198,210
34,825
233,035
21 LOANS AND ADVANCES
Considered Good
15,122
861
15,983
697,322
2,570
715,875
Rupees (000s)
As at June 20151-6 monthsUpto 1 month
Rupees (000s)
2016 2015
Rupees (000s)
Note
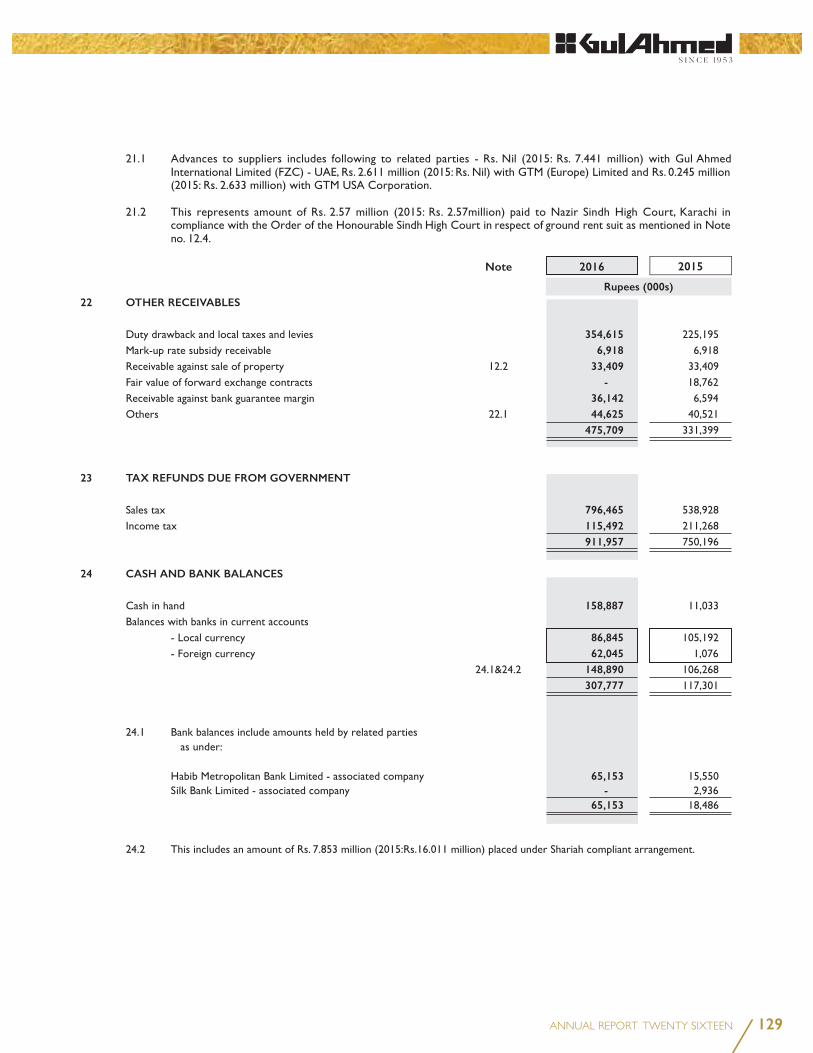
129
22 OTHER RECEIVABLES
354,615
6,918
33,409
-
36,142
44,625
475,709
23 TAX REFUNDS DUE FROM GOVERNMENT
796,465
115,492
911,957
24 CASH AND BANK BALANCES
158,887
86,845
62,045
148,890
307,777
65,153
-
65,153
2016 2015
Rupees (000s)
Note

130
25 SALES
12,397,822
19,299,079
443,211
19,742,290
272,628
32,412,740
(138,184)
32,274,556
26 COST OF SALES
8,970,687
27,283,518
36,254,205
(11,285,914)
24,968,291
26.1 Cost of goods manufactured
7,671,158
4,057,004
5,155,417
2,529,862
133,709
782,227
854,834
182,600
6,114,128
(203,630)
27,277,309
237,034
(230,825)
6,209
27,283,518
2016 2015
Rupees (000s)
Note
2016 2015
Rupees (000s)
Note
131
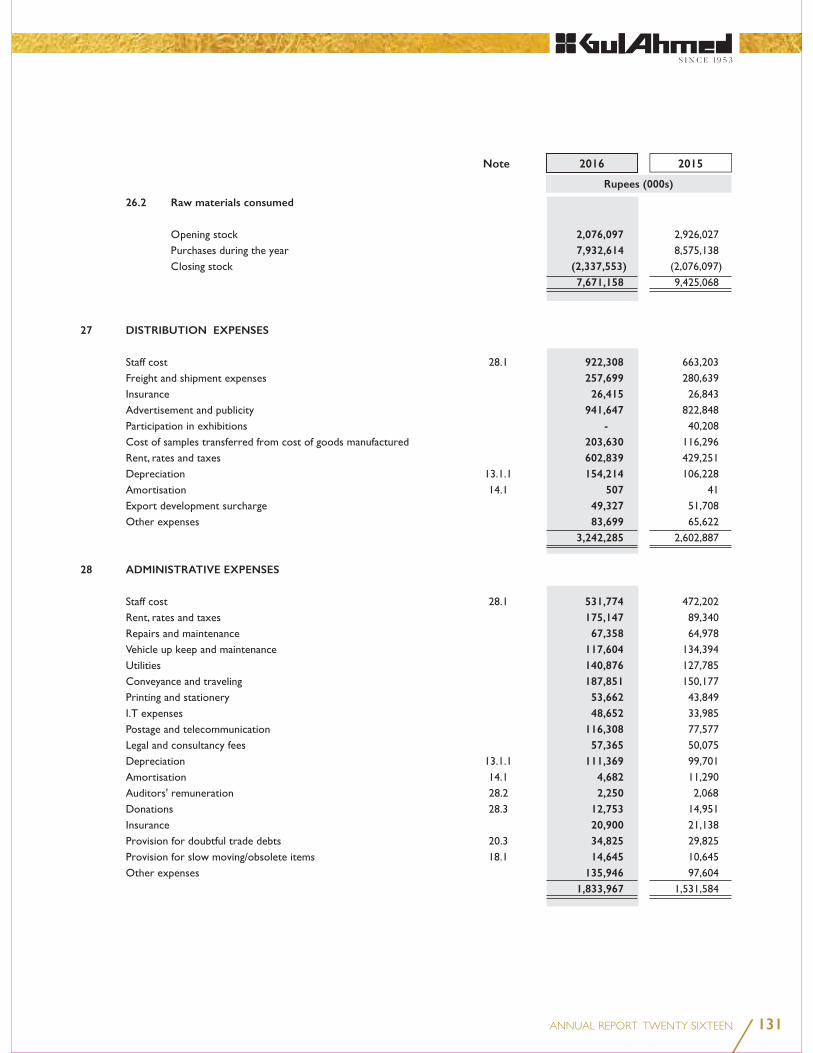
26.2 Raw materials consumed
2,076,097
7,932,614
(2,337,553)
7,671,158
27 DISTRIBUTION EXPENSES
922,308
257,699
26,415
941,647
-
203,630
602,839
154,214
507
49,327
83,699
3,242,285
28 ADMINISTRATIVE EXPENSES
531,774
175,147
67,358
117,604
140,876
187,851
53,662
48,652
116,308
57,365
111,369
4,682
2,250
12,753
20,900
34,825
14,645
135,946
1,833,967
2016 2015
Rupees (000s)
Note

132
Cost of sales Distribution Cost Administrative expense
Total
2016 2015 2016 2015 2016 2015 2016 2015
Rupees (000s)
5,012,297 900,881 508,098 6,421,276
Retirement benefits
34,342 - - 34,342
69,848 20,561 21,410 111,819
104,190 20,561 21,410 146,161
38,930 866 2,266 42,062
5,155,417 922,308 531,774 6,609,499
Rupees (000s)
20152016
Rupees (000s)
20152016
28.2 Auditor's remuneration 1,500
110 200
55
39
112 234
2,250
Name of Director Interest in Donee Name of Donee
175
-
-
175
28.1 Staff cost
133
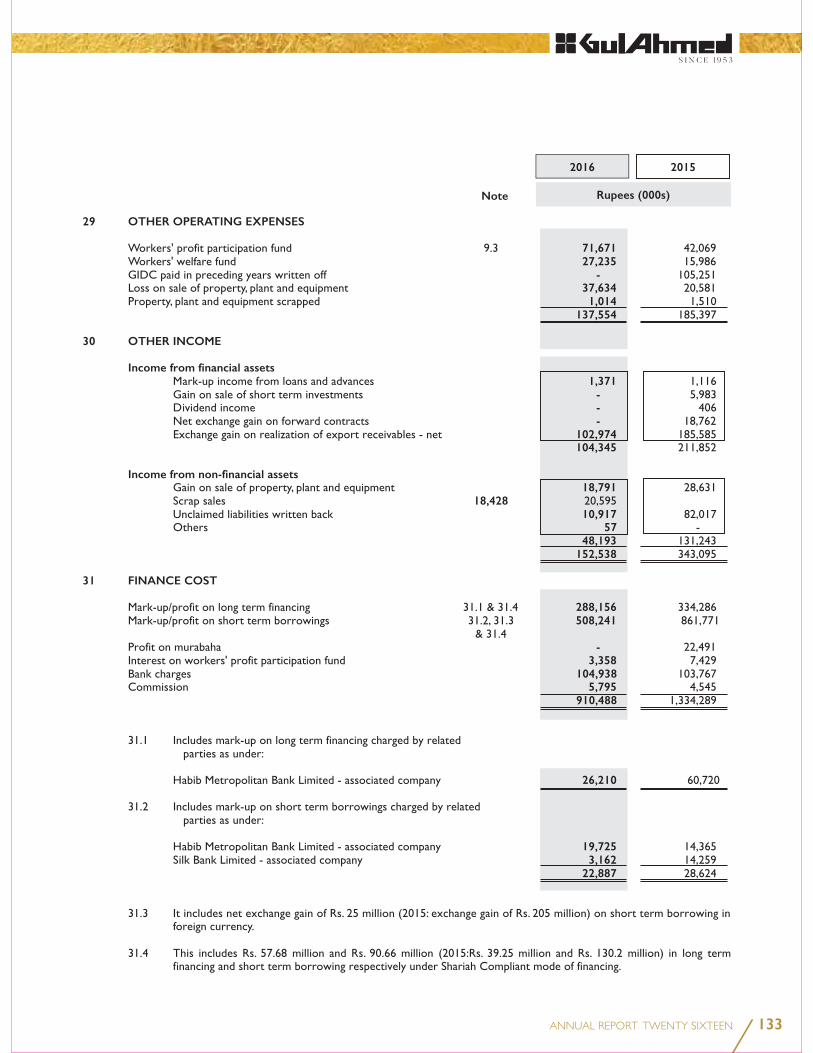
2015
Note Rupees (000s)
2016
29 OTHER OPERATING EXPENSES 71,671 27,235 - 37,634 1,014 137,554 30 OTHER INCOME Income from financial assets 1,371 - - - 102,974 104,345 Income from non-financial assets 18,791 18,428 10,917 57 48,193 152,538
31 FINANCE COST 288,156 508,241 - 3,358 104,938 5,795 910,488
26,210
19,725 3,162
22,887

134
2015
Note Rupees (000s)
2016
32 PROVISION FOR TAXATION
231,905 3,157
235,062 (41,983)
193,079 32.1 Reconciliation between accounting profit and tax expense 1,334,509 32% 427,043 (149,658) 3,157 (82,516) 33,453 1,566 (9,978) (29,988) (233,964)
193,079
33 EARNINGS PER SHARE - basic and diluted 1,141,430 267,132,058 4.27
34 SEGMENT INFORMATION
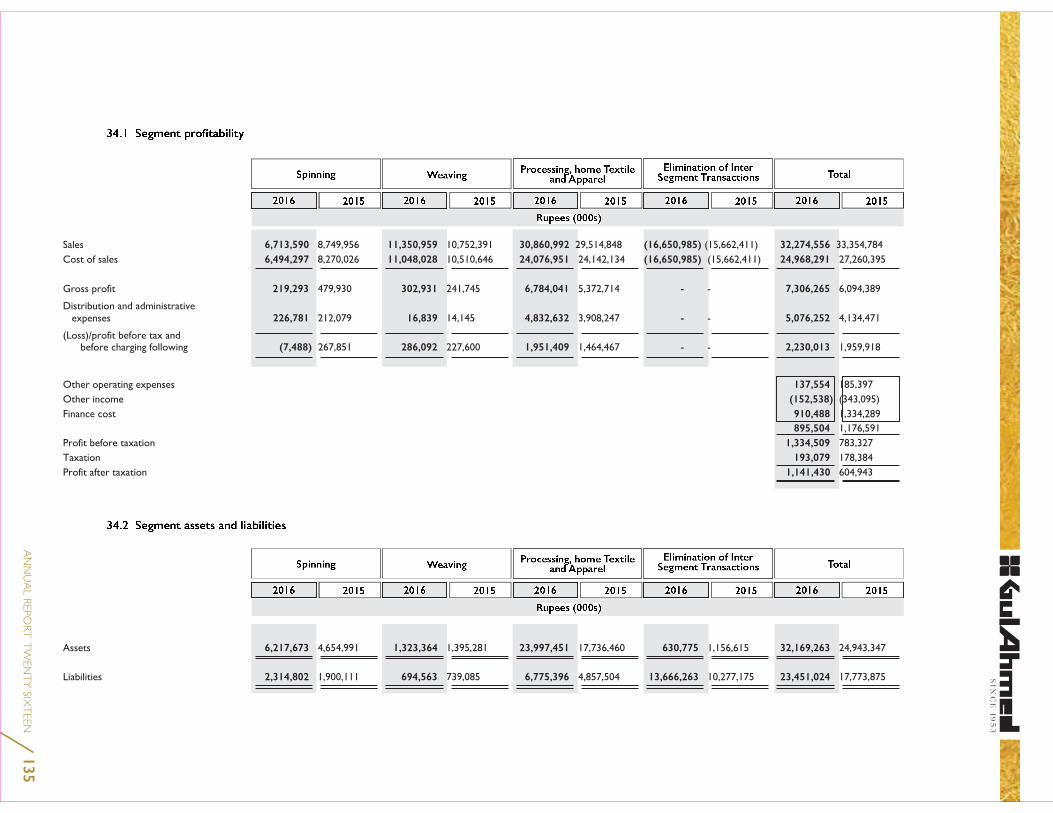
135
6,713,590 11,350,959 30,860,992 (16,650,985) 32,274,556 6,494,297 11,048,028 24,076,951 (16,650,985) 24,968,291
219,293 302,931 6,784,041 - 7,306,265
226,781 16,839 4,832,632 - 5,076,252
(7,488) 286,092 1,951,409 - 2,230,013
137,554 (152,538) 910,488 895,504 1,334,509 193,079 1,141,430
6,217,673 1,323,364 23,997,451 630,775 32,169,263
2,314,802 694,563 6,775,396 13,666,263 23,451,024

136
3
34.6 Information by geographical area
12,702,849 12,241,277
4,384,073 -
2,140,329 -
552,880 -
2, -
1,790,750 -
1,638,947 -
196,784 58,450
1,517,638 -
1,433,697 -
740,890 -
2,275,889 -
32,274,556 12,299,727
35 CASH AND CASH EQUIVALENTS
307,777
(12,866,493)
(12,558,716)
Non - current assets
2016 2015 2016 2015
Revenue
Rupees (000s)
20152016
Note
Director Executives Total Director Executives Total
2016 2015
Rupees (000s)
36 REMUNERATION OF CHIEF EXECUTIVE, DIRECTORS AND EXECUTIVES
9,020 6,765 631,687 647,472
3,608 2,706 251,943 258,257
1,085 739 146,110 147,934
751 564 45,216 46,531
14,464 10,7741,074,956 1,100,194

137
37 TRANSACTIONS AND BALANCES WITH RELATED PARTIES
Relationship with Nature of Transactions the Company
Parent Company 534,106 818,192 Subsidiaries and 1,195,985 indirect subsidiaries 1,396 142,793 Associated companies 37,173 and other related parties 1,160 71,558 1,500 847 175 4,590,010 31,693 49,097 113,463 24,388 36,961 Relationship with Nature of Outstanding Balances the Company Subsidiaries and 35,933 indirect subsidiaries 58,450 460,432 2,856 93,365 Associated companies 622,639 and others related parties 10,746 14,270 637,583 2,528 35,618 2,587 65,153 35,197
Rupees (000s)
20152016
138
2016 2015
Rupees (000s)
Rupees (000s)
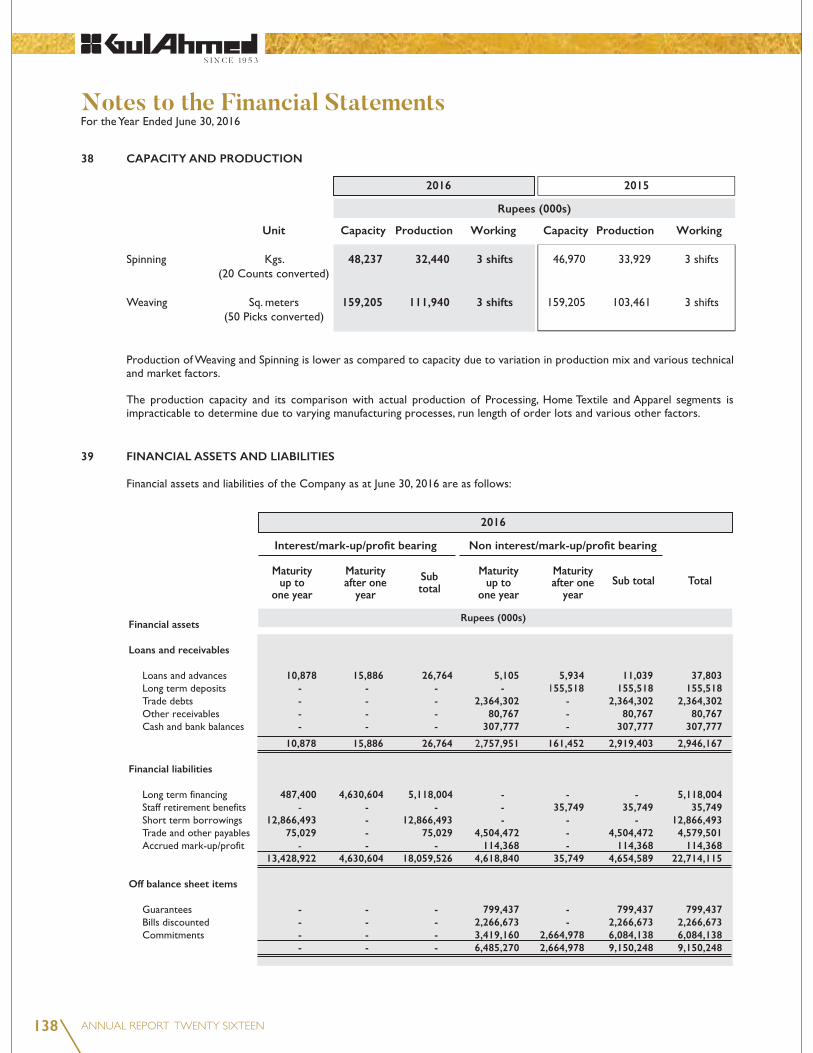
38 CAPACITY AND PRODUCTION
Unit Capacity Production Working Capacity Production Working
48,237 32,440 3 shifts
159,205 111,940 3 shifts
39 FINANCIAL ASSETS AND LIABILITIES
Financial assets
Loans and receivables
10,878 15,886 26,764 5,105 5,934 11,039 37,803 - - - - 55,518 155,518 155,518 - - - 2,364,302 - 2,364,302 2,364,302 - - - 80,767 - 80,767 80,767 - - - 307,777 - 307,777 307,777
10,878 15,886 26,764 ,757,951 161,452 2,919,403 2,946,167
Financial liabilities
487,400 4,630,604 5,118,004 - - - 5,118,004 - - - 35,749 35,749 35,749 12,866,493 - 12,866,493 - - - 12,866,493 75,029 - 75,029 4,504,472 - 4,504,472 4,579,501 - - 114,368 - 114,368 114,368 13,428,922 4,630,604 18,059,526 4,618,840 35,749 4,654,589 22,714,115
Off balance sheet items
- - - 799,437 - 799,437 799,437 - - - 2,266,673 - 2,266,673 2,266,673 - - - 3,419,160 2,664,978 6,084,138 6,084,138 - - - 6,485,270 2,664,978 9,150,248 9,150,248
2016
Interest/mark-up/profit bearing
Maturityup to
one year
Maturityafter one
year
Subtotal
Maturityup to
one year
Maturityafter one
yearSub total Total
Non interest/mark-up/profit bearing
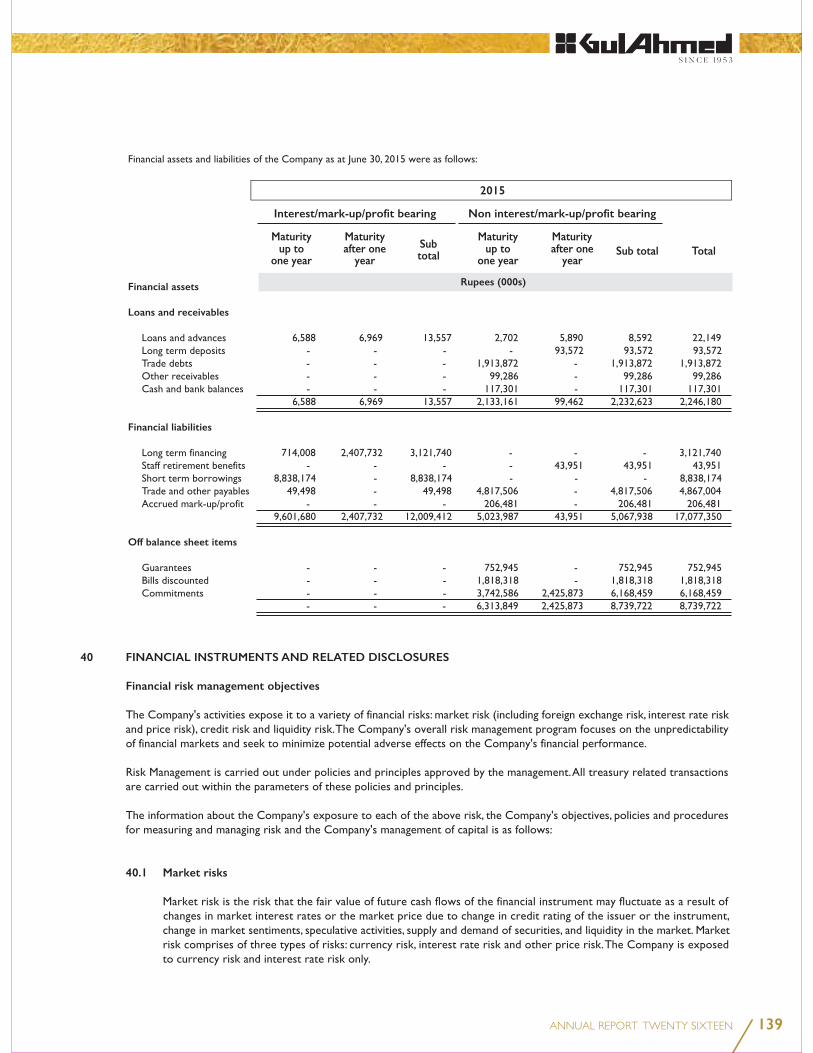
139
Financial assets
Loans and receivables
Financial liabilities
Off balance sheet items
2015
Interest/mark-up/profit bearing
Maturityup to
one year
Maturityafter one
yearSubtotal
Maturityup to
one year
Maturityafter one
year
Non interest/mark-up/profit bearing
40 FINANCIAL INSTRUMENTS AND RELATED DISCLOSURES
Financial risk management objectives
40.1 Market risks
Rupees (000s)
Sub total Total

140
2015
000s
2016
2015
Equivalent USD 000s
2016
a) Currency risk
Exposure to foreign currency risk
14,485
593
(8,527)
(1,589)
4,962
7,420
7,191
912,410
1,993
-
Rupee per USD 104.80 104.90 / 104.70 Foreign currency sensitivity analysis
b) Interest/mark-up rate risk

141
Cash flow sensitivity analysis for variable rate instruments
Fair value sensitivity analysis for fixed rate instruments
c) Other Price risk
40.2 Credit risk
Exposure to credit risk
37,803
155,518
2,364,302
80,767
148,890
2,787,280
Loans and advances
52016Note
Rupees (000s)

142
Long Term Deposits
Trade debts
2,199,435 158,242 6,625
2,364,302
Other receivables
Bank balances
12,946 70,251 18,693 554 45,830 205 411
148,890
20152016Note
Rupees (000s)
20152016Note
Rupees (000s)

143
20152016
Financial assets that are either past due or impaired
40.3 Liquidity risk
40.4 Capital risk management
17,984,497
(307,777)
17,676,720
8,718,239
26,394,959
67
41 FAIR VALUES

144
20152016
42 PROVIDENT FUND RELATED DISCLOSURES
Un-audited
851,930
721,812
84.73%
777,547
78,014 10.03%
437,017 56.20%
130,650 16.80%
63,509 8.17%
68,357 8.79%
777,547 100%
43 NUMBER OF PERSONS EMPLOYED
Note
2015
Rupees (000s) Percentage
Un-audited
2016

145
44 EVENT AFTER BALANCE SHEET DATE
45 DATE OF AUTHORIZATION
46 GENERAL
MOHOMED BASHIR
MOHAMMED ZAKI BASHIR

146
Board Audit CommitteeHuman Resource &
Remuneration Committee

147
4,773 297,079,604
4,773 297,079,604 100.00
No. of Shareholders Shareholding Shares held
Categories. of Shareholders Number PercentageShares held

148
Categories of Shareholders Number Shares held
Associated Companies, Undertakings and Related Parties
NIT and ICP
Mutual Funds
DIRECTORS :
DIRECTORS'/CEO'S SPOUSE :
CHIEF FINANCIAL OFFICER (CFO)
Shareholders holding 5% or more Voting Interest
Details of trading in the shares by: the year under review except for 30% Right Shares subscribed as per details given below:-
DIRECTORS : DIRECTORS'/CEO'S SPOUSE : CHIEF FINANCIAL OFFICER :

ConsolidatedFinancial Statements
2016

MOHAMMED ZAKI BASHIR
Rupees (000s)
The Group
Group Results
Appropriation
Pattern of Shareholding
Subsequent Effects
150

KRESTON HYDER BHIMJI & CO.
151

Rupees (000s)
20152016
Note
EQUITY AND LIABILITIES
SHARE CAPITAL AND RESERVES
2,970,796
6,010,215
8,981,011
NON-CURRENT LIABILITIES
4,630,604
323,908
41,346
365,254
4,995,858
CURRENT LIABILITIES
5,377,637
114,368
12,866,493
487,400
18,845,898
CONTINGENCIES AND COMMITMENTS
32,822,767
MOHOMED BASHIR
152

ASSETS
NON-CURRENT ASSETS
12,069,608
20,492
21,820
158,136
996
12,271,052
CURRENT ASSETS
903,447
14,057,202
2,786,782
729,911
227,788
475,709
913,960
117,249
339,666
20,551,714
32,822,767
Rupees (000s)
20152016
Note
MOHAMMED ZAKI BASHIR
153
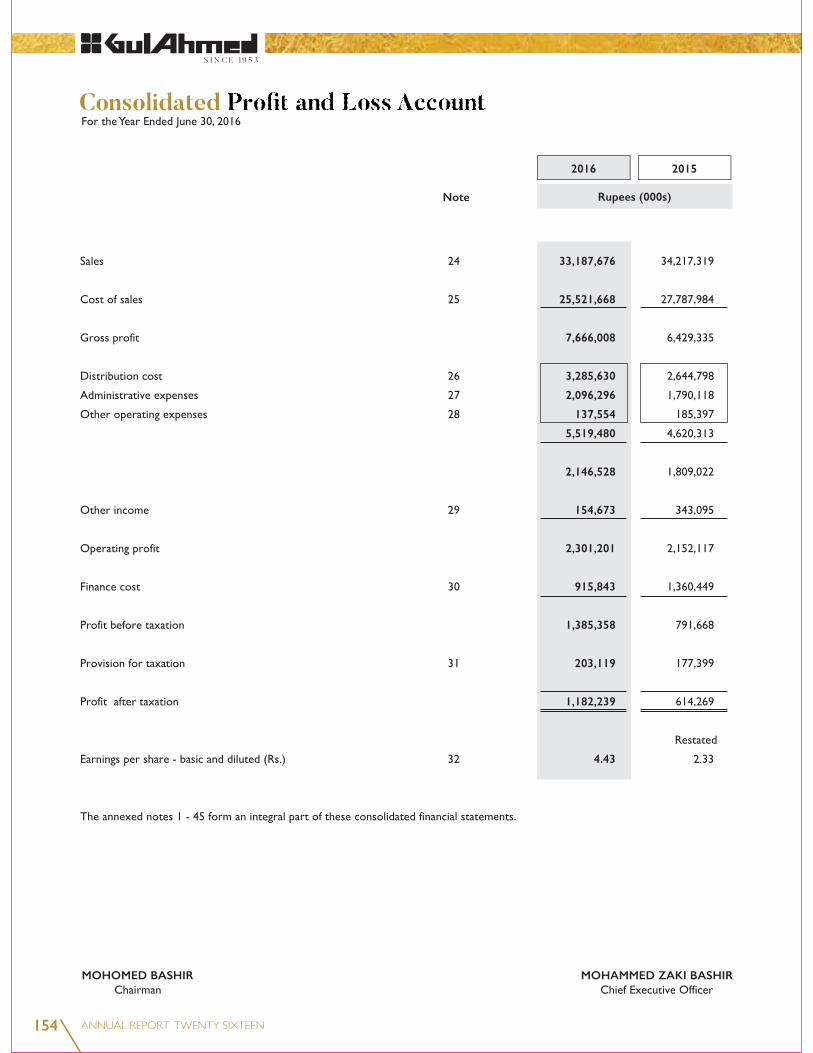
Rupees (000s)
20152016
Note
33,187,676
25,521,668
7,666,008
3,285,630
2,096,296
137,554
5,519,480
2,146,528
154,673
2,301,201
915,843
1,385,358
203,119
1,182,239
4.43
MOHOMED BASHIR
MOHAMMED ZAKI BASHIR
154

Profit after taxation 1,182,239
Other comprehensive income
Items that will not be reclassified to profit and loss
account subsequently
8,376
(952)
7,424
Items that will be reclassified to profit and loss account
subsequently
9,076
Total comprehensive income 1,198,739
Rupees (000s)
20152016
Note
MOHOMED BASHIR
MOHAMMED ZAKI BASHIR
155

Rupees (000s)
20152016
CASH FLOWS FROM OPERATING ACTIVITIES
1,385,358
1,125,358
7,130
36,585
915,843
14,645
34,825
1,014
(10,917)
18,619
2,143,102
3,528,460
(219,030)
(2,596,004)
(669,534)
(380,664)
(112,824)
(144,310)
14,809
(4,107,557)
(15,073)
(4,122,630)
(594,170)
(35,696)
(1,007,956)
(351,605)
(8,961)
(64,564)
(1,468,782)
(2,062,952)
156

Rupees (000s)
20152016
Note
CASH FLOWS FROM INVESTING ACTIVITIES
(4,225,010)
(11,788)
59,553
-
-
-
(4,177,245)
(6,240,197)
CASH FLOWS FROM FINANCING ACTIVITIES
2,681,678
(685,414)
1,199,744
(789,492)
2,406,516
9,076
(3,824,605)
(8,702,222)
(12,526,827)
MOHOMED BASHIR
MOHAMMED ZAKI BASHIR
157
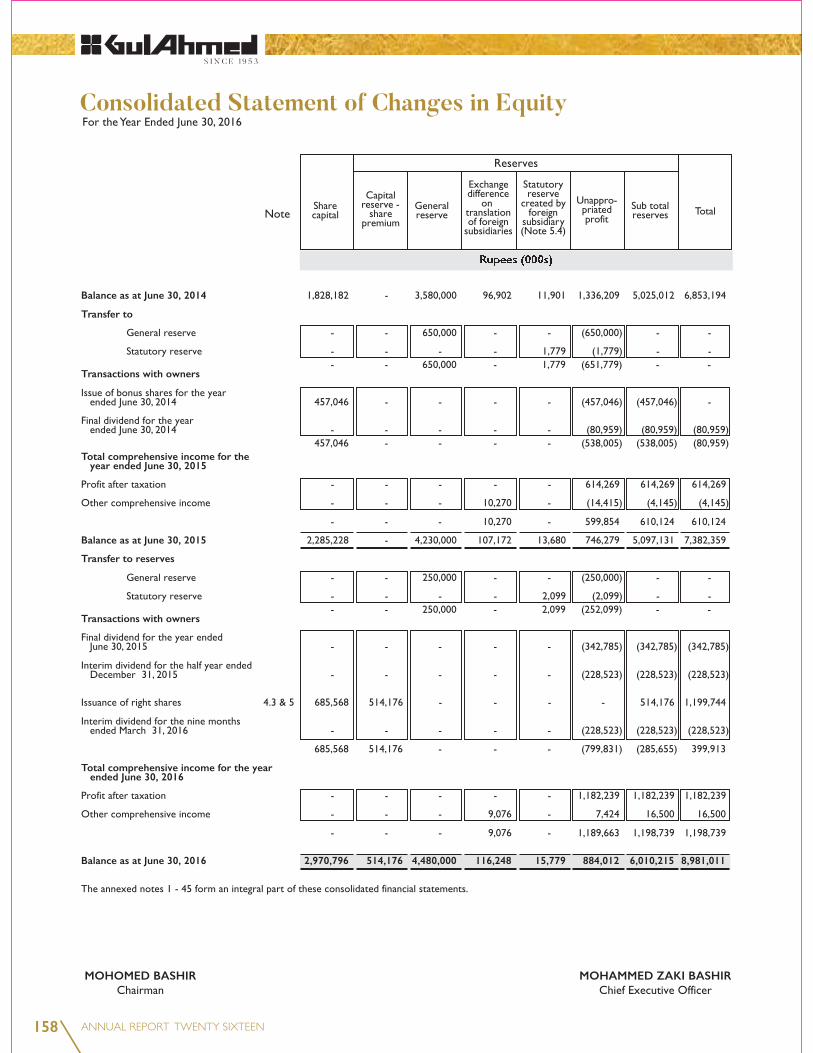
MOHOMED BASHIR
MOHAMMED ZAKI BASHIR
Balance as at June 30, 2014 Transfer to
Transactions with owners
Total comprehensive income for the year ended June 30, 2015 Balance as at June 30, 2015 Transfer to reserves
Transactions with owners Total comprehensive income for the year ended June 30, 2016 Balance as at June 30, 2016 2,970,796 514,176 4,480,000 116,248 15,779 884,012 6,010,215 8,981,011
158

1 LEGAL STATUS AND ITS OPERATIONS
Details of Subsidiaries Date of Percentage of Country of Incorporation Holding Incorporation
1.2 Basis of consolidation
2 BASIS OF PREPERATION 2.1 Basis of measurement
159
2.2 Statement of compliance
2.3 Functional and presentation currency
2.4 Critical accounting estimates and judgments
(a) Defined benefit plan
(b) Contingencies
(c) Useful lives, pattern of economic benefits and impairments
(d) Intangibles
(e) Provision for obsolescence and slow moving spare parts and loose tool
(f ) Stock-in-trade
(g) Provision against trade debts, advances and other receivables
(h) Taxation
160

2.5 Adoption of new and revised standards and interpretations
(a) New and amended standards and interpretations became effective:
IFRS 10 ‘Consolidated Financial Statements’
IFRS 11 ‘Joint Arrangements’
IFRS 12 ‘Disclosure of Interest in Other Entities’
IFRS 13 ‘Fair Value Measurement’
(b) Standards, Interpretations and Amendments not yet effective
IAS 1 ‘Presentation of Financial Statements' (Effective for annual periods beginning on or after January 01, 2016)
IAS 12 'Income Taxes' (Effective for annual periods beginning on or after January 01, 2017)
161

IAS 7 'Statement of Cash Flows' (Effective for annual periods beginning on or after January 01, 2017)
Amendments to IAS 16 ‘Property, Plant and Equipment’ and IAS 38 ‘Intangible Assets’ (Effective for
annual periods beginning on or after January 01, 2016)
Amendments to IAS 16 ‘Property, Plant and Equipment’ and IAS 41 ‘Agriculture’ - Bearer Plants
(Effective for annual periods beginning on or after January 01, 2016)
IAS 27 (Revised 2011) – ‘Separate Financial Statements’ (Effective from accounting period beginning on
or after January 01, 2016)
IAS 28 (Revised 2011) – ‘Investments in Associates and Joint Ventures’ (Effective from accounting period beginning on or after January 01, 2016)
IFRS 2 ‘Share-based Payment’ (Effective from accounting period beginning on or after January 01, 2016)
IFRS 9 ‘Financial Instruments’ (Effective from accounting period beginning on or after February 01, 2015)
162
IFRS 14 ‘Regulatory Deferral Accounts’ (Effective from accounting period beginning on or after January 01, 2016)
IFRS 15 ‘Revenue from Contracts with Customer’ (Effective from accounting period beginning on or
after January 01, 2018)
IFRS 16 ‘Leases’ (Effective from accounting period beginning on or after January 01, 2019)
(c) Amendments to standards as a result of annual improvements to IFRSs 2012–2014 cycle that are not yet effective:
IFRS 5 ‘Non-current Assets Held for Sale and Discontinued Operations’ - Changes in methods of disposal (Effective from accounting period beginning on or after January 01, 2016)
IFRS 7 ‘Financial Instruments: Disclosures’ (Effective from accounting period beginning on or after January 01, 2016)
IAS 19 ‘Employee Benefits’ - Discount rate regional market issue (Effective from accounting period beginning on or after January 01, 2016)
163

IAS 34 ‘Interim Financial Reporting’ - Disclosure of information 'elsewhere in the interim financial report' (Effective from accounting period beginning on or after January 01, 2016)
New Standards issued by IASB but not yet been notified by SECP
International Financial Reporting Standards (IFRSs) IASB effective date annual periods beginning on or after
3 SIGNIFICANT ACCOUNTING POLICIES 3.1 Foreign currency transactions and translation
3.2 Staff retirement benefits Defined benefit plan
164

Defined contribution plan
3.3 Accumulated employee compensated absences
3.4 Provisions and contingencies
3.5 Taxation
Current
Deferred
3.6 Borrowings
3.7 Borrowing cost
3.8 Trade and other payables
165

3.9 Property, plant and equipment Operating fixed assets
Capital work-in-progress
3.10 Intangible assets
3.11 Investments
Investment at fair value through profit and loss
3.12 Loans and receivables
3.9 Property, plant and equipment Operating fixed assets
Capital work-in-progress
3.10 Intangible assets
3.11 Investments
Investment at fair value through profit and loss
3.12 Loans and receivables
166

3.13 Stores, spare parts and loose tools
3.14 Stock-in-trade
3.15 Trade debts
3.16 Revenue recognition
3.17 Financial Instruments
3.18 Derecognition of Financial Instruments
3.13 Stores, spare parts and loose tools
3.14 Stock-in-trade
3.15 Trade debts
3.16 Revenue recognition
3.17 Financial Instruments
3.18 Derecognition of Financial Instruments
167

3.19 Impairment
Financial assets
Non-Financial assets
3.20 Derivative financial instruments
3.21 Offsetting of financial assets and liabilities
3.22 Cash and cash equivalents
3.23 Dividend and appropriation to reserves
3.24 Segment reporting
168

2015
2015
2015
Number of SharesNumber of Shares
2016
2016 2015
Rupees (000s)
2016
Number of Shares
2016Note
4.1 Authorized capital
400,000,000 4,000,000
4.2 Issued, subscribed and paid - up capital
132,745,817 1,327,458 5,447,326 54,473
158,886,461 1,588,865
297,079,604 2,970,796
4.3 Reconciliation of the number of shares outstanding
228,522,772
68,556,832
-
297,079,604
Number of Shares
169
Rupees (000s)
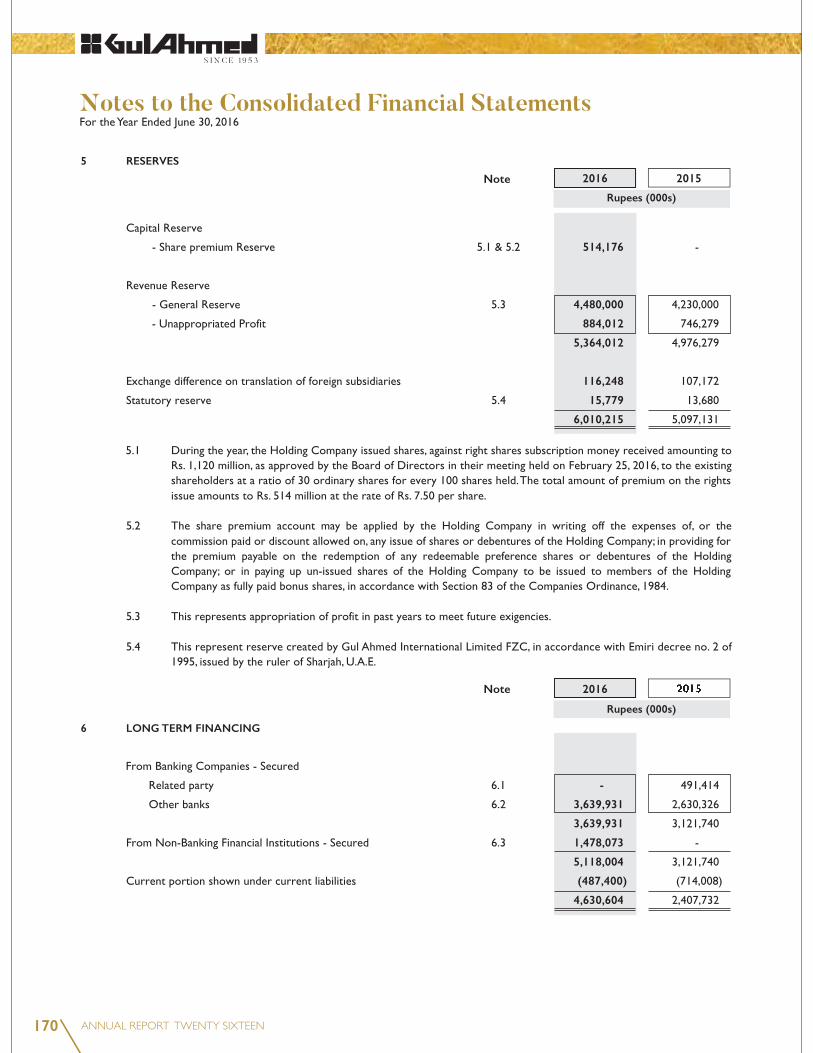
201520165 RESERVES
514,176
4,480,000
884,012
5,364,012
116,248
15,779
6,010,215
6 LONG TERM FINANCING
-
3,639,931
3,639,931
1,478,073
5,118,004
(487,400)
4,630,604
Note
Rupees (000s)
2016Note
170

20152016
Rupees (000s)Particulars
Installmentamount
Rs. (000s)
Number ofinstallments andcommencement
month
Mark-up rateper annum
6.1 Related party - Bank
-
-
-
-
-
-
-
-
-
-
-
-
-
-
-
-
-
Total from related party -
Note
171

20152016
Rupees (000s)Particulars
Installmentamount
Rs. (000s)
Number ofinstallments andcommencement
month
Note Mark-up rateper annum
6.2 Other Banks
74,058
166,920
58,578
21,325
1,259
7,675
29,935
26,005
50,842
33,871
2,680
5,030
147,820
-
5,736
7,361
40,859
51,425
37,755
172

2016ParticularsInstallment
amountRs. (000s)
Number ofinstallments andcommencement
month
Note Mark-up rateper annum
25,830 2,358 32,075 - - - - - - - - - - - - - 66,326 3,375 4,260
1,937 28,326
201520152016
Rupees (000s)
173

2015Particulars
Installmentamount
Rs. (000s)
Number ofinstallments andcommencement
month
Note Mark-up rateper annum
116,050 33,950 188,910 24,251 57,730 - 744,555 495,981 - - - - - 116,700 109,012 3,570 142,618 - - -
2016
Rupees (000s)
174

20152016
Rupees (000s)Particulars
Installment
Rs. (000s)
Number ofinstallments andcommencement
month
Note Mark-up rateper annum
4,975
22,619 - - - - - - 2,023 - - 231,310 - - - - - - - - - -
InstallmentInstallmentInstallmentamountamountamount
175

20152016Particulars
Installmentamount
Rs. (000s)
Number ofinstallments andcommencement
month
Note Mark-up rateper annum
-
1,612
7,411
35,792
-
-
83,387
8,020
3,985
2,150
1,020
23,850
890
3,187
1,822
18,270
9,546
121,114
-
-
Total from Other Banks 3,639,931
Rupees (000s)
176
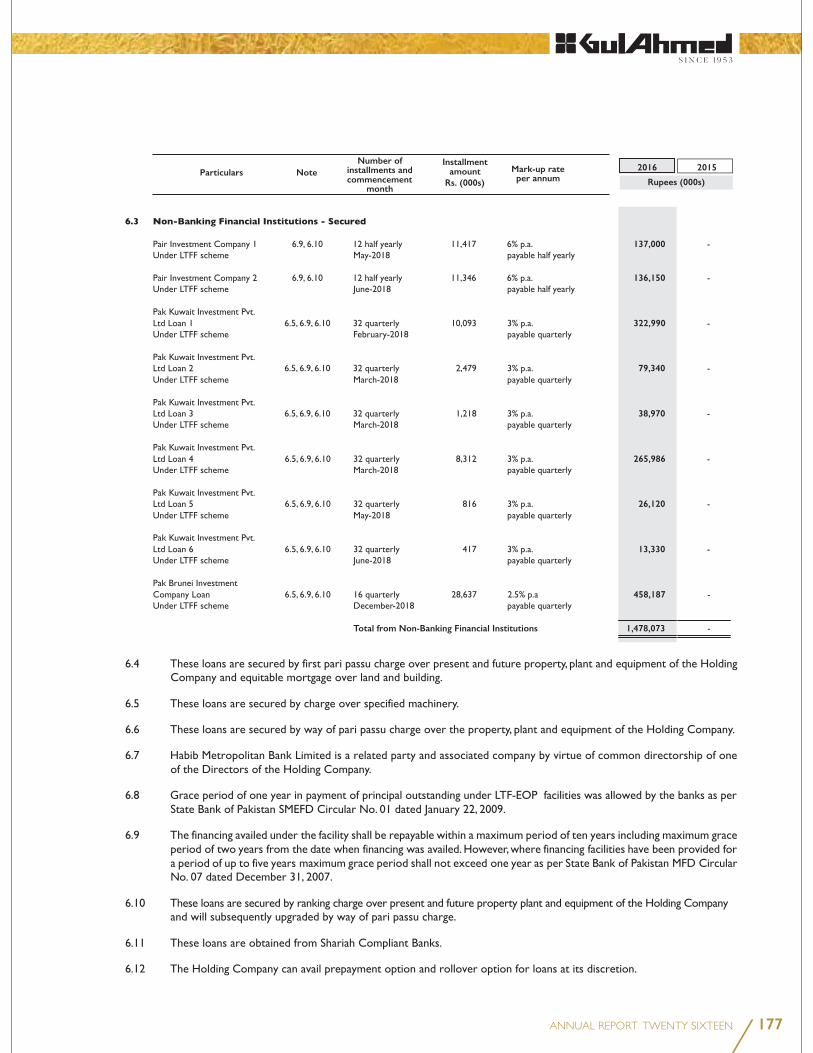
20152016
Rupees (000s)Particulars
Installmentamount
Rs. (000s)
Number ofinstallments andcommencement
month
Note Mark-up rateper annum
137,000
136,150
322,990
79,340
38,970
265,986
26,120
13,330
458,187
Total from Non-Banking Financial Institutions 1,478,073
177

7 DEFERRED TAXATION
323,908
(996)
322,912
7.1 Deferred tax arises due to:
Taxable temporary differences in respect of 352,990
14,600
367,590
Deductible temporary differences in respect of (4,062)
(26,477)
(13,143)
43,682)
323,908
7.2 Deferred tax asset of an indirect subsidiary
(312)
(684)
(996)
7.3 Movement in deferred taxation
356,354
(34,394)
952
322,912
2016 2015
Rupees (000s)
Note
2016 2015
Rupees (000s)
Rupees (000s)
178

8 STAFF RETIREMENT BENEFITS 8.1 Reconciliation of the present value of defined benefit obligation and movement in net defined benefit
liability
48,833 36,585 (8,376) (35,696) 41,346 8.2 Charge for the recognized in profit and loss account 31,722 - 2,620
34,342 2,243
36,585 8.3 Significant actuarial assumptions used 7.25% p.a 6.25 % p.a 5 years SLIC 2001-2005 Set back 1 Year
8.6 General Description
8.7 Sensitivity Analysis
34,171
37,543
37,543
34,142
2016 2015
Rupees (000s)
2016 2015
Rupees (000s)
Note
179
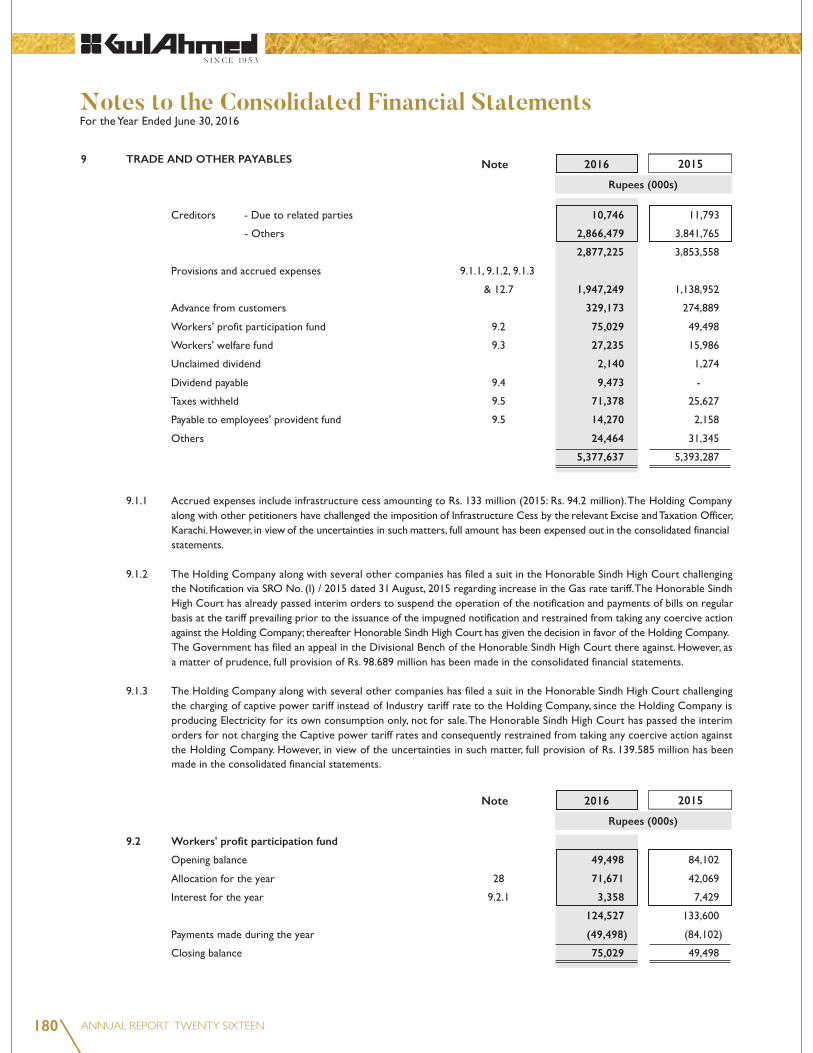
9 TRADE AND OTHER PAYABLES
10,746
2,866,479
2,877,225
1,947,249
329,173
75,029
27,235
2,140
9,473
71,378
14,270
24,464
5,377,637
9.2 Workers' profit participation fund
49,498
71,671
3,358
124,527
(49,498)
75,029
2016 2015
Rupees (000s)
Note
2016 2015
Rupees (000s)
Note
180
2016 2015
Rupees (000s)
2016 2015
Rupees (000s)
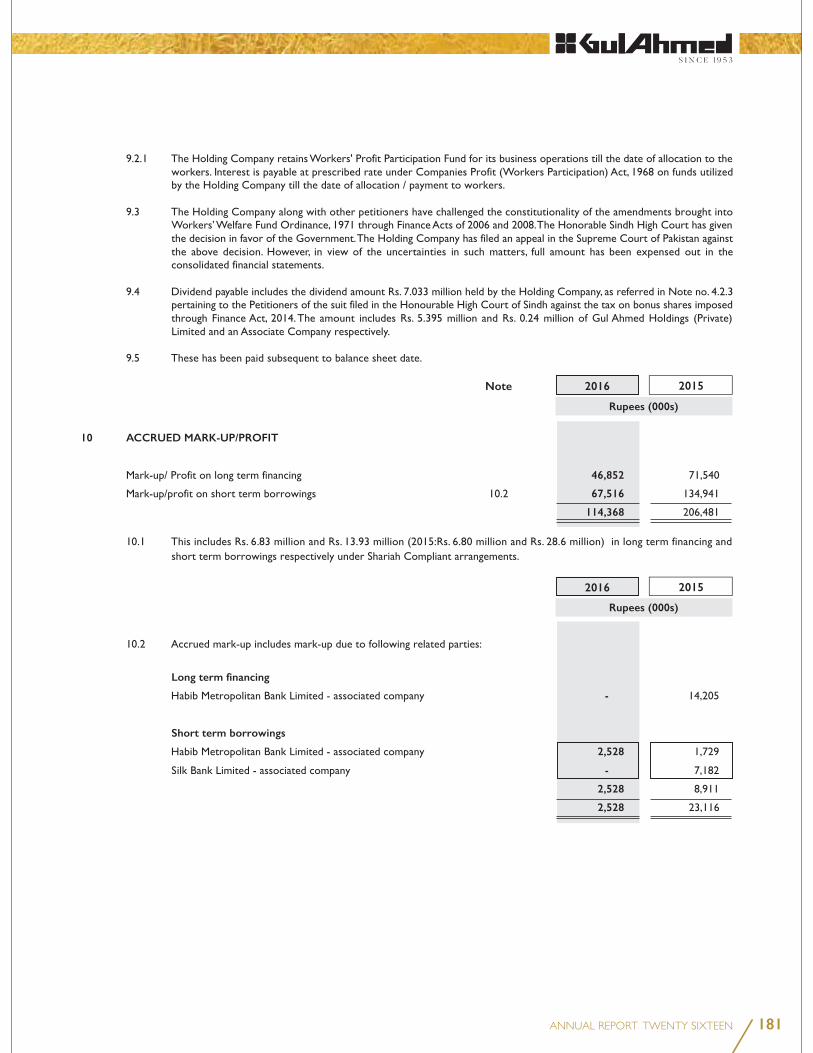
10 ACCRUED MARK-UP/PROFIT
46,852
67,516
114,368
Long term financing
-
Short term borrowings
2,528
-
2,528
2,528
Note
181

11 SHORT TERM BORROWINGS - SECURED
894,500
7,525,100
8,419,600
4,446,893
12,866,493
622,639
- 622,639
12 CONTINGENCIES AND COMMITMENTS
Rupees (000s)
2016 2015Note
Rupees (000s)
2016 2015
182

Rupees (000s)
2016 2015
12.8 Guarantees
12.9 Commitments
497,517
1,670,611
994,367
,162,495
13 PROPERTY, PLANT AND EQUIPMENT
10,524,519
1,545,089
12,069,608
Note
183
Rupees (000s)
2016 2015
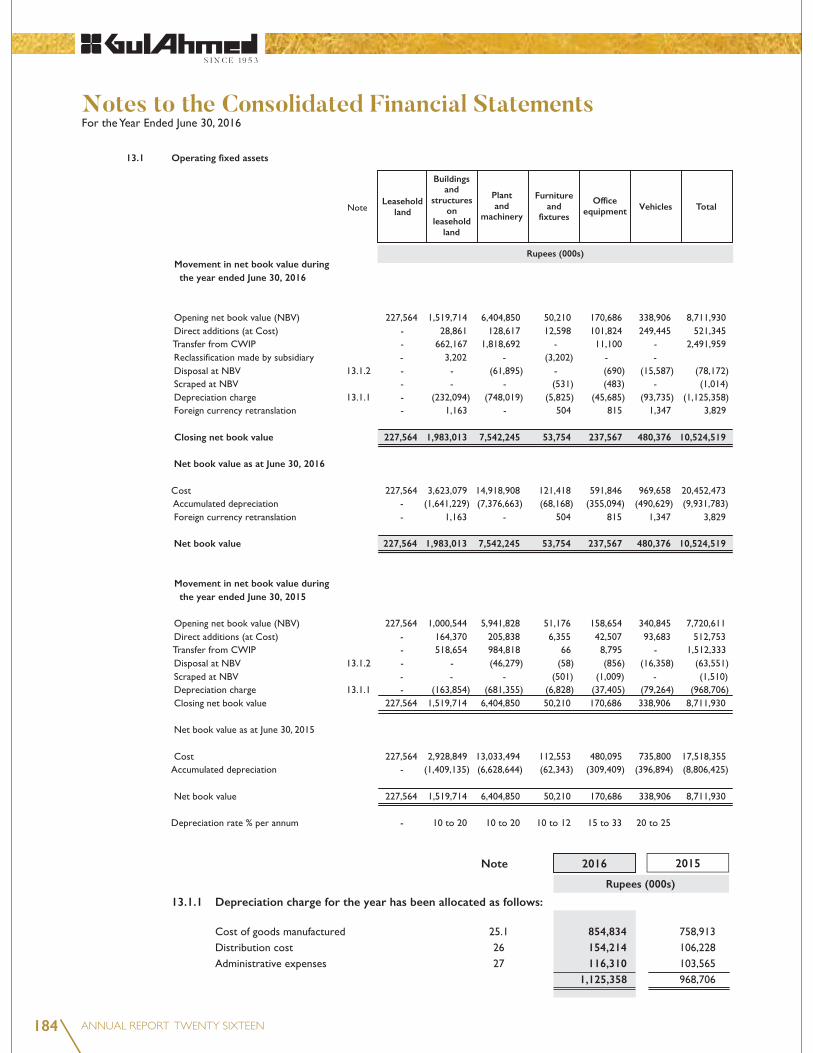
13.1 Operating fixed assets
Movement in net book value during the year ended June 30, 2016
Closing net book value 227,564 1,983,013 7,542,245 53,754 237,567 480,376 10,524,519
Net book value as at June 30, 2016
Net book value 227,564 1,983,013 7,542,245 53,754 237,567 480,376 10,524,519
Movement in net book value during the year ended June 30, 2015
13.1.1 Depreciation charge for the year has been allocated as follows:
854,834
154,214
116,310
1,125,358
Leasehold
land
Rupees (000s)
Buildingsand
structureson
leaseholdland
Plantand
machinery
Furnitureand
fixtures
Officeequipment Vehicles Total
Note
184

Modeof
disposal
Written downvalue
CostParticulars of assets Particulars of buyersSaleproceeds
(Loss)/gainon disposal
Rupees (000s)
Plant and machinery
Office equipment
13.1.2 Details of operating assets sold
185

Modeof
disposal
Written downvalue
CostParticulars of assets Particulars of buyersSaleproceeds
(Loss)/gainon disposal
Rupees (000s)
Vehicles
186
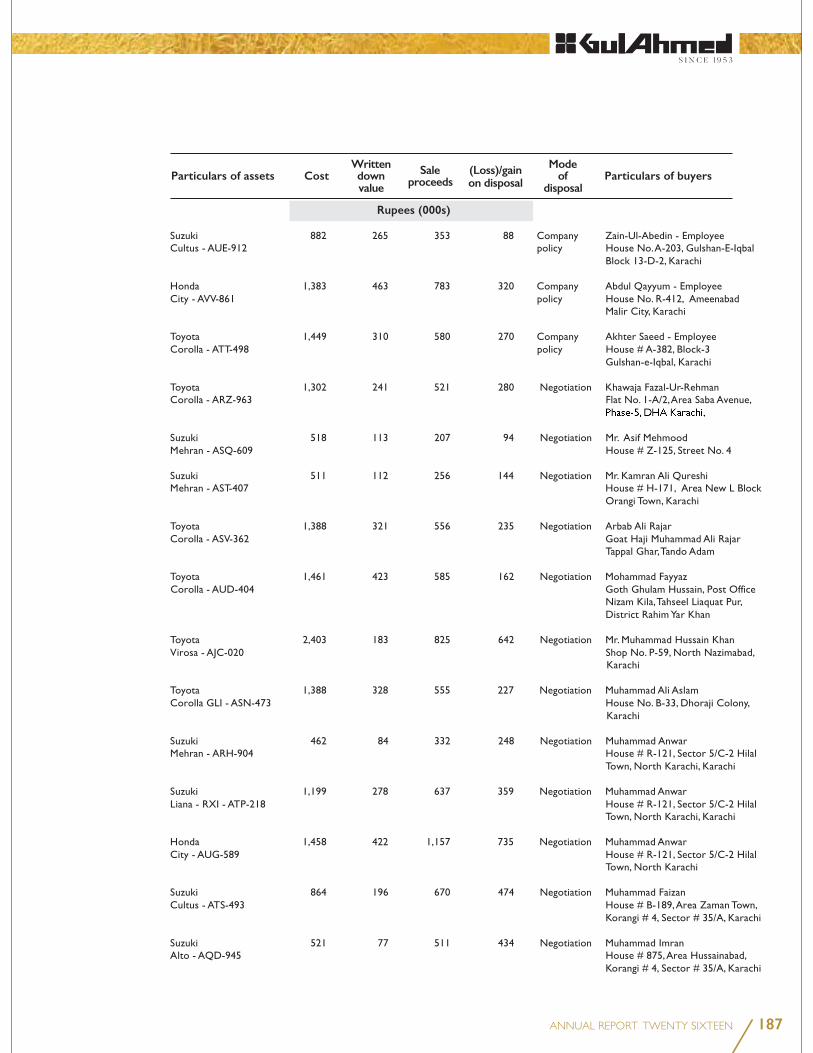
Modeof
disposal
Written downvalue
CostParticulars of assets Particulars of buyersSaleproceeds
(Loss)/gainon disposal
Rupees (000s)
187

Modeof
disposal
Written downvalue
CostParticulars of assets Particulars of buyersSaleproceeds
(Loss)/gainon disposal
Rupees (000s)
188
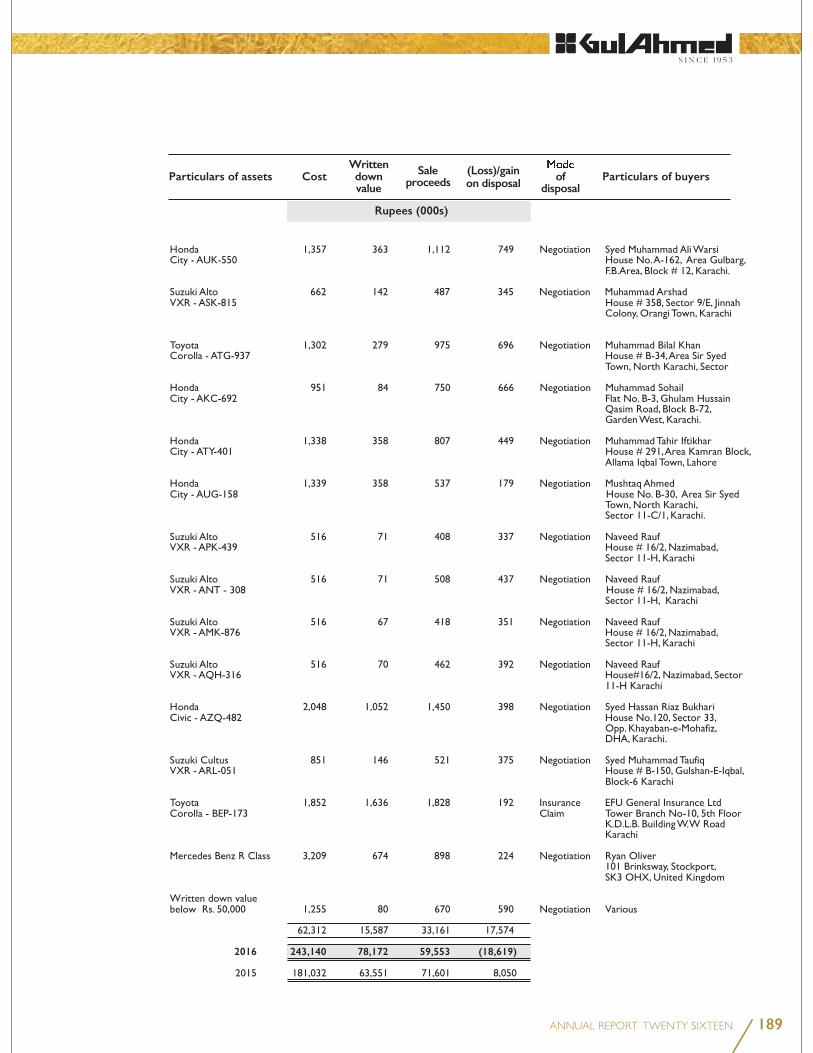
2016 243,140 78,172 59,553 (18,619)
ofdisposal
Written downvalue
CostParticulars of assets Particulars of buyersSaleproceeds
(Loss)/gainon disposal
Rupees (000s)
189

2016 2015
Rupees (000s)
Rupees (000s)
13.1.3 Details of net loss on disposal of property, plant and equipment
19,015
(37,634)
(18,619)
2016 2015ComputerSoftware
TradeMark
14 INTANGIBLE ASSETS
15,834 9,312 (7,130) 2,476 20,492 194,083 (176,067) 2,476 0,492
507
6,623
7,130
13.2 Capital work in progress
254,586 80,051 2,575 337,212
2,534,641 1,156,600 8,595 3,699,836
(1,818,692) (662,167) (11,100) (2,491,959)
Cost as at end 970,535 574,484 70 1,545,089
June 2016 June 2015
Rupees (000s)
Note
2016 2015
Rupees (000s)
Note
190

2016 2015
Rupees (000s)
Note
2016 2015
Rupees (000s)
2016 2015
Rupees (000s)
35,618
2,185
37,803
(15,122)
(861)
(15,983)
21,820
15.2 Reconciliation of carrying amount of loans to executives
20,725
28,344
-
(13,451)
35,618
16 LONG TERM DEPOSITS
Considered good 149,964
5,335
2,837
158,136
191

2016 2015
Rupees (000s)
2016 2015
Rupees (000s)
17 STORES, SPARE PARTS AND LOOSE TOOLS
564,426
450,956
3,749
1,019,131
(115,684)
903,447
17.1 Movement in provision for slow moving/obsolete items
101,039
4,645
115,684
18 STOCK-IN-TRADE
2,337,553
230,825
11,488,824
14,057,202
19 TRADE DEBTS
Export debtors - secured 1,939,039
Local debtors - unsecured 847,743
233,035
1,080,778
3,019,817
(233,035)
2,786,782
2,587
Note
Note
192

As at June 20161-6 monthsUpto 1 month
1,160 - 1,427 2,587
19.3 Movement in allowance for impairment of doubtful trade debts
198,210
34,825
33,035
20 LOANS AND ADVANCES
Considered Good
15,122
861
15,983
711,358
2,570
745,894
Rupees (000s)
As at June 20151-6 monthsUpto 1 month
Rupees (000s)
2016 2015
Rupees (000s)
Note
193

21 OTHER RECEIVABLES
354,615
6,918
33,409
-
36,142
4,625
475,709
22 TAX REFUNDS DUE FROM GOVERNMENT
798,468
115,492
913,960
23 CASH AND BANK BALANCES
158,998
86,845
93,823
180,668
339,666
65,153
-
65,153
2016 2015
Rupees (000s)
Note
194

24 SALES
12,397,822
20,212,199
443,211
20,655,410
272,628
33,325,860
(138,184)
33,187,676
25 COST OF SALES
9,148,067
27,283,518
578,907
37,010,492
(11,488,824)
25,521,668
25.1 Cost of goods manufactured
7,671,158
4,057,004
5,155,417
2,529,862
133,709
782,227
854,834
182,600
6,114,128
(203,630)
27,277,309
237,034
(230,825)
6,209
27,283,518
2016 2015
Rupees (000s)
Note
2016 2015
Rupees (000s)
Note
195

25.2 Raw materials consumed
2,076,097
7,932,614
(2,337,553)
7,671,158
26 DISTRIBUTION COST
922,308
257,699
26,415
954,054
-
203,630
602,839
154,214
507
49,327
114,637
3,285,630
27 ADMINISTRATIVE EXPENSES
681,905
205,088
71,714
119,688
143,453
206,165
54,558
51,857
122,359
62,164
116,310
6,623
4,294
12,753
25,786
34,825
14,645
162,109
2,096,296
2016 2015
Rupees (000s)
Note
196

Cost of sales Distribution Cost Administrative expense
Total
2016 2015 2016 2015 2016 2015 2016 2015
Rupees (000s)
5,012,297 900,881 655,986 6,569,164
Retirement benefits
34,342 - 2,243 36,585
69,848 20,561 21,410 111,819
104,190 20,561 23,653 148,404 38,930 866 2,266 42,062
5,155,417 22,308 681,905 6,759,630
Rupees (000s)
20152016
Rupees (000s)
20152016
27.2 Auditor's remuneration 1,500 110
200
55
39 112
2,044
234 4,294
Name of Director Interest in Donee Name of Donee
175
-
-
175
27.1 Staff cost
197

2015
Note Rupees (000s)
2016
28 OTHER OPERATING EXPENSES 71,671 27,235 - 37,634 1,014 137,554 29 OTHER INCOME Income from financial assets 1,371 - - - 102,974 104,345 Income from non-financial assets 19,015 18,428 10,917 1,968 50,328 154,673
30 FINANCE COST 288,156 512,458 - 3,358 106,076 5,795 915,843
26,210
19,725 3,162
22,887
198

2015
Note Rupees (000s)
2016
31 PROVISION FOR TAXATION
234,356
3,157
237,513
(34,394)
203,119
31.1 Reconciliation between accounting profit and tax expense 1,385,358 32% 443,315 (149,658) 3,157 (82,516) 33,453 1,566 (10,608) (12,766) 5,391 (33,367) (245,348) 197,967
32 EARNINGS PER SHARE - basic and diluted 1,182,239 267,132,058 4.43
33 SEGMENT INFORMATION
199

200
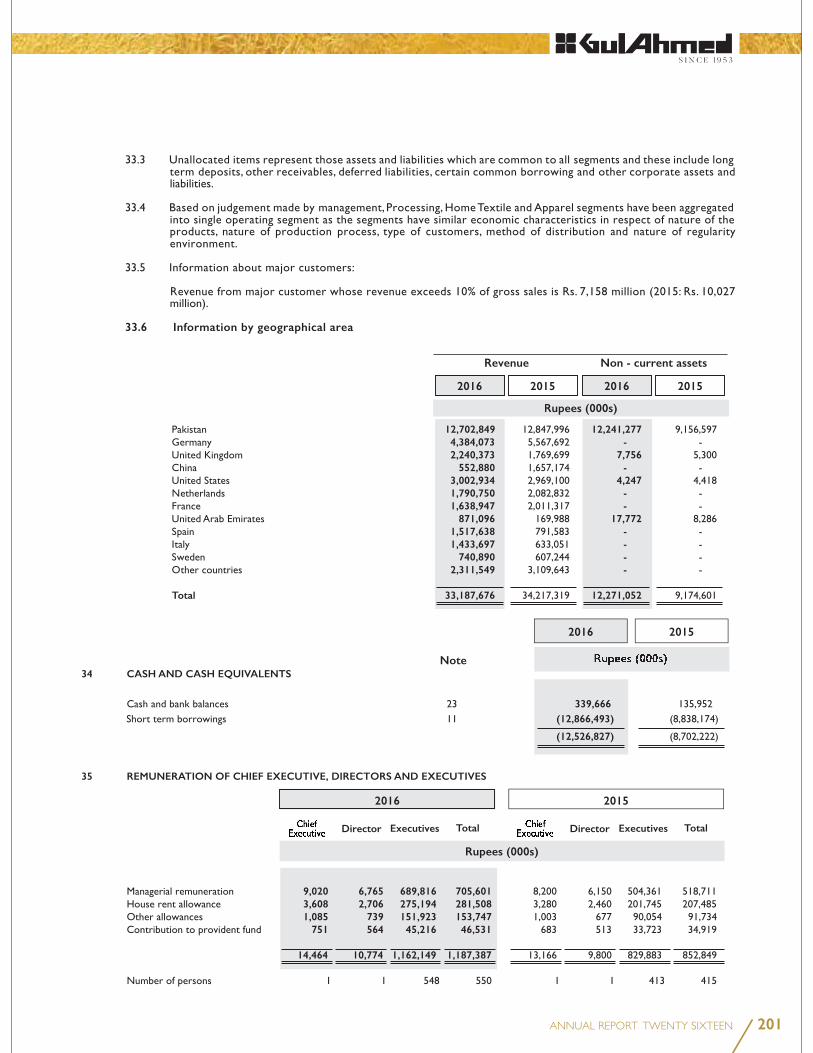
33.6 Information by geographical area
12,702,849 12,241,277
4,384,073 -
2,240,373 7,756
552,880 -
3,002,934 4,247
1,790,750 -
1,638,947 -
871,096 17,772
1,517,638 -
1,433,697 -
740,890 -
2,311,549 -
Total 33,187,676 12,271,052
34 CASH AND CASH EQUIVALENTS
339,666
(12,866,493)
(12,526,827)
Non - current assets
2016 2015 2016 2015
Revenue
Rupees (000s)
20152016
Note
Director Executives Total Director Executives Total
2016 2015
Rupees (000s)
35 REMUNERATION OF CHIEF EXECUTIVE, DIRECTORS AND EXECUTIVES
9,020 6,765 689,816 705,601
3,608 2,706 275,194 281,508
1,085 739 151,923 153,747
751 564 45,216 46,531
14,464 10,774 1,162,149 1,187,387
201

36 TRANSACTIONS AND BALANCES WITH RELATED PARTIES
Relationship with Nature of Transactions the Group
37,173
1,160
71,558
,500
47
175
4,590,010
31,693
49,097
113,463
24,388
36,961
Relationship with Nature of Outstanding Balances the Group
622,639
10,746
14,270
637,583
2,528
35,618
2,587
35,197
65,153
Rupees (000s)
20152016
202

2016 2015
Rupees (000s)
Rupees (000s)
37 CAPACITY AND PRODUCTION
Unit Capacity Production Working Capacity Production Working
48,237 32,440 3 shifts
159,205 111,940 3 shifts
38 FINANCIAL ASSETS AND LIABILITIES
Financial assets
Loans and receivables
10,878 15,886 26,764 5,105 5,934 11,039 37,803 - - - - 158,136 158,136 158,136 - - - 2,786,782 - 2,786,782 2,786,782 - - - 80,767 - 80,767 80,767 - - - 339,666 - 339,666 339,666 10,878 15,886 26,764 3,212,320 164,070 3,376,390 3,403,154
Financial liabilities
487,400 4,630,604 5,118,004 - - - 5,118,004 - - - - 41,346 41,346 41,346 12,866,493 - 12,866,493 - - - 12,866,493 75,029 - 75,029 4,874,822 - 4,874,822 4,949,851 - - - 114,368 - 114,368 114,368 13,428,922 4,630,604 18,059,526 4,989,190 41,346 5,030,536 23,090,062
Off balance sheet items
- - - 799,437 - 799,437 799,437 - - - 2,266,673 - 2,266,673 2,266,673 - - - 3,419,160 2,664,978 6,084,138 6,084,138 - - - 6,485,270 2,664,978 9,150,248 9,150,248
2016
Interest/mark-up/profit bearing
Maturityup to
one year
Maturityafter one
year
Subtotal
Maturityup to
one year
Maturityafter one
yearSub total Total
Non interest/mark-up/profit bearing
203

Financial assets
Loans and receivables
Financial liabilities
Off balance sheet items
2015
Interest/mark-up/profit bearing
Maturityup to
one year
Maturityafter one
yearSubtotal
Maturityup to
one year
Maturityafter one
year
Non interest/mark-up/profit bearing
39 FINANCIAL INSTRUMENTS AND RELATED DISCLOSURES
Financial risk management objectives
39.1 Market risks
Rupees (000s)
Sub total Total
204

2015
000s
2016
2015
Equivalent USD 000s
2016
a) Currency risk
Exposure to foreign currency risk
18,520
896
(8,527)
(1,589)
9,300
7,420
7,191
912,410
1,993
-
Rupee per USD 104.80 104.90 / 104.70 Foreign currency sensitivity analysis
b) Interest/mark-up rate risk
205

Cash flow sensitivity analysis for variable rate instruments
Fair value sensitivity analysis for fixed rate instruments
c) Other price risk
39.2 Credit risk
Exposure to credit risk
37,803
158,136
2,786,782
80,767
180,668
3,244,156
Loans and advances
20152016Note
Rupees (000s)
206
Long Term Deposits
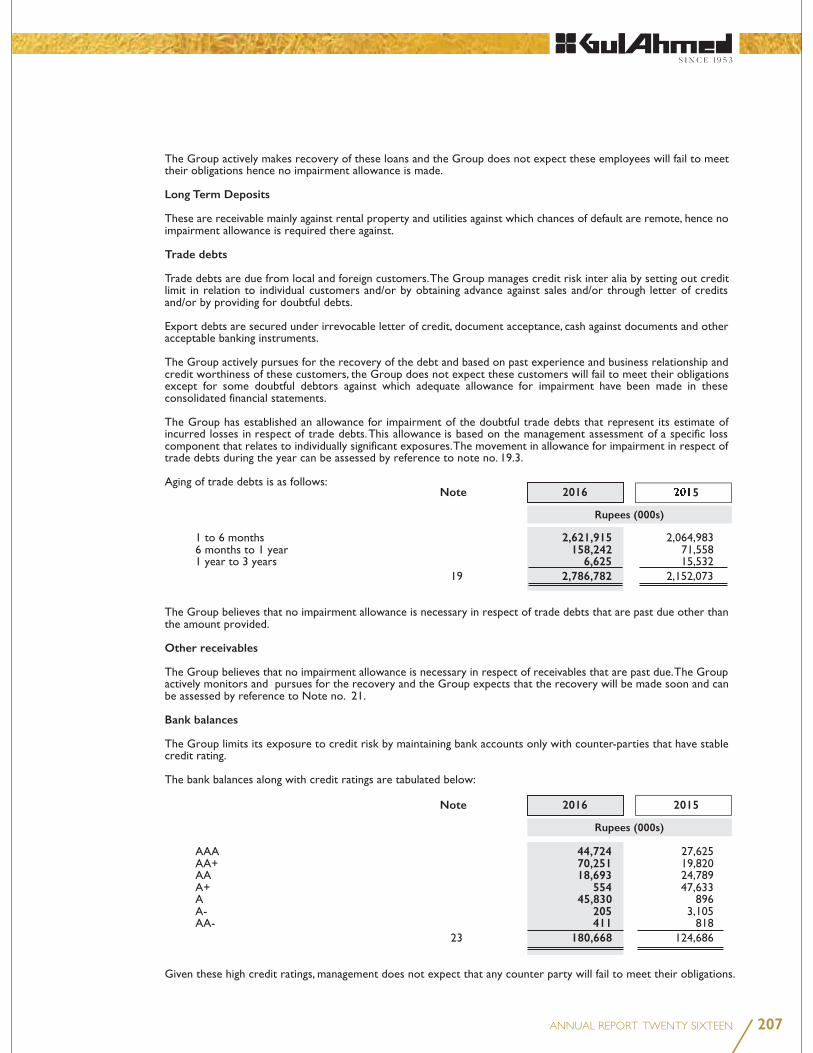
Trade debts
2,621,915 158,242 6,625
2,786,782
Other receivables
Bank balances
44,724 70,251 18,693 554 45,830 205 411
180,668
52016Note
Rupees (000s)
20152016Note
Rupees (000s)
207

Rupees (000s)
20152016
Financial assets that are either past due or impaired
39.3 Liquidity risk
39.4 Capital risk management
17,984,497
(339,666)
17,644,831
8,981,011
26,625,842
66
40 FAIR VALUES
208

20152016
41 PROVIDENT FUND RELATED DISCLOSURES
Un-audited
851,930
721,812
84.73%
777,547
78,014 10.03%
437,017 57.05%
130,650 16.80%
63,509 8.17%
68,357 8.79%
777,547 100.84%
Note
2015
Rupees (000s) Percentage
Un-audited
2016
209
42 EVENT AFTER BALANCE SHEET DATE
43 NUMBER OF PERSONS EMPLOYED
44 DATE OF AUTHORIZATION
45 GENERAL
MOHOMED BASHIR
MOHAMMED ZAKI BASHIR
210

211

Definitions
Profitability Ratios
Liquidity Ratios
Turnover Ratios
Investment/Market Ratios
Capital Structure Ratios
212

Notes:
