webinar: survey of nurse employers in california
TRANSCRIPT

The End of the Shortage? Emerging Trends in California’s RN Labor Market
April 28, 2015
Today’s presenters
§ Joanne Spetz
• Professor at the Philip R. Lee Institute for Health Policy Studies, University of California, San Francisco
§ Teri Hollingsworth
• Vice President, Human Resources Services, Hospital Association of Southern California
§ Judee Berg
• Executive Director of the California Institute for Nursing & Health Care
2
Goals for this webinar
§ Assess how the economic recovery is affecting demand for RNs in California
• Learn how Chief Nursing Officers perceive the current RN labor market
• Track the latest hospital vacancy and turnover data
• Understand how recently-graduated nurses are faring
§ Identify next steps for ensuring an adequate nurse supply
3
The collaboration § Betty Irene Moore Nursing Initiative
§ Philip R. Lee Institute for Health Policy Studies, University of California, San Francisco
§ California Institute for Nursing & Health Care
§ Hospital Association of Southern California
§ Acknowledgements & thanks to…
• California Hospital Association
• Hospital Council of Northern & Central California
• FutureSense Inc.
• Hospital Association of San Diego & Imperial Counties
• UCSF Staff & Interns: Tim Bates, Lela Chu, Jesse Smith
4
What is going on in our RN labor market?
§ Reports of nurse surplus 2009-now
• Newspaper stories of new graduates who are unemployed
• Shortage may not have ended in some states
§ Emerging reports of shortage
• Anecdotes about using more contract nurses
• Potential mismatch between needs and skills
§ What will happen next?
• Is the economic recovery changing the situation?
• Is the Affordable Care Act changing the situation?
5
Goals for this webinar
§ Assess how the economic recovery is affecting demand for RNs in California
• Learn how Chief Nursing Officers perceive the current RN labor market
• Track the latest hospital vacancy and turnover data
• Understand how recently-graduated nurses are faring
§ Identify next steps for ensuring an adequate nurse supply
6
Survey of Chief Nursing Officers
§ Fielded by UCSF
§ Funded by Gordon & Betty Moore Foundation
§ Web-based survey with option to return paper survey via fax or email
§ Questions based on previous CINHC survey and National Forum of State Nursing Centers “Minimum Demand Data Set” recommendations
§ 7 surveys conducted
• Fall 2010, Spring 2011, Fall 2011, Spring 2012, Fall 2012, Fall 2013, Fall 2014
• Fall 2014 survey: 207 CNO responses, 238 HR Director responses
7
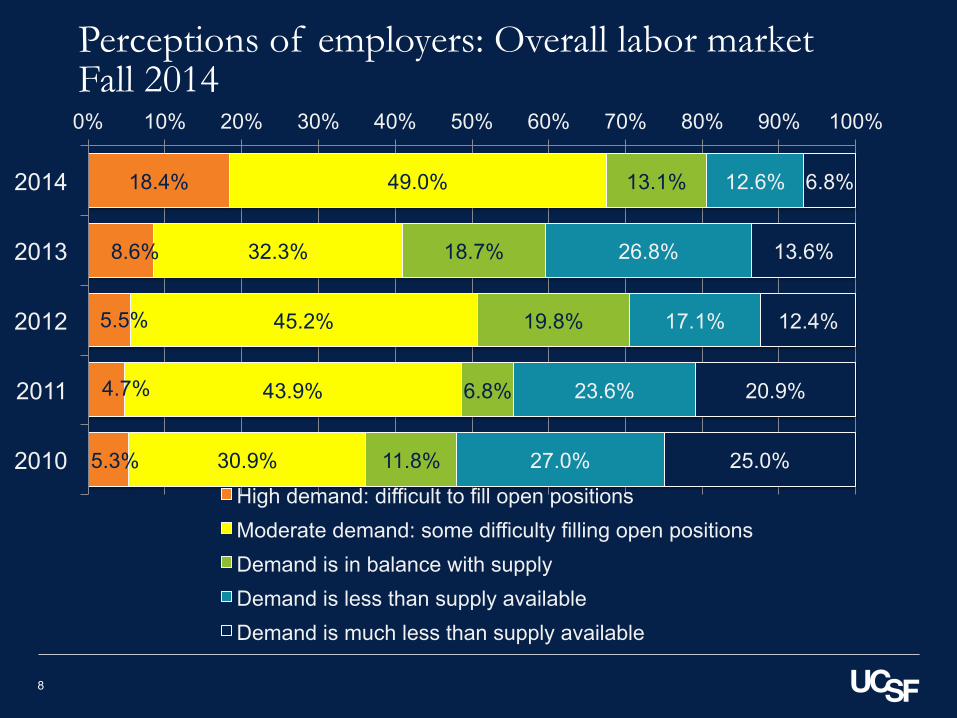
Perceptions of employers: Overall labor market Fall 2014
18.4%
8.6%
5.5%
4.7%
5.3%
49.0%
32.3%
45.2%
43.9%
30.9%
13.1%
18.7%
19.8%
6.8%
11.8%
12.6%
26.8%
17.1%
23.6%
27.0%
6.8%
13.6%
12.4%
20.9%
25.0%
0% 10% 20% 30% 40% 50% 60% 70% 80% 90% 100%
2014
2013
2012
2011
2010 High demand: difficult to fill open positions Moderate demand: some difficulty filling open positions Demand is in balance with supply Demand is less than supply available Demand is much less than supply available
8
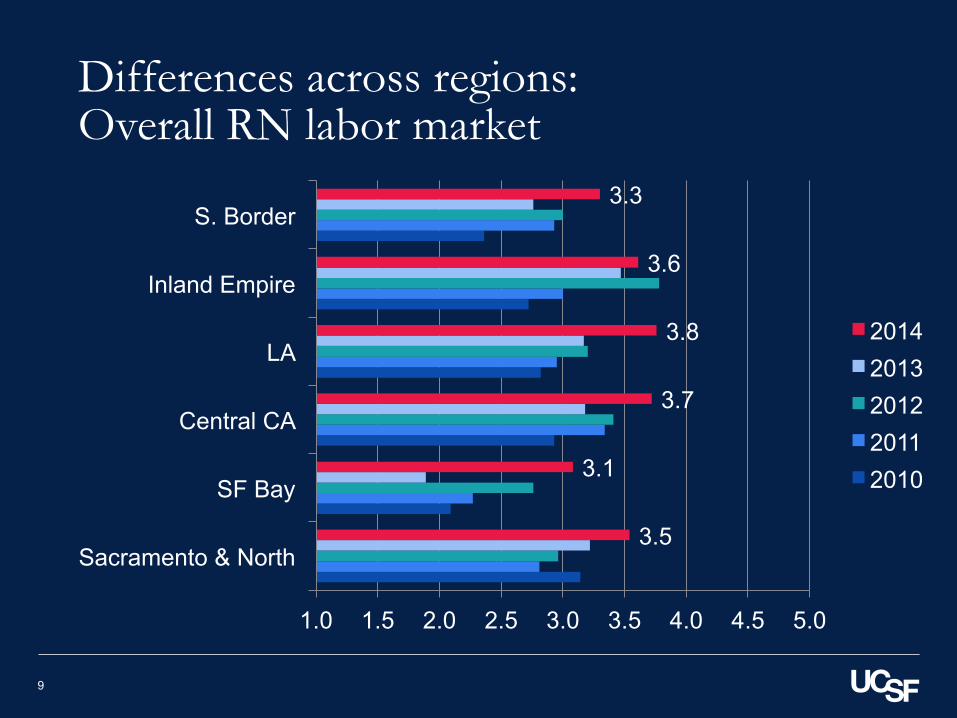
Differences across regions: Overall RN labor market
9
3.5
3.1
3.7
3.8
3.6
3.3
1.0 1.5 2.0 2.5 3.0 3.5 4.0 4.5 5.0
Sacramento & North
SF Bay
Central CA
LA
Inland Empire
S. Border
2014 2013 2012 2011 2010

Differences across regions: Experienced RNs
10
4.17
3.79
4.21
4.17
4.14
3.70
1.00 1.50 2.00 2.50 3.00 3.50 4.00 4.50 5.00
Sacramento & North
SF Bay
Central CA
LA
Inland Empire
S. Border
2014 2013
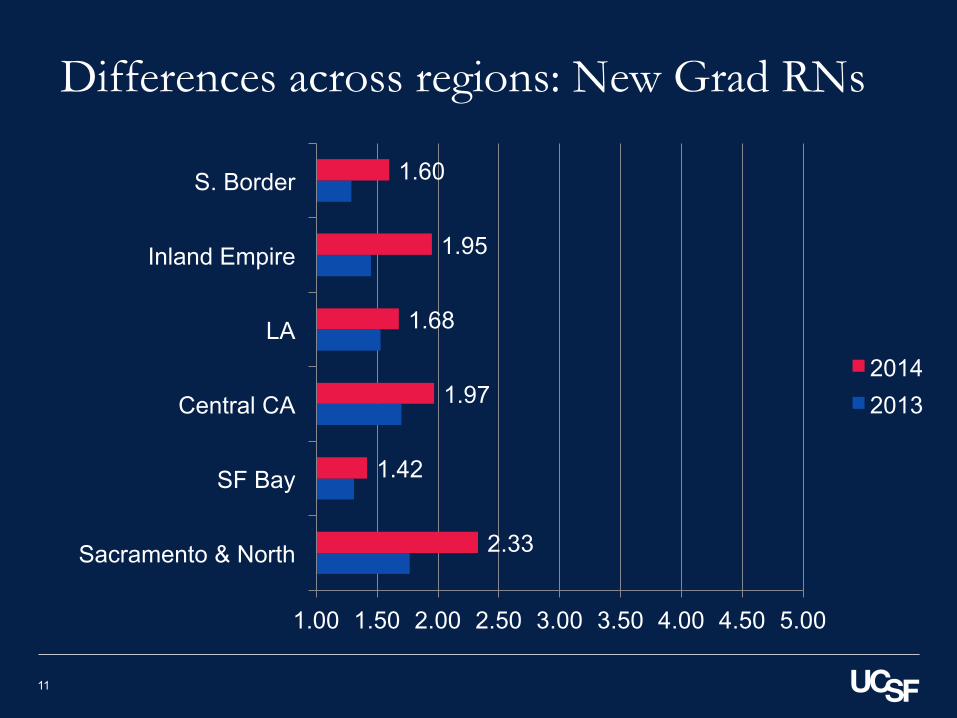
Differences across regions: New Grad RNs
11
2.33
1.42
1.97
1.68
1.95
1.60
1.00 1.50 2.00 2.50 3.00 3.50 4.00 4.50 5.00
Sacramento & North
SF Bay
Central CA
LA
Inland Empire
S. Border
2014 2013
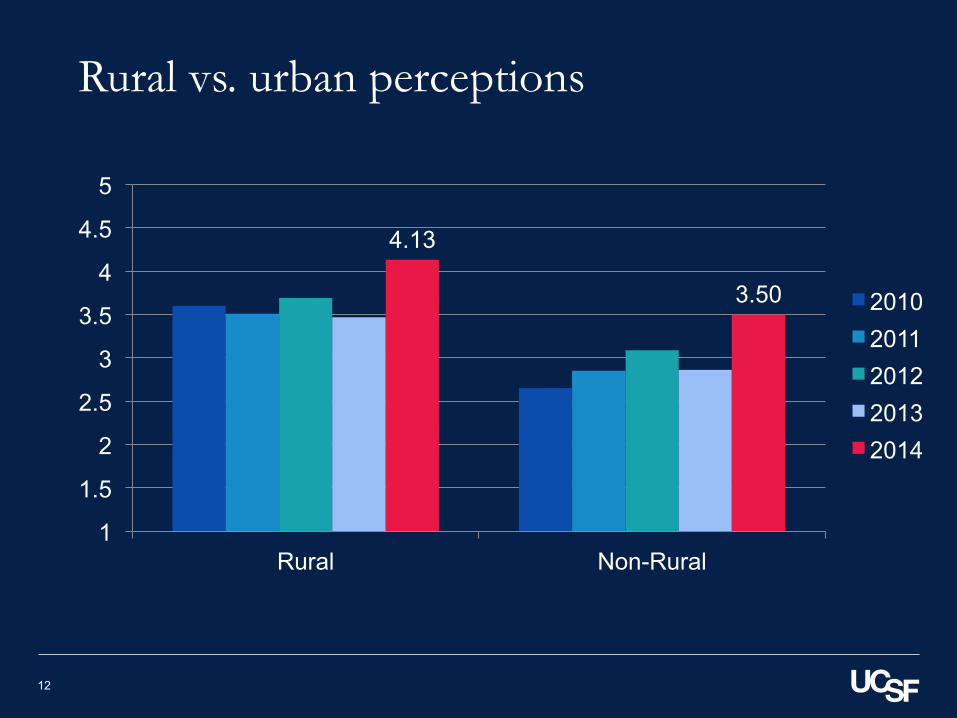
Rural vs. urban perceptions
4.13
3.50
1
1.5
2
2.5
3
3.5
4
4.5
5
Rural Non-Rural
2010 2011 2012 2013 2014
12 Higher number = more shortage
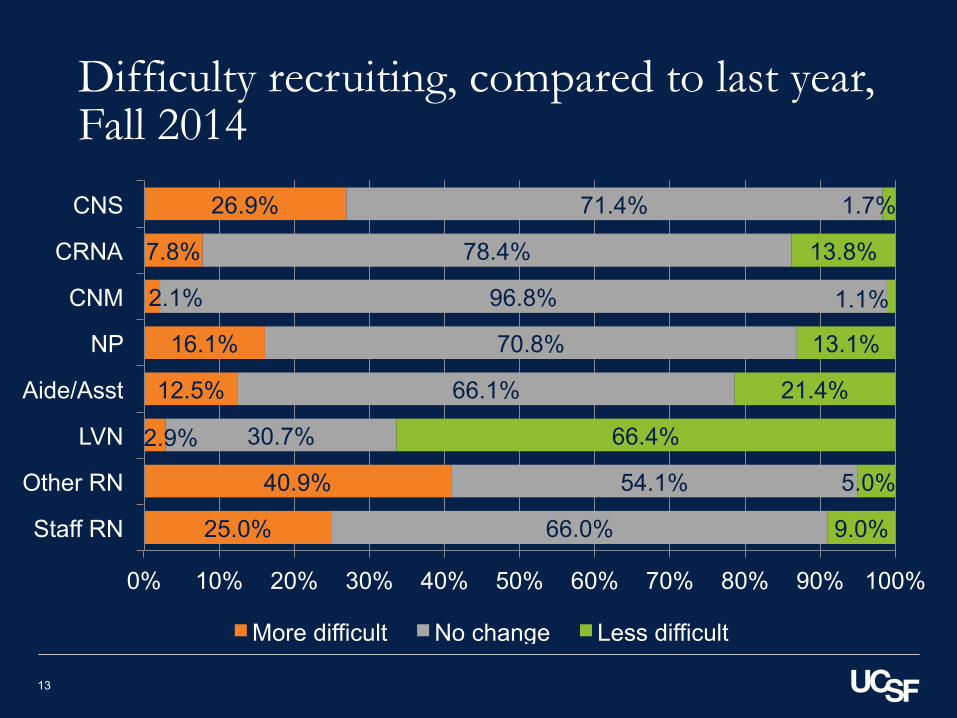
Difficulty recruiting, compared to last year, Fall 2014
25.0%
40.9%
2.9%
12.5%
16.1%
2.1%
7.8%
26.9%
66.0%
54.1%
30.7%
66.1%
70.8%
96.8%
78.4%
71.4%
9.0%
5.0%
66.4%
21.4%
13.1%
1.1%
13.8%
1.7%
0% 10% 20% 30% 40% 50% 60% 70% 80% 90% 100%
Staff RN
Other RN
LVN
Aide/Asst
NP
CNM
CRNA
CNS
More difficult No change Less difficult
13
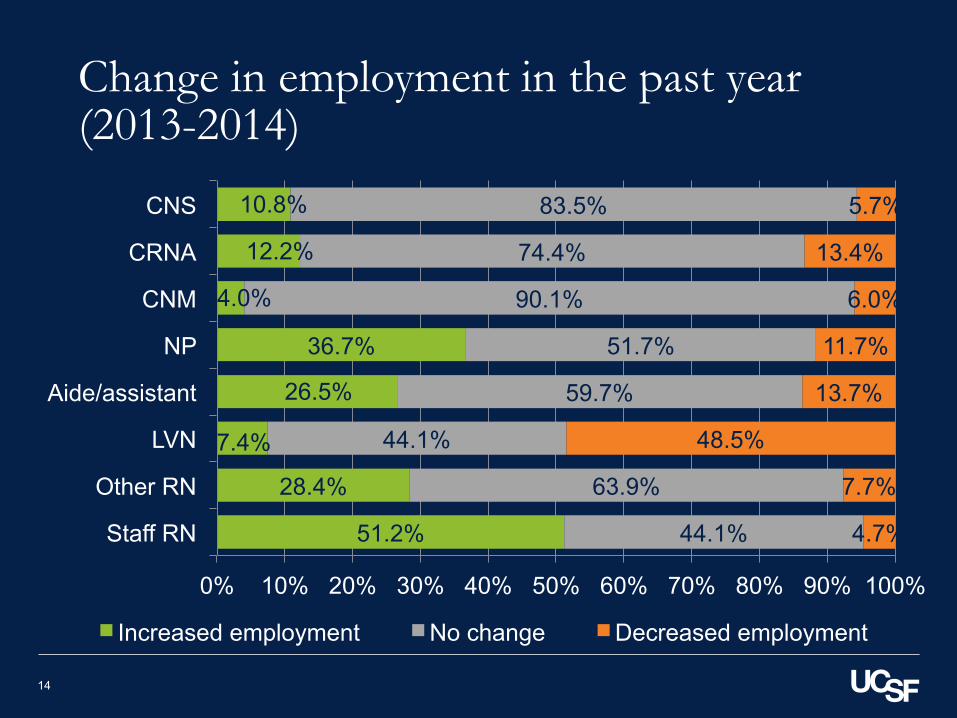
Change in employment in the past year (2013-2014)
51.2%
28.4%
7.4%
26.5%
36.7%
4.0%
12.2%
10.8%
44.1%
63.9%
44.1%
59.7%
51.7%
90.1%
74.4%
83.5%
4.7%
7.7%
48.5%
13.7%
11.7%
6.0%
13.4%
5.7%
0% 10% 20% 30% 40% 50% 60% 70% 80% 90% 100%
Staff RN
Other RN
LVN
Aide/assistant
NP
CNM
CRNA
CNS
Increased employment No change Decreased employment
14
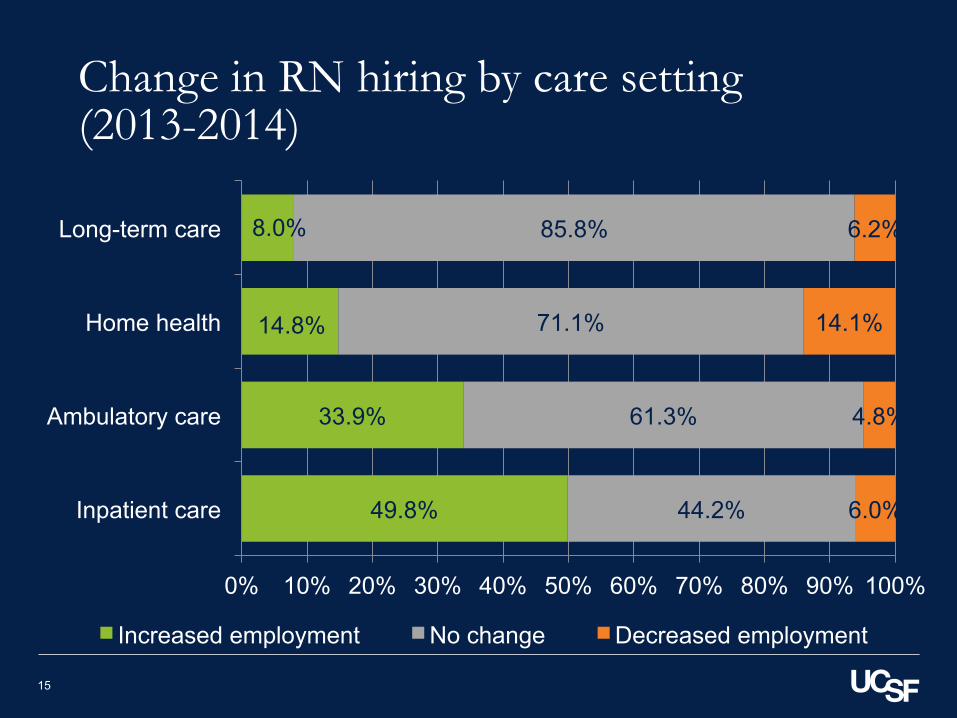
Change in RN hiring by care setting (2013-2014)
49.8%
33.9%
14.8%
8.0%
44.2%
61.3%
71.1%
85.8%
6.0%
4.8%
14.1%
6.2%
0% 10% 20% 30% 40% 50% 60% 70% 80% 90% 100%
Inpatient care
Ambulatory care
Home health
Long-term care
Increased employment No change Decreased employment
15
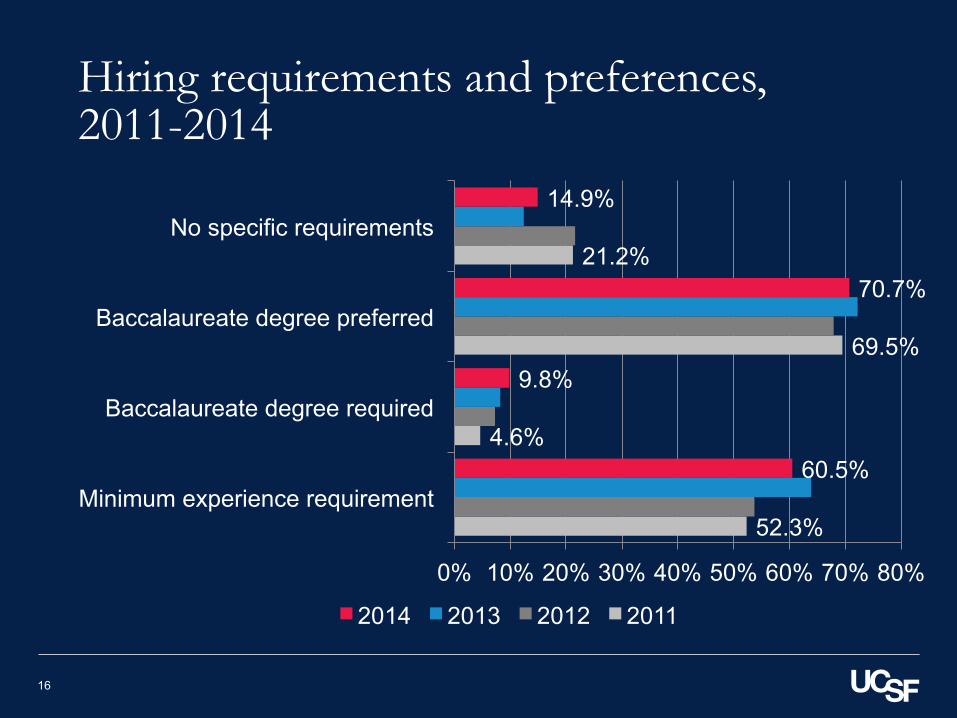
Hiring requirements and preferences, 2011-2014
52.3%
4.6%
69.5%
21.2%
60.5%
9.8%
70.7%
14.9%
0% 10% 20% 30% 40% 50% 60% 70% 80%
Minimum experience requirement
Baccalaureate degree required
Baccalaureate degree preferred
No specific requirements
2014 2013 2012 2011
16
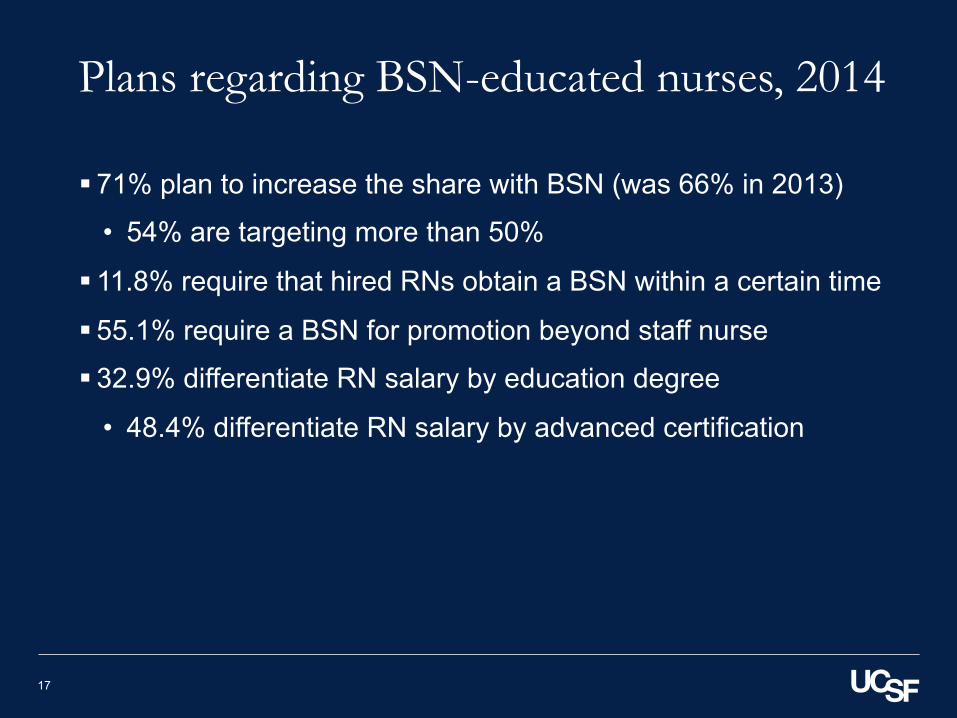
Plans regarding BSN-educated nurses, 2014
§ 71% plan to increase the share with BSN (was 66% in 2013)
• 54% are targeting more than 50%
§ 11.8% require that hired RNs obtain a BSN within a certain time
§ 55.1% require a BSN for promotion beyond staff nurse
§ 32.9% differentiate RN salary by education degree
• 48.4% differentiate RN salary by advanced certification
17
Challenges to increasing the share of BSN-educated RNs
§ Most common barriers to increasing share with BSN:
• Low supply of BSN-educated RNs in community
• Lack of tuition reimbursement funds
• Lack of funds for financial incentives
• Lack of interest among RNs
18
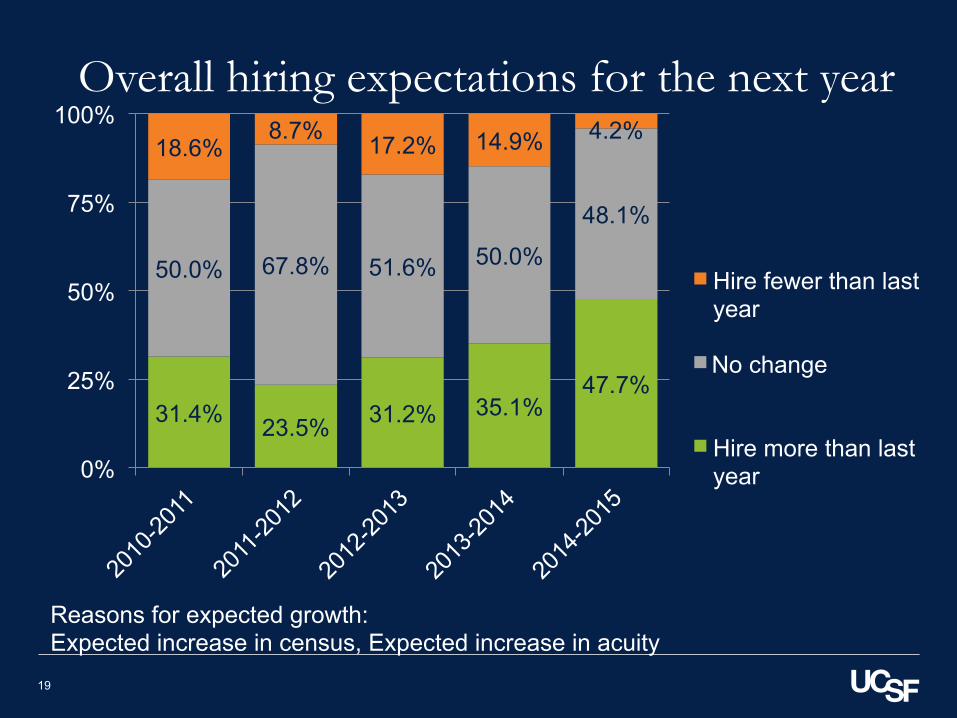
Overall hiring expectations for the next year
31.4% 23.5% 31.2% 35.1% 47.7%
50.0% 67.8% 51.6% 50.0%
48.1%
18.6% 8.7% 17.2% 14.9% 4.2%
0%
25%
50%
75%
100%
Hire fewer than last year
No change
Hire more than last year
19
Reasons for expected growth: Expected increase in census, Expected increase in acuity
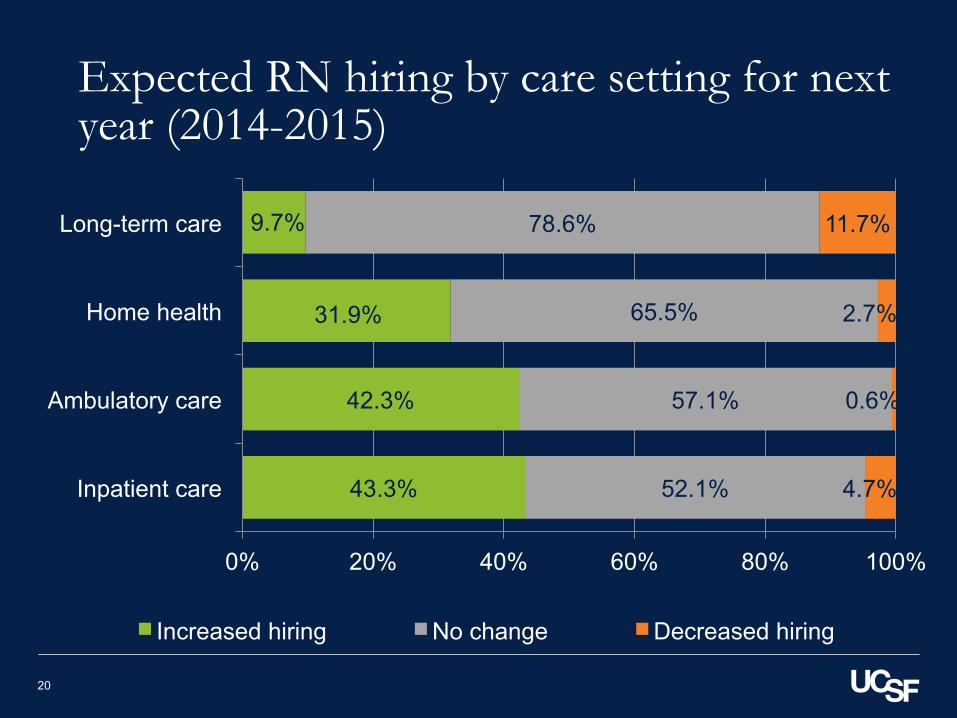
Expected RN hiring by care setting for next year (2014-2015)
43.3%
42.3%
31.9%
9.7%
52.1%
57.1%
65.5%
78.6%
4.7%
0.6%
2.7%
11.7%
0% 20% 40% 60% 80% 100%
Inpatient care
Ambulatory care
Home health
Long-term care
Increased hiring No change Decreased hiring
20
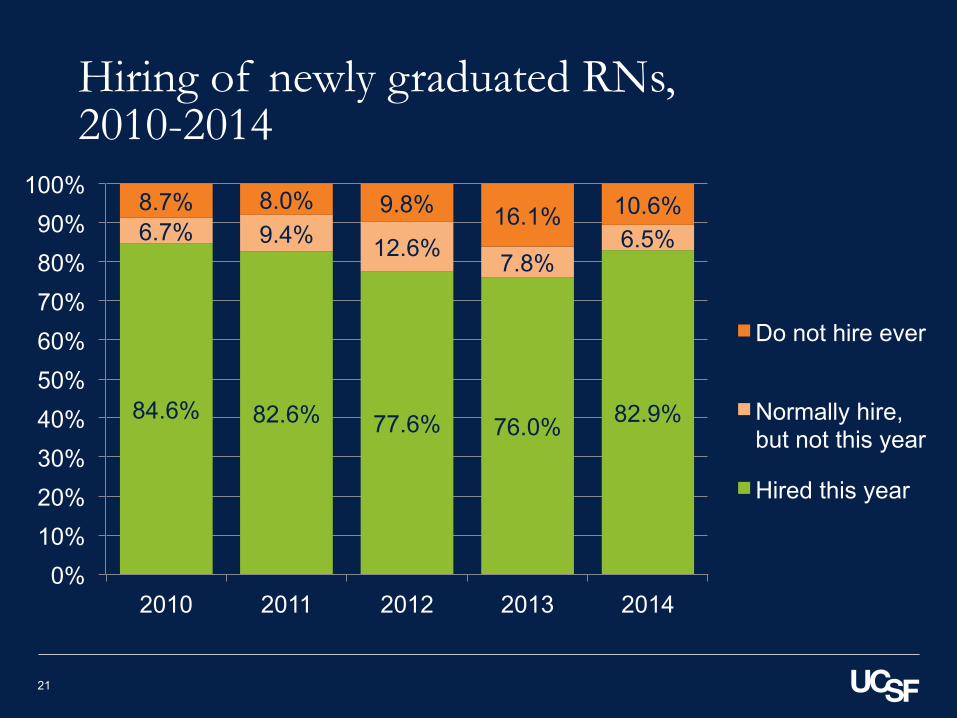
Hiring of newly graduated RNs, 2010-2014
84.6% 82.6% 77.6% 76.0% 82.9%
6.7% 9.4% 12.6% 7.8% 6.5%
8.7% 8.0% 9.8% 16.1% 10.6%
0% 10% 20% 30% 40% 50% 60% 70% 80% 90%
100%
2010 2011 2012 2013 2014
Do not hire ever
Normally hire, but not this year
Hired this year
21
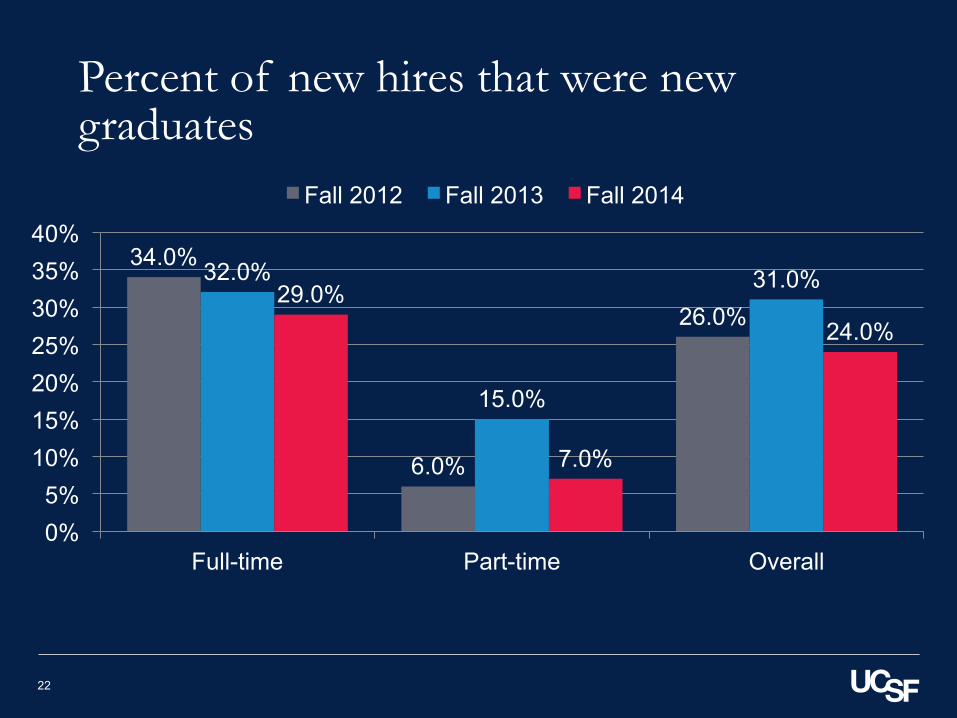
Percent of new hires that were new graduates
34.0%
6.0%
26.0%
32.0%
15.0%
31.0% 29.0%
7.0%
24.0%
0% 5%
10% 15% 20% 25% 30% 35% 40%
Full-time Part-time Overall
Fall 2012 Fall 2013 Fall 2014
22
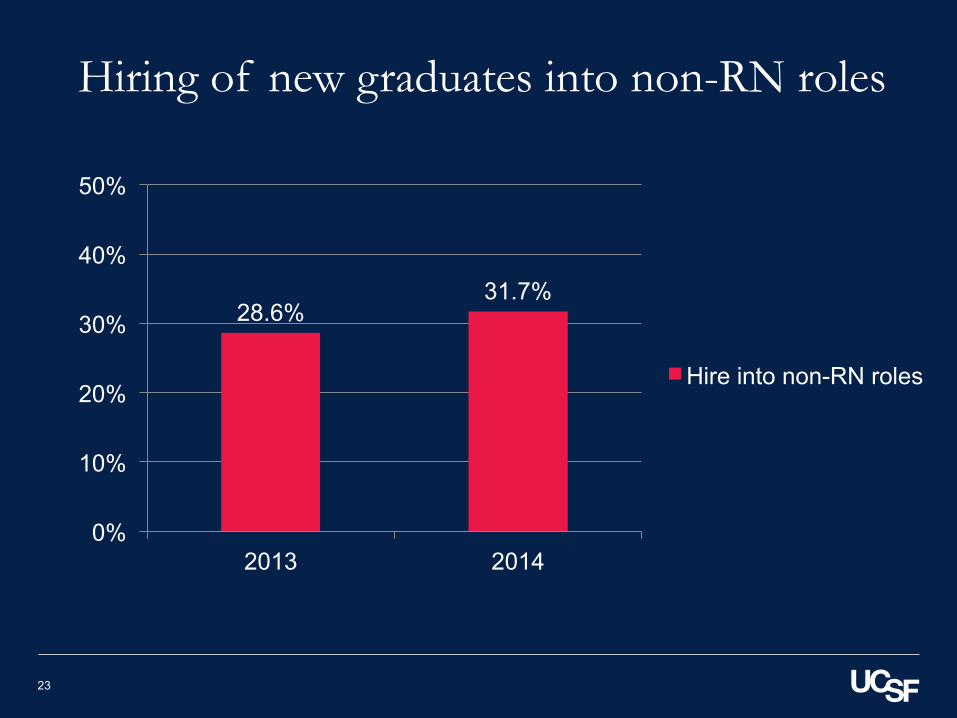
Hiring of new graduates into non-RN roles
28.6% 31.7%
0%
10%
20%
30%
40%
50%
2013 2014
Hire into non-RN roles
23
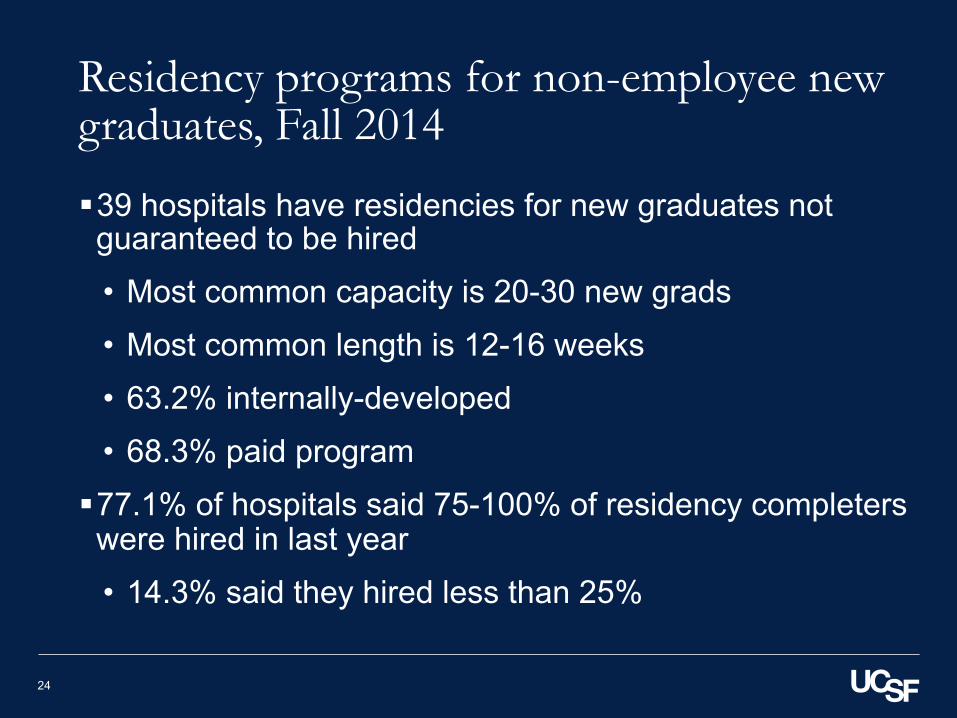
Residency programs for non-employee new graduates, Fall 2014
§ 39 hospitals have residencies for new graduates not guaranteed to be hired
• Most common capacity is 20-30 new grads
• Most common length is 12-16 weeks
• 63.2% internally-developed
• 68.3% paid program
§ 77.1% of hospitals said 75-100% of residency completers were hired in last year
• 14.3% said they hired less than 25%
24
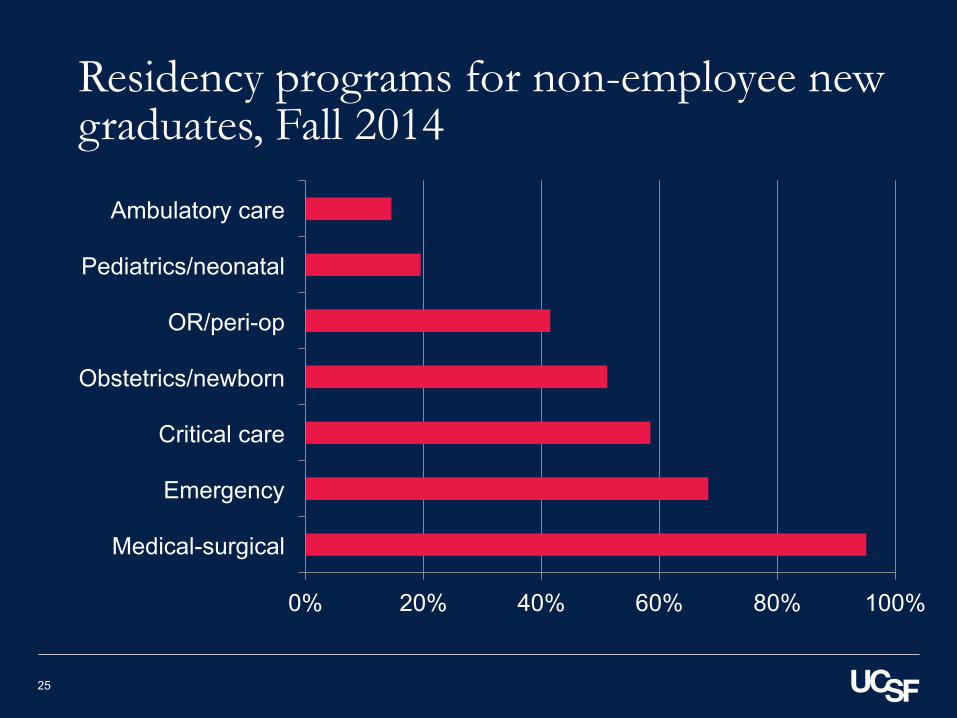
Residency programs for non-employee new graduates, Fall 2014
0% 20% 40% 60% 80% 100%
Medical-surgical
Emergency
Critical care
Obstetrics/newborn
OR/peri-op
Pediatrics/neonatal
Ambulatory care
25
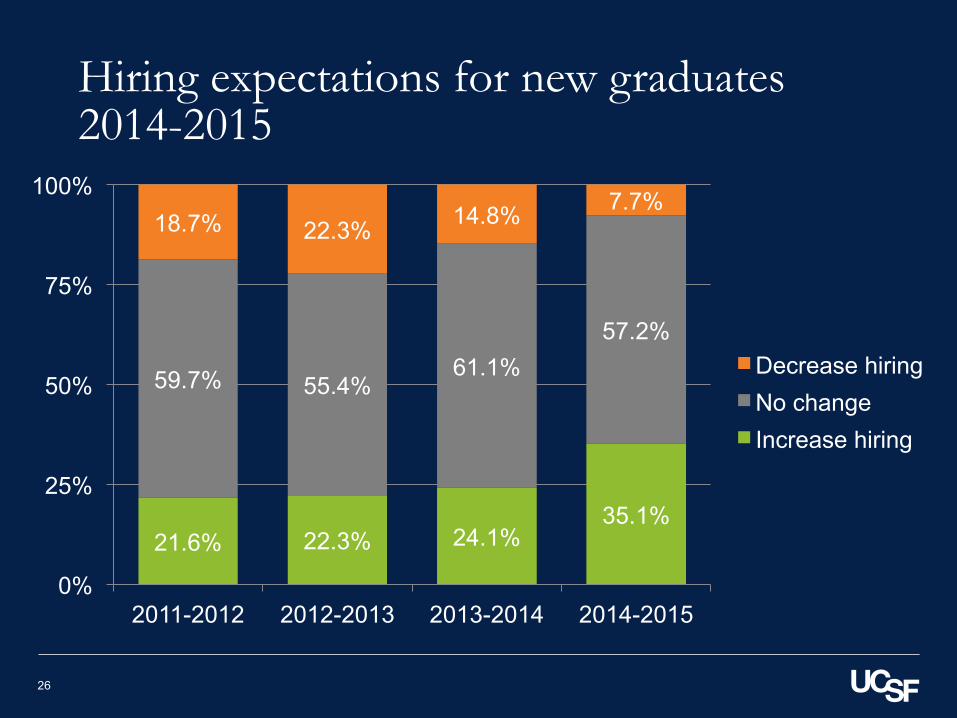
Hiring expectations for new graduates 2014-2015
21.6% 22.3% 24.1% 35.1%
59.7% 55.4% 61.1%
57.2%
18.7% 22.3% 14.8% 7.7%
0%
25%
50%
75%
100%
2011-2012 2012-2013 2013-2014 2014-2015
Decrease hiring No change Increase hiring
26
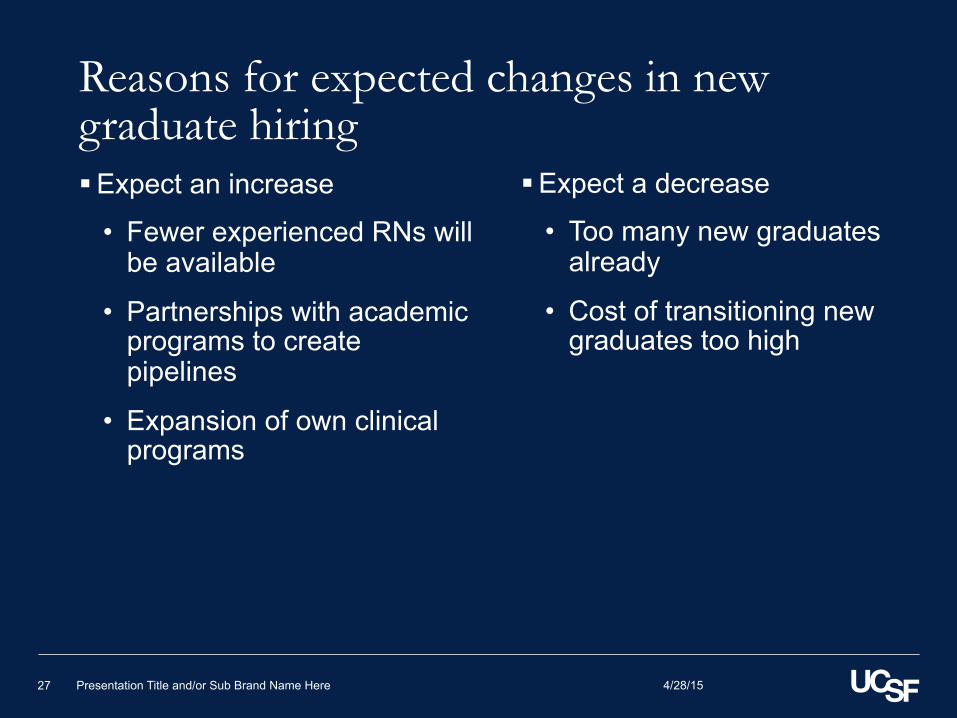
Reasons for expected changes in new graduate hiring § Expect an increase
• Fewer experienced RNs will be available
• Partnerships with academic programs to create pipelines
• Expansion of own clinical programs
§ Expect a decrease
• Too many new graduates already
• Cost of transitioning new graduates too high
4/28/15 Presentation Title and/or Sub Brand Name Here 27
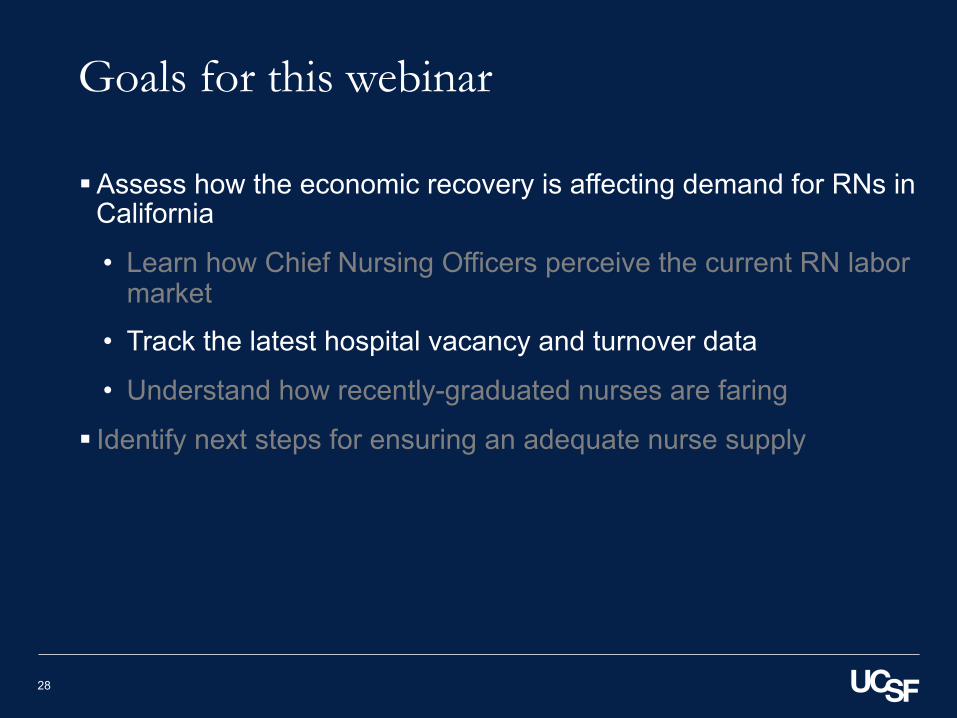
Goals for this webinar
§ Assess how the economic recovery is affecting demand for RNs in California
• Learn how Chief Nursing Officers perceive the current RN labor market
• Track the latest hospital vacancy and turnover data
• Understand how recently-graduated nurses are faring
§ Identify next steps for ensuring an adequate nurse supply
28
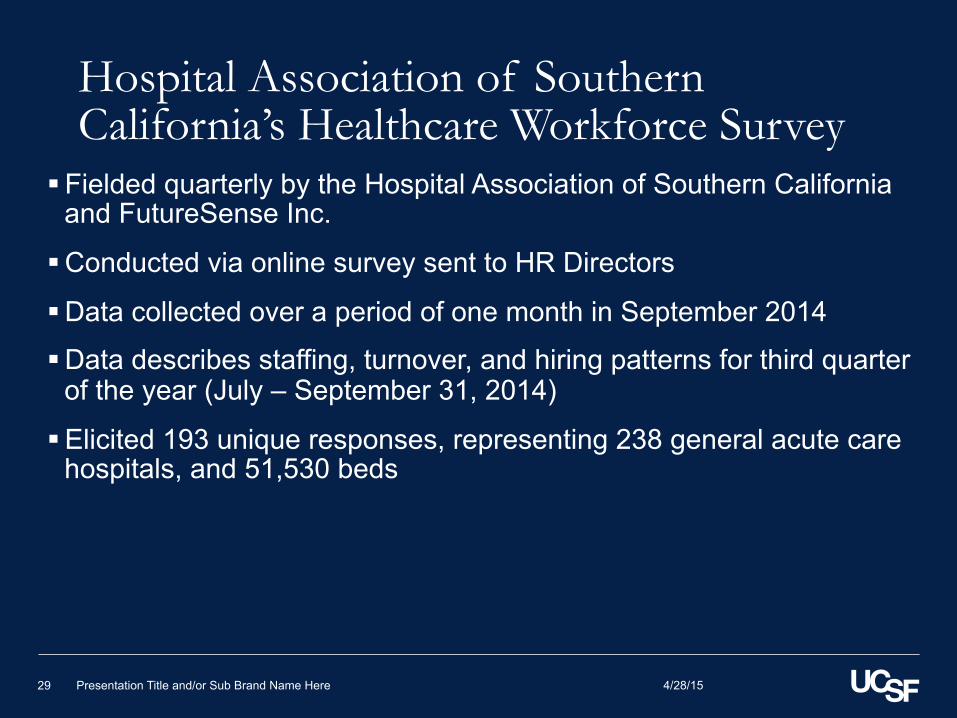
Hospital Association of Southern California’s Healthcare Workforce Survey
§ Fielded quarterly by the Hospital Association of Southern California and FutureSense Inc.
§ Conducted via online survey sent to HR Directors
§ Data collected over a period of one month in September 2014
§ Data describes staffing, turnover, and hiring patterns for third quarter of the year (July – September 31, 2014)
§ Elicited 193 unique responses, representing 238 general acute care hospitals, and 51,530 beds
4/28/15 Presentation Title and/or Sub Brand Name Here 29
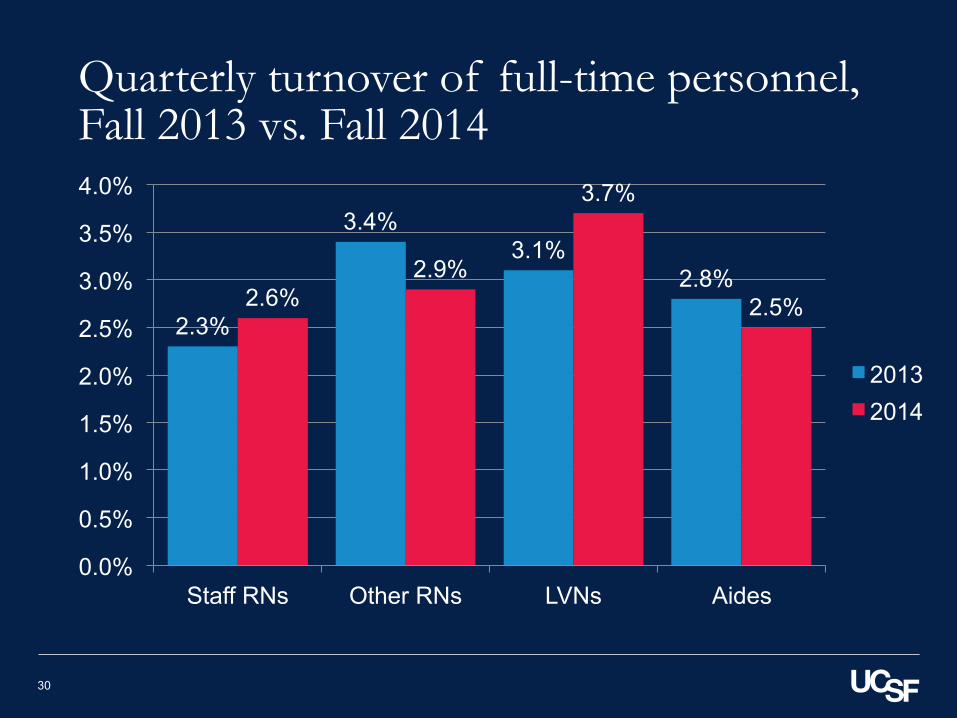
Quarterly turnover of full-time personnel, Fall 2013 vs. Fall 2014
2.3%
3.4% 3.1%
2.8% 2.6%
2.9%
3.7%
2.5%
0.0%
0.5%
1.0%
1.5%
2.0%
2.5%
3.0%
3.5%
4.0%
Staff RNs Other RNs LVNs Aides
2013 2014
30
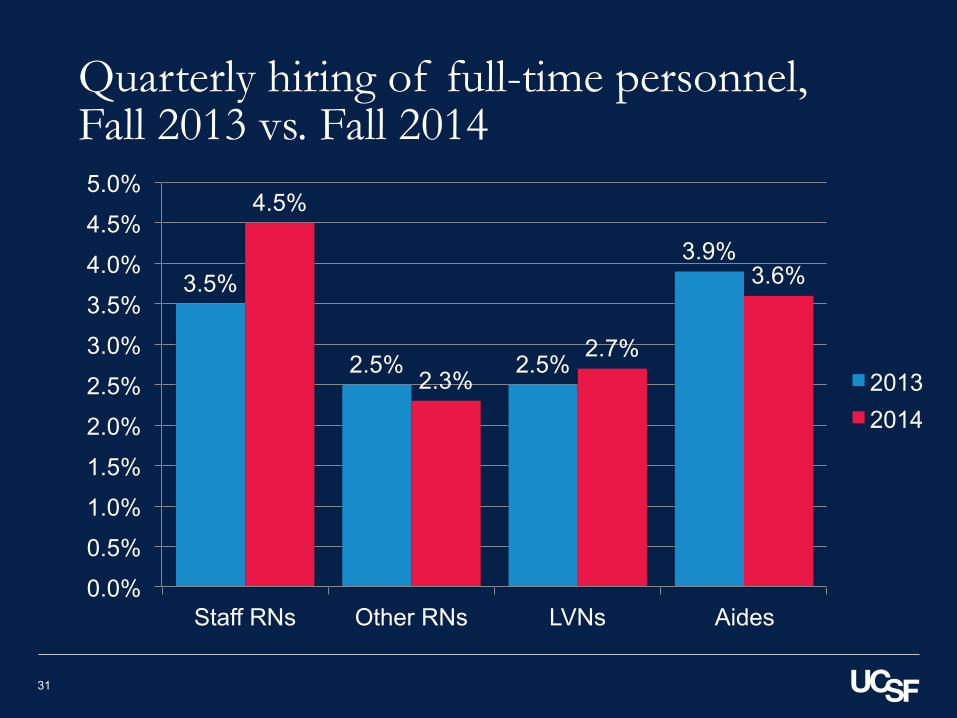
Quarterly hiring of full-time personnel, Fall 2013 vs. Fall 2014
3.5%
2.5% 2.5%
3.9%
4.5%
2.3% 2.7%
3.6%
0.0%
0.5%
1.0%
1.5%
2.0%
2.5%
3.0%
3.5%
4.0%
4.5%
5.0%
Staff RNs Other RNs LVNs Aides
2013 2014
31
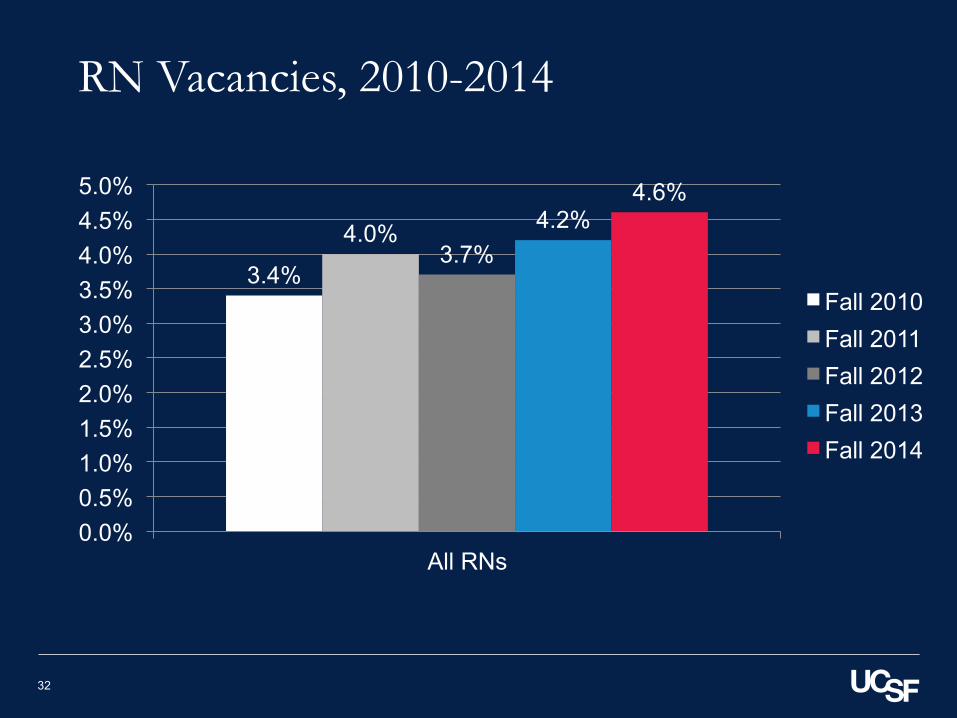
RN Vacancies, 2010-2014
3.4%
4.0% 3.7%
4.2% 4.6%
0.0% 0.5% 1.0% 1.5% 2.0% 2.5% 3.0% 3.5% 4.0% 4.5% 5.0%
All RNs
Fall 2010 Fall 2011 Fall 2012 Fall 2013 Fall 2014
32
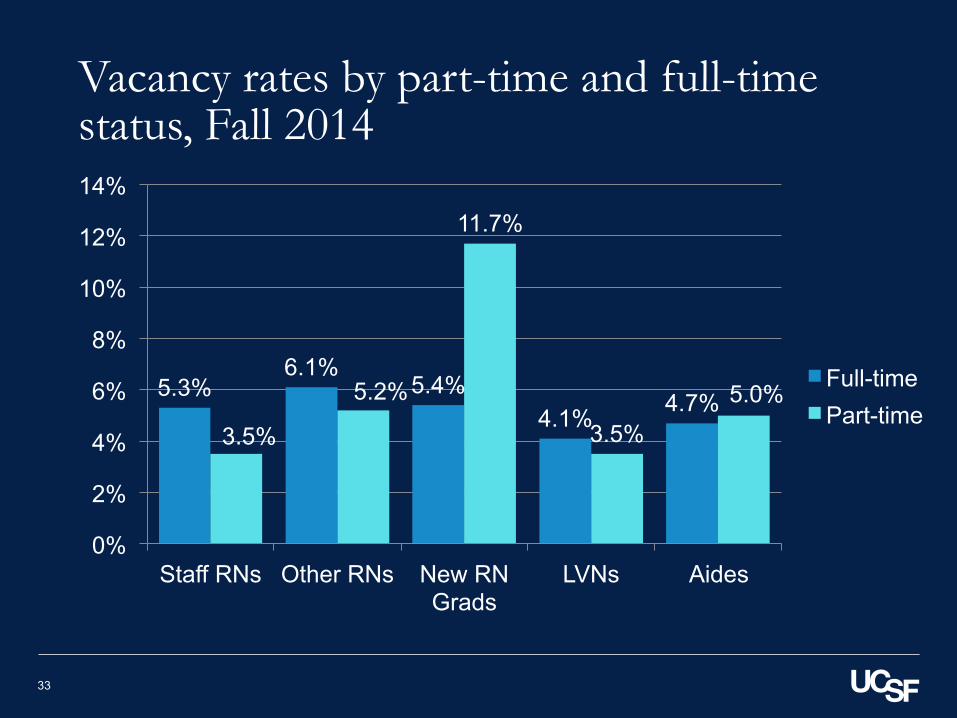
Vacancy rates by part-time and full-time status, Fall 2014
5.3% 6.1%
5.4% 4.1% 4.7%
3.5%
5.2%
11.7%
3.5% 5.0%
0%
2%
4%
6%
8%
10%
12%
14%
Staff RNs Other RNs New RN Grads
LVNs Aides
Full-time Part-time
33
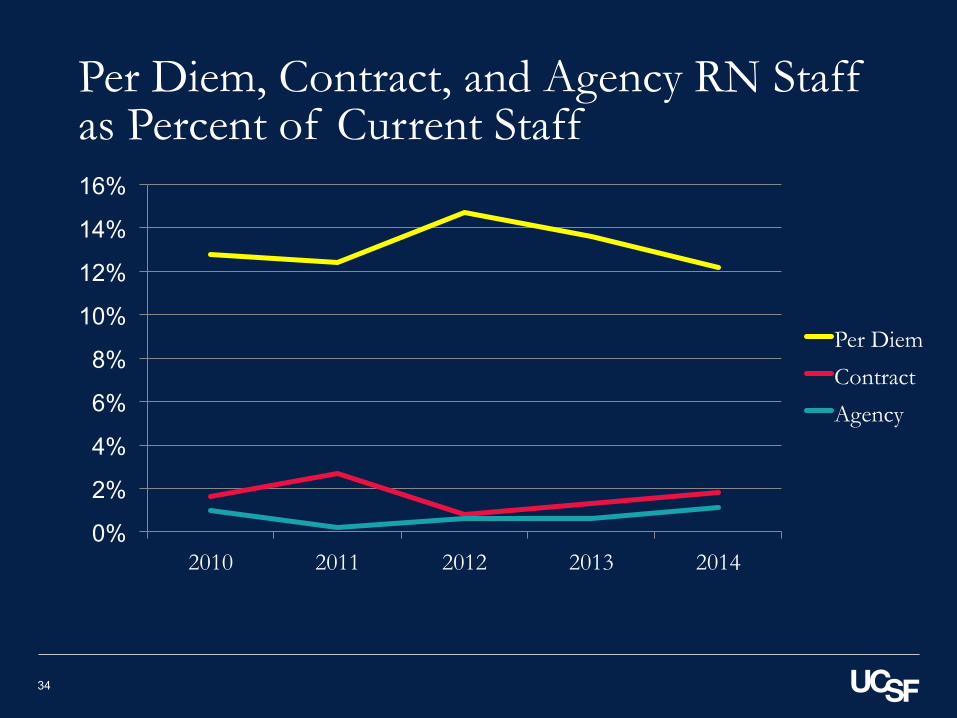
Per Diem, Contract, and Agency RN Staff as Percent of Current Staff
0%
2%
4%
6%
8%
10%
12%
14%
16%
2010 2011 2012 2013 2014
Per Diem
Contract
Agency
34
Goals for this webinar
§ Assess how the economic recovery is affecting demand for RNs in California
• Learn how Chief Nursing Officers perceive the current RN labor market
• Track the latest hospital vacancy and turnover data
• Understand how recently-graduated nurses are faring
§ Identify next steps for ensuring an adequate nurse supply
35
New RN Graduate Hiring Survey
§ Statewide survey of new grads conducted in fall of 2014
§ Collaborators:
• CINHC
• UCLA School of Nursing
• California Board of Registered Nursing
• Association of California Nurse Leaders
• California Student Nurses Association
§ Funder:
• Kaiser Permanente Fund for Health Education at the East Bay Community Foundation
36
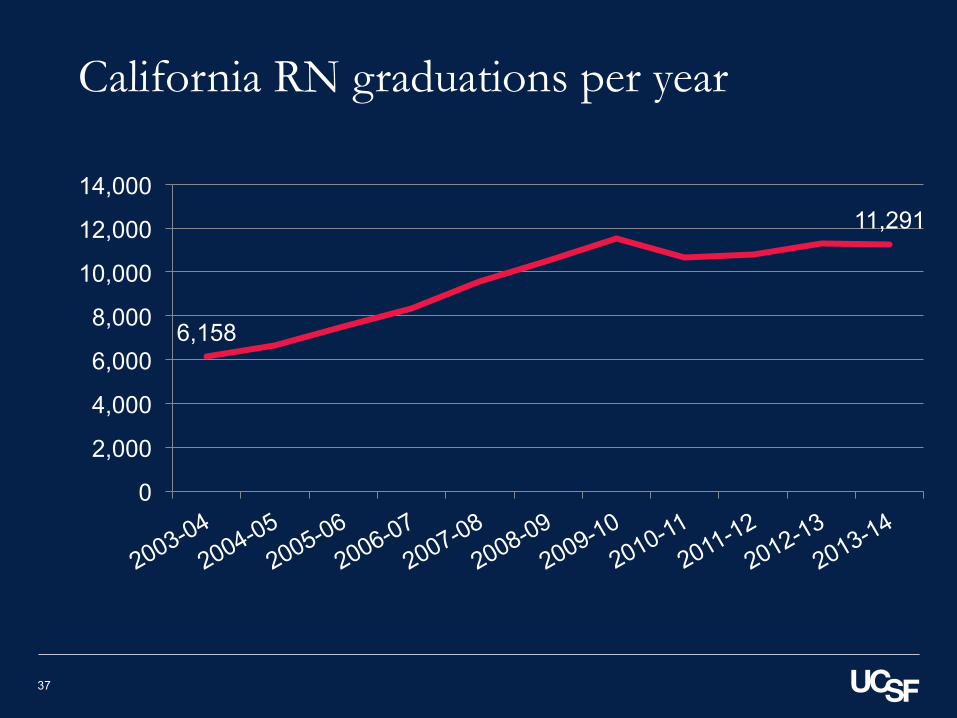
California RN graduations per year
6,158
11,291
0
2,000
4,000
6,000
8,000
10,000
12,000
14,000
37
New RN Graduate Hiring Survey
§ Random selection of 3,429 newly licensed RNs in CA - September 2013 through August 2014
• Sample was mailed letters with invitation to complete web-based survey
§ 634 responses received (18.5% response rate)
§ Margin of error is +/- 3.8 percentage points
38
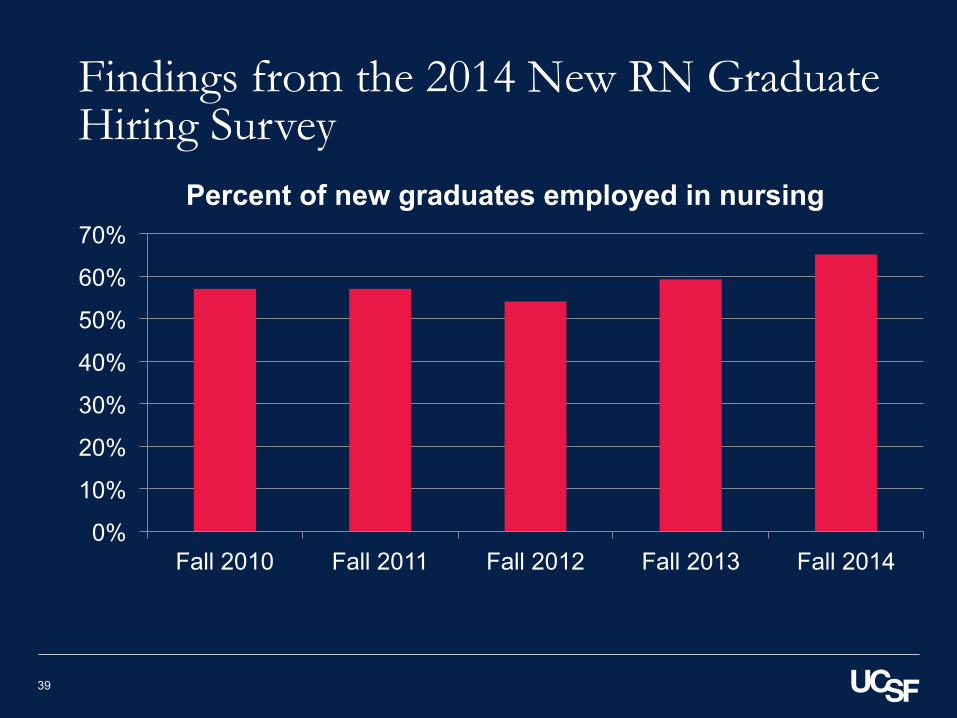
Findings from the 2014 New RN Graduate Hiring Survey
0%
10%
20%
30%
40%
50%
60%
70%
Fall 2010 Fall 2011 Fall 2012 Fall 2013 Fall 2014
Percent of new graduates employed in nursing
39
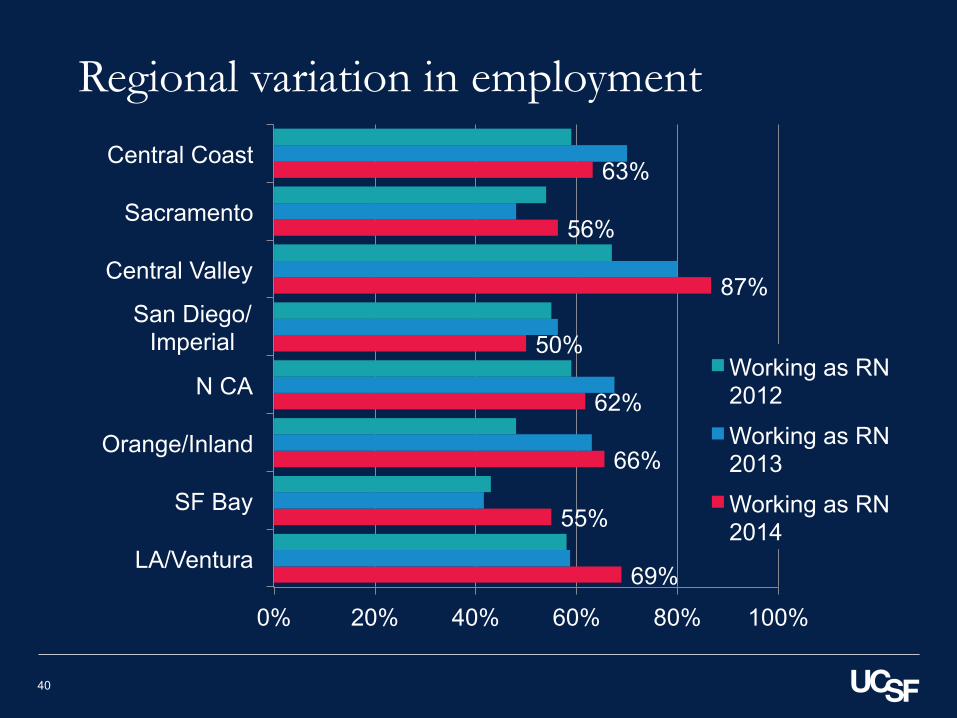
Regional variation in employment
40
69%
55%
66%
62%
50%
87%
56%
63%
0% 20% 40% 60% 80% 100%
LA/Ventura
SF Bay
Orange/Inland
N CA
San Diego/Imperial
Central Valley
Sacramento
Central Coast
Working as RN 2012
Working as RN 2013
Working as RN 2014
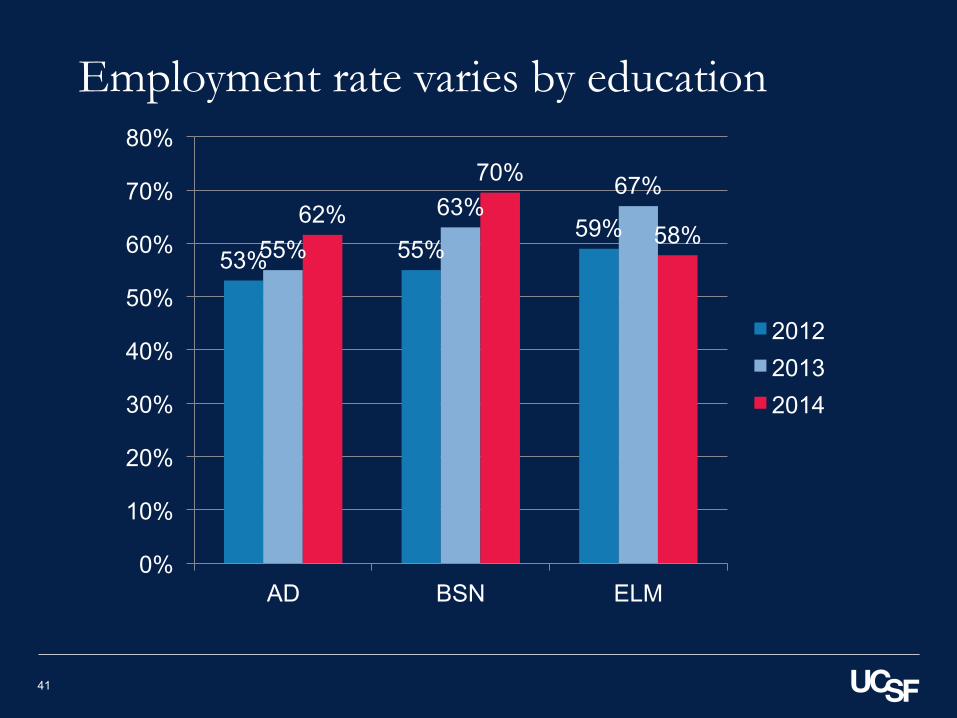
Employment rate varies by education
41
53% 55% 59%
55%
63% 67%
62%
70%
58%
0%
10%
20%
30%
40%
50%
60%
70%
80%
AD BSN ELM
2012 2013 2014
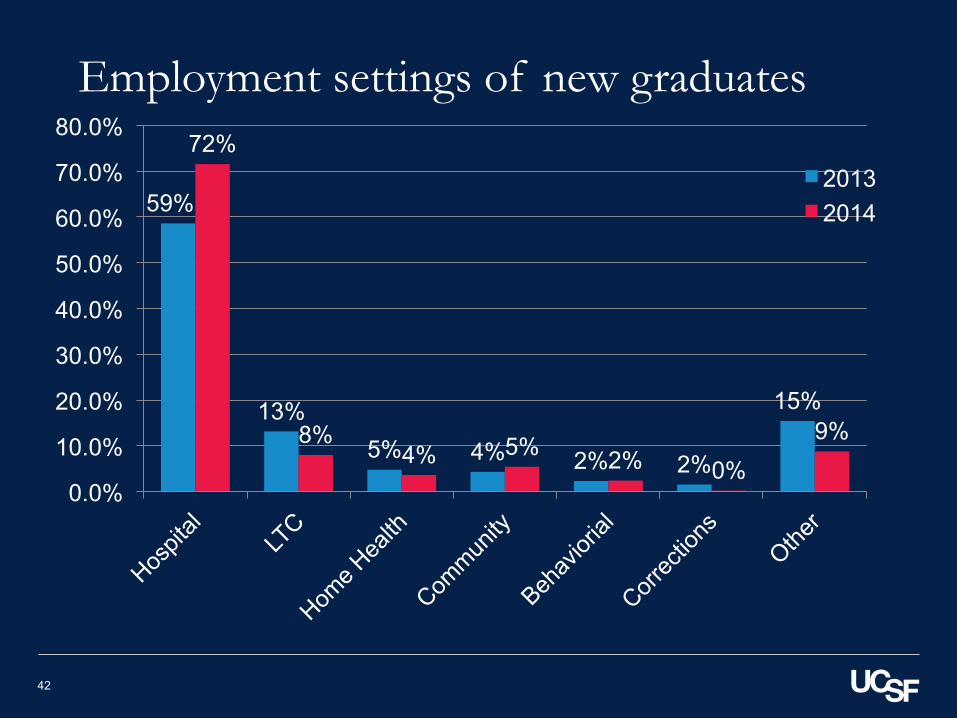
Employment settings of new graduates
42
59%
13% 5% 4% 2% 2%
15%
72%
8% 4% 5% 2% 0%
9%
0.0%
10.0%
20.0%
30.0%
40.0%
50.0%
60.0%
70.0%
80.0%
2013 2014
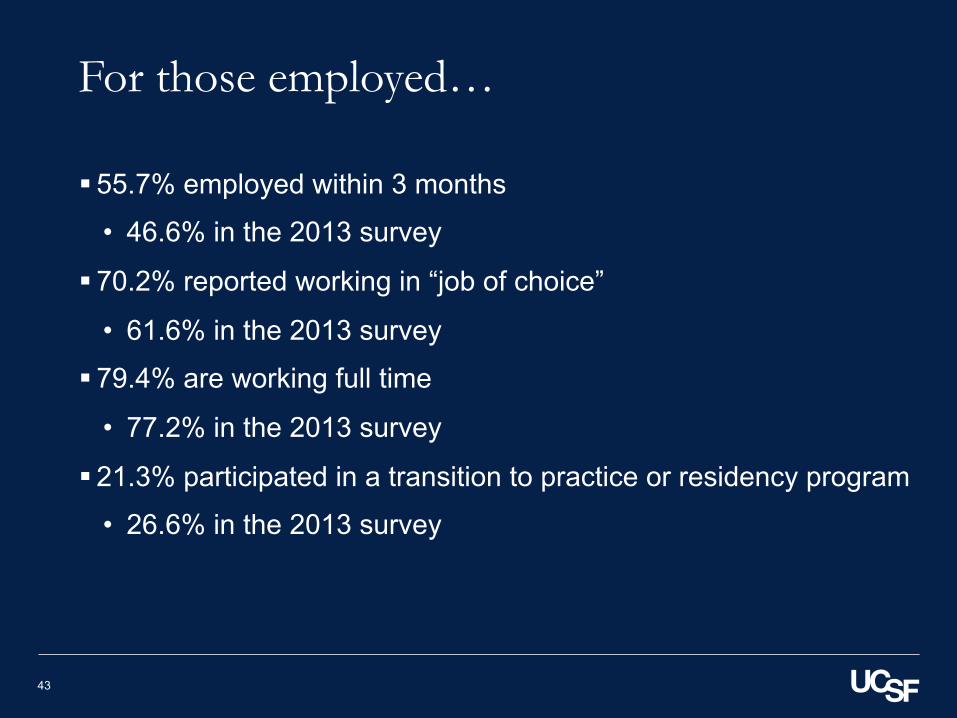
For those employed…
§ 55.7% employed within 3 months
• 46.6% in the 2013 survey
§ 70.2% reported working in “job of choice”
• 61.6% in the 2013 survey
§ 79.4% are working full time
• 77.2% in the 2013 survey
§ 21.3% participated in a transition to practice or residency program
• 26.6% in the 2013 survey
43
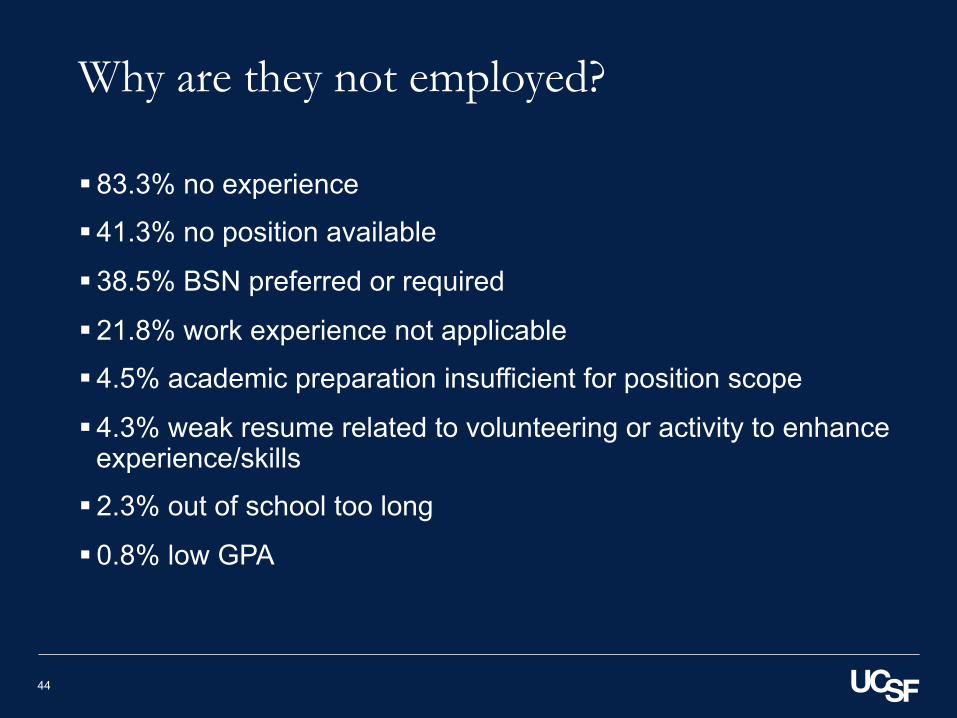
Why are they not employed?
§ 83.3% no experience
§ 41.3% no position available
§ 38.5% BSN preferred or required
§ 21.8% work experience not applicable
§ 4.5% academic preparation insufficient for position scope
§ 4.3% weak resume related to volunteering or activity to enhance experience/skills
§ 2.3% out of school too long
§ 0.8% low GPA
44
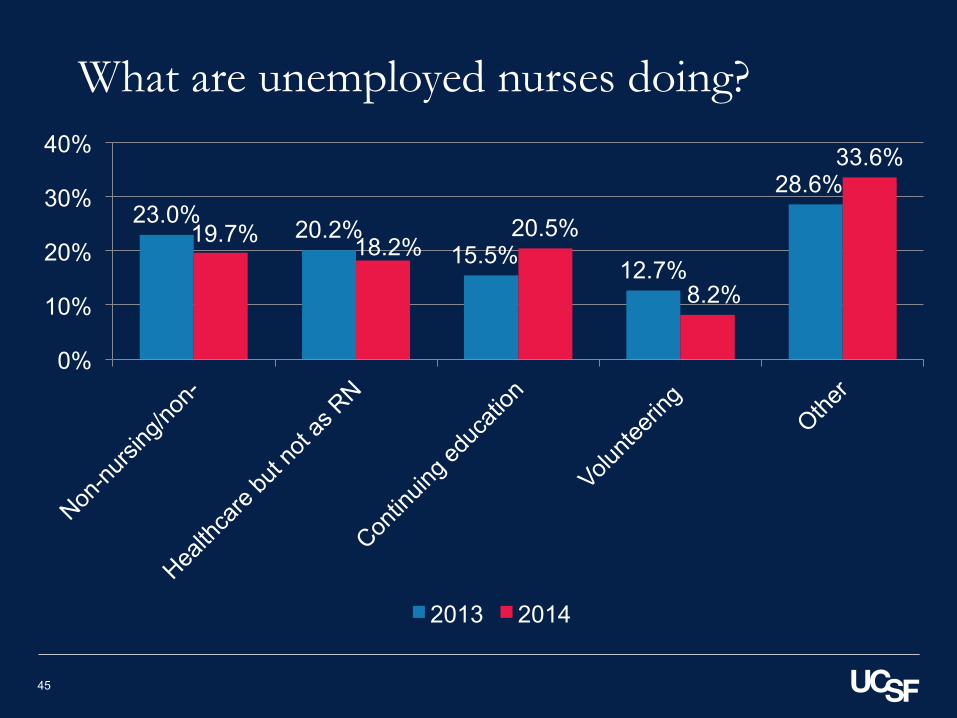
What are unemployed nurses doing?
23.0% 20.2% 15.5% 12.7%
28.6%
19.7% 18.2% 20.5%
8.2%
33.6%
0%
10%
20%
30%
40%
2013 2014
45
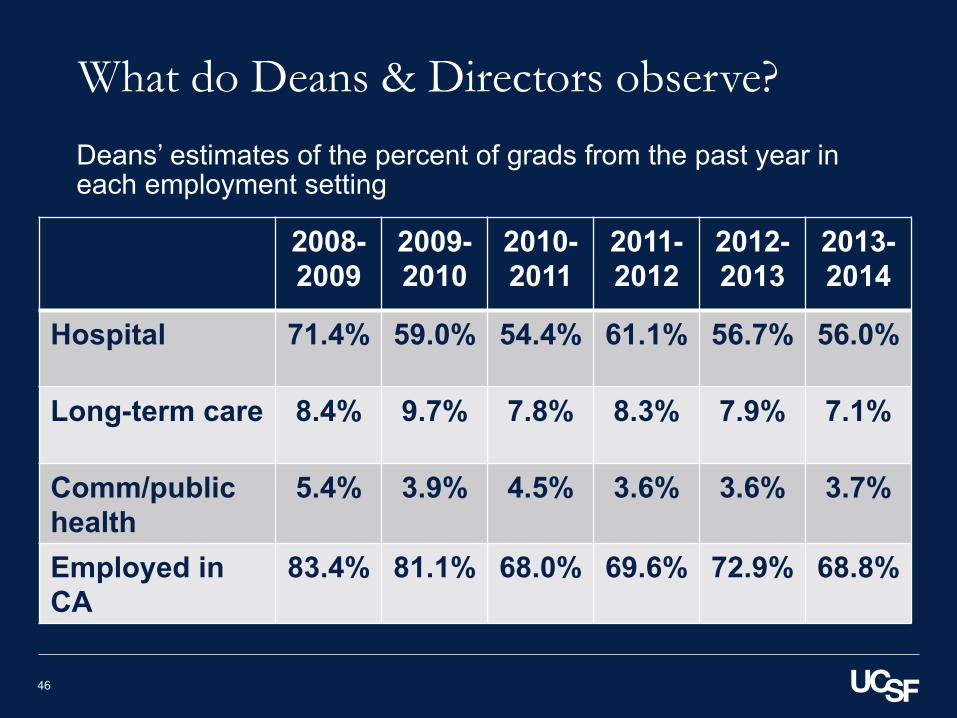
What do Deans & Directors observe?
2008-2009
2009-2010
2010-2011
2011-2012
2012-2013
2013-2014
Hospital 71.4% 59.0% 54.4% 61.1% 56.7% 56.0%
Long-term care 8.4% 9.7% 7.8% 8.3% 7.9% 7.1%
Comm/public health
5.4% 3.9% 4.5% 3.6% 3.6% 3.7%
Employed in CA
83.4% 81.1% 68.0% 69.6% 72.9% 68.8%
Deans’ estimates of the percent of grads from the past year in each employment setting
46
Goals for this webinar
§ Assess how the economic recovery is affecting demand for RNs in California
• Learn how Chief Nursing Officers perceive the current RN labor market
• Track the latest hospital vacancy and turnover data
• Understand how recently-graduated nurses are faring
§ Identify next steps for ensuring an adequate nurse supply
47
What is happening now?
§ There is current and anticipated job growth
• Inpatient care growth in census and higher acuity
• Ambulatory care growth
§ Shortages are emerging
• Experienced RNs are in short supply
‒ Operating Room
‒ Labor & Delivery
‒ Emergency Department
‒ Intensive care
§ Reservoir of recent graduates who are still unemployed
48
Concerns for workforce policy
§ Will recent graduates who can’t find work leave California permanently?
§ What education changes are needed to ensure new graduates have the right skills?
§ Can we foster opportunities to gain on-the-job skills and to pursue additional education?
49
Some recommendations § Employers: Invest in new graduate hiring
• Less expensive than a shortage
‒ Recruitment costs
‒ Costs of patient care lapses
‒ Costs of rapid wage increases
§ Educators: Partner with employers
• Offer electives in the clinical areas of shortage
• Ensure streamlined education progression
§ Policymakers: Maintain education capacity
• Do not let enrollments drop
• Support scholarship programs such as the HPEF programs
50
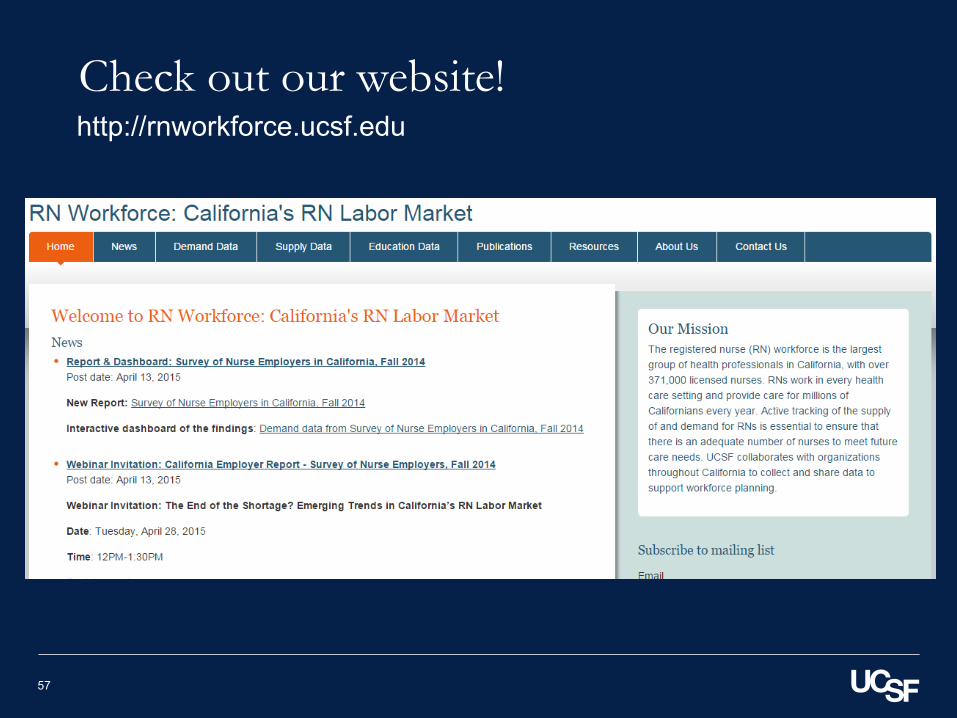
Check out our website! http://rnworkforce.ucsf.edu
57
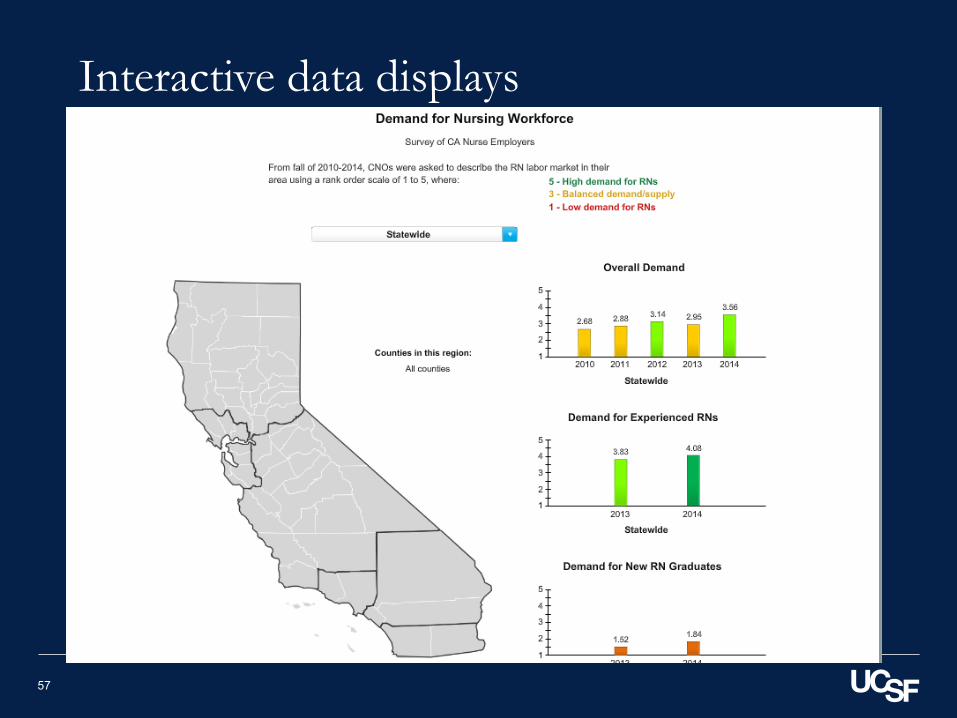
Interactive data displays
57
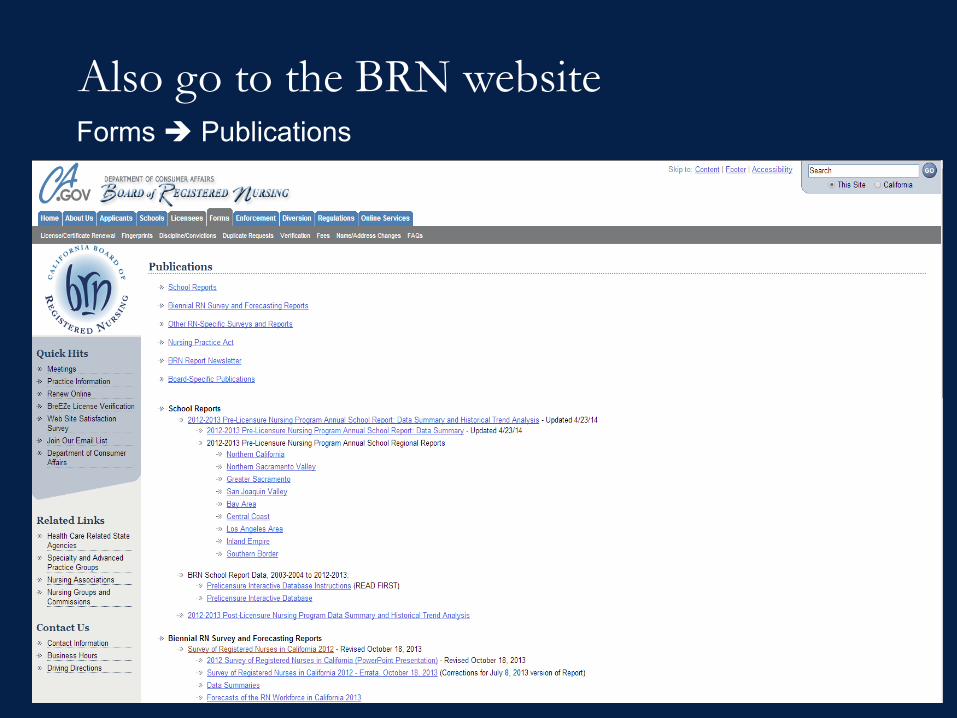
Also go to the BRN website Forms è Publications
53
Available from the BRN website
§ Annual Schools Report
• Public-use Excel workbook to summarize data by region, type of program…
§ RN Surveys (every 2 years)
• Full reports
• Link to a webpage with summary data, and ability to get regional and other cuts of the data
§ RN Forecasts
• Full reports
• Regional reports when we have them
§ Other studies
54
What is happening next?
§ UCSF and HASC are continuing our collaboration
• HASC does quarterly surveys of HR directors
• UCSF does annual CNO surveys
§ The 2014 BRN Survey of RNs report will be published later this spring or early summer
• New forecasts in Summer 2015
§ The 2014-2015 BRN Annual Schools Survey will be sent in October
§ The 2015 Employer Survey will be sent in October
55
Questions?
Thoughts?
Ideas?
Perspectives?
56