child surface groundwater presentation - … น าท ารายเด อน ท สถาน...
TRANSCRIPT

11
SemiSemi--coupling of a surfacecoupling of a surface-- and and
groundwater model togroundwater model to
investigate surface and investigate surface and
groundwater interactionsgroundwater interactions
in the Upper Great Chao Phraya Plain of in the Upper Great Chao Phraya Plain of
ThailandThailand
01.04.2010 @ University of Hong Kong

22
Contents
•• IntroductionIntroduction
•• Application to the study areaApplication to the study area
•• Coupling resultsCoupling results
•• Interactions of SW Interactions of SW -- GWGW

33
�� IntroductionIntroduction
Irrigation canal
GW pump
Shallow GW well

44
ModelsModels
�� SWATSWAT
�� MODFLOWMODFLOW
Saturated Zone
Unsaturated Zone
Overview of the couplingIntroduction
t
hSW
z
hK
zy
hK
yx
hK
xszzyyxx
∂
∂=−
∂
∂
∂
∂+
∂
∂
∂
∂+
∂
∂
∂
∂
( ) 2
a
a
e
SIP
IPP
+−
−=
1,2,
2,1,2,1,
22storedstored
outoutininVV
qqt
qqt −=
+⋅∆−
+⋅∆
Variable Storage
SCS, CN
Darcy’s Law
•• Develop Develop a coupling processa coupling process between SW and GW between SW and GW models to understand their interactionsmodels to understand their interactions
•• Apply the coupled model to analyst Apply the coupled model to analyst water balancewater balance and and hydrological components hydrological components between SW and GW in between SW and GW in study areastudy area
Functions in c
oupling

5
Coupling componentsModel coupling
Surface
SWAT
Soil
MODFLOW
Percolation
RechargeAquifer
∆t = 1 month (coupling)
Qriv HrivHaq
SWAT
MODFLOW
SWAT
( )aqrivrivriv
HHCQ −=
Checking parameters :
Streamflow (discharge) and GW Level

6
16
9
5
7
11
SW
GW
River-interaction
6
13
16
4
19
3
20
9
1
2
8
10
12
5
14
18
15
7
21
22
11
17
streamlines
Coupling dimensions (spatial)Model coupling
6
13
16
4
19
3
20
9
1
2
8
10
12
5
14
18
15
7
21
22
11
17
GW
Infiltration
SW
16
16
19
3
20
9
8
15
7
11
17
Subbasin polygon
Subbasin block
SpaceDimension
SpaceDimension
river package

7
Coupling dimensions (temporal)Model coupling
Data exchang
e
data exchang
e
SW model (daily time step)
GW model (monthly time step)
TimeDimension
iterations

8
Coupling of parameters
•Surface Recharge(one-way)•Streamflow-GW interaction(two-way)

99
�� Application to study areaApplication to study area

1010
Study area: OverviewApplication
Southeast Asia
Thailand
Ping river
Yom riverNan river
Chao Phraya river
Sakae Krang river
study area
alluvial aquifers
covers 9 provinces northern of Thailand

1111
#Y
#Y
#Y
#Y
6
13
16
4
19
3
20
9
1
2
8
10
12
5
14
18
15
7
21
22
11
17
Mathematical modelApplication
SW GW
C.2
Y.14
P.7A
N.12A
22 Subbasins,4 main-stream 2 layers,666 grid-cells

1212
Water balance: : Hydrological compoentsApplication
Coupling
Annual hydrological components (mm)
SW
GW
1313
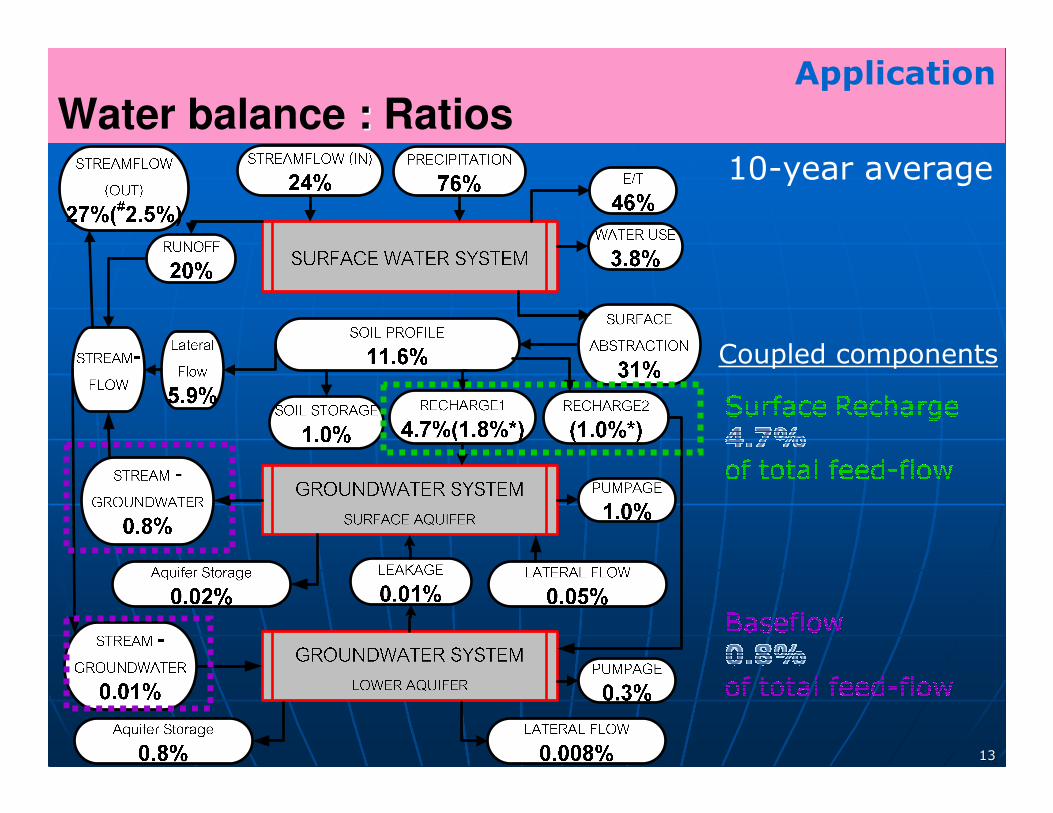
Water balance : : RatiosApplication
10-year average
Coupled components

1414
น�ําท่ารายเดือน ที�สถานี C2
0
2000
4000
6000
8000
10000
12000
0419
9307
1993
1019
9301
1994
0419
9407
1994
1019
9401
1995
0419
9507
1995
1019
9501
1996
0419
9607
1996
1019
9601
1997
0419
9707
1997
1019
9701
1998
0419
9807
1998
1019
9801
1999
0419
9907
1999
1019
9901
2000
0420
0007
2000
1020
0001
2001
0420
0107
2001
1020
0101
2002
0420
0207
2002
1020
0201
2003
น�ําท่
า (ล้าน
ลบ.ม./เดือน)
Observed Data
Uncoupled (SWAT)
Coupled (SWAT + MODFLOW)
SW results : StreamflowCoupling results
Streamflow at outlet
Flow (million m
3/m
onth)

151534
35
36
37
38
39
40
41
42
43
44
04-2536 04-2537 04-2538 04-2539 04-2540 04-2541 04-2542 04-2543 04-2544 04-2545 04-2546
ระดับน�ําใต้ดิน (ม.รทก.)
Coupled (MODFLOW)
Coupled (SWAT + MODFLOW)
GWW results : water levelsPCP-20
30
31
32
33
34
35
36
37
38
39
40
04-2536 04-2537 04-2538 03-2539 03-2540 03-2541 03-2542 03-2543 03-2544 03-2545 03-2546
ระดับน�ําใต้ดิน (ม.รทก.)
Uncoupled (MODFLOW)
Coupled (MODFLOW + SWAT)
Observed well
Coupling results
inner gw basin
dense pumping

1616
�� SWSW--GW interactions (results)GW interactions (results)

1717
นํ าท่ารายเดอืน ที�สถาน ีC2
0
1000
2000
3000
4000
5000
6000
7000
8000
9000
011996 021996 031996 041996 051996 061996 071996 081996 091996 101996 111996 121996 011997 021997 031997
นํ าทา่ (ล
า้น ลบ.ม
./เดอืน)
Observed Data
Uncoupled (SWAT)
Coupled (SWAT + MODFLOW)
ปรมิาณการเตมินํ าในแอง่นํ าใตด้นิจากผวิดนิ
0
5
10
15
20
25
30
35
40
45
50
Wet Dry
2539
ปรมิาณน
ํ/ารายฤด
กูาล-แลง้/ฝน
(มม.)
Coupled SWAT+MODFLOW
MODFLOW
Coupled results: Seasonal effectsCoupled results: Seasonal effectsPCP-20
33
34
35
36
37
38
39
01-2539 02-2539 03-2539 04-2539 05-2539 06-2539 07-2539 08-2539 09-2539 10-2539 11-2539 12-2539 01-2540 02-2540 03-2540
ระดบันํ าใต้ดิน (ม.รทก.)
Uncoupled (MODFLOW)
Coupled (MODFLOW + SWAT)
ปรมิาณการเตมินํ าในแอง่นํ าใตด้นิจากลํานํ า-80
-70
-60
-50
-40
-30
-20
-10
0
10
Wet Dry
2539
ปรมิาณน
ํ/ารายฤด
กูาล-แล้ง/ฝ
น (มม.)
Coupled SWAT+MODFLOWMODFLOWSWAT
Streamflow GW Level
River Recharge Surface Recharge
Wet Dry Wet Dry
Results
48 billion m3
Difference of uncoupling and coupling
Wet Dry
Wet Dry
~0

1818
Movement of water between SW and GWMovement of water between SW and GW
ปรมิาณการเตมินํ าในแอง่นํ าใตด้นิ
-30
.0
-20
.0
-10
.0
0.0
10.0
20.0
30.0
40.0
50.0
Wet Dry Wet Dry Wet Dry Wet Dry Wet Dry Wet Dry Wet Dry Wet Dry Wet Dry Wet Dry
2536 2537 2538 2539 2540 2541 2542 2543 2544 2545
ปริมาณน
ํ/ารายฤดกูาล-แล้ง/ฝน (มม.)
เติมจากแม่นํ/า
เติมจากผิวดิน
++ Into groundwater
-- Into rivers
Results
Total for 10 years + 21.5 billion cubic meters- 6.1 billion cubic meters
Raise 1.5 billion m3
In 10 years
1993 2002Recharge from river
Recharge from surface

1919
-7%
1%
19%
10%
0%
7% 7%
18%
8%
30%
7%
15%
8%
17%
5%
17%
8%
17%
6%
8%
-10
%
-5%
0%
5%
10%
15%
20%
25%
30%
35%
Wet Dry Wet Dry Wet Dry Wet Dry Wet Dry Wet Dry Wet Dry Wet Dry Wet Dry Wet Dry
2536 2537 2538 2539 2540 2541 2542 2543 2544 2545
ความผดิพลาดเฉลี�ยสมัพัทธ์
0
5,000
10,000
15,000
20,000
25,000
ปริมาณ
นํ าท่า (ล้าน ลบ.ม.)
ความคลาดเคลือนลดลง
ปรมิาณนํ�าท่า
Situation 1993 1994 1995 1996 1997 1998 1999 2000 2001 2002
wet
average
dry
drought
SW results : Water situation effect
Results
1993 2002
Less calculation error
Streamflow
Streamflow(m
illion m
3)
Less of prediction error (%
)

2020
Conclusions
••EvaluationEvaluation
The semiThe semi--coupling of MODFLOW and SWAT improves coupling of MODFLOW and SWAT improves
the individual results of the GW and SW simulations by the individual results of the GW and SW simulations by
2%2%--20% better with regard to the uncoupled 20% better with regard to the uncoupled
models, models, especially in the dryespecially in the dry--seasonseason
•Uncoupled vs coupled results
ParametersImproved by coupling (less prediction error)
Whole year Wet DryDry
Streamflow 11.5% 7.5% 16.7%
GW Level 2.3% 0.55% 2.9%

2121
Questions & AnswersQuestions & Answers