the costs of unclaimed earned income tax credits to ... notices/left on the table... · antonio...
TRANSCRIPT

1
The Costs of Unclaimed Earned Income Tax Credits
to California’s Economy: Update and Expansion of
the “Left on the Table” Report
Antonio Avalos, Ph.D.*
January 2018
EXECUTIVE SUMMARY
The Earned Income Tax Credit (EITC) is a refundable federal income tax credit for
low to moderate income working households. The EITC is one of the federal government’s
largest resources to assist low-income working Americans. Every year, millions of
Californians claim billions of dollars as federal EITC refunds. The federal EITC credits
claimed by California residents provide a substantial amount of dollars that benefit the
state’s economy as they are injected into the state’s income stream. For a variety of
reasons, however, hundreds of thousands of Californians fail to claim federal EITC refunds
every year. Since these unclaimed dollars are never spent at local businesses, fewer jobs
are created or supported, fewer wages are paid, and eventually less tax revenue goes to
state and local governments. Thus, these unclaimed refunds represent a foregone economic
stimulus for California. In June 2015, the State Legislature approved the California EITC.
Like the federal program, to receive the California EITC, an individual must have earned
income, be a United States (U.S.) citizen or legal resident, and have a valid social security
number.
This report is a second update and first expansion of the “Left on the Table” report released
on March 9, 2010, by the New America Foundation. The “Left on the Table” report,
commissioned by the California Department of Community Services and Development
(CSD), was the first attempt to estimate the magnitude of the foregone losses associated
with unclaimed federal EITC benefits in California. While this revised report updates the
estimated value of unclaimed federal EITC dollars, the main goal is to generate new
information to apprise the public and policy makers in general about the current importance
of the federal and California EITC programs for the state’s economy, its 58 counties and
its residents.
________________________________________________________________________ * This report was produced with funding provided by the California Department of Community Services and
Development. The findings, interpretations, and conclusions are the author’s own responsibility and do not
necessarily represent the position of California State University, Fresno, or the California Department of
Community Services and Development.
2
Primary Findings
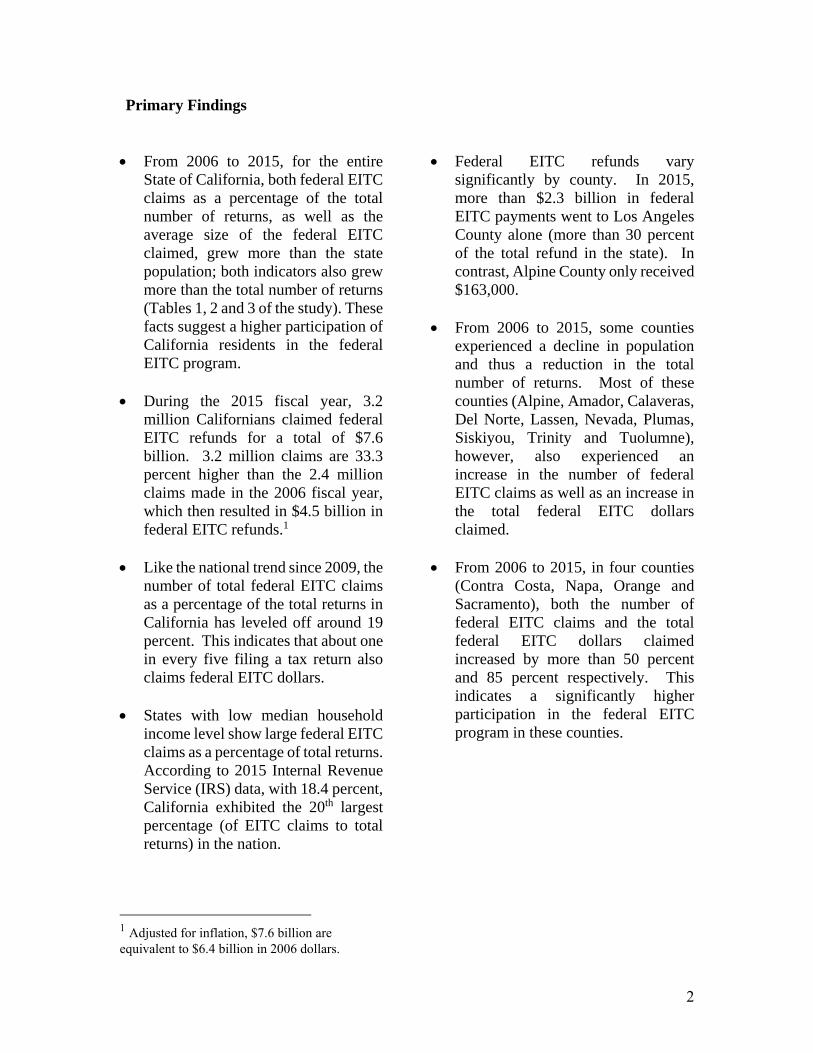
From 2006 to 2015, for the entire
State of California, both federal EITC
claims as a percentage of the total
number of returns, as well as the
average size of the federal EITC
claimed, grew more than the state
population; both indicators also grew
more than the total number of returns
(Tables 1, 2 and 3 of the study). These
facts suggest a higher participation of
California residents in the federal
EITC program.
During the 2015 fiscal year, 3.2
million Californians claimed federal
EITC refunds for a total of $7.6
billion. 3.2 million claims are 33.3
percent higher than the 2.4 million
claims made in the 2006 fiscal year,
which then resulted in $4.5 billion in
federal EITC refunds.1
Like the national trend since 2009, the
number of total federal EITC claims
as a percentage of the total returns in
California has leveled off around 19
percent. This indicates that about one
in every five filing a tax return also
claims federal EITC dollars.
States with low median household
income level show large federal EITC
claims as a percentage of total returns.
According to 2015 Internal Revenue
Service (IRS) data, with 18.4 percent,
California exhibited the 20th largest
percentage (of EITC claims to total
returns) in the nation.
1 Adjusted for inflation, $7.6 billion are
equivalent to $6.4 billion in 2006 dollars.
Federal EITC refunds vary
significantly by county. In 2015,
more than $2.3 billion in federal
EITC payments went to Los Angeles
County alone (more than 30 percent
of the total refund in the state). In
contrast, Alpine County only received
$163,000.
From 2006 to 2015, some counties
experienced a decline in population
and thus a reduction in the total
number of returns. Most of these
counties (Alpine, Amador, Calaveras,
Del Norte, Lassen, Nevada, Plumas,
Siskiyou, Trinity and Tuolumne),
however, also experienced an
increase in the number of federal
EITC claims as well as an increase in
the total federal EITC dollars
claimed.
From 2006 to 2015, in four counties
(Contra Costa, Napa, Orange and
Sacramento), both the number of
federal EITC claims and the total
federal EITC dollars claimed
increased by more than 50 percent
and 85 percent respectively. This
indicates a significantly higher
participation in the federal EITC
program in these counties.
3
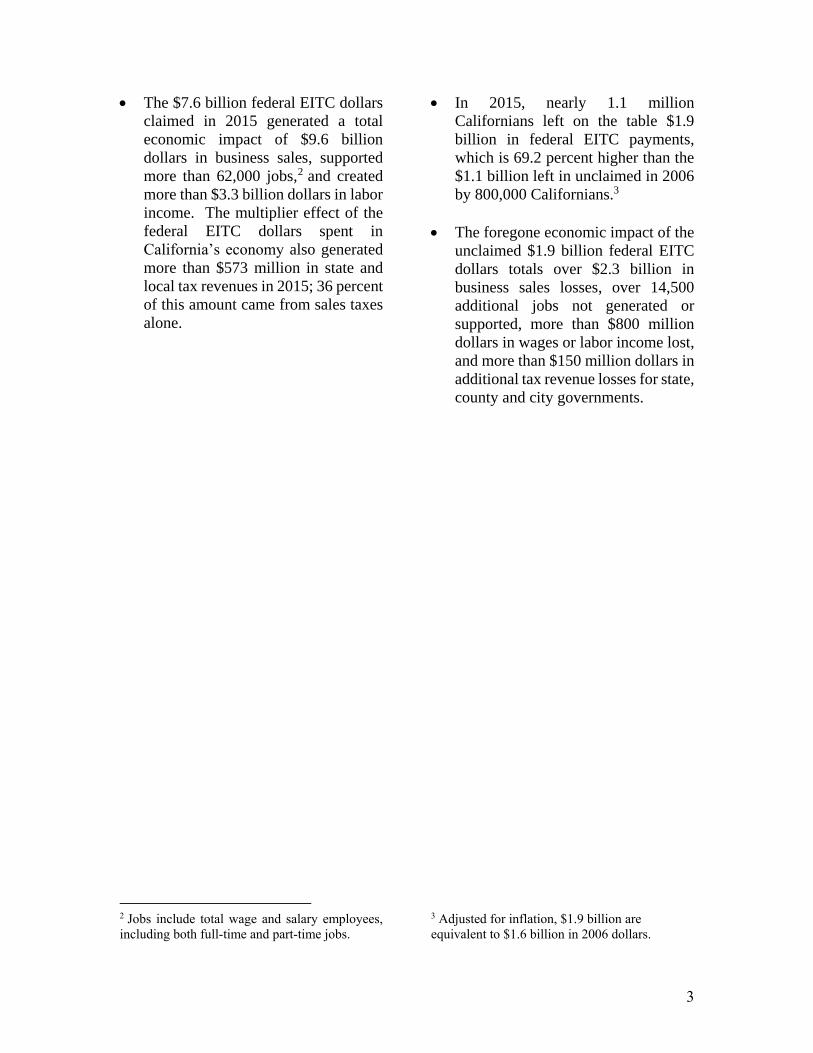
The $7.6 billion federal EITC dollars
claimed in 2015 generated a total
economic impact of $9.6 billion
dollars in business sales, supported
more than 62,000 jobs,2 and created
more than $3.3 billion dollars in labor
income. The multiplier effect of the
federal EITC dollars spent in
California’s economy also generated
more than $573 million in state and
local tax revenues in 2015; 36 percent
of this amount came from sales taxes
alone.
In 2015, nearly 1.1 million
Californians left on the table $1.9
billion in federal EITC payments,
which is 69.2 percent higher than the
$1.1 billion left in unclaimed in 2006
by 800,000 Californians.3
The foregone economic impact of the
unclaimed $1.9 billion federal EITC
dollars totals over $2.3 billion in
business sales losses, over 14,500
additional jobs not generated or
supported, more than $800 million
dollars in wages or labor income lost,
and more than $150 million dollars in
additional tax revenue losses for state,
county and city governments.
2 Jobs include total wage and salary employees,
including both full-time and part-time jobs.
3 Adjusted for inflation, $1.9 billion are
equivalent to $1.6 billion in 2006 dollars.

4
CONTENTS
Executive Summary 1
I. Introduction 5
II. Overview of the Earned Income Tax Credit (EITC) 7
i. Federal EITC 7
ii. California EITC 8
III. Claimed Federal EITC Refunds in California and its Economic Impact 10
IV. Foregone Economic Impact of the Unclaimed Federal EITC Refunds 20
V. Claimed California EITC Refunds and its Economic Impact 28
VI. Concluding Remarks 33
APPENDIX A: Data, Scope and Economic Impact Methodology 34
LIST OF TABLES
Table 1: Federal EITC Returns & Federal EITC Dollars Claimed in 2015 by County 14
Table 2: Federal EITC Returns & Federal EITC Dollars Claimed in 2006 by County 15
Table 3: Federal EITC Returns & Federal EITC Dollars Claimed Growth Rate (2006-15) 16
Table 4: Economic Impact of the Federal EITC in California by County (2015) 18
Table 5: Impact of the Federal EITC on California State and Local Taxes (2015) 20
Table 6. Estimated Federal EITC Non-filer Rates by State 22
Table 7: Unclaimed Federal EITC Returns and Payments (2006 vs. 2015) 24
Table 8: Characteristics Associated with High Rates of Unclaimed EITC Funds 26
Table 9: Foregone Economic Impact in California by County (2015) 27
Table 10: Foregone Economic Impact of the Federal EITC on California
State and Local Taxes (2015) 28
Table 11: Cal EITC Returns and EITC Dollars Claimed by County 30
Table 12: Economic Impact of the Cal EITC by County (2016) 31
Table 13: Economic Impact of the California EITC on State and Local Taxes (2016) 32
LIST OF CHARTS
Chart 1: 2016 Federal EITC Structure for a Single, Head of Household or Qualified Widow 8
Chart 2: 2016 California EITC Structure for all Households 9
Chart 3: Federal EITC Dollars in California & Percent of Total Federal EITC Dollars in the US 11
Chart 4: Average Credit Size and Federal EITC Claims as a Percentage of Total Returns 12
Chart 5: California and United States Poverty Rate (1990-2016) 17
Chart A1: Conceptual Framework 34

5
I. Introduction
The EITC, created by the U.S. Congress
in 1975, represents one of the Federal
Government’s largest resources to assist
working low-income Americans.4 Every
year, parallel to what happens around the
nation, millions of Californians claim
billions of dollars as federal EITC
payments. The federal EITC dollars
claimed by California residents provide a
substantial amount of resources that
benefit the state’s economy as they are
injected into the state’s revenue stream.
The economic stimulus is magnified
beyond the original federal EITC
payments because the spending of federal
EITC refunds within California creates
ripple effects as more dollars move
among consumers, businesses and even
among state and local governments,
which capture higher tax revenue.
However, for a variety of reasons,
hundreds of thousands of Californians
fail to claim federal EITC refunds every
year. Further, the individuals and
households who miss claiming the
benefits are not the only California
residents that lose. Since these unclaimed
dollars are never spent at local
businesses, fewer jobs are created, fewer
wages are paid, and eventually less tax
revenue goes to state and local
governments. Thus, these unclaimed
refunds represent a foregone economic
stimulus for California.
On March 9, 2010, the New America
Foundation released a report titled “Left
on the Table,” authored by Dr. Antonio
4 http://www.epi.org/publication/ib370-earned-
income-tax-credit-and-the-child-tax-credit-
history-purpose-goals-and-effectiveness/
Avalos and Dr. Sean Alley from the
Department of Economics at California
State University, Fresno.5 Utilizing IRS
data for tax year 2006, the report assessed
the costs to California’s economy
associated with the unclaimed EITCs.
Among others, the findings included that:
2.4 million California residents claimed
$4.95 billion in federal EITC refunds; as
these refunds were spent, they spurred
$5.5 billion in sales for California
businesses, who in turn created or
supported 33,000 jobs, paid $1.32 billion
in wages, and brought $390.5 million in
tax revenue to state and local
governments. The report also reported
that: an estimated 800,000 Californians
failed to claim $1.2 billion in federal
EITC refunds; since these refunds went
unclaimed, California businesses lost out
$1.4 billion in sales and 8,200 jobs were
not created or supported.
The “Left on the Table” report was the
first attempt to assess the magnitude of
the foregone losses associated with
unclaimed federal EITC benefits in
California. As such, it gained national
notice and was utilized as an effective
tool in bringing attention to the federal
EITC program. For example, in March 9,
2010, the findings of the report were used
as testimony by the authors before the
California Senate Human Services
Committee. Also, the findings were used
across the state to support federal EITC
program awareness campaigns and the
report was featured in The New York
Times on April 30, 2014.6
The “Left on the Table” report, however,
was produced in 2010 and used data from
5http://newamerica.net/publications/policy/left_o
n_the_table 6http://www.nytimes.com/2010/04/30/us/30sfbri
efs.html

6
the 2006 tax year. Although still useful
in informing policy as well as for EITC
awareness campaigns, its findings lost
relevance not only because considerable
time had passed, but also because new
IRS data had become available. Thus, On
March 2015, sponsored by CSD, Dr.
Avalos released a second report titled
“The Costs of Unclaimed Earned Income
Tax Credits to California’s Economy:
Update of the ‘Left on the Table’ Report,”
which assessed the costs to California’s
economy associated with the unclaimed
earned income tax federal credits using
more recent data. This updated report
found that for 2012, 3.2 million
Californians claimed federal EITC
refunds for a total of $7.3 billion. This
number of claims was 33.6 percent higher
than the 2.4 million claims made in 2006,
which then resulted in $4.95 billion in
federal EITC refunds. This report also
reported that in 2012, 1.0 million
Californians left on the table $1.8 billion
in EITC payments, which was 61.2
percent higher than the $1.1 billion in
federal EITC payments in 2006
unclaimed by 800,000 Californians.
In February 2017, officials from CSD and
the University Business Center (UBC) at
California State University, Fresno
initiated a new conversation about the
need to update and expand the updated
“Left on the Table” 2015 report for two
main reasons. First, once again, although
only two years have lapsed, new IRS data
had become available making it possible
to produce more current, relevant and
informative calculations. Second, in June
2015, the Legislature and Governor Jerry
Brown approved the California EITC,
which supplements the federal EITC.
Thus, this report not only updates the
2010 “Left on the Table” original report,
but also expands it by adding new
economic impact calculations for the
California EITC. The analysis of the
California EITC is limited to estimating
its economic and fiscal impact because,
unlike with the federal EITC, there is not
enough data available to date on the rate
of unclaimed Cal EITC for a reliable
analysis to be conducted.
The fundamental purpose of this updated
and expanded report is to produce more
recent information to apprise the public
and policy makers in general about the
current importance of both federal and
state EITC programs for the California
economy, its 58 counties and residents.
Specifically, this new report: 1) conducts
research to provide updated data on the
number of claimed and unclaimed federal
credits in California by county and assess
the economic and fiscal impact of both;
2) compares where California stands
today in terms of federal EITC
participation compared to the last report;
3) compares where California ranks today
in terms of federal EITC participation in
relation to all other states in the nation; 4)
examines the main demographic
characteristics associated with those
taxpayers that fail to claim the federal tax
credit; and 5) provides data on the
number of claimed California EITC
credits in California by county and
assesses their economic and fiscal
impact.
7
II. Overview of the Earned Income
Tax Credit (EITC)
i. Federal EITC
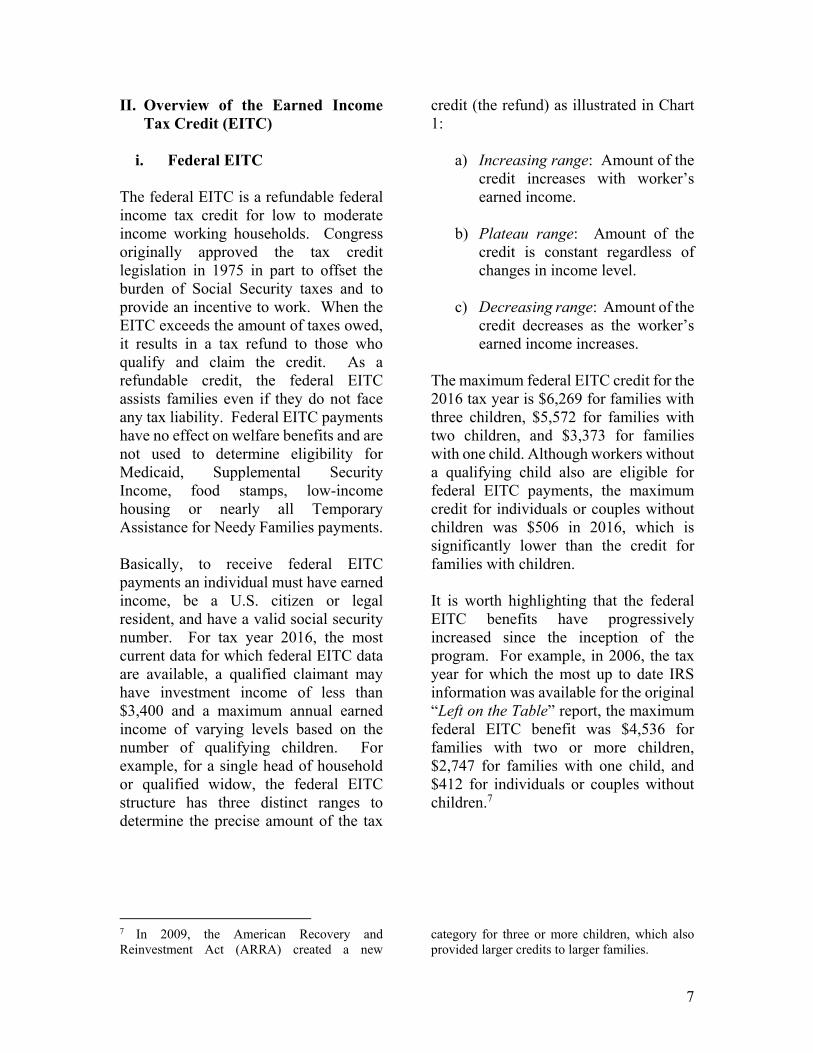
The federal EITC is a refundable federal
income tax credit for low to moderate
income working households. Congress
originally approved the tax credit
legislation in 1975 in part to offset the
burden of Social Security taxes and to
provide an incentive to work. When the
EITC exceeds the amount of taxes owed,
it results in a tax refund to those who
qualify and claim the credit. As a
refundable credit, the federal EITC
assists families even if they do not face
any tax liability. Federal EITC payments
have no effect on welfare benefits and are
not used to determine eligibility for
Medicaid, Supplemental Security
Income, food stamps, low-income
housing or nearly all Temporary
Assistance for Needy Families payments.
Basically, to receive federal EITC
payments an individual must have earned
income, be a U.S. citizen or legal
resident, and have a valid social security
number. For tax year 2016, the most
current data for which federal EITC data
are available, a qualified claimant may
have investment income of less than
$3,400 and a maximum annual earned
income of varying levels based on the
number of qualifying children. For
example, for a single head of household
or qualified widow, the federal EITC
structure has three distinct ranges to
determine the precise amount of the tax
credit (the refund) as illustrated in Chart
1:
a) Increasing range: Amount of the
credit increases with worker’s
earned income.
b) Plateau range: Amount of the
credit is constant regardless of
changes in income level.
c) Decreasing range: Amount of the
credit decreases as the worker’s
earned income increases.
The maximum federal EITC credit for the
2016 tax year is $6,269 for families with
three children, $5,572 for families with
two children, and $3,373 for families
with one child. Although workers without
a qualifying child also are eligible for
federal EITC payments, the maximum
credit for individuals or couples without
children was $506 in 2016, which is
significantly lower than the credit for
families with children.
It is worth highlighting that the federal
EITC benefits have progressively
increased since the inception of the
program. For example, in 2006, the tax
year for which the most up to date IRS
information was available for the original
“Left on the Table” report, the maximum
federal EITC benefit was $4,536 for
families with two or more children,
$2,747 for families with one child, and
$412 for individuals or couples without
children.7
7 In 2009, the American Recovery and
Reinvestment Act (ARRA) created a new
category for three or more children, which also
provided larger credits to larger families.

8
Chart 1: 2016 Federal EITC Structure for a Single, Head of Household
or Qualified Widow
SOURCE: Internal Revenue Service (IRS)
NOTE: The EITC success stories presented in this report were collected from California
residents who filed their taxes at Volunteer Income Tax Assistance centers. Names may
have been changed to maintain confidentiality.
ii. California EITC
Over time, multiple states have adopted
their own versions of the federal EITC
program, with the goal of supplementing
it and thus combating poverty more
effectively by augmenting the tax credit
low-income families can receive. In June
8 For tax year 2016, the credit was available to
taxpayers with earned income of less than
$14,161, which is lower than the income limit of
2015, the Legislature and Governor Jerry
Brown approved the California EITC,
which has unique characteristics making
it different from the federal EITC. For
example, it imposed significantly lower
income limits than the federal program8,
did not include marital status as a
determinant of the credit amount, and did
$53,505 (if married filing jointly) set by the
Federal Program. California increased income
eligibility to $22,300 for tax year 2017.
EITC Success Story #1: Michelle
Michelle is a single mother with two children who qualified for the Federal Earned
Income Tax Credit and the Child Tax Credit. Her daughter had taken a year off
from college because she couldn’t afford to buy her books and supplies. Michelle
gave her daughter a portion of her tax credit to pay for college. Michelle is very
happy that she is able to assist her daughter in fulfilling her dream of being the
first family member to earn a college degree.

9
not allow self-employed income to count
toward earned income requirements. 9
Like the federal program, to receive
California EITC payments an individual
must have earned income, be a U.S.
citizen or legal resident, and have a valid
social security number. For tax year
2016, the most current data for which
California EITC data is publicly
available, the credit amount was
determined by the number of qualified
children and qualified income and was
structured with credit phase-in and phase-
out income ranges. The amount of the
credit was also multiplied by an
adjustment factor that can vary across
taxable years. The State Budget set the
adjustment factor at 85 percent for
taxable years 2015 and 2016. The two
ranges described below are also
illustrated in Chart 2:
a) Increasing range: Amount of the
credit increases with worker’s
earned income. The credit is equal
to the credit phase-in rate
multiplied by the qualified income
and the adjustment factor.
b) Decreasing range: Amount of the
credit decreases as the worker’s
earned income increases. In this
range, each dollar of qualified
income over the maximum, the
credit is reduced by the phase-out
rate and the adjustment factor
until the credit reaches zero.
Chart 2: 2016 California EITC Structure for all Households
SOURCE: California Franchise Tax Board
9 The Federal Program allows self-employment
income to count as earned income. California
expanded eligibility for tax year 2017 to include
self-employment income.

10
For the 2016 taxable year, the maximum
California EITC (after applying the 85
percent adjustment factor) ranged from
$217 for an eligible individual without a
qualifying child to $2,706 for an eligible
individual with three qualifying children.
III. Claimed Federal EITC Refunds in
California and its Economic Impact
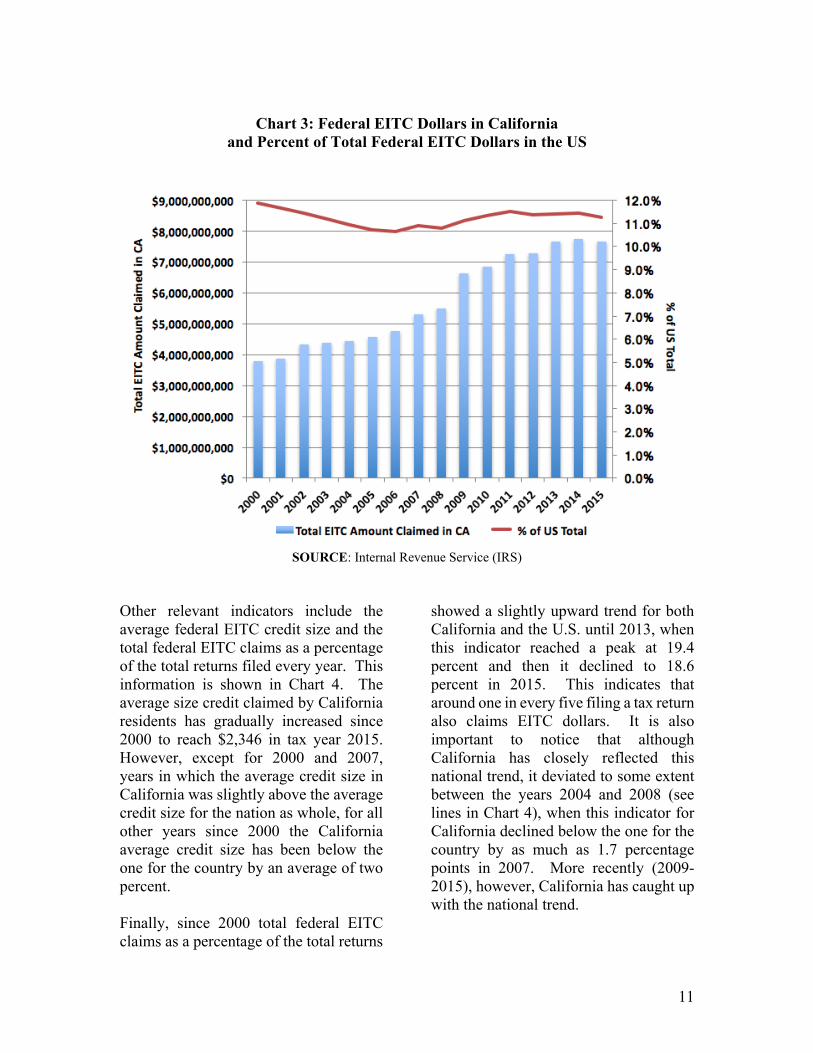
During the 2015 tax year, 3.2 million
Californians claimed the federal EITC for
a total of $7.6 billion. These amounts are
substantially higher than the 2.4 million
claims made in the 2006 tax year, which
resulted in $4.5 billion in federal EITC
refunds as reported in the “Left on the
Table” 2010 report. In fact, as shown in
Chart 2, the amount of federal EITC
refunds for California residents has been
steadily increasing since at least 2000.
However, it is worth noticing that as a
percentage of the total federal EITC
refunds in the U.S. (which roughly
signals the relative participation of
California in the federal program), the
federal EITC refunds paid to California
residents have moderately varied over
time (see red line in Chart 3). While
consistently fluctuating since 2000
between a narrow range of 10 percent and
12 percent, federal EITC refunds to
California as a percent of total federal
EITC dollars in the nation showed a
recent small decline from 11.5 percent in
2011 to 11.25 percent in 2015. Further,
a similar decline is observed in absolute
terms. The total EITC amount claimed in
2015 was $7.6 billion dollars, while in
2014 the amount was 7.7 billion dollars.
EITC Success Story #2: Angela
Angela believes the federal and state Earned Income Tax Credits make a big
difference in helping her make ends meet. With the addition of the new California
EITC to her refund, she was surprised by the increase in her refund amount and
could not believe it was true! Angela received a $1,319 refund from Cal EITC
and $1,828 from Federal EITC. She used the refund for childcare for her
grandson – who she is raising – and to purchase four new tires for her car,
ensuring they have safe transportation. Angela was thrilled she could use her
EITC to cover these big expenses.
11
Chart 3: Federal EITC Dollars in California
and Percent of Total Federal EITC Dollars in the US
SOURCE: Internal Revenue Service (IRS)
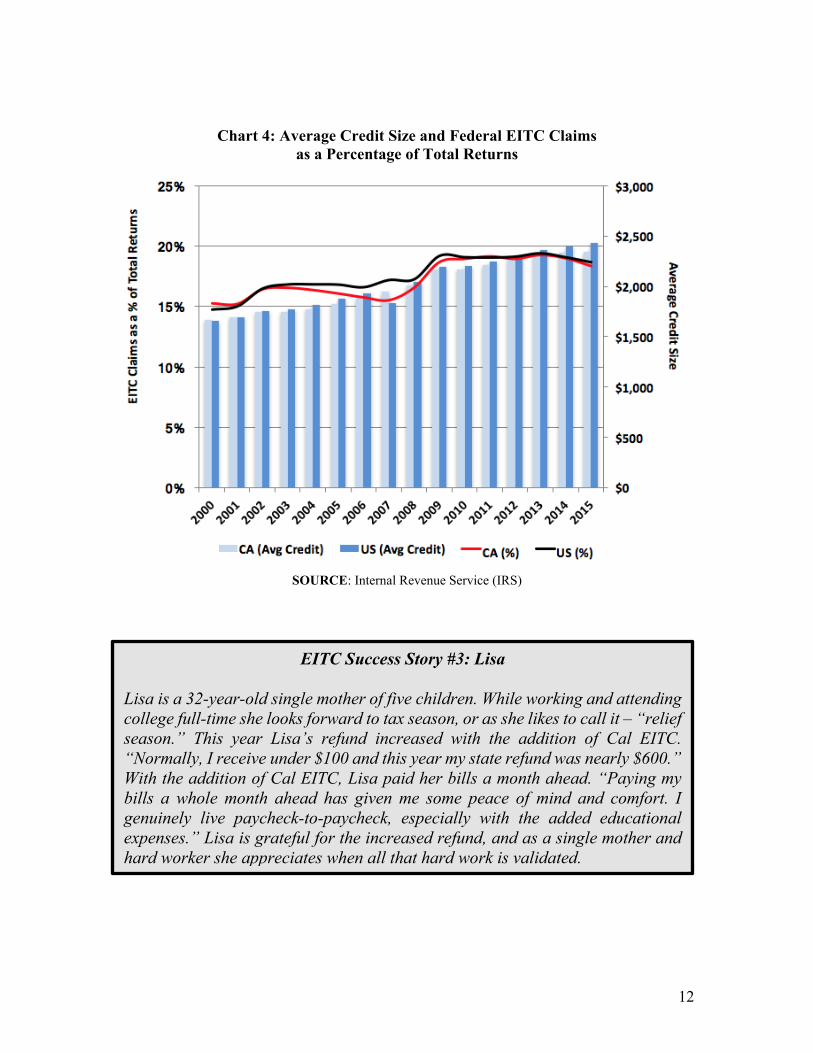
Other relevant indicators include the
average federal EITC credit size and the
total federal EITC claims as a percentage
of the total returns filed every year. This
information is shown in Chart 4. The
average size credit claimed by California
residents has gradually increased since
2000 to reach $2,346 in tax year 2015.
However, except for 2000 and 2007,
years in which the average credit size in
California was slightly above the average
credit size for the nation as whole, for all
other years since 2000 the California
average credit size has been below the
one for the country by an average of two
percent.
Finally, since 2000 total federal EITC
claims as a percentage of the total returns
showed a slightly upward trend for both
California and the U.S. until 2013, when
this indicator reached a peak at 19.4
percent and then it declined to 18.6
percent in 2015. This indicates that
around one in every five filing a tax return
also claims EITC dollars. It is also
important to notice that although
California has closely reflected this
national trend, it deviated to some extent
between the years 2004 and 2008 (see
lines in Chart 4), when this indicator for
California declined below the one for the
country by as much as 1.7 percentage
points in 2007. More recently (2009-
2015), however, California has caught up
with the national trend.
12
Chart 4: Average Credit Size and Federal EITC Claims
as a Percentage of Total Returns
SOURCE: Internal Revenue Service (IRS)
EITC Success Story #3: Lisa
Lisa is a 32-year-old single mother of five children. While working and attending
college full-time she looks forward to tax season, or as she likes to call it – “relief
season.” This year Lisa’s refund increased with the addition of Cal EITC.
“Normally, I receive under $100 and this year my state refund was nearly $600.”
With the addition of Cal EITC, Lisa paid her bills a month ahead. “Paying my
bills a whole month ahead has given me some peace of mind and comfort. I
genuinely live paycheck-to-paycheck, especially with the added educational
expenses.” Lisa is grateful for the increased refund, and as a single mother and
hard worker she appreciates when all that hard work is validated.
13
At the county level, the federal EITC
claims made by California residents in
2015 are shown in Table 1. For
comparison purposes, Table 2 also shows
the same indicators with data for 2006,
which is the year examined in the “Left on
the Table” report. Lastly, Table 3 shows
the growth rate between 2006 and 2015
for each indicator contained in Tables 2
and 3. The data reveals several salient
facts.
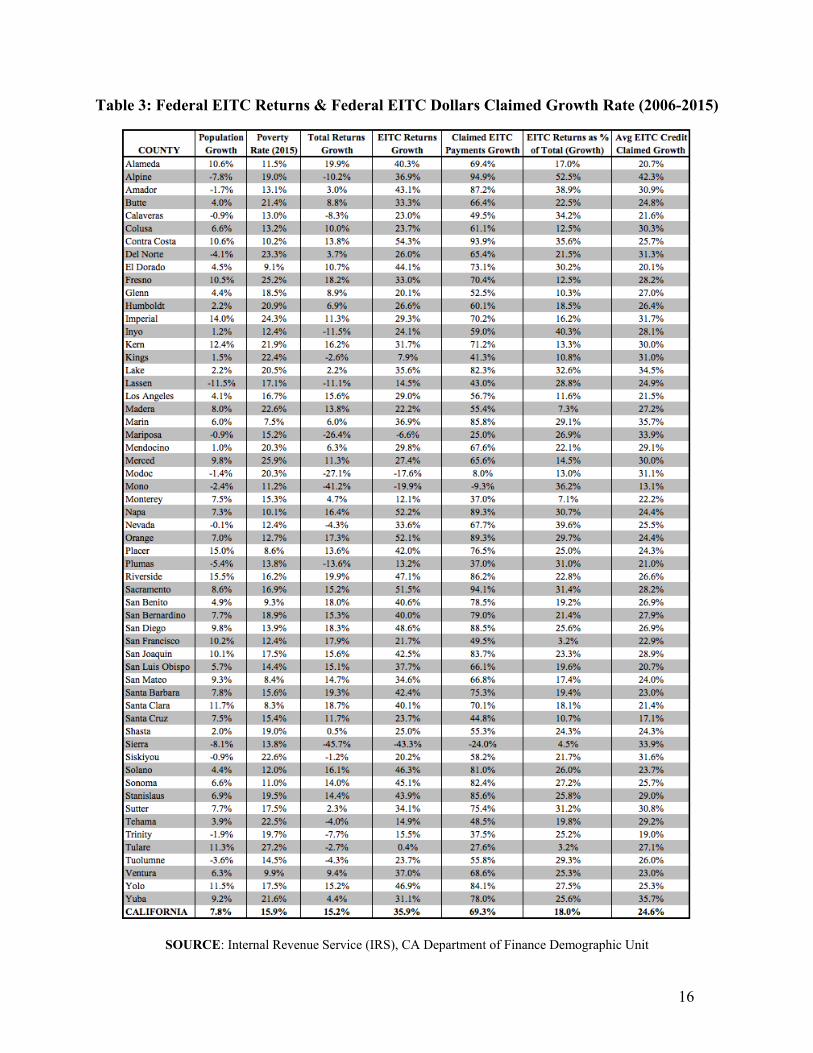
First, for the whole state, from 2006 to
2015 both federal EITC claims as a
percentage of the total number of returns
and the average federal EITC credit
claimed grew more (18.0 percent and
24.6 percent respectively) than the state
population (7.8 percent), as well as more
than the total number of returns (15.2
percent). These facts suggest a higher
participation of California residents in the
federal EITC program, which is not
unexpected given that the state poverty
rate increased from 12.2 percent in 2006
to 14.6 percent in 2015, as shown in Chart
5. It is worth highlighting that during this
time (2016 through 2015), the average
annual poverty rate in California
exceeded the national poverty rate by 0.8
percentage points.
Second, during the period under
examination (2006-2015), 15 counties
experienced a decline in population and
thus a reduction in the total number of
returns, except Del Norte; that shows an
increase in total returns despite the
population reduction. Most of these
counties however (Alpine, Amador,
Calaveras, Del Norte, Lassen, Nevada,
Plumas, Siskiyou, Trinity and
Tuolumne), despite the decline in the
population, also experienced an increase
in the number of federal EITC claims as
well as an increase in the total federal
EITC dollars claimed. Only four counties
(Mariposa, Modoc, Mono and Sierra)
registered a decline in both population
and number of EITC claims.
Third, in four counties (Contra Costa,
Napa, Orange and Sacramento), both the
number of federal EITC claims and the
total federal EITC dollars claimed
significantly increased by more than 50
percent and 85 percent respectively. This
indicates a significantly higher
participation of California residents in the
EITC program in these counties.
Finally, as during years 2006 and 2012, in
2015, Los Angeles County registered the
largest amount of federal EITC dollars
claimed, while Alpine showed the lowest.
Also, as in year 2006, in 2015, Marin
County showed the lowest federal EITC
returns as a percentage of total returns,
while Imperial County registered the
highest. These observations are not
unexpected giving the positive
correlation between county population
size and the number of federal EITC
claims (i.e. more people implies more
federal EITC claims), as well as the
strong negative correlation between
household income and federal EITC
program participation (i.e. higher
household income implies less household
federal EITC claims).

14
Table 1: Federal EITC Returns & Federal EITC Dollars Claimed in 2015 by County
SOURCE: Internal Revenue Service (IRS)

15
Table 2: Federal EITC Returns & Federal EITC Dollars Claimed in 2006 by County
SOURCE: Internal Revenue Service (IRS)
16
Table 3: Federal EITC Returns & Federal EITC Dollars Claimed Growth Rate (2006-2015)
SOURCE: Internal Revenue Service (IRS), CA Department of Finance Demographic Unit

17
Chart 5: California and United States Poverty Rate (1990-2016)
SOURCE: U.S. Census Bureau
Table 4 shows that the $7.6 billion federal
EITC dollars claimed in 2015 generated a
total economic impact of $9.6 billion in
business sales (output), supported more
than 62,000 jobs10, and created more than
$3.3 billion in labor income.11
Among the counties that experienced the
largest impact, Los Angeles, Riverside
and San Bernardino stand out with a
combined employment impact of over
28,500 jobs. Other regions that registered
high poverty rates, for example San
Joaquin Valley counties (Fresno, Madera,
Merced, Kern, Kings, San Joaquin,
Stanislaus and Tulare), the data show a
combined business sales (output) impact
of more than $1.5 billion dollars and a
combined employment impact of over
9,600 jobs. If the federal EITC program
did not exist (or if no state resident had
claimed the credit), none of these impacts
would have occurred.
10 Jobs include total wage and salary employees,
including both full-time and part-time jobs.
11 Appendix A contains a thorough description of
the economic impact methodology and multiplier
analysis.

18
Table 4: Economic Impact of the Federal EITC in California by County (2015)
SOURCE: Internal Revenue Service (IRS), IMPLAN

19
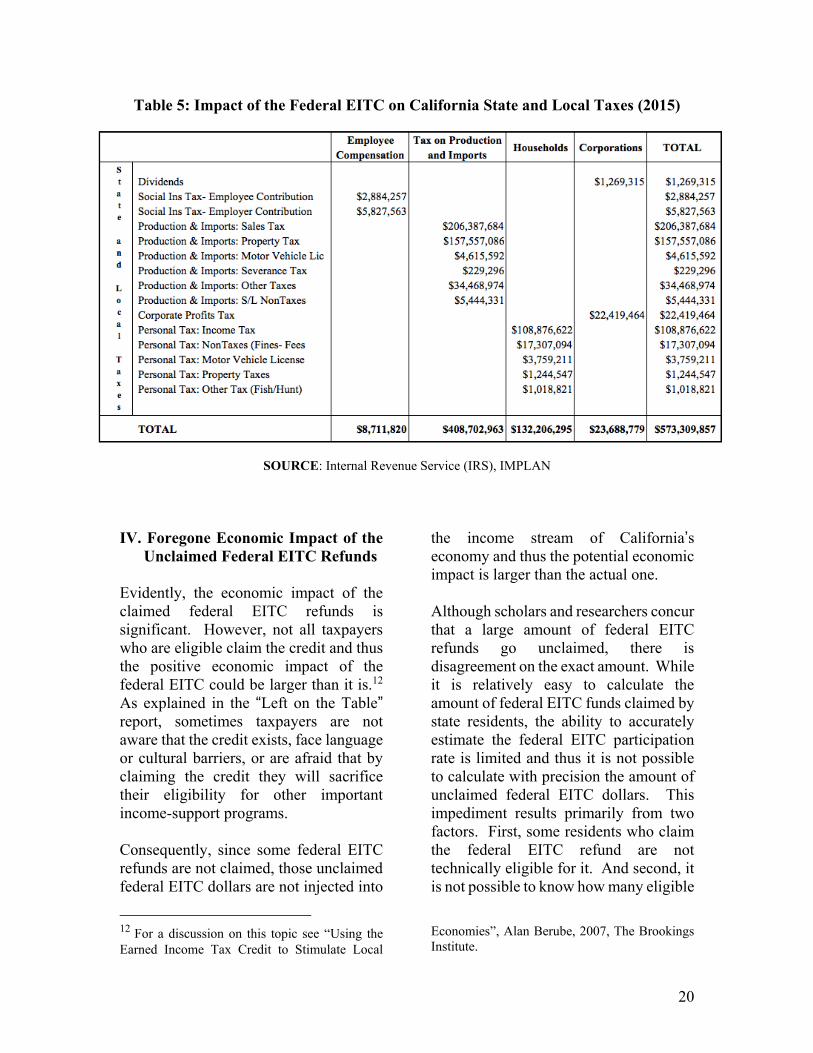
The spending of federal EITC refunds
eventually results in additional tax
revenue for the cities, counties and for the
state as presented in Table 5. The
multiplier effect of federal EITC dollars
spent in California’s economy generates
more than $573 million in tax revenue,
and 36 percent of this amount comes from
sales taxes alone. The methodology
employed to calculate the fiscal impact
(IMPLAN) does not produce separate
reports for the state and local
governments. Thus, the estimates include
total estimated tax revenue for all levels
of government (state, county and city).
However, the tax revenue produced by
each county is proportional to the overall
economic impact.
An Illustrative Example of the Economic Impact of EITC
Imagine Linda is a single mother of three who lives in Los Angeles County. Linda
makes $16,000 a year working in a restaurant and has no significant investment
income. Linda is eligible for an EITC payment of around $5,600. Suppose Linda
saves 10%, $560, and spends the rest, $5,040, on school clothes and supplies at
Max’s store in San Bernardino. This $5,040 is income for Max. After Max
withholds his income tax, he is left with $4,000, which he uses for a down payment
on a new car at Nell’s Autos. This $4,000 is income for Nell. After taxes, Nell
spends $3,000 on a new stereo at Ophelia’s, who spends $2,000 (her after-tax
income) on tuition and books at Paula’s Cosmetology school. Paula spends her
after-tax income of $1,000 on a vacation to Canada.
In this simple illustrative exercise, the initial EITC payment of $5,600 generated
$14,040 ($5,040 + $4,000 + $3,000 + $2,000) in new labor income in the State.
The initial $5,600 also generated new economic output and tax revenue each time
it was re-spent, so the economic impact of the EITC revenue was much larger over
time than the initial payment. This phenomenon is known as the multiplier effect
of the EITC payment. For a more thorough description of the economic impact
and multiplier analysis, see Appendix A. The magnitude of the multiplier effect
depends on the savings rate of the economic participants and the amount of
resources that leave the State during each round of spending. The $560 that Linda
saved and the $1,000 that Paula spent on her vacation represent "leakages" from
the State income stream.
20
Table 5: Impact of the Federal EITC on California State and Local Taxes (2015)
SOURCE: Internal Revenue Service (IRS), IMPLAN
IV. Foregone Economic Impact of the
Unclaimed Federal EITC Refunds
Evidently, the economic impact of the
claimed federal EITC refunds is
significant. However, not all taxpayers
who are eligible claim the credit and thus
the positive economic impact of the
federal EITC could be larger than it is.12
As explained in the “Left on the Table” report, sometimes taxpayers are not
aware that the credit exists, face language
or cultural barriers, or are afraid that by
claiming the credit they will sacrifice
their eligibility for other important
income-support programs.
Consequently, since some federal EITC
refunds are not claimed, those unclaimed
federal EITC dollars are not injected into
12 For a discussion on this topic see “Using the
Earned Income Tax Credit to Stimulate Local
the income stream of California’s
economy and thus the potential economic
impact is larger than the actual one.
Although scholars and researchers concur
that a large amount of federal EITC
refunds go unclaimed, there is
disagreement on the exact amount. While
it is relatively easy to calculate the
amount of federal EITC funds claimed by
state residents, the ability to accurately
estimate the federal EITC participation
rate is limited and thus it is not possible
to calculate with precision the amount of
unclaimed federal EITC dollars. This
impediment results primarily from two
factors. First, some residents who claim
the federal EITC refund are not
technically eligible for it. And second, it
is not possible to know how many eligible
Economies”, Alan Berube, 2007, The Brookings
Institute.
21
families there are at the county or state
level, and therefore is impossible to
calculate how many eligible families fail
to claim the federal EITC. Thus, given
that one of the goals of this report is to
compare the actual and foregone 2015
economic impact of the federal EITC
claimed and unclaimed refunds in
California with those estimated in the
“Left of the Table” report, this analysis
employs similar assumptions to calculate
the amount of unclaimed federal EITC
dollars in 2006 as discussed next.
In 2001, the U.S. General Accounting
Office (GAO) estimated that the average
EITC participation rate for the whole
country was approximately 75 percent
(thus 25 percent of the eligible population
does not claim the federal EITC). 13
However, some researchers argued that
this estimate for the federal EITC
participation rate was too low and
contested GAO’s methodology because
the report was based on information from
two mismatched databases.14 In 2002, the
IRS released a report estimating the
national federal EITC non-filer rate to be
17.8 percent using the Census Bureau’s
Survey of Income and Program
Participation. 15 Further, the same IRS
report lists California as having the third
highest federal EITC non-filer rate (24.9
percent) in the nation (after DC and
Nevada). In 2005, the IRS released
another report estimating the national
federal EITC non-filer rate to be 25.0
percent using the Census Bureau’s
Annual Social and Economic Supplement
of the Current Population Survey.16 As
discussed in the “Left of the Table”
report, scholars have more confidence in
the IRS estimate due to the methodology
employed. This report assumes a federal
EITC non-filer rate of 25 percent and uses
this number to estimate the amount of
unclaimed federal EITC payments.
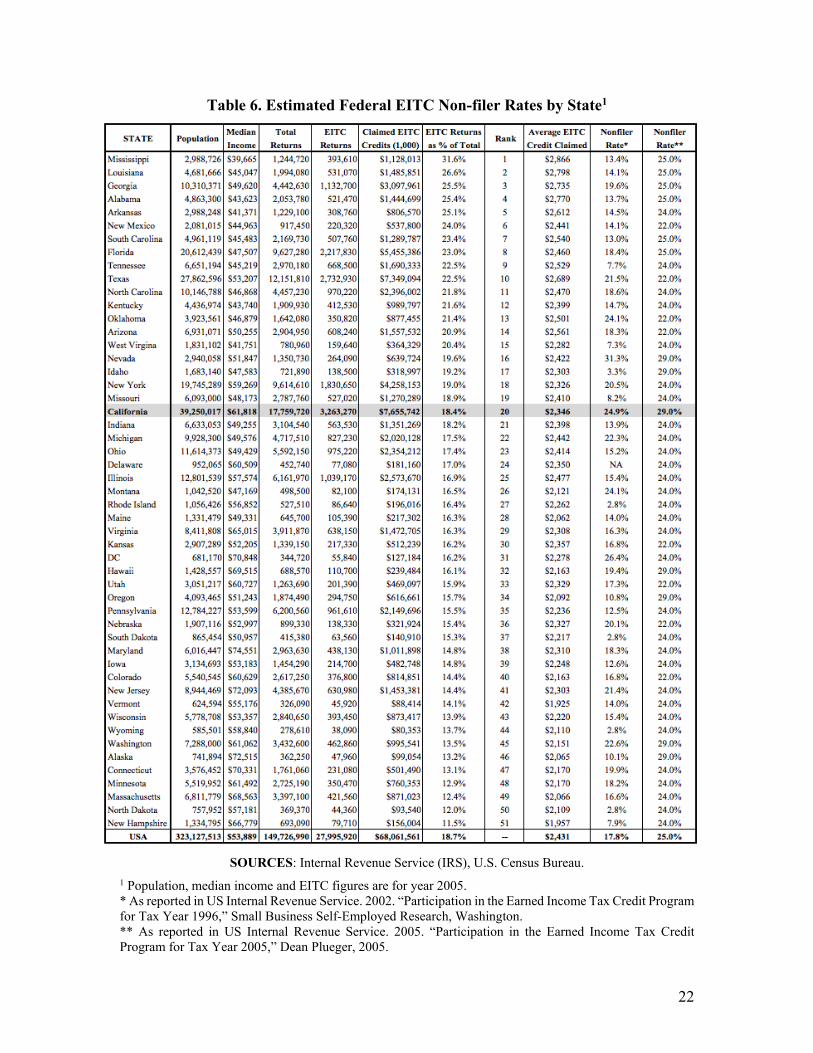
For comparison purposes, Table 6 shows
the IRS-estimated EITC non-filer rates
for all states supplemented by data by the
U.S. Census Bureau.17 Notice that those
states with low median household income
levels exhibit the largest federal EITC
claims as a fraction of total returns, and
tend to show low non-filer rates
(Mississippi for instance).
13 US General Accounting Office, 2001, “Earned
Income Tax Credit Participation”, GAO-02-
290R. 14 Burman, Leonard E., and Deborah Kobes.
2002. “Analysis of GAO Study of EITC
Eligibility and Participation.” Washington: Urban
Institute. 15 US Internal Revenue Service. 2002.
“Participation in the Earned Income Tax Credit
Program for Tax Year 1996.” Small Business
Self-Employed Research, Washington. 16 US Internal Revenue Service. 2005.
“Participation in the Earned Income Tax Credit
Program for Tax Year 2005,” Dean Plueger. 17 Figures for population, median income and
EITC returns correspond to year 2015.
22
Table 6. Estimated Federal EITC Non-filer Rates by State1
SOURCES: Internal Revenue Service (IRS), U.S. Census Bureau.
1 Population, median income and EITC figures are for year 2005.
* As reported in US Internal Revenue Service. 2002. “Participation in the Earned Income Tax Credit Program
for Tax Year 1996,” Small Business Self-Employed Research, Washington.
** As reported in US Internal Revenue Service. 2005. “Participation in the Earned Income Tax Credit
Program for Tax Year 2005,” Dean Plueger, 2005.

23
In line with the “Left of the Table” report,
it should be noted that the under-
participation in the federal EITC program
not only results in lost resources for
California, but also entails social costs
that are more difficult to measure. For
example, some federal EITC recipients
file their tax returns through a paid tax
preparer and often pay large sums for this
service. 18 While this practice does not
necessarily limit the amount of federal
EITC resources that are injected into
California’s revenue stream, it does
represent an unintended use of public
funds. In these situations, federal EITC
resources that are aimed to help the
working poor are diverted to financial
professionals. This practice represents a
social cost since, although difficult to
quantify, these public funds are not being
used as intended.
Further, the average credit owed to
eligible federal EITC recipients who
failed to claim the credit is likely lower
than for the average actual claimant
because these two groups of individuals
have different characteristics. Like the
assumption made in “Left of the Table”
and following what other researchers
have done, the average credit received is
multiplied by 75 percent to obtain a more
accurate picture of the average credit
owed to eligible federal EITC recipients
who failed to claim the credit.19
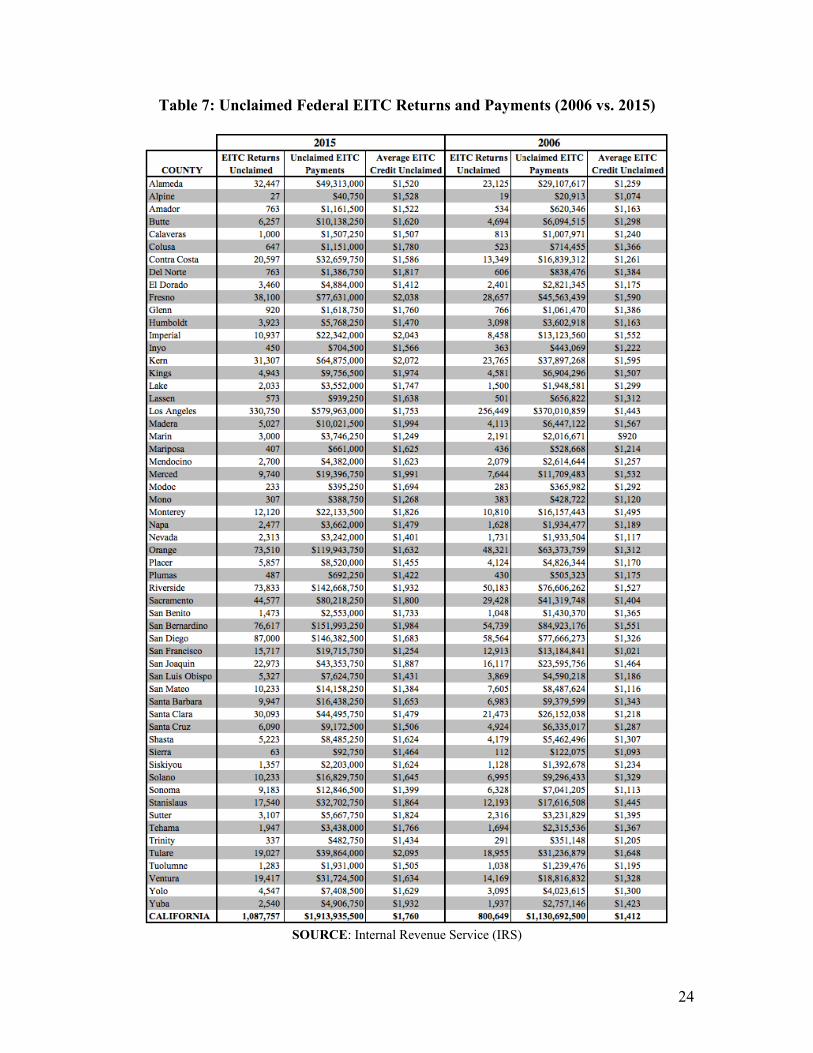
This calculation is then used to estimate
the number of unclaimed federal EITC
returns (an estimate of the number of
individuals that fail to claim the credit).
The estimate of unclaimed federal EITC
returns is obtained by dividing the total
amount of unclaimed EITC payments by
the estimated average credit owed to
eligible EITC recipients who failed to
claim the credit. Table 7 shows these
calculations, which for comparison
purposes, contains both the data for 2006
and for 2015.
The data illustrate at least two salient
facts. First, for the whole state of
California, between 2006 and 2015, the
number of claimed federal EITC returns
grew by 35.9 percent (from 2,401,947 to
3,263,270), unclaimed federal EITC
payments grew by 69.3% (from
$1.1billion to $1.9 billion), and the
average size of the unclaimed federal
EITC payment grew by 24.6 percent
(from $1,412 to $1,760). Second, for
relatively small counties the number of
unclaimed federal EITC returns increased
significantly showing rates of over 50
percent (such as Contra Costa, Napa,
Orange and Sacramento). On the other
hand, in a few counties the number of
unclaimed federal EITC returns increased
only by a few percentage points (like
Kings and Tulare), while in others this
indicator declined (like in Mariposa,
Modoc, Mono and Shasta).
18 See “Another Year of Losses: High-Priced
Refund Anticipation Loans Continue To Take a
Chunk Out Of Americans’ Tax Refunds”, 2006,
Chi Chi Wu, National Consumer Law Center and
“One Step Forward, One Step Back: Progress
Seen in Efforts Against High-Priced Refund
Anticipation Loans, but Even More Abusive
Products Introduced”, 2007, Chi Chi Wu,
National Consumer Law Center and Jean Ann
Fox, Consumer Federation of America. 19 See for example “EITC Interactive: User Guide
and Data Dictionary”, Alan Berube, The
Brookings Institution.
24
Table 7: Unclaimed Federal EITC Returns and Payments (2006 vs. 2015)
SOURCE: Internal Revenue Service (IRS)
25
As discussed in the “Left on the Table”
report, the proportion of individuals not
claiming the federal EITC credit is
unlikely to be 25 percent uniformly in all
counties. This is due to the different
characteristics among counties,
particularly economic and demographic.
The IRS identified that the proportion of
those failing to claim the federal EITC
credit is higher: (1) in areas of high
concentration of Hispanics; (2) among
individuals with lower incomes than
eligible individuals who filed a tax return
to get the federal EITC; (3) among
individuals who participated in food
stamp assistance programs; and (4)
among those with no qualifying children.
In counties where the demographic
profile indicates a prevalence of these
factors, the actual non-filer rate is likely
to be higher than the assumed 25 percent.
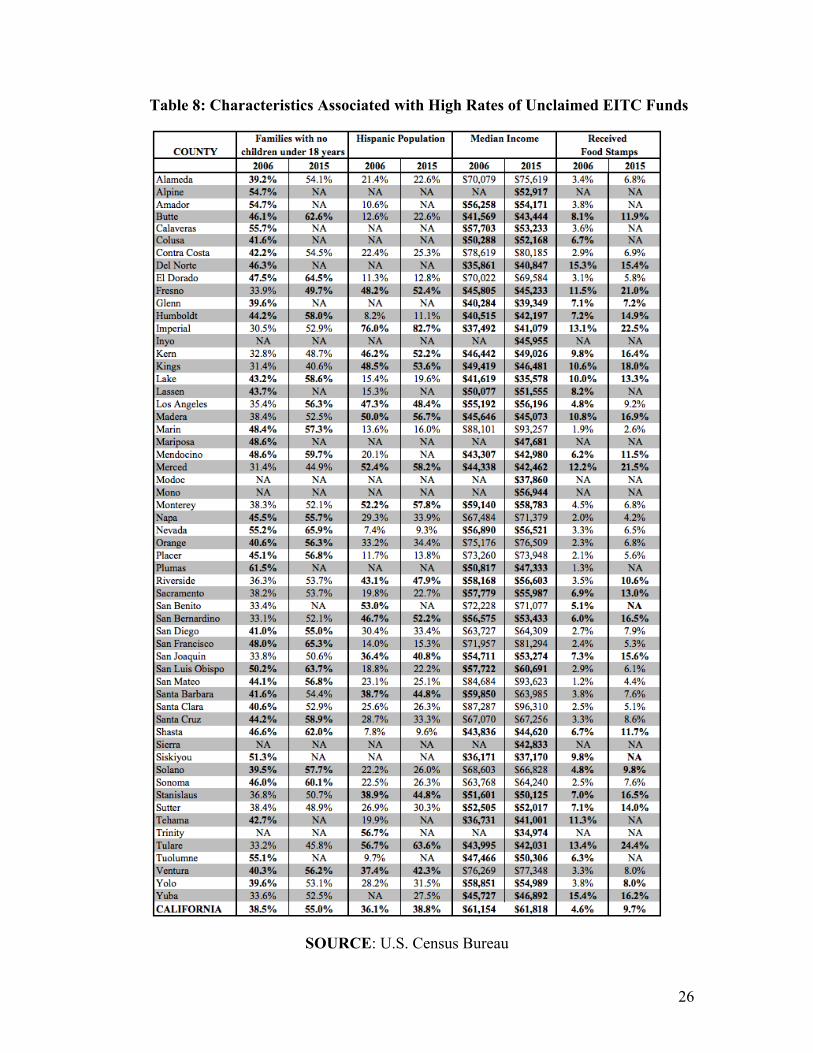
Table 8 shows these characteristics by
county for 2006 and 2015. The numbers
in bold font indicate that the given
characteristic in that county is more
prevalent than the average for the state.
For example, in Fresno County, the
concentration of Hispanics, the
proportion of households with no
qualifying children and the percentage of
households receiving food stamps are
higher than the state average, while the
household median income is lower.
These numbers suggest that the
proportion of eligible individuals not
claiming the federal EITC credit in
Fresno County is likely to be higher than
25 percent. Thus, while it is not possible
to accurately assess how much higher
without resorting to arbitrary
calculations, it is probably reasonable to
assume a non-filer rate higher than 25
percent in the counties with prevalent
non-filer characteristics, which is the rate
reported as the state average by the IRS.
Alameda County, on the other hand,
which shows a relatively lower
concentration of Hispanics, a lower
proportion of households with no
qualifying children and a lower
percentage of households receiving food
stamps than the state average, the
proportion of eligible individuals not
claiming the federal EITC credit is likely
to be closer to the 25 percent assumed
average for the state.
As presented, a significant amount of
unclaimed federal EITC payments are not
injected into the state’s revenue stream
when eligible residents fail to claim them.
These foregone transfer payments
represent a lost opportunity to generate
new business sales, income and tax
revenue, as well as to support more jobs.
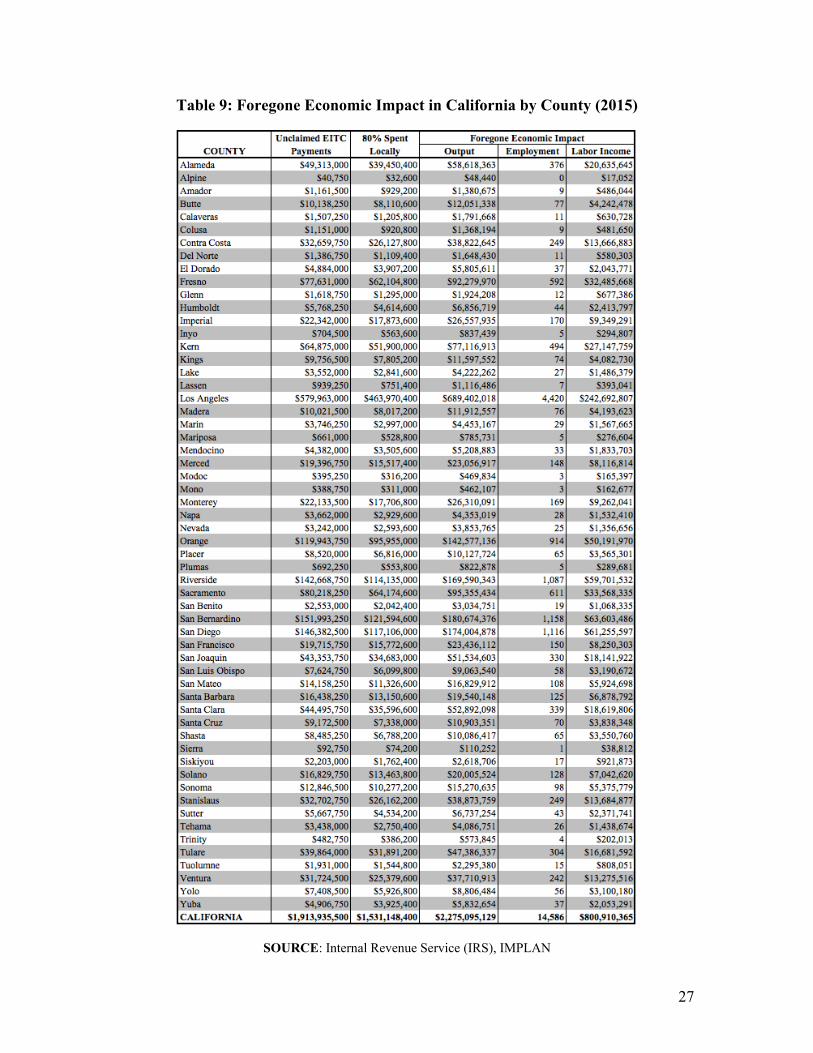
Table 9 shows the foregone economic
impact of the unclaimed federal EITC
payments by county. The estimates show
that if California eligible residents fully
participated in the federal EITC program
and if they spent 80 percent of the
payments in California, then these federal
EITC resources would create near $2.3
billion in additional business sales
(output), support over 14,500 additional
jobs and create more than $800 million in
wages or labor income. Further, most of
the estimated foregone revenue is
concentrated in Los Angeles, Riverside
and San Bernardino counties, with a
combined foregone business sales impact
of over $1 billion and a combined
foregone employment impact of over
6,600 jobs. The San Joaquin Valley
counties (Fresno, Madera, Merced, Kern,
Kings, San Joaquin, Stanislaus and
Tulare) suffer a combined foregone
business sales (output) impact of more
than $353 million and a foregone
employment impact of over 2,200 jobs
due to low take-up of the credit.
26
Table 8: Characteristics Associated with High Rates of Unclaimed EITC Funds
SOURCE: U.S. Census Bureau
27
Table 9: Foregone Economic Impact in California by County (2015)
SOURCE: Internal Revenue Service (IRS), IMPLAN

28
Finally, if California residents claimed
the estimated unclaimed federal EITC
payments, more than $150 million in
additional tax revenue would be
generated at all levels of government
(state, county and city). Table 10 shows
the foregone impact of federal EITC
refunds on state and local taxes, with
separate totals of foregone revenue.
Table 10: Foregone Economic Impact of the Federal EITC on California
State and Local Taxes (2015)
SOURCE: Internal Revenue Service (IRS), IMPLAN
V. Claimed California EITC Refunds
and its Economic Impact
During the 2016 fiscal year, 368,343
Californians claimed the California EITC
for a total of $196.1 million. Although
the number of claims was lower than the
claims made in 2015 (373,299), the total
dollar amount claimed was slightly
higher by $0.6 million. The average
claimed credit in 2016 was $532, which
is also $8 higher than the previous year.
Los Angeles County alone, which is the
most populous county in the state,
accounted for 23 percent of the total
claimed California EITC in 2016 with
near $45 million. Among other relative
low-income areas at least two regions are
worth highlighting. One, Riverside and
San Bernardino counties combined
claimed $28.7 million in 2016 (close to
15 percent of the total claimed in the
state). And two, the San Joaquin Valley
counties combined (Fresno, Madera,
Merced, Kern, Kings, San Joaquin,
Stanislaus and Tulare) claimed $39.0
million in 2016 (close to 20 percent of the
total claimed in the state).
29
It is also relevant commenting that there
are objective reasons to expect that the
California EITC could increase
participation in the federal EITC
program.20 First, many of the low-income
working families targeted by the EITC
programs, although eligible, are not
always familiar with the available credits
or even required to file a tax return.
Consequently, since the creation of the
California EITC, state and local
governments, as well as the IRS and an
assorted variety of community-based
organizations and non-profits, have
engaged in significant outreach efforts to
promote both the California and federal
EITC. As part of this effort, the State
Interagency Team (SIT) Workgroup to
Reduce Poverty was formed to coordinate
the delivery of education and outreach for
the California and federal EITC, and to
thereby increase the number of low-
income tax filers by increasing awareness
of the tax credits. Second, since the
California EITC constitutes a supplement
to the federal EITC, it increases the
effective wage an eligible worker can
earn. Thus, the positive effect on
employment as well as on federal EITC
participation are enhanced, particularly
among single taxpayers such as single
mothers.
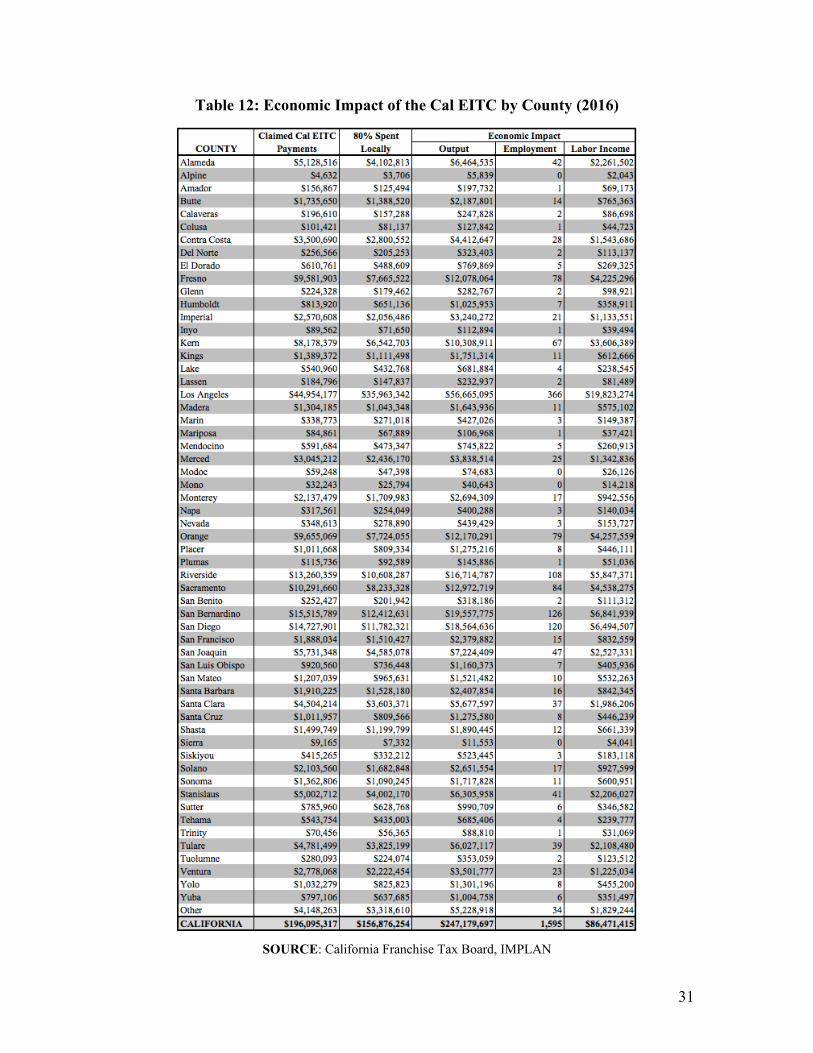
Finally, as explained in Appendix A, the
calculation of the economic and fiscal
impact of the California EITC employs
the same assumptions made to calculate
the impact of the federal EITC. This
includes the assumption that 80 percent
of the California EITC payments made to
California residents are spent within the
state’s economy. That is, the other 20
percent produces no impacts within the
state. Table 12 shows that the 196.1
million California EITC dollars claimed
in 2016 generated a total economic
impact of $247.1 million in business sales
(output), supported 1,595 jobs 21 , and
created more than $86.4 million in labor
income.22 If the California EITC program
did not exist (or if no resident had claimed
it), none of these impacts would occur.
20 See for example: “Do State Earned Income Tax
Credits Increase Participation in the Federal
EITC?”, David Neumark and Katherine E.
Williams, ESSPRI Working Papers # 20163,
University of California, Davis.
21 Jobs include total wage and salary employees,
including both full-time and part-time jobs. 22 Appendix A contains a thorough description of
the economic impact methodology and multiplier
analysis.

30
Table 11: Cal EITC Returns and EITC Dollars Claimed by County
* Fewer than 10 returns SOURCE: California Franchise Tax Board
31
Table 12: Economic Impact of the Cal EITC by County (2016)
SOURCE: California Franchise Tax Board, IMPLAN

32
The spending of California EITC refunds
eventually results in additional tax
revenue for the cities, counties and for the
state as presented in Table 13. The
multiplier effect of the 2016 California
EITC dollars spent in California’s
economy generated $15.4 million in tax
revenue, and 36 percent of this amount
comes from sales taxes alone. As
explained before, the methodology
employed to calculate the fiscal impact
(IMPLAN) does not produce separate
reports for the state and local
governments. Thus, the estimates include
total estimated tax revenue for all levels
of government (state, county and city).
However, the tax revenue produced by
each county is proportional to the overall
economic impact.
Table 13: Economic Impact of the California EITC on
State and Local Taxes (2016)
SOURCE: California Franchise Tax Board, IMPLAN

33
VI. Concluding Remarks
Both federal and California EITC
programs represent an important source
of business sales, revenue for state and
local governments, as well as income for
the working families who receive the
EITC refunds. Using conservative data
and assumptions, this report estimates
that the 7.6 billion federal EITC dollars
claimed in 2015 generated a total
economic impact of $9.6 billion in
business sales (output), supported more
than 62,000 jobs, created more than $3.3
billion in labor income and $15.4 million
in tax revenue. Similarly, 196.1 million
California EITC dollars claimed in 2016
resulted in a total economic impact of
$247.1 million in business sales (output),
supported more than 1,595 jobs, created
more than $86.4 million in labor income,
and $548 million in tax revenue.
Yet, many eligible families within
California failed to claim these credits.
Findings of this updated report suggest
that the estimated number of Californians
failing to claim the federal EITC refunds
has remained high along with the number
of dollars left on the table. Based on the
data examined for tax year 2015,
estimates indicate that California
residents failed to claim over $2.3 billion
in federal EITC payments for which they
are eligible. If these federal payments
had been claimed, economic activity
resulting from the payments would have
supported an additional 14,500 jobs and
created more than $800 million dollars in
new labor income each year. These
foregone federal payments, if claimed,
would have also generated more than
$150 million dollars in additional tax
revenue for state and local governments.
As argued in the previous update, it must
be considered that from December 2007
to June 2009 the U.S. economy suffered
from a severe and prolonged economic
recession that considerably increased the
number of poor households, many of
which have not fully recovered from the
dire conditions they went through. Some
households that have been poor for years
continued claiming federal EITC refunds,
but some new poor households are not
claiming federal EITC refunds. The data
collected in this report show that the
number of Californians claiming the
federal EITC refunds has increased along
with the number of dollars injected into
the state’s income stream. Both federal
EITC claims as a percentage of the total
number of returns as well as the average
EITC credit claimed, grew more than the
state population and more than the total
number of returns. This suggests that
although the gap between potential
federal EITC payments and actual EITC
payments is still large, it could have been
larger if all the efforts and awareness
campaigns about this important federal
program had not taken place.

34
APPENDIX A: Data, Scope and Economic Impact Methodology
Using federal and California EITC
payments data for the state (collected
from the IRS and the California FTB),
and focusing on the state’s economy and
on each of its 58 counties, the report: a)
assesses the economic impact of the
federal and California EITC programs as
resources are injected into the state’s
revenue stream; b) estimates the amount
of foregone federal EITC dollars that
state residents leave unclaimed; and c)
assesses the foregone economic impact of
unclaimed federal EITC dollars when the
foregone resources never make it into the
state’s revenue stream and, thus never
circulate in the state economy. In each
region (state and counties), the economic
impact (or lack thereof) of the EITC
attributable to the tax credit payments is
linked to the ways recipients spend this
income.
This report measures the impact of the
EITC in four different areas: 1)
Additional business sales (output
impact); 2) Number of jobs that these
benefits payments support directly and
indirectly (employment impact); 3)
Additional labor income (income
impact); and 4) Additional state tax
revenue (fiscal impact). Chart A1
illustrates the conceptual framework of
this economic impact analysis.
Chart A1: Conceptual Framework
The report calculates the economic
impact of the federal EITC for 2015 and
the economic impact of the California
EITC for 2016 the most recent years for
which data is available. Since EITC
eligibility is based on earned income,
federal EITC payments and their
associated economic impact in the state
are likely to be different in 2016.
However, due to data limitations derived
from the fact that the IRS releases these
data with a lag of at least one year, 2015
is the most up to date year for which the
economic impact assessment can be
performed.
Additionally, the calculation of the
economic impact understates the
potential impact of the federal and
California EITC programs on low-
income families in the state for two
reasons: (1) not all eligible taxpayers
claim the credit; and (2) not all taxpayers
claiming the EITC credit get the entire
amount for which they are eligible
(mainly because they use the services of
EITC Credit
Payments
Expenditures by
EITC
Recipients
Economy of the
State
Employment
Impact
Fiscal Impact
Income Impact
Output Impact
35
a professional tax preparer, sometimes
for a very high fee).
The impact of the federal and California
EITC dollars in California is smaller
when there are income leakages mainly in
the form of savings withheld and dollars
spent outside the state’s economy.
Accurately determining which
percentage of the EITC payments is spent
in California would probably require an
expensive primary data collection
instrument, such as a survey. Instead,
following the methodology employed in
the original “Left on the Table” report to
account for initial expenditures leakages,
it is assumed that 80% of the federal and
California EITC payments made to
California residents are spent within the
state’s economy.23 This assumption is a
conservative one considering (1) the low
mobility of low-income families, (2)
empirical evidence showing the low
savings rate (and negative in some cases)
for low-income families, and (3) the
geography of California, which is
bounded on three sides by mountains,
deserts and an ocean. This report also
assumes that EITC dollars will be spent
following a typical pattern for households
with incomes between $15,000 and
$30,000. In other words, it is assumed
that the spending profile of EITC
recipients resembles one of typical
families earning this income level.
The analysis mainly relies on the use of
input-output (IO) models and associated
databases, which are techniques for
quantifying interactions among firms,
23 The Jacob France Institute of the University of
Baltimore in its 2004 study “The Importance of
the Earned Income Tax Credit and Its Economic
Effects in Baltimore City” assumes that two-
thirds of the payments made to city residents were
re-spent within the City. Similarly, John Haskell
at Vanderbilt University in his 2006 study “The
industries, and social institutions within a
regional economy. IO models are the
standard techniques that regional
economists use to conduct economic
impact analysis. In particular, the report
makes extensive use of IMPLAN
economic impact data and analysis
software. 24 The total economic impact
(also known as the multiplier effect) of
the EITC is equal to the sum of three
components: the direct effect, the
indirect effect and the induced effect.
The direct effect is the immediate upshot
caused by residents when they spend their
EITC payments. Due to the interactions
between firms, industries, and social
institutions that naturally occur within the
regional and state economy, the direct
effect initiates a series of iterative rounds
of income creation, spending and re-
spending that result in indirect and
induced effects. The indirect effects are
changes in production, employment and
income that result from the inter-industry
purchases triggered by the direct effect.
Finally, induced effects arise due to
changes in household income and
spending patterns caused by direct and
indirect effects. Since the total impact of
the EITC payments that are spent within
the regional economy is a multiple of the
initial expenditures, the total effect is
expressed as a multiplier effect.
Therefore, the total impact of the EITC
payments spent within the regional and
state economy as estimated by IMPLAN
is larger than the initial expenditures.
The increases in economic activity
resulting from the multiplier process
State of the Earned Income Tax Credit in
Nashville: An Analysis of Economic Impacts and
Geographic Distribution of the ‘Working Poor’
Tax Credit, TY 1997-2004” assumes that 87% of
the EITC disbursements would be spent within
the Nashville region. 24 www.implan.com

36
become smaller with each round due to
leakages from the spending stream.
Furthermore, spending on goods and
services that are not produced within the
regional economy do not generate
additional regional spending. Therefore,
the multiplier process traces the flows of
spending and re-spending until the initial
expenditures have completely leaked out
to other regions. To properly estimate the
effects at the regional level, an
adjustment known as the regional
purchase coefficient is implemented
within the IMPLAN system.

37
About the University Business Center (UBC)
The UBC serves as the outreach arm for the Craig School of Business at Fresno State by
offering professional development programs and state-of-the-art meeting facilities. The
UBC focuses on providing business and professionals with services and resources to foster
growth, create jobs and develop a prosperous economy. The UBC's present facilities were
built in 1987 with donations from private businesses. The UBC has an impressive history
of serving private enterprises and public organizations throughout California’s Central
Valley.
Biographical Sketch of the Author
Dr. Antonio Avalos
Dr. Antonio Avalos specializes in forensic economics, economic development, regional
economics, and international economics. He holds a Ph.D. in Economics and a M.S. in
Economics from Oklahoma State University. In the past, Dr. Avalos has worked as
Herman Kahn Fellow at the Hudson Institute in Indianapolis, and later as an external
consultant for the institute, conducting research on regional economics and workforce
issues. He also was a visiting scholar at the Andean Corporation of Development in
Caracas, Venezuela, where he conducted applied research in international trade, economic
development and labor markets in Latin American economies. Over the last few years, Dr.
Avalos also has participated and presented research at an assorted list of regional, national
and international conferences, including countries such as Chile, Argentina, Nicaragua,
Mexico, The Netherlands, Romania, Italy, China, and others. Currently, Dr. Avalos is a
Professor of Economics at California State University, Fresno, where he has served as a
faculty member since 2003.