madiha ali capstone
TRANSCRIPT

Supervisor’s MPP Capstone Approval Form
The attached capstone project proposal has been submitted by:
___________________________________
(Print your name in the space above)
____________________________________ __________________
(Student signature) (Date)
This capstone project proposal has been approved by:
_____________________________________
(Name of supervisor)
_____________________________________ __________________
(Supervisor’s signature) (Date)
Supervisor’s Comments (if any):
_______________________________________________________________
_______________________________________________________________
_______________________________________________________________
_______________________________________________________________
_______________________________________________________________
_______________________________________________________________
_______________________________________________________________
_______________________________________________________________
MASTER OF PUBLIC POLICY
CAPSTONE PROJECT
The effectiveness of carbon pricing: The case of Alberta and British Columbia
Submitted by:
Madiha Ali
Approved by Supervisor:
Dr. Robert Mansell
Submitted in fulfillment of the requirements of PPOL 623 and completion of the requirements for the
Master of Public Policy degree

Acknowledgements
I would like to thank Dr. Robert Mansell for his support and valuable feedback. I would also like to thank
Justin Wheler and John Storey Bishoff of Alberta Energy for their input.
Capstone Approval Page
The undersigned, being the Capstone Project Supervisor, declares that
Student Name: _________________
has successfully completed the Capstone Project within the
Capstone Course PPOL 623
___________________________________
(Name of supervisor)
_____________________________________ __________________
(Supervisor’s signature) (Date)
Table of Contents
1. Introduction ...................................................................................................................................... 1
1.1. British Columbia Carbon Tax ......................................................................................................... 3
1.2. Alberta Carbon Levy ...................................................................................................................... 5
2. Literature Review ............................................................................................................................. 7
3. Methodology .................................................................................................................................. 17
4. Data Sources, Trends and Estimates .............................................................................................. 23
4.1 Data Sources ................................................................................................................................. 23
4.2 Data Trends .................................................................................................................................. 26
4.3 Results of Estimation .................................................................................................................... 39
4.4. Discussion of Results: .................................................................................................................. 40
4.4.1 Electricity and Heat .................................................................................................................... 40
4.4.2. Oil & Gas.................................................................................................................................... 41
4.4.3. Transportation .......................................................................................................................... 42
4.4.4. Residential Buildings ................................................................................................................. 45
4.4.5. Manufacturing .......................................................................................................................... 46
4.4.6. Agriculture................................................................................................................................. 47
4.4.7. Construction .............................................................................................................................. 47
5. Conclusion and Recommendations: .............................................................................................. 47
List of Tables
Table 1 : Summary of B.C., Alberta and Saskatchewan Climate Change Initiatives .............................. 199
Table 2: Current and Proposed Levy Structures………............................................................................52

List of Figures
Figure 1: The difference-in-difference approach…………………………………………………………………………………….22
Figure 2a: Oil & Gas Emissions Intensity…………………………………………………………………………………………..27
Figure 2b: Yearly Difference in Oil & Gas Emissions Intensity .................................................................. 27
Figure 3a: Electricity & Heat Emissions Intensity………………………………………………………………………………….…29
Figure 3b: Yearly Difference in Electricity & Heat Emissions Intensity………………………………………………..……29
Figure 4a: Transportation Emissions Intensity .......................................................................................... 31
Figure 4b: Yearly Difference in Transportation Emissions Intensity……………………………………………………..31
Figure 5a: Residential Buildings Emissions Intensity...............................................................................32
Figure 5b: Yearly Difference in Residential Buildings Emissions Intensity……………………………………………..33
Figure 6a: Manufacturing Emissions Intensity…………………………………………………………………………………. 34
Figure 6b: Yearly Difference in Manufacturing Emissions Intensity……………………………………………………..34
Figure 7a: Construction Emissions Intensity…………………………………………………………………………………..…36
Figure 7b: Yearly Difference in Construction Emissions Intensity………………………………………………………. 36
Figure 8a: Agriculture Emissions Intensity………………………………………………………………………………………..37
Figure 8b: Yearly Difference in Agriculture Emissions Intensity………………………………………………..…………37
Capstone Executive Summary
The Intergovernmental Panel on Climate Change (IPCC) recently presented its Fourth Report
that contained additional evidence that human activities are a significant cause of increases in
Greenhouse Gas (GHG) emissions resulting in a warming of the climate. There has been growing
pressure on governments to substantially reduce these emissions by adopting effective policy
mechanisms.
In Canada, individual provinces have implemented a variety of approaches that best fit their
individual circumstances. This, in turn, provides an opportunity to assess the effectiveness of
different policy approaches in reducing carbon emissions. This report focuses on the relative
impacts of the carbon tax implemented by British Columbia (B.C.), and Alberta’s carbon levy.
Having neither a carbon tax or carbon levy, Saskatchewan is used as the ‘control province.’ A
difference-in-difference estimate is used to study the real mitigation effects of the carbon tax
and levy.
The results indicate that Alberta’s carbon levy has had a positive impact in reducing the
emissions intensity levels of the oil and gas, electricity and heat, transportation and residential
buildings sectors. The mitigation effects of the B.C. carbon tax were limited to the
transportation sector.
Based on the findings of the statistical analysis presented in the report, several
recommendations are made so that a greater reduction in emissions can be achieved. The
recommendations include: expanding the size and scope of the levy for large emitters, and
subjecting small emitters to the carbon levy, phasing out the use of coal-fired plants for power
generation in Alberta, introducing energy efficiency programs, and monitoring the performance
of Alberta’s Specified Gas Emitters Regulation on a continuous basis.
1
1. Introduction
The Intergovernmental Panel on Climate Change (IPCC) recently presented its Fourth Report
that contained additional evidence that human activities are a significant cause of increases in
Greenhouse Gas (GHG) emissions resulting in a warming of the climate.1 Evidence suggests that
carbon dioxide emissions, a key element of GHGs, have increased “…almost fivefold in the past
century.” 2 A large component of these carbon emissions arises from hydrocarbon combustion
and there has been growing pressure on governments to substantially reduce these emissions.
The carbon emissions associated with the combustion of hydrocarbons represent a cost that, in
the absence of carbon pricing policies, is not internalized or taken into account in market
decisions. This is a classic case of ‘market failure’ and the result is excessive carbon emissions.
In order to address this market failure, various policy approaches are suggested to ‘internalize’
this externality. Typically, these involve the direct regulation of carbon emissions and/ or
putting a price on these emissions so these costs are reflected in market decisions. Most
commonly, these have involved some version of a ‘carbon tax’ or a ‘cap and trade system.’ A
carbon tax is a corrective, per unit tax on emissions and the advantage of implementing a
1 IPCC report, supra note 9, at 5 in Reuven S. Avi-Yonah and David M. Uhlmann, “Combating Global Climate Change: Why a Carbon Tax Is a Better Response to Global Warming Than Cap and Trade,” Stanford Environmental Law Journal Vol. 28:3 (2009) : 18 2 James Gustave Speth, (2004) in Avi-Yonah, S Reuven and David M. Uhlmann, “Combating Global Climate Change: Why a Carbon Tax Is a Better Response to Global Warming Than Cap and Trade,” Stanford Environmental Law Journal Vol. 28:3 (2009) : 18

2
carbon tax is that there is “cost certainty” since the amount of the tax is pre-decided. 3 In a cap
and trade system a maximum emissions amount is set and firms are given tradable permits.
This results in “benefit certainty” but there is considerable “cost uncertainty.”4
In Canada, individual provinces have considerable jurisdiction over environmental policy
making and this has resulted in a variety of approaches that best fit their individual
circumstances. This, in turn, provides an opportunity to assess the effectiveness of different
policy approaches in reducing carbon emissions. Of particular interest here are the different
approaches taken by British Columbia and Alberta. In the former case, a key policy element has
been the imposition of a carbon tax rising to $30 per tonne of carbon equivalent (CO₂e). In the
latter case, it has been a carbon levy of $15 per tonne of CO₂e. The key difference between a
carbon tax and a levy is that a tax is levied on all emissions whereas a levy allows facilities to
emit free of charge as long as they keep emissions below a certain threshold. The Alberta
carbon levy is thus a “binding performance regulation” where firms pay only when their
emissions exceed a certain level.5
The objective in this paper is to examine the effectiveness of these two approaches in reducing
carbon emissions. The focus is on the relative impacts of the carbon tax/levy on emissions, and
3 Reuven S. Avi-Yonah and David M.Uhlman, “Combating Global Climate Change: Why a Carbon Tax is a Better Response to Global Warming than Cap and Trade,” Stanford Environmental Law Journal Vol.28:3 (2009): 40 4 Ibid. 40 5 Mark Jaccard, “Alberta’s (Non)-Carbon Tax and Our Threatened Climate,” Sustainability Suspicions, April 26, 2013. http://markjaccard.blogspot.ca/2013/04/albertas-non-carbon-tax-and-our.html

3
teasing out differences in terms of energy efficiency and energy intensity. Having neither a
carbon tax or carbon levy, Saskatchewan is used as the ‘control province’ for the purpose of
assessing the relative impacts of the policies in British Columbia and Alberta.
The paper is structured as follows: Details on the British Columbia (B.C.) and Alberta
approaches are outlined in Section 1.1 and 1.2 below. Section 2 provides a review of existing
literature on carbon taxes. A description of the methodology is provided in Section 3. Details
about the data sources, trends in provincial and sectoral emissions, estimates and discussion of
the empirical results can be found in Section 4. Section 5 concludes with the main findings and
recommendations.
1.1. British Columbia Carbon Tax
The B.C. government announced the implementation of a carbon tax as part of the B.C. Climate
Action Plan in 2008. The carbon tax became effective on July 1, 2008. This tax started at $10 per
tonne (CO₂e), and was increased by $5 per tonne increments each year till 2012. It now stands
at $30 per tonne and is levied at the source of emissions. Since the tax is based on the amount
of carbon emitted, the effective tax rate for each fossil fuel differs.6
6 British Columbia, Ministry of Finance, “How the Carbon Tax Works,” online: http://www.fin.gov.bc.ca/tbs/tp/climate/A4.htm

4
The scope of the B.C. carbon tax extends to 77 percent of all the GHG emissions including
“residential, commercial and industrial sources.”7 There are no exemptions for certain
industries or economic sectors. It does not, however, include “non-combustion emissions from
industrial processes,” and “venting and fugitive emissions.” 8
The tax was designed to be revenue-neutral, which implies that the revenue collected by the
government through the carbon tax would be injected back into the economy by reducing
other tax rates. This was done to minimize any regressive impacts of the tax, especially for low-
income households. The tax deductions were in the form of lower personal and corporate
income taxes, and a low-income Climate Action Tax Credit was given to low-income families. 9
It is beyond the scope of this paper to examine whether there was a ‘rebound effect’ in the
change in consumption of carbon intensive fuels brought about as a result of the tax cuts and
credits offered by the government to offset the increased carbon tax revenues. Additional
analysis is required to determine whether the impact of the carbon tax was large enough to
more than offset the increase in consumption due to the reduction in personal and corporate
income taxes.
7 British Columbia, Ministry of Finance, “Myths and Facts about the Carbon Tax”, online: http://www.fin.gov.bc.ca/tbs/tp/climate/A6.htm 8 Kathryn Harrison, “The Political Economy of British Columbia’s Carbon Tax,” OECD Environment Working Papers No 63, October 8, 2013: 9 http://www.oecd.org/officialdocuments/publicdisplaydocumentpdf/?cote=ENV/WKP(2013)10&docLanguage=En, 9 British Columbia, Climate Action Plan (2008), online: http://www.gov.bc.ca/premier/attachments/climate_action_plan.pdf

5
The analysis of the B.C. carbon pricing scheme focuses on the effectiveness of a carbon tax in
reducing GHG emissions. A sectoral approach is used to compare pre and post policy emissions
intensity for the following sectors: electricity and heat generation, oil and gas, transportation,
residential buildings, manufacturing, agriculture and construction.
1.2. Alberta Carbon Levy
By virtue of its rapid economic growth, a booming energy sector and a heavy reliance on coal-
fired electricity sector, Alberta has become the largest emitter of greenhouse gases in Canada.
In 2007, Alberta passed legislation which made it mandatory for large industrial carbon emitters
to achieve set GHG reduction targets. A number of instruments were used to achieve this end.
Putting a price on carbon dioxide was one of them. Under the Greenhouse Reduction plan,
emitters across all sectors whose emissions exceed 100,000 tonnes per year were to achieve a
12 percent annual decrease in emissions intensity.10 A compliance option under this
greenhouse reduction plan was for companies failing to meet the target to pay $15 per tonne
(CO₂e) into the Climate Change and Emissions Management Fund for the amount that exceeds
the target. 11 The $15 per tonne non-compliance charge is often equated with a “carbon tax.”12
10 Emissions intensity refers to emissions per unit of production 11 Government of Alberta, Alberta Environment and Sustainable Resource Development: Green House Gas Reduction Program, 2013 Environment.alberta.ca/01838.html 12 Mark Jaccard, “Alberta’s (Non)-Carbon Tax and Our Threatened Climate,” Sustainability Suspicions, April 26, 2013. http://markjaccard.blogspot.ca/2013/04/albertas-non-carbon-tax-and-our.html

6
The Alberta Government has introduced other policies that attempt to mitigate emissions
intensity. This includes a baseline-credit system, offering offsets to emitters and offering
support to renewable technologies.13
The Specified Gas Emitters Regulation (SGER) under the Climate Change and Emissions
Management Act lays down guidelines for how the baseline and credit system works. The
regulatory authority constructs a formula, which each regulated emitter is to use to calculate a
baseline amount of emissions for a particular compliance period. Unlike a cap and trade
system, the Alberta scheme does not impose a maximum limit on the emissions.14
Due to the way the baseline and credit system is constructed, the absolute emissions in Alberta
continue to increase because as expansion in the oil sands increases, the number of emitters
also increases. Secondly, regulated emitters focus on keeping their intensity limit per unit of
production under the baseline threshold rather than cutting total emissions. 15
Alberta’s policy to reduce GHG emissions has been criticised for its inadequacy. For example, it
has been argued that the $15 per tonne carbon levy is too low to catalyse technological
innovation and reduce emissions by a substantial amount. There has been pressure on the
13 Government of Alberta, Alberta Environment and Sustainable Resource Development: Green House Gas Reduction Program, 2013 Environment.alberta.ca/01838.html 14 Shaun Fluker, “Raising Questions About The Use of an Offset For Compliance with Carbon Emission Reduction
Obligations,” Ablawg.ca, June 13, 2013. http://ablawg.ca/2013/06/13/raising-questions-about-the-use-of-an-offset-for-compliance-with-carbon-emission-reduction-obligations/ 15 Ibid.

7
Alberta government by environmental think tanks and climate change economists to increase
the carbon levy so that absolute emissions are reduced.16
2. Literature Review
This section will summarize key findings of studies done to evaluate the effectiveness of
existing carbon taxes. The literature exhibits varied opinions; some have contended that
carbon taxes should be considered the “gold-standard” of market based tools and that they are
highly effective in reducing GHG emissions. Others have challenged this opinion on grounds of
lack of sufficient empirical evidence, and on grounds that the theoretical simplicity of a carbon
tax is constrained by various factors in the real world that reduce effectiveness of such a policy.
Several European countries implemented policies to curb GHG emissions well before
jurisdictions in North America. One such example is that of Norway, which implemented a high
carbon tax of $61.76 per metric tonne of CO₂ in 1991. Since the carbon taxes by most European
countries have been implemented between 1990 and 1992, this provides researchers with a
large data set to study the effectiveness of a carbon tax as a policy tool. Results from research
done using a data set that spans over two decades are, therefore, far more conclusive than
results from studies evaluating the effectiveness of carbon taxes implemented in the latter half
of this decade.
16 Geoff Dembicki,”To Spur Innovation, What Price to Put on Oil Sands Carbon?” The Tyee, June 21, 2012 http://thetyee.ca/News/2012/06/21/Oil-Sands-Carbon-Price/

8
Bruvoll and Larsen use a disaggregated general equilibrium model to study the effects of
Norway’s carbon tax. They found that even such a high carbon tax has not had a huge impact
on reducing emissions. 17 While absolute emissions in Norway have continued to increase,
emissions relative to GDP (emissions intensity) have declined. The reason for a reduction in
emissions intensity is a change in the overall energy mix and a reduction in energy intensity.
The energy intensity effect implies that households and industry were moving towards more
energy efficient technologies, and substituting away from fossil fuel consumption. Bruvoll and
Larsen suggest that many carbon intensive sectors in Norway have been exempted from the
carbon tax, and this affects the effectiveness of the tax. They propose a “broad based, cost
efficient tax” and the use of other policy tools, for e.g. regulation to reduce emissions.18
Unlike the simulation model used by Bruvoll and Larsen, Lin and Li use a difference-in-
difference model to evaluate the success of carbon tax in different European countries.19 They
use empirical data to study the “real mitigation effects.” Their key findings are as follows:
Firstly, they find that there is a positive relationship between per capita GDP and the “growth
rate of per capita CO₂ emissions and industry structure.”20 Per capita CO₂ emissions are
negatively correlated with R&D expenditures and energy prices. Secondly, the impacts of the
carbon tax are not uniform across countries due to differential tax rates across sectors as well
17 Annegrete Bruvoll and Bodil Merethe Larsen, “Greenhouse Gas Emissions in Norway: Do Carbon Taxes Work?” Energy Policy 32(4): 501 18 Ibid. 501 19 Boqiang Lin and Xuehui Li, “The effect of carbon tax on per capita CO₂ emissions,” Energy Policy 39 (2011): 5137 20 Ibid. 5144

9
as countries, different approaches to recycling the revenue generated by the tax, and the scope
of exemptions granted to various industries or sectors.
Lin and Li find that a flat tax rate across all sectors is more effective as compared to a higher tax
rate with industry specific exemptions. Finland, is a case in point, which had a lower carbon tax
than Denmark, Sweden, and Norway, and its effects were more significant due to an absence of
exemptions. They also note that recycling the revenue from the carbon tax by using it towards
renewable and energy efficient technology has a much larger impact than absorbing it as fiscal
revenue.21
Baranzini et al. also emphasize on the importance of revenue recycling when carbon taxes are
implemented. They argue that in the absence of revenue-neutrality or the subsidization of less
carbon intensive or renewable technologies, carbon taxes increase the costs to emitters by
much more than it would in a cap and trade regime. They suggest that when governments
propose a carbon tax, they should reduce some other tax to even out the tax burden, or
“earmark” the revenue to fund programs that would reduce the carbon footprint, or
“compensate” those adversely affected by the tax.22
According to Baranzini et al. carbon taxes seem to have regressive distributional impacts due to
the higher incidence of such taxes on low income households, as energy constitutes a larger
21 Ibid.5145 22 Andrea Baranzini, Jose Goldemberg, and Stefan Speck, “A future for carbon taxes,” Ecological Economics 32 (2000): 400
10
proportion of a low-income household’s budget. However, most analyses exclude
“distributional benefits” because they are difficult to quantify. If the positive impacts of
improved environmental quality could be measured, the effect of the tax would be considered
to be less regressive.23
Most of the literature on carbon taxes focuses on European countries to evaluate the
usefulness of the tax as a policy instrument. A review of existing studies suggests that carbon
taxes are most effective when they are gradually phased in, their revenues recycled through
income (personal and corporate) tax reductions or channeled into R&D expenditure, and are
broad-based with minimal exemptions. Both Alberta and B.C. embrace the ideas suggested by
the literature in designing their carbon policies, but take different routes. B.C. aims to lower the
regressive impact of the tax by offering tax rebates and lump-sum transfers to low income
households, whereas Alberta invests the money into a technology fund to spur innovation.
A research report published by Sustainable Prosperity analyses the B.C’s carbon tax shift after
five years of its implementation. In examining the effects of the tax, the authors look at changes
in per capita fuel consumption. They find that the “average per capita fuel consumption” in B.C.
as compared to the rest of Canada fell by a larger percentage in the post-tax years than in the
pre-tax years. They attribute this change to the carbon tax.24
23 Ibid. 409 24 Stewart Elgie and Jessica McClay, “BC’s Carbon Tax Shift After Five Years: Results,” Canadian Public Policy, July 2013 : 3 online: http://www.sustainableprosperity.ca/dl1026&display

11
According to the report, B.C’s GHG emissions per capita declined by 8.9% more than in the rest
of Canada. The effects on GDP are not conclusive; however, they claim that the economic
effects of the tax are similar to those experienced by European countries, which had
implemented a carbon tax and that the effects of the tax on GDP were not negative.25
The B.C. carbon tax was introduced as part of B.C’s climate change action plan, which means
that the success of B.C’s emission reduction is shared by other policies. Harrison’s evaluation of
B.C’s carbon tax is more circumspect than that put forward by the Sustainable Prosperity
report. The difference in B.C’s fuel consumption and the rest of Canada could also be the
consequence of structural changes in the economy or other policy instruments not related to
the carbon tax.26
Lee observes that in the initial phase when the tax was implemented, low-income households
were compensated by reductions in other taxes and the “low income tax credit.” However, the
offset amount has not been scaled up to match the yearly $5 increment of the carbon tax. In
addition, the benefits from corporate tax cuts tend to flow to “wealthy investors.” Due to these
reasons, the overall impact of the tax has been regressive.27
25 Ibid.5 26 Kathryn Harrison, “The Political Economy of British Columbia’s Carbon Tax,” OECD Environment Working Papers No 63, October 8, 2013: 18 27 Marc Lee, “Fair and Effective Carbon Pricing: Lessons from British Columbia,” Canadian Centre for Policy Alternatives, 2011 http://www.sierraclub.bc.ca/publications/scbc-reports/CCPA-BC_Fair_Effective_Carbon_FULL.pdf/at_download/file

12
Rivers and Schaufele use panel data from different provinces to study the impact of B.C’s
carbon tax on gasoline demand. Their hypothesis is that an exogenous tax increase triggers a
“demand response” that is different from a demand response if the price of a commodity is
affected by other market factors. They find that by increasing the carbon tax by five cents,
gasoline demand in the short run fell by 12.5%, whereas, if the market price of gasoline was
increased by the same amount, it reduced gasoline consumption by only 1.8%.28
A paper by Rayne and Forest challenges the results put forward by Rivers and Schaufele on the
grounds that lower fuel consumption per capita can be due to two factors. The first is where
the carbon tax does not have a negative impact on the economy, and encourages consumers to
change their behaviour by opting for public rather than private modes of transportation. The
second is where the carbon tax adversely affects the overall economy and leaves consumers
with less income to spend on transportation, the effect of which is a fall in per capita gasoline
demand. Rayne and Forest conclude that it is difficult to tease out the actual cause of the
reduced per capita gasoline demand. They also emphasize that the per capita gasoline demand
has shown a declining trend since 2004 whereas the per capita diesel demand has shown an
upward trend even in the post-tax period.29
28 Nicholas Rivers and Brandon Schaufele, “Salience of Carbon Taxes in the Gasoline Market,” University of Ottawa, Working Paper 1211E, 201 https://socialsciences.uottawa.ca/sites/default/files/public/eco/eng/documents/1211e.pdf 29 Sierra Rayne and Kaya Forest, “British Columbia’s Carbon Tax: Greenhouse Gas Emission and Economic Trends Since Introduction,” Saskatchewan Institute of Applied Science and Technology, 2013 http://vixra.org/pdf/1301.0094v1.pdf

13
While there are quite a few studies that try to analyse the impacts of the B.C. carbon tax, there
is a lack of empirical research on the effects of Alberta’s carbon levy on emissions. Alberta’s
carbon levy has been criticised as insufficient and ineffective as absolute emissions have
increased despite the price on carbon. The Alberta carbon levy of $15 a tonne has a legislated
incidence on only large industrial emitters, and is levied if industries fail to achieve a 12%
reduction in emissions intensity.
Alberta’s SGER has been criticised for not providing stronger incentives for emissions reduction.
However, research done by Andrew Leach suggests that even though the average cost of
emissions is lower under the SGER when compared to the average cost of emissions under a
carbon tax regime, it does not necessarily always equate with weaker incentives.30 The financial
incentives created under the SGER differ from those created under a carbon tax. Understanding
the incentives offered by each approach is important as it informs future policy actions.
For existing facilities, “the incentives to improve productivity per unit of emissions are stronger
with the SGER, and the incentives to reduce emissions by reducing production are stronger with
the carbon tax.” For new facilities, “upfront costs in NPV” terms are less under the SGER than a
30 Andrew Leach, “Policy Forum: Alberta’s Specified Gas Emitters Regulation,” Canadian Tax Journal (2012) 60:4, 882
14
carbon tax regime. However, once a more efficient technology is adopted, the incentives to
reduce emissions will be much lower under the SGER.31
The results from the 2012 Greenhouse Gas Reduction Program show that 7.5 million tonnes of
emissions reductions have been achieved by companies due to improved operational
performance and the purchase of offsets. From 2007 to 2012, a total of $503 million has been
paid by emitters into the Climate Change and Emissions Management Fund (CCEMF) for failing
to comply with their intensity target.32
Alberta’s CCEMF invests the revenue from the $15/tonne levy into technologies that would
help in the reduction of GHG emissions. A report by the Conference Board of Canada dwells on
the impacts of climate-related technology investments, and aims to answer a very pertinent
question: “How are technology funds best used to contribute to reducing greenhouse gas
emissions?” 33 In answering the question, the report makes a very important distinction
between technology investments and technology funds. The underlying premise of a
technology fund is to reduce GHG emissions by investing in the creation of “new technologies”
or improving “existing technologies.” Technology funds are mostly financed by a continuous
31 Ibid. 896 32 Government of Alberta, Alberta Environment and Sustainable Resource Development : Green House Gas Reduction Program, 2013 http://esrd.alberta.ca/focus/alberta-and-climate-change/regulating-greenhouse-gas-emissions/greenhouse-gas-reduction-program/default.aspx 33 Conference Board of Canada, “The Economic and Employment Impacts of Climate-Related Technology Investments,” Conference Board of Canada 2010: 2

15
stream of revenue rather than a subsidy or a lump-sum transfer, and have a distinct directive
that the fund will be used towards innovation in low carbon technologies.
The CCEMF establishes a “direct link” between the penalties imposed on emitting above the
intensity target and investment in “climate change and mitigation technologies.” 34While the
$15/tonne levy helps in correcting the negative externality of emissions, the investment in new
technologies creates a positive externality due to the commercialization and deployment of
low-carbon technologies.
The fund is managed by the Climate Change and Emissions Management Corporation (CCEMC)-
-an ‘arms-length organization from the government.’35 The CCEMC invests the money in energy
efficiency and clean energy projects. In 2012, the CCEMC funded a total of 12 projects that are
expected to achieve a reduction of 5.635 million tonnes of CO₂e by the year 2020.36
The Report by the Conference Board of Canada suggests that technology funds should be used
in conjunction with other policy instruments to achieve the desired reduction in emissions.
Investment in low-carbon technologies will ultimately lead to lower levels of emissions, as well
as help in keeping the carbon tax low. In the long-run, this would keep industries competitive
34 Ibid. 22 35 Government of Alberta, Alberta Environment and Sustainable Resource Development : Climate Change and Emissions Management Fund, 2014 http://esrd.alberta.ca/focus/alberta-and-climate-change/climate-change-and-emissions-management-fund.aspx 36 CCEMC, Annual Report, 2012: 9 http://ccemc.ca/wp-content/uploads/2013/12/CCEMC-2013-AnnualReport-web-R1.pdf
16
and the positive impact of the adoption of cleaner technologies would outweigh any negative
effects of the tax.37
According to the analysis done in the Report, 30% of all technology investments in Alberta and
B.C. leaks to other jurisdictions within and outside Canada. Alberta, Saskatchewan and B.C. lead
the way in investments in clean technologies due to their economic dependence on the
extractive sector. Research by the Conference Board of Canada suggests that these investments
have a large positive impact on employment, especially in these three Western provinces. The
positive spillover effect seems to be helping in correcting distortions caused in the labour
market by environmental regulations and market-based policies like taxes.38
In a proposal put forward by the Brookings Institute, Muro and Rothwell advocate for a bundled
approach that puts a price on carbon, and simultaneously invests the revenue into clean energy
R&D to curb emissions. The carbon tax literature offers compelling evidence that when used as
a single policy tool, its impacts are limited in both mitigating emissions as well as catalysing
investment in cleaner technologies. Muro and Rothwell propose that the U.S Congress should
implement a $20/tonne carbon tax and recycle part of the revenue to drive climate friendly
37 Ibid. 26 38 Ibid. 35

17
investments. Alberta is already implementing a model that pairs a carbon price with investment
in a technology fund--something which remains a theoretical possibility in the U.S.39
3. Methodology
Given that B.C. and Alberta have implemented two different approaches to lower GHG
emissions, it is important to tease out the impacts of both approaches in order to understand
which policy has had a more significant impact in reducing CO₂ emissions. The evaluation of
existing approaches is also important since it will provide evidence for other jurisdictions in
Canada that are considering the imposition of a carbon tax.
A difference-in-difference method is used to compare B.C’s carbon tax with Alberta’s carbon
levy. A difference-in-difference estimate compares the treatment group with a control group to
calculate the effects of a policy change on the treatment group. In this case, Alberta and B.C.
are the treatment groups where the treatment is the carbon levy and a carbon tax.
Saskatchewan is the control group without any price on carbon.
39 Mark Muro and Jonathan Rothwell, “Institute a Modest Carbon Tax to Reduce Carbon Emissions, Finance Clean Energy Technology Development, Cut Taxes, and Reduce the Deficit,” Brookings Institute, 2012 http://www.brookings.edu/~/media/research/files/papers/2012/11/13%20federalism/13%20carbon%20tax.pdf

18
Saskatchewan was selected as the control group since the economic make-up of Saskatchewan
resembles that of Alberta and B.C. The natural resources sector is a large contributor to the
GDP of these provinces. Saskatchewan, Alberta and B.C. are in the same geographical belt
which makes comparisons between these jurisdictions easier.
Saskatchewan does not have a price on carbon, yet it has some climate initiatives in place, for
example, renewable fuel standards for diesel and gasoline, an offsets program, and industry
GHG reduction programs and funding. This makes it a suitable candidate for a control group.
A sector-by-sector approach was taken to estimate the impacts of the policy. The sectors
include: Electricity and Heat generation, Oil and Gas, Transportation, Residential Buildings,
Manufacturing, Construction, and Agriculture.
Table 1 provides a summary of the climate change initiatives, GHG emission reduction targets,
method of carbon tax revenue disbursement, and the energy mix of all three provinces. 40
40 Conference Board of Canada, “The Economic and Employment Impacts of Climate-Related Technology Investments,” Conference Board of Canada 2010: 9-10

19
Table 1 : Summary of B.C., Alberta and Saskatchewan Climate Change Initiatives
Province Climate Change Initiatives Reduction Targets
Method of carbon tax/levy revenue disbursement
Energy Mix
British Columbia -$30 per tonne carbon tax -Fuel tax -Renewable Electricity Program -Renewable Fuel Standard for Diesel -Vehicle Efficiency Standards -Building Efficiency Standards -Renewable Energy Funding & Targets -Offsets Program -Vehicle Rebates for Low or Zero emissions -Industry GHG Reduction Programs & Funding
18% below by 2016 33% below by 2020 80% below by 2050
Low income tax credit Tax cuts
Natural Gas—1.62% Other Fuels –1.67% Steam from waste—0.07% Hydro—91.84% Other Renewables—0.33% Other Generation—4.46%
Alberta -$15 per tonne carbon levy on large emitters -Cap on emissions intensity -Mandatory & voluntary emissions reporting -Emissions Trading -Technology R&D funding -Renewable Fuel Standards for Gasoline & Diesel -Building Efficiency standards -Renewable Energy Funding & Targets -Offsets Program -Industry GHG Reduction Programs & Funding
Reduce emissions by 50 Mt by 2020, and 200 Mt by 2050
Paid into technology fund
Coal – 71.65% Natural Gas – 19.34% Other Fuels -- 0.76% Steam from waste--1.76% Hydro – 3.05% Other Renewables –3.44%
Saskatchewan -Renewable Fuel Standards for Gasoline and Diesel -Building Efficiency Standards -Renewable Energy Funding & Targets -Offsets Program -Vehicle Rebates for Low or zero emissions -Industry GHG Reduction Programs & Funding
20% below 2006 levels by 2020
N/A Coal – 55.76% Natural Gas – 15.67% Other Fuels -- 0.05% Steam from waste—3.29% Hydro – 22.30% Other Renewables –2.92%
To control for relative sector size, GHG emissions intensities were used. Intensities were
calculated by dividing sector emissions by total sector GDP. The two factors that affect GHG

20
emission intensity are energy efficiency and the carbon content of fuels. 41 GHG emission
intensity can be described as:42
𝐶𝑂₂
𝑆𝑒𝑐𝑡𝑜𝑟 𝐺𝐷𝑃=
𝐸𝑛𝑒𝑟𝑔𝑦
𝑆𝑒𝑐𝑡𝑜𝑟 𝐺𝐷𝑃 ×
𝐶𝑂₂
𝐸𝑛𝑒𝑟𝑔𝑦 ;
where Energy/ Sector GDP is the energy intensity and CO₂/Energy is the carbon content of the
energy consumed.
The model used to calculate the difference in sectoral emissions is as follows:
Emissions intensity= α+ βₒ(Taxyear)+ β₁(TaxProvince)+ δ₁(Taxyear×TaxProvince)+ε
where TaxProvince = Alberta or B.C.
A pair-wise difference-in-difference estimate was done by first comparing the emissions
intensity levels of Alberta and Saskatchewan, and then comparing the emissions intensity levels
of B.C. and Saskatchewan. Two iterations of the above equation were performed, one for
Alberta as the Taxprovince, and one for B.C.
Emissions intensity is Mt CO₂ emissions/ Sector GDP. 𝛼 captures the average difference in
emissions intensity between Alberta and Saskatchewan, and between B.C. and Saskatchewan.43
Taxyear denotes the dummy variable44 representing time periods before and after the policy
was implemented. The dummy variable taxyear takes the value 1 for post-tax time periods for
41 Timothy Herzog, Kevin A. Baumert and Jonathan Pershing, “Target: Intensity An Analysis of Greenhouse Gas Intensity Targets,” World Resources Institute, 2006 http://pdf.wri.org/target_intensity.pdf 42 Ibid.4 43 Since a pairwise comparison was done, 𝛼 does not represent the average difference in intensity levels for all three provinces 44 A dummy variable is used to distinguish the treatment group and takes on binary values when performing a regression analysis.
21
both the control and the treatment province, and 0 for pre-tax time periods. The coefficient 𝛽ₒ
captures the effect of factors that would cause a change in emissions intensity even if the tax or
levy was not implemented. Such factors could include changes in energy intensity due to
technological improvements45 or other regulations imposed to reduce emissions.
TaxProvince represents the dummy variable for the treatment and the control province. It takes
the value 0 for Saskatchewan, and 1 for Alberta and B.C. 𝛽₁ captures the differences between
the control and the treatment groups before the carbon tax or levy was implemented.
According to existing studies, such factors include “industry structure, urbanization level,
energy prices”46 and energy mix. In this case, GDP would not be an explanatory variable since
the analysis is done using emissions intensity.
𝛿₁ is the coefficient of interest as it indicates whether the emissions intensity of provinces
that have implemented a carbon tax/levy is lower than the province which does not have a
price on carbon. If the value of 𝛿₁ is positive and passes the significance test, it means that the
carbon levy or tax has had a positive impact on reducing emission intensity levels. 휀 is the error
term.
This difference-in-difference approach can be illustrated as follows. The null and alternative
hypotheses are, respectively:
45 Boqiang Lin and Xuehui Li, “The effect of carbon tax on per capita CO₂ emissions,” Energy Policy 39 (2011): 5140 46 Ibid. 5141

22
Null hypothesis or H₀=no difference in emissions intensity after the carbon levy/tax.
Alternative hypothesis or H₁ = there is a difference in emissions intensity after the carbon
levy/tax.
Figure 1: The difference-in-difference approach
In Figure 1, the distance from E⁰₁ to E⁰₂ represents the changes in emission intensity in the
control province from time t₁ to t₂. Similarly, the distance from E¹₁ to E¹₂ represents the changes
in emission intensity in the treatment province in the time period t₁ to t₂.
t₁ t₂ Time
Emis
sio
ns
Inte
nsi
ty
Policy effect
Control province
Treatment province
E⁰₁
E₁¹
E⁰₂
E¹₂

23
4. Data Sources, Trends and Estimates
4.1 Data Sources
The data for conducting the statistical analysis was taken from the National Inventory Report
1990-2012: Greenhouse Gas Sources and Sinks in Canada (NIR).47The Report provides the most
comprehensive ‘inventory’ of GHGs for all Canadian provinces, and is the most suitable data set
to perform a difference-in-difference estimate.
The NIR systematically reviews its methodology and refines it to increase the accuracy of its
emissions estimates. To improve the quality of the national inventory, the methodological
changes are applied to the ‘entire time series, from the 1990 base year to the most recent year
available.’48 Existing estimates are recalibrated as additional parameters become available to
make the inventory trends consistent over time. This is done so that a ‘methodological change’
can be differentiated from an actual change in the GHG emissions level.49
Section 46(1) of the Canada Environment Protection Act (CEPA) mandates all industrial and
other facilities to report their GHG emissions under the Greenhouse Gas Emissions Reporting
Program (GHGRP). Under the GHGRP, provinces only report emissions from large industrial
facilities, whereas, the NIR captures emissions from all source categories.50
47 National Inventory Report 1990-2012: Greenhouse Gas Sources and Sinks in Canada https://www.ec.gc.ca/ges-ghg/default.asp?lang=En&n=3808457C-1&offset=5&toc=show 48 Ibid. 19 49 Ibid. 171 50 National Inventory Report 1990-2012, Part 1, 20

24
The data in the NIR is based on estimates and while these estimates are calculated to be
‘accurate, complete, comparable, transparent, and consistent,’ there is still an element of
uncertainty. The NIR limits uncertainty by reviewing estimation models and removing
‘systematic’ and ‘random’ uncertainties. 51
The Report is structured to capture GHG emissions from all major economic sectors and
subsectors. The breakdown of emissions according to economic sectors is particularly helpful
when doing a sector by sector analysis.52
The NIR provides the most robust data set to compare the effects of a carbon price on
emissions intensity levels in Alberta and British Columbia. However, there were some data
constraints while performing the analysis. Since the GHGRP was established in 2004, data for
prior years was not collected on an annual basis and no basic reporting structure existed. 53
Data on provincial emissions is available for 1990, 2000 and 2005. The NIR, however, does
provide an estimate of provincial emissions during 1990-2000 and 2000-2005. These estimates
have been revised on an annual basis and recalculated to reflect improvements in
methodology. The unavailability of actual data points in the pre-policy implementation phase
poses a limitation to the conclusiveness of the statistical analysis performed. The analysis is
performed using emissions data between 2000 and 2012. The data points from 2001 to 2004
51 Ibid. 22 52 Ibid. 18 53 Ibid. 19

25
are estimated whereas data from 2005 onwards is based on an annual data collection
procedure. The validity of the results of the statistical analysis is therefore subject to this caveat
in data.
The emissions figure used for the sector “Oil and Gas” was derived from adding emissions from
Fossil Fuel Production and Refining, and Mining and Oil and Gas Extraction. Emissions from
fugitive sources were not included in the analysis. Emissions from fuels consumed by and
emissions resulting from industrial processes were aggregated under Manufacturing for the
purposes of this study. Emissions resulting from and emissions from fuels consumed by the
agriculture and forestry sector were aggregated under the sector Agriculture.
The Sector GDP data was taken from Statistics Canada.54 Household expenditure on electricity,
gas and other fuels was used as a proxy for Residential Buildings GDP. 55
Data for Saskatchewan for the Electricity and Heat sector was not available prior to 2004, so the
regression results capture the time period from 2004-2012. For all other sectors, the time
period of analysis was 2000-2012.
54 Statistics Canada, Table 379-0030 - Provincial and territorial GDP by industry chained dollars vectors 55 Statistics Canada. Table 384-0041 - Detailed household final consumption expenditure, provincial and
territorial, annual (dollars)

26
The carbon levy and taxes were implemented in the latter half of the year for both Alberta and
B.C., so the post-tax time period starts from the next year i.e. 2008 and 2009 for Alberta and
B.C. respectively.
4.2 Data Trends
This section shows the yearly difference in emissions intensity levels for different sectors for
Saskatchewan, Alberta and B.C. Trends in emissions intensity are observed before and after the
implementation of the carbon levy in Alberta, and the carbon tax in B.C. These trends are then
compared with that of the control province, Saskatchewan. In sectors where the data sets of
the treatment provinces show a markedly different trend than the data set of the control
province, further testing using a difference-in-difference estimate would help in discerning
whether this was due to the effects of a price on carbon.

27
Figure 2a: Oil & Gas Emissions intensity levels
Figure 2b: Yearly Difference in Oil & Gas Emissions Intensity
Figure 2b shows the annual difference in emissions intensity from the Oil and Gas sector for
Alberta, Saskatchewan and B.C. From the graph it can be observed that emissions intensity
levels in Alberta’s oil and gas sector have declined each year between 2007 and 2010.
0.0000
0.0002
0.0004
0.0006
0.0008
0.0010
0.0012
2000 2001 2002 2003 2004 2005 2006 2007 2008 2009 2010 2011 2012
Emis
sio
ns
Inte
nsi
ty
Oil & Gas Emissions Intensity
Saskatchewan (Control) Alberta British Columbia
Levy Tax
-0.0002
-0.0002
-0.0001
-0.0001
0.0000
0.0001
0.0001
0.0002
0.0002
0.0003
Dif
fere
nce
in E
mis
sio
ns
Inte
nsi
ty
(Mt/
CO
₂e)
Yearly Difference in Oil & Gas Emissions Intensity
Saskatchewan (Control) Alberta British Columbia
Levy Tax

28
Comparing this to the yearly difference in oil and gas emissions intensity levels of
Saskatchewan, it can be observed that between 2007 and 2009, Saskatchewan’s emissions
intensity levels show an increasing trend. Prior to the implementation of the levy, emissions
intensity levels for Alberta and Saskatchewan show an increasing trend from 2004 to 2007
(Figure 2a). This upholds the “parallel trends assumption” of a difference-in-difference
approach that had there been no policy change both provinces would have followed the same
trend. Since Alberta’s emissions intensity levels show a declining trend after 2007, the carbon
levy might be one of the reasons for the divergence in yearly difference in emissions intensity of
Alberta and Saskatchewan after 2007. B.C’s intensity levels remain somewhat constant
between 2007 and 2009 but fall sharply between 2009 and 2010. Comparing the trend of B.C.’s
emissions intensity levels with that of Saskatchewan, it can be seen that both provinces follow a
very similar trend from 2000 to 2005. Immediately after the implementation of the tax, B.C.’s
intensity levels decline at a faster rate than Saskatchewan’s intensity levels, however, after
2010 both provinces follow the same trend. The difference-in-difference analysis would help in
isolating the time-dependent trend from the change caused by the tax.

29
Figure 3a: Electricity and Heat Generation Emissions Intensity
Figure 3b: Yearly Difference in Electricity and Heat Emissions Intensity
Figure 3b shows that up to the point of the implementation of the carbon levy, Alberta’s
emissions intensity levels in the electricity and heat sector declined more than the intensity
0.0000
0.0020
0.0040
0.0060
0.0080
0.0100
0.0120
0.0140
0.0160
2004 2005 2006 2007 2008 2009 2010 2011 2012
Emis
sio
ns
Inte
nsi
ty
Electricity and Heat Generation Emissions Intensity
Saskatchewan (Control) Alberta British Columbia
Levy Tax
-0.0015
-0.0010
-0.0005
0.0000
0.0005
0.0010
0.0015
2004-2005 2005-2006 2006-2007 2007-2008 2008-2009 2009-2010 2010-2011 2011-2012
Dif
fere
nce
in E
mis
sio
ns
Inte
nsi
ty
(Mt/
CO
₂e)
Yearly Difference in Electricity and Heat Emissions Intensity
Saskatchewan (Control) Alberta British Columbia
Levy Tax

30
levels of Saskatchewan. Trends in the differences in intensity levels of Alberta and
Saskatchewan do not show convergence following the implementation of the levy. It can be
observed from Figure 3a that before 2007, Saskatchewan and Alberta’s emission intensity
trends are almost the same and diverge after the levy was introduced. Saskatchewan’s intensity
levels grew by a much larger percentage than Alberta’s, which justifies using a difference-in-
difference approach since it shows that both provinces had the same trends in the time period
prior to 2007. B.C’s yearly difference in intensity levels does not vary much, however, the
difference is little more pronounced in the year B.C. introduces the tax.
By using Saskatchewan as a control group any changes in emissions intensities that occur with
time can be subtracted from the overall change to understand the effect of the policy change in
Alberta and B.C.
31
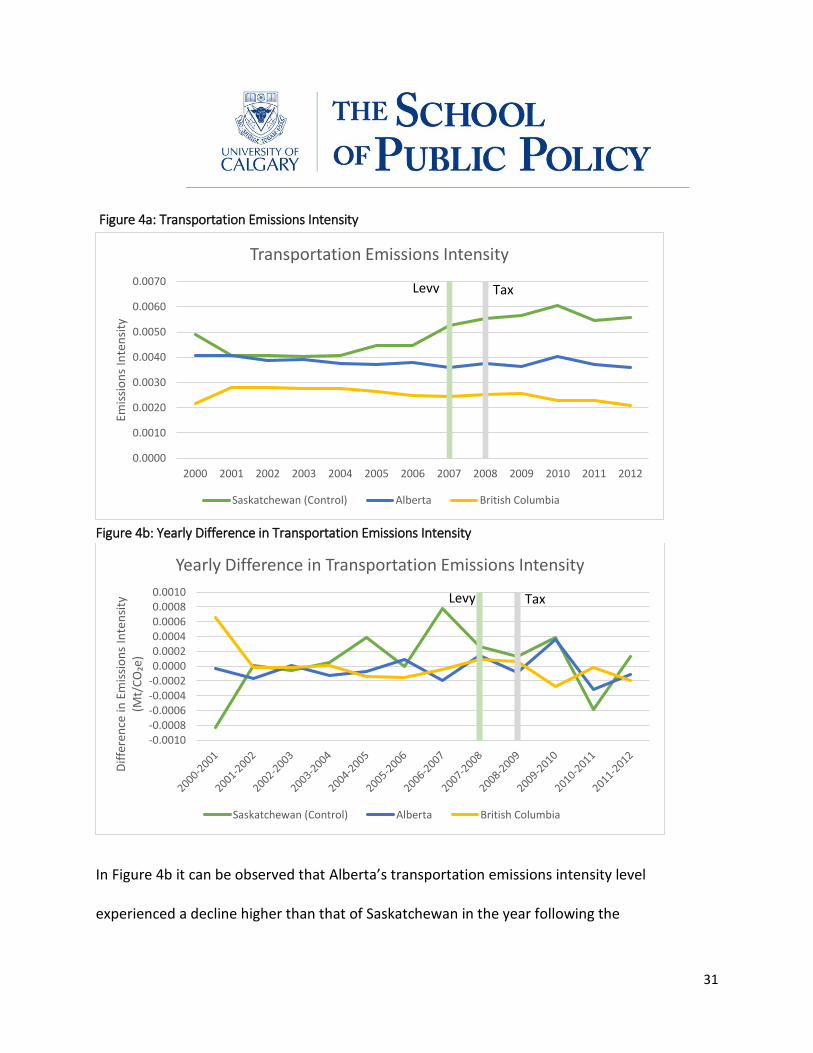
Figure 4a: Transportation Emissions Intensity
Figure 4b: Yearly Difference in Transportation Emissions Intensity
In Figure 4b it can be observed that Alberta’s transportation emissions intensity level
experienced a decline higher than that of Saskatchewan in the year following the
0.0000
0.0010
0.0020
0.0030
0.0040
0.0050
0.0060
0.0070
2000 2001 2002 2003 2004 2005 2006 2007 2008 2009 2010 2011 2012
Emis
sio
ns
Inte
nsi
ty
Transportation Emissions Intensity
Saskatchewan (Control) Alberta British Columbia
Levy Tax
-0.0010-0.0008-0.0006-0.0004-0.00020.00000.00020.00040.00060.00080.0010
Dif
fere
nce
in E
mis
sio
ns
Inte
nsi
ty
(Mt/
CO
₂e)
Yearly Difference in Transportation Emissions Intensity
Saskatchewan (Control) Alberta British Columbia
Levy Tax
32
implementation of the levy, however, between 2009 and 2011 the average yearly difference in
intensity levels converges. Between the time period 2001-2004, there is little difference
between the emission intensity levels of Alberta and Saskatchewan but after 2004 the trend
shows a continuous divergence in intensity levels of the two provinces. The difference in
intensity levels between the provinces shows considerable stability. By conducting a statistical
analysis, this divergence can be studied in more detail by comparing Alberta’s pre and post levy
intensity levels to that of Saskatchewan’s and the mitigation effect of the levy can be gauged.
Comparing B.C.’s trends with Saskatchewan it can be observed that the difference between the
emissions intensity levels of the two provinces is quite stable between 2001 and 2007. B.C’s
intensity levels in the post-tax years seem to experience a higher than average decline which
may be attributed to the carbon tax.
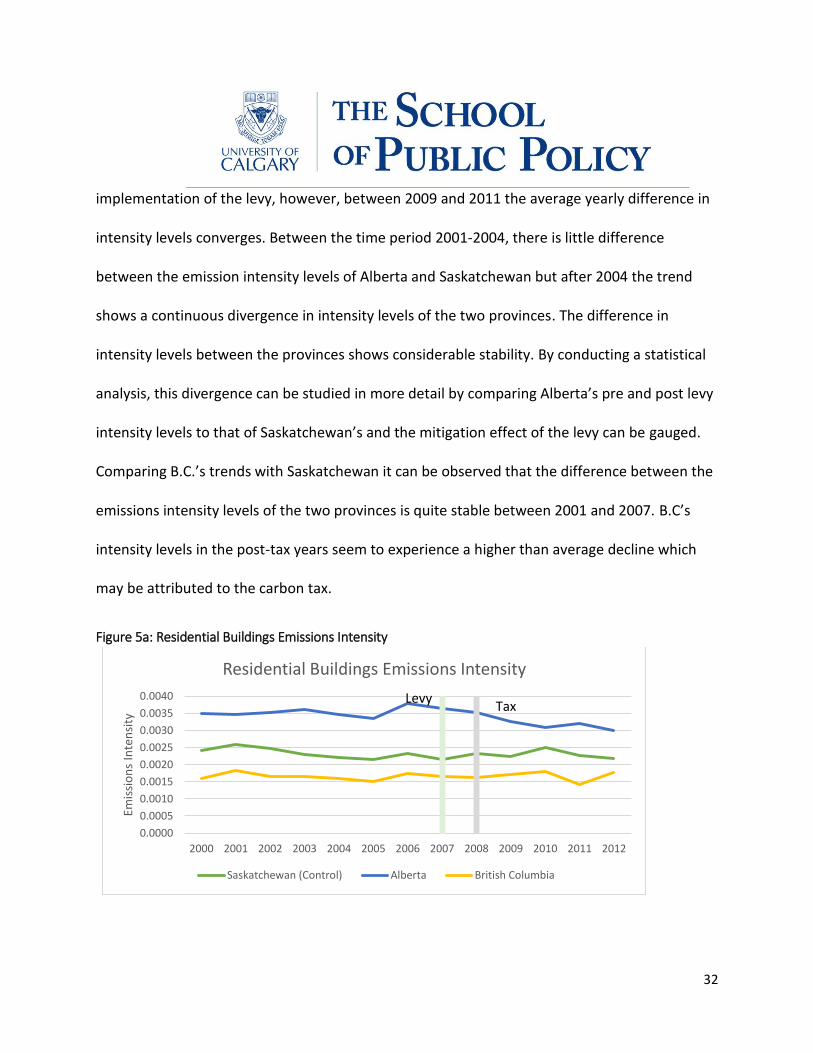
Figure 5a: Residential Buildings Emissions Intensity
0.0000
0.0005
0.0010
0.0015
0.0020
0.0025
0.0030
0.0035
0.0040
2000 2001 2002 2003 2004 2005 2006 2007 2008 2009 2010 2011 2012
Emis
sio
ns
Inte
nsi
ty
Residential Buildings Emissions Intensity
Saskatchewan (Control) Alberta British Columbia
TaxLevy

33
Figure 5b: Yearly Difference in Residential Buildings Emissions Intensity
From Figure 5a it can be observed that from 2001-2007, the difference between the emissions
intensity levels of Alberta and Saskatchewan is fairly constant, which means that the trends
between the two provinces were parallel. After 2007, the emissions intensity levels for Alberta
decline, while the intensity levels of Saskatchewan show an increasing trend. For all three
provinces, the similarity in trends can be observed from the 2005 and 2006 data points. This
might have been as a result of a common shock experienced by all three provinces.
From Figure 5b it can be observed that while the yearly differences in intensity levels between
Alberta and Saskatchewan followed the same trend between 2007 and 2010, the decline in
Alberta’s intensity levels was higher than that of Saskatchewan. In B.C. there was little change
in the yearly difference from 2009-2010 (the year after the carbon tax was imposed), however,
a much larger decline in yearly difference was seen between 2010 and 2011.
-0.0005-0.0004-0.0003-0.0002-0.00010.00000.00010.00020.00030.00040.0005
Dif
fere
nce
in E
mis
sio
ns
Inte
nsi
ty
(Mt/
CO
₂e)
Yearly Difference in Residential Buildings Emissions Intensity
Saskatchewan (Control) Alberta British Columbia
Levy Tax

34
Figure 6a: Manufacturing Emissions Intensity
Figure 6b: Yearly Difference in Manufacturing Emissions Intensity
0.0000
0.0005
0.0010
0.0015
0.0020
0.0025
0.0030
0.0035
0.0040
0.0045
2000 2001 2002 2003 2004 2005 2006 2007 2008 2009 2010 2011 2012
Emis
sio
ns
Inte
nsi
ty
Manufacturing Emissions Intensity
Saskatchewan (Control) Alberta British Columbia
Levy Tax
-0.0010
-0.0008
-0.0006
-0.0004
-0.0002
0.0000
0.0002
0.0004
0.0006
Dif
fere
nce
in E
mis
sio
ns
Inte
nsi
ty
(Mt/
CO
₂e)
Yearly Difference in Manufacturing Emissions Intensity
Saskatchewan (Control) Alberta British Columbia
Levy Tax
35
Figure 6b shows that both Alberta and B.C’s yearly differences experience a converging trend
after the levy and the tax were imposed. The levy and the tax do not result in a decline in
intensity levels.
In both Figure 7b and 8b (below), the yearly differences in construction and agriculture
emissions intensity in Saskatchewan were greater than those for Alberta. Since the Alberta
carbon levy does not apply to the construction and agriculture sector, Alberta’s yearly
differences did not show a significant decline following the implementation of the levy.
However, for B.C. the difference between the yearly intensity levels before and after the tax
suggests that the tax probably had some impact.
In both Figures 7a and 8a it can be observed that the data for all three provinces show similar
trends prior to the policy change (excluding some outliers). The difference in emissions
intensity levels between Alberta and Saskatchewan for the construction sector is stable
between the time period from 2001-2006 and is steady for the agriculture sector between the
time period 2003-2007. The same stability in differences can be found in the agriculture sector
emissions intensity levels of B.C. and Saskatchewan from 2001 to 2007.

36
Figure 7a: Constructions Emissions Intensity
Figure 7b: Yearly Difference in Constructions Emissions Intensity
0.0000
0.0000
0.0000
0.0000
0.0000
0.0000
0.0000
0.0000
0.0000
2000 2001 2002 2003 2004 2005 2006 2007 2008 2009 2010 2011 2012
Emis
sio
ns
Inte
nsi
ty
Construction Emissions Intensity
Saskatchewan (Control) Alberta British Columbia
0.0000
0.0000
0.0000
0.0000
0.0000
0.0000
0.0000
0.0000
0.0000
Dif
fere
nce
in E
mis
sio
ns
Inte
nsi
ty
(Mt/
CO
₂e)
Yearly Difference in Construction Emissions Intensity
Saskatchewan (Control) Alberta British Columbia
Levy Tax

37
Figure 8a: Agriculture Emissions Intensity
Figure 8b: Yearly Difference in Agriculture Emissions Intensity
0.0000
0.0010
0.0020
0.0030
0.0040
0.0050
0.0060
0.0070
0.0080
0.0090
2000 2001 2002 2003 2004 2005 2006 2007 2008 2009 2010 2011 2012
Emis
sio
ns
Inte
nsi
ty
Agriculture Emissions Intensity
Saskatchewan (Control) Alberta British Columbia
-0.0020
-0.0015
-0.0010
-0.0005
0.0000
0.0005
0.0010
0.0015
0.0020
Dif
fere
nce
in E
mis
sio
ns
Inte
nsi
ty
(Mt/
CO
₂e)
Yearly Difference in Agriculture Emissions Intensity
Saskatchewan (Control) Alberta British Columbia
Levy Tax

38
A two-sided t-test was performed to test for difference in means between emissions intensity
of Alberta, B.C. and Saskatchewan. The two-sided t-test tests the hypothesis that there is no
difference between emissions intensity in Alberta and Saskatchewan and B.C. and
Saskatchewan. For some of the sectors, the p-value was below the 5%, which means that
emissions intensity levels between the control and treatment provinces were significantly
different in those sectors. These sectors included oil and gas, transportation, residential
buildings, and manufacturing sectors in Alberta, and the transportation, manufacturing and
agriculture sectors in B.C.
Based on the trends observed in the figures above, and the results of the two-sided t-test there
is motivation to test whether the carbon levy and the carbon tax are causing the difference in
emissions intensity between provinces. The difference in difference estimate conducted
determines whether divergence in the emissions intensity levels of the control and the
treatment group can be attributed to the carbon price.

39
4.3 Results of Estimation
Province British Columbia
Sector Elec & Heat Oil & Gas Transportation Residential buildings Manufacturing Agriculture Construction
𝜷₀ -0.0000463 0.0002352* 0.0011473* -0.0000262 -0.0004202* -0.0001242 -5.79E-06
𝜷₁ -0.0131452*
-0.00000146 -0.0019389* -0.0006689* -0.0037704* 0.0018626*
-0.00000727*
𝜹₁ 0.0000171 -0.000469 -0.0014328* 0.0000508 0.0004182* -0.0001784 0.00000236
Standard Error 0.0004751 0.0001013 0.0003244 0.000112 0.0001631 0.0001848 5.083-06
T 0.04 -0.46 -4.42 0.45 2.56 -0.97 0.47
P value 0.972 0.648 0 0.654 0.018 0.345 0.647
[95% Conf. Interval]
-0.0009901 -0.0002569 -0.0021057 -0.0001814 0.0000801 -0.0005616 -0.00000817
0.0010244 0.0001632 -0.00076 0.0002831 0.0007564 -0.0002049 0.0000129
R-Squared 0.995 0.4476 0.9269 0.8791 0.9907 0.9539 0.3396
*denotes P-value is less than 0.05 and value is significant The standard error, t , P-values and confidence intervals are given for the coefficient 𝜹₁
Province Alberta
Sector Elec & Heat Oil & Gas Transportation Residential buildings Manufacturing Agriculture Construction
𝜷₀ -0.0001172 0.0002425* 0.0012365* -0.0000242 -0.0002978* -0.0001617 -3.83E-06*
𝜷₁ -0.0011892* 0.0002429* -0.0005683* 0.001222* -0.0028443* 0.0055481* -8.07E-06*
𝜹₁ -0.0016323*
-0.0001481* -0.0013404* -0.0003128* 0.0001945 -0.0003932 0.00000194
Standard Error 0.00063 0.0000623 0.0002398 0.0001238 0.000179 0.0002998 0.0000023
T -2.59 -2.38 -5.59 -2.53 1.09 -1.31 0.84
P value 0.02 0.027 0 0.019 0.289 0.203 0.408
[95% Conf. Interval]
-0.0029678 -0.0002773 -0.0018377 -0.0005696 -0.0001767 -0.0010148 -0.00000283
-0.0002968 -0.0000189 -0.0008431 -0.000056 -0.0005656 0.0002285 0.00000671
R-Squared 0.7779 0.7672 0.8641 0.9408 0.9788 0.9843 0.6934

40
4.4. Discussion of Results:
4.4.1 Electricity and Heat
The coefficient 𝛿₁ Alberta Electricity and Heat is -0.0016323 and the p-value is significant at the
5% level. This means that the carbon levy has reduced emissions intensity in the Electricity and
Heat sector in Alberta by 0.163%. The coefficient 𝛽₁ for Alberta is also negative and significant
which could imply that some inherent differences between the two provinces caused the
difference in intensity.
Roughly, 43% of the large emitters in Alberta are power plants, which include mainly coal-fired
and gas-fired plants. Under the SGER, these coal and gas power plants are required to bring
down their emissions intensity by 12% of the baseline emissions. The carbon levy incentivizes
the adoption of more efficient technologies in reducing the emissions intensity. 56
It is worth noting that coal power plants are subject to provincial and federal regulations other
than SGER. These include the following:
Alberta Air Emission Standards for Electricity Generation and Alberta Air Emission
Guidelines for Electricity Generation
Reduction of Carbon Dioxide Emissions from Coal‐fired Generation of Electricity
Regulations
Base Level Industrial Emission Requirements (BLIERS)
These regulations put stringent checks on the operation of coal powered plants and in most
cases require them to substitute their existing equipment with “retrofit” emissions control
56 Bob Twa and David Butler, “Use of Low Grade Heat from Existing Coal Plants in Alberta,” 2013, online: http://www.ai-ees.ca/media/12503/use_of_low_grade_heat_from_coal_plants_11jun13.pdf

41
technologies or invest in carbon sequestration technologies to reduce their emissions.57 It is
difficult to isolate the effect of the $15/tonne levy from the impact of the above-mentioned
regulations on emissions intensity of the Electricity and Heat Sector. However, it does increase
the marginal cost of abatement for these facilities and encourages a shift away from coal power
plants. A report by AESO forecasts that the mix of Alberta’s power generation will become
more gas-dominated than coal. 58 The carbon levy makes coal plants less competitive as
compared to gas-fired plants as the price on carbon increases the marginal cost of electricity
from coal powered plants.
The coefficient measuring the impact of the B.C carbon tax on the Electricity and Heat
Generation sector was 0.0000171 and was statistically insignificant. B.C’s energy mix is
dominated by hydropower, and therefore, the impact of the tax on this sector cannot induce
further substitution.
4.4.2. Oil & Gas
The coefficient representing the impact of the carbon levy on the Oil and Gas sector in Alberta
is -0.0001481 and the p-value is significant at the 5% level. This estimate implies that the levy
resulted in a 0.015% decrease in the emissions intensity level of Alberta’s oil and gas sector.
Almost 28% of the emitters subjected to the carbon levy are oil sands mining, in situ extraction
and upgrading facilities. The levy probably resulted in an “energy intensity effect.” An energy
57 Ibid. 2 58 Alberta Electric System Operator, “AESO 2012 Long-Term Outlook,” online: http://www.aeso.ca/downloads/AESO_2012_Long-term_Outlook_bookmarked.pdf

42
intensity effect can be brought about by advancements in oil sands technology-- resulting in
greater efficiencies (that is less energy being used to produce the same level of output.)
Facilities are re-using energy, thus reducing emissions per unit of output.
Several energy efficiency projects have been initiated by the Climate Change and Emissions
Management Corporation (CCEMC), which shows that the revenue from the levy is being
channeled towards GHG reduction programs. Most of these projects have not been deployed at
a commercial level so it is difficult to quantify the full impact on emissions from Alberta’s oil
and gas sector.
The value of B.C’s coefficient 𝛿₁ for Oil and Gas is -0.000469. Even though, value of B.C’s
coefficient is larger than that of Alberta’s, it does not pass the significance test. This suggests
that the mitigation effects of the carbon tax are limited in B.C’s oil and gas sector.
4.4.3. Transportation
The statistical results suggest that the $15/tonne levy has also had a positive and significant
impact on reducing the emissions intensity of the transportation sector in Alberta. The value of
𝛿₁ is -0.00134 and is significant at the 5% level. This implies that Alberta’s carbon levy may have
resulted in a 0.134% decrease in the emissions intensity level of Alberta’s transportation sector.
The coefficient 𝛽₁ is negative and significant which implies that there were differences between
Alberta and Saskatchewan other than the tax that resulted in a decrease in emissions intensity
levels. Such factors can include, for example, differences in the stock of transportation.

43
The transportation sector is not directly affected by the levy, except in the case of pipeline
transportation. While nothing can be concluded with certainty, there is a possibility of spillover
effects from other sectors. Costs of the carbon levy may have been passed on to the
transportation sector resulting in substitution away from less fuel efficient vehicles.
Knowles notes that within the subsector of passenger transportation, energy intensity has
decreased by 20% between 1990 and 2010 due to a move towards more fuel efficient cars. This
is despite the increase in use of light-truck vehicles for personal transportation.59 He also finds
that the increase in absolute emissions from freight transportation as compared to emissions
from passenger transportation is disproportionately higher in Alberta than in other
jurisdictions. While freight transportation became more fuel-efficient, the overall volume of
freight has increased and has resulted in a net increase in emissions. Knowles finds that freight
emissions have increased independent of population and GDP growth. This trend was exclusive
to the jurisdictions of Alberta and Saskatchewan. Knowles alludes to the possibility that this
increase was due to Alberta’s heavy reliance on oil and gas extraction, and the need to
transport equipment and machinery to extraction sites. 60 The hypothesis has not been
empirically tested, however, it may be inconclusively postulated that most large emitters in the
oil and gas sector passed on the costs of the carbon levy to freight transportation resulting in a
decrease in emissions intensity.
59 James Christopher Knowles, “What’s Driving Alberta’s Emissions? Decomposing Greenhouse Gases Emitted by Alberta’s Road Transportation Sector,” Simon Fraser University, 2013: 1 60 Ibid. 24-26

44
In Alberta, especially, pipelines haven’t kept pace with the growth of the oil and gas sector and
the province is relying heavily on rail transportation to transport their product to markets.
One possible factor in decreasing the overall GHG emissions intensity of the transportation
sector could also be changes in urban and rural densification. However, there is no empirical
evidence to support this.
The impact of the B.C carbon tax on the emissions intensity of the transportation sector of B.C.
was also positive and significant (that is, the tax caused a decline in emissions intensity levels.)
The estimate suggests that the tax resulted in a 0.143% reduction in emissions intensity levels.
A possible reason for this could be tax induced behavioral changes where people are
substituting away from private vehicles to public transportation. Comparing the coefficients of
both provinces, B.C’s carbon tax induced a relatively larger reduction in emissions intensity
level than did Alberta’s carbon levy.
Knowles’ research suggests that in both Alberta and B.C, the stock of transportation, fuel mix,
and GHG emissions intensity for each fuel type has only had a small negative effect on
emissions. The real driver of decreasing GHG emissions intensity has been gains from fuel
efficiency, which has cancelled out the effects of increase in the volume of transportation.61
61 Ibid. 16
45
4.4.4. Residential Buildings
The coefficient 𝛿₁ measuring the impact of the levy was -0.000312 and statistically significant in
the case of Residential Buildings in Alberta. This suggests there was a 0.031% reduction in
emissions intensity levels due to the carbon levy. This sector includes emissions from fuel
consumed for personal residences.62 The fuels used by households is mostly for space and
water heating. The fuel mix comprises of natural gas, heating oil, propane, and wood. Electricity
is used for appliances. Emissions in the residential sector also depend on the stock of housing
units. Newer construction is more energy efficient and results in lower emissions. In Alberta,
the decrease in emissions intensity was either due to efficiency gains from better construction
quality, or a shift towards more natural gas usage for space heating. It is also possible that the
incidence of the levy was shifted from the power generation sector to households in the form
of higher electricity prices. However, further analysis is required to prove causation.
In B.C., the tax had no impact on residential emissions. This is probably due to the fact that B.C.
relies on clean, hydro energy and there were no spillover effects from the power generation
sector. B.C’s revenue recycling in the form of tax rebates may also be a reason why residential
emissions were not impacted. It is a plausible inference that the tax rebate resulted in a
rebound effect, causing any impact of the tax on residential emissions to be offset by an
increase in the use of fuels. It should be noted, however, that more empirical investigation is
needed to test this hypothesis. 62 National Inventory Report 1990-2012: Greenhouse Gas Sources and Sinks in Canada https://www.ec.gc.ca/ges-ghg/default.asp?lang=En&n=3808457C-1&offset=5&toc=show

46
4.4.5. Manufacturing
The results from the manufacturing sector were unexpected. In both provinces, the coefficients
of the term measuring the mitigation effects were positive and significant. The coefficient 𝛿₁
was 0.000194 for Alberta and 0.000418 for B.C. This implies that emissions intensity increased
as a result of the tax. The increase in emissions intensity level of B.C. was more than that of
Alberta since B.C’s coefficient term is a larger than Alberta’s.
A possible explanation for this result in Alberta might be the operation of a large number of
manufacturing facilities that produce less than 100,000 kt CO₂ are not subject to the $15/tonne
levy. Individually, any one facility might not be producing the threshold level of emissions but
the sector, overall, might have many small emitters. The exemption is probably what is
resulting in an increase in emissions intensity.
In B.C, however, there are no exemptions. A news article reported that the competitiveness of
B.C’s industry is being affected by the carbon tax.63 Since B.C is one of the few jurisdictions to
have a price on carbon, it increases the cost of doing business. This creates incentives for
businesses to shift production in the long term. In the short-run, it has impacted output and
exports, especially in B.C’s cement industry. A report by the Kamloops Chamber of Commerce
points out that since the introduction of the tax, cement imports have increased from 4% to
23%. The reason is that cement imports are not subject to the carbon tax. This is resulting in job
63 Mike Youds, “Carbon tax jeopardizing industry jobs, critics say,” Kamloops Daily News, January 5, 2013 http://www.kamloopsnews.ca/carbon-tax-jeopardizing-industry-jobs-critics-say-1.1229562

47
losses within the cement industry. 64 The increase in emissions intensity of the manufacturing
sector may be attributed to sector GDP falling more than sector emissions.
4.4.6. Agriculture
The results indicate that there was no impact on the Agriculture sector of the levy in Alberta.
This is probably because the agriculture sector does not qualify as a large emitter. The
coefficient 𝛿₁ was negative for B.C but it did not pass the significance test. B.C’s carbon tax did
not demonstrate any reduction in emissions intensity in the agriculture sector even though the
tax was applied uniformly across all sectors.
4.4.7. Construction
Alberta’s carbon levy and B.C’s carbon tax had no effect on the emissions intensity of the
construction sector. The construction sector in Alberta is exempted from the carbon levy, which
explains why there was no impact on this sector.
5. Conclusion and Recommendations:
Despite being the first jurisdiction in North America to implement a price on carbon, Alberta’s
SGER has been criticised for both its design, and its inadequacy to meet the emissions reduction
targets. Parallels are drawn between the SGER and British Columbia’s $30 per tonne carbon tax
in environmental policy debates. Several recommendations have been made to make the SGER
more stringent so that the 50Mt reduction in emissions can be achieved by 2020.
64 Kamloops Chamber of Commerce, “B.C’s costly carbon tax,” online: http://www.kamloopschamber.ca/files/documents/BC%27s%20costly%20carbon%20tax%20FINAL.pdf

48
The SGER covers large industrial emitters in Alberta, which are responsible for nearly half of
Alberta’s GHG emissions. According to the National Inventory Report, 35% of Canada’s GHG
emissions can be attributed to Alberta. This implies that the SGER is applicable to almost one-
sixth of Canada’s emissions.65 It was therefore, extremely important to study the effectiveness
of such a policy. The statistical analysis performed in the report focuses on one aspect of the
SGER—the $15 per tonne levy—and assesses the effectiveness of this policy. It also evaluates
the impacts of the B.C. carbon tax on the emissions intensity levels of various sectors. Much of
the research conducted on the B.C. carbon tax focuses on either absolute emissions or per-
capita emissions. The estimates done in this report were based on emissions intensity so that
differences in sector size across the provinces could be controlled for.
The main findings are summarized below.
The statistical results suggest that the carbon levy in Alberta had a significant impact on
reducing the emissions intensity level of the Oil and Gas, Electricity and Heat, Transportation,
and Residential Buildings sectors. In contrast, in B.C. the carbon tax seems to have had a
significant negative impact on the emissions intensity level of the transportation sector.
The emissions intensity levels, both in Alberta and B.C’s manufacturing sector increased after
the introduction of a price on carbon. In Alberta, the mitigation effects were limited to the
sectors mentioned above since the levy applies to large emitters only. A long-term reduction in
65 Andrew Leach, “Policy Forum: Alberta’s Specified Gas Emitters Regulation,” Canadian Tax Journal (2012) 60:4, 882
49
emissions intensity level is only possible if the price on carbon induces a change in the overall
energy mix, and energy intensity of provinces.
Alberta’s environmental policies have been criticised for not being as aggressive as other
jurisdictions. The difference-in-difference estimate suggests that the levy is working; however,
even though the coefficients for some sectors are negative and statistically significant, the size
of the coefficients is too small to have a large environmental impact. While the levy has had a
relatively small impact on reducing emissions intensity, absolute emissions still continue to
grow. From an economic standpoint, the levy has not affected the competitiveness of Alberta’s
key industrial sectors because the scope and size of the levy is small. Since the levy is only
applicable to large emitters, the costs of the levy have not been disproportionately passed on
to low income households in Alberta and so the levy does not seem to have had a regressive
impact. The real distributive impacts of the levy will become clearer in the long run once low
carbon technologies (funded by revenues from Alberta’s carbon levy) have been substituted for
carbon intensive technologies at a commercial scale.
The effectiveness of B.C’s carbon tax is limited since B.C. relies mainly on renewable energy
sources. There is little room for tax induced substitution if a jurisdiction does not rely on fossil
fuels. The B.C carbon tax was implemented in 2008, and a longer time period of analysis is
needed to see the full impact of the tax. The distributional and economic impacts of the tax will
50
be clearer in a few more years, and so estimates from a long-term post-tax empirical study
might diverge from the estimates in this study.
The methodology used in the paper controls for factors such as sector size by using GHG
emissions intensities, and while the difference-in-difference approach isolates time dependent
trends from policy induced changes, there are still some weaknesses in the methodology
adopted. For example, there are inherent differences between all three provinces, and while
Saskatchewan is the best option for a control, it isn’t a perfect option. There were also data
limitations, one of which was the availability of data points in the pre-policy implementation
phase. Due to these reasons the estimates in this paper are indicative at best, rather than
conclusive.
A review of the literature and the analysis conducted in the paper suggests that implementing a
price on carbon is not the only factor that affects emissions. The method of revenue
disbursement, scope of the tax, energy mix of the electricity and heat generation sectors, fuel
mix of the transportation sector are all crucial in achieving a low carbon future. For a carbon
tax/levy to work, it is important that it is applied evenly across all sectors, combined with other
policy instruments such as investments in cleaner technologies, and is set at a level which
induces substitution towards less carbon intensive systems.

51
Based on the findings of the research done in this report, the research conducted by think
tanks, academics and environmental groups, a set of recommendations has been developed to
improve the current environmental policies of Alberta and B.C.
Recommendation 1
Expand the scope of the Alberta carbon levy for large and small emitters
While the Alberta carbon levy has seemed to lower emissions intensity levels, the scope of the
tax needs to extend beyond the existing large emitters to include small emitters that contribute
to the province’s emissions on an aggregate level. Since the carbon levy is not applicable on
small emitters, this provides little incentive for them to substitute towards more efficient
technologies. By subjecting the small emitters to the levy, emissions intensity levels will
probably decrease by a larger percentage. It is recommended that facilities which emit between
50,000 and 99,999 ktCO₂ are subjected to a $10 per tonne levy on emissions above 10% of their
baseline emissions intensity. The levy for large emitters should be increased to $20 per tonne
with a 20 per cent intensity target instead of the current 12 per cent. This would result in a two-
tiered levy structure and provide a stronger incentive to both large and small emitters to
reduce their emissions intensity levels.
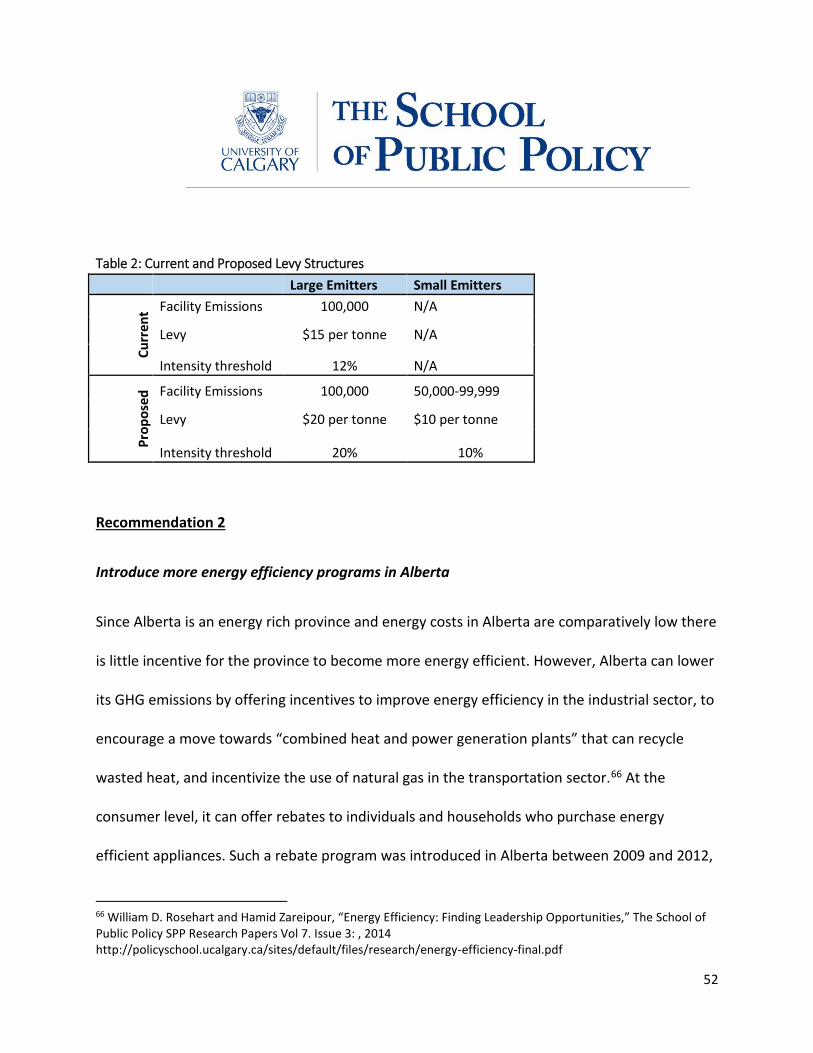
52
Table 2: Current and Proposed Levy Structures
Large Emitters Small Emitters
Cu
rren
t Facility Emissions 100,000 N/A
Levy $15 per tonne N/A
Intensity threshold 12% N/A
Pro
po
sed
Facility Emissions 100,000 50,000-99,999
Levy $20 per tonne $10 per tonne
Intensity threshold 20% 10%
Recommendation 2
Introduce more energy efficiency programs in Alberta
Since Alberta is an energy rich province and energy costs in Alberta are comparatively low there
is little incentive for the province to become more energy efficient. However, Alberta can lower
its GHG emissions by offering incentives to improve energy efficiency in the industrial sector, to
encourage a move towards “combined heat and power generation plants” that can recycle
wasted heat, and incentivize the use of natural gas in the transportation sector.66 At the
consumer level, it can offer rebates to individuals and households who purchase energy
efficient appliances. Such a rebate program was introduced in Alberta between 2009 and 2012,
66 William D. Rosehart and Hamid Zareipour, “Energy Efficiency: Finding Leadership Opportunities,” The School of Public Policy SPP Research Papers Vol 7. Issue 3: , 2014 http://policyschool.ucalgary.ca/sites/default/files/research/energy-efficiency-final.pdf
53
which resulted in a “2.6 Mt of reductions over the lifetime of the promoted technologies.”67
However, there is a need to offer such incentives on a continuous basis to change consumer
behaviour and energy demand in the long run. This will help Alberta in consuming less energy,
and thus reduce the province’s carbon footprint.
Recommendation 3
Phase out the use of coal-fired plants for power generation in Alberta
Alberta relies heavily on coal-fired plants to generate electricity—almost 75% of Alberta’s
electricity is produced with coal. By transitioning to an energy mix that relies more on natural
gas, wind and solar, Alberta can reduce its emissions by a large percentage.68 According to a
scenario proposed by the Pembina Institute, if 50% of the electricity produced from
conventional coal was generated by alternatives like wind, industrial cogeneration it would lead
to an estimated emissions reduction of 70 Mt by 2028.69 Natural gas can be used as a bridge
fuel as the province develops its wind and solar capacity. By focusing on its electricity-sector
emissions, Alberta can dramatically alter its GHG emissions profile.
67 Government of Alberta, Environment and Sustainable Resource Development: Alberta and Climate Change http://esrd.alberta.ca/focus/alberta-and-climate-change/ 68Tyler Hamilton, “Coal and easier target than Oil Sands in Alberta,” Toronto Star, March 10, 2012 http://www.thestar.com/business/tech_news/2012/03/10/coal_an_easier_target_than_oil_sands_in_alberta.html 69 Jeff Bell, Tim Weis, “Greening the Grid,” The Pembina Institute, April, 2009 http://www.pembina.org/reports/greeningthegrid-report.pdf

54
Recommendation 4
Continuous monitoring of performance of Alberta’s SGER
The Alberta Auditor General’s Report found that the Department of Environment and
Sustainable Resource Development (ESRD) lacked a plan to evaluate the effectiveness of
current climate change initiatives. Performance monitoring was particularly lax between 2008
and 2012, and ESRD has been slow in implementing the recommendations put forward in
previous Auditor General Reports. 70
Improved performance monitoring is required so that ineffective policies in Alberta’s Climate
Change portfolio can be revised. ESRD needs to devise an implementation plan to achieve the
emissions intensity targets.71
Recommendation 5
Aligning carbon policies with other jurisdictions
Even though each province has a different landscape and what works in Alberta might not work
in B.C., there is merit to the argument of aligning climate change policies. This would help
Alberta in gaining market access, as harmonization of carbon policy with jurisdictions in Canada
and the U.S. would lend credibility to Alberta’s efforts of responsible resource development.
70 Report of the Auditor General of Alberta, 2014: 39 http://www.oag.ab.ca/webfiles/reports/AGJuly2014Report.pdf. 71 Ibid. 41

55
Aligning climate change policies would mitigate some of the adverse effects on economic
competitiveness. A starting point for such an alignment could be the opening up of Alberta’s
carbon offset market to B.C.72 This would lower compliance costs for large emitters in Alberta,
and help companies in maintaining a competitive edge, especially in the current market
conditions where low oil prices have already put a strain on Alberta’s economy.73
72 Trevor McLeod, Shafak Sajid, “Western Canada should lead on carbon,” The Globe and Mail, February 12, 2015 http://www.theglobeandmail.com/news/alberta/western-canada-should-lead-on-carbon/article22973783/ 73 Ibid.

56
REFERENCES
Alberta Electric System Operator. “AESO 2012 Long-Term Outlook.” http://www.aeso.ca/downloads/AESO_2012_Long-term_Outlook_bookmarked.pdf
Avi-Yonah, Reuven S. and David M. Uhlmann. “Combating Global Climate Change: Why a Carbon Tax Is a Better Response to Global Warming Than Cap and Trade.” Stanford Environmental Law Journal Vol. 28:3 (2009)
Baranzini, Andrea, Jose Goldemberg, and Stefan Speck. “A future for carbon taxes.” Ecological Economics 32 (2000): 395-412
Bell, Jeff, Tim Weis. “Greening the Grid.” The Pembina Institute. April, 2009. http://www.pembina.org/reports/greeningthegrid-report.pdf British Columbia, Climate Action Plan (2008) http://www.gov.bc.ca/premier/attachments/climate_action_plan.pdf
British Columbia, Ministry of Finance. “How the Carbon Tax Works.” online:http://www.fin.gov.bc.ca/tbs/tp/climate/A4.htm British Columbia, Ministry of Finance. “Myths and Facts about the Carbon Tax.” http://www.fin.gov.bc.ca/tbs/tp/climate/A6.htm Bruvoll, Annegrete and Bodil Merethe Larsen. “Greenhouse Gas Emissions in Norway: Do Carbon Taxes Work?” Energy Policy 32(4): 493-505
CCEMC. Annual Report 2013 http://ccemc.ca/wp-content/uploads/2013/12/CCEMC-2013-AnnualReport-web-R1.pdf Conference Board of Canada. “The Economic and Employment Impacts of Climate-Related Technology Investments.” Conference Board of Canada 2010
Dembicki, Geoff. “To Spur Innovation, What Price to Put on Oil Sands Carbon?” The Tyee, June 21, 2012. http://thetyee.ca/News/2012/06/21/Oil-Sands-Carbon-Price/
Elgie, Stewart and Jessica McClay. “B.C’s Carbon Tax Shift After Five Years: Results.” Canadian Public Policy, July 2013 http://www.sustainableprosperity.ca/dl1026&display

57
Fluker, Shaun. “Raising Questions About The Use of an Offset For Compliance with Carbon Emission
Reduction Obligations.” Ablawg.ca, June 13, 2013 http://ablawg.ca/2013/06/13/raising-questions-
about-the-use-of-an-offset-for-compliance-with-carbon-emission-reduction-obligations/
Government of Alberta. Alberta Environment and Sustainable Resource Development: Green House Gas Reduction Program, 2013 http://esrd.alberta.ca/focus/alberta-and-climate-change/regulating-greenhouse-gas-emissions/greenhouse-gas-reduction-program/default.aspx
Government of Alberta. Environment and Sustainable Resource Development: Alberta and Climate Change. http://esrd.alberta.ca/focus/alberta-and-climate-change/ Kamloops Chamber of Commerce. “B.C’s costly carbon tax.” http://www.kamloopschamber.ca/files/documents/BC%27s%20costly%20carbon%20tax%20FINAL.pdf Kathryn Harrison. “The Political Economy of British Columbia’s Carbon Tax.” OECD Environment Working Papers No 63, October 8, 2013 http://www.oecd.org/officialdocuments/publicdisplaydocumentpdf/?cote=ENV/WKP(2013)10&docLanguage=En Knowles, James Christopher. “What’s Driving Alberta’s Emissions? Decomposing Greenhouse Gases Emitted by Alberta’s Road Transportation Sector.” Simon Fraser University. 2013
Leach, Andrew. “Policy Forum: Alberta’s Specified Gas Emitters Regulation.” Canadian Tax Journal 60:4 (2012) : 881-898
Lee, Marc. “Fair and Effective Carbon Pricing: Lessons from British Columbia.” Canadian Centre for Policy Alternatives, 2011 http://www.sierraclub.bc.ca/publications/scbc-reports/CCPA-BC_Fair_Effective_Carbon_FULL.pdf/at_download/file Lin, Boqiang and Xuehui Li. “The effect of carbon tax on per capita CO₂ emissions.” Energy Policy 39 (2011): 5137-5146 McLeod, Trevor, Shafak Sajid. “Western Canada should lead on carbon.” The Globe and Mail. February 12, 2015. http://www.theglobeandmail.com/news/alberta/western-canada-should-lead-on-carbon/article22973783/ Muro, Mark and Jonathan Rothwell. “Institute a Modest Carbon Tax to Reduce Carbon Emissions, Finance Clean Energy Technology Development, Cut Taxes, and Reduce the Deficit.” Brookings Institute, 2012. http://www.brookings.edu/~/media/research/files/papers/2012/11/13%20federalism/13%20carbon%20tax.pdf

58
Office of the Auditor General of Alberta. Report of the Auditor General of Alberta, July 2014. http://www.oag.ab.ca/webfiles/reports/AGJuly2014Report.pdf
National Inventory Report 1990-2012: Greenhouse Gas Sources and Sinks in Canada https://www.ec.gc.ca/ges-ghg/default.asp?lang=En&n=3808457C-1&offset=5&toc=show
Rayne, Sierra and Kaya Forest. “British Columbia’s Carbon Tax: Greenhouse Gas Emission and Economic Trends Since Introduction.” Saskatchewan Institute of Applied Science and Technology, 2013 http://vixra.org/pdf/1301.0094v1.pdf
Rivers, Nicholas and Brandon Schaufele. “Salience of Carbon Taxes in the Gasoline Market.” University of Ottawa, Working Paper 1211E https://socialsciences.uottawa.ca/sites/default/files/public/eco/eng/documents/1211e.pdf
Rosehart, William D and Hamid Zareipour. “Energy Efficiency: Finding Leadership Opportunities.” The School of Public Policy SPP Research Papers Vol 7. Issue 3: 2014
http://policyschool.ucalgary.ca/sites/default/files/research/energy-efficiency-final.pdf
Twa, Bob and David Butler. “Use of Low Grade Heat from Existing Coal Plants in Alberta.” 2013 http://www.ai-ees.ca/media/12503/use_of_low_grade_heat_from_coal_plants_11jun13.pdf
Youds, Mike. “Carbon tax jeopardizing industry jobs, critics say,” Kamloops Daily News, January 5, 2013 http://www.kamloopsnews.ca/carbon-tax-jeopardizing-industry-jobs-critics-say-1.1229562