fin374-jansen-written project
TRANSCRIPT
2
Table of Contents
History………………………………………………………………………………………………………………….3
Products……………………………………………………………………………………………………………….4
Risk Assessment……………………………………………………………………………………………..…5-6
Financial Situation…………………………………………………………………………………………..7-28
Policies Written…………………………………………………………………………………………….29-30
Regulation………………………………………………………………………………………………………….31
Future Prospects………………………………………………………………………………………………..32
Recommendations……………………………………………………………………………………………..33
Sources……………………………………………………………………………………………………………...34
3
History
MetLife has a long history stretching over 140 years. A group of New York City
businessmen got together in 1863 to form National Union Life and Limb Insurance Company.
They opened for business in July 1864 and started insuring Civil War sailors and soldiers who
suffered from war related disabilities. The company had a difficult beginning and after five
years President James R. Dow and the board of directors decided to drop the casualty business
and focus on life insurance. Metropolitan Life Insurance Company was formed on March 24,
1868. The name has been shortened to MetLife over the years.
In 1909, MetLife became the nation's largest life insurer in terms of insurance in force.
On January 6, 1915 MetLife completed the process mutualization and changed from a stock life
insurance company to a mutual company. In the 1920s and 1930s, MetLife was involved with
the construction projects of major buildings in New York. Met Life financed the construction of
the Empire State Building in 1929 and provided capital to build Rockefeller Center in 1931.
MetLife went public in April of 2000 and had an IPO of $14.25/share. At that time, there were
nine million shareholders and MetLife was the most widely held stock in North America.
Today, MetLife holds leading market positions in the United States, Japan, Latin America, Asia’s
Pacific region, Europe, and the Middle East.
4
Products
Insurance
Life Insurance*
o Term Life Insurance
o Final Expense Whole Life Insurance
o Whole Life Insurance
o Universal Life Insurance
Disability Income Insurance
o Individual Disability Insurance
Auto Insurance
o Individual Auto Insurance
o Group Auto Insurance
Home Insurance
o Homeowners
o Condo
o Renters
o Insurance for Landlord
o Mobile Home Insurance
Employee Benefits
Life
Dental
Disability
Vision
Accident & Health
Investment
Annuities
IRAs
Mutual Funds and Brokerage (MetLife Securities Inc.)
*Life Insurance is MetLife’s biggest area of business. Life is in their name!
5
Risk Assessment
Underwriting
In October of 2012, Hurricane Sandy made its way across the Eastern United States and
brought with it a lot of destruction and death. Events like this can greatly impact insurance
companies like MetLife. Their underwriting is always at risk for the potential of another
catastrophic storm like Hurricane Sandy. In their annual report, MetLife talks about how they
are focusing on disciplined underwriting and do not see any significant changes to the
underlying trends that drive underwriting results. However, another catastrophe could result in
a high volume of claims.
Reinsurance
In their annual report, MetLife addresses the issue of reinsurance and the risks it
involves. MetLife is both a purchaser and provider of reinsurance. Reinsurance activities are
used to limit losses, minimize exposer to significant risk, and provide additional capacity for
future growth. Reinsurance is based on estimates and assumptions related to the future
performance of the underlying business and the potential of counterparty credit risks.
At MetLife, they periodically review the actual and anticipated experience compared to
the assumptions that are involved with reinsurance. For each reinsurance agreement, MetLife
must determine whether the agreement provides insurance against loss or liability related to
insurance risk and is within accounting standards. MetLife will also review the contractual
features that limit the insurance risk that the reinsurer is subject to. If the reinsurance

6
agreement does not expose the reinsurer to a reasonable possibility of a significant loss from
insurance risk, the deposit method of accounting is used.
7
Financial Situation
Ownership structure
MetLife, Inc. is set-up as a corporation. This means that the ownership of MetLife is
shared between stockholders who each own a percentage of the company based on the
number of shares they purchase. Because the company is public, anyone can own a share of the
company by purchasing a share in the stock market. The stockholders have limited liability and
are not held personally liable for the company’s debts. The stockholders elect a board of
directors who oversee the management of the corporation.
MetLife’s Board of Directors includes Steven A. Kandarian, Cheryl W. Grisé, Carlos M.
Gutierrez, R. Glenn Hubbard, John M. Keane, Alfred F. Kelly, Jr., William E. Kennard, James M.
Kilts, Catherine R. Kinney, Denise M. Morrison, Kenton J. Sicchitano, and Lulu C. Wang.
The Executive Officers include the President, CEO, Vice President, Chief Investment
Officer, Chief Investment Officer, Chief Financial Officer.
8
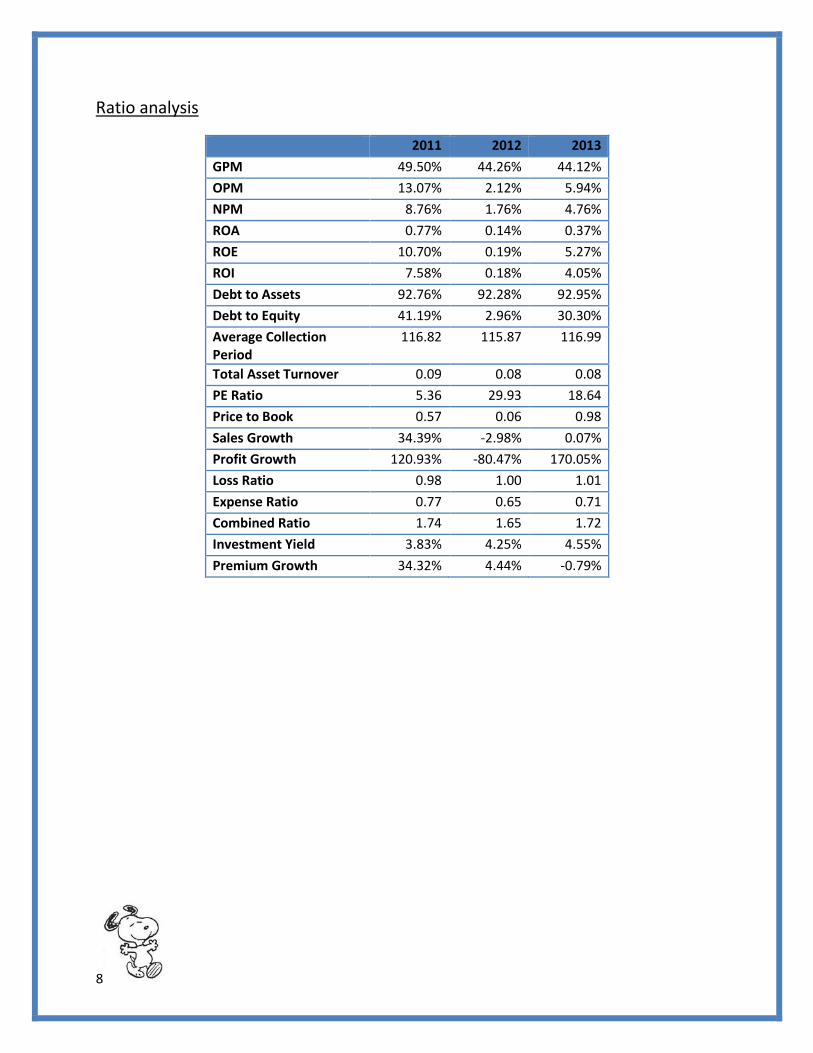
Ratio analysis
2011 2012 2013
GPM 49.50% 44.26% 44.12%
OPM 13.07% 2.12% 5.94%
NPM 8.76% 1.76% 4.76%
ROA 0.77% 0.14% 0.37%
ROE 10.70% 0.19% 5.27%
ROI 7.58% 0.18% 4.05%
Debt to Assets 92.76% 92.28% 92.95%
Debt to Equity 41.19% 2.96% 30.30%
Average Collection Period
116.82 115.87 116.99
Total Asset Turnover 0.09 0.08 0.08
PE Ratio 5.36 29.93 18.64
Price to Book 0.57 0.06 0.98
Sales Growth 34.39% -2.98% 0.07%
Profit Growth 120.93% -80.47% 170.05%
Loss Ratio 0.98 1.00 1.01
Expense Ratio 0.77 0.65 0.71
Combined Ratio 1.74 1.65 1.72
Investment Yield 3.83% 4.25% 4.55%
Premium Growth 34.32% 4.44% -0.79%
9
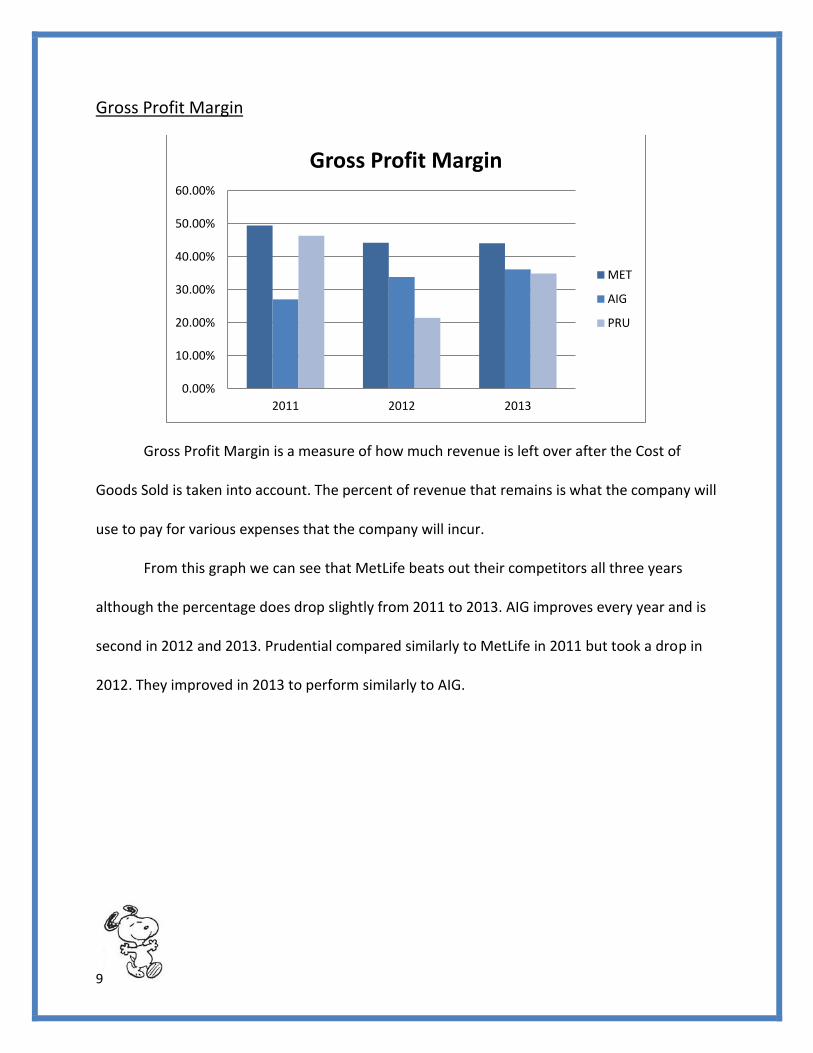
Gross Profit Margin
Gross Profit Margin is a measure of how much revenue is left over after the Cost of
Goods Sold is taken into account. The percent of revenue that remains is what the company will
use to pay for various expenses that the company will incur.
From this graph we can see that MetLife beats out their competitors all three years
although the percentage does drop slightly from 2011 to 2013. AIG improves every year and is
second in 2012 and 2013. Prudential compared similarly to MetLife in 2011 but took a drop in
2012. They improved in 2013 to perform similarly to AIG.
0.00%
10.00%
20.00%
30.00%
40.00%
50.00%
60.00%
2011 2012 2013
Gross Profit Margin
MET
AIG
PRU
10
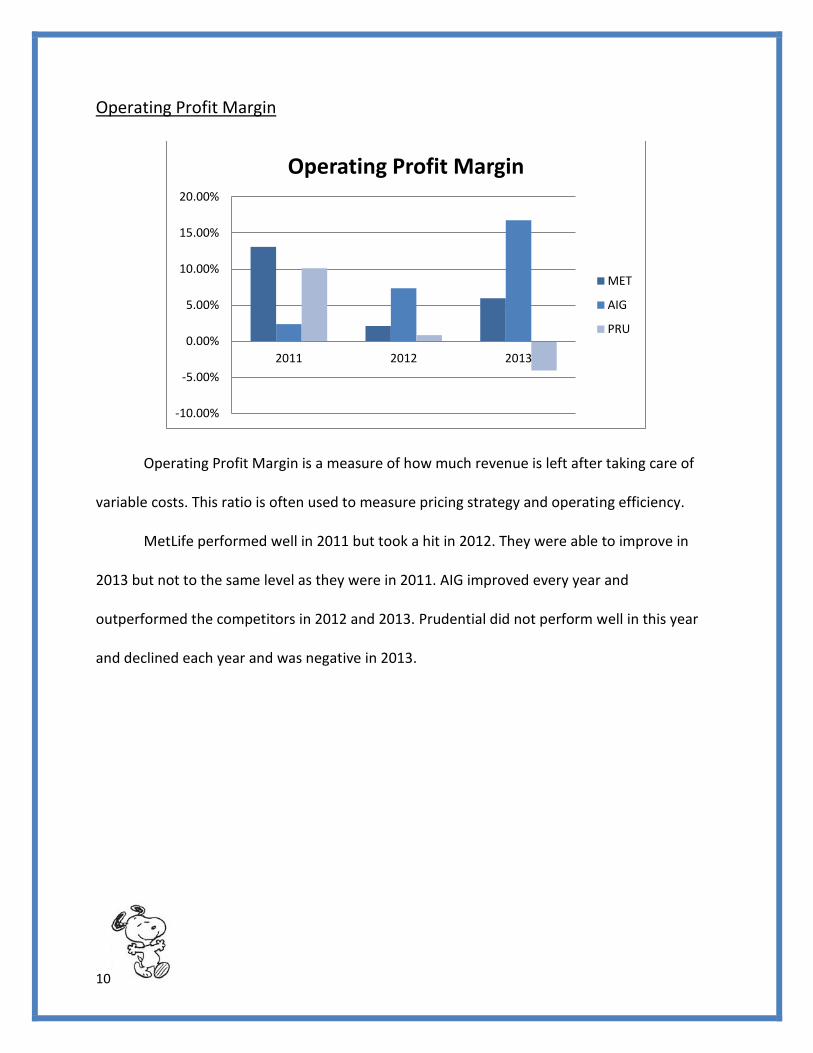
Operating Profit Margin
Operating Profit Margin is a measure of how much revenue is left after taking care of
variable costs. This ratio is often used to measure pricing strategy and operating efficiency.
MetLife performed well in 2011 but took a hit in 2012. They were able to improve in
2013 but not to the same level as they were in 2011. AIG improved every year and
outperformed the competitors in 2012 and 2013. Prudential did not perform well in this year
and declined each year and was negative in 2013.
-10.00%
-5.00%
0.00%
5.00%
10.00%
15.00%
20.00%
2011 2012 2013
Operating Profit Margin
MET
AIG
PRU
11
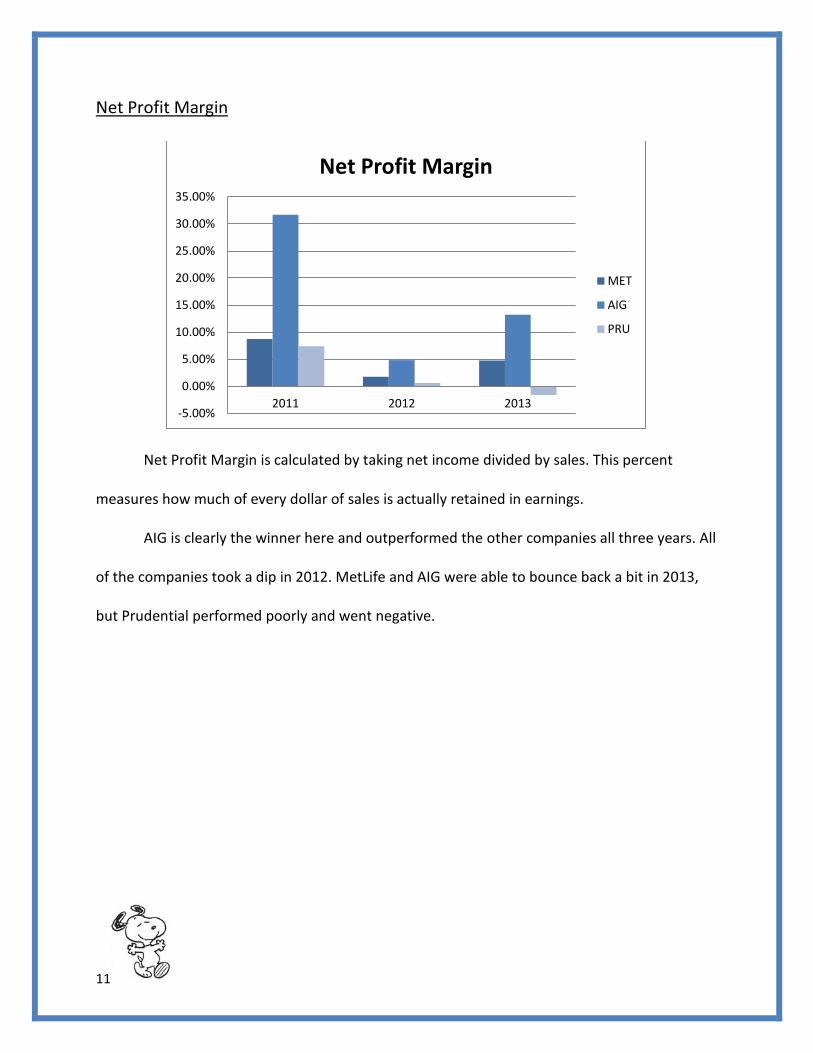
Net Profit Margin
Net Profit Margin is calculated by taking net income divided by sales. This percent
measures how much of every dollar of sales is actually retained in earnings.
AIG is clearly the winner here and outperformed the other companies all three years. All
of the companies took a dip in 2012. MetLife and AIG were able to bounce back a bit in 2013,
but Prudential performed poorly and went negative.
-5.00%
0.00%
5.00%
10.00%
15.00%
20.00%
25.00%
30.00%
35.00%
2011 2012 2013
Net Profit Margin
MET
AIG
PRU
12
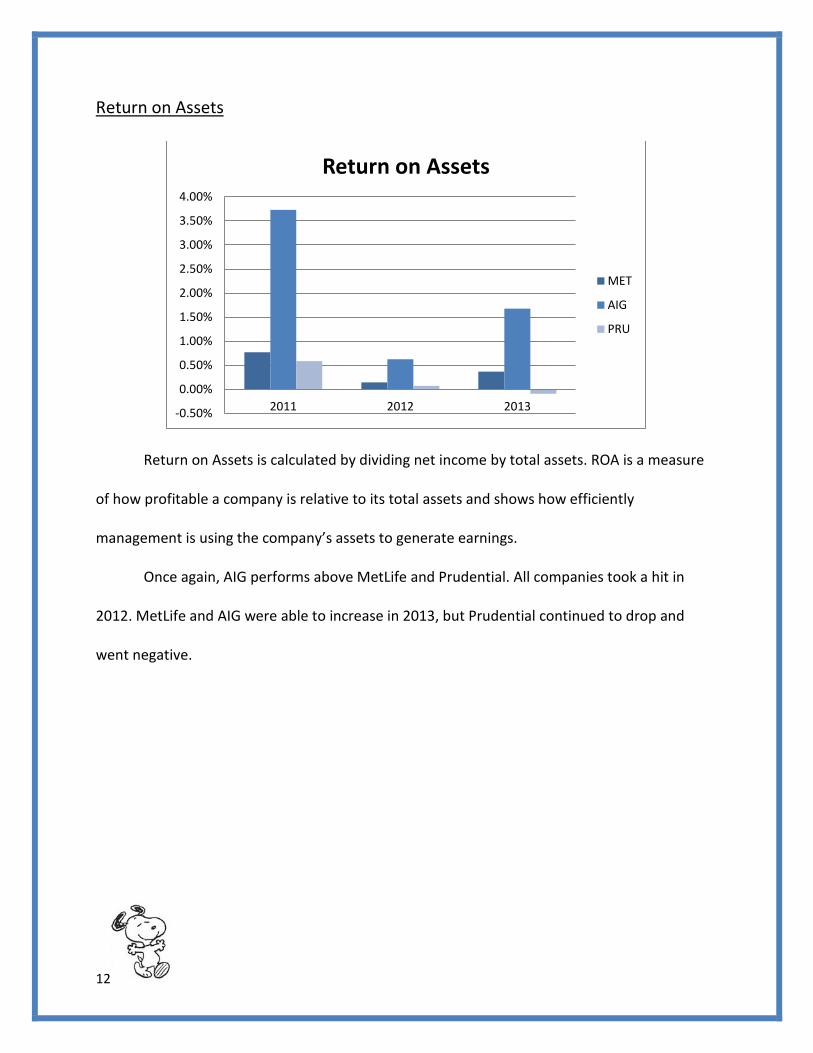
Return on Assets
Return on Assets is calculated by dividing net income by total assets. ROA is a measure
of how profitable a company is relative to its total assets and shows how efficiently
management is using the company’s assets to generate earnings.
Once again, AIG performs above MetLife and Prudential. All companies took a hit in
2012. MetLife and AIG were able to increase in 2013, but Prudential continued to drop and
went negative.
-0.50%
0.00%
0.50%
1.00%
1.50%
2.00%
2.50%
3.00%
3.50%
4.00%
2011 2012 2013
Return on Assets
MET
AIG
PRU
13
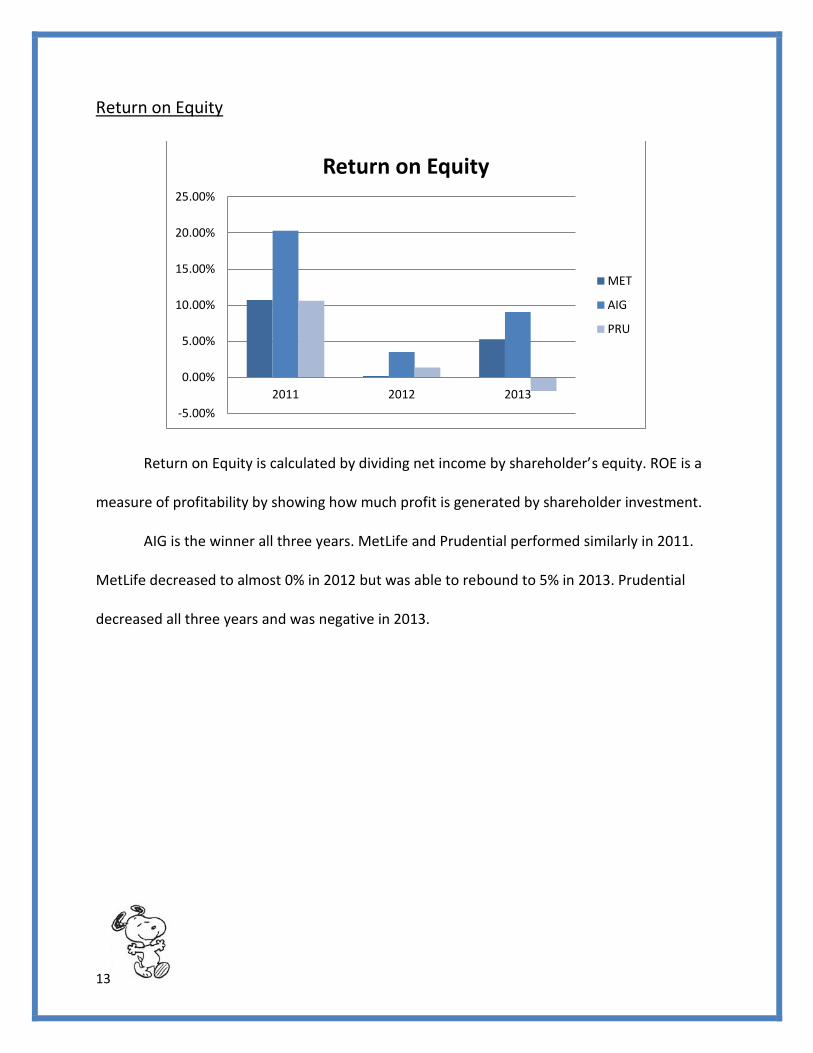
Return on Equity
Return on Equity is calculated by dividing net income by shareholder’s equity. ROE is a
measure of profitability by showing how much profit is generated by shareholder investment.
AIG is the winner all three years. MetLife and Prudential performed similarly in 2011.
MetLife decreased to almost 0% in 2012 but was able to rebound to 5% in 2013. Prudential
decreased all three years and was negative in 2013.
-5.00%
0.00%
5.00%
10.00%
15.00%
20.00%
25.00%
2011 2012 2013
Return on Equity
MET
AIG
PRU
14
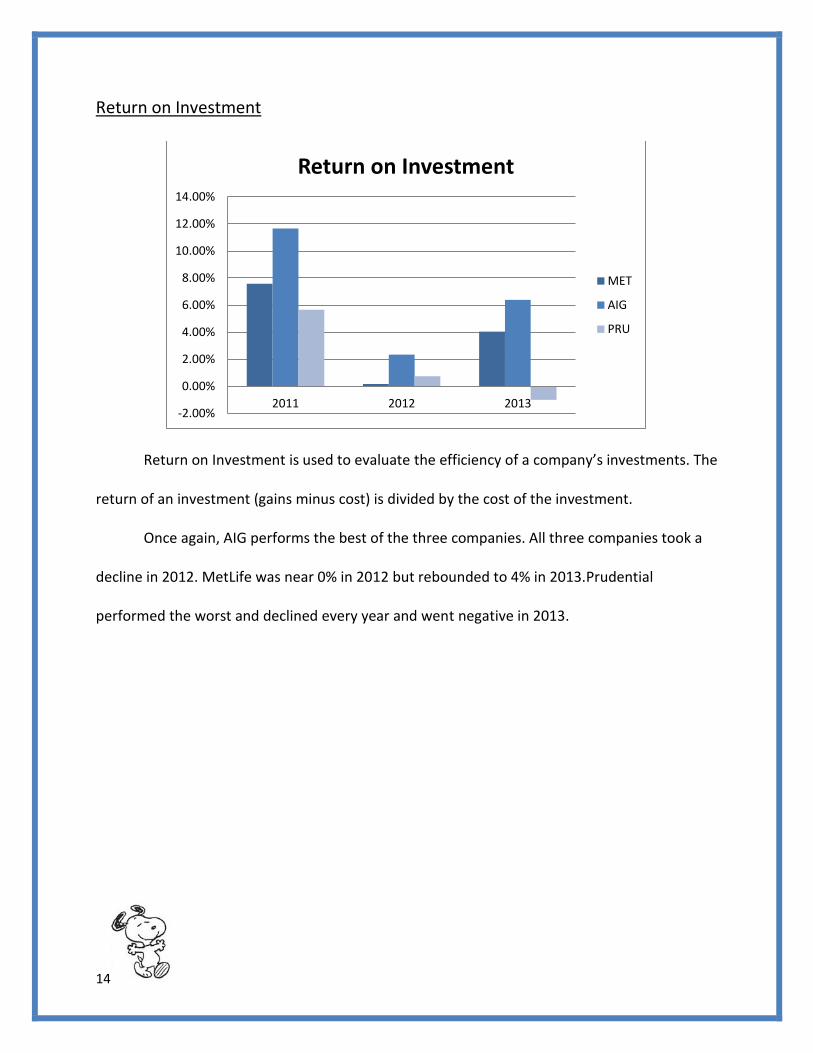
Return on Investment
Return on Investment is used to evaluate the efficiency of a company’s investments. The
return of an investment (gains minus cost) is divided by the cost of the investment.
Once again, AIG performs the best of the three companies. All three companies took a
decline in 2012. MetLife was near 0% in 2012 but rebounded to 4% in 2013.Prudential
performed the worst and declined every year and went negative in 2013.
-2.00%
0.00%
2.00%
4.00%
6.00%
8.00%
10.00%
12.00%
14.00%
2011 2012 2013
Return on Investment
MET
AIG
PRU
15
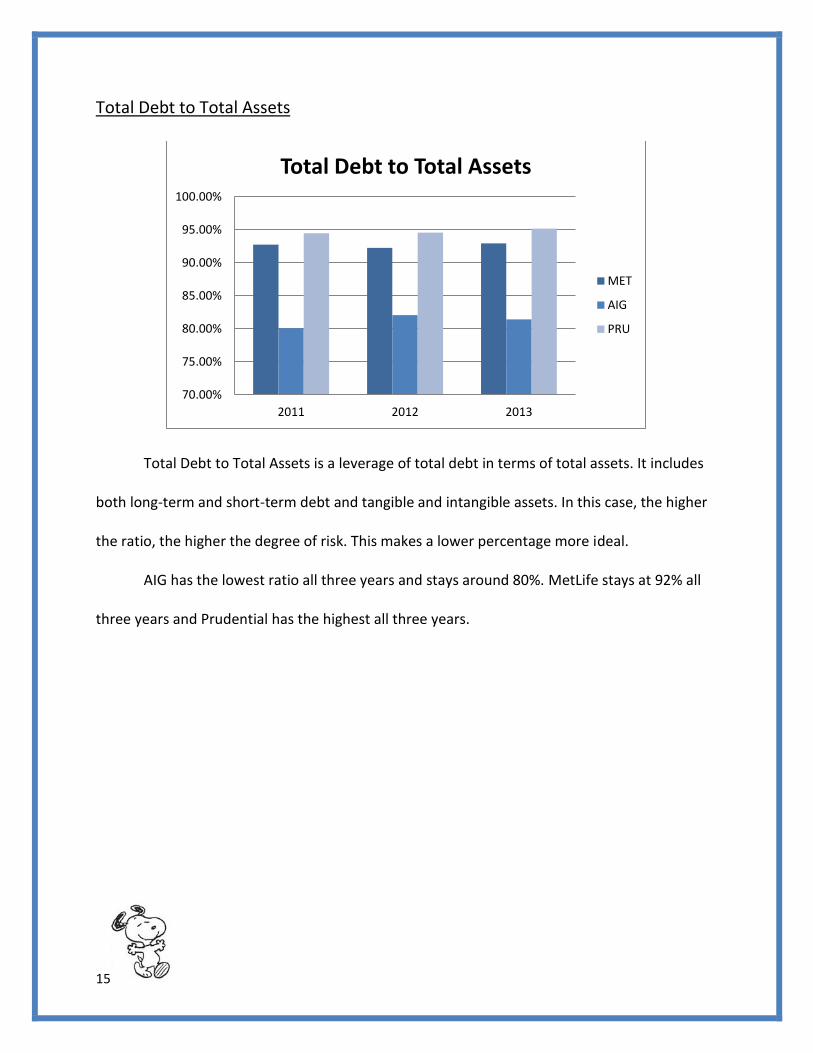
Total Debt to Total Assets
Total Debt to Total Assets is a leverage of total debt in terms of total assets. It includes
both long-term and short-term debt and tangible and intangible assets. In this case, the higher
the ratio, the higher the degree of risk. This makes a lower percentage more ideal.
AIG has the lowest ratio all three years and stays around 80%. MetLife stays at 92% all
three years and Prudential has the highest all three years.
70.00%
75.00%
80.00%
85.00%
90.00%
95.00%
100.00%
2011 2012 2013
Total Debt to Total Assets
MET
AIG
PRU
16
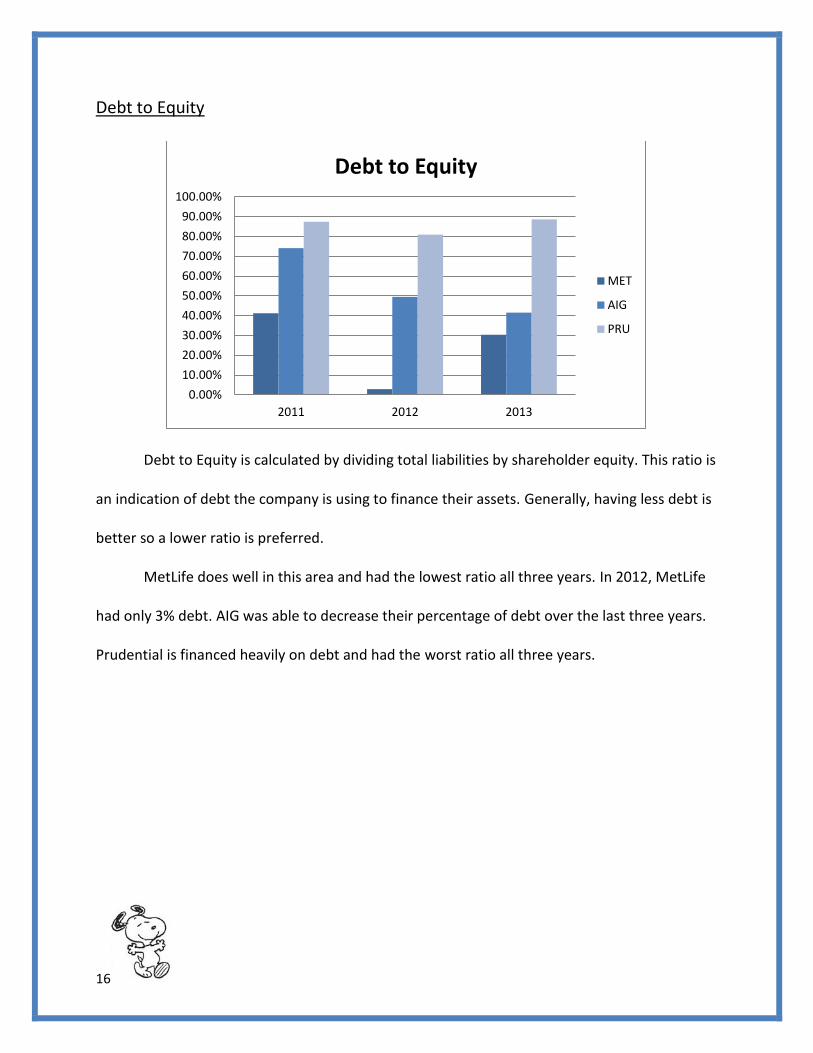
Debt to Equity
Debt to Equity is calculated by dividing total liabilities by shareholder equity. This ratio is
an indication of debt the company is using to finance their assets. Generally, having less debt is
better so a lower ratio is preferred.
MetLife does well in this area and had the lowest ratio all three years. In 2012, MetLife
had only 3% debt. AIG was able to decrease their percentage of debt over the last three years.
Prudential is financed heavily on debt and had the worst ratio all three years.
0.00%
10.00%
20.00%
30.00%
40.00%
50.00%
60.00%
70.00%
80.00%
90.00%
100.00%
2011 2012 2013
Debt to Equity
MET
AIG
PRU
17
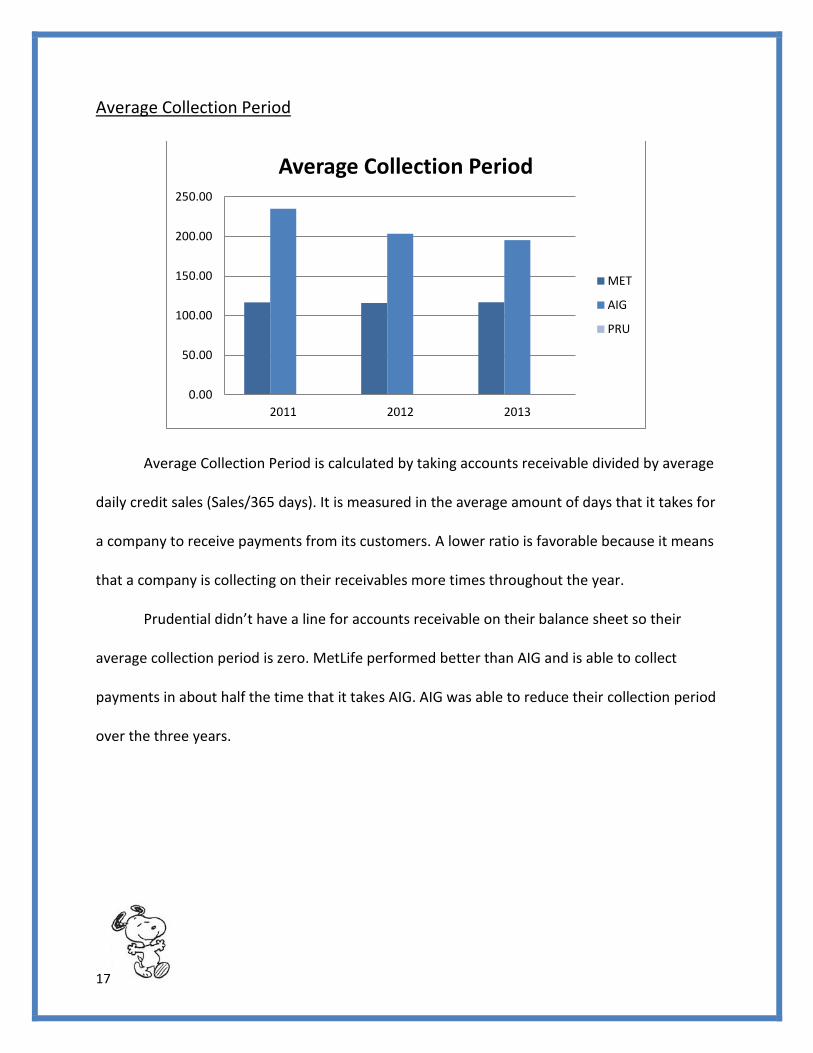
Average Collection Period
Average Collection Period is calculated by taking accounts receivable divided by average
daily credit sales (Sales/365 days). It is measured in the average amount of days that it takes for
a company to receive payments from its customers. A lower ratio is favorable because it means
that a company is collecting on their receivables more times throughout the year.
Prudential didn’t have a line for accounts receivable on their balance sheet so their
average collection period is zero. MetLife performed better than AIG and is able to collect
payments in about half the time that it takes AIG. AIG was able to reduce their collection period
over the three years.
0.00
50.00
100.00
150.00
200.00
250.00
2011 2012 2013
Average Collection Period
MET
AIG
PRU

18
Total Asset Turnover
Total Asset Turnover is calculated by dividing sales by total assets. It measures how
much sales is generated for every dollar of assets. It is used to see if companies are growing
revenue in proportion to assets.
AIG once again is the best all three years. MetLife slightly declined each year and was
the worst in 2012. Prudential performed poorly in 2011 and 2013 but was comparable to AIG in
2012.
0.00
0.02
0.04
0.06
0.08
0.10
0.12
0.14
2011 2012 2013
Total Asset Turnover
MET
AIG
PRU
19
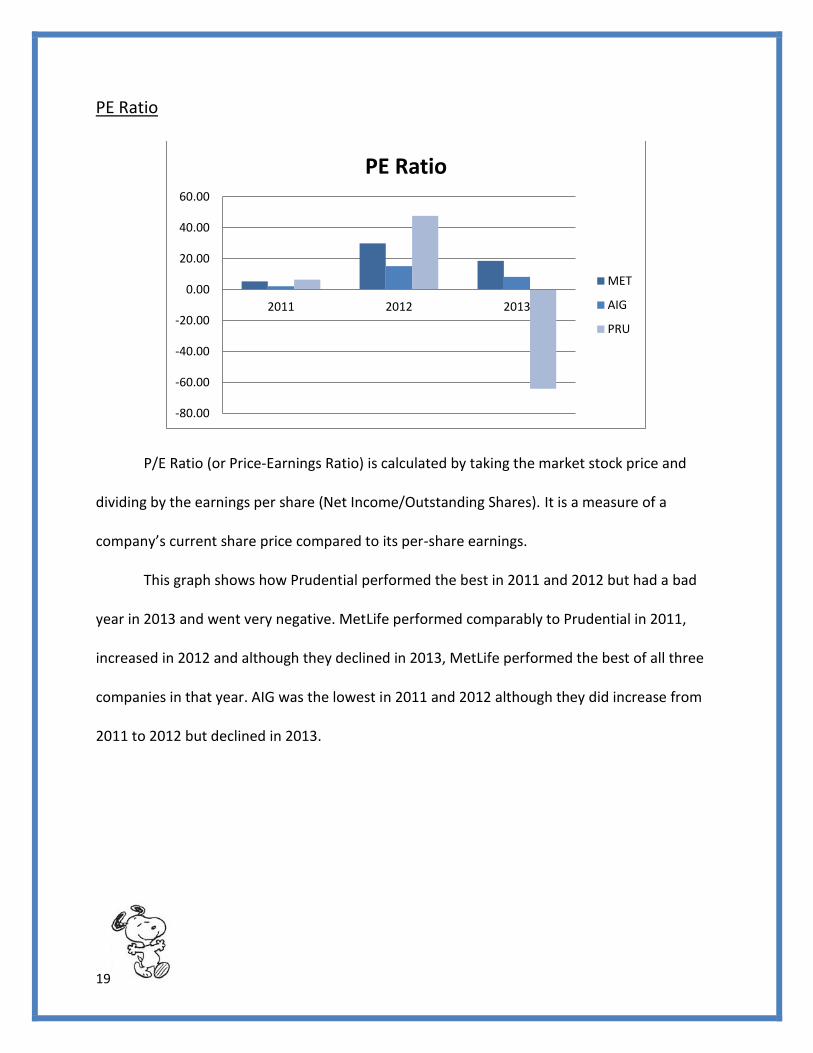
PE Ratio
P/E Ratio (or Price-Earnings Ratio) is calculated by taking the market stock price and
dividing by the earnings per share (Net Income/Outstanding Shares). It is a measure of a
company’s current share price compared to its per-share earnings.
This graph shows how Prudential performed the best in 2011 and 2012 but had a bad
year in 2013 and went very negative. MetLife performed comparably to Prudential in 2011,
increased in 2012 and although they declined in 2013, MetLife performed the best of all three
companies in that year. AIG was the lowest in 2011 and 2012 although they did increase from
2011 to 2012 but declined in 2013.
-80.00
-60.00
-40.00
-20.00
0.00
20.00
40.00
60.00
2011 2012 2013
PE Ratio
MET
AIG
PRU
20
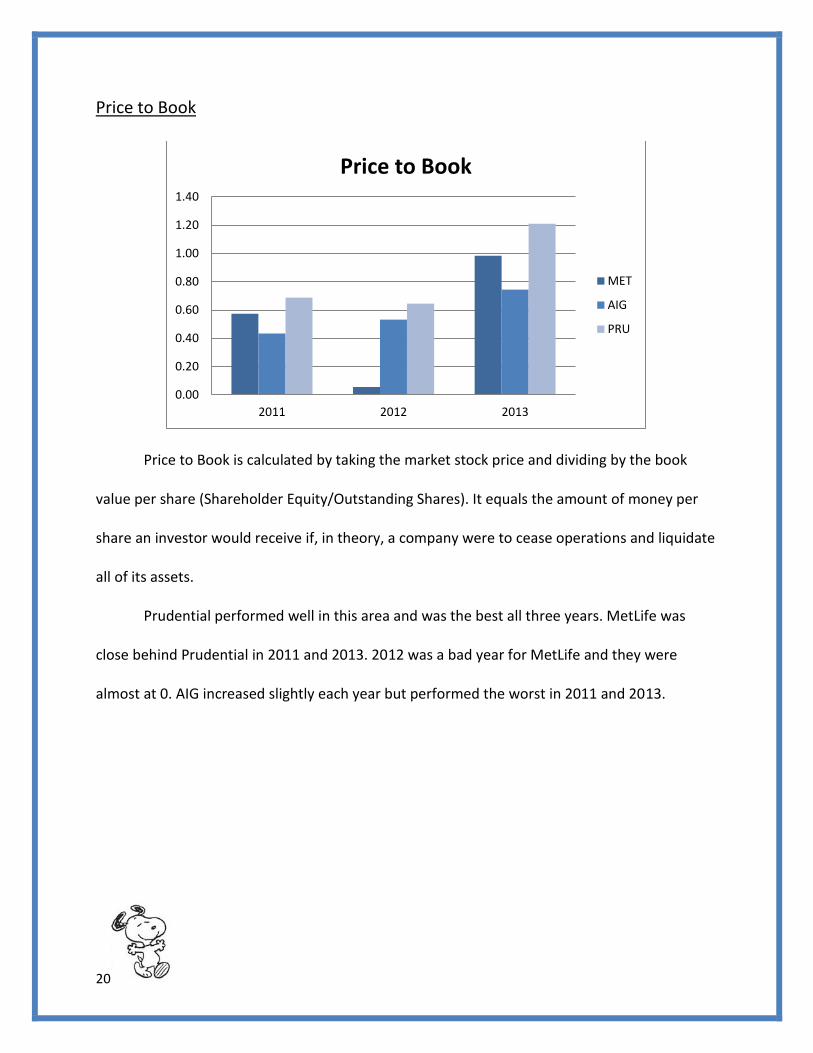
Price to Book
Price to Book is calculated by taking the market stock price and dividing by the book
value per share (Shareholder Equity/Outstanding Shares). It equals the amount of money per
share an investor would receive if, in theory, a company were to cease operations and liquidate
all of its assets.
Prudential performed well in this area and was the best all three years. MetLife was
close behind Prudential in 2011 and 2013. 2012 was a bad year for MetLife and they were
almost at 0. AIG increased slightly each year but performed the worst in 2011 and 2013.
0.00
0.20
0.40
0.60
0.80
1.00
1.20
1.40
2011 2012 2013
Price to Book
MET
AIG
PRU
21
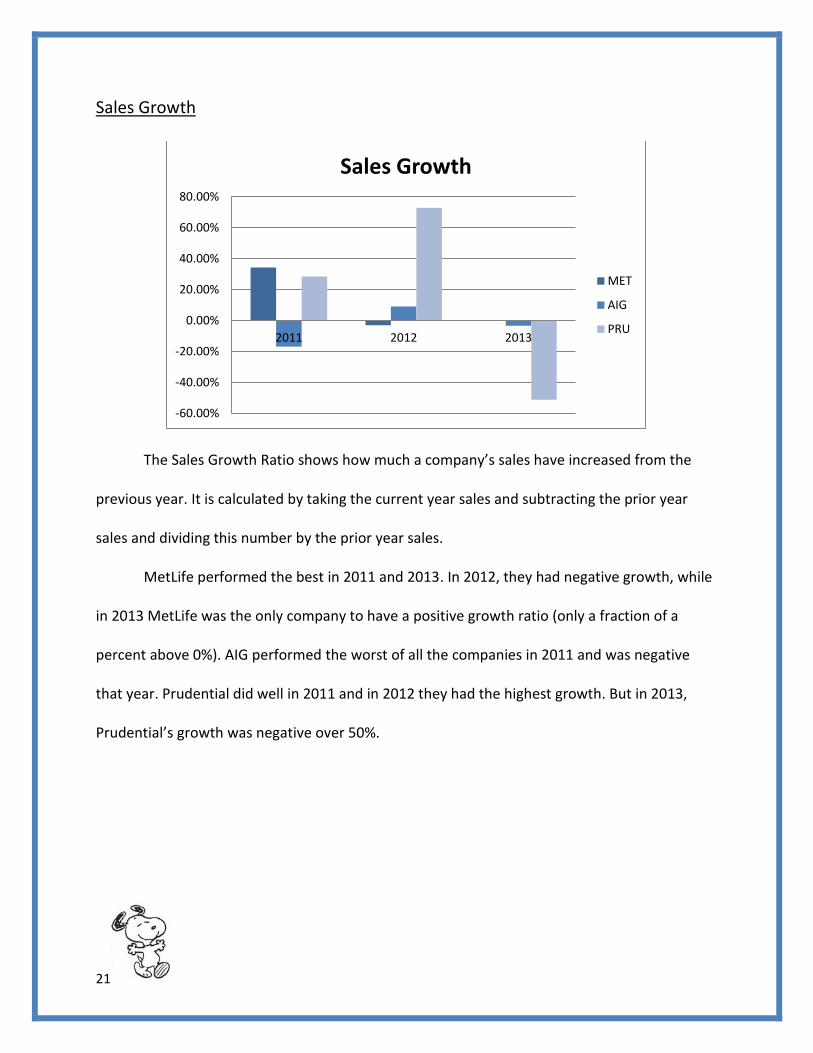
Sales Growth
The Sales Growth Ratio shows how much a company’s sales have increased from the
previous year. It is calculated by taking the current year sales and subtracting the prior year
sales and dividing this number by the prior year sales.
MetLife performed the best in 2011 and 2013. In 2012, they had negative growth, while
in 2013 MetLife was the only company to have a positive growth ratio (only a fraction of a
percent above 0%). AIG performed the worst of all the companies in 2011 and was negative
that year. Prudential did well in 2011 and in 2012 they had the highest growth. But in 2013,
Prudential’s growth was negative over 50%.
-60.00%
-40.00%
-20.00%
0.00%
20.00%
40.00%
60.00%
80.00%
2011 2012 2013
Sales Growth
MET
AIG
PRU
22
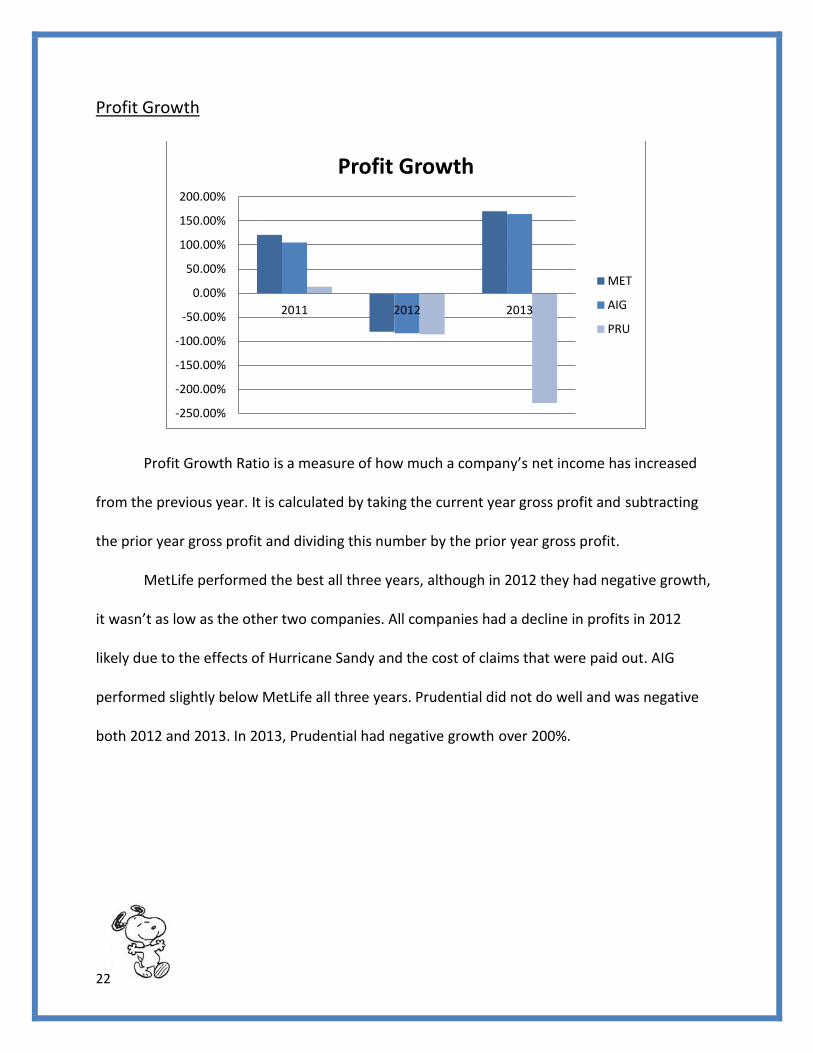
Profit Growth
Profit Growth Ratio is a measure of how much a company’s net income has increased
from the previous year. It is calculated by taking the current year gross profit and subtracting
the prior year gross profit and dividing this number by the prior year gross profit.
MetLife performed the best all three years, although in 2012 they had negative growth,
it wasn’t as low as the other two companies. All companies had a decline in profits in 2012
likely due to the effects of Hurricane Sandy and the cost of claims that were paid out. AIG
performed slightly below MetLife all three years. Prudential did not do well and was negative
both 2012 and 2013. In 2013, Prudential had negative growth over 200%.
-250.00%
-200.00%
-150.00%
-100.00%
-50.00%
0.00%
50.00%
100.00%
150.00%
200.00%
2011 2012 2013
Profit Growth
MET
AIG
PRU
23
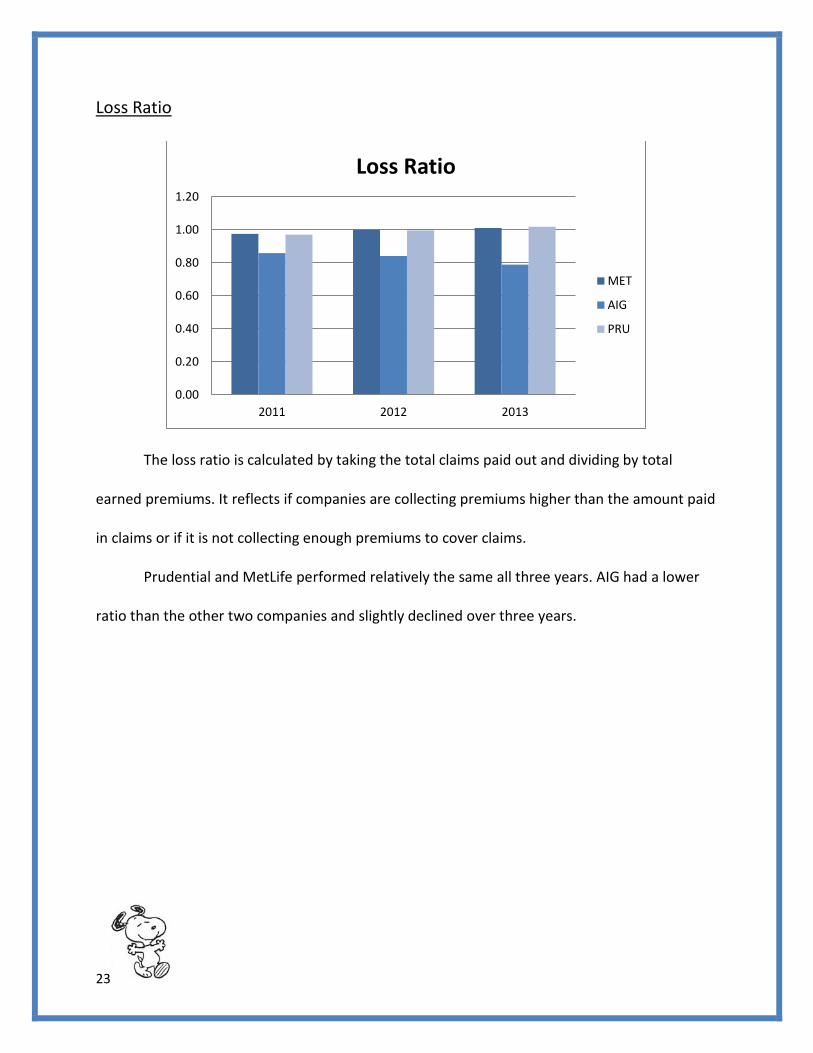
Loss Ratio
The loss ratio is calculated by taking the total claims paid out and dividing by total
earned premiums. It reflects if companies are collecting premiums higher than the amount paid
in claims or if it is not collecting enough premiums to cover claims.
Prudential and MetLife performed relatively the same all three years. AIG had a lower
ratio than the other two companies and slightly declined over three years.
0.00
0.20
0.40
0.60
0.80
1.00
1.20
2011 2012 2013
Loss Ratio
MET
AIG
PRU
24
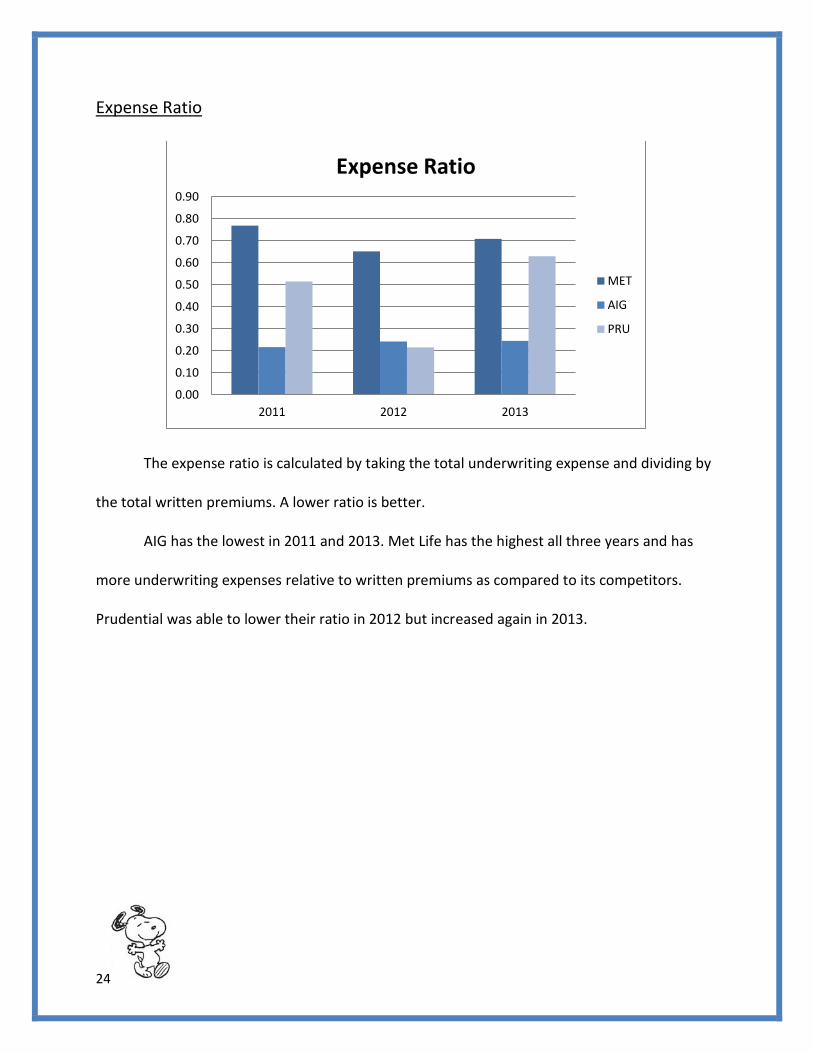
Expense Ratio
The expense ratio is calculated by taking the total underwriting expense and dividing by
the total written premiums. A lower ratio is better.
AIG has the lowest in 2011 and 2013. Met Life has the highest all three years and has
more underwriting expenses relative to written premiums as compared to its competitors.
Prudential was able to lower their ratio in 2012 but increased again in 2013.
0.00
0.10
0.20
0.30
0.40
0.50
0.60
0.70
0.80
0.90
2011 2012 2013
Expense Ratio
MET
AIG
PRU
25
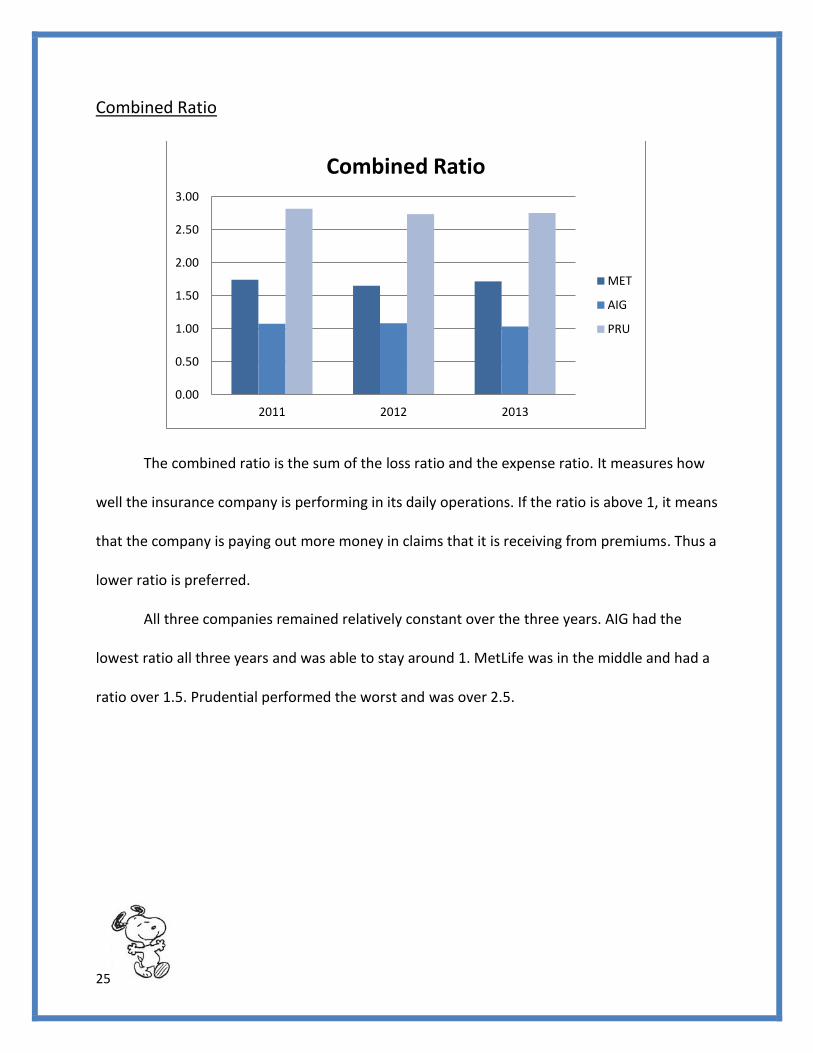
Combined Ratio
The combined ratio is the sum of the loss ratio and the expense ratio. It measures how
well the insurance company is performing in its daily operations. If the ratio is above 1, it means
that the company is paying out more money in claims that it is receiving from premiums. Thus a
lower ratio is preferred.
All three companies remained relatively constant over the three years. AIG had the
lowest ratio all three years and was able to stay around 1. MetLife was in the middle and had a
ratio over 1.5. Prudential performed the worst and was over 2.5.
0.00
0.50
1.00
1.50
2.00
2.50
3.00
2011 2012 2013
Combined Ratio
MET
AIG
PRU
26
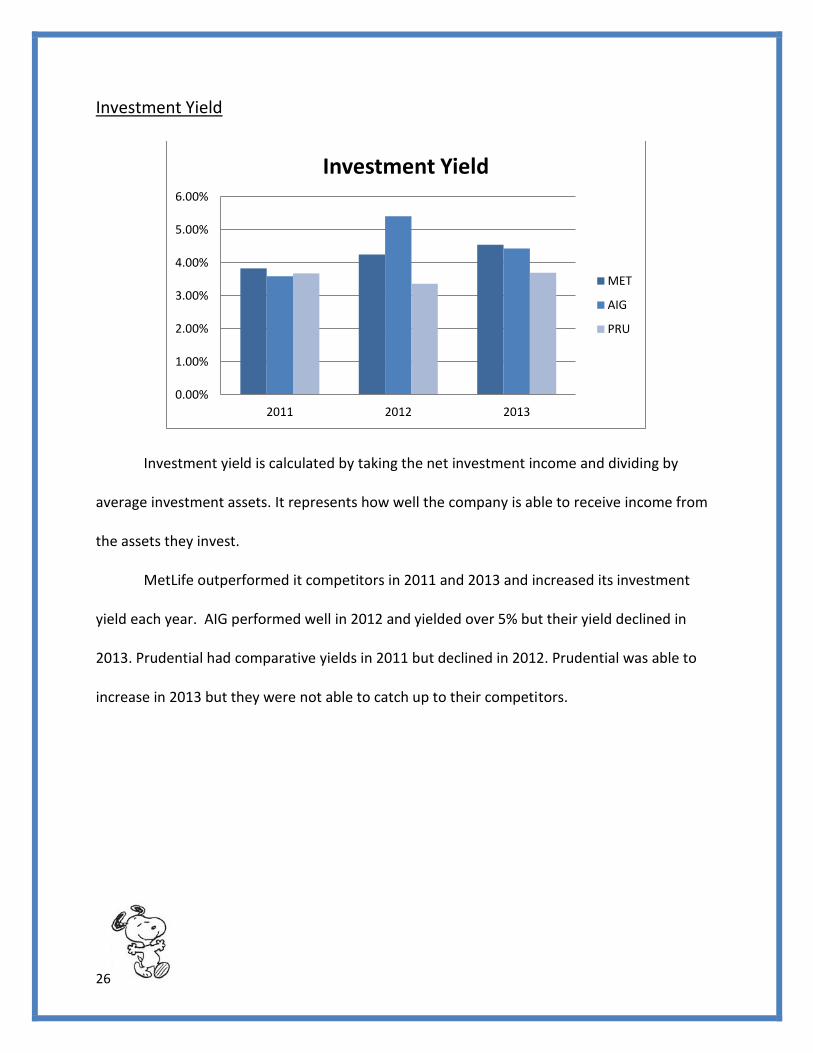
Investment Yield
Investment yield is calculated by taking the net investment income and dividing by
average investment assets. It represents how well the company is able to receive income from
the assets they invest.
MetLife outperformed it competitors in 2011 and 2013 and increased its investment
yield each year. AIG performed well in 2012 and yielded over 5% but their yield declined in
2013. Prudential had comparative yields in 2011 but declined in 2012. Prudential was able to
increase in 2013 but they were not able to catch up to their competitors.
0.00%
1.00%
2.00%
3.00%
4.00%
5.00%
6.00%
2011 2012 2013
Investment Yield
MET
AIG
PRU
27
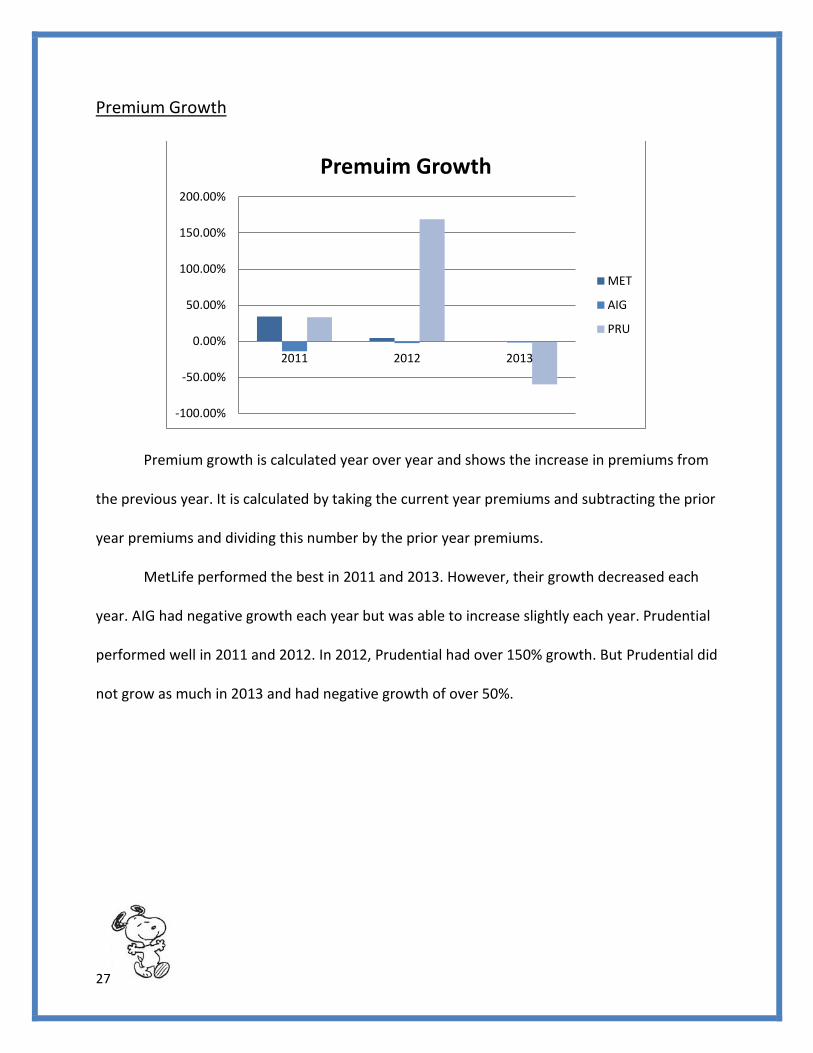
Premium Growth
Premium growth is calculated year over year and shows the increase in premiums from
the previous year. It is calculated by taking the current year premiums and subtracting the prior
year premiums and dividing this number by the prior year premiums.
MetLife performed the best in 2011 and 2013. However, their growth decreased each
year. AIG had negative growth each year but was able to increase slightly each year. Prudential
performed well in 2011 and 2012. In 2012, Prudential had over 150% growth. But Prudential did
not grow as much in 2013 and had negative growth of over 50%.
-100.00%
-50.00%
0.00%
50.00%
100.00%
150.00%
200.00%
2011 2012 2013
Premuim Growth
MET
AIG
PRU
28
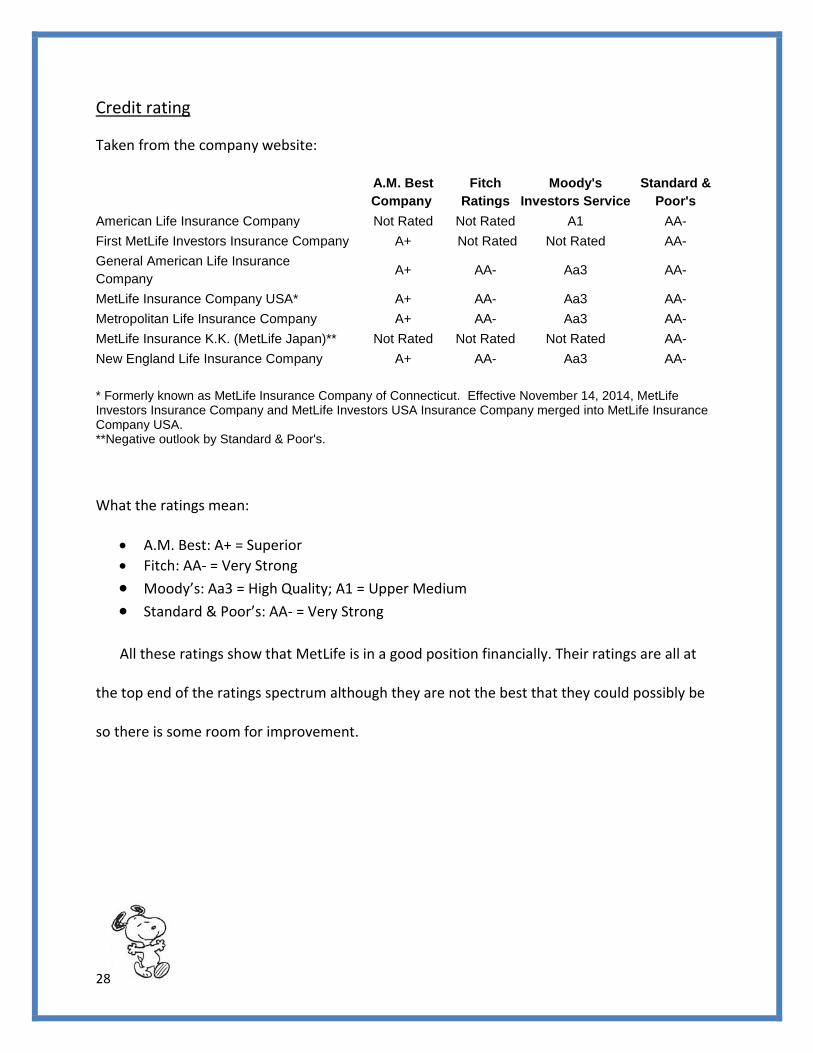
Credit rating
Taken from the company website:
A.M. Best
Company
Fitch
Ratings
Moody's
Investors Service
Standard &
Poor's
American Life Insurance Company Not Rated Not Rated A1 AA-
First MetLife Investors Insurance Company A+ Not Rated Not Rated AA-
General American Life Insurance
Company A+ AA- Aa3 AA-
MetLife Insurance Company USA* A+ AA- Aa3 AA-
Metropolitan Life Insurance Company A+ AA- Aa3 AA-
MetLife Insurance K.K. (MetLife Japan)** Not Rated Not Rated Not Rated AA-
New England Life Insurance Company A+ AA- Aa3 AA-
* Formerly known as MetLife Insurance Company of Connecticut. Effective November 14, 2014, MetLife Investors Insurance Company and MetLife Investors USA Insurance Company merged into MetLife Insurance Company USA. **Negative outlook by Standard & Poor's.
What the ratings mean:
A.M. Best: A+ = Superior
Fitch: AA- = Very Strong
Moody’s: Aa3 = High Quality; A1 = Upper Medium Standard & Poor’s: AA- = Very Strong
All these ratings show that MetLife is in a good position financially. Their ratings are all at
the top end of the ratings spectrum although they are not the best that they could possibly be
so there is some room for improvement.
29
Policies Written
Type
MetLife is in the life insurance business. Life is in their name! There are many different
types of life insurance policies that MetLife offers. They are broken down into two main
categories: Term Life and Permanent Life.
There are few different options under the term life category. Basic Term Life is an
employer-paid benefit that offers your beneficiaries only the essential protection needed and is
the most cost-effective. Supplemental Term Life is also employer-paid and offers a little bit
extra protection than the Basic Term Life. Dependent Term Life covers your spouse, partner,
and eligible children.
Permanent life has a few different options as well. Group Variable Universal Life can
help you meet your needs today and in the years to come. It combines life insurance protection
with tax-deferred investments. You can invest your money in variable investment portfolios or
and interest-bearing account. With GVUL, you can benefit from tax-deferred growth and are
able to access the cash value in the account before age 59 ½ without any additional fees. Group
Universal Life offers affordable, guaranteed protection. The policy’s cash value builds as you
contribute additional money into a tax-deferred account that is interest bearing. You are
guaranteed that the interest rate will never drop below a minimum rate. Whole Life Insurance
is a great option to supplement your employer-provided plan. It is a policy that you own and
can never be cancelled because of your health. You can take it with you if you change jobs.
30
Pricing
The cost of life insurance plans depend on the type of policy you wish to purchase. Term
life insurance costs less than permanent life because it doesn’t cover as much. You have to pay
higher premiums to have a permanent life policy.
Customers
Term life insurance policies are targeted towards customers who are looking for an
affordable way to get financial protection and be able to provide funds for financial
responsibilities such as mortgage or college payments. Customers who are looking for flexibility
based on their changing needs would want a term life insurance policy.
Permanent life insurance is targeted towards customers who are able to afford the
higher costs and want to have coverage over their lifetime. It is good for customers who are
looking for a tax-advantaged investment that they can tap into during their life.
31
Regulation
Laws
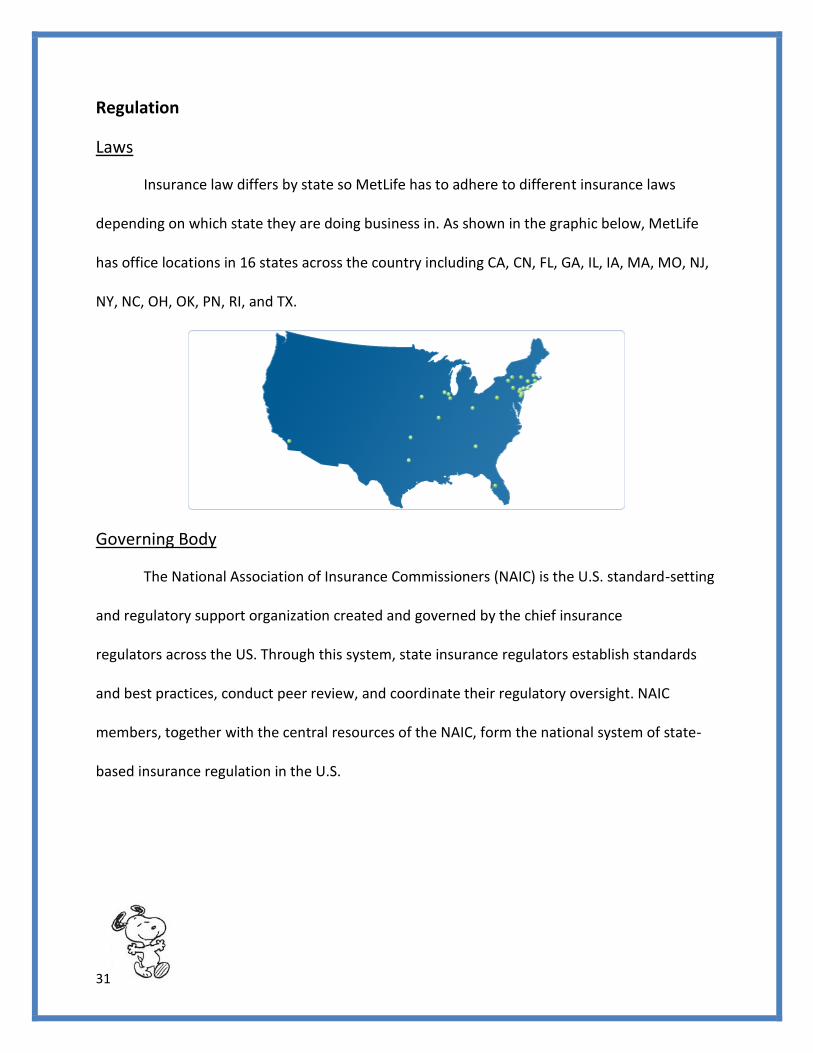
Insurance law differs by state so MetLife has to adhere to different insurance laws
depending on which state they are doing business in. As shown in the graphic below, MetLife
has office locations in 16 states across the country including CA, CN, FL, GA, IL, IA, MA, MO, NJ,
NY, NC, OH, OK, PN, RI, and TX.
Governing Body
The National Association of Insurance Commissioners (NAIC) is the U.S. standard-setting
and regulatory support organization created and governed by the chief insurance
regulators across the US. Through this system, state insurance regulators establish standards
and best practices, conduct peer review, and coordinate their regulatory oversight. NAIC
members, together with the central resources of the NAIC, form the national system of state-
based insurance regulation in the U.S.
32
Future Prospects
Insurance Niche
Currently, MetLife is focusing primarily on life insurance. They have been providing life
insurance for over 140 years so they should be pretty good at things by now! Life insurance is
their niche. MetLife also offers a variety of home insurance policies depending on your living
situation. One area of insurance that I thought was lacking was auto insurance. There wasn’t
much information on the company website about their auto insurance plans. In the future, I
think that MetLife should develop other areas of insurance besides life insurance.
Company
As a company, MetLife has room for growth. In terms of location, MetLife is only in 16
states. Most of these locations are in the Eastern United States. There are opportunities for
MetLife to expand to areas in the western United States.
But MetLife doesn’t just exist in the US. They serve customers in nearly 50 countries
worldwide. There are MetLife locations in Latin America, Europe, and Asia. One area of the
world that MetLife hasn’t explored is Africa. I would suggest that MetLife expand their
operations worldwide to reach as many customers as possible.
33
Recommendations
To the owners of MetLife, I recommend that they expand their operations to other parts
of the Western United States and other countries worldwide. There are also different areas of
insurance that they should explore more than the life insurance area that they are comfortable
with.
MetLife should continue to rebound from the drop in profits they had in 2012 because
of Hurricane Sandy. As long as there is not another catastrophic event like Hurricane Sandy,
MetLife should be able to have an increase in profits in the coming years.
As an investor, I would recommend purchasing MetLife stock. I had MetLife in my
portfolio for investments class and it performed well over the course of the semester. I like
investing in companies that are well-know and have been in business for a while. MetLife has
been around for 140 years and they have a solid history in the life insurance industry.

34
Sources
https://www.metlife.com/about/corporate-profile/metlife-history/metlife-begins/index.html
https://www.metlife.com/about/corporate-profile/ratings/index.html
http://en.wikipedia.org/wiki/MetLife
http://finance.yahoo.com/
http://ycharts.com/
http://www.investopedia.com/
http://www.naic.org/index_about.htm